Characteristics of Clay-Abundant Shale Formations: Use of CO2 for Production Enhancement
by
 , , and
Chengpeng Zhang
1 ,
,
Ranjith Pathegama Gamage
1,*,
Mandadige Samintha Anna Perera
2 and
Jian Zhao
1 1
Deep Earth Energy Laboratory, Department of Civil Engineering, Monash University, Building 60, Melbourne, VIC 3800, Australia
2
Department of Infrastructure Engineering, The University of Melbourne, Building 176, Parkville, VIC 3010, Australia
*
Author to whom correspondence should be addressed.
Energies 2017, 10(11), 1887; https://doi.org/10.3390/en10111887
Submission received: 12 October 2017
/
Revised: 9 November 2017
/
Accepted: 9 November 2017
/
Published: 16 November 2017
Abstract
:Clay-abundant shale formations are quite common worldwide shale plays. This particular type of shale play has unique physico-chemical characteristics and therefore responds uniquely to the gas storage and production process. Clay minerals have huge surface areas due to prevailing laminated structures, and the deficiency in positive charges in the combination of tetrahedral and octahedral sheets in clay minerals produces strong cation exchange capacities (CECs), all of which factors create huge gas storage capacity in clay-abundant shale formations. However, the existence of large amounts of tiny clay particles separates the contacts between quartz particles, weakening the shale formation and enhancing its ductile properties. Furthermore, clay minerals’ strong affinity for water causes clay-abundant shale formations to have large water contents and therefore reduced gas storage capacities. Clay-water interactions also create significant swelling in shale formations. All of these facts reduce the productivity of these formations. The critical influences of clay mineral-water interaction on the productivity of this particular type of shale plays indicates the inappropriateness of using traditional types of water-based fracturing fluids for production enhancement. Non-water-based fracturing fluids are therefore preferred, and CO2 is preferable due to its many unique favourable characteristics, including its minor swelling effect, its ability to create long and narrow fractures at low breakdown pressures due to its ultralow viscosity, its contribution to the mitigation of the greenhouse gas effect, rapid clean-up and easy residual water removal capability. The aim of this paper is to obtain comprehensive knowledge of utilizing appropriate production enhancement techniques in clay-abundant shale formations based on a thorough literature review.
1. Introduction
Although coal and petroleum have traditionally been the most exploited natural energy resources, natural gases are now attracting more interest, as they offer an efficient and greener source of energy [1]. For example, in the U.S natural gas accounted for around 27% of the total energy consumption in 2012, and the proportion is expected to increase to around 30% by 2040, with an average consumption growth of about 0.8% per year [2]. Of all the varieties of unconventional gas sources (shale gas, coal-bed methane, tight gas, and gas hydrates), more than 63% comes from shale, and the gas produced from shale is commonly known as shale gas. However, the extremely low permeability of shales is the major barrier to shale gas production and various permeability-enhancement techniques are therefore used to enhance shale gas productivity in the field [3,4]. Of these, hydraulic fracturing is one of the most commonly-used techniques. The use of this enhancement technique caused shale gas production to rapidly increase after 2005 [2,5,6,7].
During the hydro fracking process, a high-pressure fracking fluid is injected into the shale formation to create a network of fractures in the formation, which increases the formation pore space and eventually reduces the tortuosity for gas movement, resulting in enhanced shale gas production. Although water-based fracking fluid is commonly used for this purpose [5,8,9,10], it raises many issues, including formation damage and long clean-up times [11,12]. Shales generally contain a considerable amount of clay, and clay minerals are a group of phyllosilicates with large surface areas [13,14]. This causes a greater adsorbed gas content to migrate from the organic materials in shale plays. In addition, clay particles are quite tiny (<2 µm) and a considerable amount of clay particles increases the micropore capacity in the shale formation [14,15,16,17], which also contributes to the existence of greater amounts of gas in shale plays as free gas in tiny micropores of around 10 nm [14,18]. Therefore, it is clear that the presence of considerable amounts of clay in shale formations can help to trap the gas in the shale. However, the presence of a considerable amount of clay is not favourable for hydro fracking purposes. This is because clay causes the enhancement of the ductile properties of the formation and this reduction of brittleness leads to a poor response to the fracking process [19,20,21,22,23]. In addition, when a water-based fracking fluid is used for hydro fracking purposes, absorption of the injecting water into the clay minerals in the shale formation causes a significant swelling in the formation matrix, which reduces the pore space available for gas movement, and therefore, reduces shale gas production [24,25]. The use of water-based fracking fluid also requires huge water consumption [5,10,26], which in turn results in a huge waste water generation upon completion of the fracking process, creating many environmental issues [27,28,29,30].
For these reasons, consideration has been given to finding alternative fracking fluids, and liquid CO2 is an alternative with many unique advantages. CO2 has been widely used for enhanced oil recovery (EOR) and enhanced gas recovery (EGR) as a displacing fluid [31,32], however the data associate with the application of CO2 as a fracking fluid is very limited. Without any additional treatment additives, pure liquid CO2 can greatly reduce the water requirement in hydro fracking, which in turn reduces water-sensitive formation damage [11,25,33,34]. In addition, liquid CO2 vaporizes to its gaseous phase while it is returning to the surface after the fracking process, with the associated pressure reduction, which therefore involves shorter clean-up times [11,35]. Moreover, gaseous CO2 has the ability to push the residual water trapped in the formation towards the ground surface, further reducing the formation damage [34]. Most importantly, in clay-rich shale plays, most of the shale gas is available in the massive micro pore network, which is unlikely to be released by traditional fracking fluids like water, which causes production difficulties. However, the stronger adsorption capacity of CO2 in the shale rock mass can release this shale gas from the formation by substituting adsorbed methane. In addition, due to its ultralow viscosity, CO2 has higher penetration capacity in clay-rich shale with ultralow permeability and generates better fracture networks. This results in enhanced shale gas production [36,37,38]. All of these facts confirm the better applicability of CO2 in the hydro fracturing process in deep shale plays.
This paper therefore intends to provide a comprehensive review of the effects of clay minerals in oil/gas production from shale formations and the advantages of using liquid CO2 as fracturing treatment for this particular type of formation.
2. Productivity of Clay-Abundant Shale Formations
The lack of knowledge of the influence of formation clay minerals on oil/natural gas exploitation is one of the main challenges in the petroleum industry, especially for clay-abundant formations like shales, as the presence of clay creates numerous issues in these formations during hydrocarbon production [12,24,25]. As shown in Table 1, shales have large amounts of clay and the influence of this clay content on shale gas production is significant.
As mentioned earlier, clay minerals have strong affinity for water. The use of conventional water-based fracking fluid therefore causes the initiation of clay minerals (e.g., smectite, illite) and water molecules interactions, creating a significant swelling in the formation. This swelling may cause a significant reduction in shale mass pore space [46]. Particularly after the hydro fracking process, a considerable amount of residual water is trapped inside the created hydraulic fractures and natural fractures [25] and the interaction of this water with formation clay minerals greatly reduces the formation porosity and eventually its permeability. For example, in clay-rich samples, permeability can be reduced by more than 80% after water saturation, compared with the initial air permeability [47]. In addition, the previously mentioned higher ductility of clay-abundant formations and their reduced strength characteristics upon water saturation significantly affect the fracturing ability of the formation [21,48,49].
The clay content in a formation can influence its shale gas production in three main ways: (1) increasing the total surface area and cation-exchange capacity (CEC); (2) swelling the rock matrix through the clay-water interactions in the presence of water; and (3) increasing the micro pore distribution and the total porosity. Each of these is discussed in the following sections.
2.1. Effect of High Surface Area and High Cation-Exchange Capacity (CEC) of Clay Minerals on Shale Gas Productivity
2.1.1. Surface Area
Clay minerals have normally been structured based on the silicate, and in clay minerals, negatively-charged silica tetrahedral sheets are always combined with octahedral sheets with cations surrounded by the six nearest neighbour oxygens or hydroxyls [50]. The basic layer types of clay minerals are usually classified mainly according to the proportion of sheets and the interlayer material, and 1:1 layers and 2:1 layers are the main layer combinations (see Figure 1).
Due to these unique platy characteristics, clay minerals normally have much larger surface areas than other minerals, particularly clay minerals with 2:1 layer combinations like smectite, because clay minerals with such layer combinations have both external and internal layers, and the internal surface area is much larger than the external surface area (the internal and external surface areas of smectite are 750 m2/g and 50 m2/g, respectively). In contrast, clay minerals like kaolinite have 1:1 layer combinations and therefore have only small external surface areas (see Figure 2) [52]. This indicates the important role played by the layer arrangements of clay minerals on its surface area. The surface area of clay can be approximately measured using surface adsorption principles using a medium such as nitrogen, carbon dioxide, or water, but the accuracy may vary with the method utilized method. Figure 2 shows the total surface areas of the main types of clay minerals measured using various absorption mediums, and clearly exhibits the higher surface area of smectite compared to other clay and non-clay minerals.
As mentioned earlier, the high surface area of clay minerals creates high gas storage capacities in underground clay-abundant reservoir formations, because it is positively correlated with the adsorption process. However, this is not a favourable fact for fluid flow migration behaviour through the formation. For example, according to the Kozeny equation [54] (Equation (1)), the permeability of a rock mass is inversely proportional to the square of the specific surface area, if the grain shape effect is ignored:
where, is the liquid permeability, is porosity, is grain-surface area per bulk volume, is specific surface (grain-surface area per grain volume) and is Kozeny’s constant.
This shows that the existing high surface area of clay-abundant shale formations causes low permeability in them [55]. For example, samples with different porosities may have similar permeability values if their specific surface area is the same. In contrast, formations with very similar porosities but different clay contents (and therefore different specific surface area values) may have different permeability values [55]. In general, shales with high clay content have lower permeability values due to their higher specific surface area [56].
2.1.2. Cation Exchange Capacity (CEC) of Clay Minerals
The cation exchange capacity (CEC) directly influences the reactivity of clay minerals, and most clay minerals with high CECs (>10 meq/100 g) create strong negative charges on the clay surface and therefore easily attract cations from the surroundings to maintain electrical neutrality. However, different clay minerals have different CECs, depending on their structural charges and cation substitution. For example, the CECs of smectite (80–150 meq/100 g), illite (10–40 meq/100 g), kaolinite (3–15 meq/100 g) and chlorite (10 meq/100 g) are quite different [57].
Having high CEC in clay minerals is not favorable to shale gas production, because it causes strong attractions to water molecules. Water is composed of excess charged polar molecules due to the imbalance of the electronegativity among the atoms. As a result, water molecules always tend to have a slight attraction to another one, creating hydrogen bonds. The bond between highly negatively charged clay minerals and water molecules is much stronger than Van der Waals attraction, and the higher the CEC, the higher the attraction [58,59].
2.2. Effect of Clay Swelling
Although the injection of water to create hydraulic fractures is a common practice in shale gas recovery to enhance gas production, it in turn reduces gas production over time. This is mainly due to the swelling induced in the clay minerals as a result of the interaction of injected water and clay minerals, resulting in reduced pore space and permeability [12]. As Figure 3 shows, there is a direct linear relation between free swelling and available clay content. However, the degree of influence (slope) may change with surrounding factors, such as burial depth and degree of weathering of the shale mass [60,61]. It is therefore essential to have thorough knowledge of the swelling effect created by this clay-water interaction in shale in order to obtain optimal gas production from clay-abundant shale plays. Water can interact with clay minerals in two main ways: (1) the inner-crystalline water (water associated with the cations neutralizing the charge caused by elemental substitution); and (2) the osmotic water (water available after absorbing the water molecules on clay external surfaces), depending on the available charges in the clay minerals [12]. These clay-water interactions create inner-crystalline swelling and osmotic swelling in the formation, respectively [12,62]. Inner-crystalline swelling occurs due to the hydration of exchangeable cations in clay by water and osmotic swelling occurs due to the large ionic concentration difference between the clay surface and the pore water. However, the amount of swelling in the shale formation by any of these means is dependent on two main facts; (a) the existing exchangeable cations and the ionic strength of the solution; (b) the structural composition of the available clay minerals, and the surface area of the available clay minerals plays a major role in water molecular adsorption into the existing clay portion in the shale (Figure 2). For example, according to Rogala et al. [46], shales with abundant smectite and illite have much greater affinity to adsorb water into the formation (which eventually creates significant swelling) due to their larger surface area and CEC than other clay minerals, such as kaolinite and chlorite. Therefore, the presence of even a small amount of smectite causes serious issues in field applications in shale reservoirs, such as production enhancement through hydraulic fracturing using water-based fracking fluid.
The problem is that the swelling created by both inner-crystalline and osmatic swelling processes greatly affects the shale reservoir permeability, because the swelling of clay contents not only reduce the pore space and pore throat for gas movement in shale matrix, but also compress and close the created fractures, and therefore eventually limits its gas production ability. According to Baptist and Sweeney’s 1954 study of petroleum reservoir sands in Wyoming fields (Table 2), sand with montmorillonite-illite mixed clay layers is much more sensitive to water compared to sand with kaolin and illite clays and therefore cause greater permeability reductions [47]. For example, sample A in Table 2 has the highest number of montmorillonite-illite mixed layers and exhibits the lowest initial air permeability compared to the other three samples, and the saturation of that sample with 0 (freshwater), 8500 and 16,250 ppm NaCl concentrations causes the sample permeability to be further reduced to around 0%, 1% and 12%, of initial air permeability, respectively. Although similar reduction trends were observed for the other three samples with low numbers of montmorillonite-illite mixed layers, the reductions are much lower (Table 2). These findings reveal the important fact that the greatest swelling effect is created by fresh water in clay-abundant shale formations, and the swelling effect reduces with increasing brine concentration in the pore fluid (see Figure 4). According to Figure 4, when the solution concentration is higher than 0.5 M, the swelling effect almost maintains stability, which is only around 20–30% of that in the solution with lower solution concentration. When even hydraulic fluids with high chloride concentration are used to alleviate formation damage, the irreversible damage can affect gas production.
Ka1 is initial air permeability, Kb1 is permeability for water with 16,500 ppm. NaCl, Kb2 is permeability for water with 8250 ppm. NaCl, Kw is the fresh water permeability and Kaf is final air permeability.
2.3. Effect of Clay on Formation Pore Distribution and Porosity
Clay swelling directly affects the pore system in shale plays, which in turn reduces gas production by reducing the reservoir permeability. It is therefore necessary to have detailed knowledge of this pore structure re-arrangement to precisely understand the gas transport and storage processes in shales. According to Kuila and Prasad [17], shale rock has a complex structure made from fine-grained particles (grain sizes less than 62.5 µm). It contains a dual porosity system with micropores (<2 nm) and mesopores (2 nm to 50 nm), and the total porosity of the shale is mainly governed by these fine pores (<10 nm) [16]. However, the total porosity of any shale play is dependent on its composition, and clay-abundant and kerogen-abundant shale rocks have higher porosities than other types of shales such as biogenic silica-rich and carbonate-rich shales, due to the fine particles in clay and kerogen [14,15].
The effect of clay on shale porosity has been extensively studied to date [16,17,65]. For example, mercury intrusion porosity measurements of Devonian-Mississippian and Jurassic shales in the Western Canadian Sedimentary basin showed that clay-abundant shales (5.6% and 5.4–6.1% porosities in clay-rich upper black shale samples in Basa Formation and Poker Chip shale samples) have much higher total porosities than shale with lower clay content (1% and 0.5–4.2% porosities in lower black mudrock samples in Basa Formation samples and Gordondale member samples with minor clay contents), and the pore size distribution in clay-abundant shales is mostly spread within a range of smaller pores (see Figure 5) [14,15].
However, all of the pore volume and pore size distribution estimation techniques that are traditionally used for shales involve the common practice of degassing of the sample and drying it under vacuum. This practice is not very accurate for samples with high moisture/clay contents, like clay-abundant shales [16]. The equilibrium moisture contents in clay-rich shales are frequently higher than the values estimated using these techniques due to the strong adsorption capacity of clay minerals to water [15]. The ultra-fine pore throats available in clay-abundant shales rocks can easily be closed by moisture, blocking them to gas movement [66].
3. Gas Storage Capacity in Clay-Abundant Shale Formations
In shales, gas can exist in two main ways: (a) as an adsorbed gas; and (b) as a free gas [20]. Adsorption mainly takes place on the surface of the existing organic matter and then eventually moves into the micropores through the van der Waals force. The free gas can exist in both macropores and mesopores. The total shale gas production capacity is therefore dependent on the surface area, pore-size distribution, and total porosity of the shale play, all of which are clearly affected by the existing clay minerals (see Section 2.2 and Section 2.3). Although many studies have been conducted to find the relationship between shale gas adsorption and organic materials, less attention has been paid to determining the relationship between shale gas adsorption and clay minerals. This is particularly important for clay-abundant shale formations, because they have relatively low levels of organic materials and large amounts of clay minerals play the major role in gas adsorption [67,68]. Detailed understanding of the relationship between the shale play’s clay content and its gas storage capacity is therefore important.
Clay consists of quite small particles (<2 µm) and therefore provides a large surface area and huge gas storage capacity to shale plays. This is because the greater surface area offers a greater locus for hydrocarbon (methane) adsorption into the shale mass [18], and micropores contribute more to the enhancement of the shale surface area than large pores. For example, according to Kuila and Prasad [17], although the micropores’ contribution to the total porosity in illite-rich Cambrian shale and montmorillonite-rich Wyoming clay is around 19.23% and 9%, it contributes to around 33.70% and 41% of the surface areas of the two shales. This also shows another important fact, that different clay minerals offer different surface areas for shale plays. For example, of these two considered shale mases, montmorillonite offers greater surface area to the shale play than illite. Ross and Bustin [14] have clearly shown the greater surface area offered by existing clay particles in shale plays. Clay-abundant shales therefore have greater surface areas than shales with small clay contents. For example, the BET surface area of clay-abundant Cambrian shale is around 31.57 m2/g, which is approximately eight times greater than the surface area of Niobrara shale with minor clay content. According to Ross and Bustin [14], the total surface area of any shale mass is mainly contributed by its small pores of less than 10 nm, the greatest contribution being made by the tiny pores (less than 3 nm in size), and only a small contribution being made by the large pores (more than 15 nm in size). According to their gas adsorption tests that were conducted using two different shale samples with similar total organic contents (TOCs), the adsorption gas content in the shale with 47% clay content was nearly double that in another sample with only 7% clay content (Figure 6). In addition to the increased adsorbed gas content, the high porosity created by clay minerals provides a locus for greater free gas content in the shale play. It is therefore clear that clay minerals in any shale play make a positive contribution to its total gas volume.
There is also a negative effect of clay minerals on gas storage capacity due to their high affinity to water molecules, and greater clay content leads to greater water content in the shale play. For example, according to Ross and Bustin [15], the Gordondale member and Poker Chip shales have around 7.4% and 17–20% of aluminosilicate clay mineral fractions, and their moisture contents are around 0.6–8.5% and 5–11%, respectively. This greater moisture content offered by clay particles to the shale mass is not favourable for its gas storage capacity, because the available water molecules tend to occupy some potential sorption sites in the shale mass, blocking small pore throats. Both of these greatly reduce the gas adsorption capacity and eventually, the gas storage capacity. For example, Ross and Bustin [15] found that a shale mass with equilibrium moisture content has up to around 40% less methane adsorption capacity than a dry shale mass. In addition, immobile water molecules occupy some pore space of the shale mass, reducing the pore space available for free gas [38]. According to Godec et al. [38], the available effective porosity ( for free gas can be written as follows:
where, is degree of water saturation, and is total porosity.
However, it should be noted that the gas adsorption capacity in shales is also influenced by many other factors, including thermal maturity, organic and inorganic contents, temperature and pressure and the interdependence among them. Therefore, the estimation of gas storage capacity cannot be determined according to each single factor.
4. Mechanical Properties of Clay-Abundant Shale Formations
Clay-abundant shales mainly are constituted of quartz, clay minerals and TOC. According to research findings, the existence of significant amounts of small clay particles causes reduced tensile and shear strength values, because clay particles obstruct stress transmission through the contact between quartz particles [19]. For this reason, clay-abundant shales mostly behave as ductile rock constituents with less brittleness [20,22]. The significant influence of clay particles on the mechanical properties of shale should be precisely understood in order to identify the long-term safety of the shale gas recovery process and the utilization of advanced shale gas recovery enhancement techniques such as hydro fracturing [69].
However, the layered structure of clay makes it difficult to predict its exact elastic properties. To date, little consideration has therefore been given to this aspect. Indirect methods have frequently been utilized to evaluate clay’s mechanical properties. Although there are clear discrepancies among the elastic properties of clay minerals predicted using various approaches (Figure 7), significantly lower elastic modules (mainly less than 30 GPa) and the greater ductilities in clay minerals compared to bulk material and other existing rock minerals (e.g., quartz) are common observations.
As a kind of ductile mineral, tiny clay particles reduce shale’s strength, which can be further reduced by the internal stress structure damage created by the swelling inducing by the interaction between clay minerals and water. According to Figure 8, yield stress significantly decreases with the increasing adsorption of water in shales, and the associated swelling reduces their Young’s modulus (see Figure 9). Han et al. [76] investigated the effect of clay content on the shear and elastic modulus of water-saturated shaly sandstones and found a general reduction in shear modulus with increasing clay content. This suggests that possibly significant formation damage may occur to clay-abundant shale plays during water-based hydraulic fracturing.
Precise evaluation of shale’s elastic properties is very important for many applications in shales, and brittleness is a key parameter that can be used to identify the elastic behaviour of any shale mass and therefore have the greatest influence on the hydraulic fracturing. Evaluation of the brittle behaviour of rock is however quite difficult, due to its sensitivity to many factors, including mineralogy, in situ stress, and moisture content. To date, various brittleness indices have been proposed in various fields, considering the influence of clay content, and their applicability for shale is worthy of consideration (Table 3).
When proposing brittleness indices for clay abundant rocks, various facts have been considered. For example, Guo et al. [49] proposed an index based on the fact that increasing clay content causes the Poisson’s ratio to increase and Young’s modulus to decrease, enhancing the ductile properties of the shale formation. According to Chen et al. [69], quartz and organic matter around clay minerals in clay-abundant shale formations cause the use of ( is Young’s modulus and is Poisson’s ratio) to be more accurate than to quantify rock brittleness. Dusseault et al. [19] proposed the use of the weight ratio between quartz-non clay minerals to illite-clay minerals as an indicator of illite-abundant shale’s strength properties, because they observed a linear relationship between this ratio and some geomechanical strength properties of shales (eastern black shale). They concluded that stiffer samples have more quartz-non clay mineral and shale’s ductility increases with increasing clay minerals. Jarvie et al. [20] generalized this finding for all kinds of clay minerals by including another ductile mineral, calcite. These researchers proposed a brittleness index, (BQ), the ratio between the quartz weight to the total weight of quartz, carbon and clay, to exhibit the effect of mineral composition on rock mass brittleness. Considering the fact that the presence of dolomite increases the brittleness of shale and that of organic matter increases the ductility of shale, Wang and Gale [79] modified the brittleness index by considering different carbonate minerals. However, the accuracy of this relation is doubtful, due to the complex shale mineralogy, because each mineral has its own mechanical properties (Table 3). Buller et al. [21] further improved this brittleness index formula by adding the contribution of each mineral’s mechanical properties. This formula reveals different influences of different clay minerals on shale rock’s brittleness.
5. CO2 as Fracturing Fluid for Hydro Fracturing in Clay-Abundant Shales
The use of CO2 to extract gas/oil from deep geological formations is not a novel technique and has been used since the 1960s due to its ability to clean up residual water and even liberate trapped hydrocarbon [80]. In 1981, pure liquid CO2 was first used as a proppant carrier and fracturing fluid [81] and this was then extensively used throughout the world, especially in Canada and the USA [33,82]. The most prominent advantage of the use of CO2 is the avoidance of huge water consumption and wastewater generation. According to Reig et al. [83], nearly 38% of shale resources are located in areas which are either droughty or under high to extremely high levels of water stress. Over 386 million people live on the land over these shale plays, while hydraulic fracturing a well requires between 7 million and 23 million liters of water, which is roughly equal to the water consumed by New York City in 7 min. According to the prediction of Nicot and Scanlon [5], in Texas, the total water used for hydraulic fracturing will reach around 4345 million cubic meters by the 2020s. The water consumption involved in the hydraulic fracturing is around 5.3–6.7% of the total water usage in the Eagle Ford counties in Texas and 89% of that in one rural country [10]. While only 25–50% of water is in consumptive use, disposal of the wastewater flow back from the wells poses a great challenge, because this water usually has high levels of salinity, toxic elements and radioactivity [27]. In this respect, as a kind of non-aqueous fracturing fluid, CO2 captured from power plants would be more environmentally friendly.
Apart from minimal water usage, the use of CO2 as a fracking fluid has many other unique advantages compared to water-based fracturing fluids, especially for clay-abundant shale plays due to their high sensitivity to water [11]. A comprehensive discussion of this is provided in the following sections.
5.1. Basic Thermodynamic Properties of CO2
Due to its unique sensitivity to temperature and pressure, CO2 may present as gas, liquid or super-critical state during the fracturing process (see Figure 10). At the beginning of the fracturing, CO2 is injected into the well in its liquid state, which however can be converted to its super-critical state on reaching to the shale formation due to the existing high pressure and temperature conditions (when it exceeds the critical point at 31 °C and 7.38 MPa). Upon completion of the fracturing process, CO2 will flow back to the surface in its gaseous state with the reduction of pressure and temperature conditions.
Importantly, CO2 has unique favourability for hydraulic fracturing due to its greater sensitivity to the surrounding environment. For example, the compressibility of CO2 is highly sensitive to temperature, and increasing the temperature under reservoir conditions causes the compressibility of CO2 to be highly reduced when it reaches the reservoir rock, which creates additional stress (through thermo pressure) on the reservoir rock mass, causing fractures in it. According to an analysis of the thermodynamic behaviour of CO2 by Niezgoda et al. [85], the injecting CO2 pressure (7 MPa at around 20 °C atmospheric condition) can increase up to around 58 MPa when it reaches deep shale formation at around 120 °C, an eight-fold increase in CO2 pressure that is significant (see Figure 11). This thermo pressure is much higher than the tensile strength of shale rock mass (≈ 3–18 MPa) and therefore leads to the generation of fractures in the formation. Apart from this, changing the phase condition of CO2 from liquid to the super-critical state in the hot shale rock formation causes a heat exchange between the CO2 and the shale rock matrix in a very short time period. This also contributes to the creation of cracks in the shale rock formation. Apart from the expansion pressure of CO2 during the heat exchange between cold CO2 and hot shale rock, thermal stress can also be created on the formation rock surface by this cold fracturing fluid (CO2) shrinking the rock surface, and this also contributes to the creation of fractures [86]. The thermal stress on the rock surface can be estimated using Equation (3), which assumes that shale is a homogeneous and linear elastic rock.
where, is thermal stress, is Young’s modulus of the rock, is Poisson’s ratio, is the temperature difference caused by cool CO2 and is the linear thermal-expansion coefficient (about 2–5 × 10⁻⁵ K−1).
All of these facts confirm the unique role that can be played by CO2 as fracturing fluid in deep shale plays.
This concept has been tested using cold water in the field, in which case cold water is injected into the deep hot gas reservoir with a constant injection rate to generate thermally-induced fractures. However, this has not succeeded for clay-abundant shale plays, mainly due to the induced swelling through clay-water interaction that covers the thermal effect. The use of non-water CO2 as fracturing fluid totally avoids this issue. Only the heat exchange between cold CO2 and hot shale rock can cause a significant thermodynamic expansion pressure in CO2 within a very short time period, also creating a thermal stress on the contact surface of the rock in a sufficiently long time period.
5.2. Low Breakdown Pressure
As mentioned earlier, above the critical temperature of 31.1 °C and critical pressure of 7.38 MPa CO2 exists in its super-critical state, when it exhibits gas-like low viscosity, high diffusion capacity and liquid-like density [87]. For example, when CO2 is in its super-critical state, the viscosity of CO2 is lower than 200 μPa·s, which is much lower than that of water or liquid CO2 and is similar to that of gaseous CO2 (Figure 12). With the increase of temperature at a constant pressure, the viscosity of CO2 continuously reduces.
Both high viscosity and low viscosity fluids can be effective as fracturing fluids for shale plays, depending on their permeability characteristics. High viscosity fluid with added proppants is more effective for highly permeable shale formations, as it creates highly conductive but short fractures, and low viscosity fluid is more effective for shale with ultra-low permeability characteristics such as clay abundant shale formations, as it creates long and narrow fractures [89]. Super-critical CO2 with its much lower viscosity can therefore generate a better fracture network in clay-abundant shale formations. In particular, low viscosity super-critical CO2 has better penetrability through the rock matrix and narrow pore throats, which creates much longer fluid pressure distribution length around the crack tip. This is found to be much better performing than the traditional water fracturing (Figure 13).
Because of the greater diffusivity characteristics of super-critical CO2 compared to water, it has a higher penetration rate as a jet drilling fluid that creates much greater pore pressure development, contributing to the fracturing [90]. Kolle [91] has compared the jet-erosion drilling rate by water and super-critical CO2 using a 100 kW and 50 mm diameter drilling system in Mancos Shale, and made an interesting finding. Although the threshold pressure for super-critical CO2 (55 MPa) is much lower than water (124 MPa) (see Figure 14), super-critical CO2 exhibits much superior drilling rates, with of an order of magnitude higher than water. This indicates the feasibility of super-critical CO2 as a fracturing medium in shales.
5.3. Avoidance of Swelling-Related Issues
As mentioned earlier, the injection of water-related fracking fluids into clay-abundant formations to create hydraulic fractures is highly inappropriate, because the water-clay interaction leads to significant shale mass physico-chemical property alterations, of which water adsorption-induced swelling is dominant (see Section 2.2). The swelling of water-sensitive clay minerals, such as smectite and illite, with water adsorption shrinks and eventually closes the fractures created by the hydro fracturing process, and the fracturing process therefore becomes less productive [46]. The injection of non-water or non-aqueous fracturing fluid should therefore be considered as a substitute for aqueous fracturing fluid for hydraulic fracturing in clay-abundant shale plays, in order to minimize the water-clay interaction and related issues. For example, according to Baptist and Sweeney [47], the permeability of the Wyoming field clay-abundant formation for air is much higher than that for water/brine due to this swelling effect.
The suitability of using CO2 as a replacement for water-based fracking fluid in clay-abundant reservoirs has been extensively tested and the expansion behaviour of clay mineral in shale formations caused by CO2 sorption is still a controversial topic [92]. Compared with water, CO2 can induce much less swelling of clay minerals and the swelling effect is greatly dependent on the initial water content in clay minerals. For example, the experimental studies conducted by Al Otaibi et al. [93] and Giesting et al. [94] showed that super-critical CO2 adsorption into clay minerals (Na or Ca-montmorillonite in this case) does not produce any significant swelling in dry clay minerals. Maximum expansion caused by CO2 from 11.3 Å to 12.3 Å occurred when small amounts of water present in montmorillonite and the swelling is nearly an order of magnitude lower than that caused by water [94,95]. While for clay minerals with high water saturation, the dehydration effect caused by CO2 dominates the hydration effect and CO2 also causes the net drying of clay particles, resulting in reduction of the basal spacing of swelled clay minerals. The D-spacing of Na-Montmorillonite with 64% water saturation collapsed by 15% after exposed to super-critical CO2 [95] and Al Otaibi et al. [93] found that the D-spacing of fully hydrated Na and Ca-montmorillonite decreased by a significant amount (around 25% and 14.2%) after super-critical CO2 treatment.
Furthermore, the injection of CO2 into a clay-abundant shale formation with a significant amount of residual water causes the injected CO2 to be dissolved in the available water to form carbonic acid. This acidizes the residual water, and up to around 3.2 pH reduction has been observed by Crawford et al. [80] and King [96]. This weak carbonic acid dissolves some available carbonates such as calcite in the formation, which eventually increases the ionic strength of the pore solution, resulting in reduced osmotic swelling of clay minerals.
When all these facts are considered, it is clear that the replacement of water-based fracking fluids with CO2 leads to significant avoidance of the water-clay interaction and associated swelling by various means. Therefore, CO2 can be considered a suitable fracking fluid agent for clay-abundant shale formations.
5.4. Contribution to Mitigation of the Greenhouse Gas Effect
Shale gas is mainly composed of methane, which mainly exists as adsorbed gas in the shale mass. However, CO2 has higher affinity to adsorb into many rock masses including shales [97,98,99]. Therefore, the injection of CO2 into shale causes its adsorbed methane to be replaced by the injected CO2, resulting in greater shale gas production. For example, according to Figure 15, gas adsorption capacity increases with the increase of pressure, while the adsorption capacity of CO2 is much stronger than that of CH4, and the ratio between them is around 3. Similar experimental values have been verified by other researchers, and the ratio of CO2 to methane adsorption capacity in shale is around 5.3 to 1 [36] and 3.3:1 [38] at 2.8 MPa and 10 MPa pressures, respectively.
The gas sorption process in shale formations is dependent on the type of gas molecules and the CEC of the clay minerals. For example, according to the Monte Carlo simulations conducted by Jin and Firoozabadi [100], the cation exchange of montmorillonite clay mineral enhances CO2 adsorption in the interlayers. This is because the exchange of cations in the tetrahedral/octahedral sheets in clay minerals leads to insufficiency in positive charges, which needs to be balanced by exchangeable cations in the interlayer space [62], in which the negatively charged layers are held tightly together very strongly by the interlayer cations. However, the researchers could observe only a minor influence of cation exchange on methane adsorption in these clay minerals. This is due to the strong quadrupole moments of CO2 that enhance the sorption by interacting with the charged clay atoms. Therefore, increasing the cation exchange rate further enhances the CO2 sorption capacity. However, such quadrupole moments do not exist in CH4 and its adsorption in shale is mainly through dispersive clay-methane interactions [100,101]. In addition to the adsorbing gas type, the types of exchangeable cations available in clay minerals also affect the gas sorption process, the gas sorption capacity being found to be maximal on exchange cations with larger ionic radius, such as alkali-metal exchange derivatives [101].
This greater adsorption affinity of CO2 in shales compared to CH4 and the corresponding methane replacement by the injected CO2 has an additional advantage for the process through the storage of substantial amounts of CO2 in shale plays, therefore contributing to the mitigation of atmospheric CO2 levels and ultimately assisting in overcoming global warming. For example, up to around 171 billion tonnes of CO2 can be stored in the Marcellus Shale in the Appalachian Basin [38] and up to around 28 billion tonnes in the Devonian shales in Kentucky [36]. According to the prediction of Liu et al. [102] based on reservoir modelling, around 4 × 10⁴ tonnes of CO2 can be injected through each horizontal well into the New Albany Shale play with less than 1% breakthrough, of which 95% of the CO2 can be sequestrated in the shale play. Therefore, the use of a greenhouse gas such as CO2 in the hydro fracturing process will assist in protecting the environment by reducing the greenhouse gas effect and will also lead to additional shale gas production enhancement.
5.5. Minimization of Issues Related to Residual Fluids
The retention of residual water in deep geological formations mainly occurs through the high capillary pressures acting on these formations. This is because the capillary pressure can increase up to around 10–20 MPa, or much higher in deep shale plays. Such high capillary pressures clearly extend the fluid recovery time and also cause a significant amount of water-based fracturing fluid to be permanently retained in the formation, unless sufficient capillary-drawdown force is applied. This retained water critically influences the gas flow ability through the shale play, and therefore significantly reduces shale gas production [103].
Due to the existing low permeability and the initiation of interaction between clay minerals and water in clay-abundant shale plays, greater amounts of water can be trapped in the rock matrix compared to normal shale plays. According to Figure 16, water content is almost linearly related to the clay content in shales (here, black points are for the water content when the samples are in equilibrium with an atmosphere with a relative humidity of 50% [77], and red and blue points are for natural water content and water content after swell testing of shale samples [61]. This water-retention issue created by high capillary pressures becomes worse in clay-abundant shale plays, because the pressure drawdown in high-pressure geological reservoirs is generally greater than the capillary end effect between the reservoirs and its fractures. Therefore, the capillary pressure will not affect gas production enhancement using hydro fracturing [104]. However, the situation is different for tight low-pressure reservoirs, where the capillary pressure can go up to more than several megapascals. Under these conditions, the fracture water easily attaches in the reservoir during the well shut-in operation period. For example, Holditch [104] observed only a little water production and a 30 days short gas breakthrough in a low permeable shale play (0.0017 md permeability), when the pressure drawdown was less than the reservoir’s capillary pressure, due to barriers created by the retained residual water. Therefore, it is clear that this issue is significant for low permeable and water-sensitive clay-abundant shale plays. According to the J-function given in Equation (4) [105], the value of capillary pressure is inversely proportional to the square root of permeability. Given the low permeability of these reservoirs, the capillary pressure is greatly increased, which eventually further reduces reservoir permeability through water retainment, resulting in significant reduction in the gas production and extensive clean-up times [104].
where, is the capillary pressure at the same water saturation, is the reservoir pressure, is the reservoir porosity, c is a coefficient at a given water saturation and is the reservoir permeability.
As mentioned in Section 2.3, clay-abundant shale plays have a larger number of tiny pores, through which viscous fluids like water cannot penetrate and therefore remain outside these pores. Further, this residual water blocks the small throats, causing difficulties in the extraction of gas from the micro-pores [14,15,33]. According to Figure 17, with the absorbed water content in clay-abundant shale rock increased to around 2%, the air permeability decreased by more than 95%. However, carbon dioxide with low viscosity has the ability to penetrate through small pores, especially in its likely super-critical state in deep shale plays (CO2 generally exists in its super-critical state in deep shale plays due to the high pressure and temperature conditions in them), owing to its high compressibility. According to Bustin et al. [16], CO2 can reach pores as fine as 0.35 nm, which is much smaller than water, due to the high capillary pressure in low permeability shales (about 15 MPa for an average pore throat radius of 10 nm) [12]. In addition, the diffusivity of CO2 is much higher than water. Therefore, it can easily diffuse through bottle-necked pore networks created by tiny pores and the available retained water [106].
The extensive clean-up time is one of the major issues in the use of water-based fracking fluids in clay-abundant shale plays, as the fracking fluid tends to remain in the formation after the treatment, due to the high capillary forces in these formations. According to King [96], Arnold [11] and Campbell et al. [34], only 25–50% of water-based fracturing fluid can be recovered and recovery takes extensive time (months or years). This issue can be minimized by using CO2-based fracking fluid, as the average clean-up time for CO2-based fracturing fluid is as short as several days [35,96]. In addition to its small molecular size, large compressibility, and high diffusion rate, the phase changes of CO2 from super- critical/liquid to gas while it moves upward due to the reduction of pressure also significantly reduce the time required for residual CO2 to move back to the surface.
6. Field Examples of Gas/Oil Production Enhancement Using CO2 Injection into Clay-Abundant Formations
Based on the above facts, the n-reactivity with clay minerals, zero residual fracturing fluid and rapid clean-up of CO2 greatly increase the efficiency of the hydro fracturing process and therefore effectively enhance gas production from shale plays. The feasibility of using CO2 to enhance gas/oil production from clay-abundant formations has been validated for a variety of formations around the world, including shales with ultra-low permeability. This may accelerate its large-scale application in hydro fracturing using CO2 as fracturing fluid in shale plays [96]. According to Sinal and Lancaster [107], gas production in the Belly River and Bearpaw basins could increase by three times using liquid CO2 as fracturing fluid. A Department of Energy (DoE)-supported project has been conducted in a Pennsylvania gas reservoir, using dry hydro fracturing in three wells with CO2 as fracking fluid. Immediate 1000% and 600% gas productivity enhancements for two of those wells were observed [11]. Campbell et al. [34] compared the production response of wells stimulated with liquid CO2 and nitrogen-water foam in Lewis shale in the San Juan Basin, New Mexico. The gas production figures after clean-up following CO2 and 70Q foam (70Q nitrogen-foamed treatment, 70% of N2 concentration in foam)-based hydro fracturing were around 192 Mscfd to 1800 Mscfd (648 Mscfd on average) from 16 wells and 118 Mscfd to 1200 Mscfd (348 Mscfd average) from 23 wells, respectively. This shows the significantly greater gas production capability of CO2 in hydro fracturing.
On the basis of the specific advantages of CO2 over water, CO2 has also been used in the field to enhance oil production from clay-abundant formations. For example, the injection of CO2 led to around 20% and 33% additional oil recovery after water-flooding from the Tor and Ekofisk formations, respectively (see Figure 18). This is because CO2 has the ability to penetrate into tiny pores and push out the residual oil from them [56]. Of these two formations, the Ekofisk formation had a greater percentage of clay (3 wt % and up to around 23 wt % in some tight zones), mainly smectite, compared to the Tor formation (only around 0.1 wt % of clay). Therefore, although the two formations have the same porosity, the permeability of the Ekofisk formation is around five-fold lower than that of the Tor formation [13]. The treatment of water-flooding reduced the oil saturation from 85.0% (initial saturation) to 25.3% in the Tor formation and from 63.7% (initial saturation) to 37.7% in the Ekofisk formation, and the CO2 flooding sequentially reduced the oil saturations in the Tor and Ekofisk Formations to around 5.8% and 4.6% (final saturation), respectively. The water-flooding treatment created less oil extraction enhancement and reduced residual oil removal from the Ekofisk formation, showing the greater reservoir damage caused by water flooding in the presence of greater clay content in the formation. Further, the around 5% low oil saturation obtained after CO2 flooding in both formations exhibits the greater ability of CO2 to enhance oil recovery compared to water, especially from clay-abundant low permeability formations [56]. The greater oil production produced by CO2 injection is also affected by the acidification created by CO2 in the pore fluid, where the weak carbonic acid made by CO2 dissolution in water dissolves the existing carbonates such as calcite from the formation [80,96]. This results in lower specific surface area and greater rock mass porosity and eventually greater permeability and therefore production enhancement. This is demonstrated by the 1–2% and 2–3% porosity increments observed after CO2 injection in the Ekofisk and Tor formations, respectively [108]. However, according to El Hajj et al. [109], although CO2 injection into brine-saturated rock causes it to be rougher (with smaller grain size) and more porous due to the dissolution of some carbonates such as calcite, the reduction of CO2 injecting pressure may cause the precipitation of some carbonates through re-mineralization, resulting in reduced pore size and eventually, reduced formation permeability. Therefore, it is clear that maintaining an appropriate CO2 injection pressure is necessary to obtain effective production enhancement from clay-abundant shale formations.
Rahman et al. [25] conducted a case study of gas production enhancement by fracturing a large, clay-abundant tight gas reservoir with 11% porosity and 0.1 md permeability. Although several water-based fracturing treatments were tried initially, the gas flow rate was not enhanced by an economically viable amount over 30 years. According to the investigation results, this is related to the high percentage of water-sensitive clay minerals like smectite present in the formation, and dumping a water-based fracturing fluid into such formations swells the clay minerals, reducing the formation permeability and trapping the residual fluid inside the fractures, creating water barriers to gas production. Furthermore, some clay minerals such as kaolinite are extracted from the rock mass by the injecting water and eventually fill the rock mass pores, reducing the pore space available for gas movement. In addition, the high viscosity of water-based fracturing fluid makes it hard to penetrate into tiny fractures. It therefore blocks the fractures, making it impossible to fracture a considerable portion of the pay zone. After obtaining comprehensive knowledge of the issues created by water-based fracturing, the researchers decided to use non-water-based fracturing fluid, liquid CO2, to clean up the formation, after which the gas flow rate significantly increased. Table 4 shows the operational scenarios considered by Rahman et al. [25].
7. Conclusions
Clay-abundant shale formations are widely existing gas production sources deep underground. However, these formations have unique characteristics compared to normal shale plays, mainly due to their high clay contents. Their utilization for gas production therefore requires comprehensive knowledge of their physico-chemical structure and its influence on shale gas production. A comprehensive review was therefore conducted and the following major conclusions can be drawn:
- ➢
- Clay-abundant shale formations have a positive influence on gas storage potential, because the laminated structures of fine clay particles can create high total surface area and high porosities, which provide great locus for gas adsorption.
- ➢
- However, clay-abundant formations have significant amounts of water due to the high affinity of clay contents to water molecules, and high water contents contribute to the reduction of gas storage capacity by occupying potential sorption sites in the shale mass and blocking the small pore throats.
- ➢
- In addition, contacts between quartz particles in clay-abundant shale plays are separated by small clay particles, resulting in reduced tensile and shear strength and enhanced ductile properties of shale formations, which affect the long-term safety of the shale gas recovery process and some advanced shale gas recovery enhancement techniques, such as hydro fracturing.
- ➢
- The swelling effect is critical, and occurs upon the interaction of clay minerals with water, causing a huge reduction in pore space and flow paths for gas movement in shale matrix, and the swelling of clay contents on the created fracture surfaces also greatly compress fracture space and even can close the created fractures. The use of traditional water-based fracturing fluids to enhance gas productivity in clay-abundant shale plays is therefore inappropriate, and non-water based fracturing fluids are preferred.
- ➢
- Liquid CO2 is an ideal fracturing medium for clay-abundant formations due to the large thermo pressure developed during the heat exchange between cold CO2 and reservoir rock, which works as a cracking pressure. The much lower viscosity of super-critical CO2 and the associated better penetrability through rock mass narrow pore throats, and create longer fractures. The use of CO2 as fracturing fluid induces minimal swelling effects. It also reduces the formation’s residual water and enables rapid clean-up, mainly due to the large compressibility and high diffusion rate of CO2. This also contributes to the mitigation of the greenhouse gas effect in the replacement process of adsorption methane by the injected CO2 with stronger adsorption.
Acknowledgments
Chengpeng Zhang thanks for the financial support from China Scholarship Council (CSC) and Monash University.
Author Contributions
Chengpeng Zhang wrote the draft paper with support from Ranjith Pathegama Gamage and Jian Zhao; Chengpeng Zhang and Mandadige Samintha Anne Perera revised the paper according to reviewers’ comments.
Conflicts of Interest
The authors declare no conflict of interest.
References
- Wanniarachchi, W.; Ranjith, P.; Perera, M.; Lashin, A.; Al Arifi, N.; Li, J. Current opinions on foam-based hydro-fracturing in deep geological reservoirs. Geomech. Geophys. Geo-Energy Geo-Resour. 2015, 1, 121–134. [Google Scholar] [CrossRef]
- Conti, J.; Holtberg, P.; Diefenderfer, J.; Napolitano, S.; Schaal, A.; Turnure, J.; Westfall, L. Annual Energy Outlook 2014 with Projections to 2040; US Energy Information Administration: Washington, DC, USA, 2014.
- Daigle, H.; Screaton, E. Evolution of sediment permeability during burial and subduction. Geofluids 2015, 15, 84–105. [Google Scholar] [CrossRef]
- Kumar, H.; Elsworth, D.; Mathews, J.; Marone, C. Permeability evolution in sorbing media: Analogies between organic-rich shale and coal. Geofluids 2015, 16, 43–55. [Google Scholar] [CrossRef]
- Nicot, J.-P.; Scanlon, B.R. Water use for shale-gas production in Texas, US. Environ. Sci. Technol. 2012, 46, 3580–3586. [Google Scholar] [CrossRef] [PubMed]
- Wang, Q.; Chen, X.; Jha, A.N.; Rogers, H. Natural gas from shale formation–The evolution, evidences and challenges of shale gas revolution in United States. Renew. Sustain. Energy Rev. 2014, 30, 1–28. [Google Scholar] [CrossRef]
- Rivard, C.; Lavoie, D.; Lefebvre, R.; Séjourné, S.; Lamontagne, C.; Duchesne, M. An overview of Canadian shale gas production and environmental concerns. Int. J. Coal Geol. 2014, 126, 64–76. [Google Scholar] [CrossRef]
- Johnson, E.G.; Johnson, L.A. Hydraulic fracture water usage in northeast British Columbia: Locations, volumes and trends. In Geoscience Report 2012; British Columbia Ministry of Energy and Mines: Fort St. John, BC, Canada, 2012; pp. 41–63. [Google Scholar]
- Boz, M.A.; Pe, M. Recycling of Produced and Flowback Water in Oil and Gas Drilling Operations through Hydraulic Fracturing in Texas. In Proceedings of the Shale Energy Engineering Conference 2014, Pittsburgh, PA, USA, 21–23 July 2014; pp. 45–52. [Google Scholar]
- Ghahremani, N.; Clapp, L. Feasibility of Using Brackish Groundwater Desalination Concentrate as Hydraulic Fracturing Fluid in the Eagle Ford Shale. In Shale Energy Engineering 2014: Technical Challenges, Environmental Issues, and Public Policy; American Society of Civil Engineers (ASCE): Reston, VA, USA, 2014; pp. 23–32. [Google Scholar]
- Arnold, D. Liquid CO2 and sand: An alternative to water-based stimulation fluids. Pet. Eng. Int. 1998, 71, 89–92. [Google Scholar]
- Lal, M.S.; Amoco, B. Shale stability: Drilling fluid interaction and shale strength. In Proceedings of the SPE Asia Pacific Oil and Gas Conference and Exhibition, Caracas, Venezuela, 20–22 April 1999. SPE 54356. [Google Scholar]
- Røgen, B.; Fabricius, I.L. Influence of clay and silica on permeability and capillary entry pressure of chalk reservoirs in the North Sea. Pet. Geosci. 2002, 8, 287–293. [Google Scholar] [CrossRef]
- Ross, D.J.; Bustin, R.M. The importance of shale composition and pore structure upon gas storage potential of shale gas reservoirs. Mar. Pet. Geol. 2009, 26, 916–927. [Google Scholar] [CrossRef]
- Ross, D.J.; Bustin, R.M. Shale gas potential of the lower jurassic gordondale member, northeastern British Columbia, Canada. Bull. Can. Pet. Geol. 2007, 55, 51–75. [Google Scholar] [CrossRef]
- Bustin, R.M.; Bustin, A.M.; Cui, A.; Ross, D.; Pathi, V.M. Impact of shale properties on pore structure and storage characteristics. In Proceedings of the SPE Shale Gas Production Conference, Fort Worth, TX, USA, 16–18 November 2008; SPE 119892. Society of Petroleum Engineers: Richardson, TX, USA, 2008. [Google Scholar]
- Kuila, U.; Prasad, M. Surface area and pore-size distribution in clays and shales. In Proceedings of the 2011 SPE Annual Technical Conference and Exhibition, Denver, CO, USA, 30 October–2 November 2011. SPE 146869. [Google Scholar]
- Wang, H.; Li, G.; Shen, Z. A feasibility analysis on shale gas exploitation with supercritical carbon dioxide. Energy Sources Part A Recovery Util. Environ. Eff. 2012, 34, 1426–1435. [Google Scholar] [CrossRef]
- Dusseault, M.B.; Loftsson, M.; Russell, D. The mechanical behavior of the Kettle Point oil shale. Can. Geotech. J. 1986, 23, 87–93. [Google Scholar] [CrossRef]
- Jarvie, D.M.; Hill, R.J.; Ruble, T.E.; Pollastro, R.M. Unconventional shale-gas systems: The Mississippian Barnett Shale of north-central Texas as one model for thermogenic shale-gas assessment. AAPG Bull. 2007, 91, 475–499. [Google Scholar] [CrossRef]
- Buller, D.; Hughes, S.N.; Market, J.; Petre, J.E.; Spain, D.R.; Odumosu, T. Petrophysical evaluation for enhancing hydraulic stimulation in horizontal shale gas wells. In Proceedings of the SPE Annual Technical Conference and Exhibition, Florence, Italy, 19–22 September 2010; SPE 132990. Society of Petroleum Engineers: Richardson, TX, USA, 2010. [Google Scholar]
- Ding, W.; Li, C.; Li, C.; Xu, C.; Jiu, K.; Zeng, W.; Wu, L. Fracture development in shale and its relationship to gas accumulation. Geosci. Front. 2012, 3, 97–105. [Google Scholar] [CrossRef]
- Zhang, D.; Pathegama Gamage, R.; Perera, M.S.A.; Zhang, C.; Wanniarachchi, W.A.M. Influence of Water Saturation on the Mechanical Behaviour of Low-Permeability Reservoir Rocks. Energies 2017, 10, 236. [Google Scholar] [CrossRef]
- Zhou, Z.; Gunter, W.; Kadatz, B.; Cameron, S. Effect of clay swelling on reservoir quality. J. Can. Pet. Technol. 1996, 35, 18–23. [Google Scholar] [CrossRef]
- Rahman, M.; Suarez, Y.; Chen, Z.; Rahman, S. Unsuccessful hydraulic fracturing cases in Australia: Investigation into causes of failures and their remedies. J. Pet. Sci. Eng. 2007, 57, 70–81. [Google Scholar] [CrossRef]
- Scott, C.A.; Sugg, Z.P. Global energy development and climate-induced water scarcity—Physical limits, sectoral constraints, and policy imperatives. Energies 2015, 8, 8211–8225. [Google Scholar] [CrossRef]
- Vengosh, A.; Warner, N.; Jackson, R.; Darrah, T. The effects of shale gas exploration and hydraulic fracturing on the quality of water resources in the United States. Procedia Earth Planet. Sci. 2013, 7, 863–866. [Google Scholar] [CrossRef]
- Kang, D.; Pe, H.; Li, J.; Pe, H.; Wre, D. Modeling of Land Movement due to Groundwater Pumping from an Aquifer System with Stress-Dependent Storage. In Shale Energy Engineering 2014; ASCE: Reston, VA, USA, 2014; pp. 1–10. [Google Scholar]
- Ziemkiewicz, P.F.; He, Y.; Quaranta, J.D. Characterization of Waste Waters from Hydraulic Fracturing. In Shale Energy Engineering 2014; ASCE: Reston, VA, USA, 2014; pp. 63–73. [Google Scholar]
- Birkle, P. Geochemical fingerprinting of hydraulic fracturing fluids from qusaiba hot shale and formation water from paleozoic petroleum systems, Saudi Arabia. Geofluids 2016, 16, 565–584. [Google Scholar] [CrossRef]
- Ampomah, W.; Balch, R.; Cather, M.; Rose-Coss, D.; Dai, Z.; Heath, J.; Dewers, T.; Mozley, P. Evaluation of CO2 storage mechanisms in CO2 enhanced oil recovery sites: Application to Morrow sandstone reservoir. Energy Fuels 2016, 30, 8545–8555. [Google Scholar] [CrossRef]
- Lindeberg, E.; Grimstad, A.-A.; Bergmo, P.; Wessel-Berg, D.; Torsæter, M.; Holt, T. Large scale tertiary CO2 EOR in mature water flooded Norwegian oil fields. Energy Procedia 2017, 114, 7096–7106. [Google Scholar] [CrossRef]
- Tudor, R.; Vozniak, C.; Peters, W.; Banks, M.-L. Technical Advances in Liquid CO2 Fracturing. In Proceedings of the 45th Annual Technical Meeting of the Petroleum Society of CIM, Calgary, AB, Canada, 12–15 June 1994; Petroleum Society of Canada: Calgary, AB, Canada, 1994. [Google Scholar]
- Campbell, S.M.; Fairchild, N.R., Jr.; Arnold, D.L. Liquid CO2 and Sand Stimulations in the Lewis Shale San Juan Basin New Mexico: A Case Study. In Proceedings of the SPE Rocky Mountain Regional/Low-Permeability Reservoirs Symposium and Exhibition, Denver, CO, USA, 12–15 March 2000; SPE 60317. Society of Petroleum Engineers: Richardson, TX, USA, 2000. [Google Scholar]
- Yost, A.B.; Mazza, R.L.; Gehr, J.B. CO2/Sand Fracturing in Devonian Shales. In Proceedings of the Eastern Regional Conference & Exhibition, Pittsburgh, PA, USA, 2–4 November 1993; Society of Petroleum Engineers: Richardson, TX, USA, 1993. [Google Scholar]
- Nuttall, B.C.; Eble, C.F.; Drahovzal, J.A.; Bustin, R.M. Analysis of Devonian Black Shales in Kentucky for Potential Carbon Dioxide Sequestration and Enhanced Natural Gas Production; Kentucky Geological Survey Report DE-FC26–02NT41442; University of Kentucky: Lexington, KY, USA, 2005. [Google Scholar]
- Chareonsuppanimit, P.; Mohammad, S.A.; Robinson, R.L.; Gasem, K.A. High-pressure adsorption of gases on shales: Measurements and modeling. Int. J. Coal Geol. 2012, 95, 34–46. [Google Scholar] [CrossRef]
- Godec, M.; Koperna, G.; Petrusak, R.; Oudinot, A. Potential for enhanced gas recovery and CO2 storage in the Marcellus Shale in the Eastern United States. Int. J. Coal Geol. 2013, 118, 95–104. [Google Scholar] [CrossRef]
- Metwally, Y.M.; Chesnokov, E.M. Clay mineral transformation as a major source for authigenic quartz in thermo-mature gas shale. Appl. Clay Sci. 2012, 55, 138–150. [Google Scholar] [CrossRef]
- Chalmers, G.R.; Bustin, R.M.; Power, I.M. Characterization of gas shale pore systems by porosimetry, pycnometry, surface area, and field emission scanning electron microscopy/transmission electron microscopy image analyses: Examples from the Barnett, Woodford, Haynesville, Marcellus, and Doig units. AAPG Bull. 2012, 96, 1099–1119. [Google Scholar]
- Bai, B.; Elgmati, M.; Zhang, H.; Wei, M. Rock characterization of Fayetteville shale gas plays. Fuel 2013, 105, 645–652. [Google Scholar] [CrossRef]
- Das, P.; Achalpurkar, M.; Pal, O. Impact of Formation Softening and Rock Mechanical Properties on Selection of Shale Stimulation Fluid: Laboratory Evaluation. In Proceedings of the SPE/EAGE European Unconventional Resources Conference and Exhibition, Vienna, Austria, 25–27 February 2014. SPE 167787. [Google Scholar]
- Khodja, M.; Canselier, J.P.; Bergaya, F.; Fourar, K.; Khodja, M.; Cohaut, N.; Benmounah, A. Shale problems and water-based drilling fluid optimisation in the Hassi Messaoud Algerian oil field. Appl. Clay Sci. 2010, 49, 383–393. [Google Scholar] [CrossRef] [Green Version]
- Gross, D.; Sachsenhofer, R.; Bechtel, A.; Pytlak, L.; Rupprecht, B.; Wegerer, E. Organic geochemistry of Mississippian shales (Bowland Shale Formation) in central Britain: Implications for depositional environment, source rock and gas shale potential. Mar. Pet. Geol. 2015, 59, 1–21. [Google Scholar] [CrossRef]
- Sonstebo, E.F.; Horsrud, P. Effects of brines on mechanical properties of shales under different test conditions. Proceedinsg of the ISRM International Symposium-EUROCK 96, Turin, Italy, 2–5 September 1996; International Society for Rock Mechanics: Lisboa, Portugal, 1996; pp. 91–98. [Google Scholar]
- Rogala, A.; Krzysiek, J.; Bernaciak, M.; Hupka, J. Non-aqueous fracturing technologies for shale gas recovery. Physicochem. Probl. Miner. Process. 2013, 49, 313–321. [Google Scholar]
- Baptist, O.C.; Sweeney, S.A. The effect of clays on the permeability of reservoir sands to waters of different saline contents. Clays Clay Miner. 1954, 3, 505–515. [Google Scholar] [CrossRef]
- Shukla, R.; Ranjith, P.; Choi, S.; Haque, A.; Yellishetty, M.; Hong, L. Mechanical behaviour of reservoir rock under brine saturation. Rock Mech. Rock Eng. 2013, 46, 83–93. [Google Scholar] [CrossRef]
- Guo, Z.; Li, X.-Y.; Liu, C.; Feng, X.; Shen, Y. A shale rock physics model for analysis of brittleness index, mineralogy and porosity in the Barnett Shale. J. Geophys. Eng. 2013, 10, 025006. [Google Scholar] [CrossRef]
- Eslinger, E.; Pevear, D.R. Clay Minerals for Petroleum Geologists and Engineers; Society of Economic Paleontologists and Mineralogists: Tulsa, OK, USA, 1988. [Google Scholar]
- Bergaya, F.; Lagaly, G. Handbook of Clay Science; Newnes: Oxford, UK, 2013. [Google Scholar]
- Van Olphen, H.; Fripiat, J. Data Handbook for Clay Minerals and Other Non-Metallic Materials; Pergamon: New York, NY, USA, 1979. [Google Scholar]
- Hang, P.T.; Brindley, G. Methylene blue absorption by clay minerals. Determination of surface areas and cation exchange capacities (clay-organic studies XVIII). Clays Clay Miner. 1970, 18, 203–212. [Google Scholar] [CrossRef]
- Kozeny, J. Über Kapillare Leitung des Wassers im Boden:(Aufstieg, Versickerung und Anwendung auf die Bewässerung); Hölder-Pichler-Tempsky: Wien, Austria, 1927. [Google Scholar]
- Mortensen, J.; Engstrom, F.; Lind, I. The relation among porosity permeability and specific surface of chalk from the Gorm Field Danish North Sea. SPE Reserv. Eval. Eng. 1998, 1, 245–251. [Google Scholar] [CrossRef]
- Olsen, D. CO2 EOR production properties of chalk. In Proceedings of the SPE EUROPEC/EAGE Annual Conference and Exhibition, Vienna, Austria, 23–26 May 2011; SPE 142993. Society of Petroleum Engineers: Richardson, TX, USA, 2011. [Google Scholar]
- Drever, J. The Geochemistry of Natural Waters; Prentice-Hall: Englewood Cliffs, NJ, USA, 1988. [Google Scholar]
- Fitch, A.; Du, J.; Gan, H.; Stucki, J.W. Effect of clay charge on swelling: A clay-modified electrode study. Clays Clay Miner. 1995, 43, 607–614. [Google Scholar] [CrossRef]
- Önal, M. Swelling and cation exchange capacity relationship for the samples obtained from a bentonite by acid activations and heat treatments. Appl. Clay Sci. 2007, 37, 74–80. [Google Scholar] [CrossRef]
- Sabtan, A.A. Geotechnical properties of expansive clay shale in Tabuk, Saudi Arabia. J. Asian Earth Sci. 2005, 25, 747–757. [Google Scholar] [CrossRef]
- Gomez-Gutierrez, I.; Bryson, L.; Hopkins, T. Correlations between geotechnical properties and the swell behavior of compacted shales. In Geo-Frontiers 2011; ASCE: Reston, VA, USA, 2011; pp. 4119–4128. [Google Scholar]
- Madsen, F.T.; Müller-Vonmoos, M. The swelling behaviour of clays. Appl. Clay Sci. 1989, 4, 143–156. [Google Scholar] [CrossRef]
- Slade, P.; Quirk, J.; Norrish, K. Crystalline swelling of smectite samples in concentrated NaCl solutions in relation to layer charge. Clays Clay Miner. 1991, 39, 234–238. [Google Scholar] [CrossRef]
- Amorim, C.L.G.; Lopes, R.T.; Barroso, R.C.; Queiroz, J.C.; Alves, D.B.; Perez, C.A.; Schelin, H.R. Effect of clay–water interactions on clay swelling by X-ray diffraction. Nucl. Instrum. Methods Phys. Res. Sect. A Accel. Spectrom. Detect. Assoc. Equip. 2007, 580, 768–770. [Google Scholar] [CrossRef]
- Clarkson, C.R.; Solano, N.; Bustin, R.M.; Bustin, A.M.M.; Chalmers, G.R.L.; He, L.; Melnichenko, Y.B.; Radliński, A.P.; Blach, T.P. Pore structure characterization of North American shale gas reservoirs using USANS/SANS, gas adsorption, and mercury intrusion. Fuel 2013, 103, 606–616. [Google Scholar] [CrossRef]
- Katsube, T. Shale Permeability and Pore-Structure Evolution Characteristics; Current Research 2000-E15; Geological Survey of Canada: Ottawa, ON, Canada, 2000; pp. 1–9. [Google Scholar]
- Lu, X.-C.; Li, F.-C.; Watson, A.T. Adsorption studies of natural gas storage in Devonian Shales. SPE Form. Eval. 1995, 10, 109–113. [Google Scholar] [CrossRef]
- Liu, D.; Yuan, P.; Liu, H.; Li, T.; Tan, D.; Yuan, W.; He, H. High-pressure adsorption of methane on montmorillonite, kaolinite and illite. Appl. Clay Sci. 2013, 85, 25–30. [Google Scholar] [CrossRef]
- Chen, J.; Zhang, G.; Chen, H.; Yin, X. The Construction of Shale Rock Physics Effective Model and Prediction of Rock Brittleness. In Proceedings of the 2014 SEG Annual Meeting, Denver, CO, USA, 26–31 October 2014; Society of Exploration Geophysicists: Tulsa, OK, USA, 2014; pp. 2861–2865. [Google Scholar]
- Katahara, K.W. Clay mineral elastic properties. In Proceedings of the 1996 SEG Annual Meeting, Denver, CO, USA, 10–15 November 1996; Society of Exploration Geophysicists: Tulsa, OK, USA, 1996. [Google Scholar]
- Wang, Z.; Wang, H.; Cates, M.E. Effective elastic properties of solid clays. Geophysics 2001, 66, 428–440. [Google Scholar] [CrossRef]
- Prasad, M.; Kopycinska, M.; Rabe, U.; Arnold, W. Measurement of Young’s modulus of clay minerals using atomic force acoustic microscopy. Geophys. Res. Lett. 2002, 29, 1311–1314. [Google Scholar] [CrossRef]
- Prasad, M.; Hofmann, R.; Batzle, M.; Kopycinska-Müller, M.; Rabe, U.; Arnold, W. Values of Mineral Modulus of Clay. In Proceedings of the 2005 SEG Annual Meeting, Houston, TX, USA, 6–11 November 2005; Society of Exploration Geophysicists: Tulsa, OK, USA, 2005. [Google Scholar]
- Pal-Bathija, A.; Prasad, M.; Liang, H.; Batzle, M.; Lu, N.; Upmanyu, M. Elastic properties of clay minerals. In Proceedings of the 2008 SEG Annual Meeting, Las Vegas, NV, USA, 9–14 November 2008; Society of Exploration Geophysicists: Las Vegas, NV, USA, 2008; pp. 1610–1614. [Google Scholar]
- Mondol, N.H.; Jahren, J.; Bjørlykke, K.; Brevik, I. Elastic properties of clay minerals. Lead. Edge 2008, 27, 758–770. [Google Scholar] [CrossRef]
- Han, D.-H.; Nur, A.; Morgan, D. Effects of porosity and clay content on wave velocities in sandstones. Geophysics 1986, 51, 2093–2107. [Google Scholar] [CrossRef]
- Chenevert, M.E. Shale alteration by water adsorption. J. Pet. Technol. 1970, 22, 1141–1148. [Google Scholar] [CrossRef]
- Wong, R. Swelling and softening behaviour of La Biche shale. Can. Geotech. J. 1998, 35, 206–221. [Google Scholar] [CrossRef]
- Wang, F.P.; Gale, J.F. Screening criteria for shale-gas systems. Gulf Coast Assoc. Geol. Soc. Trans. 2009, 59, 779–793. [Google Scholar]
- Crawford, H.; Neill, G.; Bucy, B.; Crawford, P. Carbon dioxide-a multipurpose additive for effective well stimulation. J. Pet. Technol. 1963, 15, 237–242. [Google Scholar] [CrossRef]
- Lillies, A.T.; King, S.R. Sand Fracturing With Liquid Carbon Dioxide. In Proceedings of the SPE Production Technology Symposium, Hobbs, NM, USA, 8–9 November 1982; SPE 11341. Society of Petroleum Engineers: Richardson, TX, USA, 1982. [Google Scholar]
- Zhou, X.; Burbey, T. Fluid effect on hydraulic fracture propagation behavior: A comparison between water and supercritical CO2-like fluid. Geofluids 2014, 14, 174–188. [Google Scholar] [CrossRef]
- Reig, P.; Luo, T.; Proctor, J.N. Global Shale Gas Development: Water Availability and Business Risks; World Resources Institute: Washington, DC, USA, 2014. [Google Scholar]
- Perera, M.; Ranjith, P.; Choi, S.-K.; Bouazza, A.; Kodikara, J.; Airey, D. A review of coal properties pertinent to carbon dioxide sequestration in coal seams: With special reference to Victorian brown coals. Environ. Earth Sci. 2011, 64, 223–235. [Google Scholar] [CrossRef]
- Niezgoda, T.; Miedzińska, D.; Małek, E.; Kędzierski, P.; Sławiński, G. Study on carbon dioxide thermodynamic behavior for the purpose of shale rock fracturing. Bull. Pol. Acad. Sci. Tech. Sci. 2013, 61, 605–612. [Google Scholar] [CrossRef]
- Mueller, M.; Amro, M.; Haefner, F.K.A.; Hossain, M.M. Stimulation of tight gas reservoir using coupled hydraulic and CO2 cold-frac technology. In Proceedings of the SPE Asia Pacific Oil and Gas Conference and Exhibition, Perth, Australia, 22–24 October 2012; SPE 160365. Society of Petroleum Engineers: Richardson, TX, USA, 2012. [Google Scholar]
- Perera, M.; Ranjith, P.; Viete, D. Effects of gaseous and super-critical carbon dioxide saturation on the mechanical properties of bituminous coal from the Southern Sydney Basin. Appl. Energy 2013, 110, 73–81. [Google Scholar] [CrossRef]
- Lemmon, E.; Huber, M.; Mclinden, M. NIST Standard Reference Database 23: NIST Reference Fluid Thermodynamic and Transport Properties—REFPROP, Version 9.0; Standard Reference Data Program; National Institute of Standards and Technology: Gaithersburg, MD, USA, 2010.
- Haimson, B.; Fairhurst, C. Initiation and extension of hydraulic fractures in rocks. Soc. Pet. Eng. J. 1967, 7, 310–318. [Google Scholar] [CrossRef]
- Zhang, C.; Ranjith, P.; Perera, M.; Zhao, J.; Zhang, D.; Wanniarachchi, W. A novel approach to precise evaluation of carbon dioxide flow behaviour in siltstone under tri-axial drained conditions. J. Nat. Gas Sci. Eng. 2016, 34, 331–340. [Google Scholar] [CrossRef]
- Kolle, J.J. Coiled-tubing drilling with supercritical carbon dioxide. In Proceedings of the SPE/CIM International Conference on Horizontal Well Technology, Calgary, AB, Canada, 6–8 November 2000; SPE/PS-CIM 65534. Society of Petroleum Engineers: Richardson, TX, USA, 2000. [Google Scholar]
- Busch, A.; Bertier, P.; Gensterblum, Y.; Rother, G.; Spiers, C.; Zhang, M.; Wentinck, H. On sorption and swelling of CO2 in clays. Geomech. Geophys. Geo-Energy Geo-Resour. 2016, 2, 111–130. [Google Scholar] [CrossRef]
- Al Otaibi, F.M.; Khaldi, M.H.; Funk, J.J.; Shen, S.; Al-Qahtani, J. Supercritical CO2 Interaction with Montmorillonite Clay. In Proceedings of the SPE EOR Conference at Oil and Gas West Asia, Muscat, Oman, 16–18 April 2012; SPE 151777. Society of Petroleum Engineers: Richardson, TX, USA, 2012. [Google Scholar]
- Giesting, P.; Guggenheim, S.; van Groos, A.F.K.; Busch, A. Interaction of carbon dioxide with Na-exchanged montmorillonite at pressures to 640 bars: Implications for CO2 sequestration. Int. J. Greenh. Gas Control 2012, 8, 73–81. [Google Scholar] [CrossRef]
- Ilton, E.S.; Schaef, H.T.; Qafoku, O.; Rosso, K.M.; Felmy, A.R. In situ X-ray diffraction study of Na+ saturated montmorillonite exposed to variably wet super critical CO2. Environ. Sci. Technol. 2012, 46, 4241–4248. [Google Scholar] [CrossRef] [PubMed]
- King, S. Liquid CO2 for the Stimulation of Low-Permeability Reservoirs. In Proceedings of the SPE/DOE Low Permeability Gas Reservoirs Symposium, Denver, CO, USA, 14–16 March 1983; SPE/DOE 11616. Society of Petroleum Engineers: Richardson, TX, USA, 1983. [Google Scholar]
- Ranjith, P.; Perera, M. Effects of cleat performance on strength reduction of coal in CO2 sequestration. Energy 2012, 45, 1069–1075. [Google Scholar] [CrossRef]
- Perera, M.; Ranjith, P. Carbon dioxide sequestration effects on coal’s hydro-mechanical properties: A review. Int. J. Energy Res. 2012, 36, 1015–1031. [Google Scholar] [CrossRef]
- Perera, M.; Ranjith, P.; Choi, S.; Airey, D.; Weniger, P. Estimation of gas adsorption capacity in coal: A review and an analytical study. Int. J. Coal Prep. Util. 2012, 32, 25–55. [Google Scholar] [CrossRef]
- Jin, Z.; Firoozabadi, A. Methane and carbon dioxide adsorption in clay-like slit pores by Monte Carlo simulations. Fluid Phase Equilibr. 2013, 360, 456–465. [Google Scholar] [CrossRef]
- Melnitchenko, A.; Thompson, J.G.; Volzone, C.; Ortiga, J. Selective gas adsorption by metal exchanged amorphous kaolinite derivatives. Appl. Clay Sci. 2000, 17, 35–53. [Google Scholar] [CrossRef]
- Liu, F.; Ellett, K.; Xiao, Y.; Rupp, J.A. Assessing the feasibility of CO2 storage in the New Albany Shale (Devonian–Mississippian) with potential enhanced gas recovery using reservoir simulation. Int. J. Greenh. Gas Control 2013, 17, 111–126. [Google Scholar] [CrossRef]
- Taylor, R.S.; Fyten, G.; Romanson, R.; Mcintosh, G.; Litun, R.; Munn, D.; Bennion, B.; Piwowar, M.; Hoch, O. Montney Fracturing-Fluid Considerations. J. Can. Pet. Technol. 2010, 49, 28–36. [Google Scholar] [CrossRef]
- Holditch, S.A. Factors affecting water blocking and gas flow from hydraulically fractured gas wells. J. Pet. Technol. 1979, 31, 1515–1524. [Google Scholar] [CrossRef]
- Amyx, J.W.; Bass, D.M.; Whiting, R.L. Petroleum Reservoir Engineering; McGraw-Hill College: New York, NY, USA, 1960. [Google Scholar]
- Larsen, J.W.; Hall, P.; Wernett, P.C. Pore structure of the Argonne premium coals. Energy Fuels 1995, 9, 324–330. [Google Scholar] [CrossRef]
- Sinal, M.; Lancaster, G. Liquid CO2 fracturing: Advantages and limitations. J. Can. Pet. Technol. 1987, 26, 26–30. [Google Scholar] [CrossRef]
- Alam, M.M.; Hjuler, M.L.; Christensen, H.F.; Fabricius, I.L. Petrophysical and rock-mechanics effects of CO2 injection for enhanced oil recovery: Experimental study on chalk from South Arne field, North Sea. J. Pet. Sci. Eng. 2014, 122, 468–487. [Google Scholar] [CrossRef]
- El Hajj, H.; Odi, U.; Gupta, A. Carbonate reservoir interaction with supercritical carbon dioxide. In Proceedings of the IPTC 2013: International Petroleum Technology Conference, Beijing, China, 26–28 March 2013. IPTC 16561. [Google Scholar]
Figure 1.
Different layer structures, 1:1 layer (i.e., kaolinite) and 2:1 layer (i.e., smectite) [51].
Figure 1.
Different layer structures, 1:1 layer (i.e., kaolinite) and 2:1 layer (i.e., smectite) [51].

Figure 2.
Comparison of surface areas of clay and some other major minerals in rock measured using various adsorption mediums: (1) Methylene blue absorption [53]; (2) Adsorption of water [52]; (3) Extrapolation from N2 BET [13]; (4) N2 BET surface area [14]; (5) CO2 equivalent surface area [14].


Figure 6.
Relationship between absorption gas content and clay content.


Figure 8.
Relationship between yield strength and water content of shale samples [77].
Figure 8.
Relationship between yield strength and water content of shale samples [77].

Figure 9.
Relationship between Young’s modulus and volumetric swelling strain [78].
Figure 9.
Relationship between Young’s modulus and volumetric swelling strain [78].

Figure 10.
CO2 thermodynamic behaviour chart [84].
Figure 10.
CO2 thermodynamic behaviour chart [84].

Figure 11.
Isochoric process of heated CO2 [85].
Figure 11.
Isochoric process of heated CO2 [85].

Figure 12.
Viscosity change with temperature and pressure [88].
Figure 12.
Viscosity change with temperature and pressure [88].

Figure 13.
Pore pressure distribution around crack tip.

Figure 14.
Comparison of drilling rates between super-critical CO2 and water [91].
Figure 14.
Comparison of drilling rates between super-critical CO2 and water [91].

Figure 15.
Excess adsorption of different gases on New Albany shale [37].
Figure 15.
Excess adsorption of different gases on New Albany shale [37].


Figure 17.
Relationship between air permeability and water content.

Figure 18.
Comparison of oil extraction using water flooding and CO2 injection from the Tor and Ekofisk formations [56].
Figure 18.
Comparison of oil extraction using water flooding and CO2 injection from the Tor and Ekofisk formations [56].


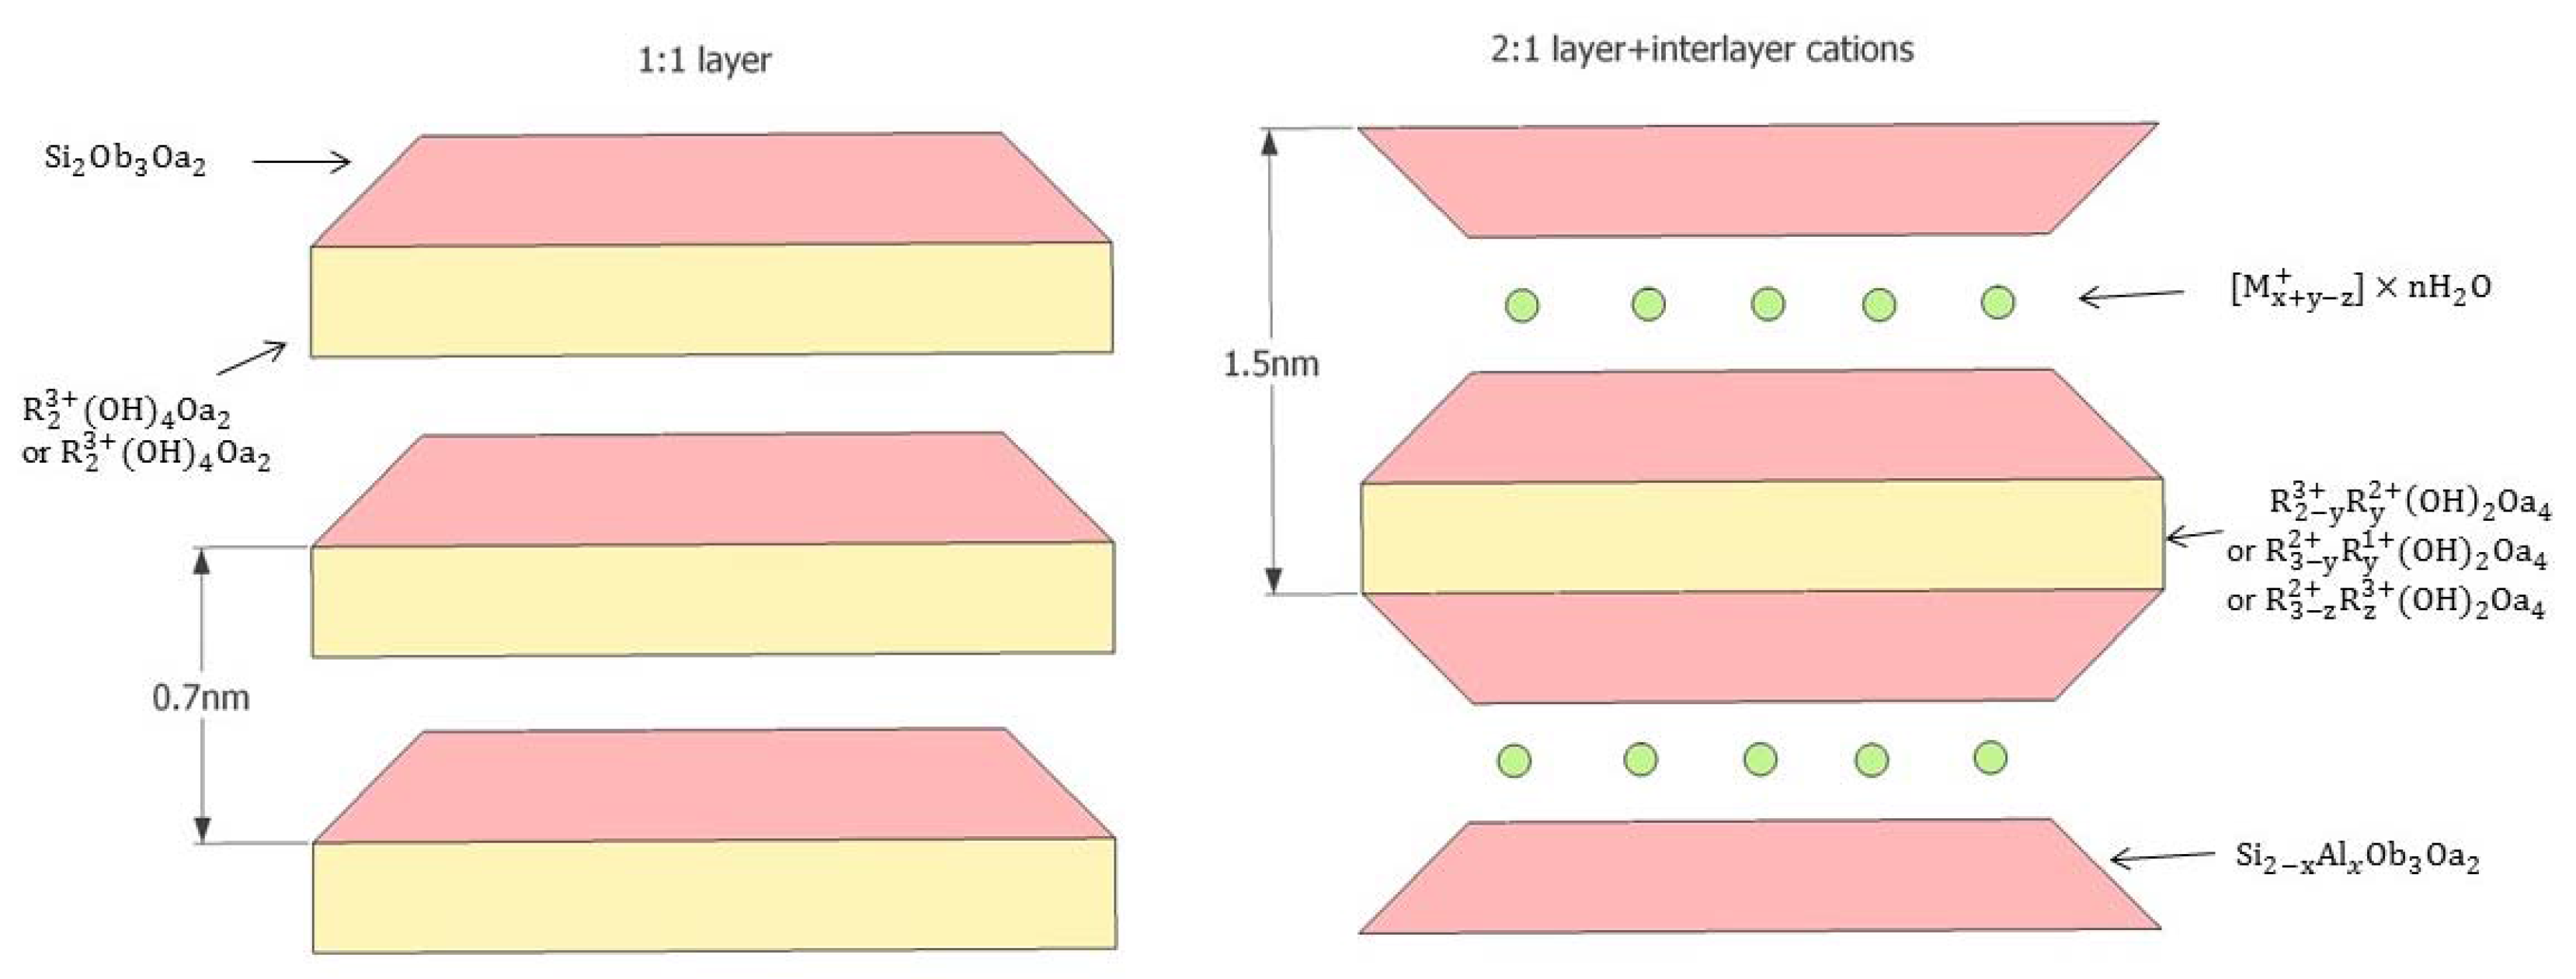
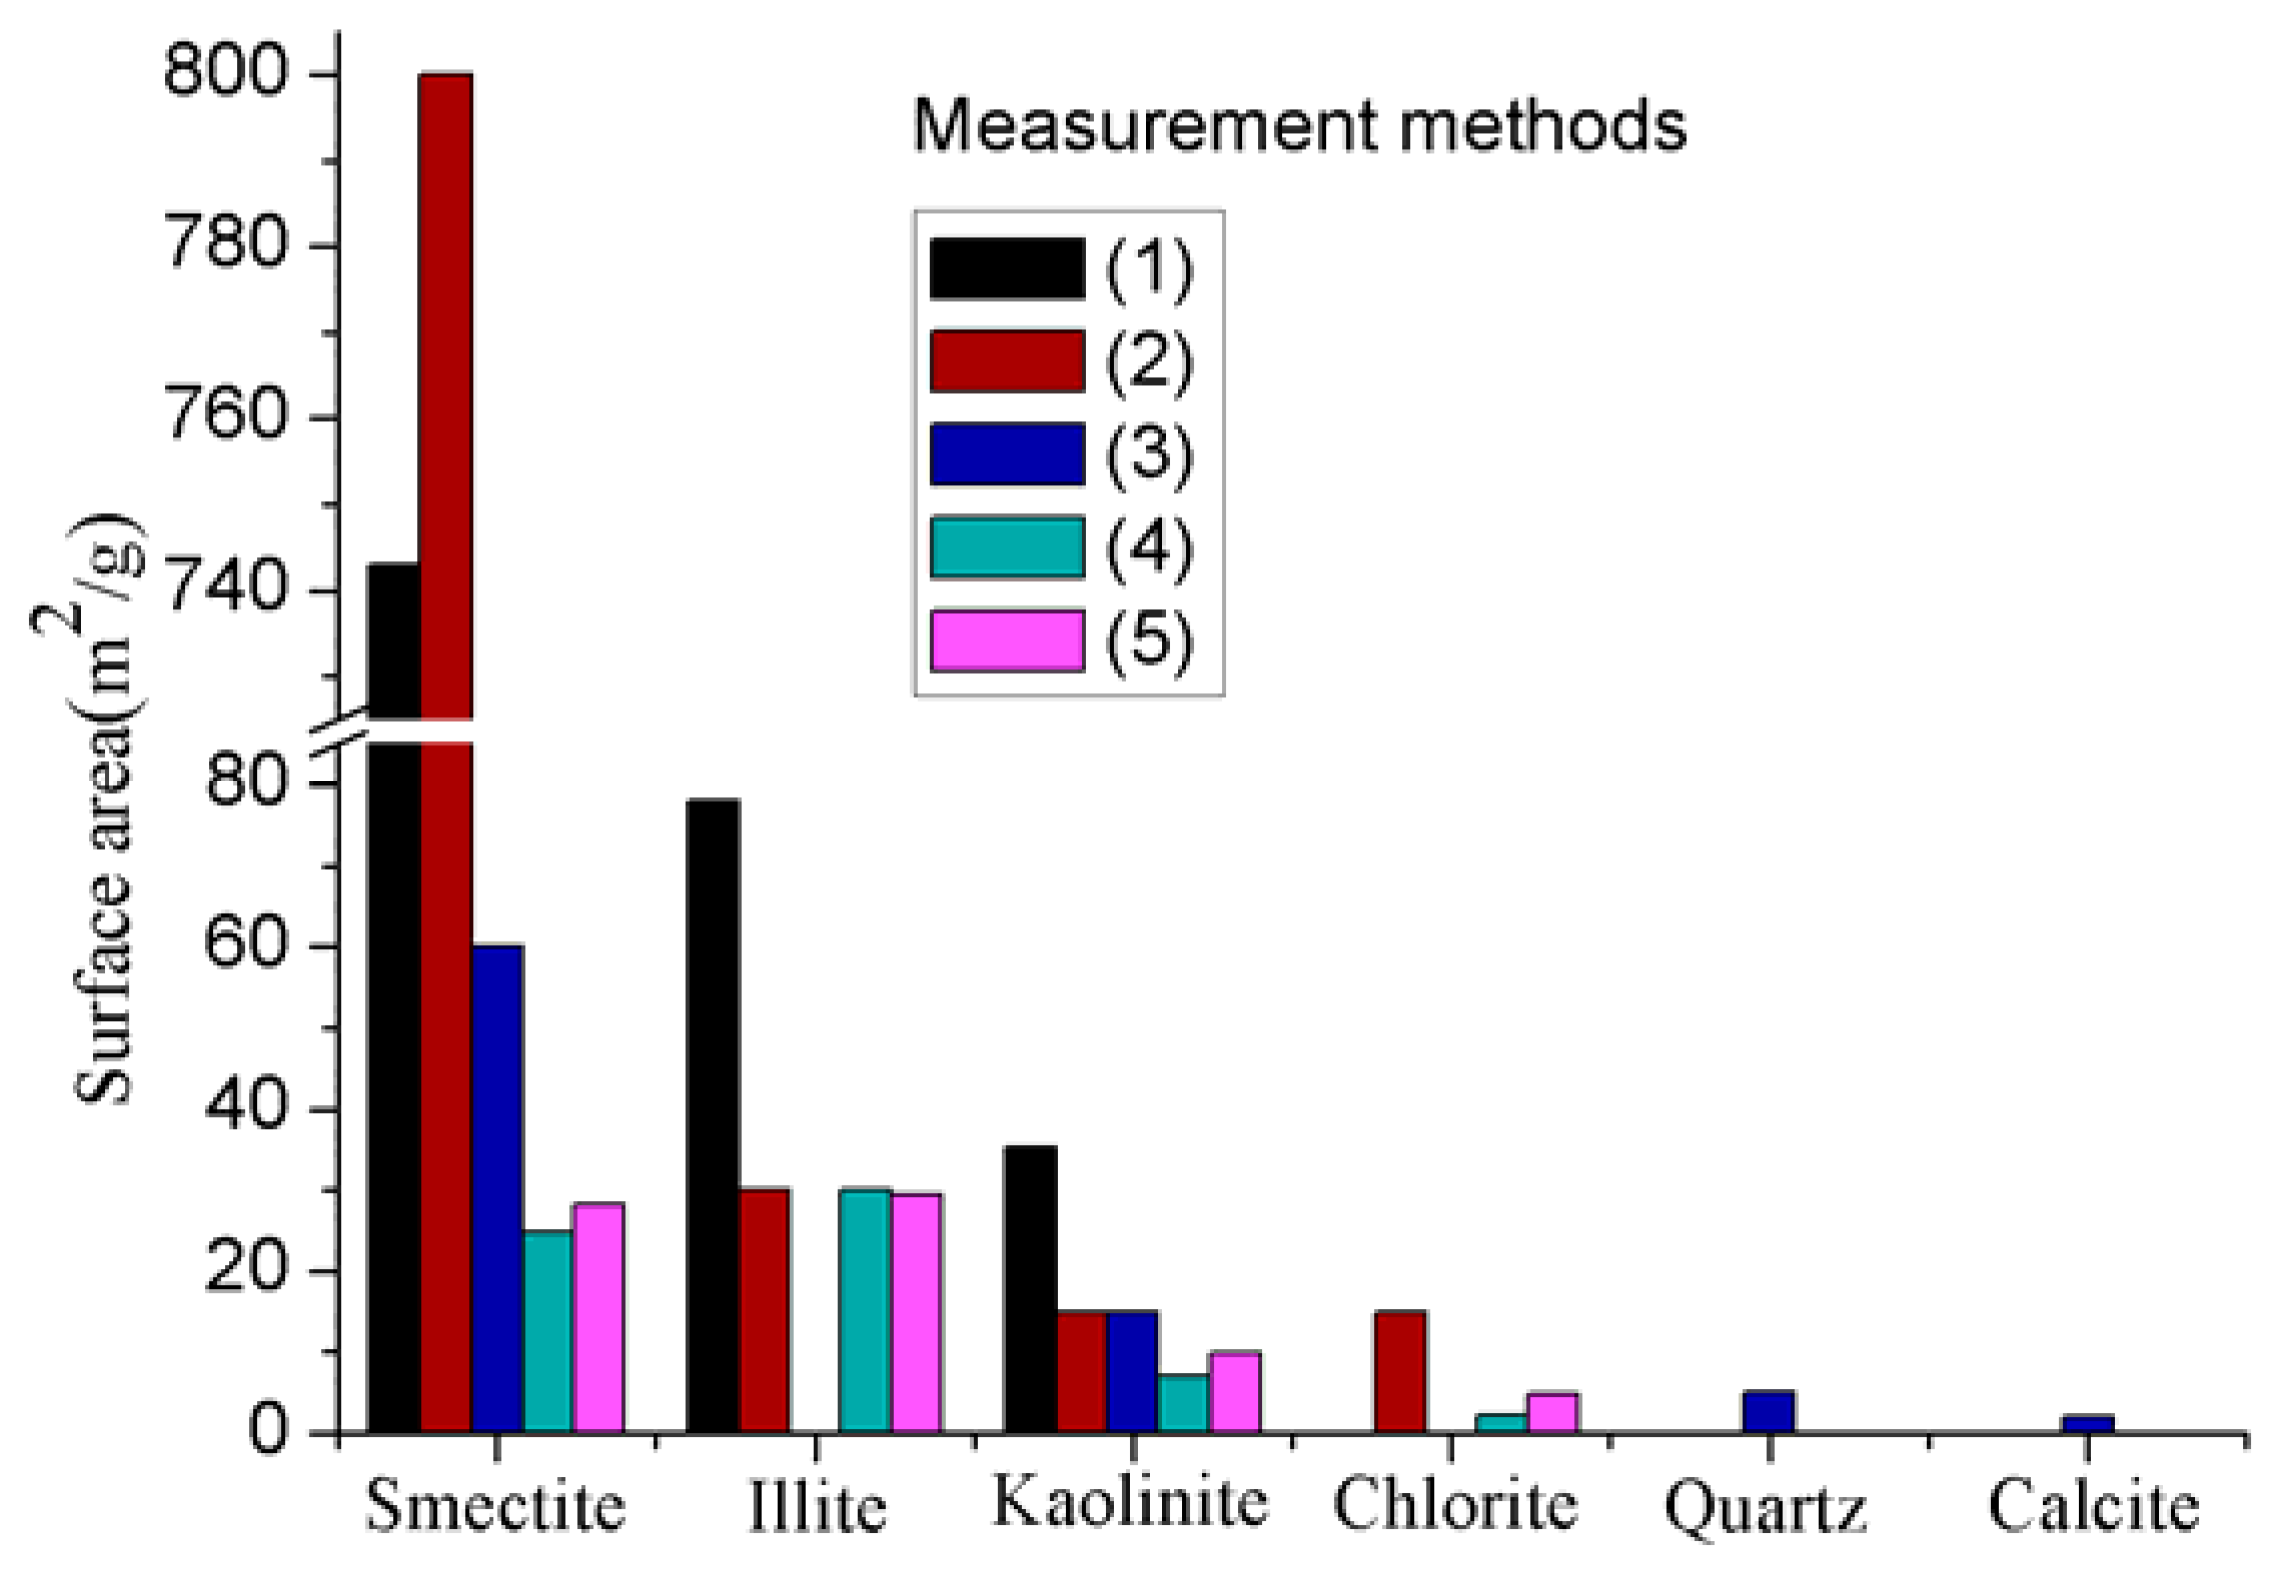
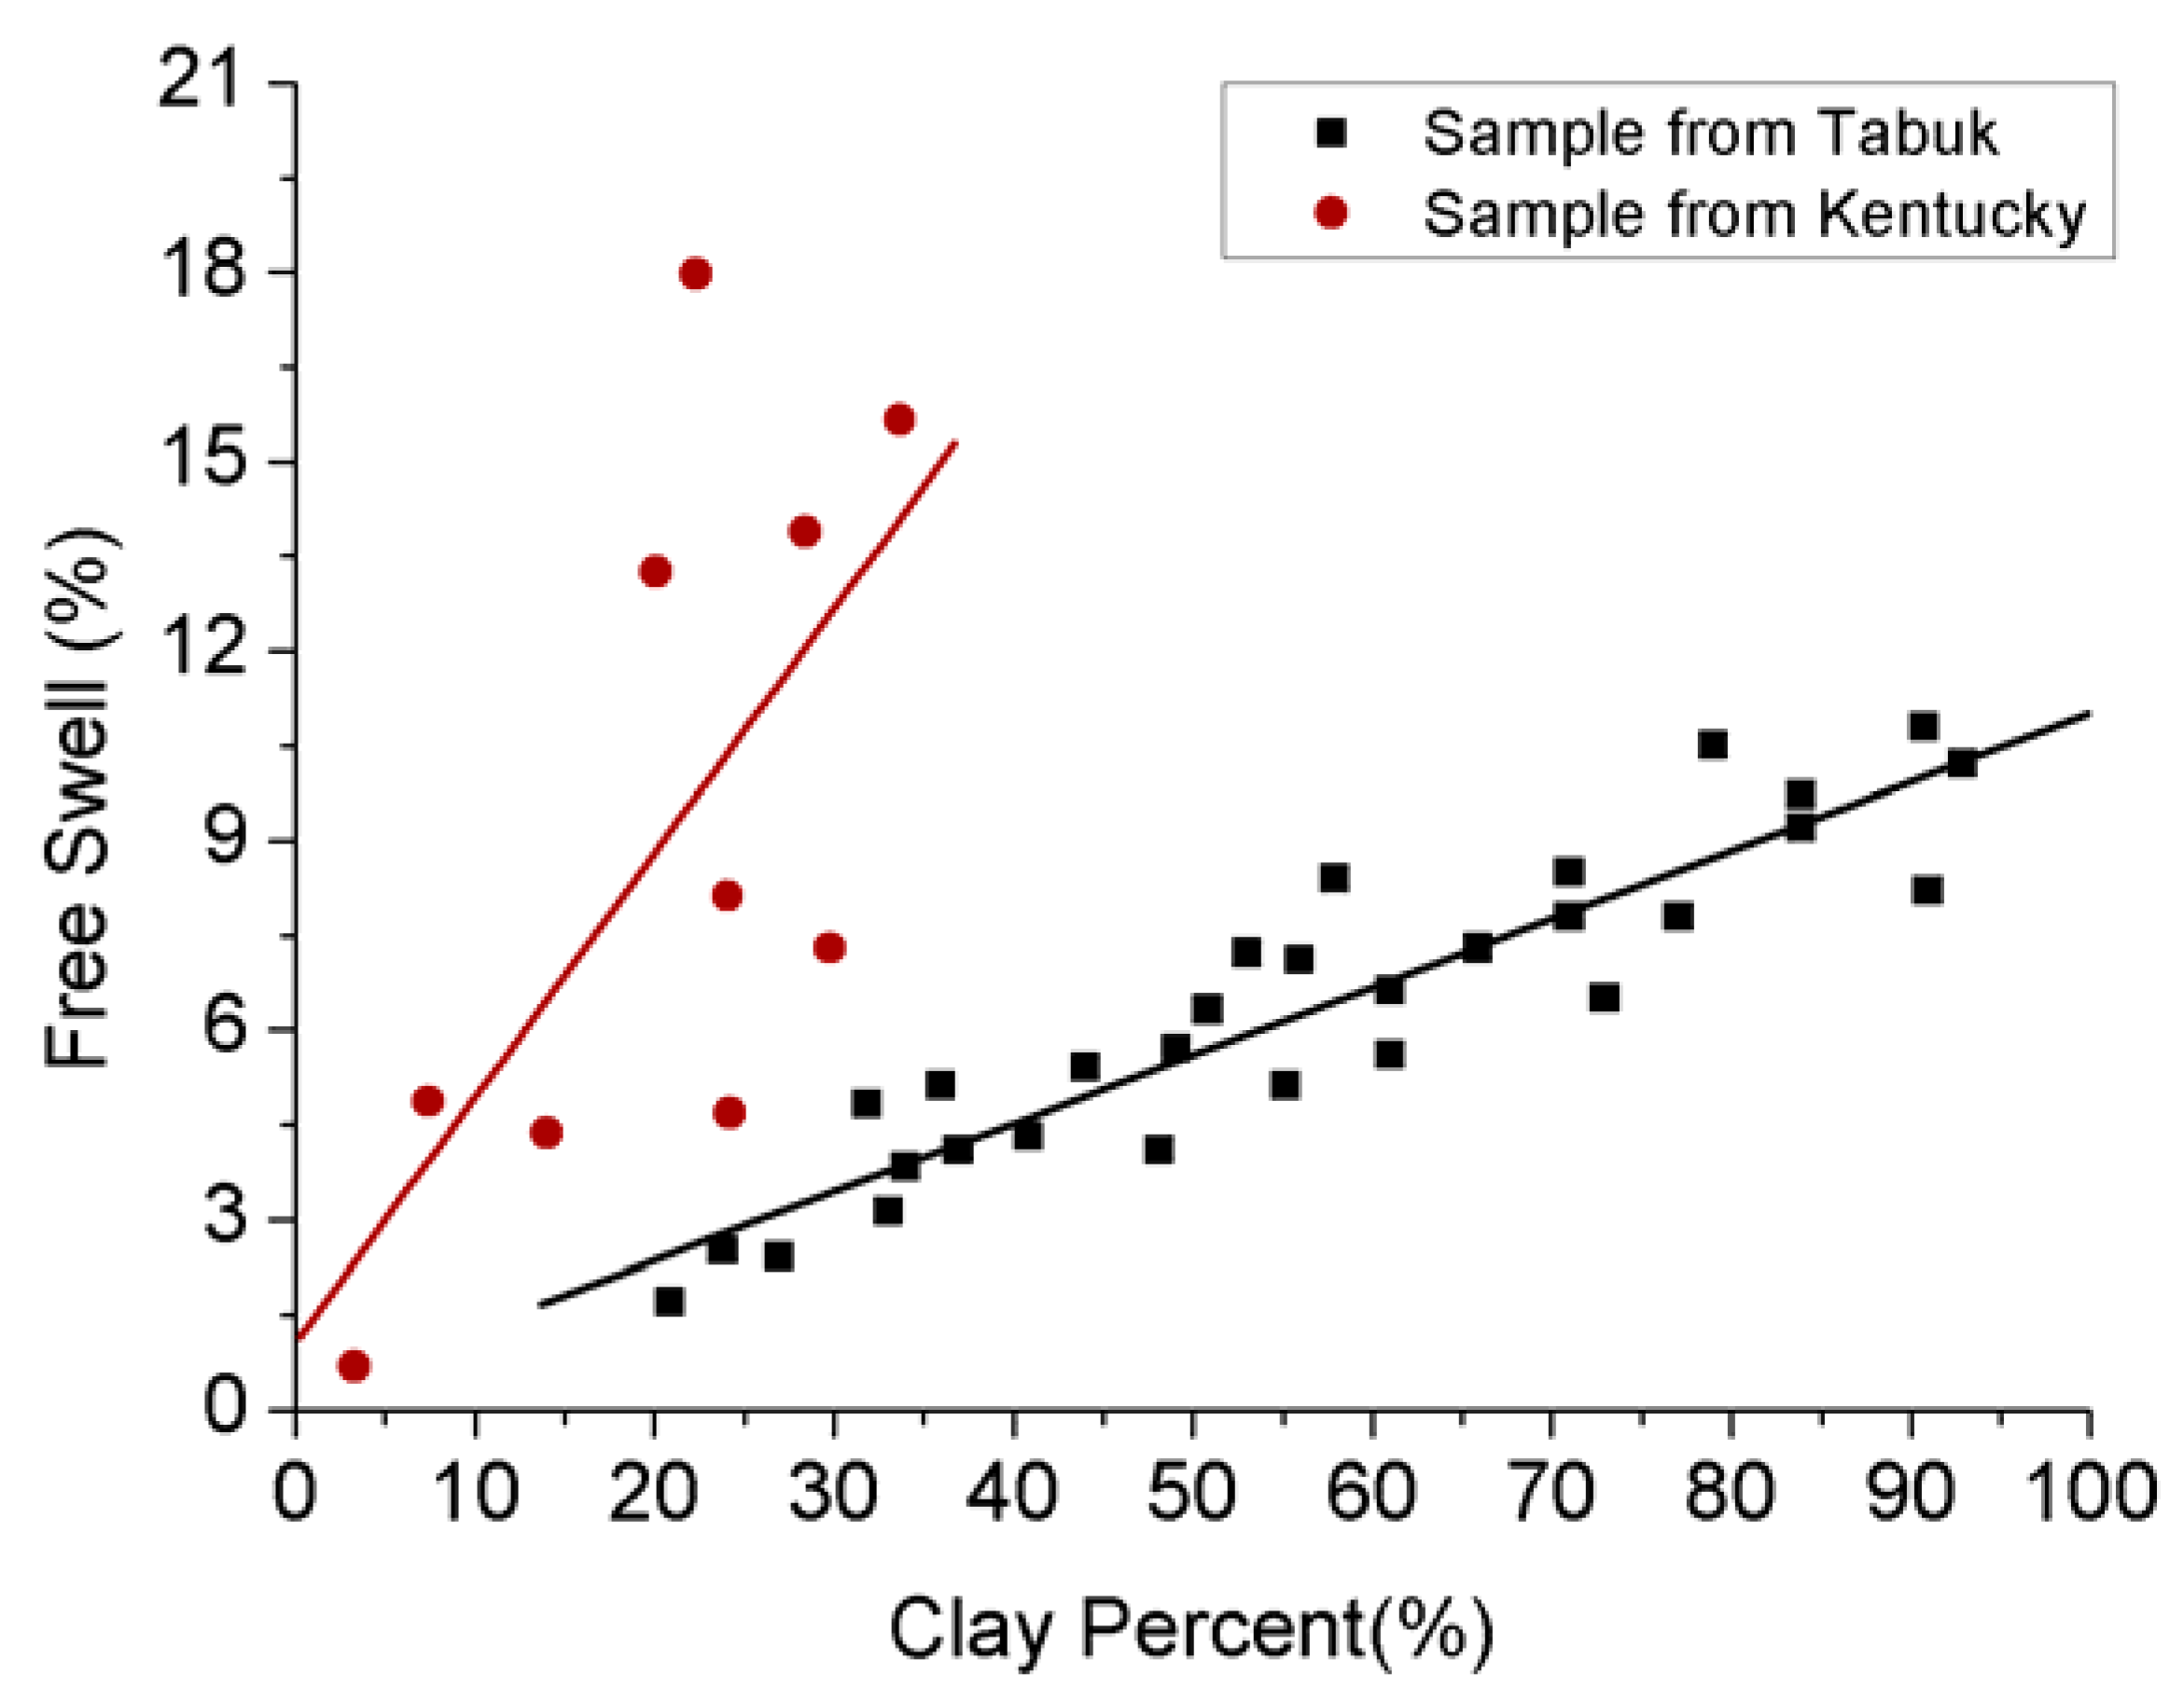
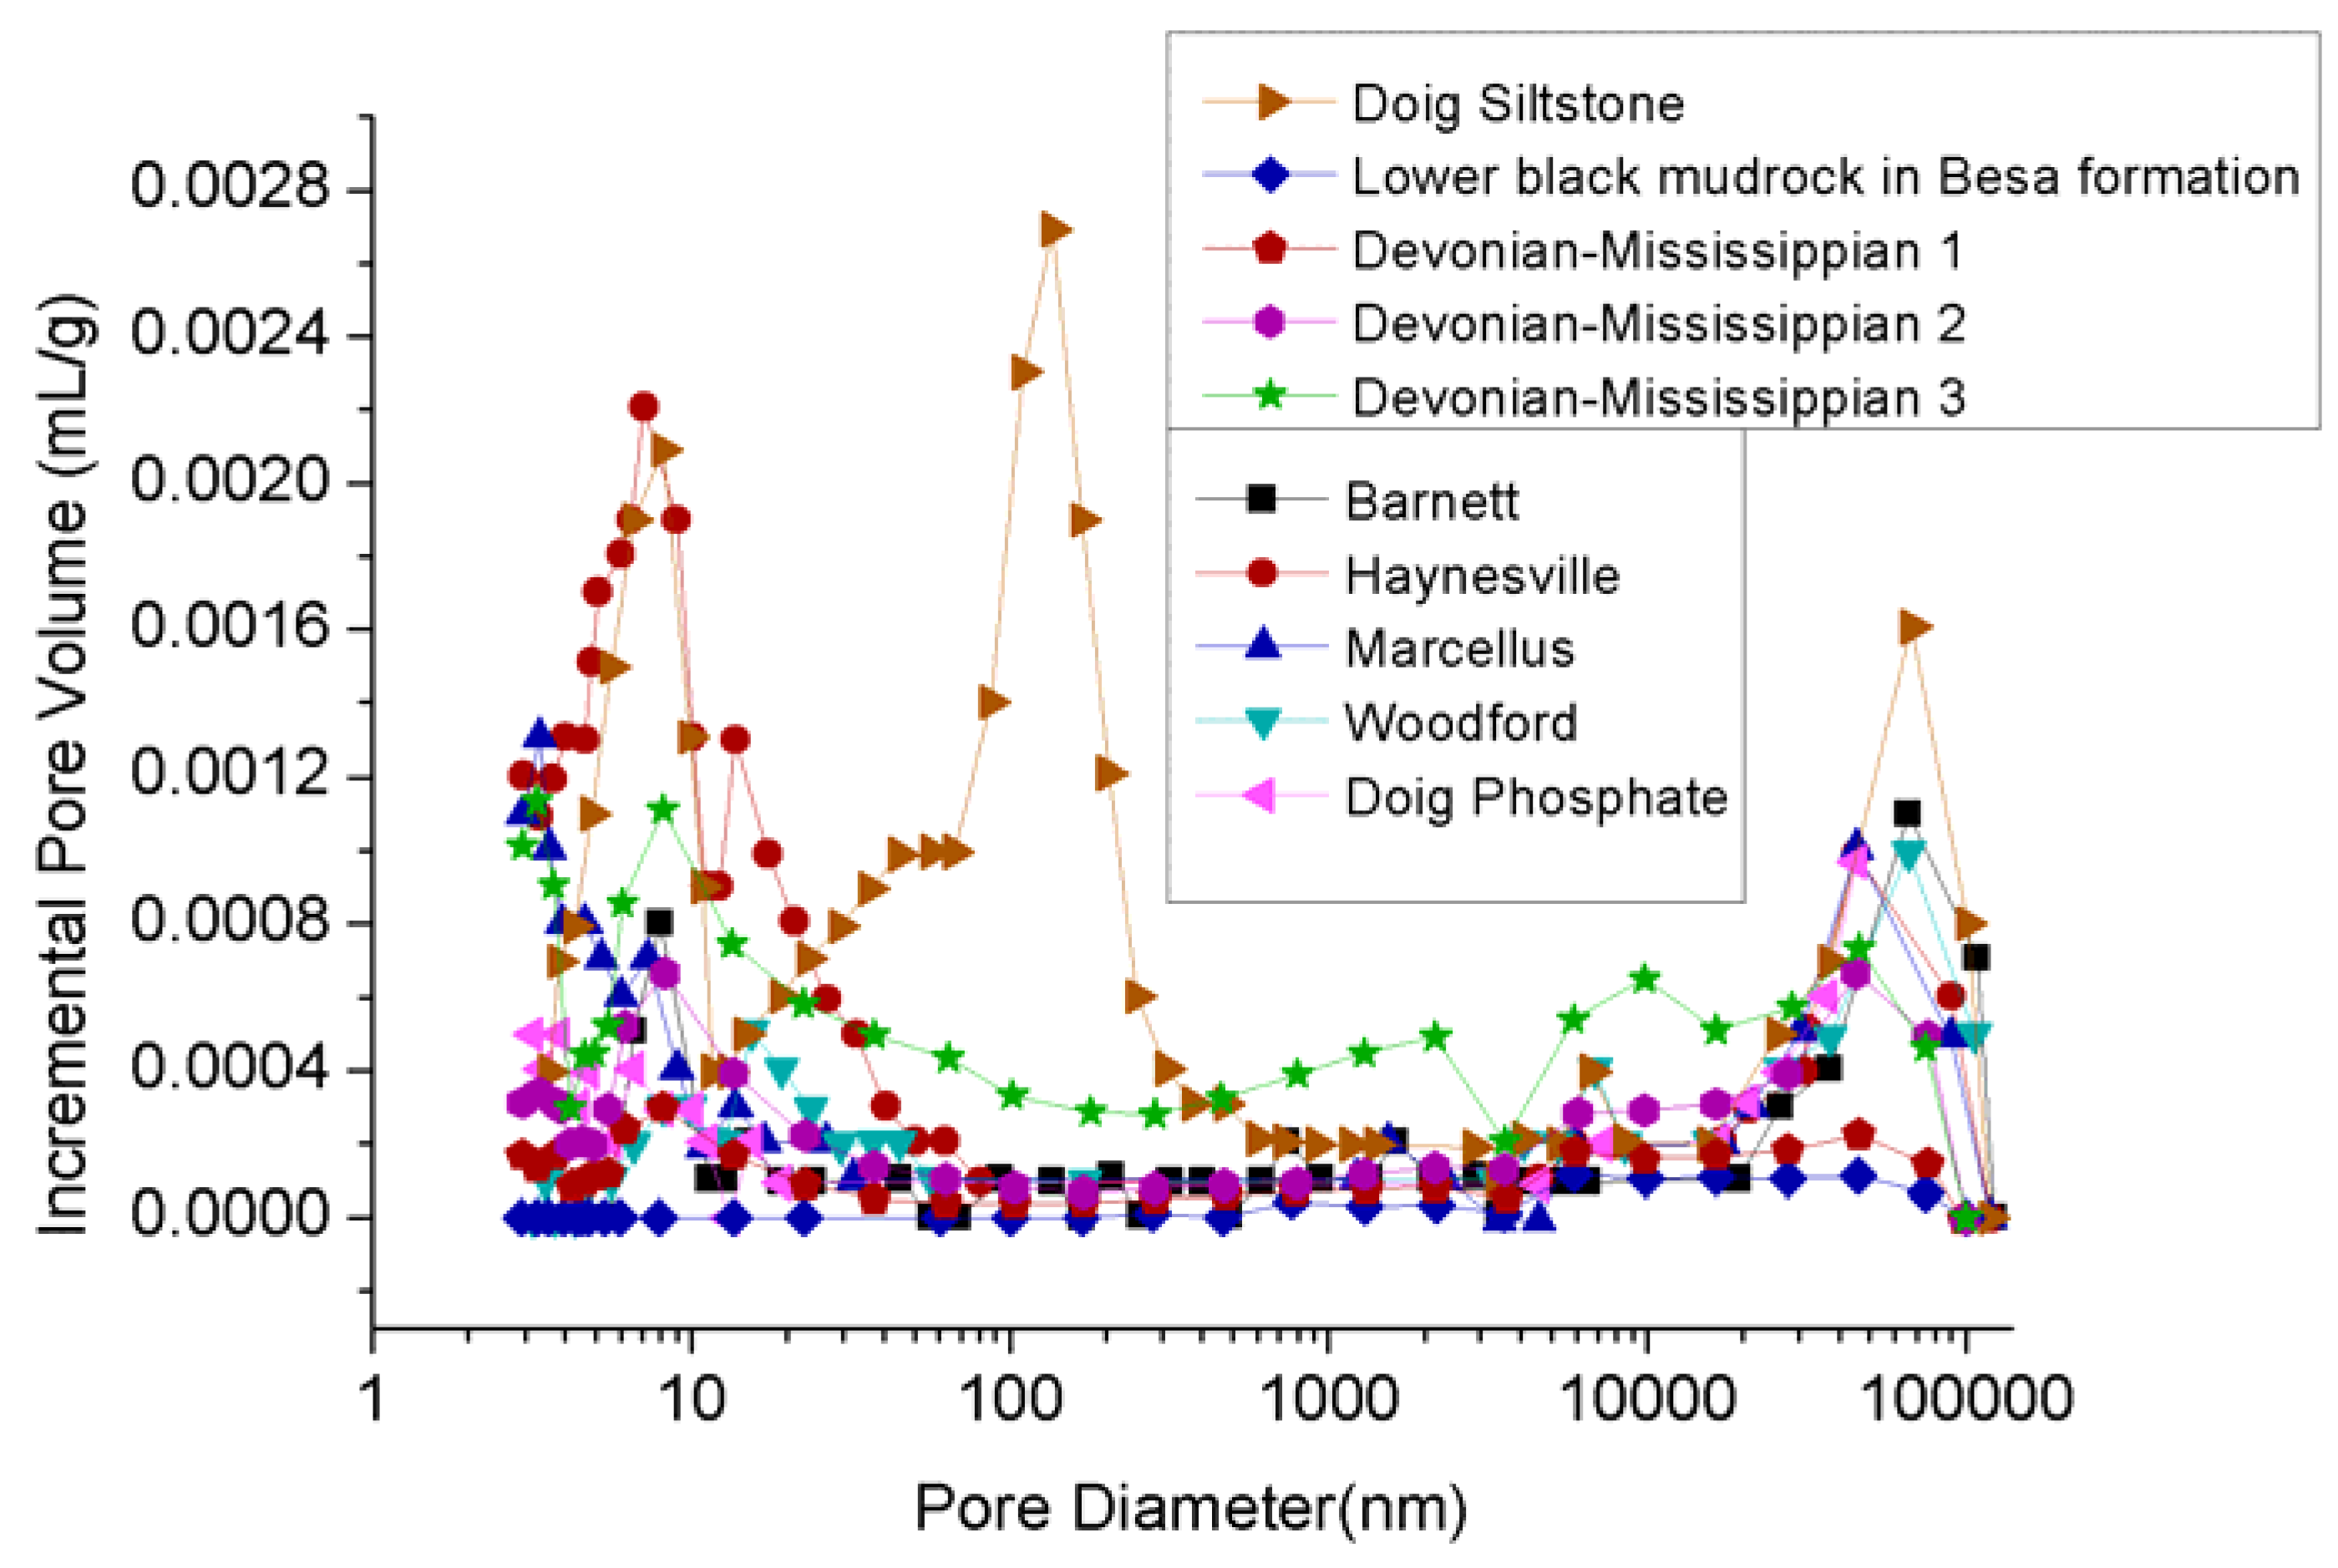
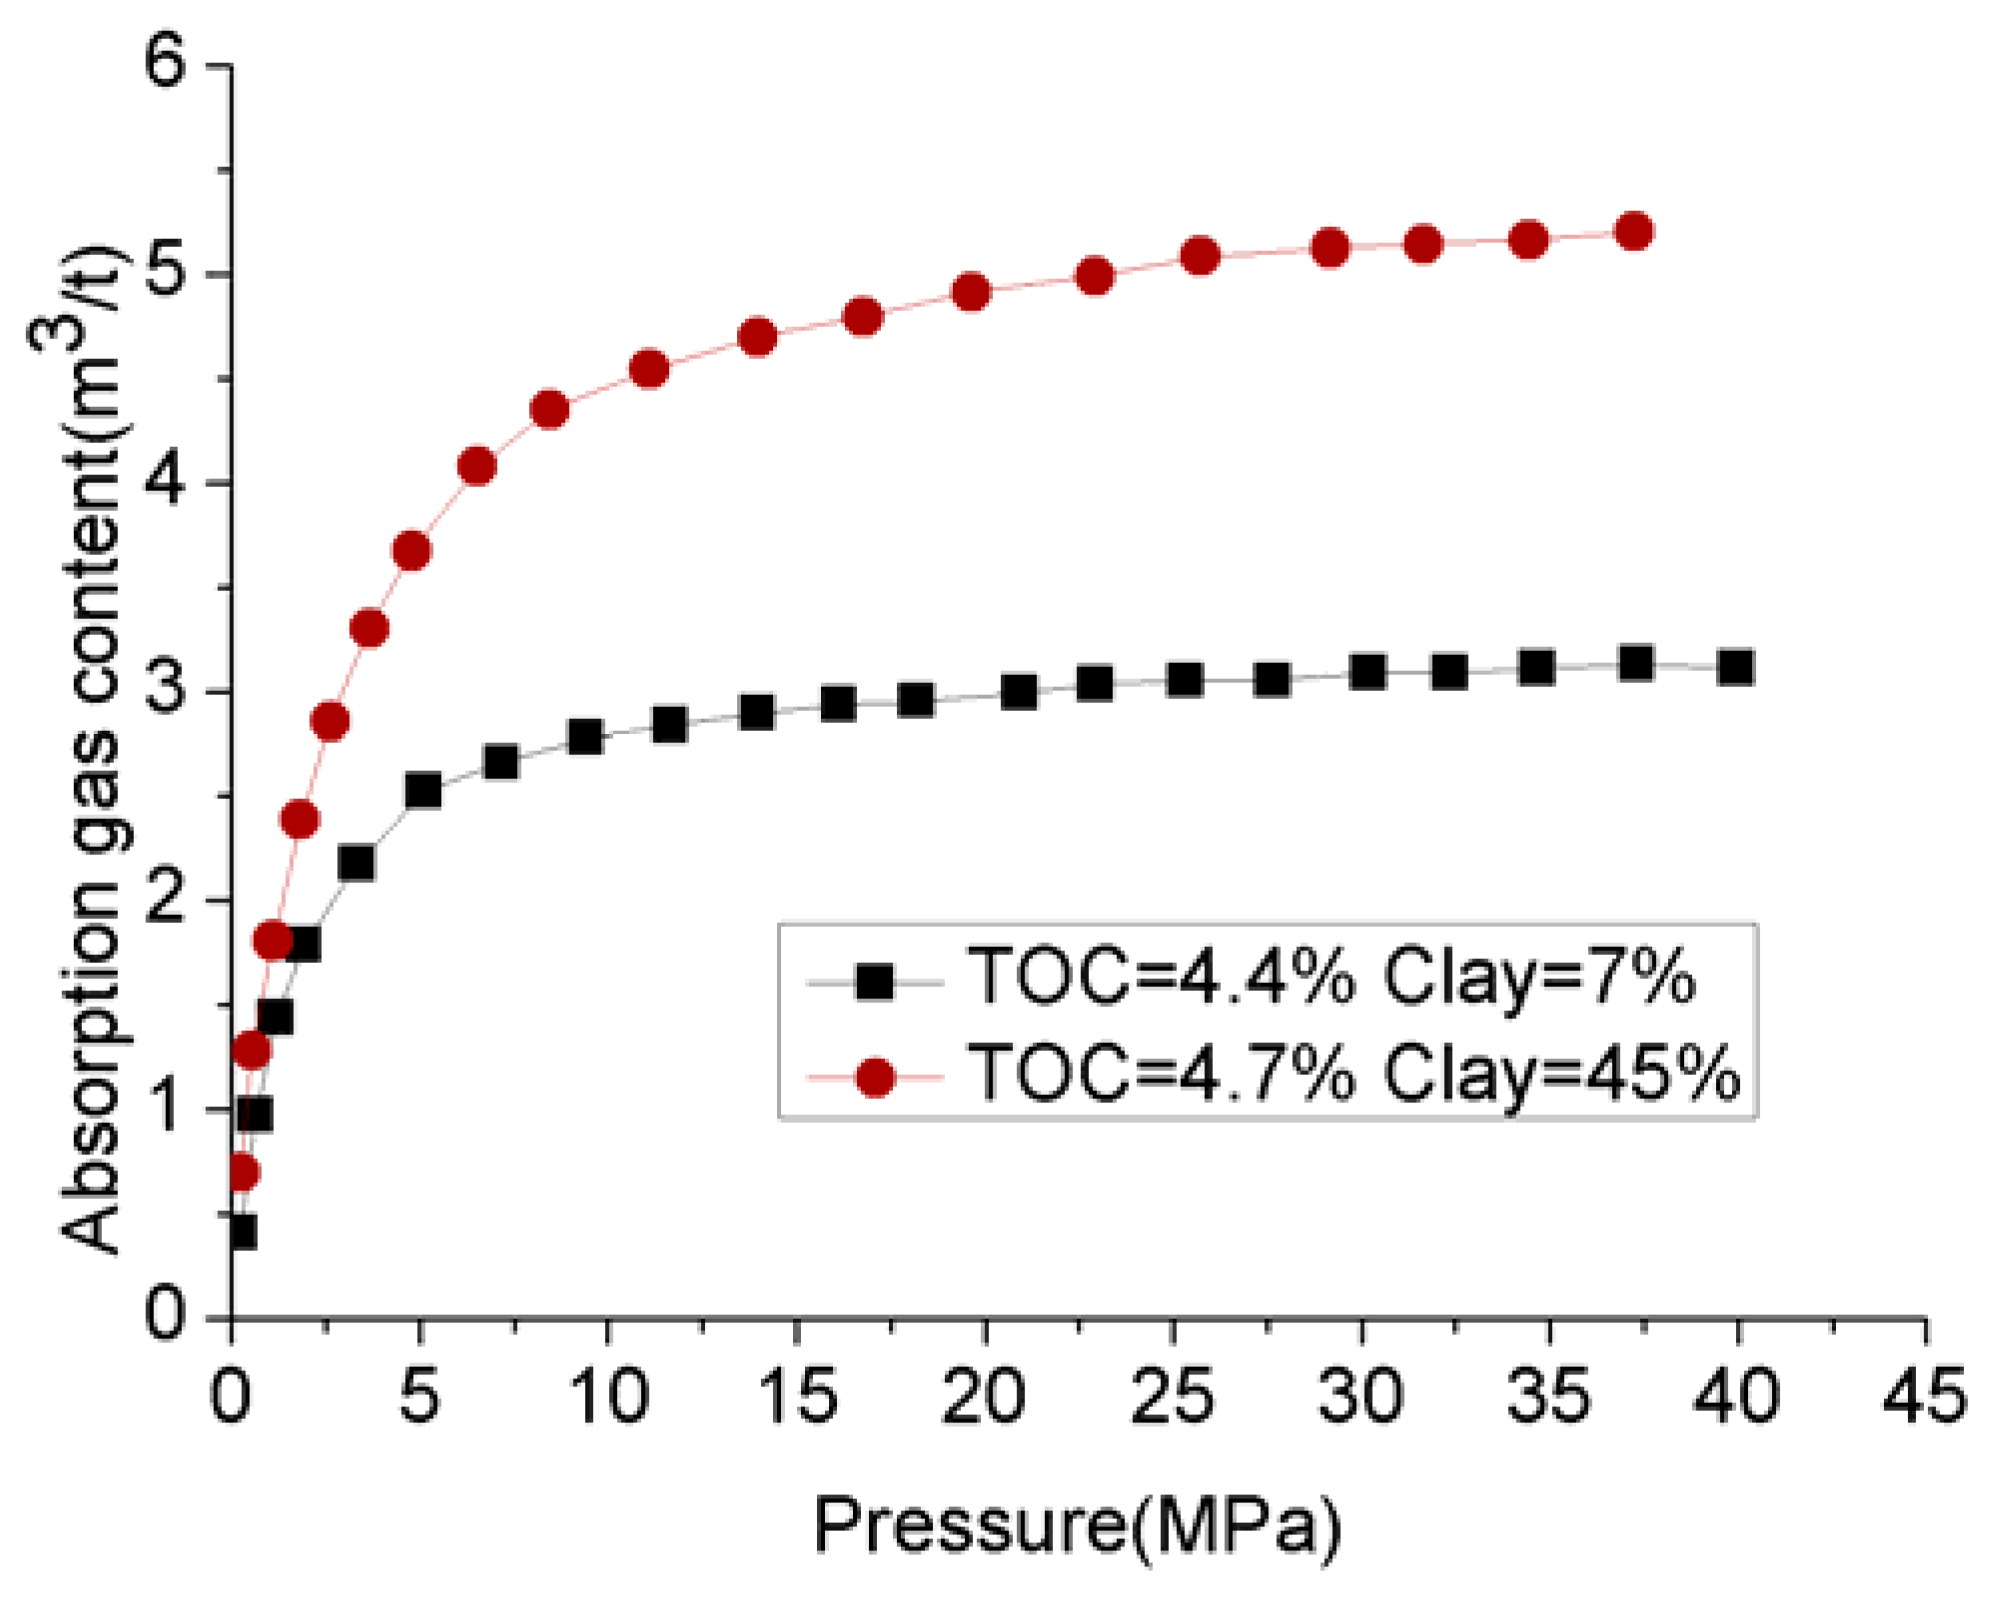
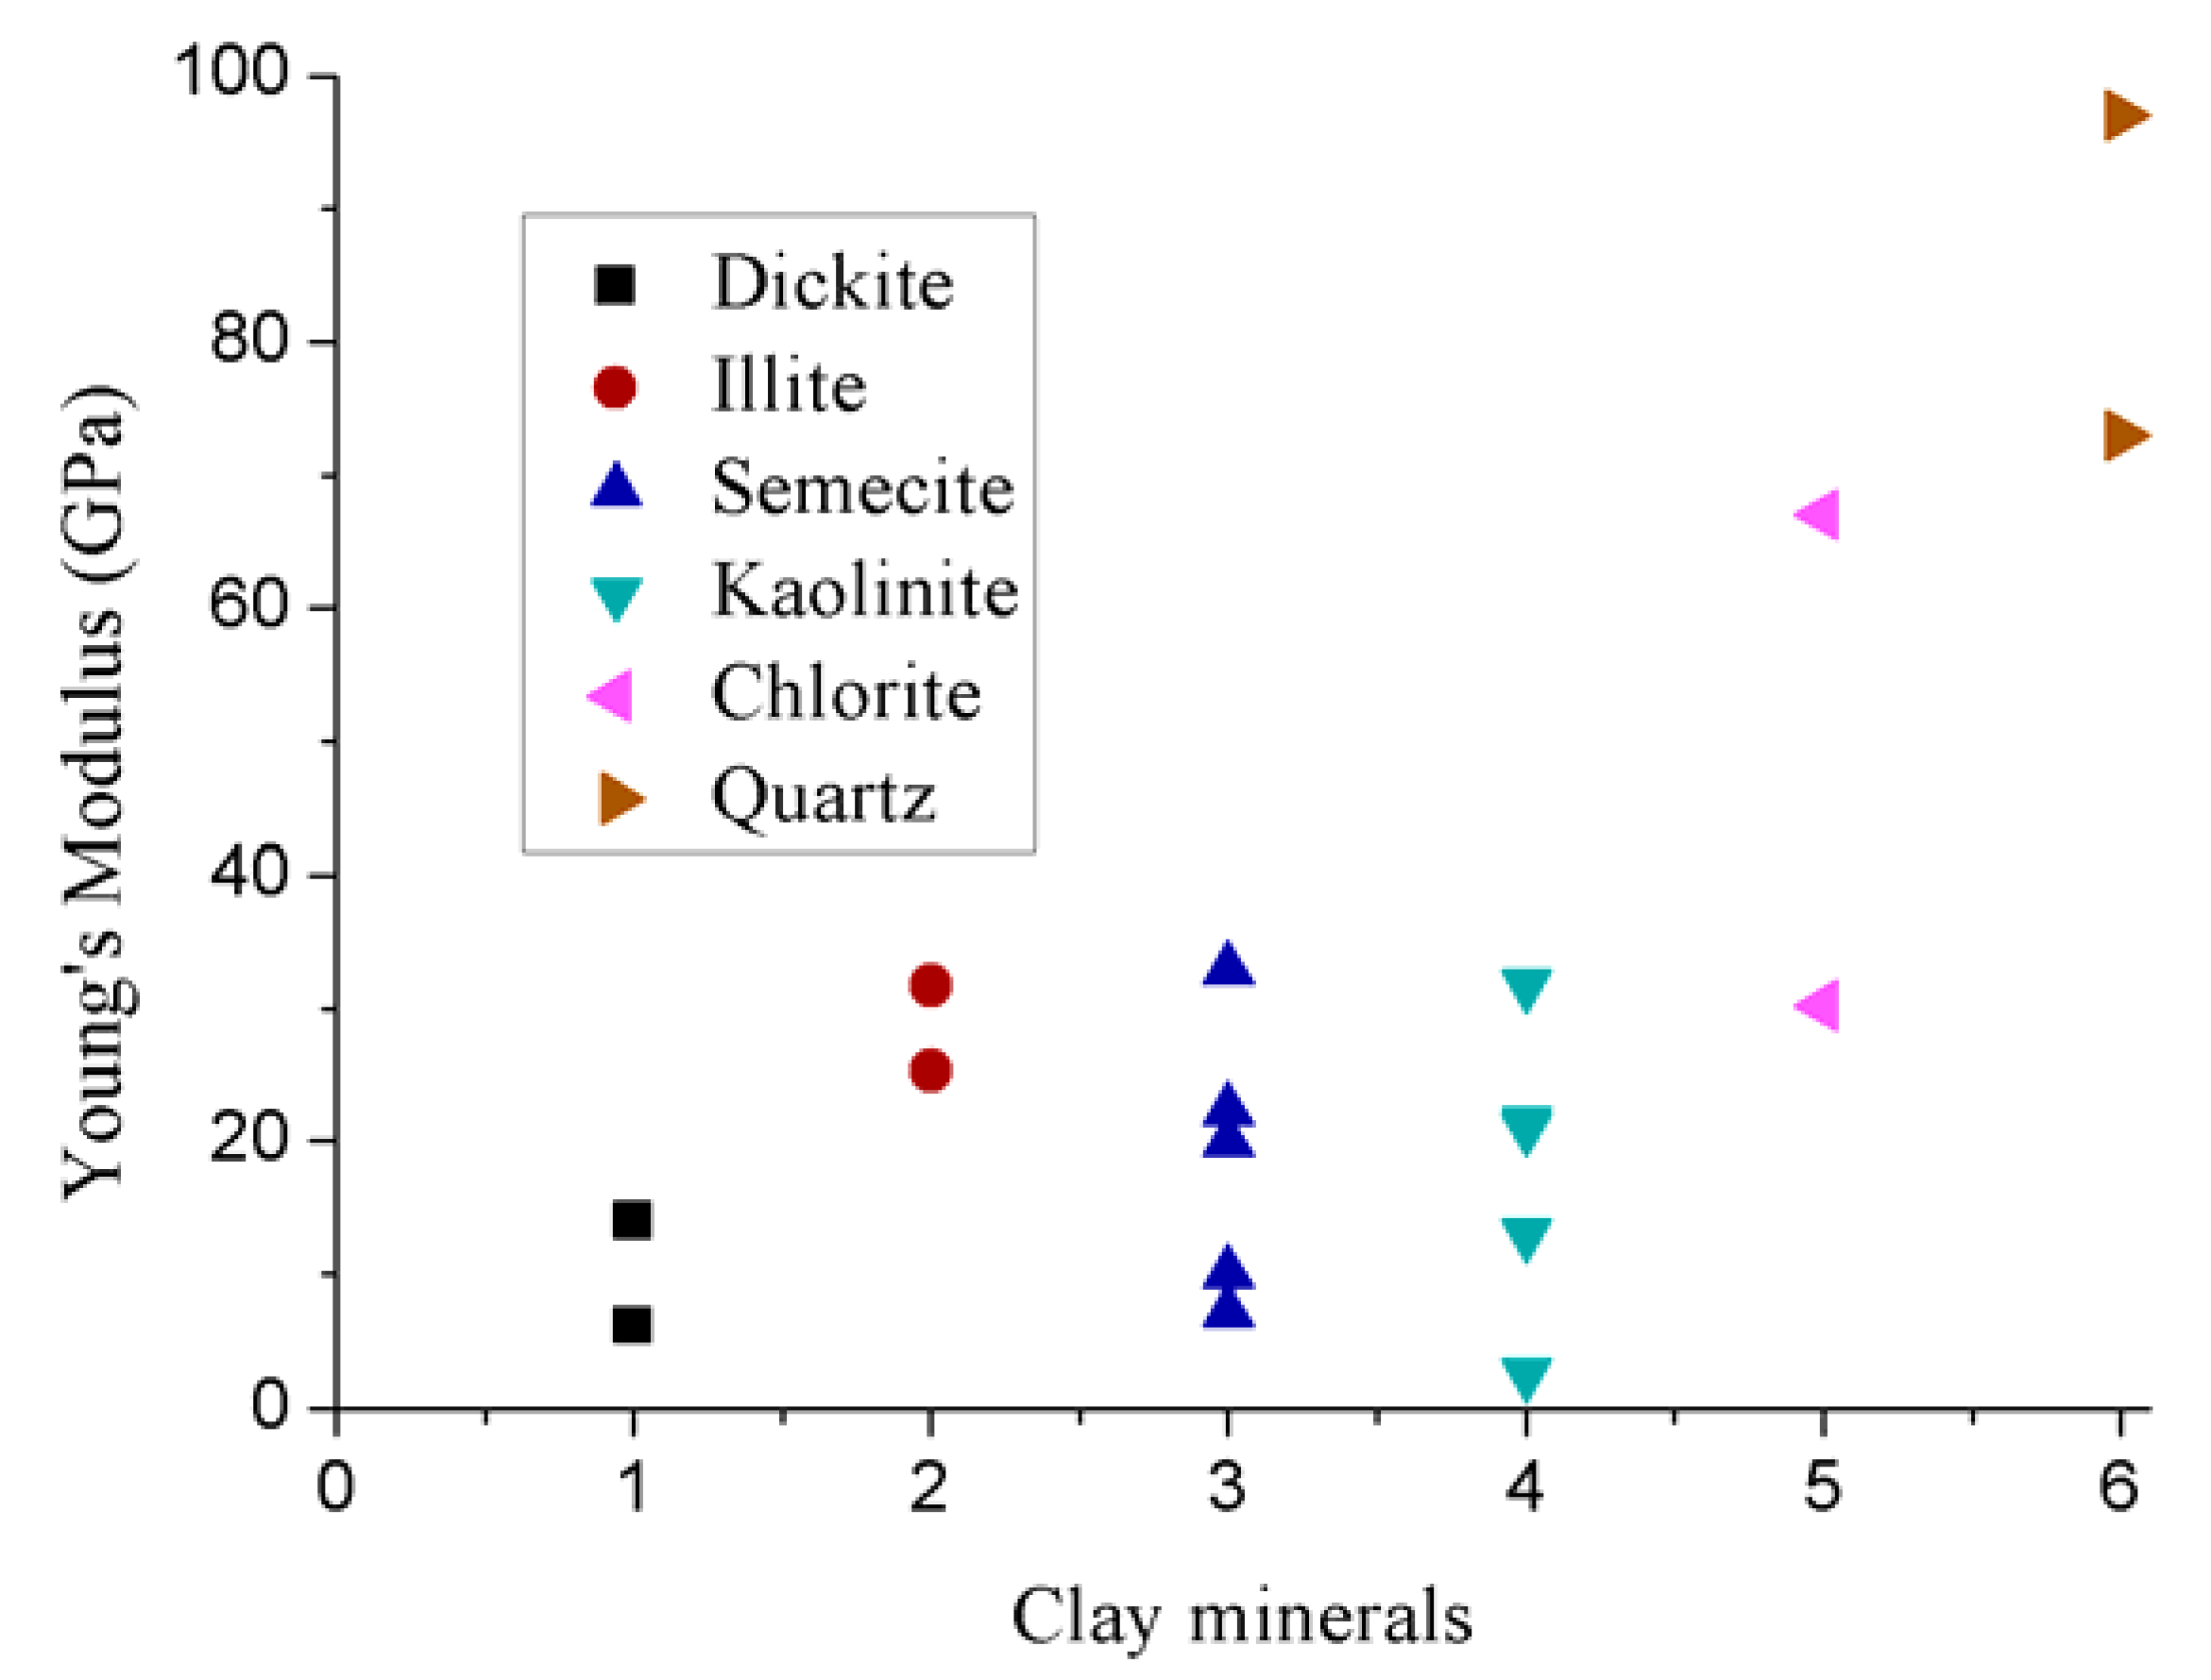
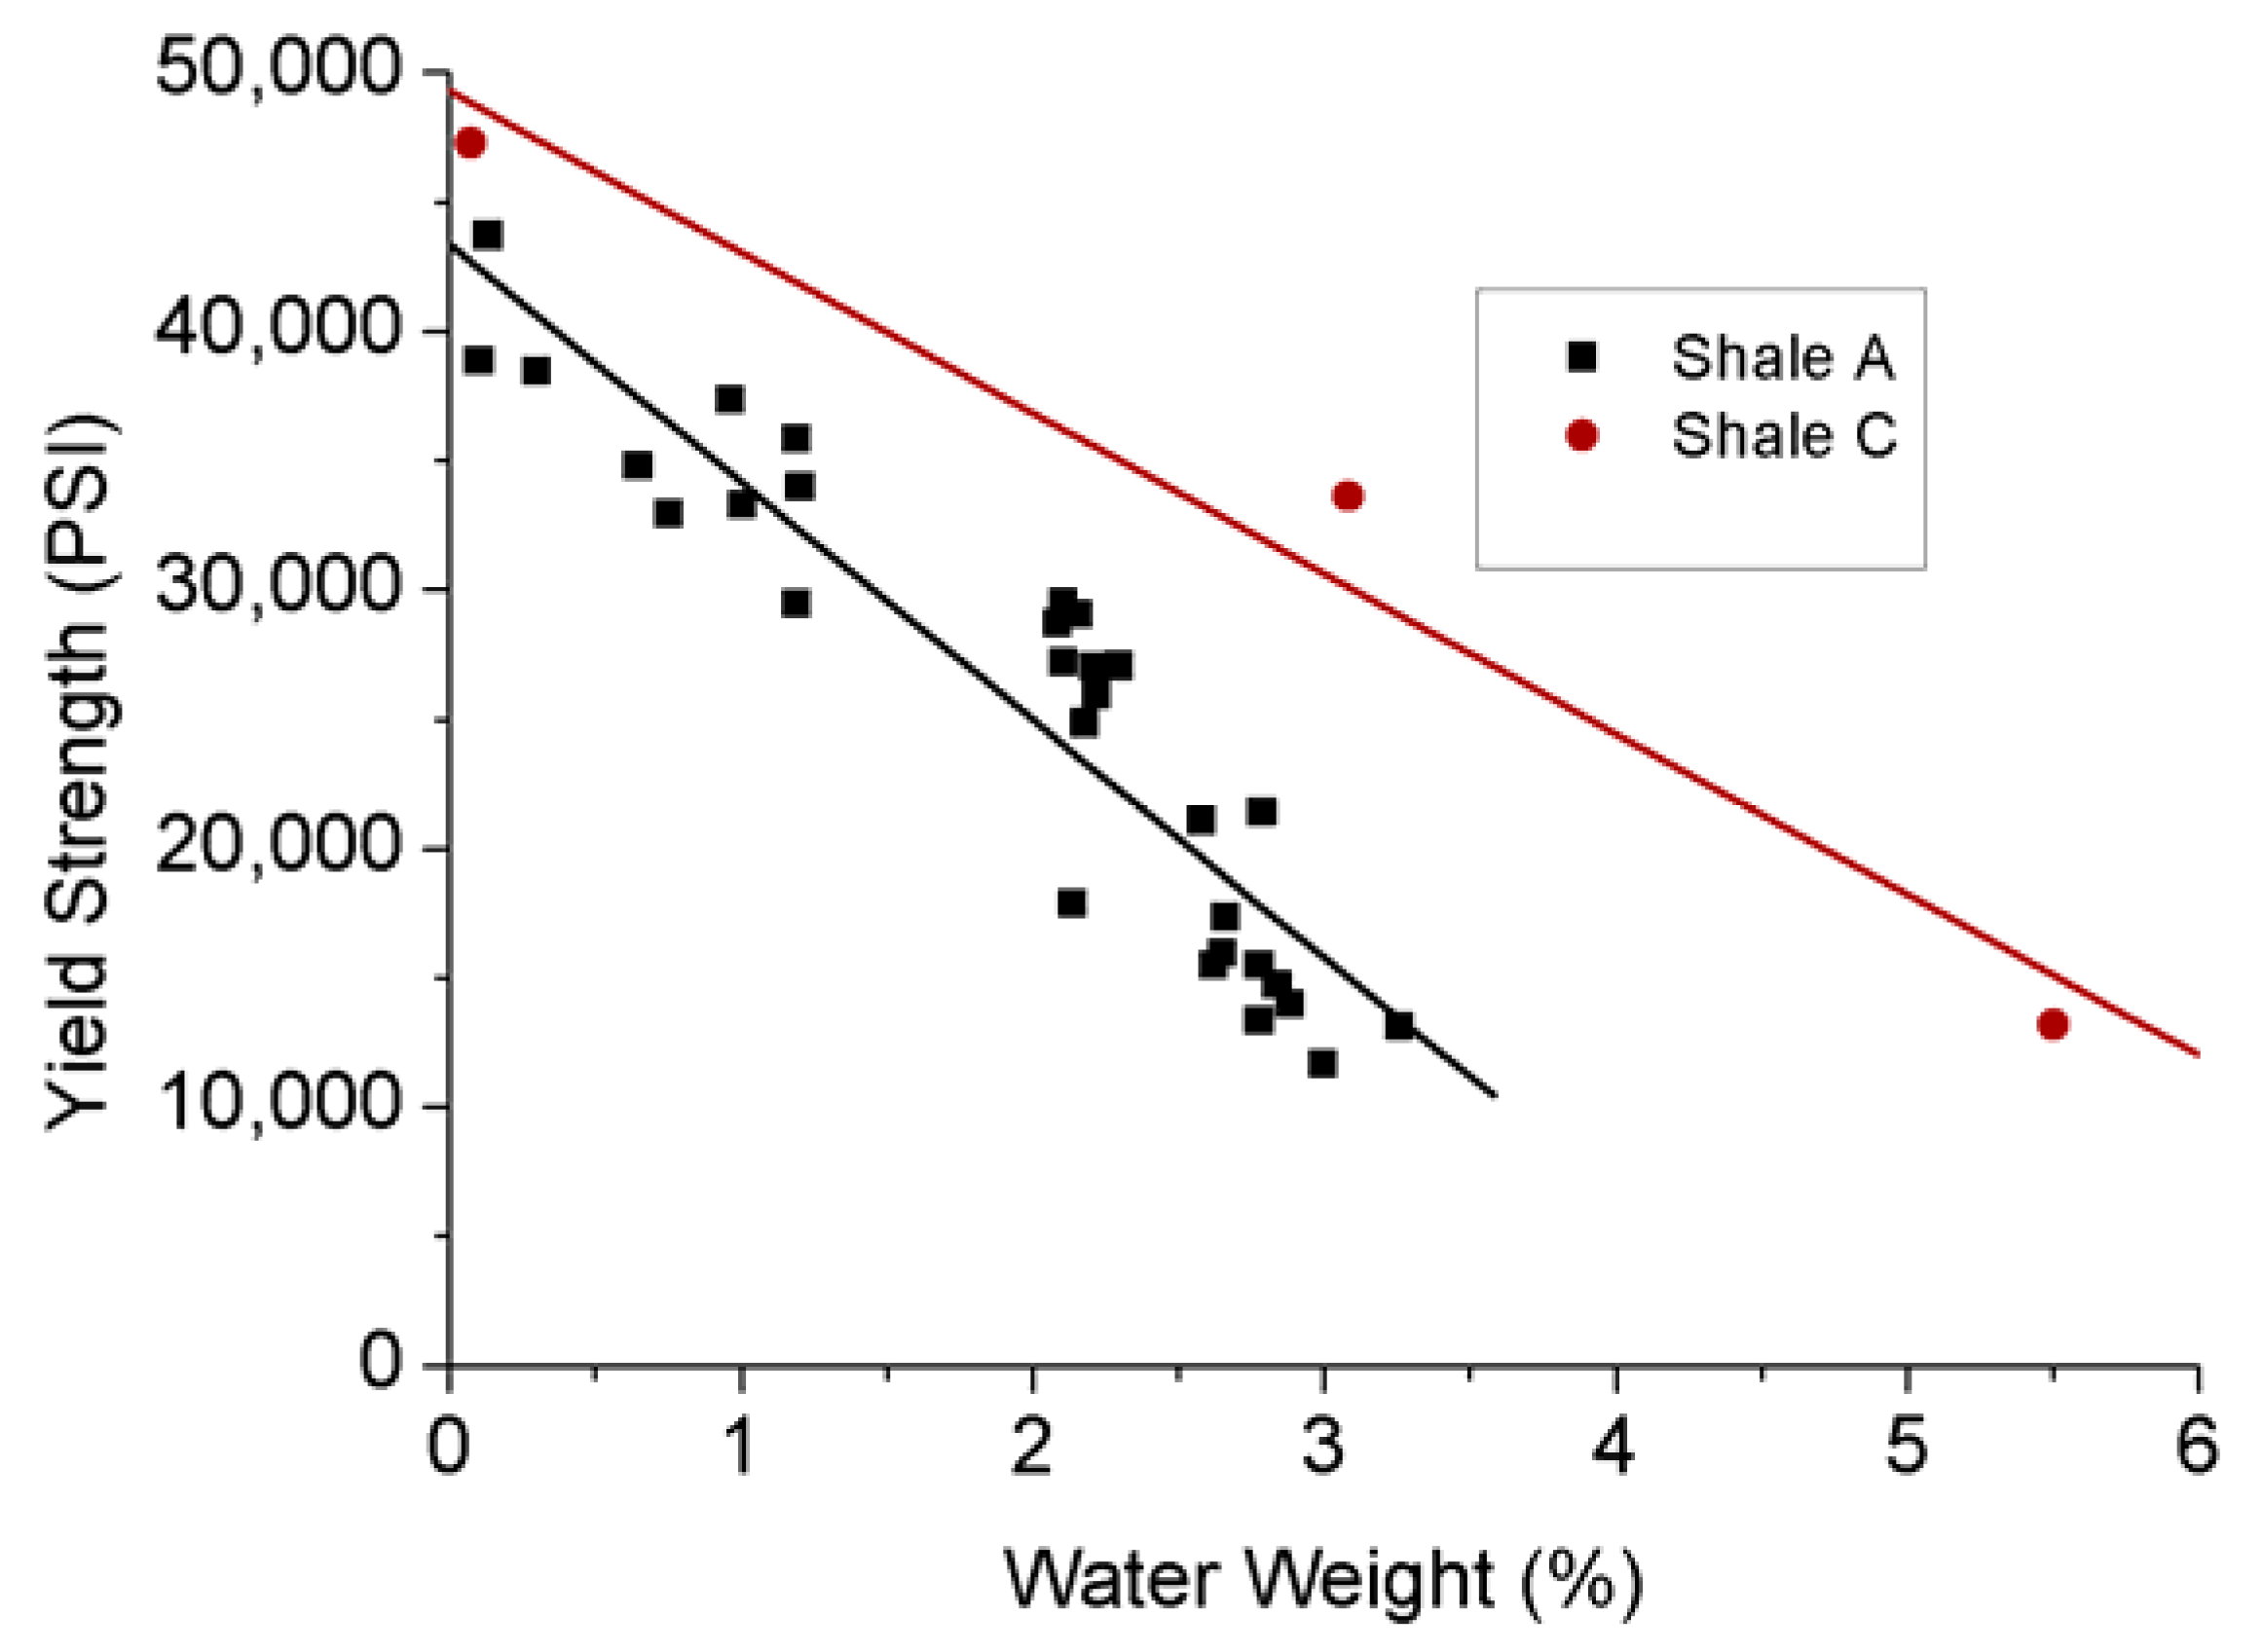
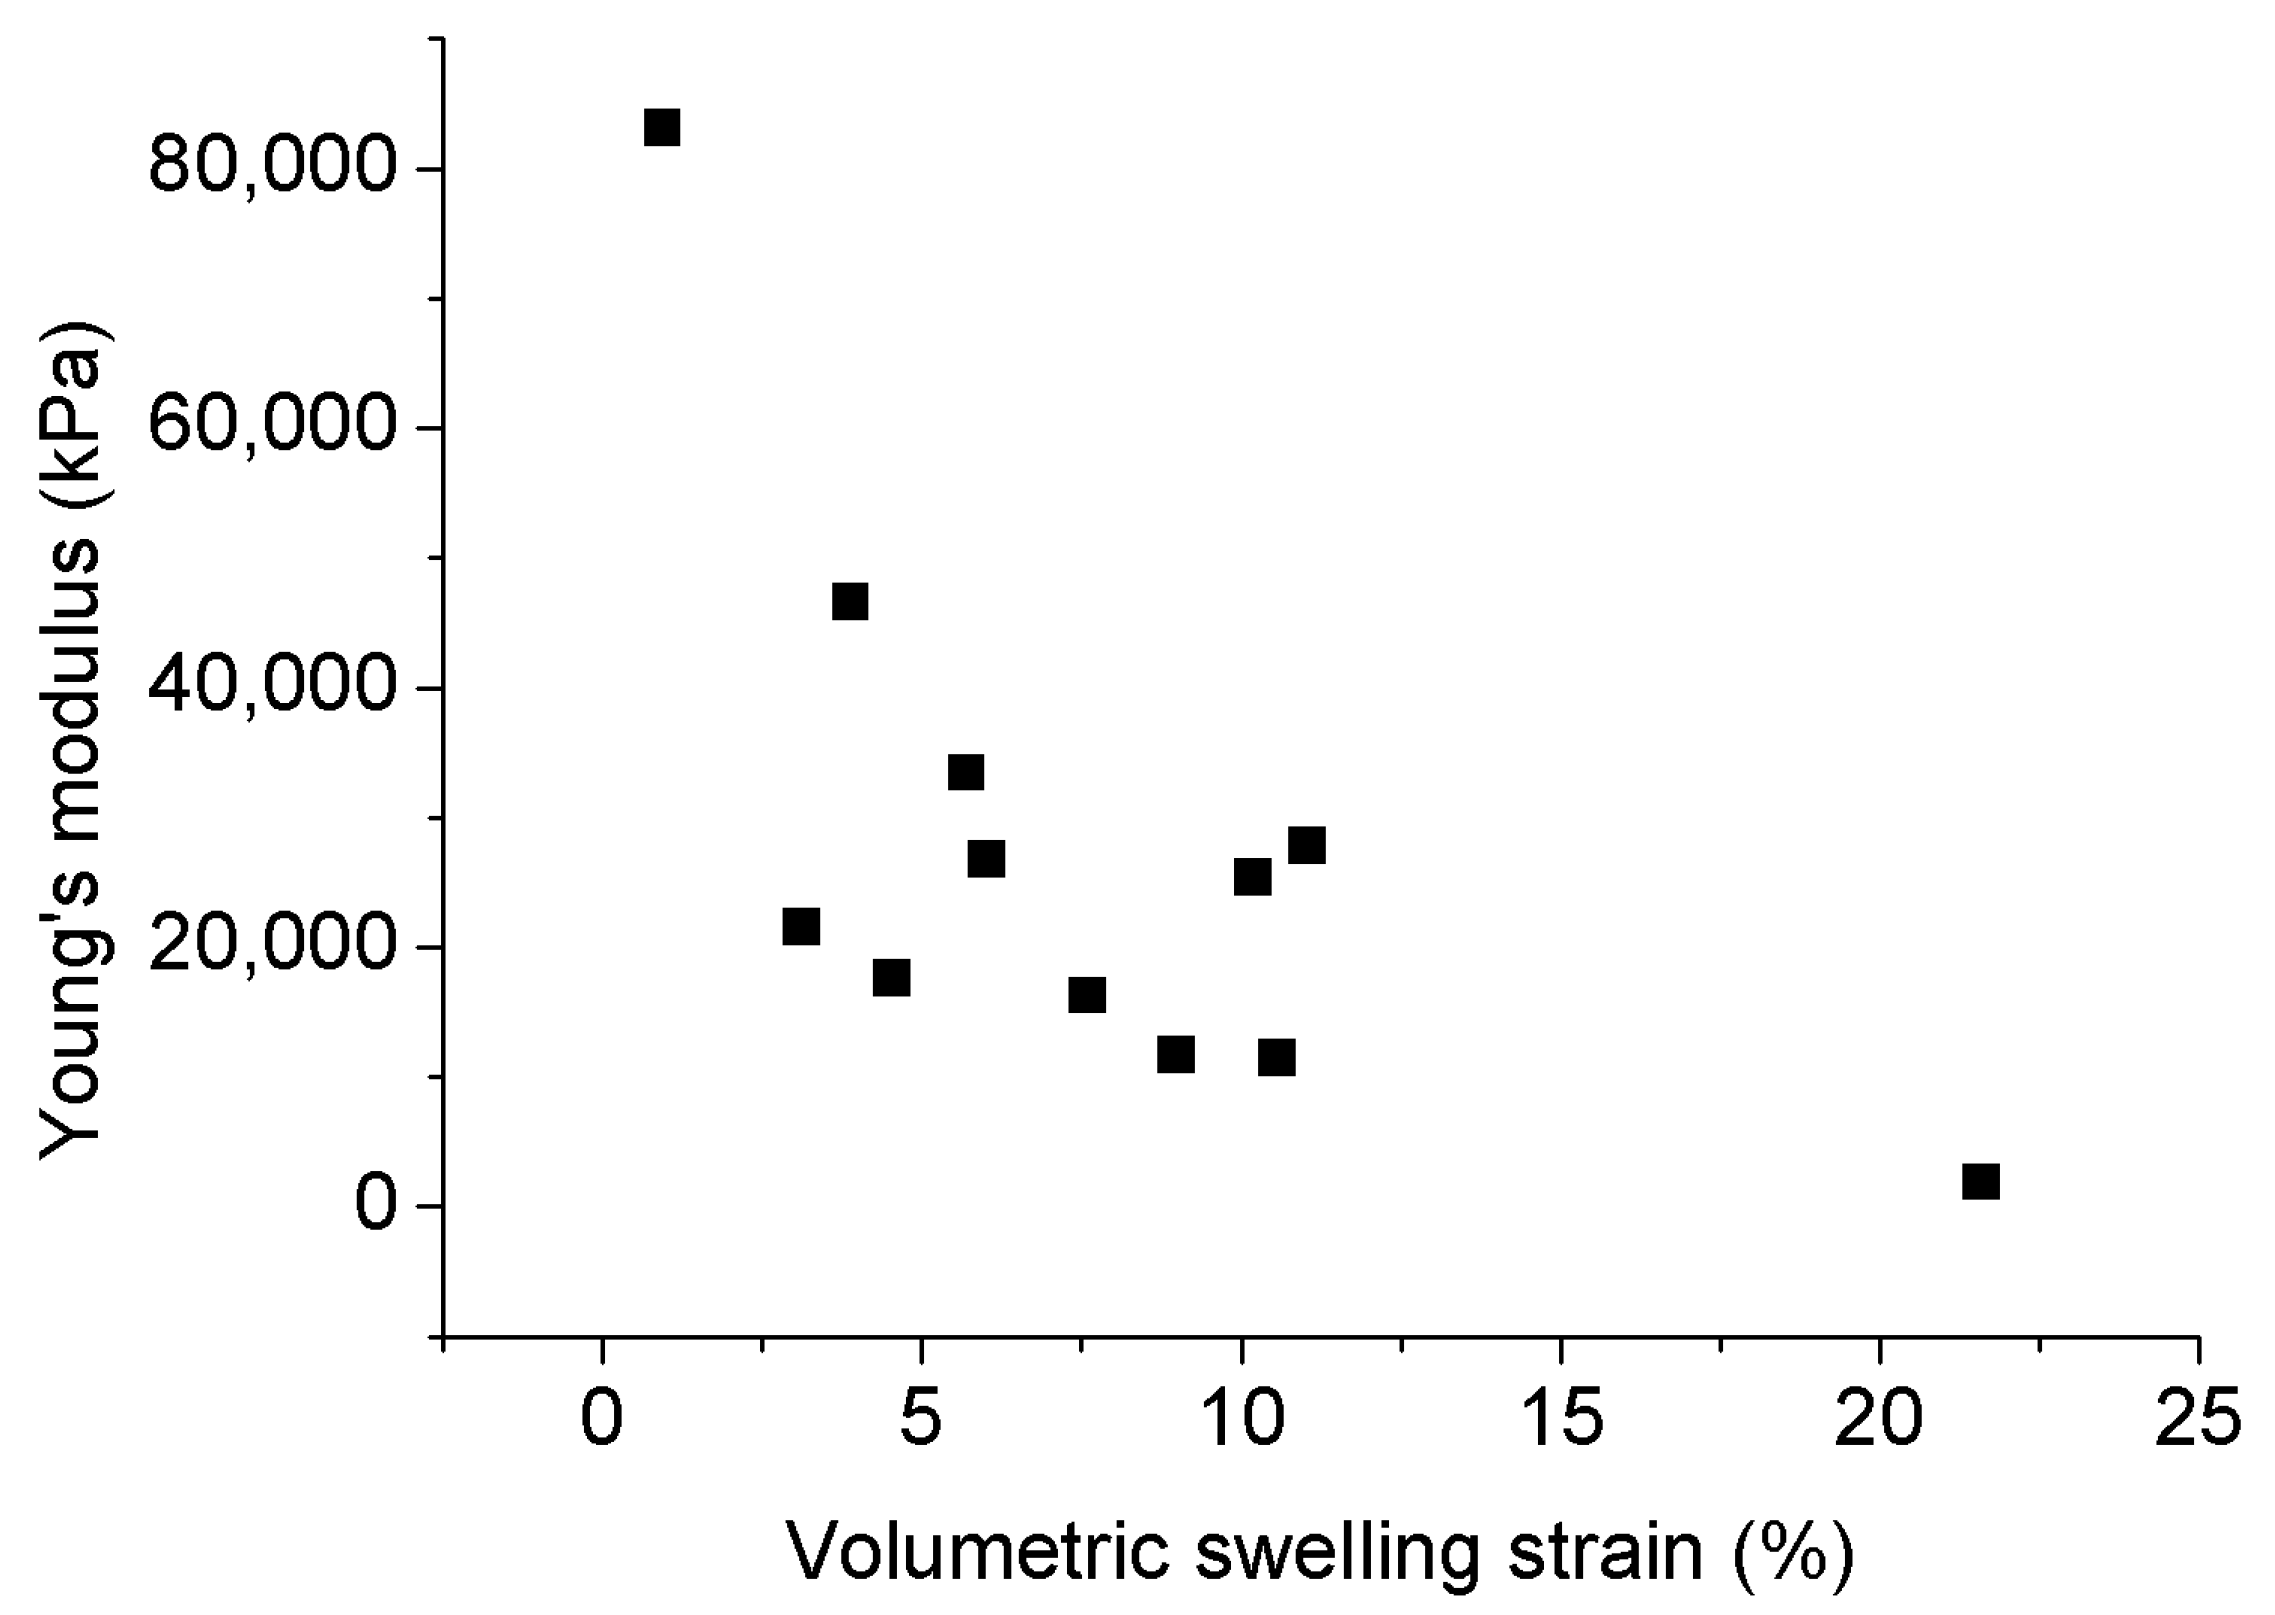
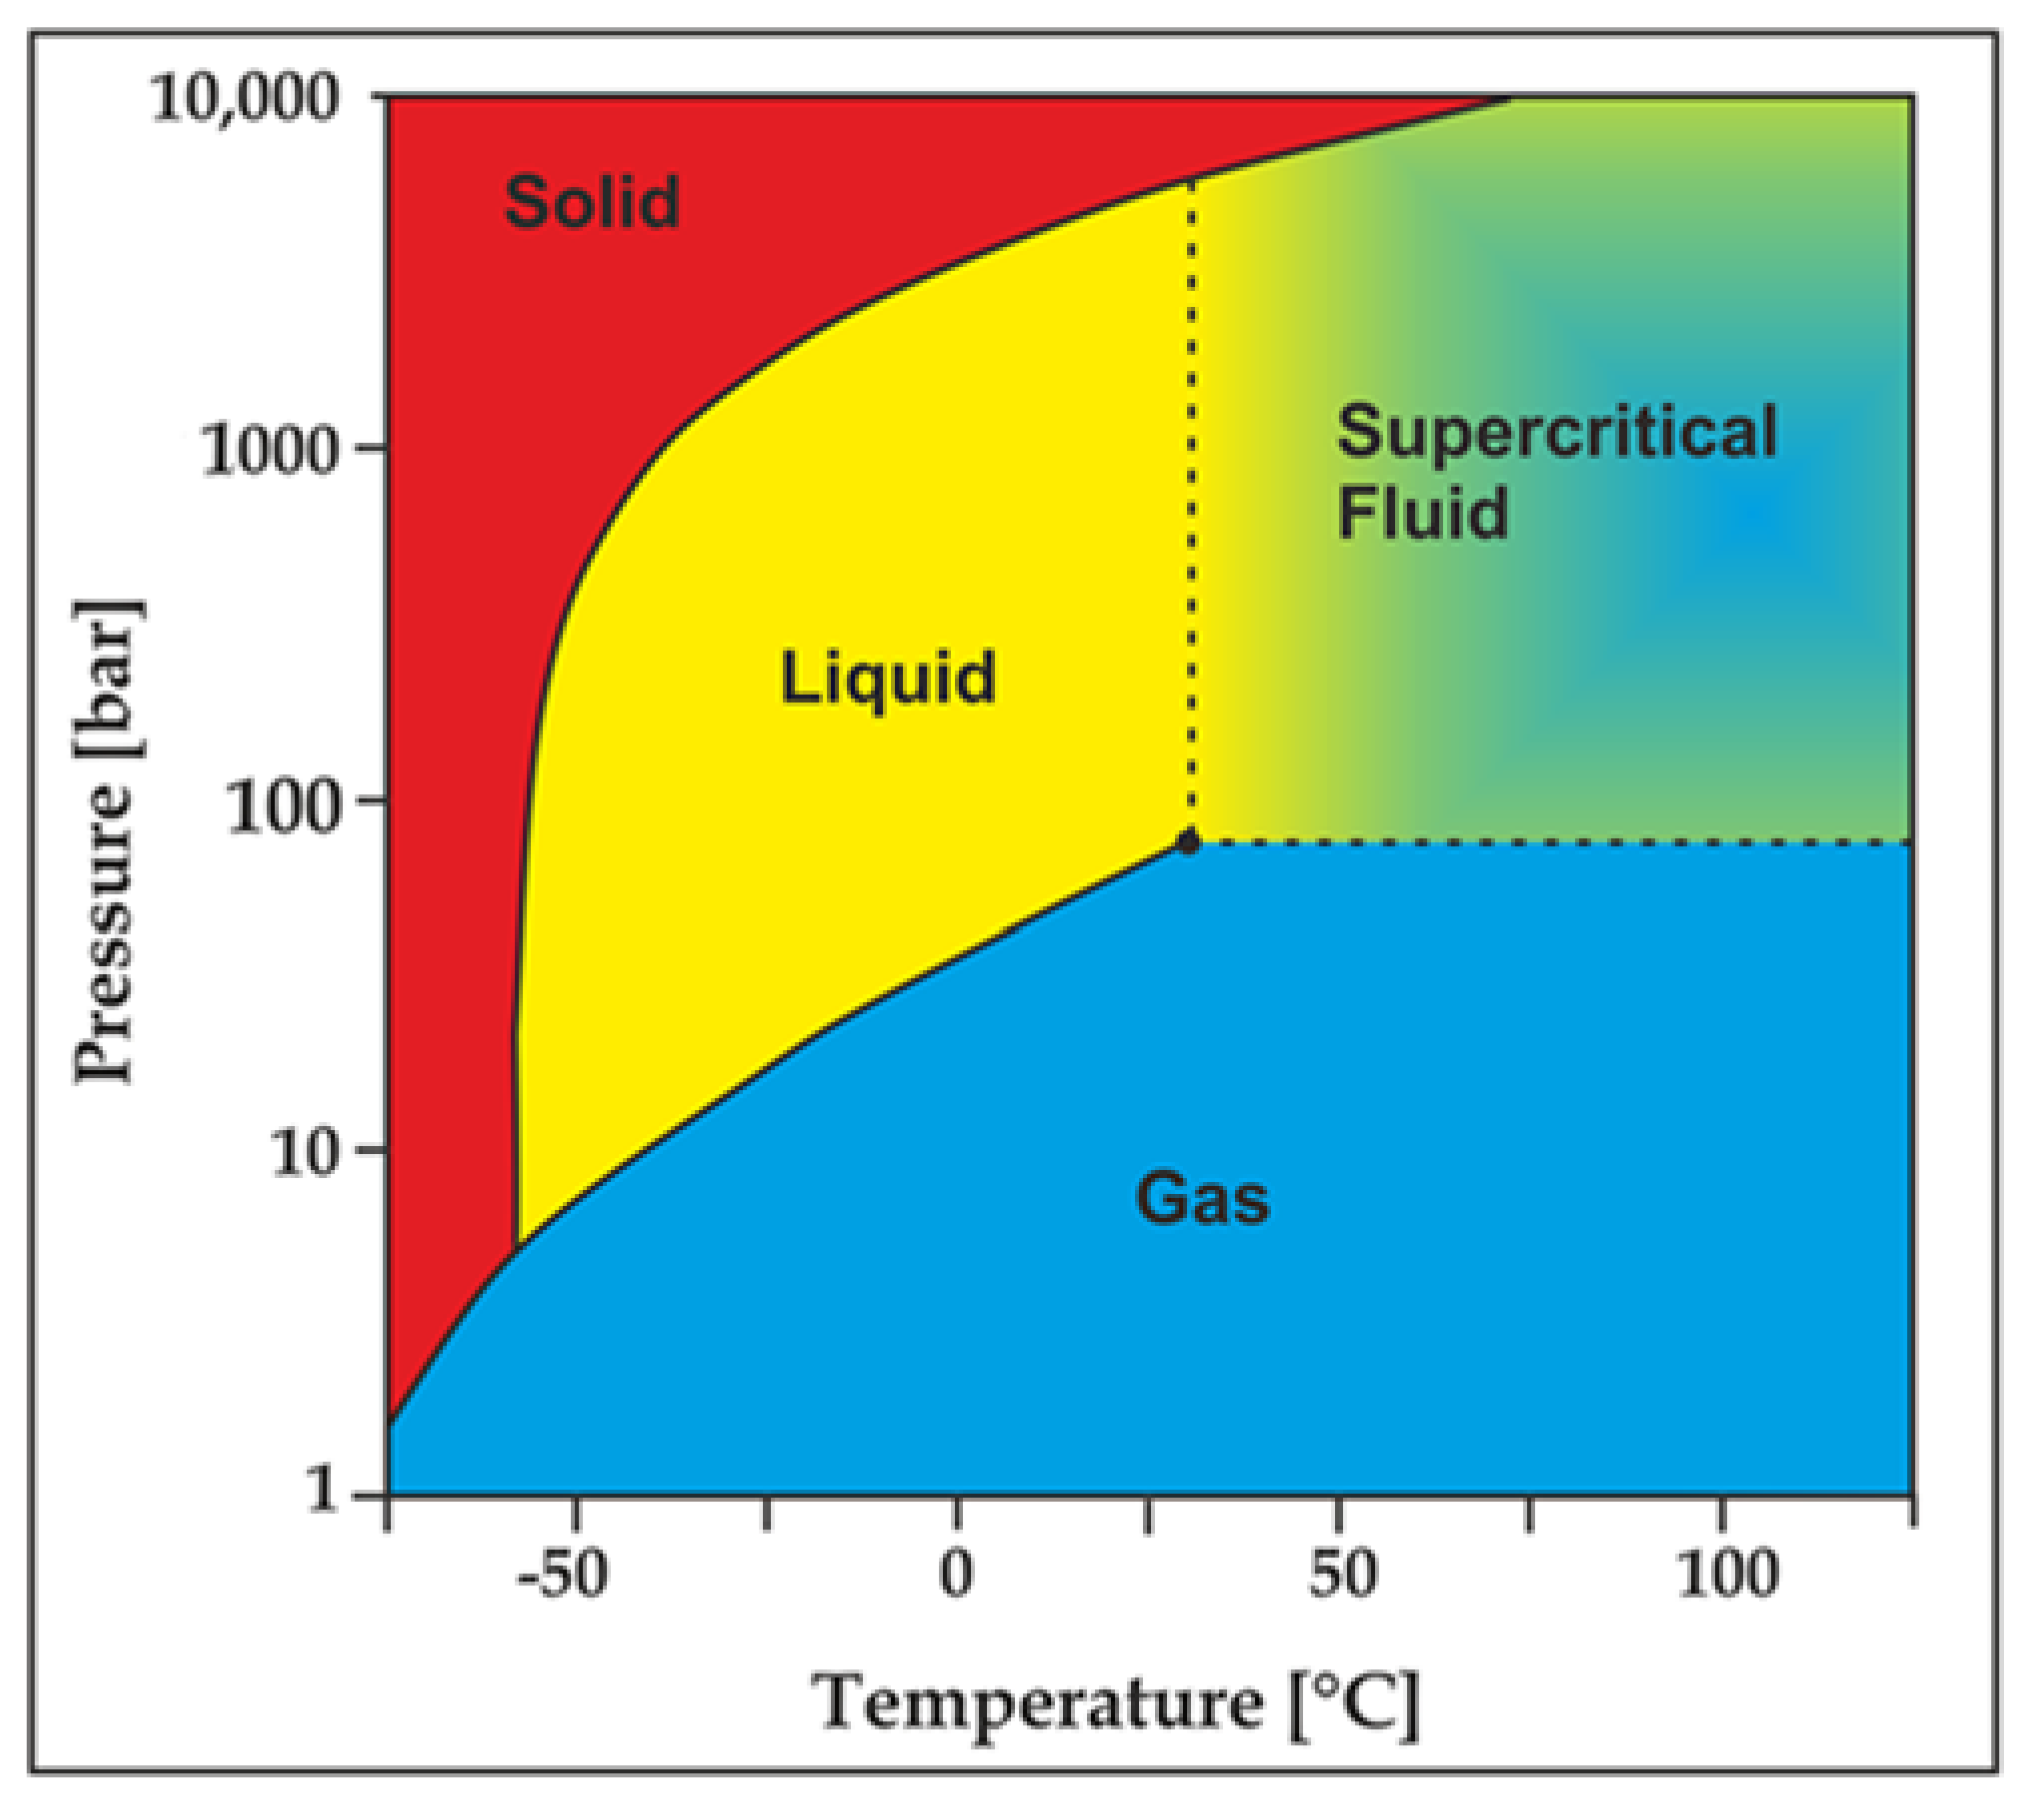
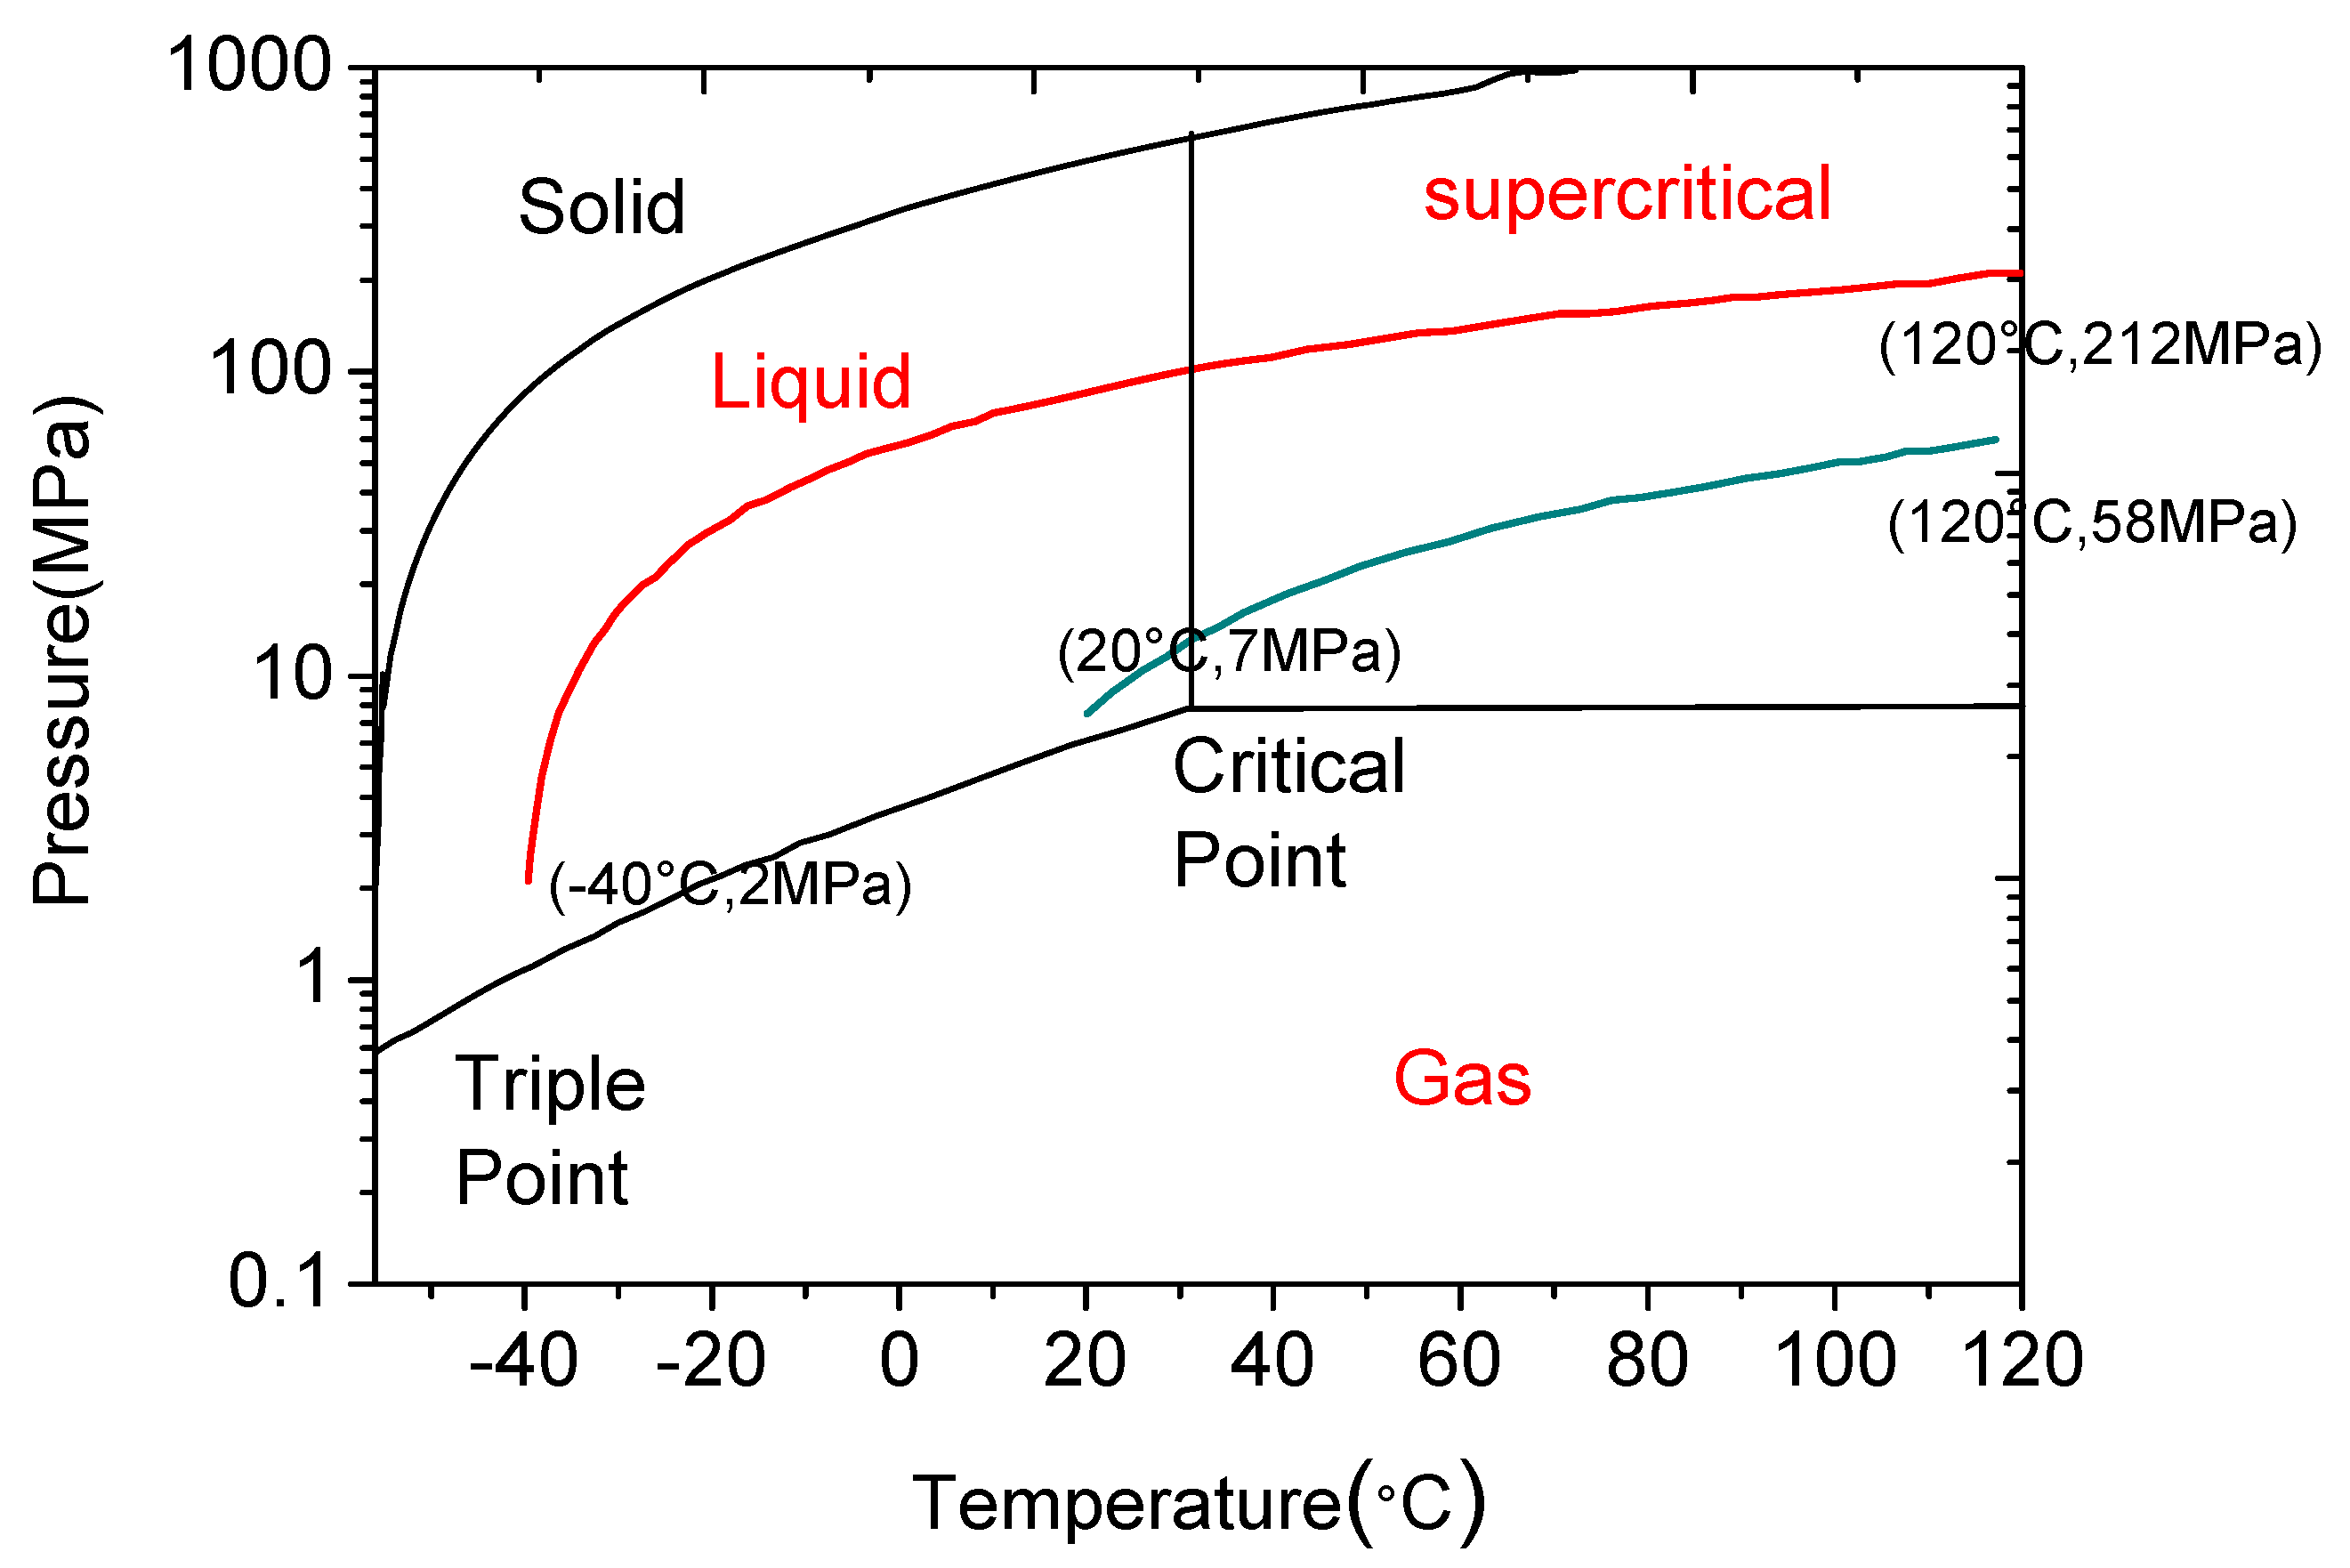
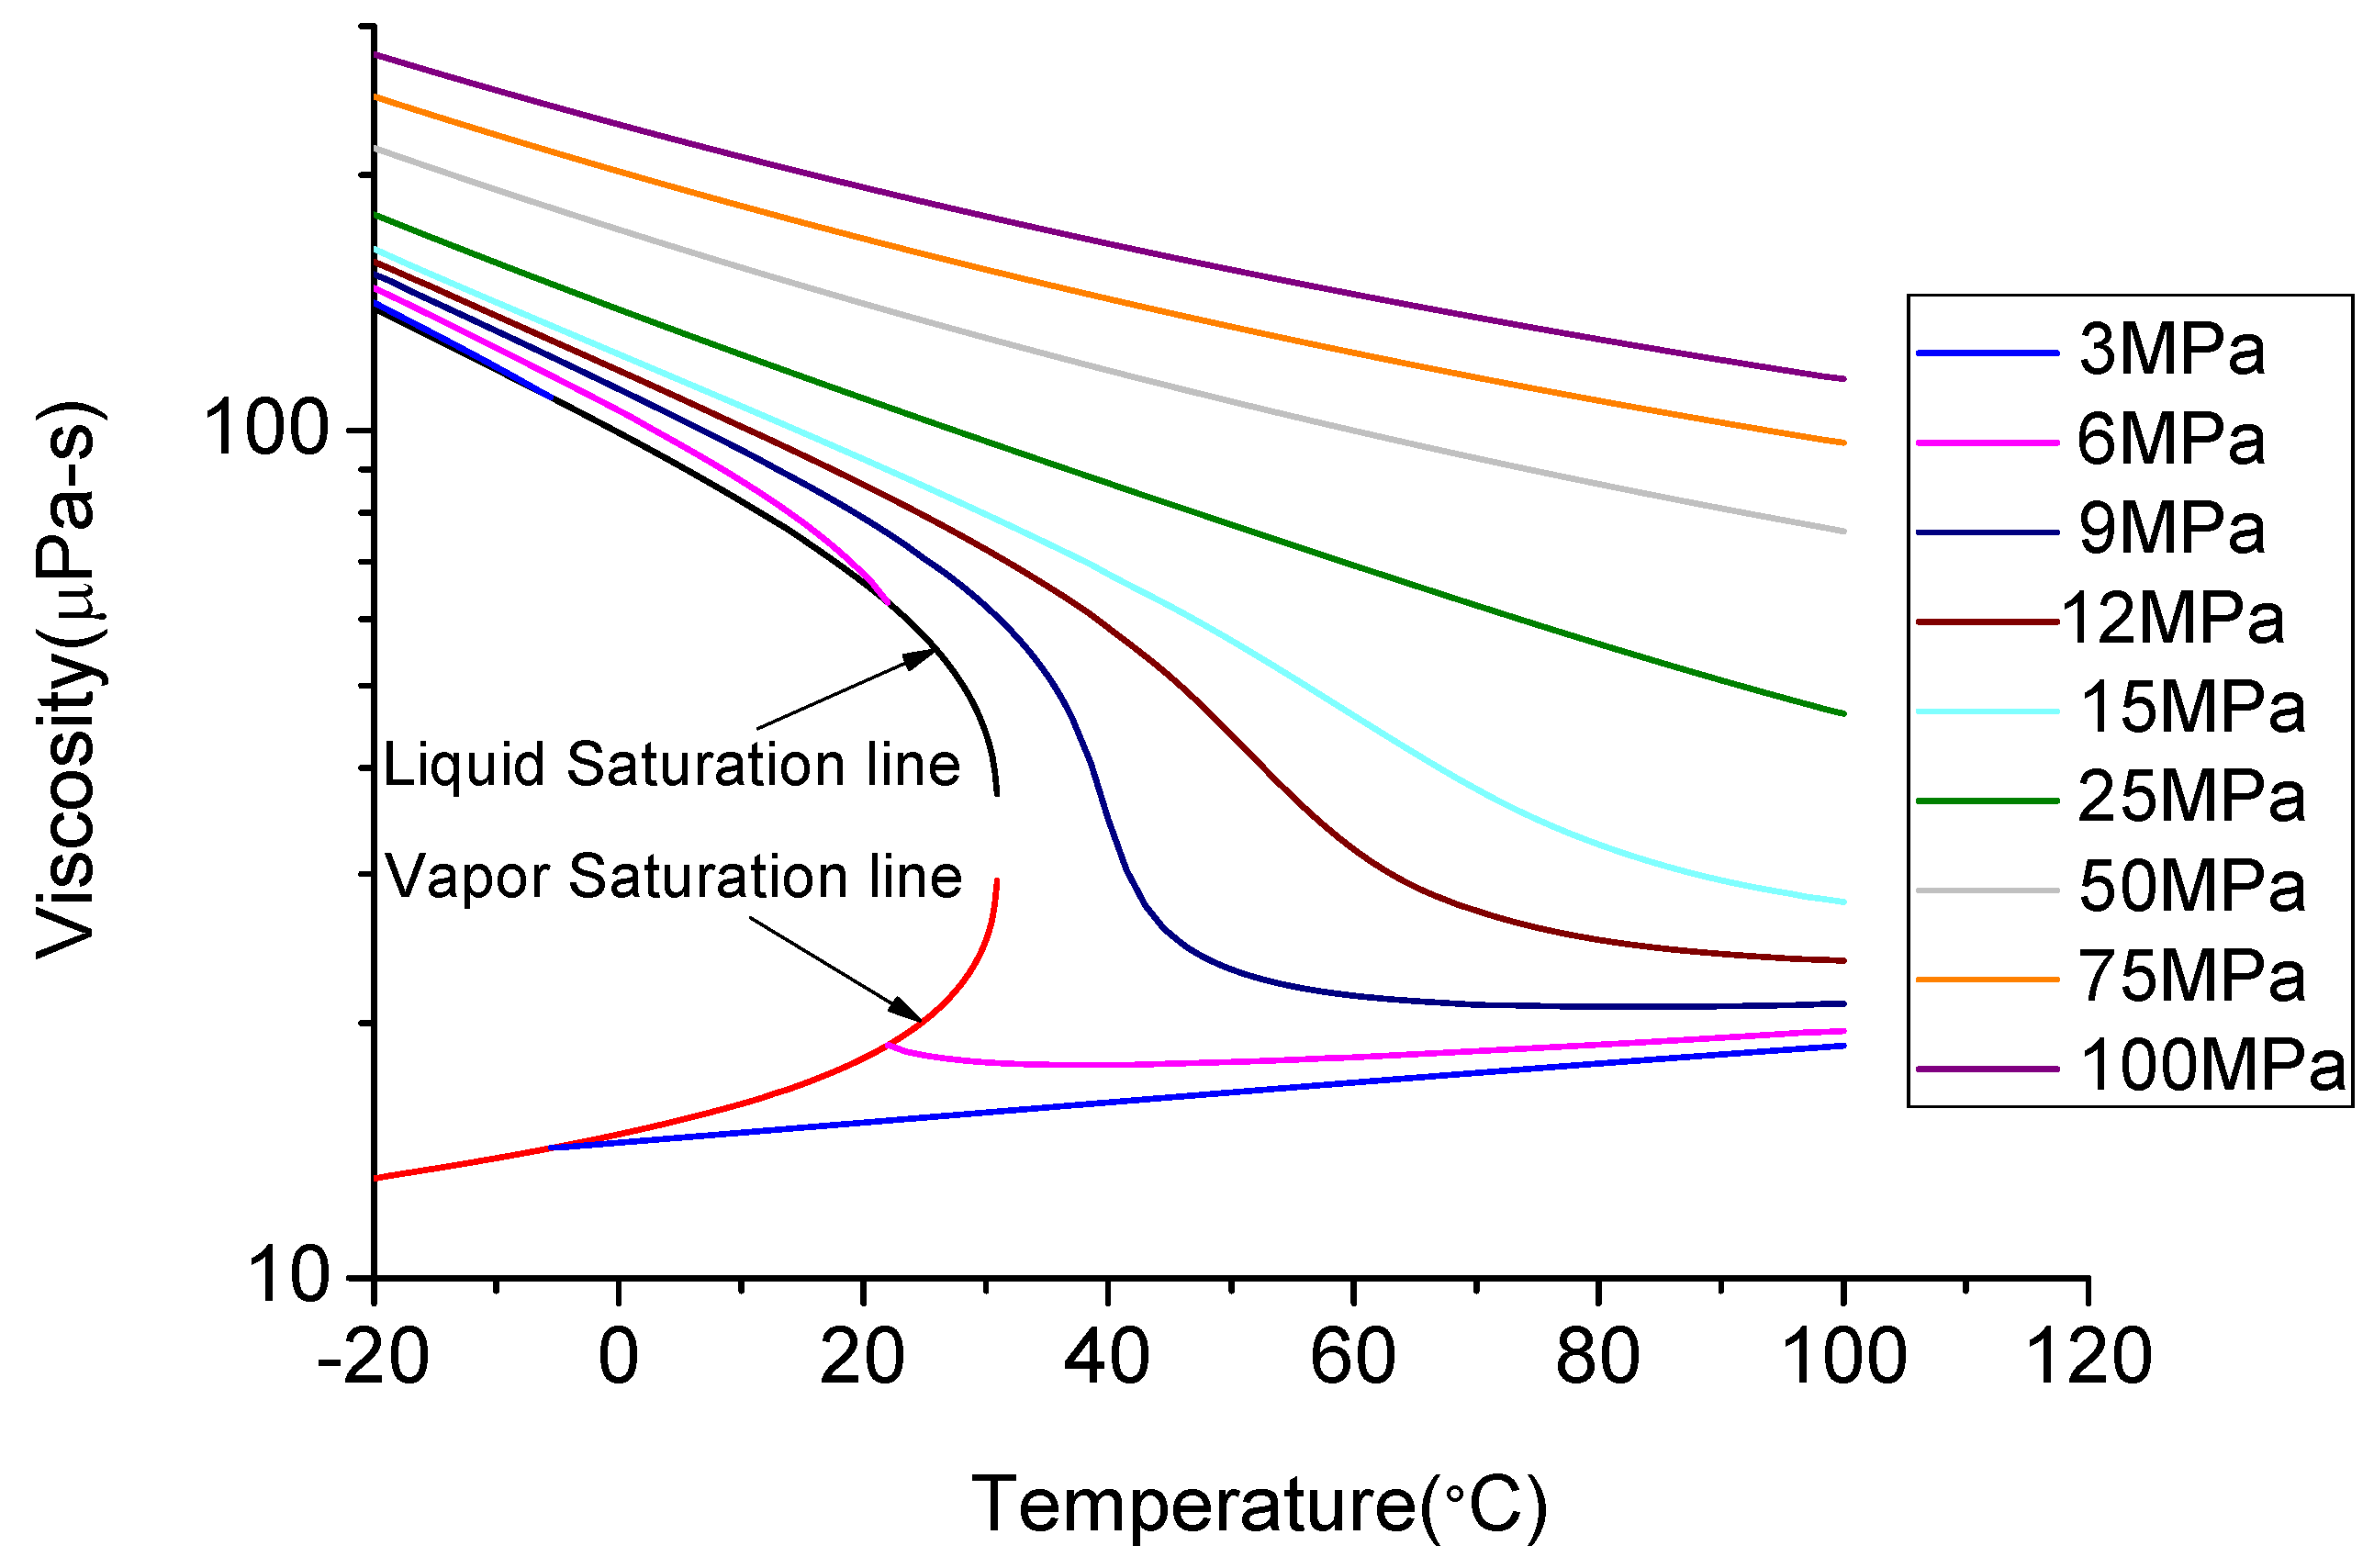
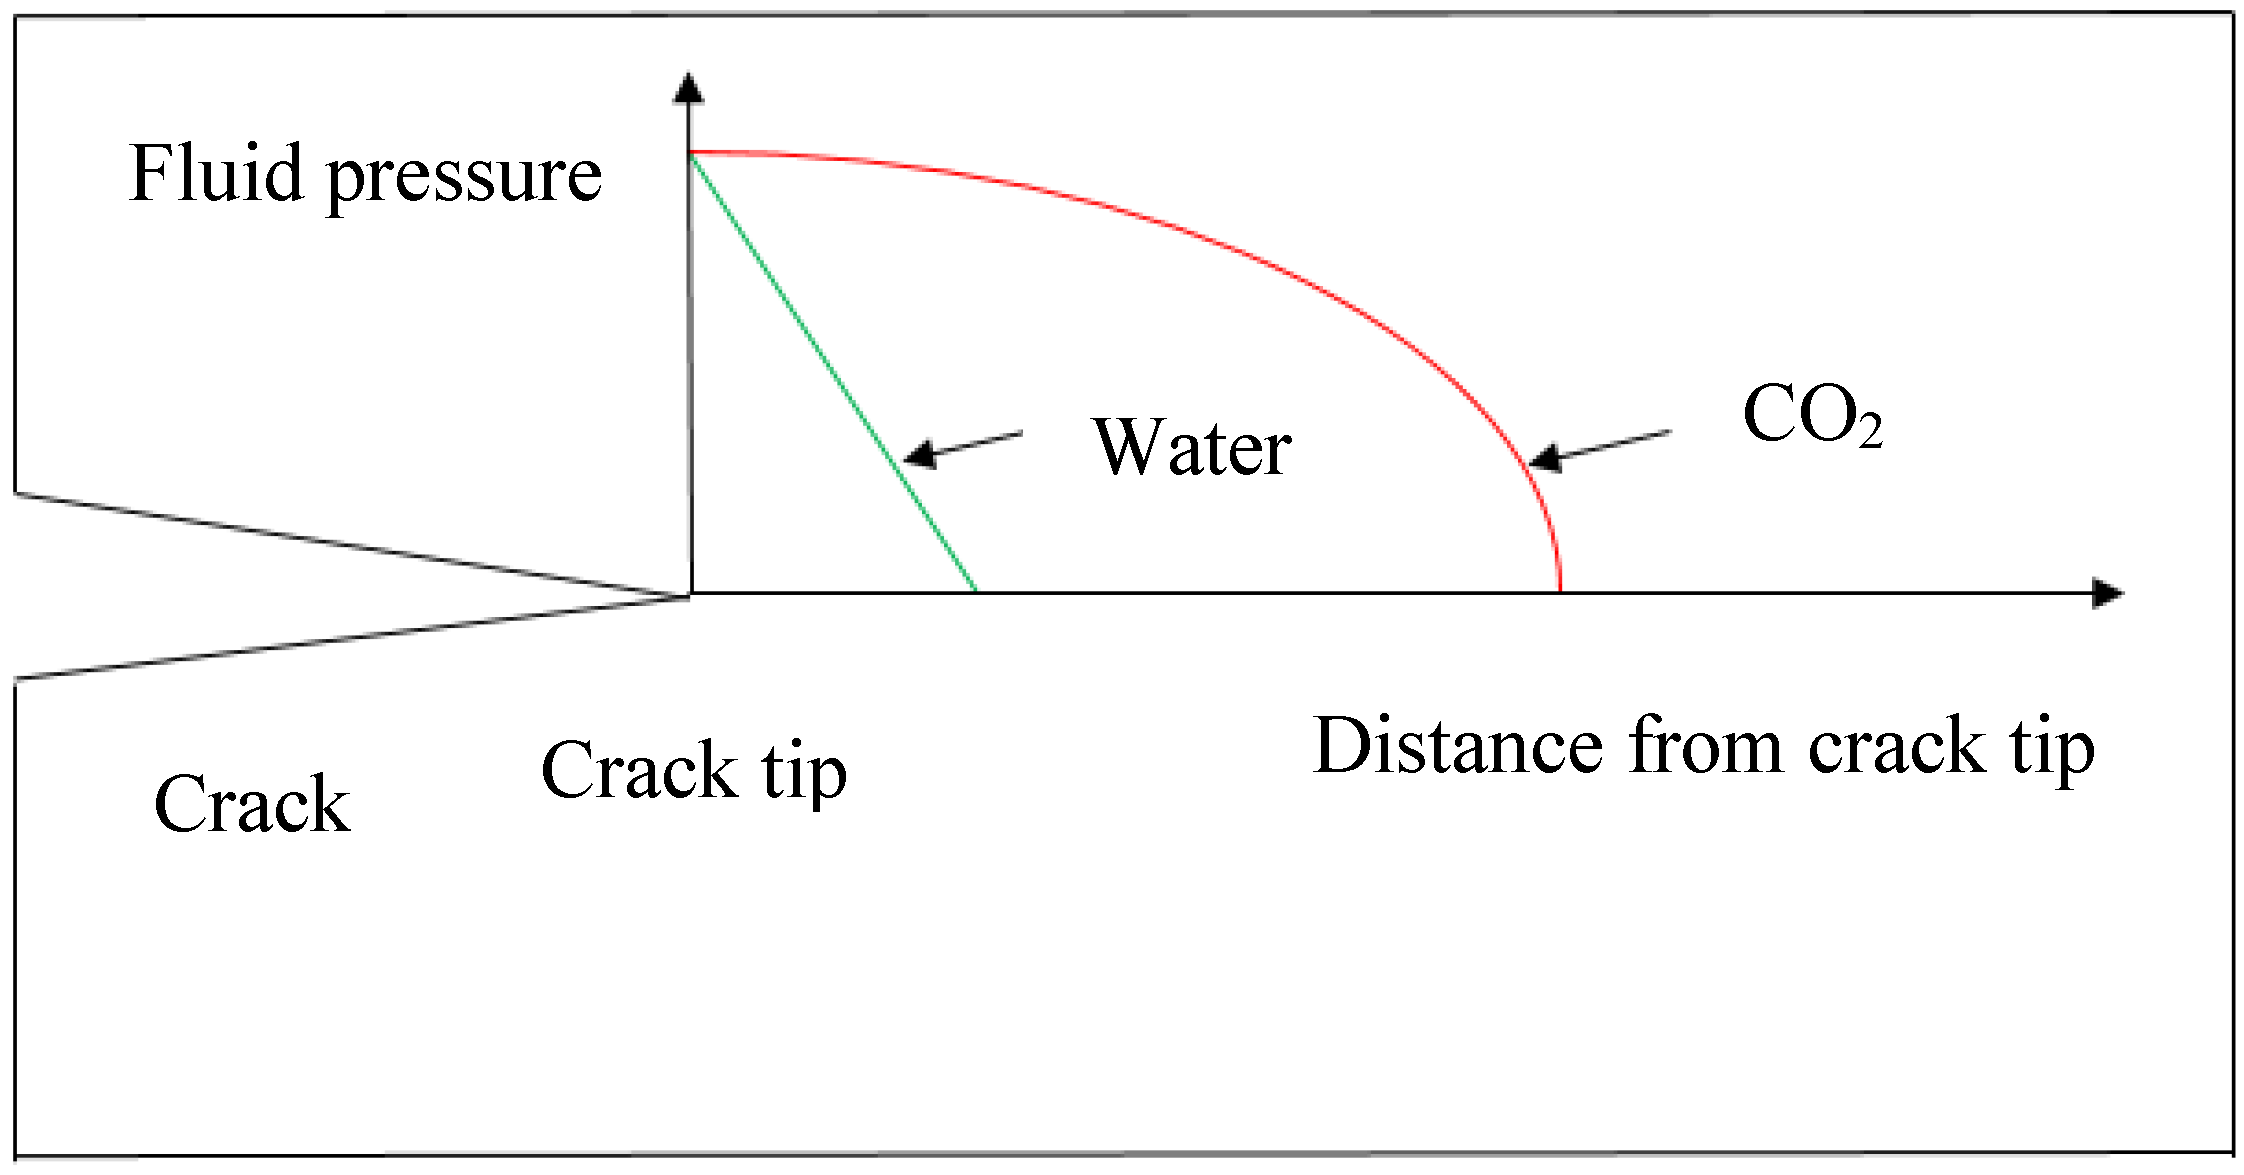
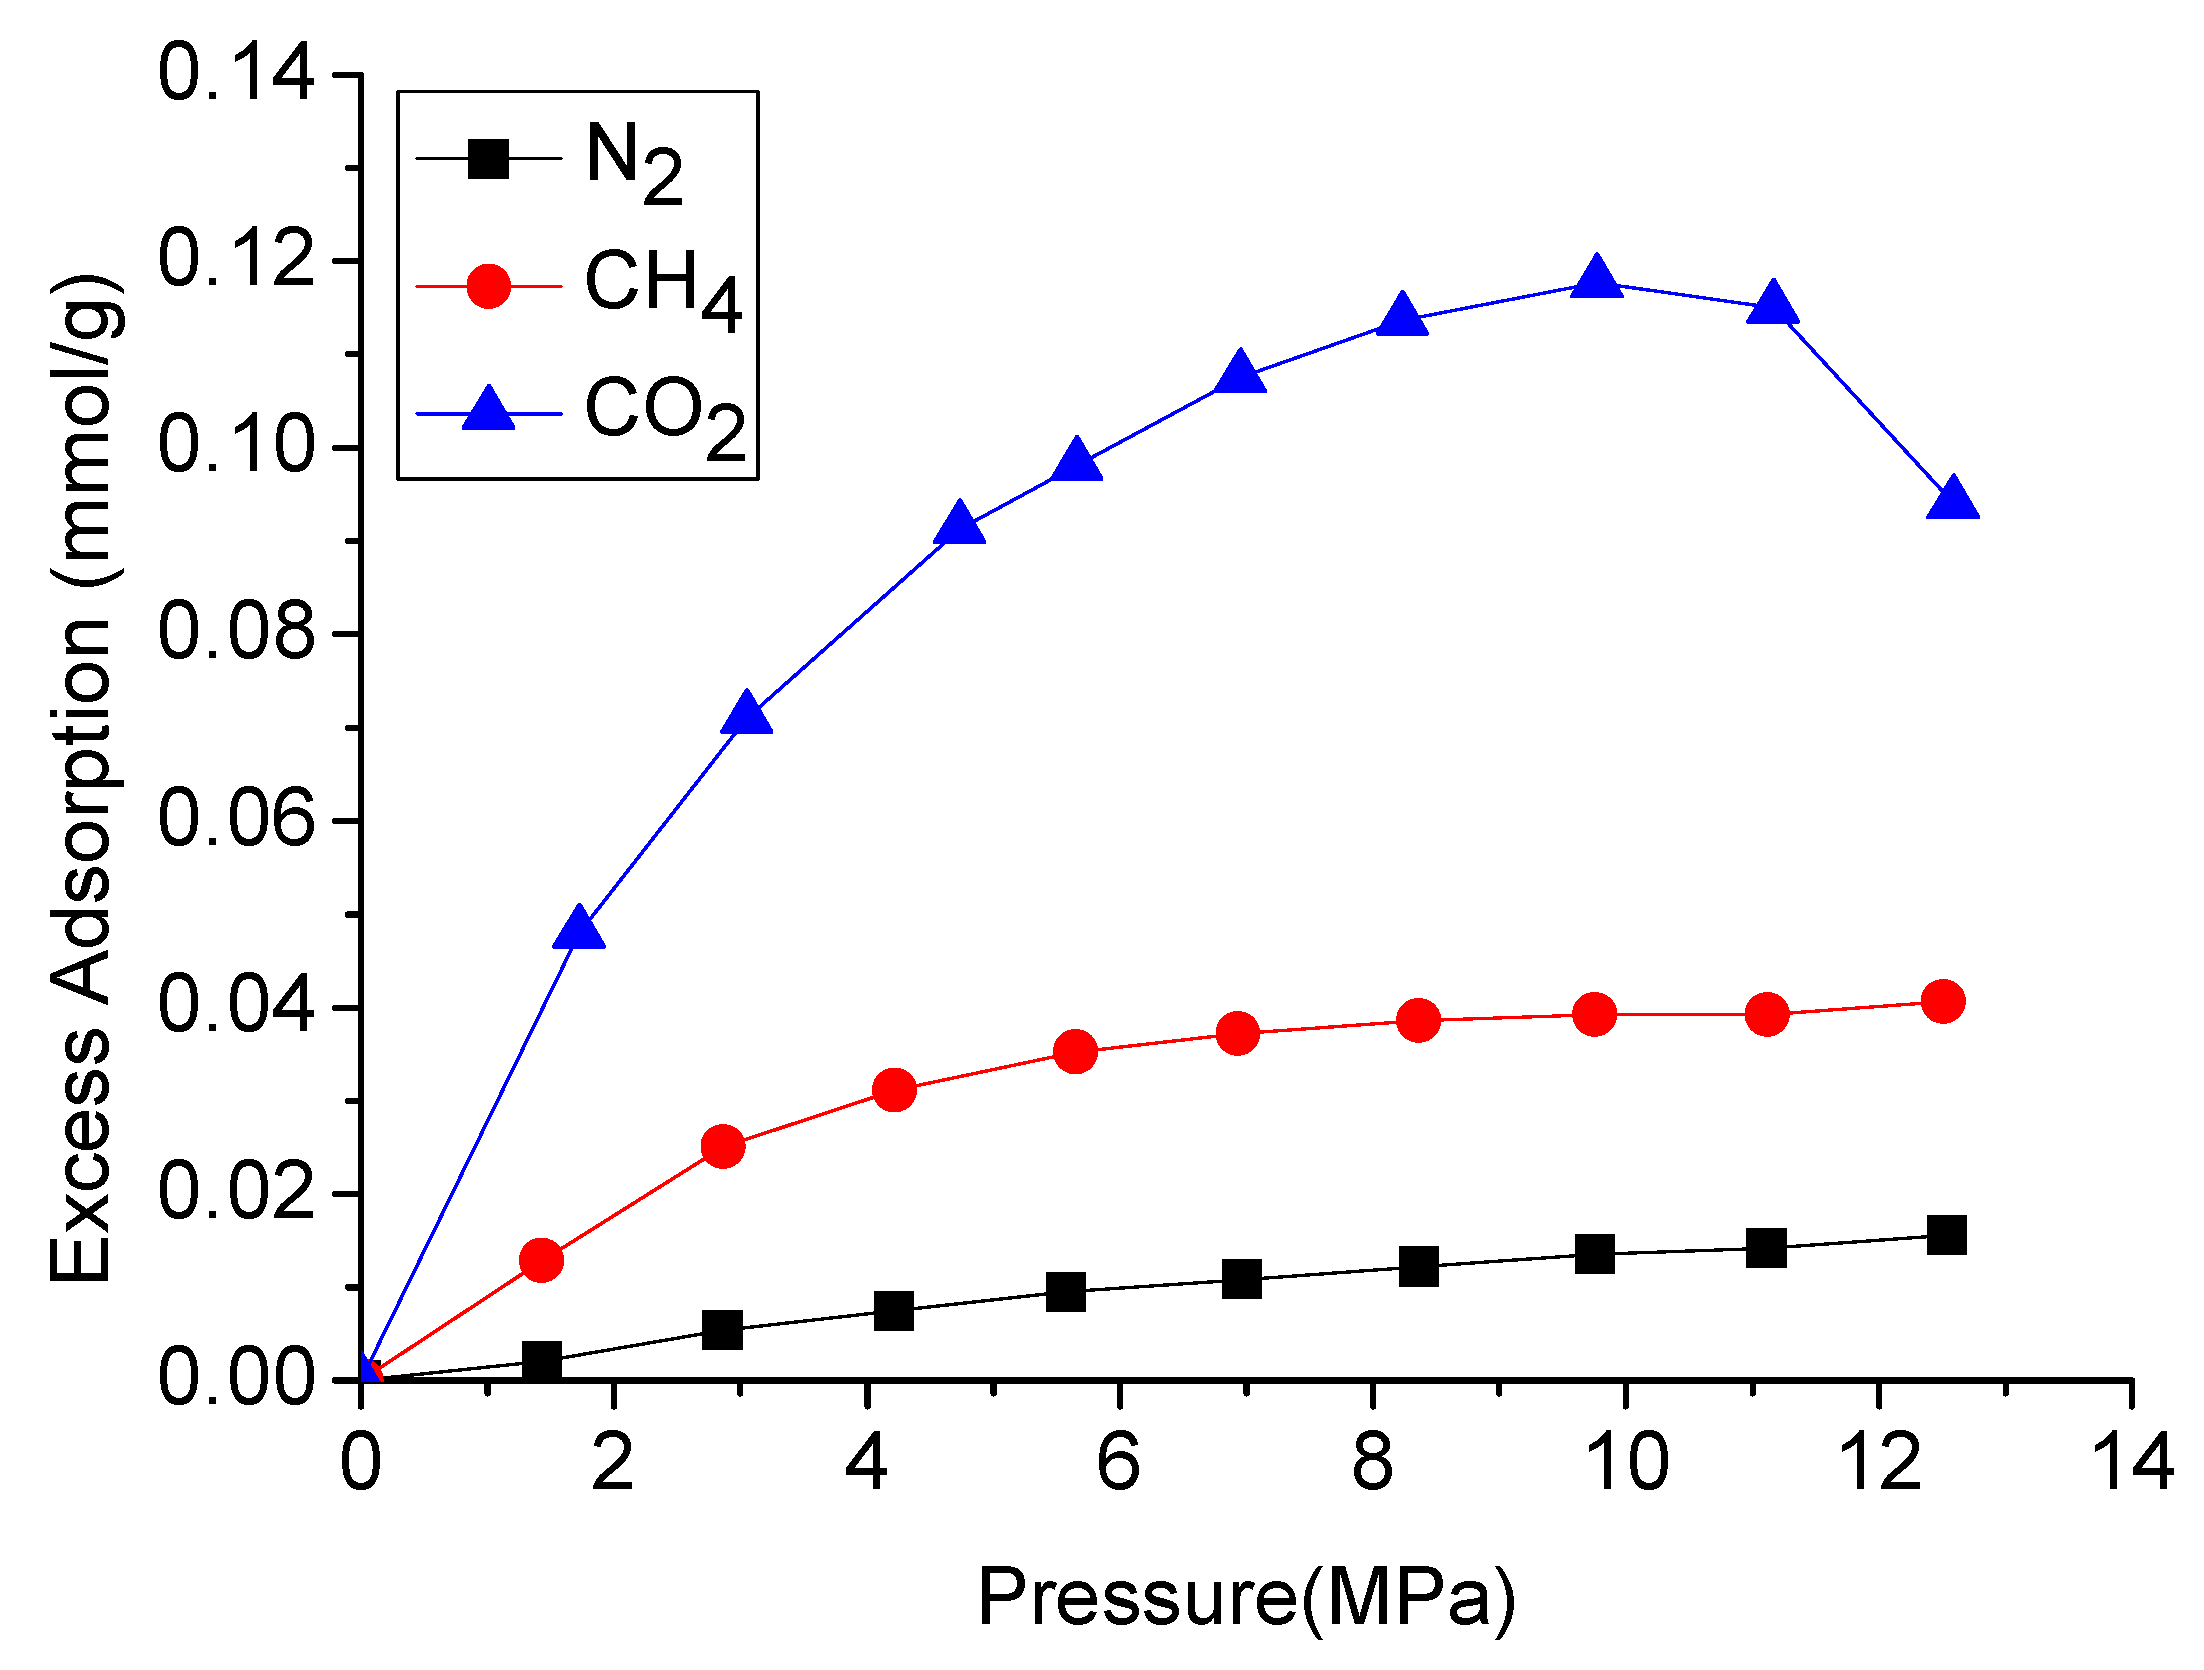
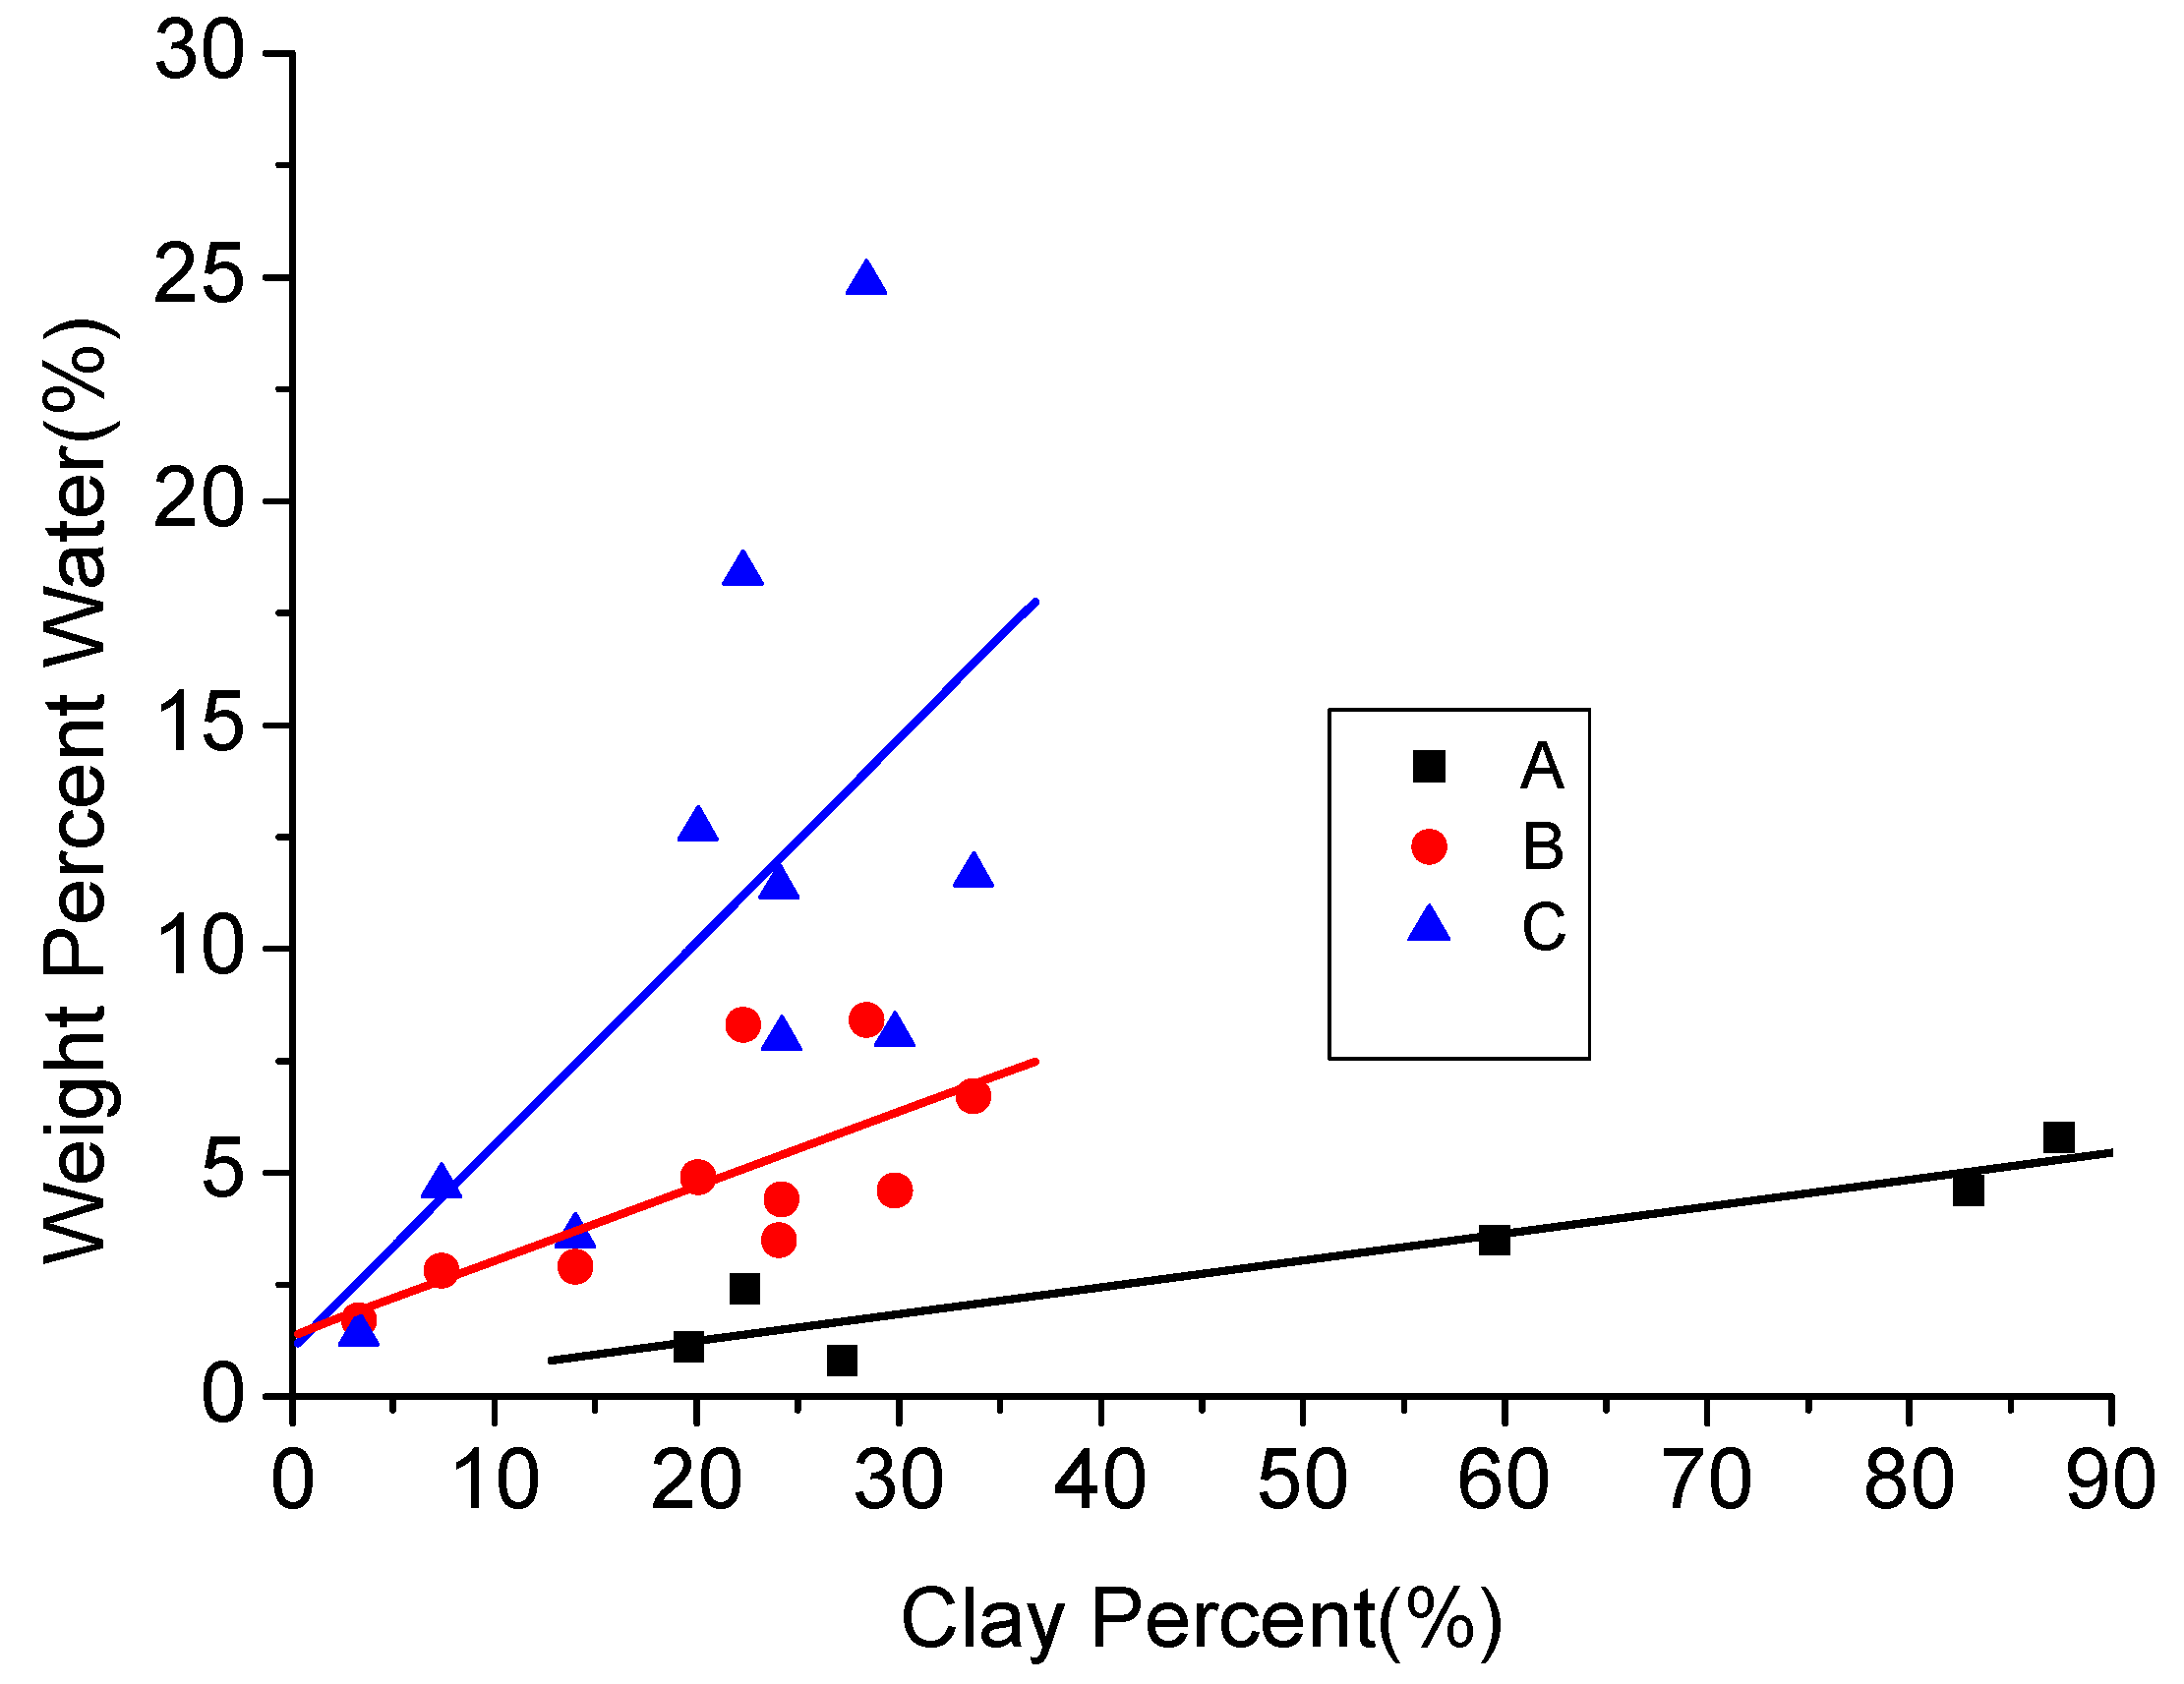
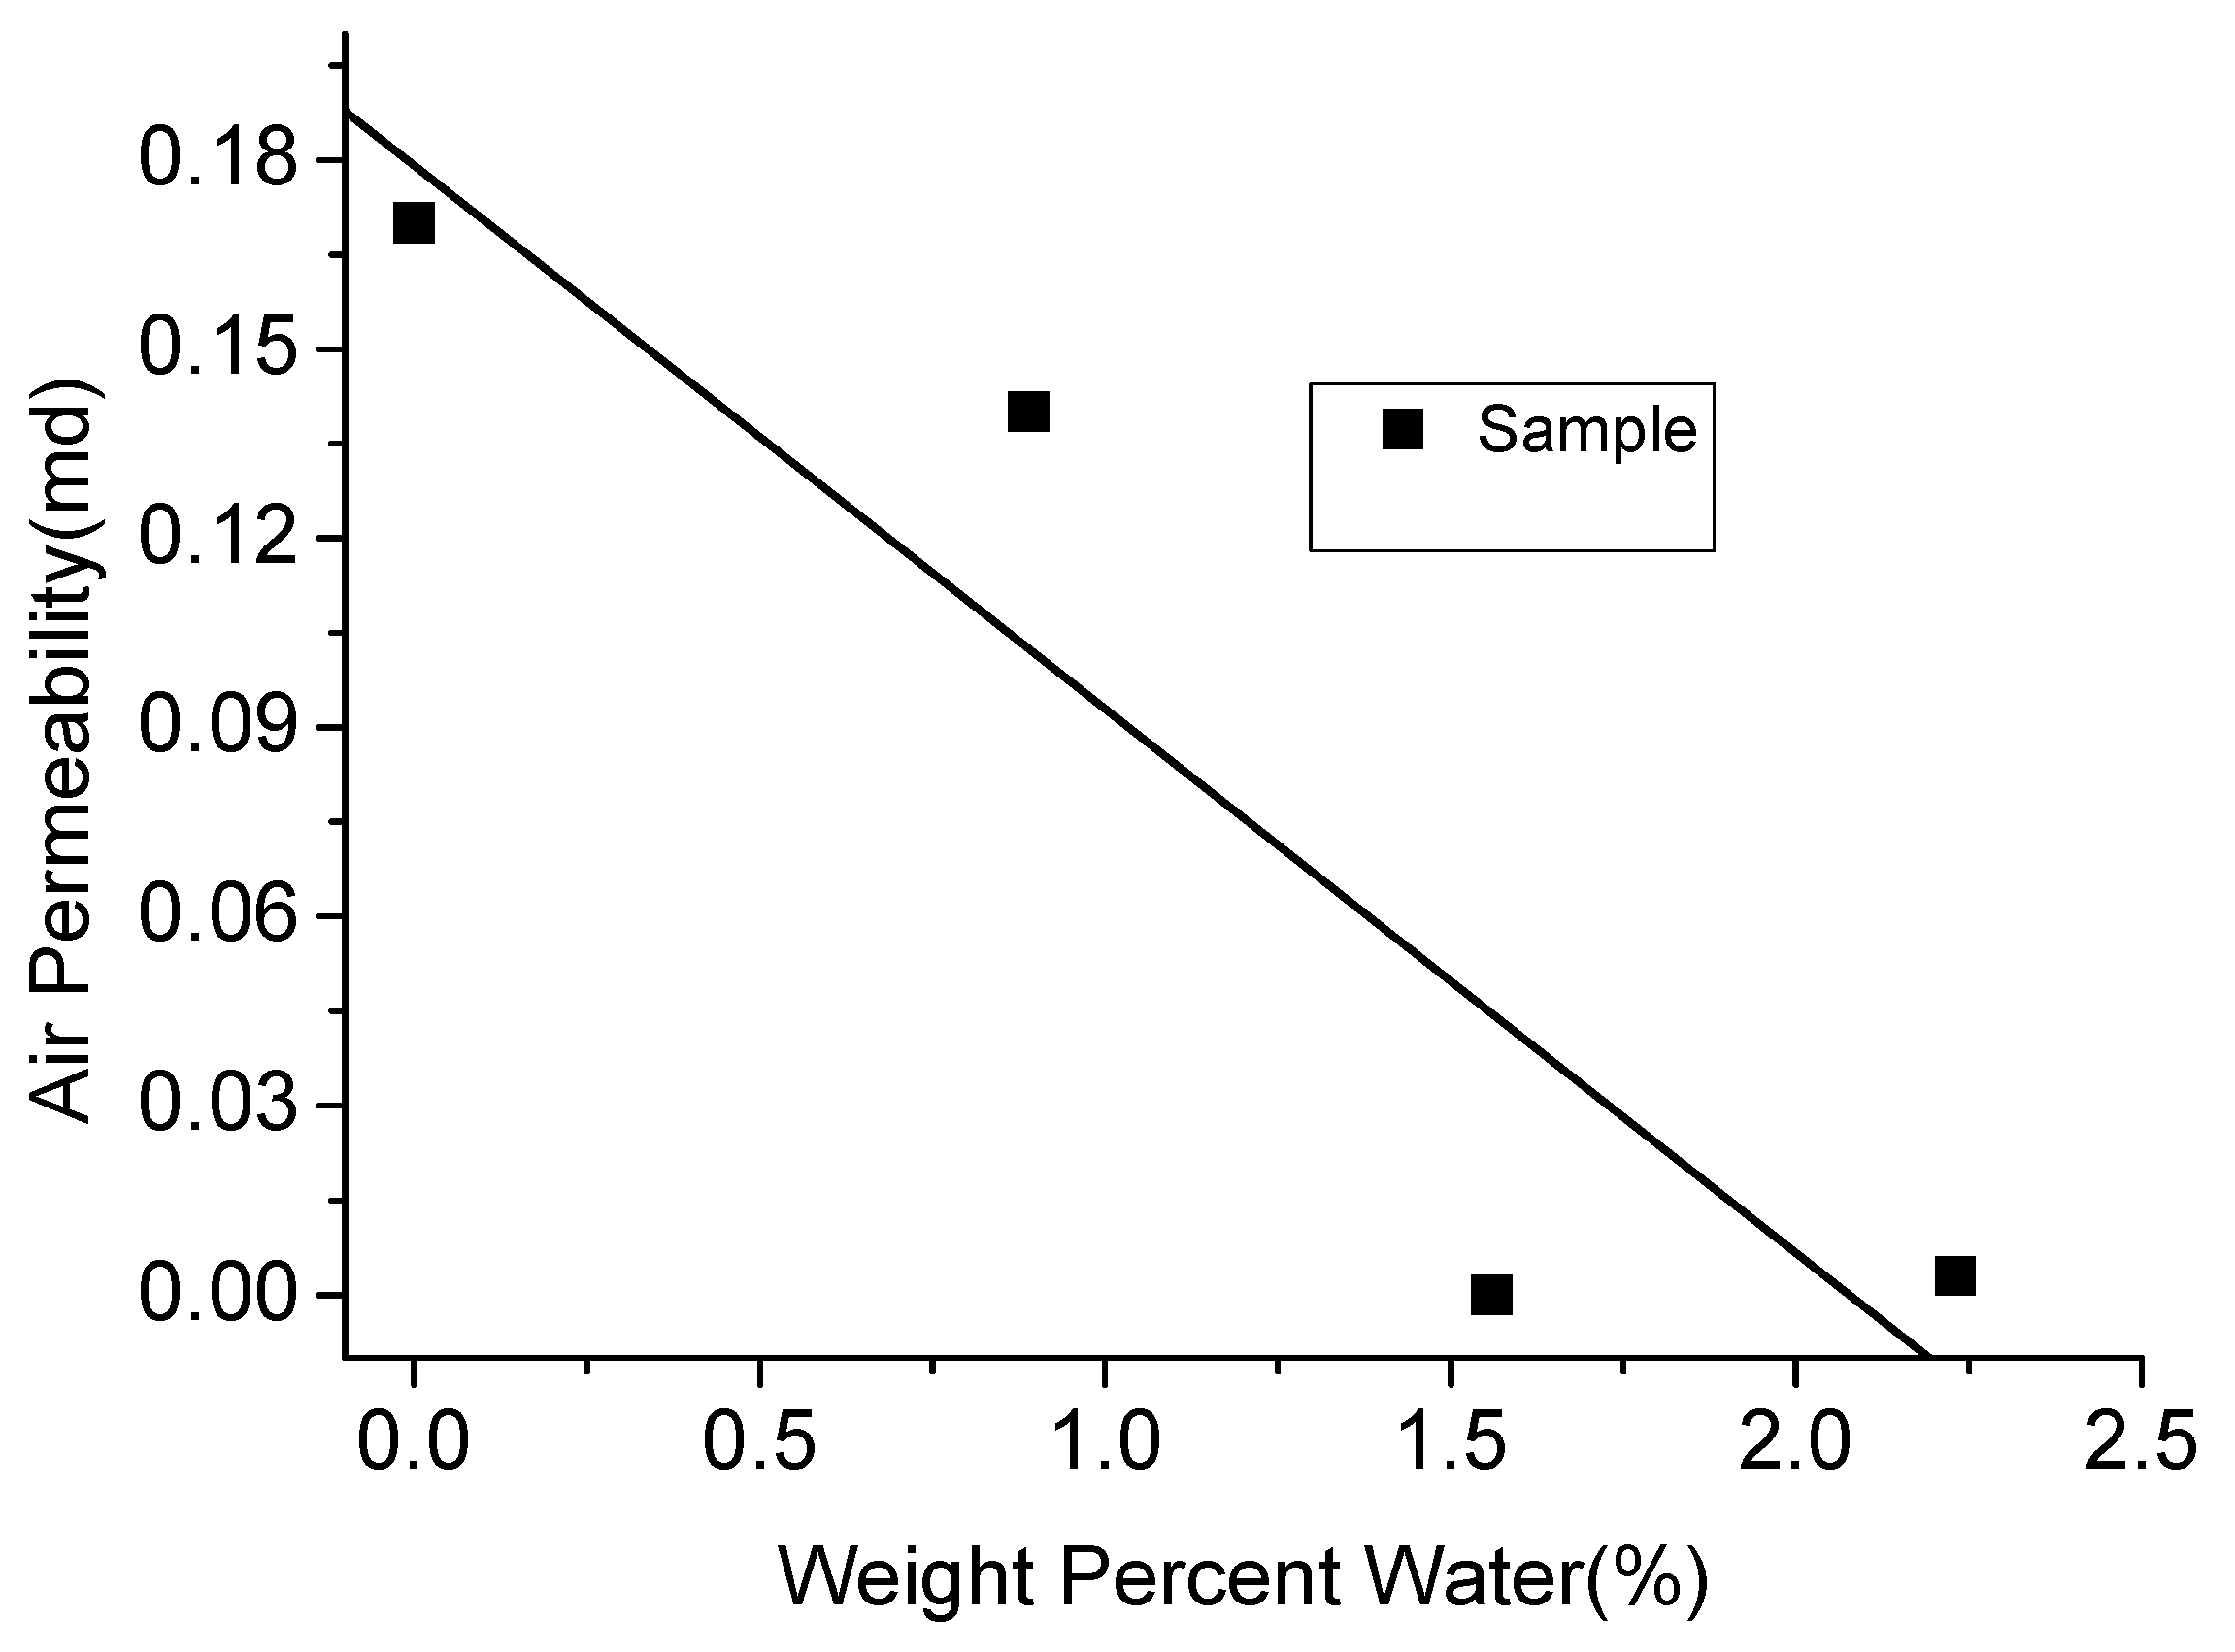
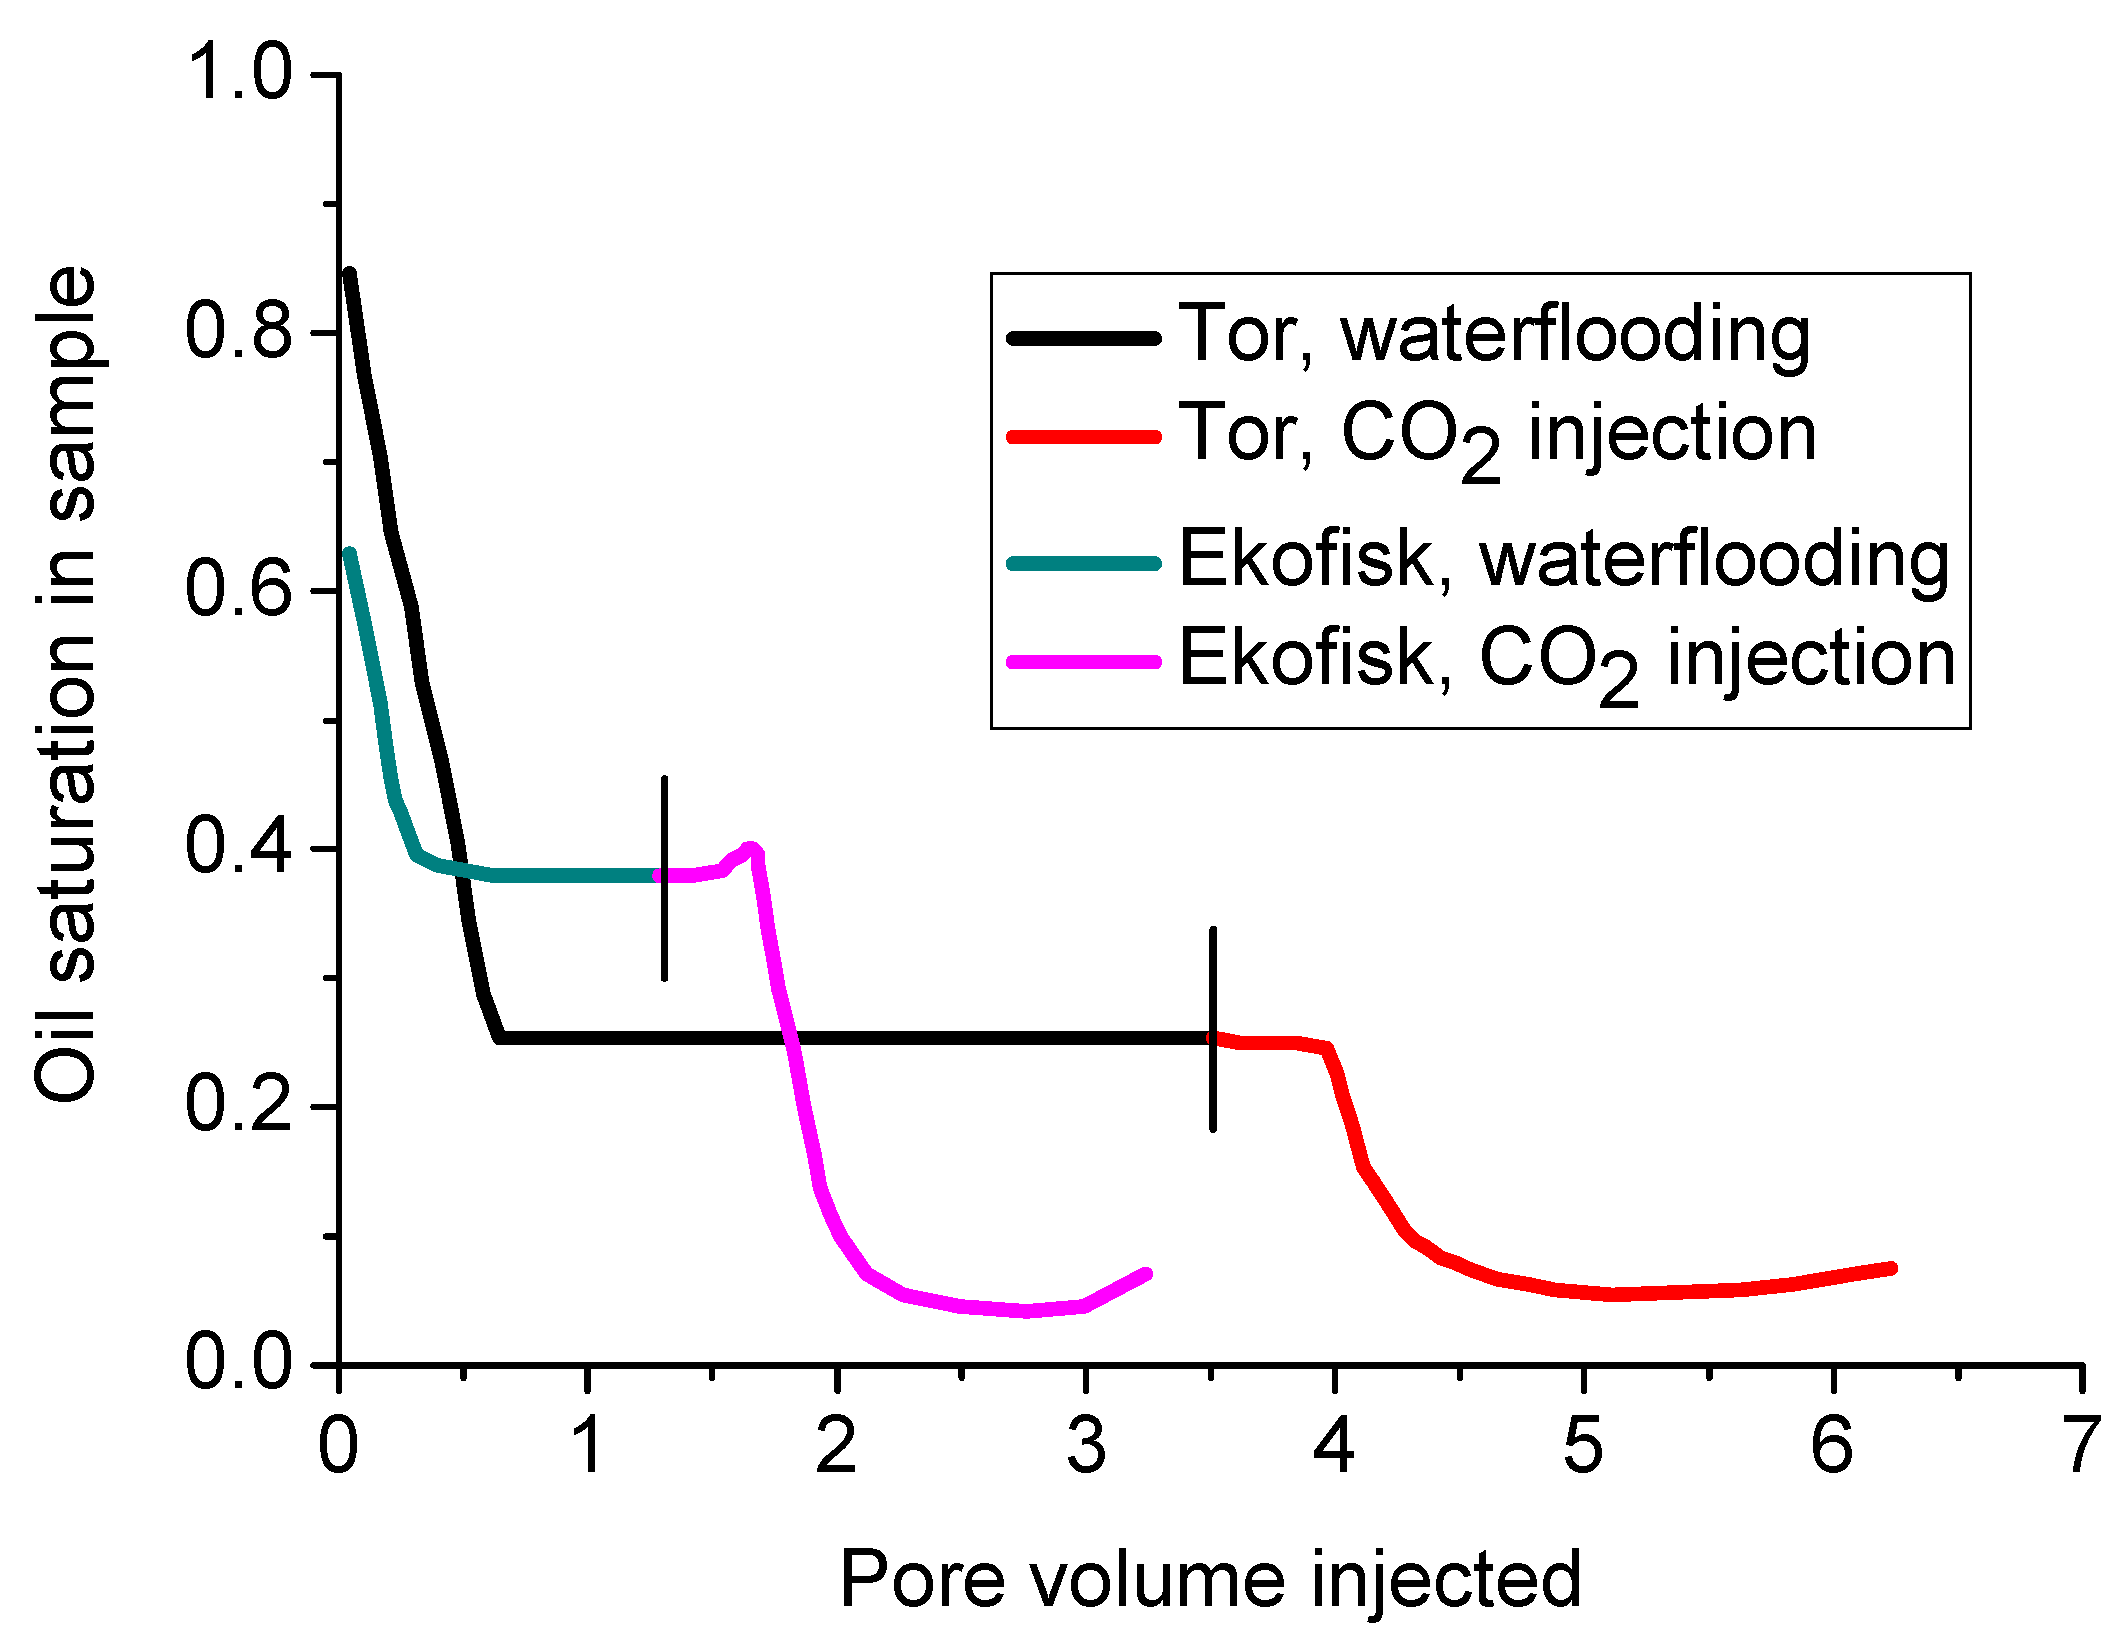
Table 1.
Clay content in shale reservoirs.
| Formation | Smectite (%) | Illite (%) | Kaolinite (%) | Mica (%) | Chlorite (%) | Mixed Layer (%) | Total (%) | References |
|---|---|---|---|---|---|---|---|---|
| Barnett shale | 0.9 | 7.2 | 1.6 | 1.7 | 1.1 | 3.1 | 15.6 | [39] |
| 31.4 | 3.8 | 1.1 | 36.3 | [40] | ||||
| Fayetteville shale | 20–25 | <5 | [41] | |||||
| 29 | 2 | 4 | 11 | 46 | [42] | |||
| Hassi Messaoud Algerian | 0.35 | 5.3 | 1.35 | 7 | [43] | |||
| Haynesville shale | 43.2 | 0.9 | 0.6 | 44.7 | [40] | |||
| Doig siltstone | 5.5 | 0.0 | 0.0 | 5.5 | ||||
| Woodford shale | 41.0 | 1.4 | 3.4 | 45.8 | ||||
| Marcellus shale | 33.6 | 3.4 | 6.0 | 43.0 | ||||
| Doig phosphate | 10.5 | 0.0 | 0.0 | 10.5 | ||||
| Bowland shale | 2.6 | 15.3 | 19.1 | 2.0 | 18.9 | 57.9 | [44] | |
| North Sea Tertiary shale | 42.8 | 1.3 | 7.9 | 0.6 | 52.6 | [45] | ||
| Mancos shale | 11 | 1 | 1 | 19 | 32 | [42] | ||
| Pierre II shale | 21 | 20 | 1 | 2 | 44 |
Table 2.
Permeability analyses of four samples of frontier sands [47].
Table 2.
Permeability analyses of four samples of frontier sands [47].
| Sample | Initial Air Permeability, md, Ka1 | Ratio of Other Permeability to Ka1,% | Clay Minerals % of 12−µ Fraction | |||||
|---|---|---|---|---|---|---|---|---|
| Kaolinite | Illite | Mixed Layers * | ||||||
| A | 27 | 12 | 1 | 0 | 89 | 4 | 7 | 26 |
| B | 76 | 22 | 18 | 8 | 68 | 16 | 5 | 15 |
| C | 52 | 64 | 64 | 19 | 105 | 14 | 14 | 0 |
| D | 46 | 99 | 98 | 72 | 100 | 3 | 5 | 0 |
* Montmorillonite-illite type.
Table 3.
Brittleness indices in research literature considering the clay content.
| No. | Brittleness Measuring Formula | References | Remarks |
|---|---|---|---|
| 1 | or , : shear velocity and compressional velocity , : samples porosity, : clay weigth%, : shear modulus, : bulk modulus, ρ: samples density | [76] | Clay content reduces the wave propagation velocity, which means lower shear modulus and greater ductility. |
| 2 | : quartz weight%, : clay(illite) weight% | [19] | Only consider one kind of clay mineral. |
| 3 | : quartz weight%, : carbon weight%, : clay weight% | [20] | Regard calcite and all clay minerals as ductile content. |
| 4 | : quartz weight%, Dol: dolomite weight%, Lm: limestone weight%, : total organic content weight%, : clay weight% | [79] | Consider dolomite to increase brittleness and organic matter to increase ductility. |
| 5 | = Mineral, a = specific brittleness factor, b = mineral distribution factor | [21] | Consider each mineral’s mechanical properties, and highlight the different effect of each clay mineral. |
| 6 | : Young’s modulus, λ: Poisson’s ratio | [69] | More accurate than E as the brittleness index, especially in clay-abundant shale formations. |
Table 4.
Previous and alternative treatments for wells in specific zones.
| Operation Stage | Time | Treatment Method | Gas Flow Rate |
|---|---|---|---|
| 1 | The 1960s | Water-based fracturing fluid | The best zone flow was 1.9 MMSCF/D;
the average (total) flow rate was 5.5 MMSCF/D. |
| 2 | The 1980s | Perforated completion and acidulation | Disappointingly low |
| 3 | The 1980s | Perforated, acidized and then water-based fracturing fluid | Flow rate is low at first, decreased by 50% after acidulation and by 80% after fracturing |
| 4 | The 1990s | Water-based gel fracturing fluid (Borate cross-linked gel) | 1.4 MMSCF/D |
| The late 1990s | A clean-up remedial treatment using liquid CO2 | Maximum flow rate was 3.2 MMSCF/D and average was 2.2 MMSCF/D |
© 2017 by the authors. Licensee MDPI, Basel, Switzerland. This article is an open access article distributed under the terms and conditions of the Creative Commons Attribution (CC BY) license (http://creativecommons.org/licenses/by/4.0/).
Share and Cite
MDPI and ACS Style
Zhang, C.; Pathegama Gamage, R.; Perera, M.S.A.; Zhao, J. Characteristics of Clay-Abundant Shale Formations: Use of CO2 for Production Enhancement. Energies 2017, 10, 1887. https://doi.org/10.3390/en10111887
AMA Style
Zhang C, Pathegama Gamage R, Perera MSA, Zhao J. Characteristics of Clay-Abundant Shale Formations: Use of CO2 for Production Enhancement. Energies. 2017; 10(11):1887. https://doi.org/10.3390/en10111887
Chicago/Turabian StyleZhang, Chengpeng, Ranjith Pathegama Gamage, Mandadige Samintha Anna Perera, and Jian Zhao. 2017. "Characteristics of Clay-Abundant Shale Formations: Use of CO2 for Production Enhancement" Energies 10, no. 11: 1887. https://doi.org/10.3390/en10111887
Note that from the first issue of 2016, this journal uses article numbers instead of page numbers. See further details here.