1. Introduction
Hydropower is an important source of renewable energy, accounting for approximately 16% of the world’s energy and over 80% of the world’s renewable energy [
1]. In 2016, the U.S. Department of Energy reported that within the United States, there is approximately 101 gigawatts (i.e., GW, 1 billion watts) of deployed hydropower capacity and there is potential for up to 50 gigawatts of new capacity that could be developed by 2050 [
2]. Opportunities to add hydropower capacity exist at powered and non-powered dams, canals and conduits, and undeveloped stream reaches. In practice, however, fulfilling these opportunities in a sustainable fashion can be complicated by various factors such as adverse environmental effects and related mitigation requirements. For example, entrained fish can be injured or killed during turbine passage [
3,
4,
5,
6]. Therefore, regulatory requirements for hydropower often include measures (e.g., fish bypass systems, fish friendly turbines, special dam operations, etc.) to minimize fish injury and mortality rates [
7,
8]. Appraising and meeting these requirements increase the costs hydropower project developers, owners, and operators must pay. To increase the role of hydropower as an environmentally sustainable and renewable energy source, developers and regulators need proven, science-based, integrative technologies for characterizing hydraulic conditions and impacts to fish at hydro-structures (e.g., turbines and spillways).
The sensor fish (SF) is an advanced technology for measuring pressure, three-dimensional (3D) linear accelerations, 3D rotational velocities, and 3D orientation in situ at a sample rate of 2048 Hz while the device is entrained in the flow through a hydro-structure [
9,
10]. The SF was designed to have a size and density similar to a yearling salmon smolt—with a diameter of 24.5 mm, length of 89.9 mm, and a weight of 42.1 g—and a nearly neutrally-buoyant body in freshwater. In a calm hydraulic environment, a live fish can change its orientation in response to flow. However, in a more severe hydraulic environment, such as when a fish enters the fast moving and turbulent conditions within a turbine, little is known about its ability to sense and avoid obstacles or compensate for changes in density related to the changes in pressure. As a result, the current practice is to assume that fish behave as passive neutrally-buoyant objects [
4]. Laboratory experiments involving live fish can be performed to develop dose–response relationships that then are used to correlate with the measurements collected by SF, thus allowing researchers to understand how hydraulic conditions affect fish. Studies using SF technology require careful planning and execution. Typically, the data sets are large, require intensive signal processing, and produce a diverse suite of measured and derived properties. Until recently, engineers used different applications to accomplish the tasks, an approach that can potentially affect the integrity of the data or introduce inconsistencies because the data are not centralized.
To efficiently and scientifically design SF field studies, process the raw data, and analyze the processed data, we developed a standardized toolset, called the Hydropower Biological Evaluation Toolset (HBET) (Version: 1.0., Pacific Northwest National Laboratory, Richland, WA, USA). The objectives of HBET are to facilitate SF studies focused on characterizing hydraulic conditions and to apply SF data for evaluating impacts to fish from passage through hydro-structures. To date, SF and HBET have been used to conduct studies on numerous hydraulic structures throughout the world, including Australia, Germany, Laos, and the United States. The hydraulic structures studied include turbine units [
10,
11,
12], spillways [
13], weirs, and fish passage systems.
HBET allows users to design new studies, analyze data, perform statistical analyses, and evaluate predicted biological responses. HBET can be used by researchers, turbine designers, hydropower operators, and regulators to evaluate hydro-structures for the goal of enhancing environmental sustainability in a cost-effective manner. In this paper, we discuss the technical methodologies and algorithms implemented in the toolset and describe a case study that illustrates its usability.
2. Program Description
HBET is an integrated suite of science-based tools with a user-friendly interface and a remote-accessible database (
Figure 1). It uses hydraulic characterization data collected in situ with SF to predict impacts to fish from entrainment through turbines or other hydro-structures at new or rehabilitated hydropower plants. The ‘data analysis’ portion of the toolset analyzes SF data to identify events, such as strike or shear events that could injure fish. In the ‘evaluation of biological response’ portion of the toolset, existing dose–response relationships [
14,
15], and those currently under development, can be used to understand how events of interest can affect fish. Methodologies to determine the relationship between the sample size (i.e., the number of SF releases) and the precision of the measurements are implemented in the ‘design new study’ portion of the toolset, which enables users to design SF studies to meet specific objectives.
HBET, along with another program named the biological performance assessment tool (BioPA) [
16], belong to a larger toolset known as the Biologically-Based Design and Evaluation of Hydropower Turbines. Both HBET and BioPA can provide estimates of the levels and types of forces fish are predicted to encounter in turbines. However, utilizing hydraulic dose data attained from direct measurements, HBET can be used to evaluate existing hydropower structures; while using data from computational fluid dynamics models, BioPA, is more commonly used in turbine design. If validated with biological field data, both capabilities can be cost-effective alternatives to live fish field studies when investigating fish injury and mortality.
2.1. Data Analysis
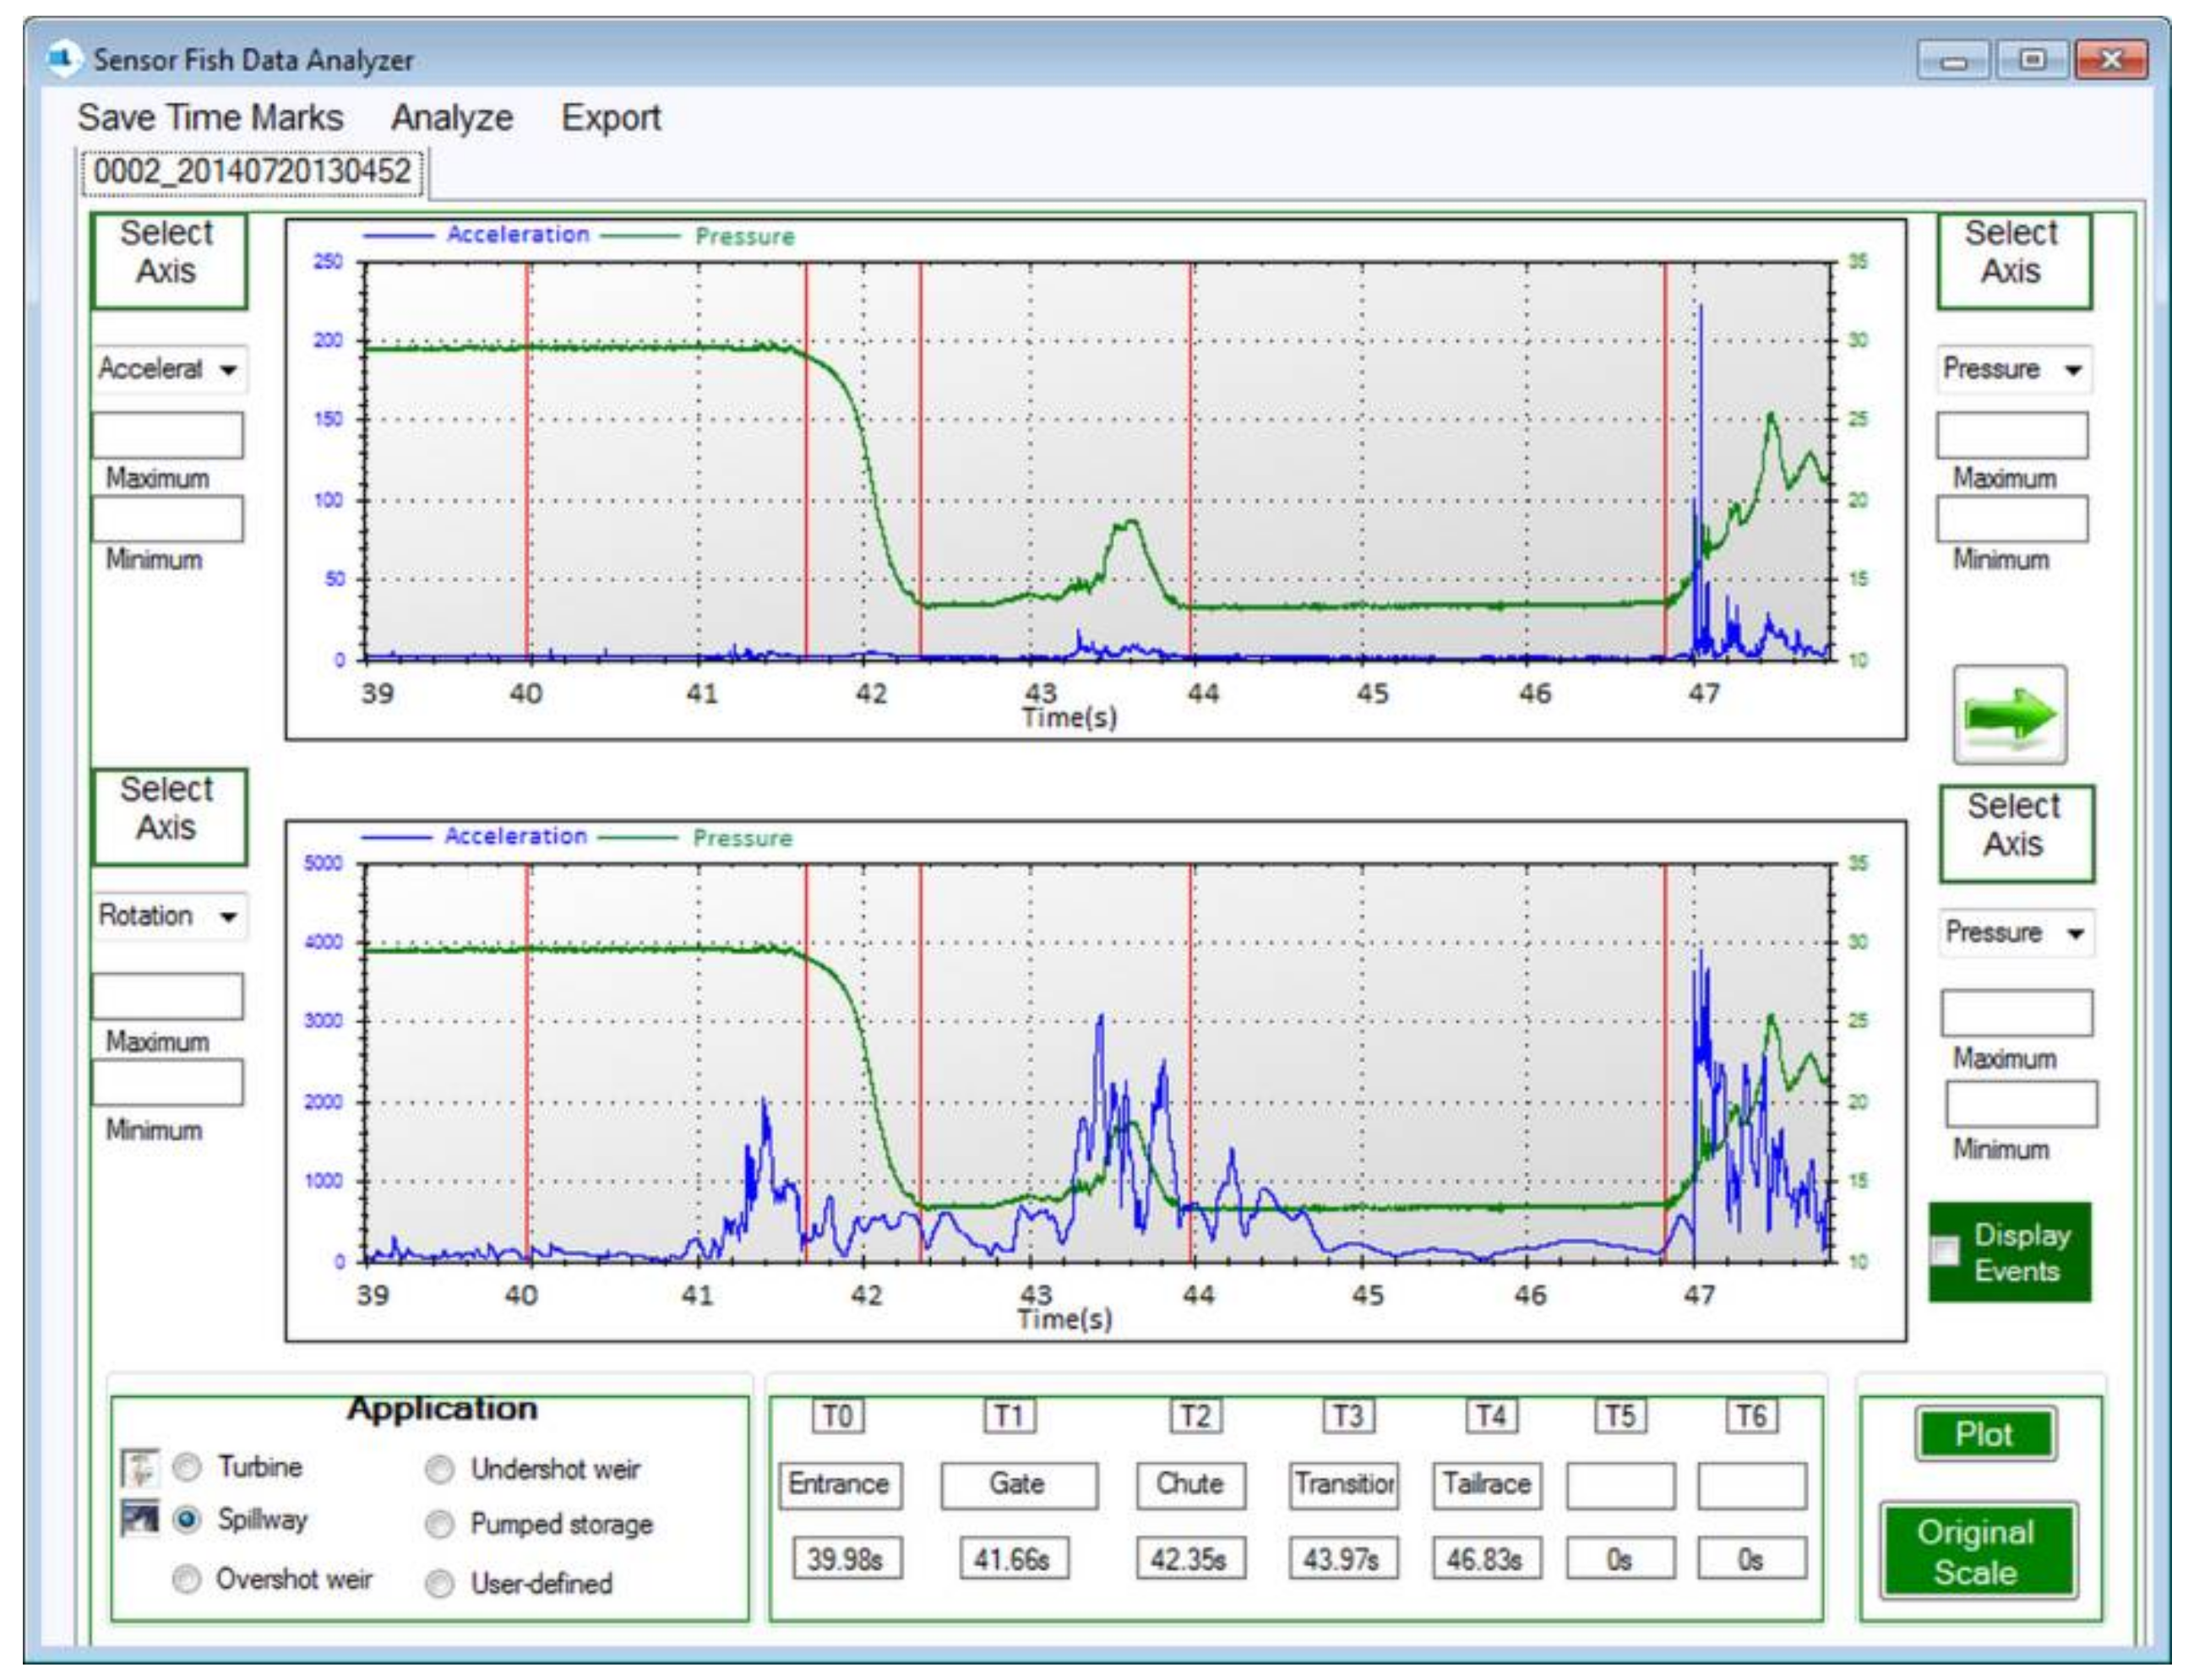
Measurements collected by SF are saved in a binary format and must be converted to physical units using calibration coefficients determined for each specific SF. By converting raw sensor data to physical units, a data set of time histories for pressure, 3D acceleration, and 3D rotational velocity is generated. These data are analyzed to obtain events of interest that characterize the hydraulic environment and also can be used to correlate events with live fish injuries. Users can examine the plots of pressure, acceleration magnitude, and rotational velocity magnitude (
Figure 2) and, using distinct characteristics within the data, define timing markers within the plots to divide the whole SF data set into separate regions. These distinct timing markers define the boundary of each region for each data file, and the corresponding data subsets in each region can be analyzed separately.
After dividing the data into different regions, acceleration data is processed to reveal high acceleration events based on the following three conditions: (1) the associated acceleration value is no less than 25 g; (2) the data point is a peak; (3) no higher amplitude event that occurred within 0.00375 s. The HBET analysis begins by creating a list, sorted from the highest to lowest, of acceleration magnitude peaks with acceleration values ≥ 25 g. Starting with the first peak in the list (i.e., the largest acceleration), a list of events is generated based on the three conditions described above. The severity of each event is defined by the acceleration value. A slight event has a magnitude between 25 and 50 g, medium events are in the 50 to 95 g range, and severe events have magnitudes of ˃ 95 g. To determine if an event is attributable to either strike or shear, a term called ‘peak duration’ is calculated. Peak duration is defined as the time gap between two data points that have an acceleration value equal to 70% of the corresponding peak value. If the peak duration is no less than 0.0075 s, the event is considered a shear event, otherwise it is a strike event [
9]. Acceleration events then are assigned to corresponding passage regions based on the timing marks created. If the SF study involved releasing SF through a turbine, the pressure data set also is analyzed. HBET extracts the nadir (i.e., the lowest) pressure experienced during passage through the turbine runner region. Both nadir pressure and acceleration events are used to evaluate the biological response to provide estimates of live fish injury and mortality rates.
2.2. Evaluation of Biological Response
The evaluation of biological response (EBR) feature of HBET is designed to use dose–response relationships developed from laboratory experiments that relate injury or mortality of fish to stressors (i.e., strike, barotrauma, shear, or turbulence). The current version of the software includes only dose–response relationships for major and mortal injuries. The first type of dose–response relationship involves mortal injuries resulting from barotrauma (i.e., injuries related to the rapid decompression that occurs during turbine runner passage) [
14,
15,
17]. The second type of dose–response relationship relates major injuries resulting from the shear stressor (i.e., fish moving from region of slow moving water to fast moving water) [
18]. Currently, the barotrauma dose–response relationships have been generated for juvenile Chinook salmon (
Oncohynchus tshawytscha), juvenile Australian bass (
Percalates novemaculeata), juvenile Gudgeon (
Hypseleotris spp.), Murray cod (
Maccullochella peelii), and Silver perch (
Bidyanus bidyanus). Ongoing laboratory experiments are being conducted to expand the dose–response relationships to include additional species and to develop new dose–response relationships for other stressors such as blade strike and turbulence. To operate the EBR feature in HBET, users first use the ‘data query’ tool to get the desired data set. HBET then uses the dose–response relationships described in the following sections to calculate the probability of barotrauma mortal injury and shear major injury.
2.2.1. Barotrauma Mortal Injury
An important parameter for turbine passage that can be computed using SF measurements is nadir pressure. Controlled laboratory experiments have been conducted to expose juvenile Chinook salmon, juvenile Australian bass, juvenile Gudgeon, juvenile Murray cod, and juvenile Silver perch to simulated turbine passages to develop dose–response relationships between the ratio pressure change and the probability of mortal injury [
14,
15,
17,
19]. The relationship established is based on the logarithmic pressure change (
LRP) between the pressure to which the fish is acclimated to prior to turbine passage (
PA) and the nadir pressure (
PN). The
LRP can be calculated using Equation (1)
By knowing the
LRP, the probability of mortal injury (
Pmort) can be estimated using Equation (2) [
14,
15,
17].
The values for the coefficients in Equation (2) depends on the species studied (
Table 1).
The acclimation pressure involved in computing the
LRP is based on the volume of gas within the swim bladder of a neutrally-buoyant fish [
20]. The current understanding is that acclimation pressure (i.e., depth) is determined by the depth at which the fish resided most often prior to approaching the upstream face of the dam [
21]. This depth typically is determined by performing telemetry or acoustic imaging studies.
To apply the barotrauma dose–response relationship using the HBET, the user first uses the ‘data query’ tool to select the SF releases they wish to use for the analysis. The user then specifies the type of study that was conducted (i.e., spillway or turbine), the species of interest (e.g., juvenile Chinook salmon, juvenile Australian bass, etc.), and an estimate of the acclimation depth. If the study type selected was turbine, then Equation (2) will be applied to the nadir pressure measurements obtained from the SF releases selected to determine the probability of mortal injury due to barotrauma.
2.2.2. Shear Major Injury
Using the acceleration measurements obtained by SF it is possible to identify occurrences of high acceleration amplitude and attribute these events to either strike or shear based on the temporal characteristics of the acceleration measurements. In a study conducted by Richmond et al. [
11,
14], both juvenile Chinook salmon and SF were exposed to shear flows in a test flume. The live fish and SF were introduced from still water into the edge of a flow jet at different flow speeds. After exposing each fish to the shear flow, the fish was each examined to assess the type and severity of any injuries. Major injuries were defined as those that were considered life-threatening, such as severe bruising, bleeding, tearing, creasing, multiple injuries, prolonged swimming impairment, disorientation, or loss of equilibrium. These major injury occurrences were correlated with the SF acceleration measurements to develop a dose–response relationship that predicts the probability of major injury based on SF acceleration measurements.
The process for applying the shear dose–response relationship in HBET is similar to the process for obtaining the pressure dose–response relationship. HBET will extract acceleration events (i.e., events ≥ 25 g) attributed to shear for each SF release. The values of these acceleration events then are applied to the dose–response relationship to determine the probability of a major injury due to shear.
2.3. Design New Study
The ‘design new study’ portion of HBET aims to develop testable hypotheses and to determine experimental designs, which enable detailed consideration of hydro-turbine design and operational elements affecting the turbine’s biological performance during the design phase of new hydro-turbine construction or rehabilitation. Existing SF studies are considered when designing new studies. HBET allows operators to select parameters that should be used for the study (e.g., nadir pressure). HBET provides two methods for calculating sample size and two methods for designing a new study. The two sample size methods are ‘precision’ and ‘detectable difference’, and the two methods to design a new study are ‘sample size for a given precision/difference’ and ‘precision/difference for a given sample size’. The algorithms for each sample size method and study design method are discussed in the following subsections.
2.3.1. Precision and Sample Size
This option is used to determine the precision that can be achieved based on a chosen sample size for selected parameters such as nadir pressure and percentage of shear events. HBET uses the following equations to perform the calculation. Sample sizes for SF releases are based on the precision in estimating a mean response
. Precision is defined in terms of relative precision
where
is the population mean,
is the defined precision, and
α is the significance level. Equation (3) specifies that the relative error in estimation (i.e.,
) should be less than
, (
1 − α) 100% of the time. For example, we may wish to estimate the sample mean within ± 10% of the true value (i.e.,
, 95% of the time (i.e.,
= 0.05). Asymptotically,
where
in a standard normal deviate (e.g.,
= 1.96) and
CV is the coefficient of variation. In the case of a sample mean, the equation will be
2.3.2. Precision and Precision/Difference
This option is used to calculate the minimum sample size needed to achieve the given precision of selected parameters. The algorithm used for this option is the same as the one used for precision and sample size, but in the reverse direction. Therefore, based on Equation (5), the following equation is used to determine the sample size
2.3.3. Detecting Difference and Sample Size
This option is used to determine the sample size based on the statistical power to detect a given change of a selected parameter. The statistical power will be determined by referring to an existing relationship with the closest matching hydraulic conditions, such as application type and total discharge. Basically, this option can be used to calculate the sample size needed to achieve the difference of the given value of the selected parameter over an existing relationship. To accomplish this, HBET uses an algorithm reported by Zar [
22]. The minimum sample size (
n) when the treatment means differ by a value of ∆ can be calculated as
where
α is the significant difference level (one-tailed);
1 − β is the statistical power;
= under Ha;
= common variance among observations;
= t-statistic with degrees of freedom at -level, one-tailed;
= t-statistic with degrees of freedom at -level, one-tailed.
The calculated value of n is the sample size for each treatment. Equation (7) must be used iteratively because the sample size is implicitly represented on both sides of the equation.
2.3.4. Detecting Difference and Precision/Difference
This option is used to determine the resulting precision or the statistical power needed to detect a given change of a selected parameter for the given maximum sample size. The underlying algorithm is the same as used for ‘detecting difference and sample size’, but in the reverse direction. Therefore, Equation (7) is arranged to calculate statistical power for a given sample size (n) at a pre-specified α level where
Equation (8) is used to calculate directly and where a t-distribution with degrees of freedom is used to determine
2.4. Extensibility
HBET was built using a modular based design that allows flexibility to develop new modules. Analyzed data can be used to validate the accuracy of dose–response relationship between SF measurements and injuries of new species of live fish. Once the dose–response relationship for new species of fish is established, a new module can be created and plugged into the toolset. Measurements from tools other than SF (e.g., acoustic telemetry) also can be incorporated into HBET.
3. Case Study: Turbine Evaluation for Hydraulic Characterization
During 2016, an SF study was conducted at Nam Song Dam, which is located on the Nam Song River in Vientiane, Lao PDR, approximately 3.7 river kilometers from the Nam Ngum reservoir. The dam was constructed in 2005 to divert water from the Nam Song River to Nam Ngum reservoir to increase the generating capacity at Nam Ngum Dam. In 2010, a project to add hydroelectric generating capacity to Nam Song Dam was completed. Three horizontal Kaplan turbine units from ANDRITZ HYDRO were installed. Each of these turbine units have a generating capacity of 2 megawatts (i.e., MW, 1 million watts), which translates to an annual production of 25 gigawatt hours (i.e., GWh, 1 billion watt hours).
The runners have a diameter of 2.8 m, four blades, and operate at a speed of 130 revolutions per minute (rpm). This study was conducted to gain information about the hydraulics in existing dams in the Lower Mekong Basin by collecting in situ measurements of forces and motions that fish are exposed to during turbine passage.
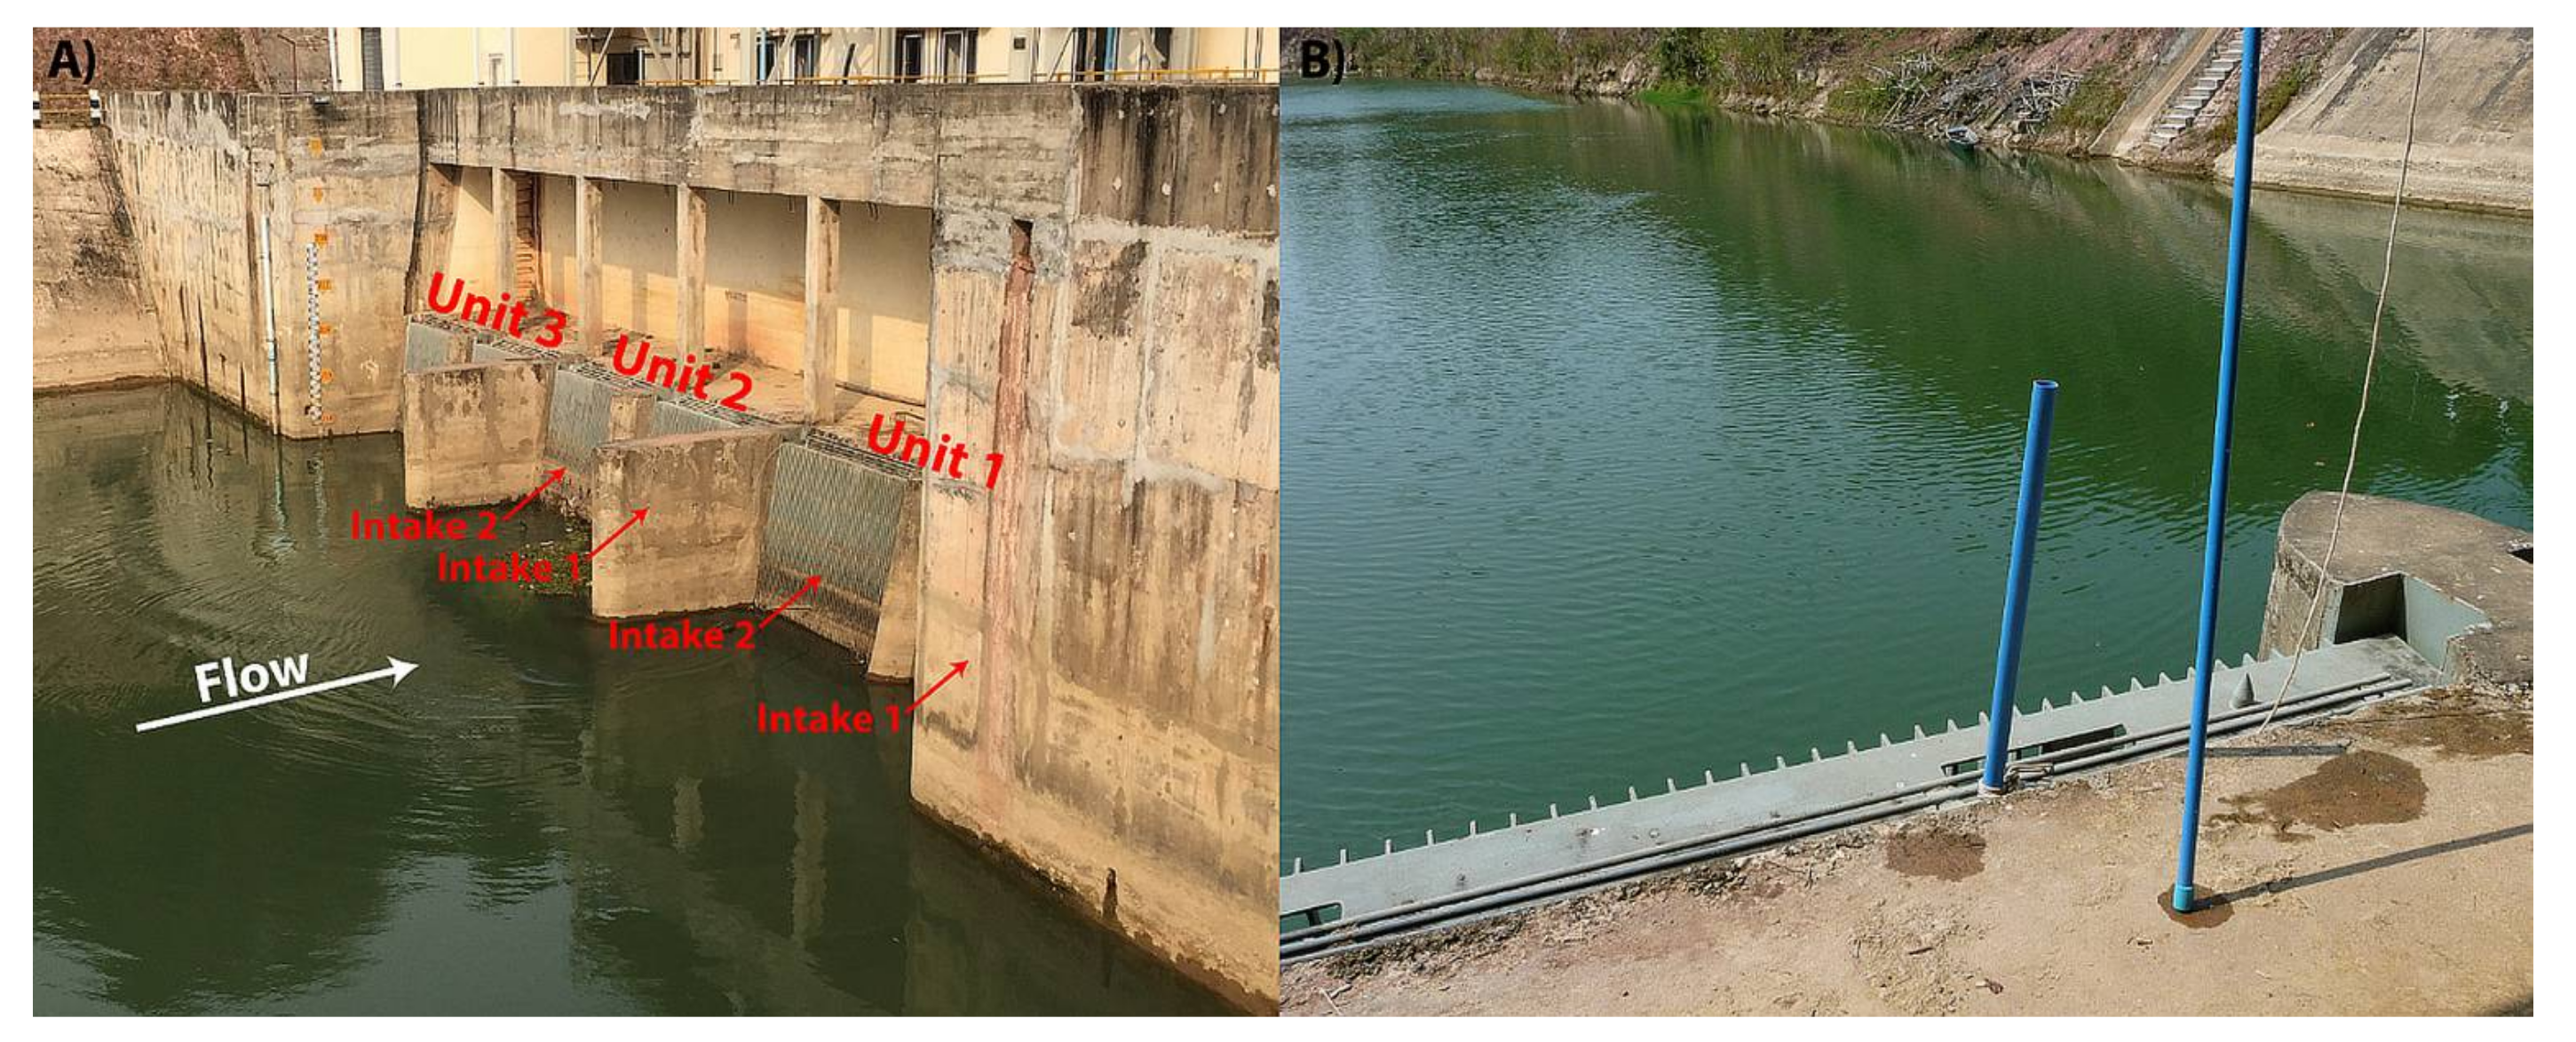
SF were released into Units 1 and 2 of Nam Song Dam (
Figure 3A) in multiple lateral and vertical locations. During testing, the dam operating conditions remained steady. The forebay elevation was 213.8 m, the tailwater elevation was 207.2 m (hydraulic head of 6.6 m), the Unit 1 discharge was 16.4 m
3/s, and the Unit 2 discharge was 11.3 m
3/s.
SF were introduced into the turbine intake through a release pipe composed of two 10-m sections of 38-mm diameter Polyvinyl chloride (PVC) pipes joined together with adhesive and reinforced with sections of bamboo attached at the joint. The PVC pipe was routed through the downstream side of the trash rack (
Figure 3B). To ensure that the SF exited the release pipe, a capped 19-mm PVC pipe was used as a plunger. After passage, the SFs released a weight on both sides and became positively buoyant. A built-in radio-frequency transmitter and four high-intensity orange light-emitting diodes were activated to assist the recovery. A total of 103 valid SF data sets were obtained at Nam Song Dam during February 2016, which was 90% of the releases.
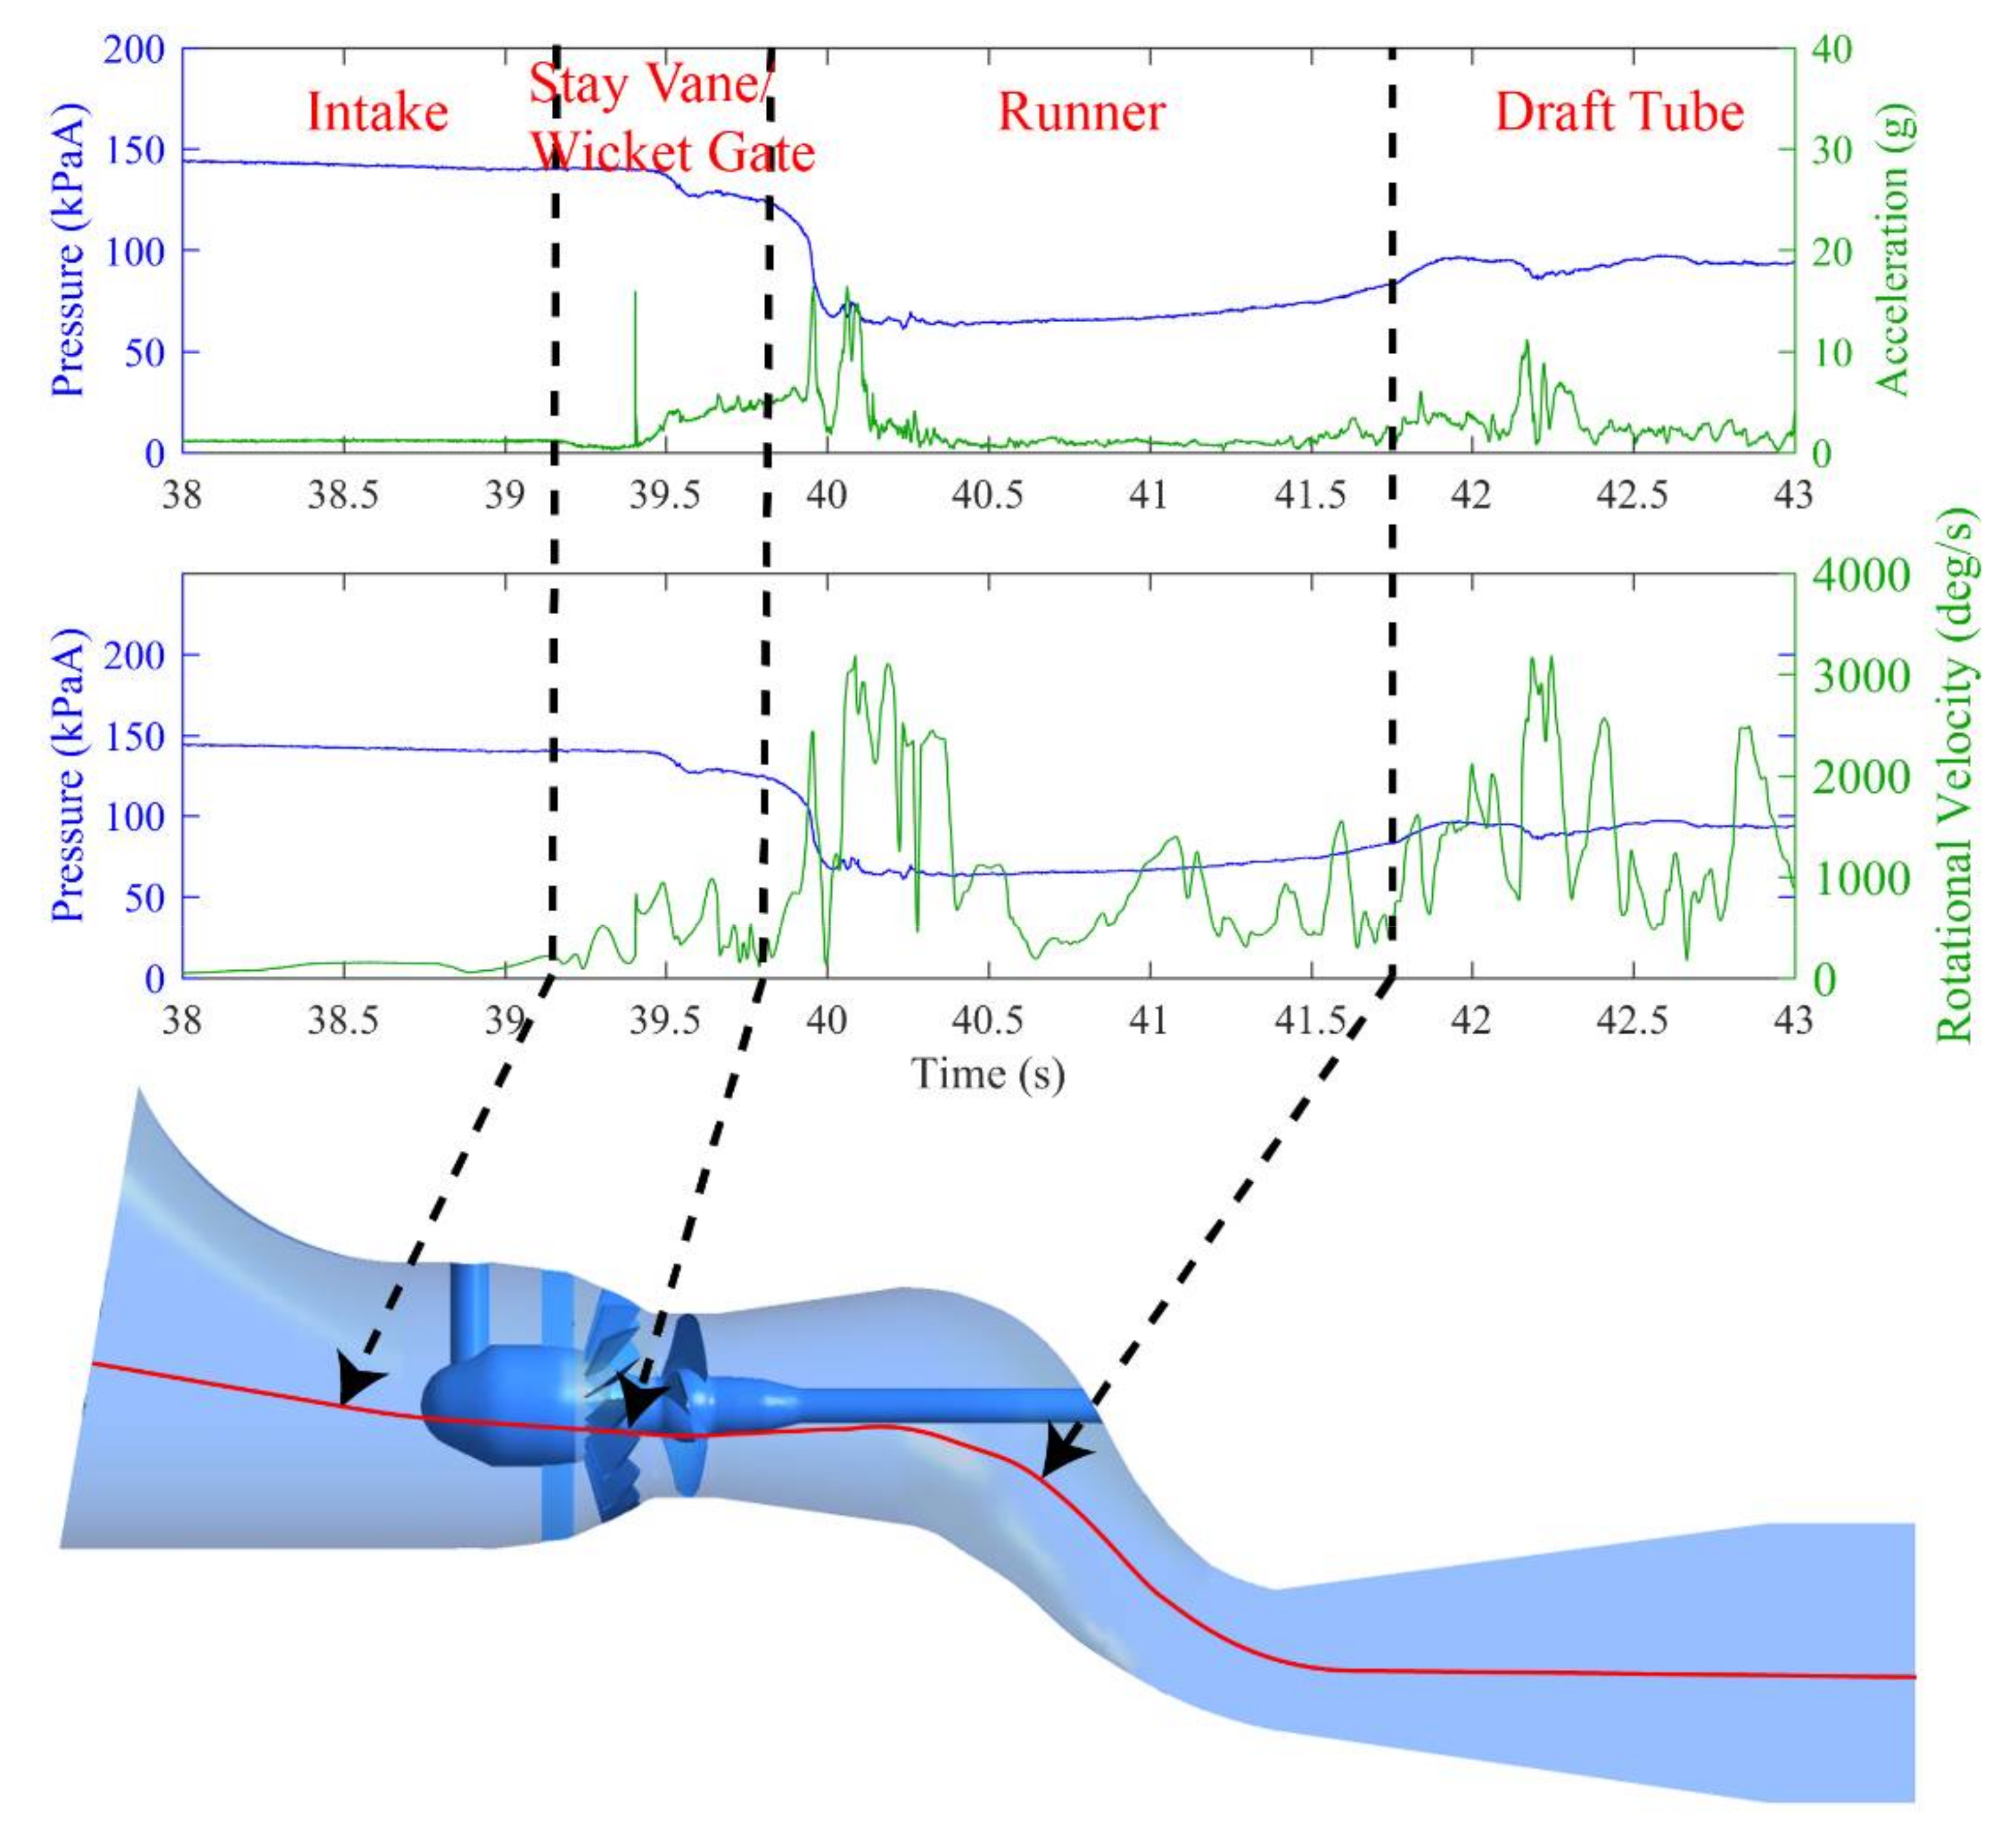
Features in pressure time histories, and to a lesser extent the acceleration and rotational velocity time histories, permit the data to be divided into segments corresponding to specific regions of passage, from the induction system to exit into the tailrace. The regions of interest for passage through the turbine are identified below and shown in
Figure 4:
Intake Region: From the release pipe terminus to the entrance to the stay vanes.
Stay Vane/Wicket Gate Region: From the upstream side of the stay vanes to the downstream side of the wicket gates.
Runner Region: From just downstream of the wicket gates to downstream of the runner blades. Given the hydraulic environment of a horizontal Kaplan turbine, we found that it is possible for the nadir pressure value to occur at a point in the draft tube shortly after the runner passage. In addition, if a SF passes the runner above the centerline, it is possible for it to strike the runner shaft. For these reasons the runner region was extended further into the draft tube than it would be for a vertical Kaplan turbine.
Draft Tube Region: From just after runner passage to the draft tube exit.
Tailrace Region: From draft tube exit into the tailrace.
Nam Song Dam was the first dam with horizontal Kaplan turbine units that was been studied using SF, but SF have been used to measure the hydraulic environment of multiple dams utilizing vertical Kaplan turbines. In 2005, a turbine evaluation study using SF was performed at Wanapum Dam (WAN) to characterize the environment of the original turbine unit (Unit 9) along with an advanced turbine design (Unit 8) that was planned to replace existing units [
11]. The results from Nam Song Dam also were compared with two smaller-scale studies conducted in the lower Columbia River in 2005; one at John Day Dam (JDA) and another at the Bonneville Dam (BON) second powerhouse (B2) [
23]. These studies served to collect information regarding pressure changes experienced by fish passing through these turbines. Information gathered from the studies at JDA and BON were used to expose juvenile salmonids, as well as other species of interest, to simulated turbine passage in a laboratory environment to develop dose–response relationships for barotrauma injuries resulting from turbine passage [
15]. This is very similar to how the data set collected from Nam Song Dam will be used to study species of interest in the Lower Mekong Basin.
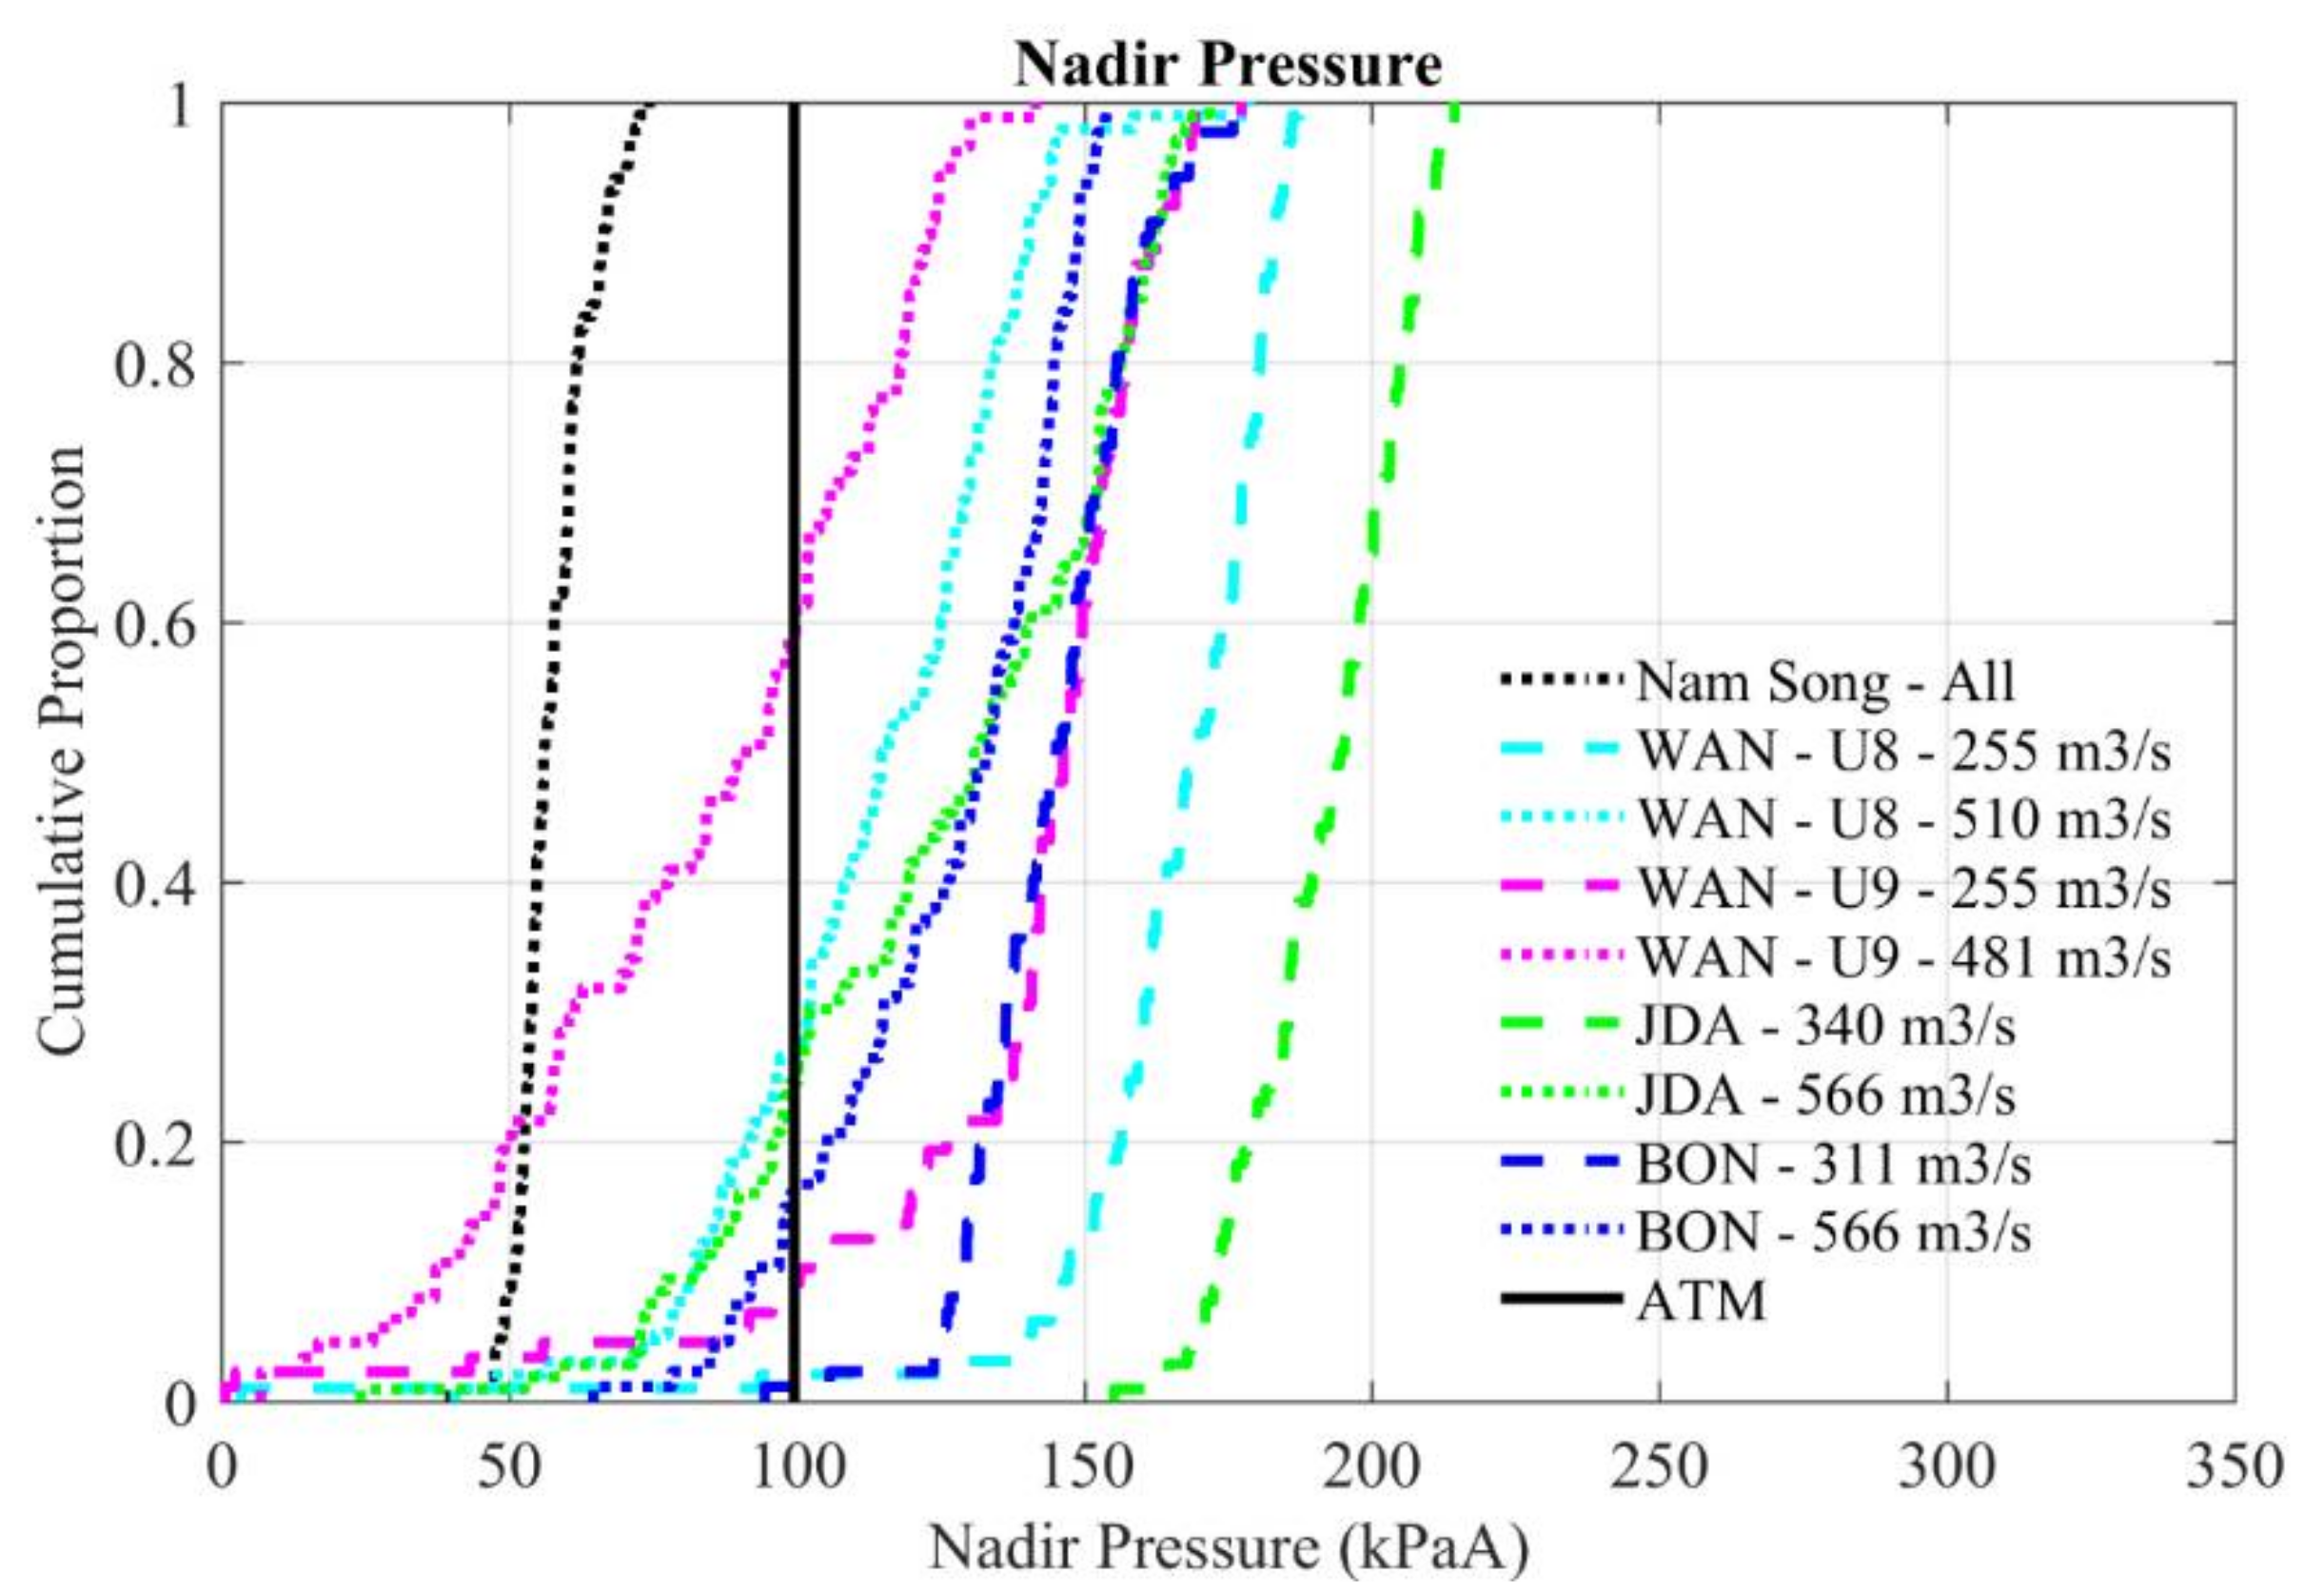
The nadir pressure cumulative distribution functions are shown in
Figure 5. The median nadir pressure value was 56.1 kPaA. The cumulative distribution functions of the nadir pressure values at Nam Song Dam were compared with other larger Kaplan turbines that were studied using SF. When compared with the other dams, the nadir pressure values at Nam Song Dam were lower and had a narrower range of nadir pressure values.
When fish pass through a turbine, the ratio between the pressure (i.e., depth) to which the fish acclimated prior to entering the turbine (i.e., the volume and pressure of gas in the swim bladder) and the nadir pressure has a direct effect on the probability of barotrauma injury. For fish that have acclimated to the same depth, the fish that experiences the lower nadir pressure is more likely to experience barotrauma injury. Given that the entire nadir pressure distribution at Nam Song Dam is lower than atmospheric pressure, any fish that are susceptible to barotrauma injury could potentially experience barotrauma effects regardless of the acclimation depth. For this reason, it is important to perform laboratory experiments on the species of interest that pass through Nam Song Dam to understand how susceptible each species is to barotrauma so the actual predicted effect of the nadir pressures on these fish can be understood.
For each release, we identified the occurrence of severe acceleration events attributed to either collision/strike or shear. The proportion of SF that experienced at least one severe event in each region, as well as the complete turbine passage as a whole, was computed (
Table 2). At Nam Song Dam, no severe events occurred in the intake region and only 2% of releases had severe events in the draft tube region. Overall, the majority of the severe events occurred in the stay vane/wicket gate and runner regions, with the most of the events being attributed to collision. With respect to proportion, type, and region, the occurrence of severe events at Nam Song Dam was found to be similar to the other dams utilizing Kaplan turbines.
4. Conclusions
HBET is a set of science-based design and evaluation tools that were developed in collaboration with the hydropower industry, the regulatory community, and natural resource managers to integrate state-of-the-art technologies to optimize the biological performance of hydro-turbines, spillways, and other hydraulic structures and to reduce the associated regulatory processing time. The current implementation of HBET is designed to be used in conjunction with the SF device. The tools embodied in HBET assist in designing studies to test hypotheses, storing collected SF data in a centralized database, processing data to obtain quantitative measurements of hydraulic parameters, and using dose–response relationships developed in the laboratory to evaluate biological response to the hydraulic parameters. The SF and HBET have been used to collect high-fidelity and high-resolution data in situ to evaluate the physical and fish passage conditions of various hydraulic structures, including large- and small-scale hydro-turbines, spillways, irrigation canals, weirs, and fish bypass facilities.
Ongoing laboratory experiments are being conducted to develop additional dose–response relationships that can be applied to HBET. These experiments include increasing the number of species (such as American eel, Pacific lamprey, and American shad) that have been evaluated for existing dose–response relationships and developing new dose–response relationships for different stressors such as strike. Beyond incorporating new dose–response relationships, potential future upgrades being considered are importing data from other sources, including acoustic telemetry, balloon-tagged live fish studies, neutrally-buoyant particles in turbine models, and computational fluid dynamics models.


