Article

Effects of Pore Fluid Chemistry and Saturation Degree on the Fracability of Australian Warwick Siltstone

by
Mandadige Samintha Anne Perera
1,2,*,
Kadinappuli Hewage Suresh Madushan Sampath
1,
Pathegama Gamage Ranjith
2 and
Tharaka Dilanka Rathnaweera
2
1
Department of Infrastructure Engineering, The University of Melbourne, Building 176, Melbourne 3010, Australia
2
Deep Earth Energy Laboratory, Department of Civil Engineering, Monash University, Building 60, Melbourne 3800, Australia
*
Author to whom correspondence should be addressed.
Energies 2018, 11(10), 2795; https://doi.org/10.3390/en11102795
Submission received: 19 September 2018 / Revised: 11 October 2018 / Accepted: 16 October 2018 / Published: 17 October 2018
(This article belongs to the Collection Bioenergy and Biofuel)

Abstract

:
Fracability of unconventional gas reservoirs is an important parameter that governs the effectiveness of subsequent gas extraction. Since reservoirs are saturated with various pore fluids, it is essential to evaluate the alteration of fracability of varyingly saturated rocks. In this study, varyingly saturated (dry, water, and brine with 10%, 20% and 30% NaCl by weight) siltstone samples were subjected to uniaxial compressive loading to evaluate their fracability variation. Acoustic emission (AE) and ARAMIS photogrammetry analyses were incorporated to interpret the crack propagation. SEM analysis was carried out to visualize the micro-structural alterations. Results show that siltstone strength and brittleness index (BI) are reduced by 31.7% and 46.7% after water saturation, due to water-induced softening effect. High NaCl concentrations do not reduce the siltstone strength or brittleness significantly but may contribute to a slight re-gain of both values (about 3–4%). This may be due to NaCl crystallization in rock pore spaces, as confirmed by SEM analysis. AE analysis infers that dry siltstone exhibits a gradual fracture propagation, whereas water and brine saturated specimens exhibit a hindered fracturing ability. ARAMIS analysis illustrates that high NaCl concentrations causes rock mass failure to be converted to shear failure from splitting failure, which is in favour of fracability.

1. Introduction

With growing concerns about rising energy demands, the petroleum industry is turning to exploring new energy resources such as extraction of natural gas from geological reservoirs. Since conventional oil and gas resources fail to meet the increasing energy demand, exploration has been extended to unconventional gas reservoirs, including shale gas, coal seam gas and tight gas. Of the various unconventional reservoirs, shale, siltstone and sandstone are identified as natural gas-rich sedimentary rocks that have a higher potential for gas storage, and thus have been proven to be viable resources for effective gas extractions [1]. However, most of the unconventional gas reservoirs have ultra-low flow characteristics, in which a significant amount of the gas is stored in natural fractures and pores, or as an absorbed phase in organic materials [2]. Due to the ultra-low permeability, the stored gas is tightly trapped inside the reservoirs and therefore cannot be extracted with conventional gas production techniques, such as reservoir pore pressure depletion through pore water removal [3]. This indicates the necessity of using appropriate reservoir permeability enhancement techniques to produce an economically-viable amounts of gas from unconventional reservoirs. Some advanced techniques, including horizontal well drilling and hydraulic fracturing, are common enhancement applications currently used in the petroleum industry.
Throughout the last few decades, hydraulic fracturing has been widely used to enhance unconventional gas recovery [1,4,5,6]. During the hydraulic fracturing process, a suitable fracturing fluid like water or slick-water is injected through a wellbore, under sufficient pressure to create a network of fractures in the formation. New fractures are created, when the injecting fluid pressure exceeds the least principal stress acting on the formation [7]. These newly-created fractures connect with the natural fractures in the formation to form a fracture network connected to the wellbore [8]. However, the creation of an effective fracture network in the formation is largely dependent on the fracability of the formation, which in turn depends on the formation’s strength characteristics and brittleness properties [9,10,11,12]. Brittle rocks have better ability to be fractured by injecting fluids, because they only need to adsorb relatively less energy before failure [13]. In contrast, ductile rocks are hard to be fractured, as they tend to deform greatly without being fractured during the hydraulic fracturing process. Moreover, the rock mass tends to heal the fractures during the fracturing process due to the required high energy, which is not favourable in terms of the fracking process.
This indicates the importance of identifying the brittleness characteristics of unconventional reservoirs before proceeding with hydraulic fracturing. However, the identification and quantification of brittleness of a particular rock mass is quite complicated, as there is no universal method that is applicable for every rock type. Literature has defined the brittleness in various ways. For example, Hetenyi [14] defined a brittle material as a material which lacks ductility, and Ramsay [15] defined it as material with broken internal cohesion. The term brittleness index (BI) is often used to define and quantify the brittle nature of rock, in which a number of equations have been derived to quantify the brittleness in terms of various effective parameters [9,11]. Table 1 summarises some of the equations commonly used to quantify the brittleness. However, it should be noted that these brittleness indices have mainly been derived empirically, thus are applicable only under certain defined conditions.
According to Table 1, rock brittleness mainly depends on its mechanical characteristics, which are highly dependent on the rock mass composition, including mineral and organic matter content, and also on the pore fluid characteristics [26]. Unconventional reservoirs are normally saturated with water or brine with varying concentrations and their brittleness characteristics may therefore be quite different from those of dry reservoir rock masses. In general, the strength of rock mass reduces with pore fluid saturation, due to the softening effect and chemical interactions, which in turn affects the brittle characteristics of the rock mass [27,28]. This can possibly affect the fracability characteristics and ultimately the hydraulic fracturing process. Hence, a clear understanding on the variation of brittleness with pore fluid conditions is essential to assess the fracability and to define the effective controlling parameters of hydraulic fracturing process in unconventional gas reservoirs.

2. Methodology

In the present study, a series of mechanical tests was carried out to evaluate the effect of pore fluid saturation on the strength and brittleness of siltstone, which is one of the common rock types available in unconventional reservoirs [29]. Varyingly saturated (i.e., dry samples and samples saturated with brine with 0%, 10%, 20% and 30% of NaCl by weight) siltstone core samples were tested to determine the unconfined compressive strength (UCS), Young’s modulus, Poisson’s ratio and BI to interpret the mechanical and fracability characteristics. Acoustic emission (AE) and ARAMIS image analysis were used to evaluate the crack propagation/initiation and sample deformation, respectively. A scanning electron microscopy (SEM) analysis was done to assess the micro-structural alterations of saturated samples. The combined results were used to interpret the fracability characteristics of siltstone, and to provide an insight to understand its effect on hydraulic fracturing process.

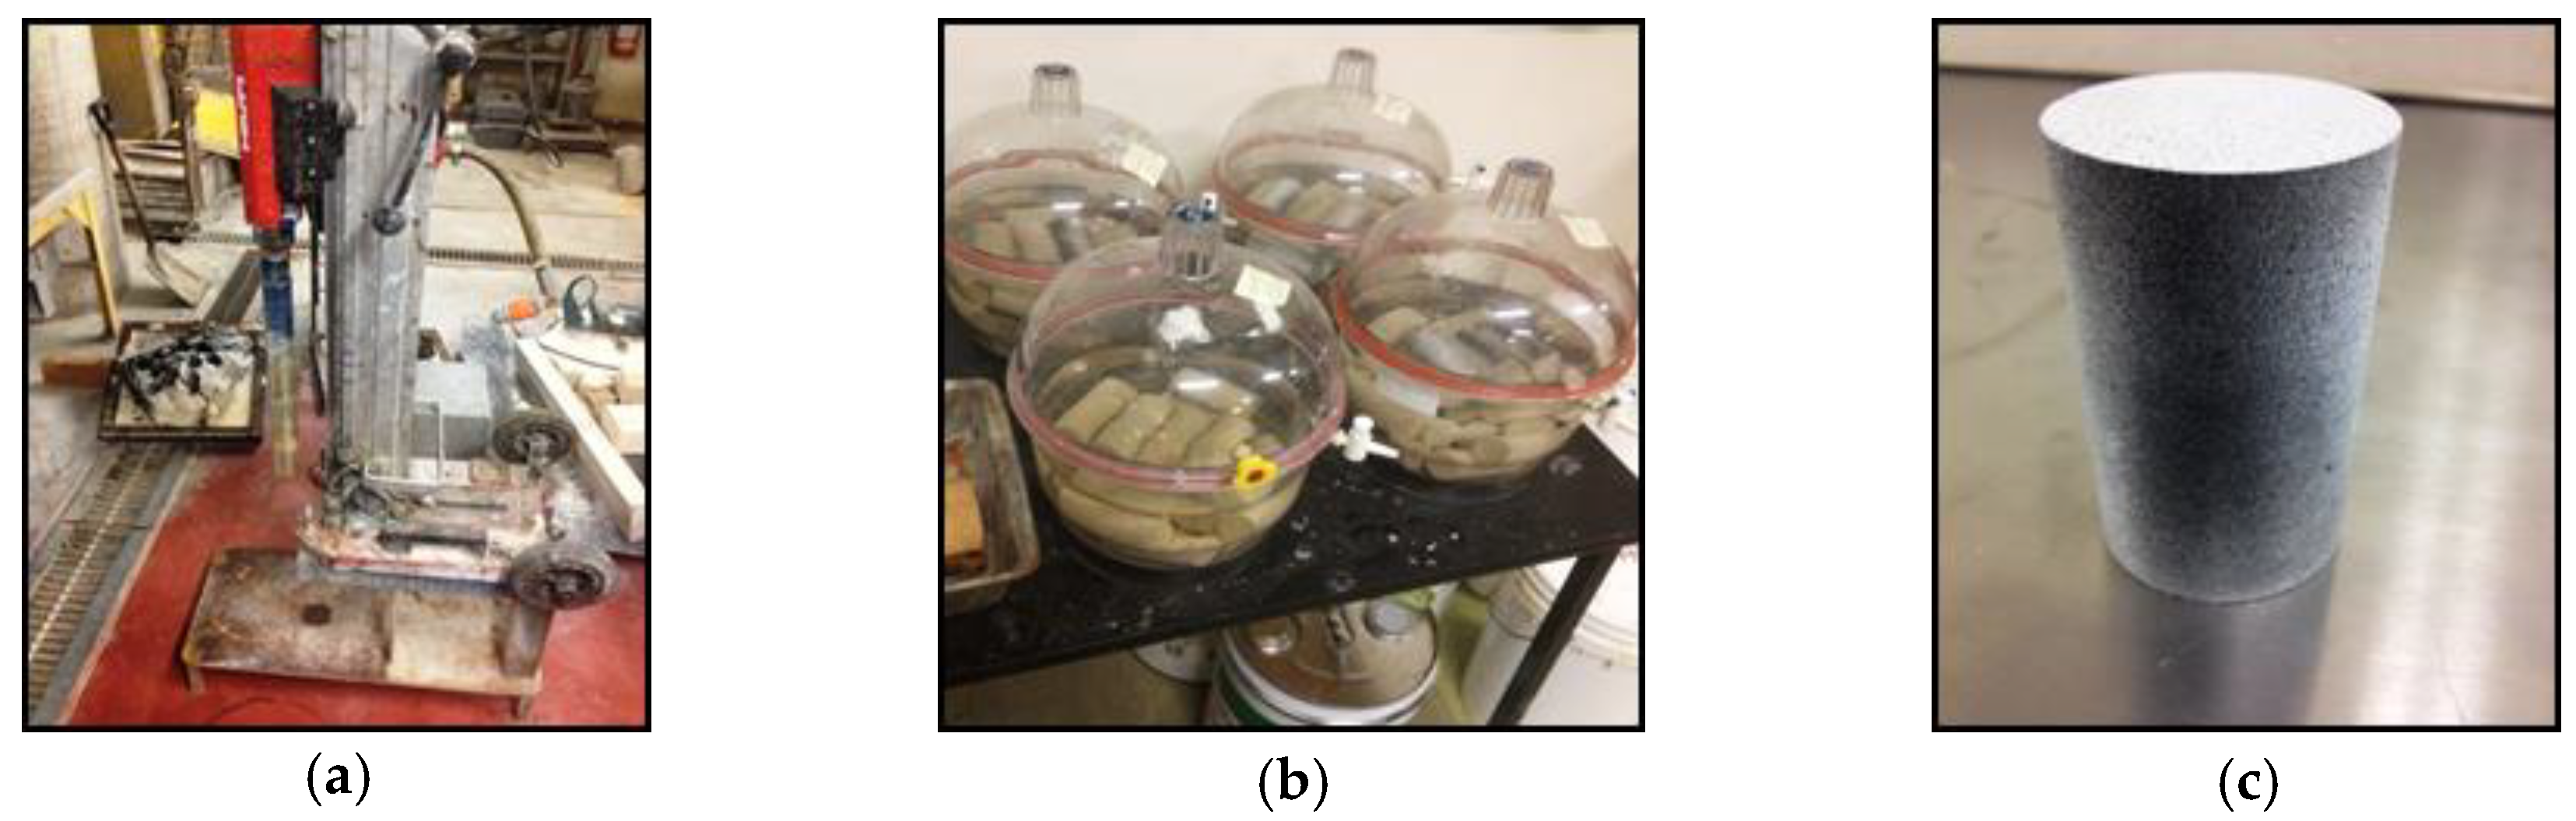
2.1. Sample Preparation

A block of siltstone was transported from Warwick (Queensland, Australia) to obtain the core samples required to perform the tests. The mineral composition of this particular siltstone mainly consists of quartz mineral bound with kaolinite clay minerals (42% and 40% quartz and kaolinite, respectively). The block was cored using a diamond drop-bit coring machine to obtain 38 mm diameter cores (see Figure 1a) and then cut into samples of 76 mm height using a diamond cutter. Both ends of the samples were ground to obtain flat and parallel surfaces. In order to check the effect of pore fluid saturation on the brittle characteristics of siltstone, samples were saturated under various pore fluid saturation conditions: dry, water and varyingly concentrated brine (i.e., 10%, 20% and 30% NaCl by weight). Saturation conditions in a large range were selected to simulate in-sit reservoir conditions and to clearly differentiate the results. The required dry condition was achieved by oven-drying the prepared samples at 60 °C for one week. A slow heating rate was used to avoid any thermal damage to the samples during heating. To achieve the fully saturated condition, samples were placed in vacuum chambers filled with the considered fluids (water and 10%, 20% and 30% brine solutions) and allowed for saturation for 40 days. Vacuum pumps were used to create the required vacuum in the chambers to ensure a better saturation (see Figure 1b). After saturation, the samples were carefully wrapped and stored in a fog room to avoid any moisture loss and the dry samples were wrapped and kept in a dry place to avoid any moisture addition to the samples from atmosphere. Prior to the strength tests, the samples were printed with speckle paint (see Figure 1c), as required by the ARAMIS analysis to study the strain development and cracking process in the samples during load application. Two samples from each condition were tested to get reliable results and the values were averaged to interpret the strength parameters. Hence, altogether 10 siltstone samples were tested in the experiment series.

2.2. Uni-Axial Compressive Strength Tests

UCS tests were carried out using the AG 9 UCS machine (Shimadzu, Tokyo, Japan) in the Deep Earth Energy Research Laboratory (DEERL) in Monash University Civil Engineering Department (see Figure 2). The axial compression load was applied on the samples at a 0.1 mm/min strain rate and the application of compression load on the sample over time was observed and recorded. The stress-strain behaviour obtained from data acquisition system was used to determine the Young’s modulus and Poisson’s ratio of all tested samples. Young’s modulus was determined as the average slope of the straight-line part of each stress-strain curve and Poisson’s ratio was determined by dividing the lateral strain by axial strain at the same stress.

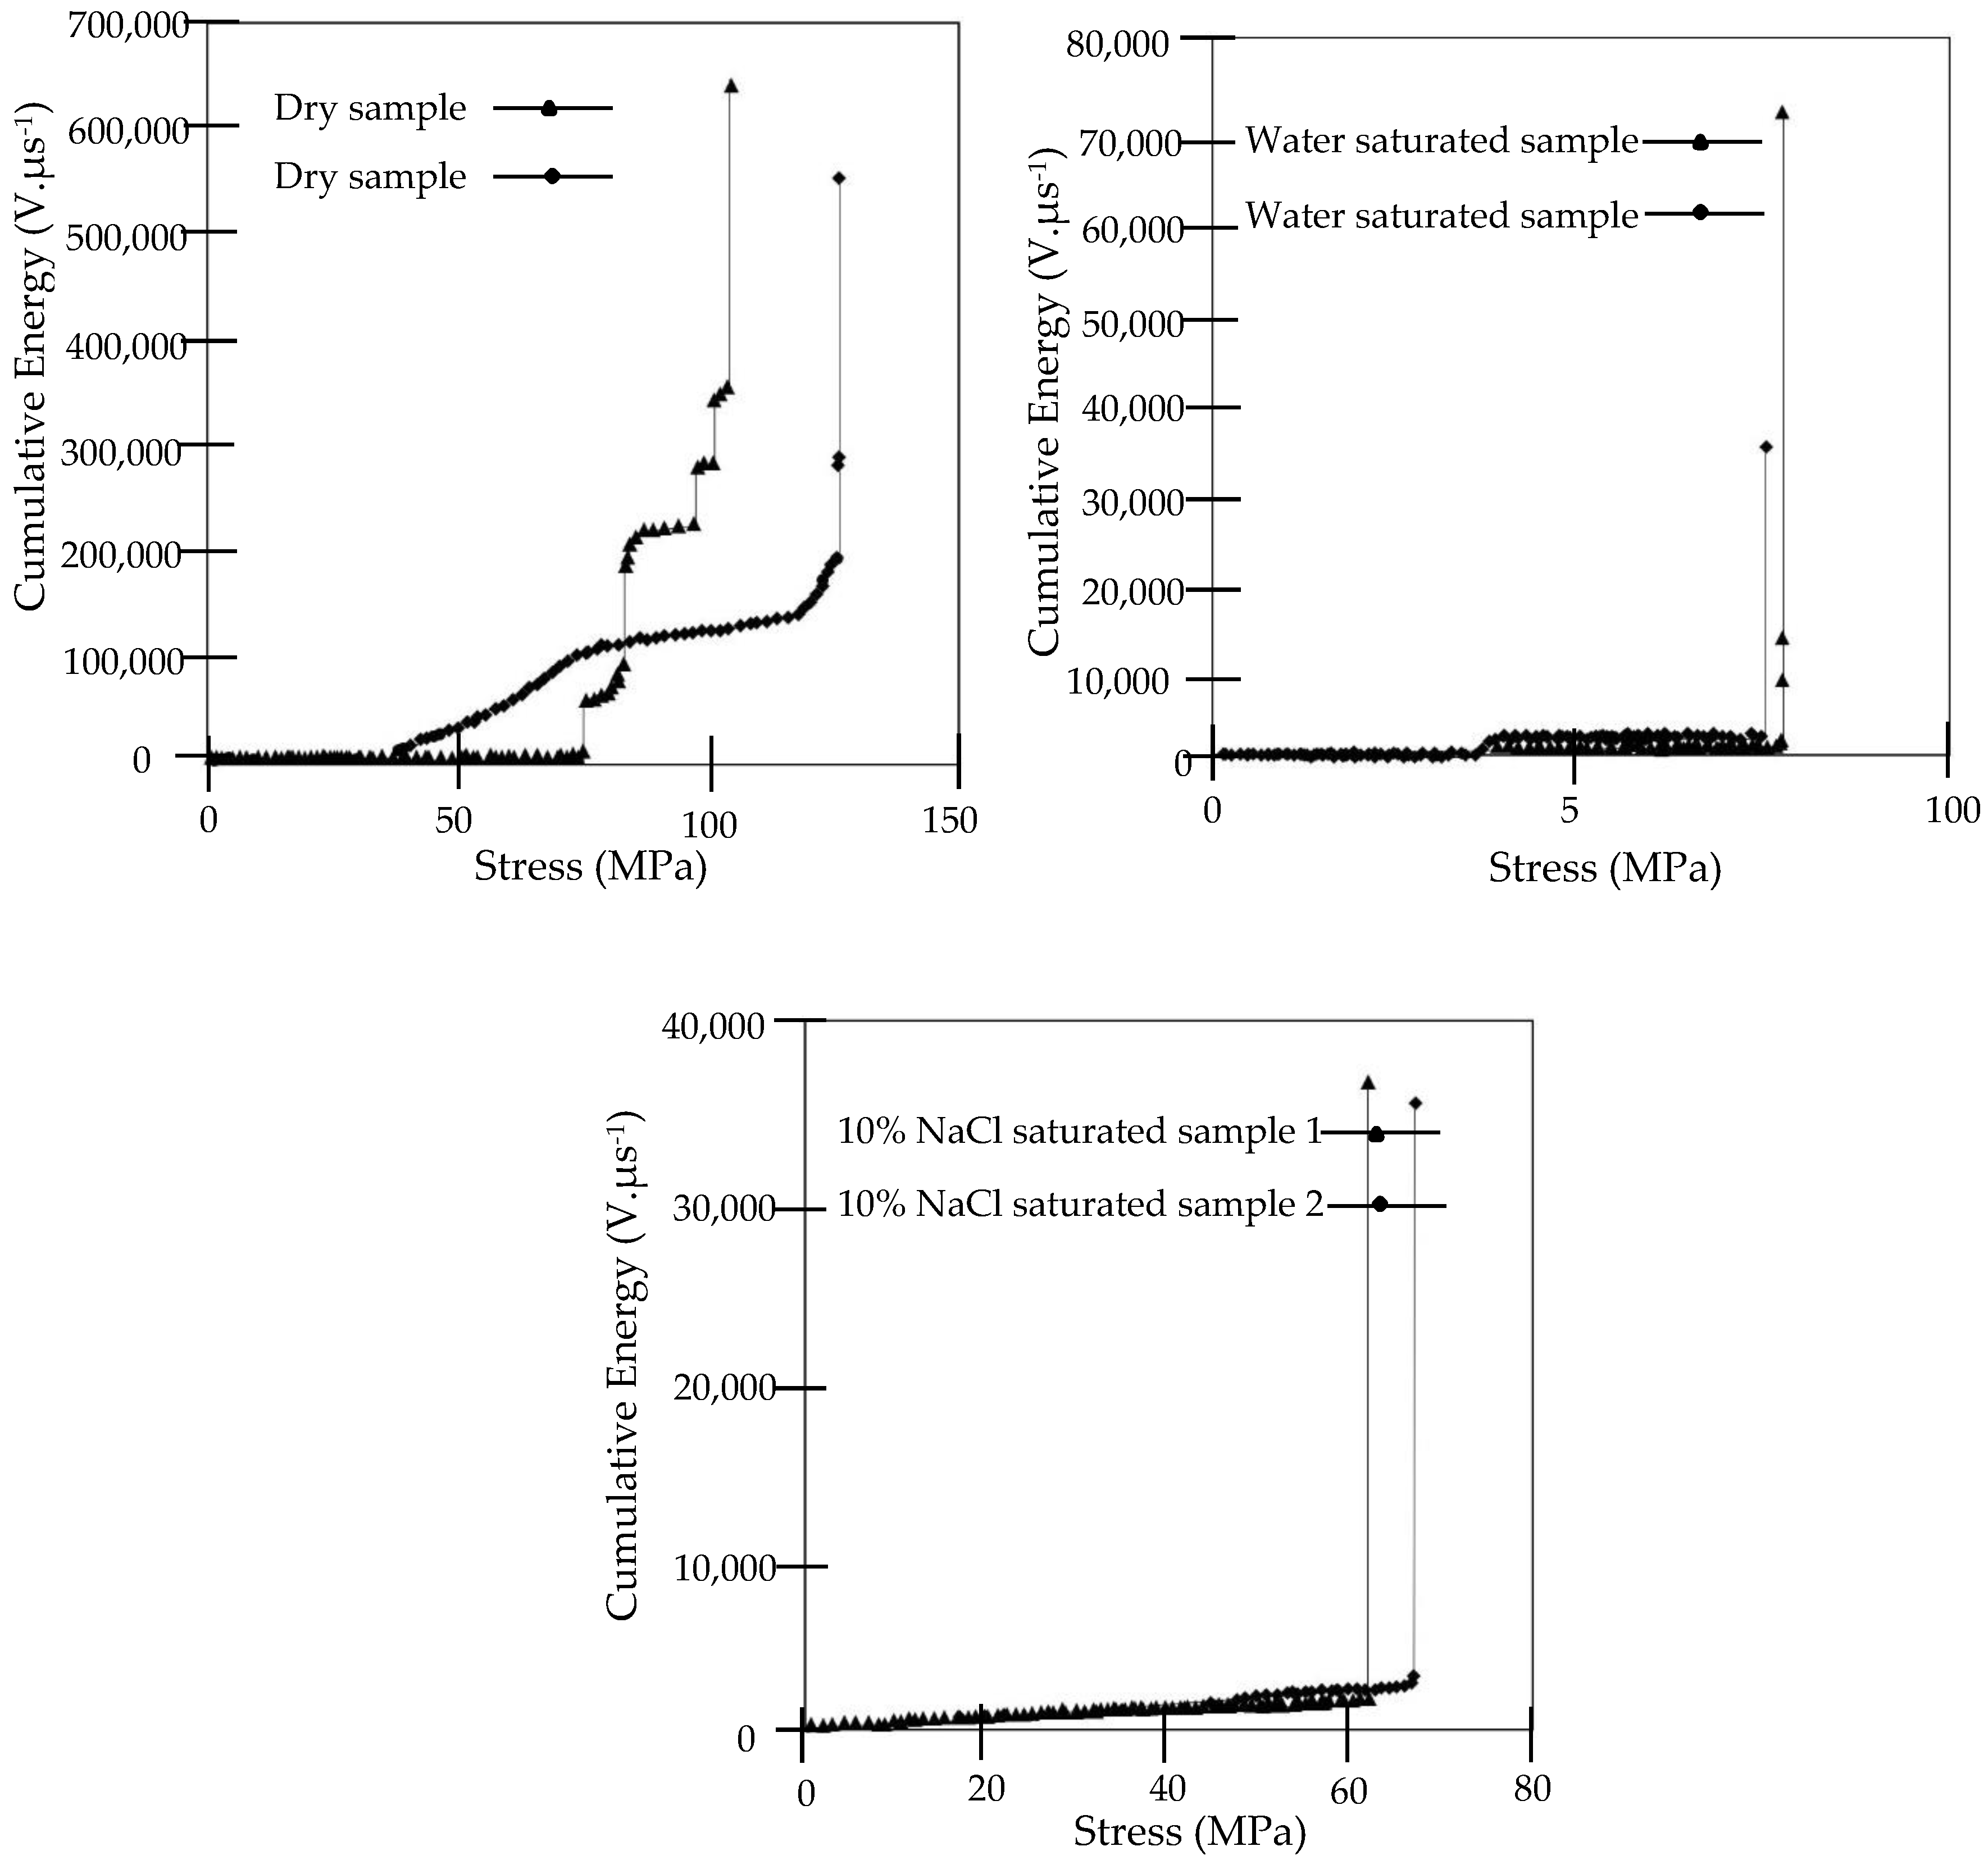
2.3. Acoustic Emission (AE) System

An advanced AE monitoring system was utilized to identify the cracking behaviour of the samples being failed. The use of AE counts to identify the crack propagation behaviour in reservoir has been well studied in the field and well explained in previous publications [27,30,31]. In this study, a peripheral component interconnection (PCI) 2-channel data acquisition system was used to detect the AE energy release during the cracking process by serially connecting two AE sensors to both ends of the sample. AE energy release over the loading time was observed and recorded. The AE data acquisition process was initiated simultaneously with the compression load application to determine the AE energy release performance for each loading condition.

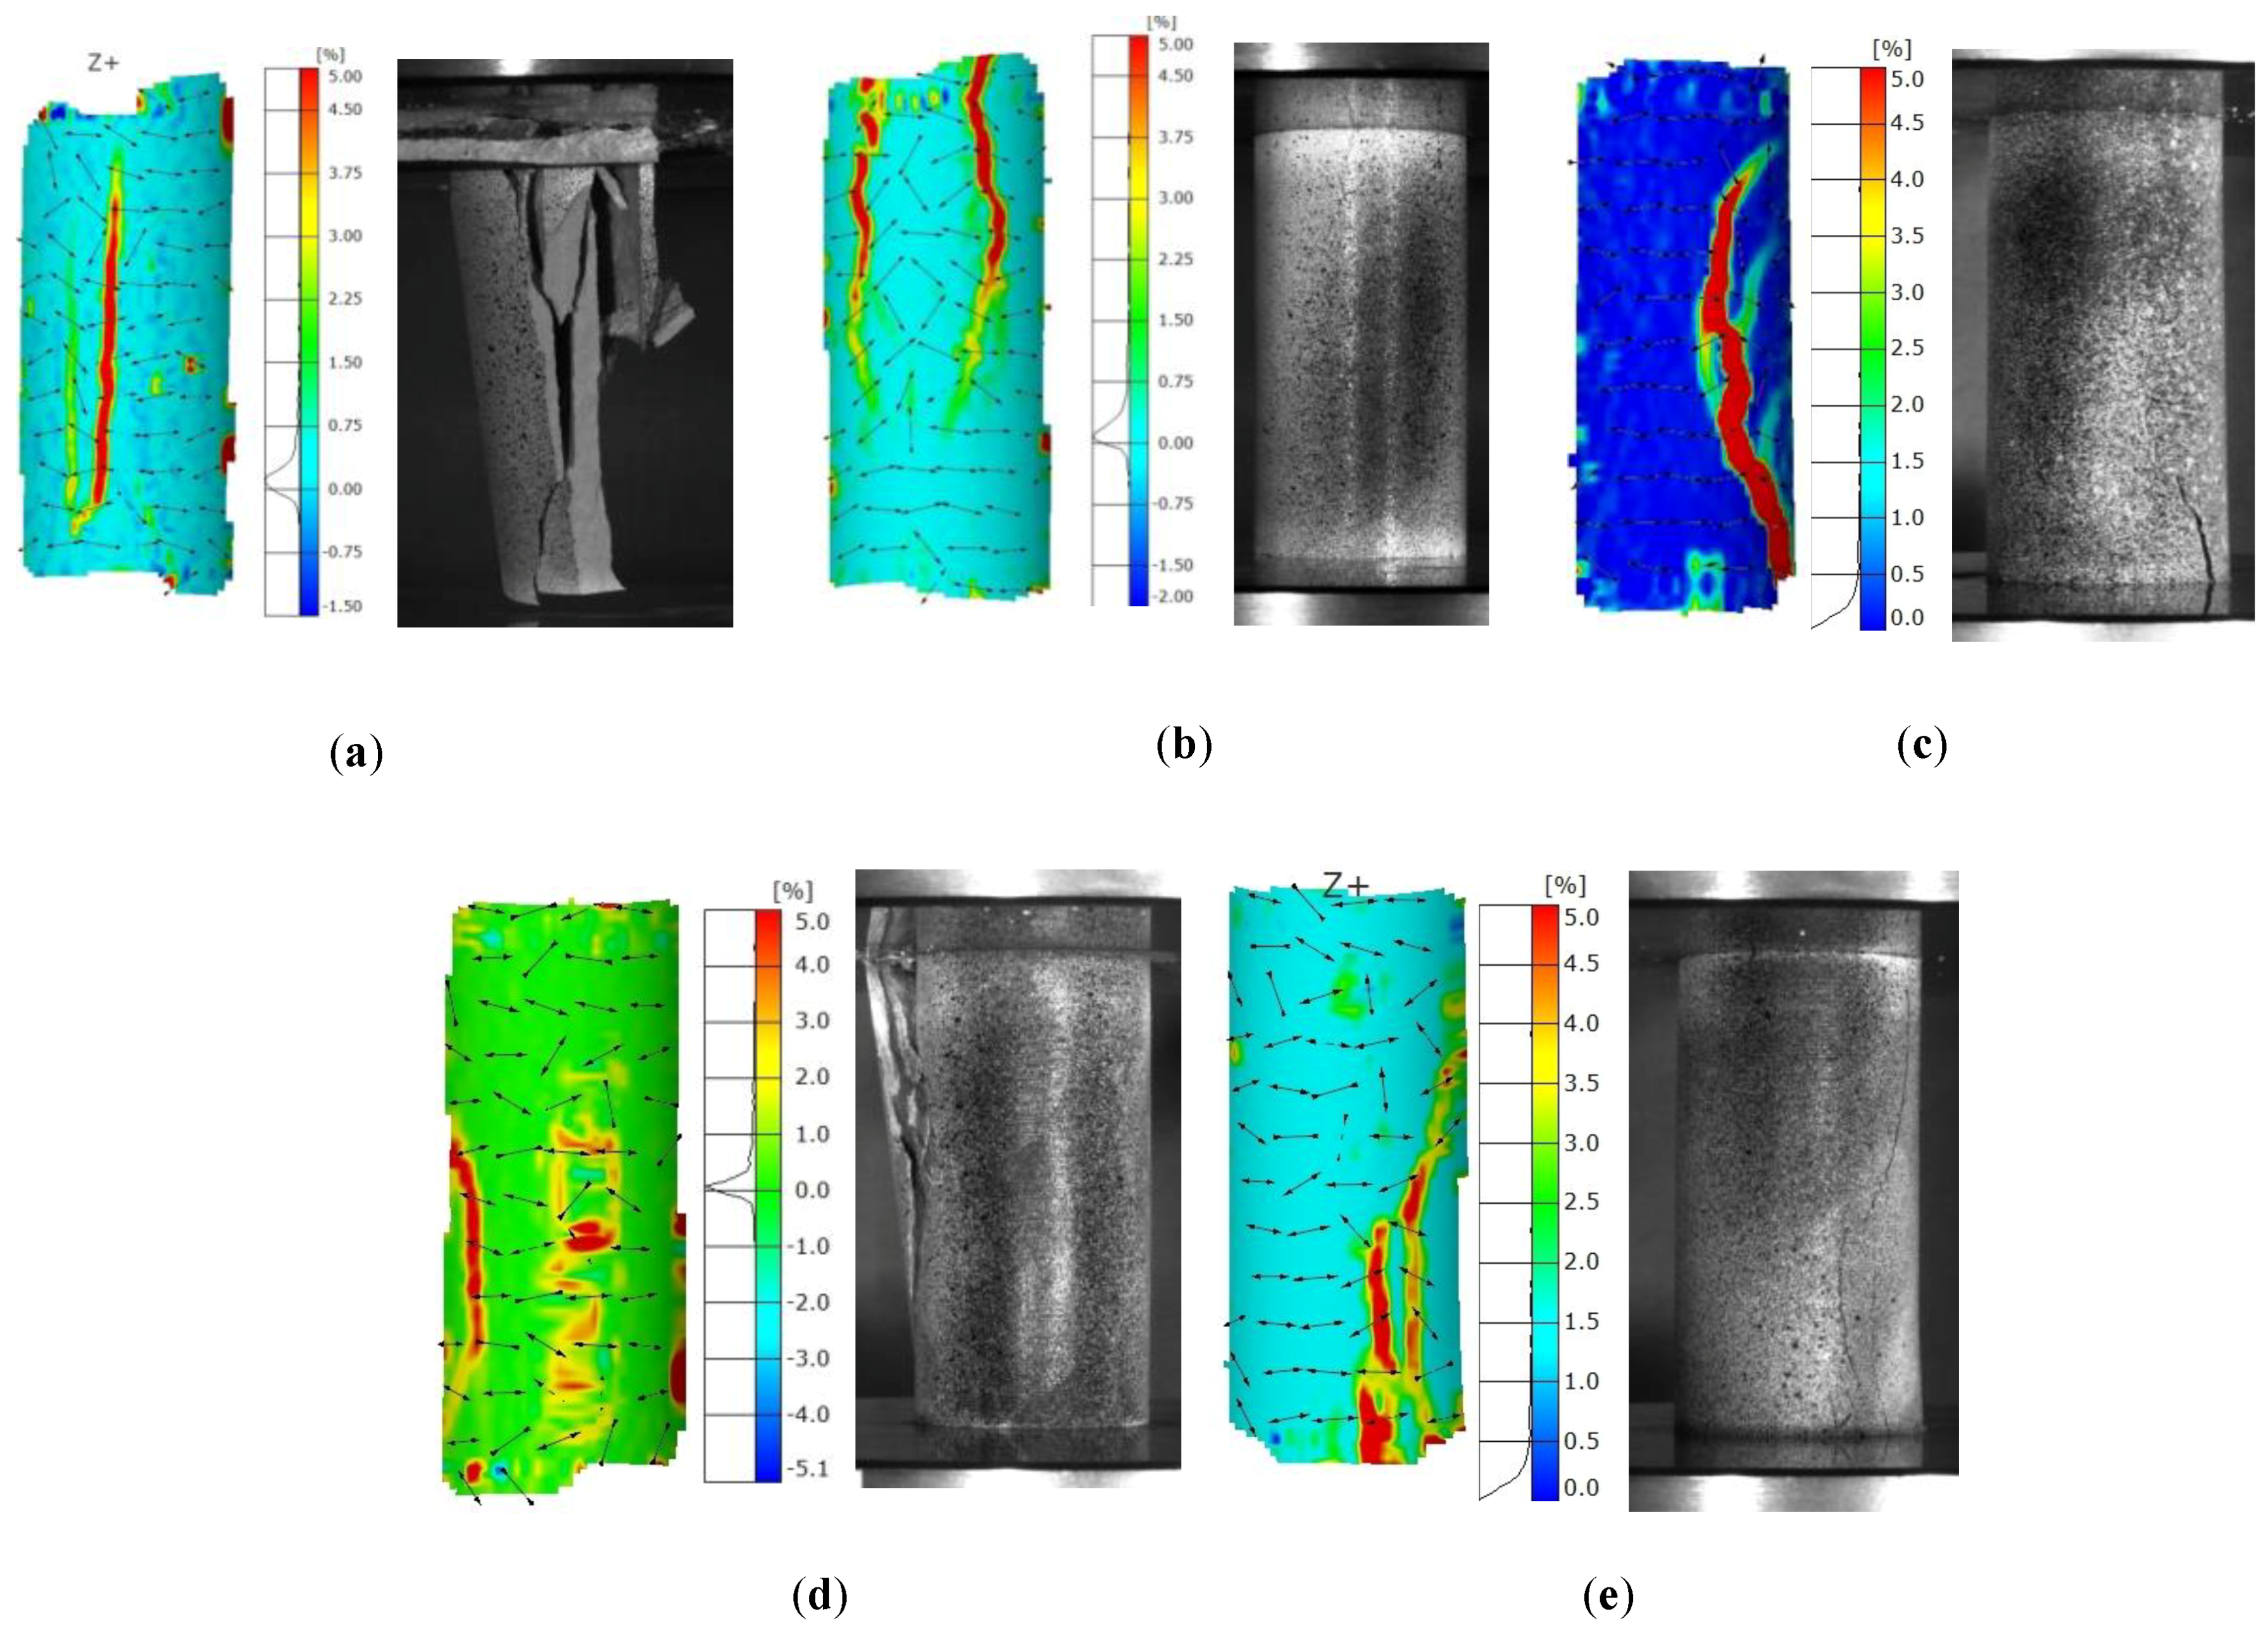
2.4. ARAMIS Photogrammetry Analysis

ARAMIS photogrammetry analysis with a digital image correlation system (DIC) was used to obtain digital images and internal strain development throughout the sample during the load application. The camera system was set to simultaneously start data recording with the application of compression load. The displacement of the points was detected and recorded by the cameras, and the strain of individual points, as well as the variation of point-point distance, was recorded by the system. The camera was directly connected to the UCS testing machine to enable real-time strain-stress information to be recorded.

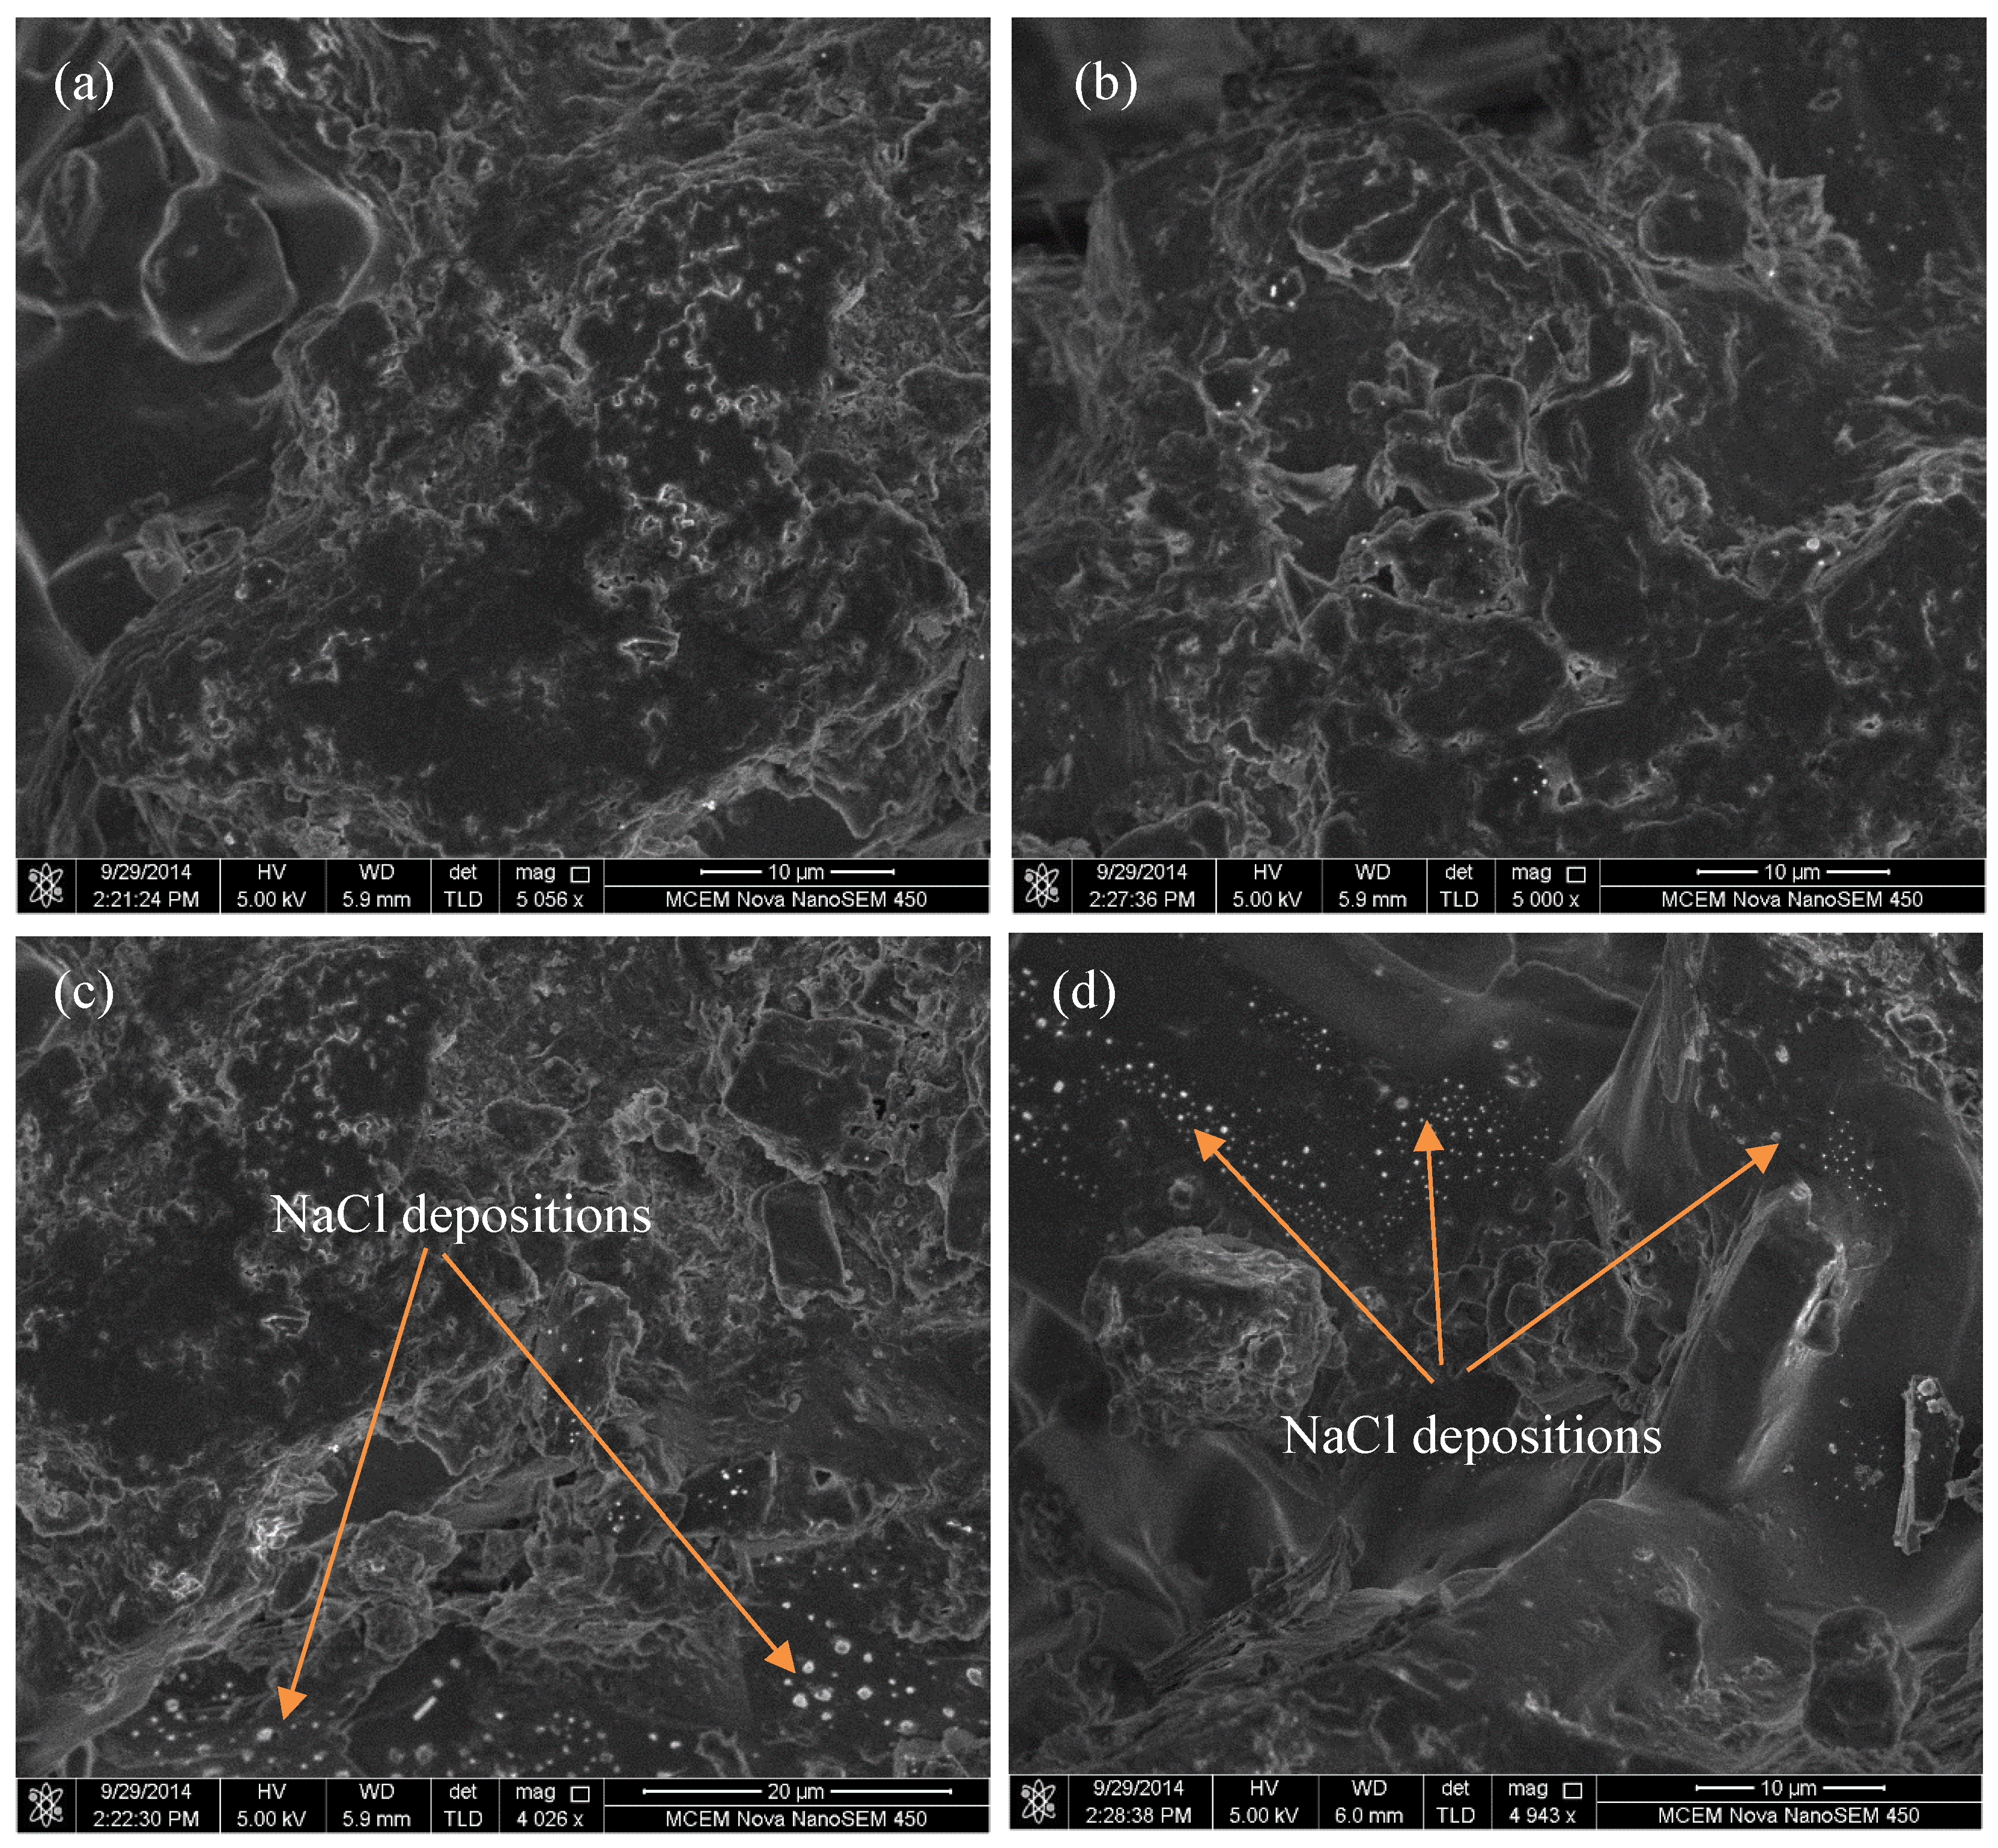
2.5. Scanning Electron Microscopy (SEM) Analysis

A comprehensive SEM analysis was conducted using the Quanta 3D FEG FIB machine (FEI, Oregon, USA) available in the Monash Centre for Electron Microscopy (MCEM) using siltstone slices obtained after pre-defined saturation period. During sample preparation, slices of 1–3 mm in height were obtained and saturated with each fluid together with the samples used for the strength test. Saturated samples were prepared for the SEM analysis by adhering them to double-sided adhesive carbon tape attached to a circular specimen stub. The samples were viewed using in-lens detector (TLD) under 5 kV voltage with 4.5 spot size and working distance of 6 mm.

2.6. Evaluation of Brittleness of Rock Samples

To date, many different expressions for BI have been proposed using various approaches and considering different characteristics of brittle performance. Table 1 summarises some of the commonly used BIs based on (1) stress–strain curve (2) unconfined compressive strength and Brazilian tensile strength (3) penetration, impact or hardness tests (4) mineral composition, porosity and grain size, and (5) geophysical method. In order to identify the brittleness characteristics of the tested siltstone under various pore fluid saturation conditions, the BI given Equation (1) [26] was used due to its many unique advantages. Importantly, the mutual influence of Young’s modulus and Poisson’s ratio on rock brittleness has been incorporated. The mutual effect of stresses and strains is more precise in quantifying rock brittleness compared to approaches that use the individual influence of stresses, strains, mineral composition, porosity or grain size:
B 12 = ( E E m i n E m a x E m i n + υ υ m a x υ m i n υ m a x ) 2
where, E is the Young’s modulus (GPa), v is the Poisson’s ratio and, “min” and “max” indicates the minimal and maximum values in the interval of interest, respectively. Brittleness increases with increasing Young’s modulus and reducing Poisson’s ratio. This equation therefore considers Young’s modulus and Poisson’s ratio as equally important factors in the evaluation of rock brittleness. In this experiment, the maximum and minimum measured values were chosen as the intervals of interest.

3. Results and Discussion

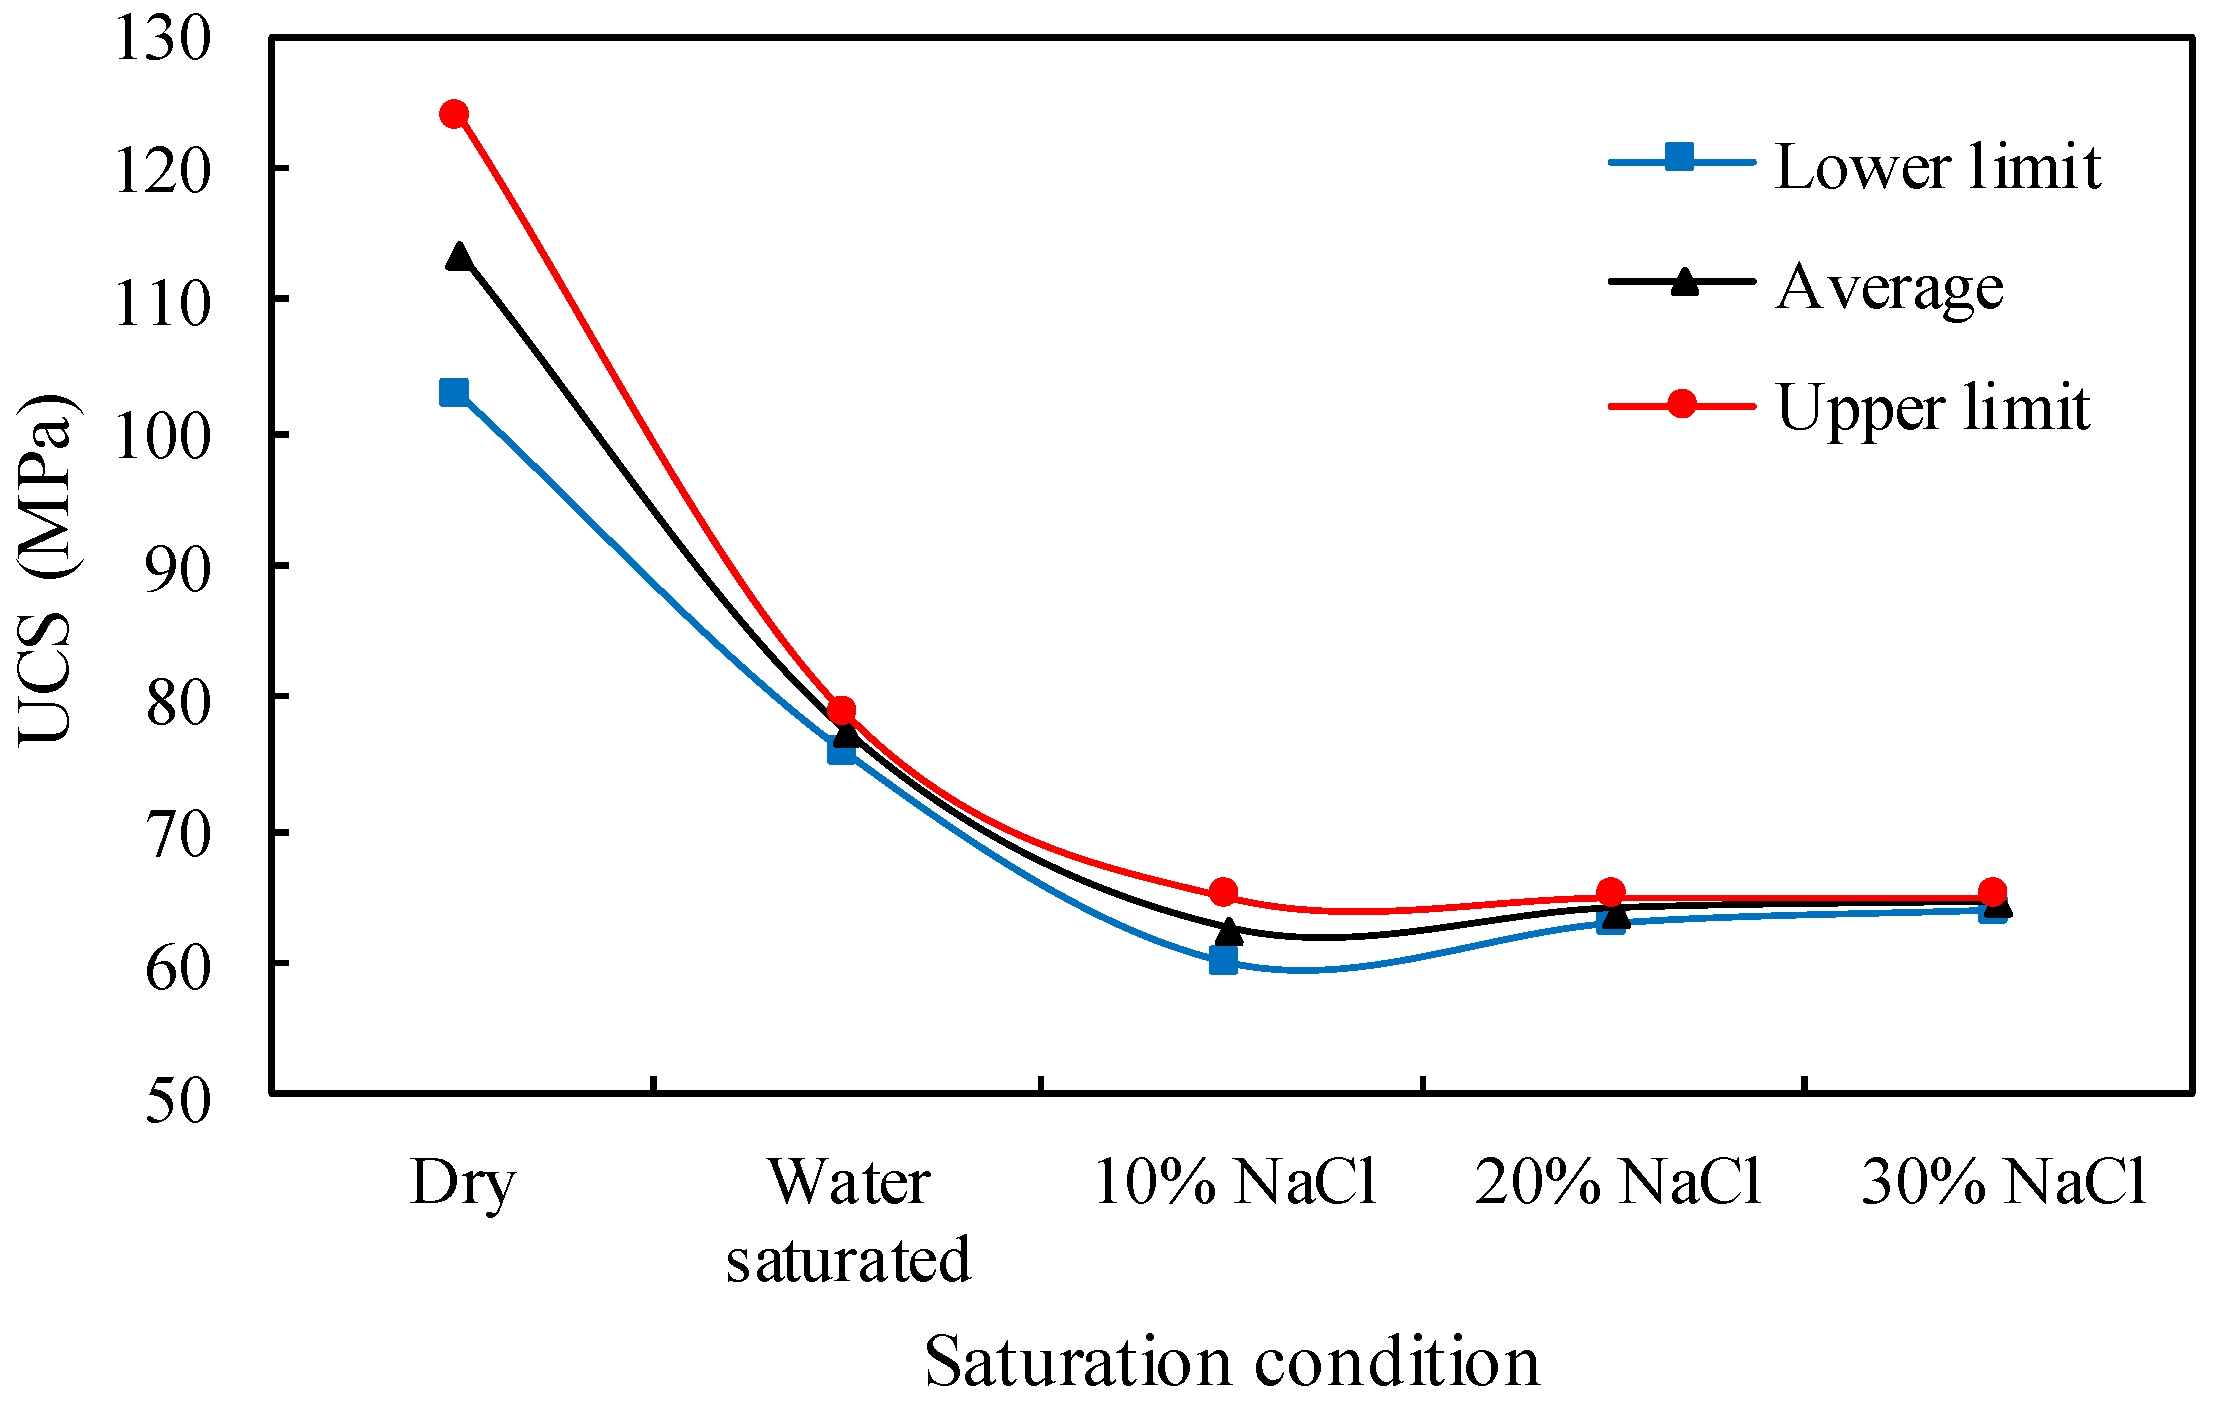
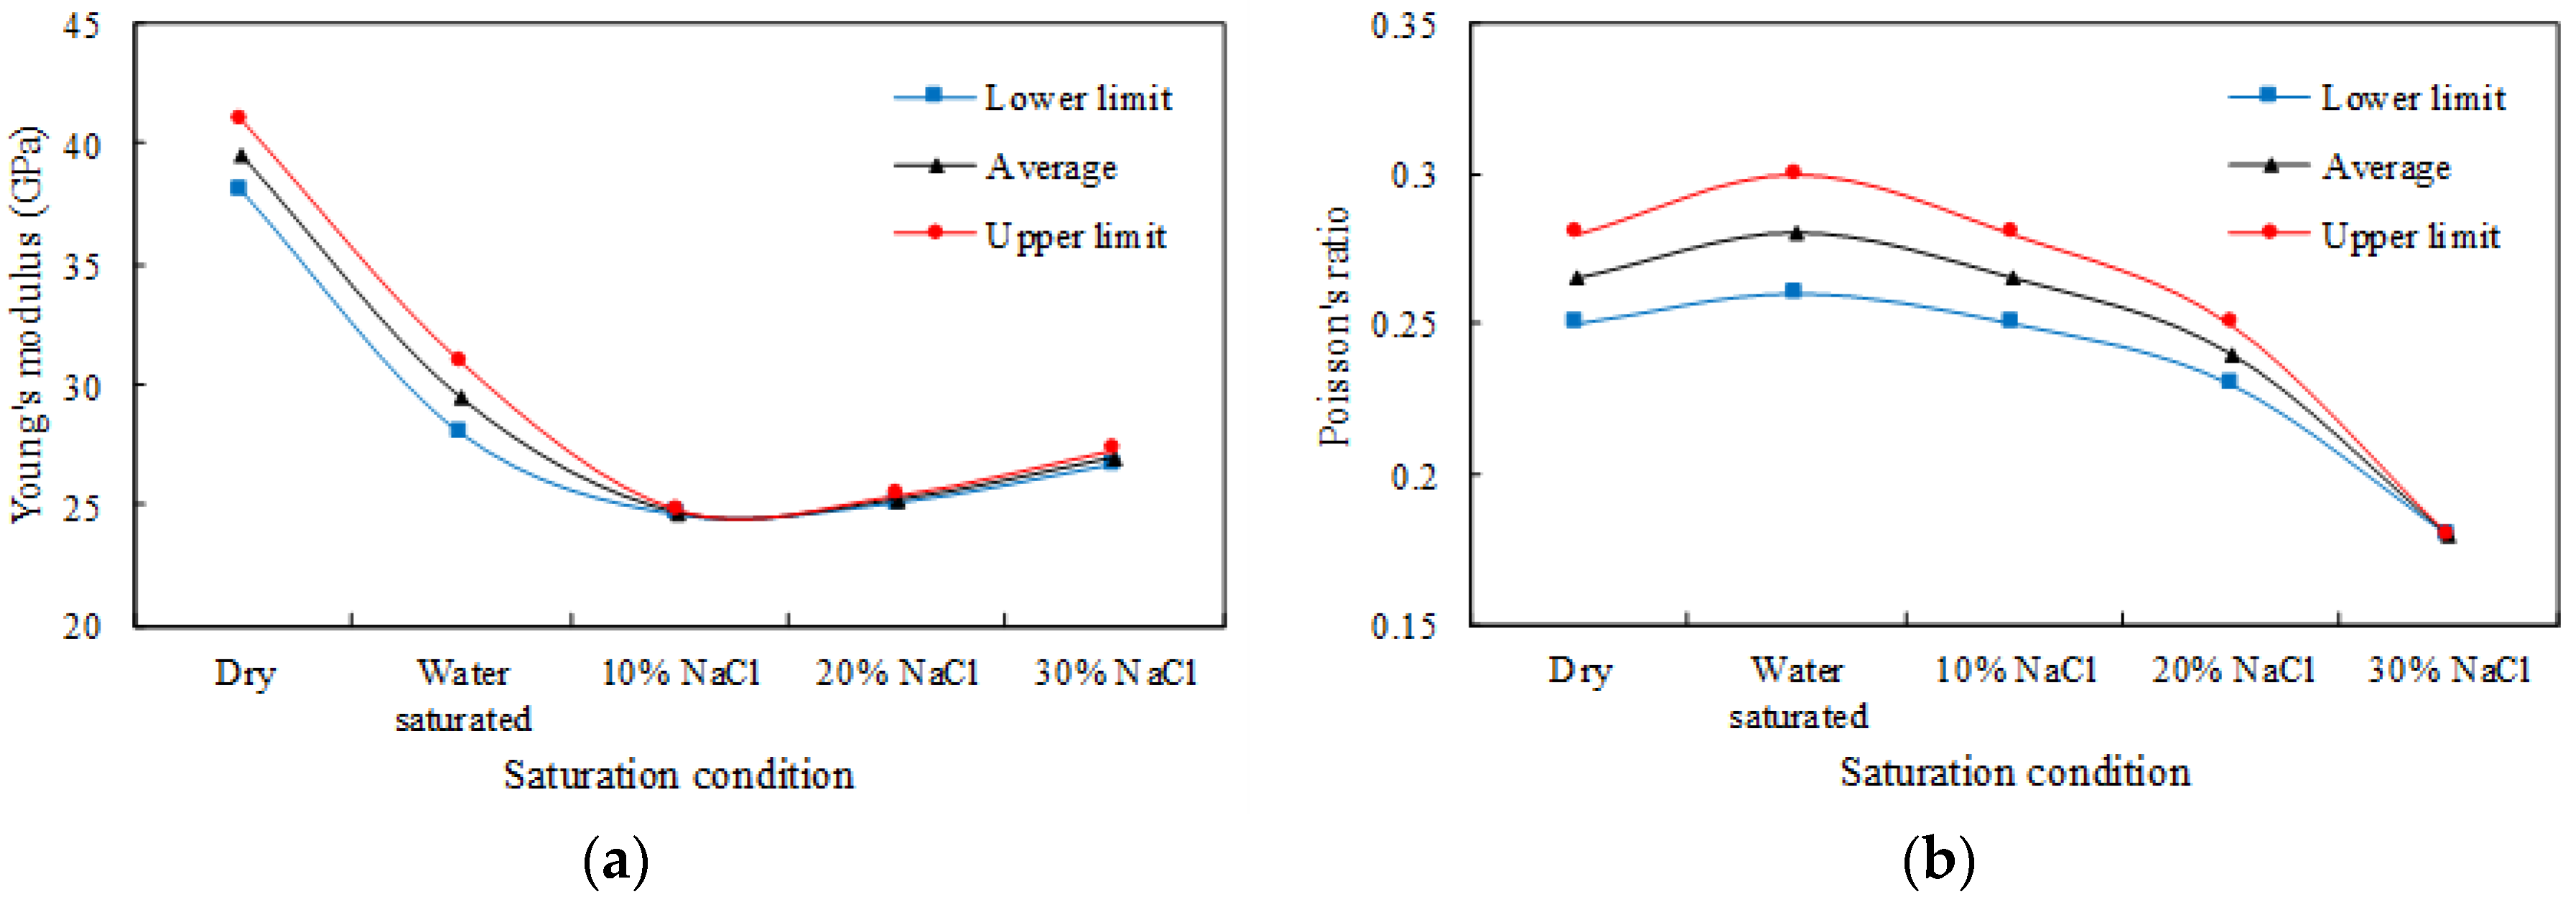
3.1. Variation of Siltstone Strength with Pore Fluid Chemistry

Table 2 gives the UCS values for the siltstone samples under various saturation conditions (dry, water, and 10–30% brine). As can be seen from Table 2, the differences in the values obtained for the various mechanical properties from the initial and replicated tests are very minor. This is probably due to the careful selection of samples from a single siltstone block with minor discontinuous features.
Figure 3 clearly shows the variation of siltstones’ strength characteristics with pore fluid saturation. As the figure shows, water saturation causes the compressive strength of the siltstone to be reduced by around 32%, and this is related to the softening effect of water saturation on the siltstone rock mass, as mentioned by Masuda [32]. The reduction of rock strength with the presence of water in the pore space has been shown for various other types of rocks [27,33,34]. For instance, strength reductions due to water saturation has been studied by Perera, Ranjith and Peter [27] and Sampath, Perera, Elsworth, Ranjith, Matthai and Rathnaweera [34] in Australian brown coal and Rathnaweera, Ranjith, Perera, Haque, Lashin, Al Arifi, Chandrasekharam, Yang, Xu, Wang and Yasar [33] in Hawkesbury sandstone. According to those studies, the softening of the rock mass through water saturation causes the tensile strength at crack tips to be greatly reduced, eventually reducing the surface free energy and strength characteristics of the whole rock mass. This also appears to be applicable to siltstone.
In relation to the influence of saline water or brine in the pore fluid, some salinity in the pore fluid causes the siltstone to be weakened. For example, according to Figure 3, the presence of 10% NaCl in the pore water causes the siltstone’s compressive strength to be further reduced by around 19% compared to the water-saturated samples. However, it is noticeable that NaCl ions contains in the solution does not change the UCS significantly, because the reduction percentage is comparatively less compared to ‘dry-to-water saturated’ stage. Further increment of the brine percentage in the pore fluid beyond 10% NaCl causes the strength of the siltstone to be slightly increased. According to the results, the average UCS value increases from 62.5 to 64 MPa, when the NaCl concentration increases from 10% to 20%. The same trend can be observed up to 30% concentration of NaCl, in which the UCS value increases from 64 to 64.5 MPa with increasing NaCl concentration from 20% to 30%. A similar influence of brine saturation on sandstone has been reported by Rathnaweera, Ranjith and Perera [28]. The reduction of rock strength with NaCl in the pore fluid possibly occurs for two main reasons: (1) the adsorption of NaCl molecules into the rock matrix causes the surface energy to be reduced, reducing the fracturing strength [35] and, (2) NaCl creates chemical corrosion of rock grain [36,37,38] and its cementation phase, which eventually reduce the rock strength [39]. However, there is also a positive influence of NaCl, as a high concentration of NaCl in the pore fluid causes NaCl crystals to be precipitated in the rock mass pore space [28,40], and these NaCl crystals create additional load-bearing surfaces in the rock mass, increasing its strength. Overall, it can be concluded that, the competitive influence of chemical corrosion, surface energy reduction and NaCl crystallization determines the influence of pore fluid NaCl concentration on the overall rock mass strength characteristics. According to Figure 3, at low order NaCl concentrations (i.e., ~10% NaCl by weight) the influences of chemical corrosion and surface energy reduction are dominant, whereas at high order NaCl concentrations (i.e., >20% NaCl by weight), NaCl crystallization effect becomes dominant, resulting in a slight strength re-gain.
The other important fact, when considering pore fluid saturation is its influence on the effective stress acting on the rock mass, which eventually affects the mechanical behaviour and fracability of the rock mass. This has been explained in literature [41,42,43,44], according to which, the pore pressure increment caused by pore fluid saturation can significantly reduce the effective stress acting on the rock mass. This enhancement in pore pressure in the reduced effective stress environment leads natural fractures to be opened and new fractures to be created in the rock mass, resulting in a strength reduction. This has been confirmed in many past studies for various other types of rock [45,46]. Hence, a precise understanding of the influence of pore fluid saturation on the effective stress environment of the rock mass, and the corresponding mechanical property changes including fracability is essential for an effective fracturing process in field projects.

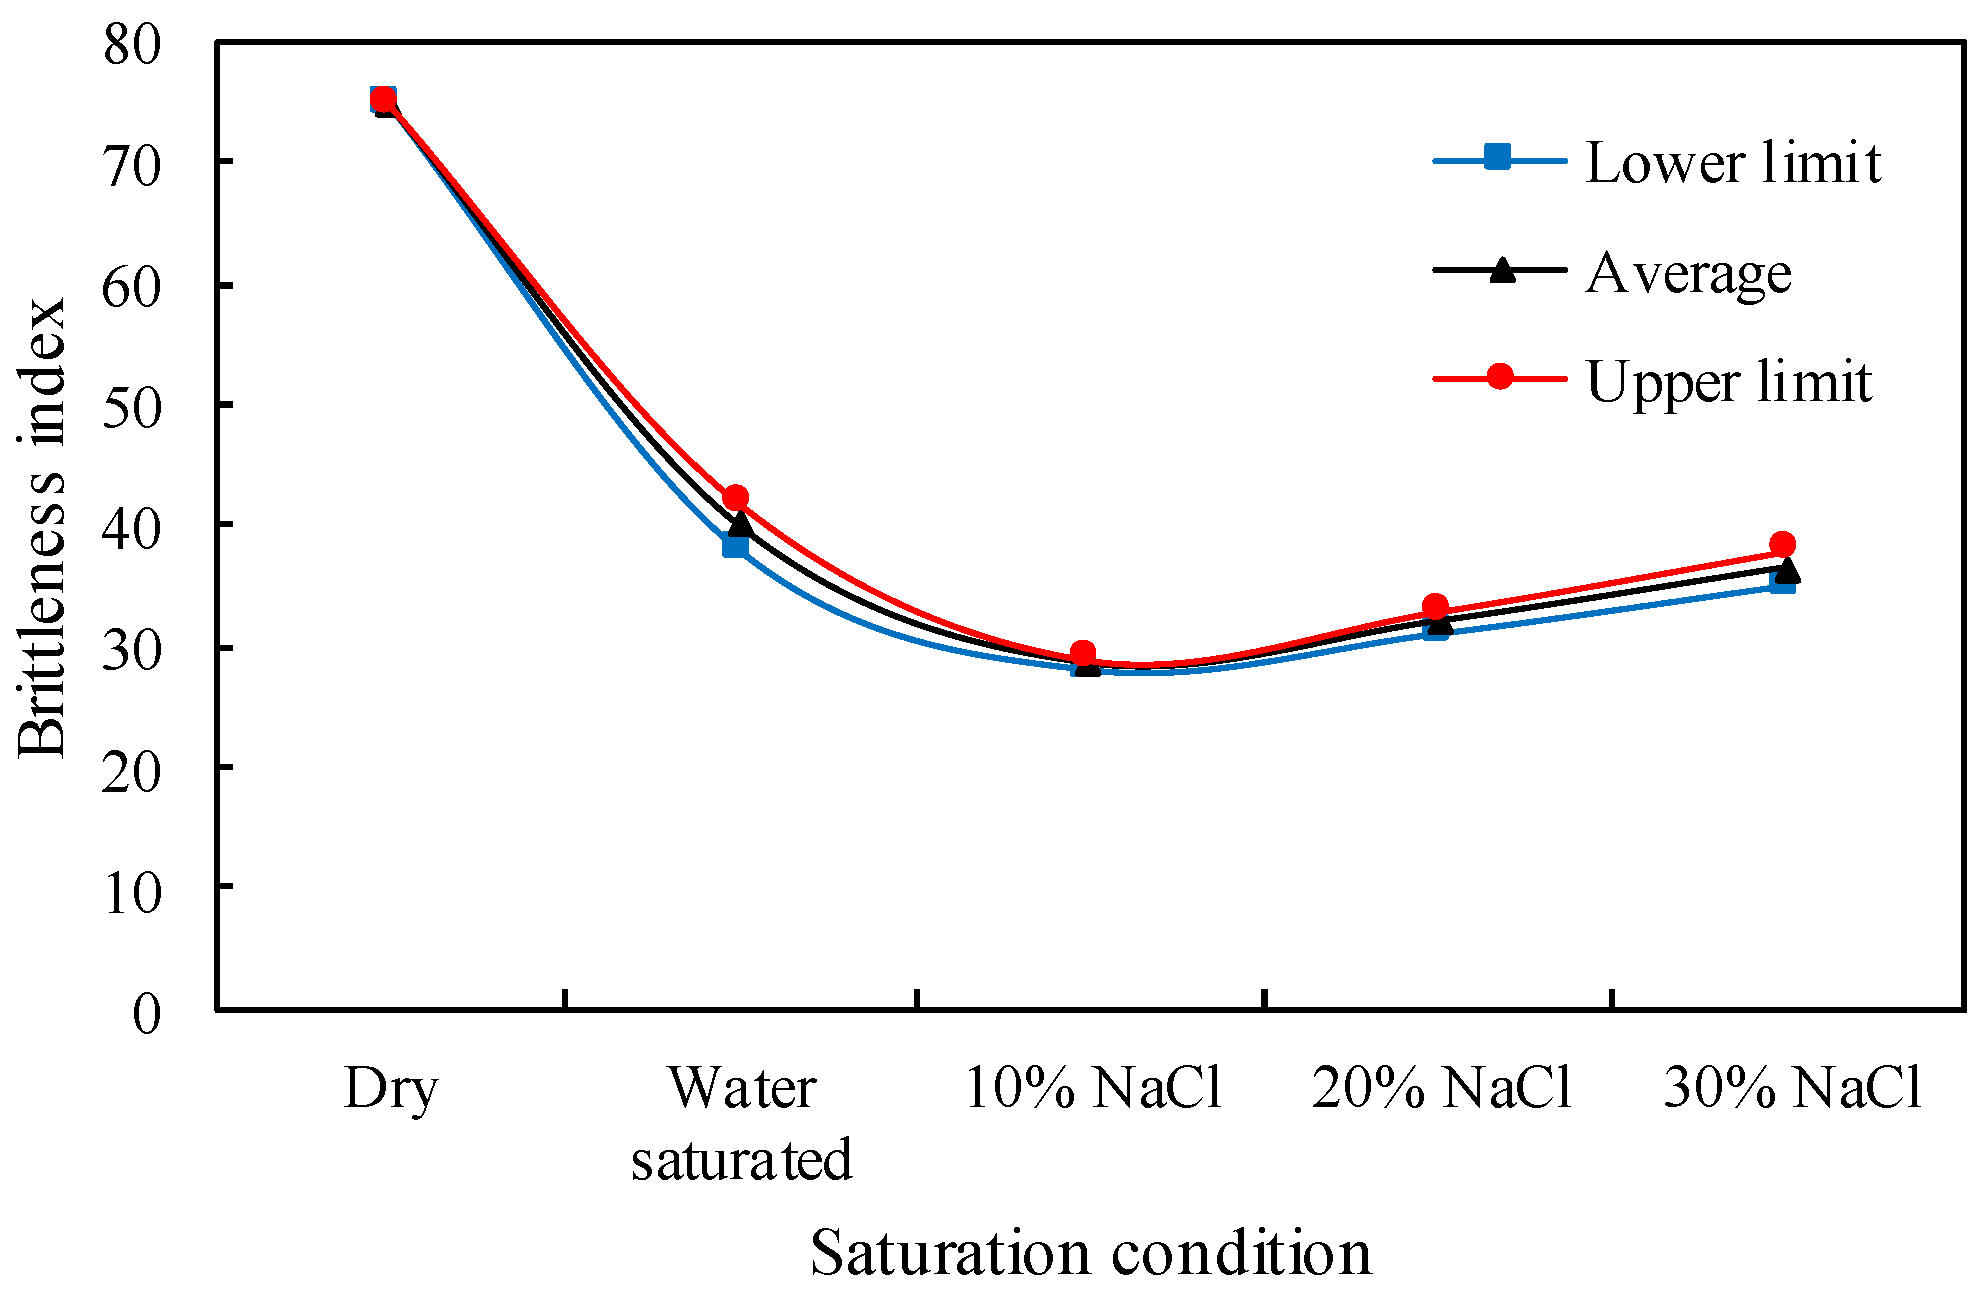
3.2. Pore Fluid Saturation Effect on Brittleness and Fracability

The main aim of this section is to evaluate the effect of pore fluid saturation on the fracability of siltstone, as it is most important for hydraulic fracturing. Figure 4a shows how the Young’s modulus of the tested siltstone varies with pore fluid saturation. Young’s modulus is widely used in the field to identify the brittleness of reservoir rocks [30,33]. It has been found that rocks with greater Young’s modulus have higher brittleness, as it represents lower expansibility of the sample under loading. Apart from the Young’s modulus, Poisson’s ratio also provides useful information on the expansibility of the rock matrix, as it is an indicator of the lateral-to-vertical strain ratio. In contrast to Young’s modulus, the greater Poisson’s ratio of a rock mass represents lower brittleness or less fracability. Such behaviour in unconventional reservoirs is less-advantageous for an effective hydraulic fracturing process, as the expansion of the rock matrix under hydraulic loading may heal existing fractures and reduce the ability to create new fractures [2].
The variation of the tested siltstone Young’s modulus and Poisson’s ratio with pore fluid saturation was first investigated to obtain knowledge on the corresponding fracability variation. According to Figure 4, water saturation causes a significant reduction in the siltstone’s Young’s modulus and enhancement in its Poisson’s ratio (26% reduction in Young’s modulus and 7% enhancement in Poisson’s ratio). Both of these show the reduction of the brittleness of siltstone with water saturation. This is because water saturation causes the whole rock mass to swell and soften, causing greater expansion ability under loading. Natural unconventional reservoirs mostly exist under saturated condition and this shows that these formations have much lower fracability compared to dry rock formations. The other important fact is that it is difficult to create a good fracturing process in a rock mass after water saturation due to its softened nature and its low surface energy.
In relation to the effect of salinity content of pore fluid on siltstone fracability, according to Figure 4, the presence of NaCl in the pore water caused both the Young’s modulus and Poisson’s ratio of the siltstone to be reduced. For example, the Young’s modulus for siltstone decreased by 16.3%, 14.2%, and 8.5% when the saline content in the pore water is increased from 0% to 10%, 20%, and 30%, respectively. However, with respect to the 10% NaCl-saturated condition, the total reduction of Young’s modulus decreases with increasing salinity of the pore fluid. Therefore, it is clear that the brittleness of the siltstone increases with the increasing NaCl concentration, as its Young’s modulus increases with the addition of NaCl. In fact, it is noticeable that increasing the NaCl concentration up to 20% and 30% causes the Young’s modulus to be increased by 3% and 10%, respectively, compared to 10% NaCl condition. This may be possibly due to the NaCl crystallization in the siltstone pore space in brine-saturated samples, that enhance the brittle characteristics of the overall rock mass due to the greater brittle nature of NaCl crystals. This effect is enhanced by increasing the percentage of salinity of the pore fluid.
However, in order to draw more reliable conclusions on siltstone fracability, it is necessary to consider the overall influence of the Young’s modulus and Poisson’s ratio. Therefore, BI of siltstones under various fluid saturation conditions was examined using Equation (1), which effectively combines the influence of Young’s modulus and Poisson’s ratio. According to Figure 5, although BI shows a somewhat similar trend to the Young’s modulus, the significance of pore fluid saturation on the BI is quite different from that on the Young’s modulus or Poisson’s ratio. For instance, water saturation of the dry siltstone causes the Young’s modulus of the tested siltstone to be reduced by around 26% and the BI to be reduced by the much larger amount of 47%. The observation is same for brine saturated conditions as well. In fact, if the brine saturation effect on siltstone fracability was cross-checked by considering both Young’s modulus and BI, it can be noticed that at high NaCl concentrations (i.e., 30% NaCl) the Young’s modulus has been reduced by 31%, whereas BI has been reduced by 51%. This implies that the actual effect of pore fluid saturation on rock brittleness is much greater than the amount which might be expected on the basis of the variation of Young’s modulus. In the field there are numerous occasions that use Young’s modulus to identity the rock brittleness and its variation with different factors [28,30]. The results of the current study emphasise the inaccuracy of using such factors in deciding rock brittleness.
If the overall trends of Young’s modulus and BI with increasing NaCl concentration are considered, it can be seen that both Young’s modulus and the BI are increasing with the salinity level from 10% to 30%, which in turn indicate the increment of brittleness characteristics of the siltstone (see Figure 4a and Figure 5). Even though both trends seem similar, above observations confirm the fact that evaluation of brittleness using a single elastic parameter such as Young’s modulus is inaccurate and unreliable to attain decisive conclusions, because the actual influence of the salinity percentage of pore fluid on rock fracability is often over/under estimated by those single parameters. This also points out the inaccuracy of some conclusions drawn in the literature on the effect of salinity on the fracability of reservoir rocks [28,40]. In addition, according to the BI evaluation, water saturation has a critically high influence on the fracability of the siltstone, causing it to be significantly reduced [47]. This is an important aspect of the hydraulic fracturing process, particularly when using water-based fracturing fluids, because the use of water-based fracturing fluid may not be a feasible option for some unconventional reservoir hydraulic fracturing, as it produces reduced fracability in the rock formation.
The fracture propagation process can be clearly identified by observing the AE energy released during the load application, which is shown in Figure 6. In AE counts, the stress at which the cumulative energy suddenly increases indicates the crack initiation point. A clear, gradual crack propagation pattern can be seen in the dry siltstone samples, exhibiting a greater ability to control the fracturing process in dry siltstone. The crack initiation stress for dry condition is about 33 and 27 MPa for the two dry samples, respectively. However, water saturation weakens the fracturing ability of the siltstone sample, in which a sudden breakage is clearly visible upon load application. The fracture initiation stress is much greater than that for the dry sample because the saturated samples have been completely failed without any initial stable fracture propagation, due to the softening effect of water saturation. The other important observation is the total cumulative energy release in dry samples is much greater than that in the water-saturated samples (nearly 10 times greater than for the water- and brine-saturated conditions). This proves the reduced surface energy in saturated samples compared to dry samples and therefore the lower fracturing ability in siltstone after saturation [48].
If the AE energy released in water- and brine-saturated samples are considered, the presence of salinity in the pore fluid causes some fracturing ability in siltstone compared to its water saturation condition [49]. In other words, brine-saturated samples exhibit a small range of crack propagation stress values during load application, with clear crack initiation and propagation steps. This is related to the ionic potential of NaCl molecules. According to Rathnaweera, Ranjith and Perera [28], NaCl interacts with some clay minerals in rock such as kaolinite and trigger depositions in the rock pore space. The tested siltstone has a significant amount of kaolinite, and this may cause significant kaolinite deposition in the rock mass pore space upon interaction with NaCl. This clay mineral deposition in the rock mass pore space may increase the cohesion of the rock, which in turn offer more opportunities for stable fracture propagation [50]. This indicates that brine has some ability to reduce the sudden failure effect caused by water, which is favourable for the hydraulic fracturing process.
This influence of pore fluid saturation on the siltstone fracturing process can be seen by the naked eye using ARAMIS photogrammetry, which shows the strain development which occurs in the rock mass during failure. ARAMIS photogrammetry technology was therefore used to identify the strain development variation in the siltstone with pore fluid saturation (see Figure 7). The colour maps give a clear picture of strain variation in the samples and the arrows show the minor strain directions at different points. The pictures are of samples close to failure. According to the ARAMIS images, siltstone in dry condition is subjected to brittle behaviour and saturation of it with different pore fluids prevents brittle failure, which itself shows the reduced surface energy of saturated siltstone compared to dry siltstone. All the saturated samples appear to be subjected to either splitting or single shear failure, and increasing the saline content in the pore fluid causes the failure to generally convert to shear failure from splitting failure. This exhibits the better fracturing ability of siltstone samples saturated with highly saline brine compared to low saline brine or water.

3.3. Micro-Structural Analysis Using Scanning Electron Microscopy (SEM)

A complete micro-structural analysis was performed to understand the observed mechanical behaviour and fracability of the siltstone with various pore fluid saturations. Figure 8 shows the results of the SEM analysis, which clearly shows a significant amount of NaCl crystal growth in the 20% and 30% NaCl-saturated specimens and a negligible amount of NaCl crystal growth in the 10% NaCl saturated specimens. It should be noted that, according to the UCS stress analysis, 20% and 30% NaCl saturation causes the siltstone rock’s UCS strength to be slightly increased by 3.25% and 4.03%, respectively, with respect to the 10% NaCl-saturated condition. This SEM analysis confirms the physics behind the UCS increments, which is clearly related to the NaCl crystallisation process in the rock pore structure (see Figure 8c,d). As described earlier, these NaCl crystals may add additional strength to the rock skeleton by reducing the pore space of siltstone through newly-developed NaCl crystals. The presence of salinity in the pore fluid also causes the fracability reduction caused by water saturation to be reduced, and the presence of 30% NaCl in the pore fluid in the tested siltstone causes its BI to be increased by around 20%. This enhancement in the siltstone brittleness is possibly caused by the crystallization of the highly brittle NaCl crystals in the siltstone pore space, which enhances the brittle characteristics of the overall rock mass.
From the overall results of the experiment, we conclude that among a number of factors, siltstone mechanical behaviour depends on the pore fluid saturation condition, in which the pore fluid can cause strength reductions at different levels, depending on the pore fluid chemistry. Also, the other primary parameters like Young’s modulus, Poisson’s ratio and BI vary accordingly. Results obtained from this study can be considered as a nice case study of siltstone to back up the literature, which confirm the mechanical alterations with pore fluid condition. For further understanding, we recommend that the experimental results should be backed up with numerical simulations, where parameter studies can be performed with verified models to gain new physical insights of the physics of siltstone. Also, sensitive analyses can be carried out in statistical sense to reproduce the experimental results, where the influence of all input parameters with respect to specific output of interest can be quantified [51,52].

4. Conclusions

The fracability of unconventional gas reservoirs is a key parameter that controls the effectiveness of rock stimulation processes such as hydraulic fracturing. Fracability can be altered due to pore fluid characteristics, thus should be thoroughly investigated prior to field implementations. Rock brittleness is often used to interpret the fracability, in which BI is quantified with basic rock strength parameters. In this study, we evaluate the brittleness and interpret the fracability of varyingly saturated (i.e., 0%, 10%, 20% and 30% NaCl by weight) siltstone, through a series of mechanical experiments. Advanced techniques like acoustic emission and ARAMIS photogrammetry analyses were utilized to evaluate the fracture propagation and sample deformation during load application. The alterations in the micro-structure was visualized by a SEM analysis. Based on the combined results, we conclude that the effect of water saturation on siltstone strength causes a strength reduction of 31.72% from its dry value, which confirms the water-induced softening effect on siltstone. However, high NaCl concentrations do not reduce the siltstone strength significantly. In fact, it may contribute to a slight strength regain (about 3–4%), possibly due to NaCl crystallization in rock pore spaces, which is confirmed by SEM analysis. Use of individual parameters like Young’s modulus and Poisson’s ratio is not much appropriate to precisely quantify the brittleness or interpret the fracability of siltstone. Thus, we use a more reliable method, which combines both said basic parameters to quantify the BI. Results indicate that pore fluid saturation cause BI to be reduced by order of 30–60%, which in turn shows a negative effect on siltstone fracability. Furthermore, as confirmed by AE analysis, dry siltstone exhibits a gradual crack propagation pattern, whereas both water and brine saturation has hindered the fracturing ability, in which the samples were subjected to a sudden failure, upon load application. According to ARAMIS images, increasing the saline content in the pore fluid causes the rock mass failure to be generally converted to shear failure from splitting failure, exhibiting better fracturing ability in siltstone saturated with highly saline brine, compared to low saline brine or water.
Overall, the results imply that pore fluid chemistry significantly alters the rock strength parameters, which in turn affects the fracability characteristics of the reservoir. This may possibly affect the environmental and economic feasibility of field projects. Hence, a detailed evaluation of rock mechanical behavior is essential to accurately evaluate the mechanical response of the targeted reservoir, prior to implantation of rock stimulation projects such as hydraulic fracturing.

Author Contributions

The experimental work, data analysis and initial draft of the paper was done by M.S.A.P. The drafted manuscript was corrected and reviewed by K.H.S.M.S. T.D.R. and P.G.R. contributed in discussion of results. The concept was conceived by M.S.A.P. and P.G.R. and also the final review of the paper.

Funding

This research was funded by the Australian Research Council (DE130100124).

Acknowledgments

The authors wish to express their appreciation for the funding provided by the Australian Research Council (DE130100124) and to the Monash Deep Earth Energy Laboratory staff and the laboratory manager Mr. Long Goh for their assistance with laboratory experiments.

Conflicts of Interest

The authors declare no conflict of interest.

References

  1. Conti, J.J.; Holtberg, P.D.; Beamon, J.A.; Schaal, A.M.; Ayoub, J.; Turnure, J.T. Annual Energy Outlook 2014; Report DOE/EIA-0383; US Energy Information Administration: Washington, DC, USA, 2014. [Google Scholar]
  2. Wanniarachchi, W.A.M.; Ranjith, P.G.; Perera, M.S.A.; Lashin, A.; Al Arifi, N.; Li, J.C. Current opinions on foam-based hydro-fracturing in deep geological reservoirs. Geomech. Geophys. Geo-Energy Geo-Resour. 2015, 1, 121–134. [Google Scholar] [CrossRef]
  3. Speight, J.G. Shale Gas Production Processes; Gulf Professional Publishing: Boston, MA, USA, 2013; pp. 101–119. [Google Scholar]
  4. Nicot, J.-P.; Scanlon, B.R. Water use for shale-gas production in Texas, US. Environ. Sci. Technol. 2012, 46, 3580–3586. [Google Scholar] [CrossRef] [PubMed]
  5. Rivard, C.; Lavoie, D.; Lefebvre, R.; Séjourné, S.; Lamontagne, C.; Duchesne, M. An overview of Canadian shale gas production and environmental concerns. Int. J. Coal Geol. 2014, 126, 64–76. [Google Scholar] [CrossRef]
  6. Wang, Q.; Chen, X.; Jha, A.N.; Rogers, H. Natural gas from shale formation–the evolution, evidences and challenges of shale gas revolution in united states. Renew. Sustain. Energy Rev. 2014, 30, 1–28. [Google Scholar] [CrossRef]
  7. Hubbert, M.K.; Willis, D.G. Mechanics of hydraulic fracturing. Trans. Am. Inst. Min. Metall. Eng. 1957, 210, 153–163. [Google Scholar]
  8. Gale, J.F.; Reed, R.M.; Holder, J. Natural fractures in the barnett shale and their importance for hydraulic fracture treatments. AAPG Bull. 2007, 91, 603–622. [Google Scholar] [CrossRef]
  9. Jarvie, D.M.; Hill, R.J.; Ruble, T.E.; Pollastro, R.M. Unconventional shale-gas systems: The mississippian barnett shale of north-central texas as one model for thermogenic shale-gas assessment. AAPG Bull. 2007, 91, 475–499. [Google Scholar] [CrossRef]
  10. Buller, D.; Hughes, S.N.; Market, J.; Petre, J.E.; Spain, D.R.; Odumosu, T. Petrophysical evaluation for enhancing hydraulic stimulation in horizontal shale gas wells. In Proceedings of the SPE Annual Technical Conference and Exhibition, Florence, Italy, 9–22 September 2010. [Google Scholar]
  11. Ding, D.Y.; Wu, Y.S.; Jeannin, L. Efficient simulation of hydraulic fractured wells in unconventional reservoirs. J. Pet. Sci. Eng. 2014, 122, 631–642. [Google Scholar] [CrossRef]
  12. Dusseault, M.B.; Loftsson, M.; Russell, D. The mechanical behavior of the kettle point oil shale. CaGeJ 1986, 23, 87–93. [Google Scholar] [CrossRef]
  13. Rickman, R.; Mullen, M.J.; Petre, J.E.; Grieser, W.V.; Kundert, D. In A practical use of shale petrophysics for stimulation design optimization: All shale plays are not clones of the barnett shale. In Proceedings of the SPE Annual Technical Conference and Exhibition, Denver, CT, USA, 21–24 September 2008. [Google Scholar]
  14. Hetenyi, M.I. Handbook of Experimental Stress Analysis. John Wiley Inc. Available online: http://cds.cern.ch/record/228929 (accessed on 15 September 2018).
  15. Ramsay, J.G. Folding and Fracturing of Rocks. Mc Graw Hill Book Company. Available online: https://ci.nii.ac.jp/naid/10003545716/ (accessed on 15 September 2018).
  16. Bishop, A. Progressive failure-with special reference to the mechanism causing it. Proc. Geotech. Conf. Oslo 1967, 2, 142–150. [Google Scholar]
  17. Hucka, V.; Das, B. Brittleness determination of rocks by different methods. Int. J. Rock. Mech. Min. Sci. Geomech. Abstr. 1974, 11, 389–392. [Google Scholar] [CrossRef]
  18. Lawn, B.; Marshall, D. Hardness, toughness, and brittleness: An indentation analysis. J. Am. Ceram. Soc. 1979, 62, 347–350. [Google Scholar] [CrossRef]
  19. Kahraman, S.; Altindag, R. A brittleness index to estimate fracture toughness. Int. J. Rock Mech. Min. Sci. 2004, 2, 343–348. [Google Scholar] [CrossRef]
  20. Quinn, J.; Quinn, G.D. Indentation brittleness of ceramics: A fresh approach. J. Mater. Sci. 1997, 32, 4331–4346. [Google Scholar] [CrossRef]
  21. Yagiz, S. Assessment of brittleness using rock strength and density with punch penetration test. Tunn. Undergr. Space Technol. 2009, 24, 66–74. [Google Scholar] [CrossRef]
  22. Waters, G.A.; Lewis, R.E.; Bentley, D. The effect of mechanical properties anisotropy in the generation of hydraulic fractures in organic shales. In Proceedings of the SPE Annual Technical Conference and Exhibition, Denver, CT, USA, 30 October–2 November 2011. [Google Scholar]
  23. Gale, F. Screening criteria for shale-gas systems. Gulf Coast Assoc. Geol. Soc. Trans. 2009, 59, 779–793. [Google Scholar]
  24. Yilmaz, N.G.; Karaca, Z.; Goktan, R.; Akal, C. Relative brittleness characterization of some selected granitic building stones: Influence of mineral grain size. Constr. Build. Mater. 2009, 23, 370–375. [Google Scholar] [CrossRef]
  25. Jin, X.; Shah, S.N.; Truax, J.A.; Roegiers, J.-C. A practical petrophysical approach for brittleness prediction from porosity and sonic logging in shale reservoirs. In Proceedings of the SPE Annual Technical Conference and Exhibition, Amsterdam, The Netherlands, 29 October 2014. [Google Scholar]
  26. Zhang, D.; Ranjith, P.G.; Perera, M.S.A. The brittleness indices used in rock mechanics and their application in shale hydraulic fracturing: A review. J. Pet. Sci. Eng. 2016, 143, 158–170. [Google Scholar] [CrossRef]
  27. Perera, M.S.A.; Ranjith, P.G.; Viete, D.R. Effects of gaseous and super-critical carbon dioxide saturation on the mechanical properties of bituminous coal from the southern sydney basin. Appl. Energy 2013, 110, 73–81. [Google Scholar] [CrossRef]
  28. Rathnaweera, T.D.; Ranjith, P.G.; Perera, M.S.A.; Haque, A.; Lashin, A.; Al Arifi, N.; Chandrasekharam, D.; Yang, S.Q.; Xu, T.; Wang, S.H.; et al. Co2-induced mechanical behaviour of hawkesbury sandstone in the gosford basin: An experimental study. Mater. Sci. Eng. A 2015, 641, 123–137. [Google Scholar] [CrossRef]
  29. Prothero, D.R.; Schwab, F. Sedimentary Geology; W. H. Freeman and Co.: New York, NY, USA, 1996; p. 575. [Google Scholar]
  30. Perera, M.S.A.; Ranjith, P.G.; Peter, M. Effects of saturation medium and pressure on strength parameters of latrobe valley brown coal: Carbon dioxide, water and nitrogen saturations. Energy 2011, 36, 6941–6947. [Google Scholar] [CrossRef]
  31. Ranjith, P.G.; Perera, M.S.A. Effects of cleat performance on strength reduction of coal in CO2 sequestration. Energy 2012, 45, 1069–1075. [Google Scholar] [CrossRef]
  32. Masuda, K. Effects of water on rock strength in a brittle regime. J. Struct. Geol. 2001, 23, 1653–1657. [Google Scholar] [CrossRef]
  33. Rathnaweera, T.D.; Ranjith, P.G.; Perera, M.S.A. Salinity-dependent strength and stress–strain characteristics of reservoir rocks in deep saline aquifers: An experimental study. Fuel 2014, 122, 1–11. [Google Scholar] [CrossRef]
  34. Sampath, K.H.S.M.; Perera, M.S.A.; Elsworth, D.; Ranjith, P.G.; Matthai, S.K.; Rathnaweera, T. Experimental investigation on the mechanical behavior of victorian brown coal under brine saturation. Energy Fuels 2018, 32, 5799–5811. [Google Scholar] [CrossRef]
  35. Swolfs, H.S. Influence of Pore-Fluid Chemistry and Temperature on Fracture of Sandstone under Confining Pressure. Ph.D. Thesis, Texas A&M University, College Station, TX, USA, 1971. [Google Scholar]
  36. Dunning, J.D.; Miller, M.E. Effects of pore fluid chemistry on stable sliding of berea sandstone. Pure Appl. Geeophys. 1984, 122, 447–462. [Google Scholar] [CrossRef]
  37. Feucht, L.J.; Logan, J.M. Effects of chemically active solutions on shear behaviour of a sandstone. Tectonophysics 1990, 175, 159–176. [Google Scholar] [CrossRef]
  38. Mohan, K.K.; Reed, M.G.; Fogler, H.S. Formation damage in smectitic sandstones by high ionic strength brines. Colloids Surf. Physicochem. Eng. Asp. 1999, 154, 249–257. [Google Scholar] [CrossRef]
  39. Feng, X.-T.; Chen, S.; Zhou, H. Real-time computerized tomography (ct) experiments on sandstone damage evolution during triaxial compression with chemical corrosion. Int. J. Rock Mech. Min. Sci. 2004, 41, 181–192. [Google Scholar] [CrossRef]
  40. Shukla, R.; Ranjith, P.G.; Choi, S.K.; Haque, A.; Yellishetty, M.; Hong, L. Mechanical behaviour of reservoir rock under brine saturation. Rock. Mech. Rock. Eng. 2013, 46, 83–93. [Google Scholar] [CrossRef]
  41. Nur, A.; Byerlee, J.D. An exact effective stress law for elastic deformation of rock with fluids. J. Geophys. Res. 1971, 76, 6414–6419. [Google Scholar] [CrossRef]
  42. Brown, R.J.; Korringa, J. On the dependence of the elastic properties of a porous rock on the compressibility of the pore fluid. Geopysics 1975, 40, 608–616. [Google Scholar] [CrossRef]
  43. Rice, J.R.; Cleary, M.P. Some basic stress diffusion solutions for fluid-saturated elastic porous media with compressible constituents. Rev. Geophys. 1976, 14, 227–241. [Google Scholar] [CrossRef]
  44. Zienkiewicz, O.C.; Chan, A.; Pastor, M.; Schrefler, B.; Shiomi, T. Computa-Tional Geomechanics with Special Reference to Earthquake Engineering; John Wiley & Sons: New York, NY, USA, 1999; pp. 105–110. [Google Scholar]
  45. Handin, J.; Hager, R.V., Jr.; Friedman, M.; Feather, J.N. Experimental deformation of sedimentary rocks under confining pressure: Pore pressure tests. AAPG Bull. 1963, 47, 717–755. [Google Scholar]
  46. Blanpied, M.L.; Lockner, D.A.; Byerlee, J.D. An earthquake mechanism based on rapid sealing of faults. Nature 1992, 358, 574–576. [Google Scholar] [CrossRef]
  47. Bieniawski, Z.T. Mechanism of brittle fracture of rock: Part I—Theory of the fracture process. Int. J. Rock. Mech. Min. Sci. Geomech. Abstr. 1967, 4, 395–406. [Google Scholar] [CrossRef]
  48. Han, G. Rock Stability under Different Fluid Flow Conditions. Ph.D. Dissertation, University of Waterloo, Waterloo, ON, Canada, 2003. [Google Scholar]
  49. Eberhardt, E.; Stead, D.; Stimpson, B.; Read, R. Identifying crack initiation and propagation thresholds in brittle rock. Can. Geotech. J. 1998, 35, 222–233. [Google Scholar] [CrossRef] [Green Version]
  50. Erguler, Z.; Ulusay, R. Water-induced variations in mechanical properties of clay-bearing rocks. Int. J. Rock Mech. Min. Sci. 2009, 46, 355–370. [Google Scholar] [CrossRef]
  51. Hamdia, K.; Silani, M.; Zhuang, X.; He, P.; Rabczuk, T. Stochastic analysis of the fracture toughness of polymeric nanoparticle composites using polynomial chaos expansions. Int. J. Fract. 2017, 206, 215–227. [Google Scholar] [CrossRef]
  52. Vu-Bac, N.; Lahmer, T.; Zhuang, X.; Nguyen-Thoi, T.; Rabczuk, T. A software framework for probabilistic sensitivity analysis for computationally expensive models. Adv. Eng. Softw. 2016, 100, 19–31. [Google Scholar] [CrossRef]
Figure 1. (a) Coring machine used to core the sample with 38 mm diameter, (b) Samples saturated with different fluids under vacuum in saturation chambers, and (c) Shaped and painted sample soon before the strength tests.
Energies 11 02795 g001
Figure 2. Experimental setup used for the mechanical testing, indicating the UCS machine, Acoustic emission system and ARAMIS camera.
Energies 11 02795 g002
Figure 3. Variation of siltstone strength with pore fluid saturation. The UCS reduces with the water saturation and low NaCl concentrations, but higher order of NaCl concentrations cause a slight strength re-gain.
Energies 11 02795 g003
Figure 4. Variation of siltstones’ (a) Young’s modulus and (b) Poisson’s ratio with pore fluid saturation. Note that water saturation causes a reduction of Young’s modulus and increment of Poisson’s ratio. But saturation of brine with high concretions causes both trends to be reversed.
Energies 11 02795 g004
Figure 5. Variation of siltstone BI with pore fluid saturation condition. Note that the BI variation with increasing NaCl concentration exhibits a U-shaped trend, in which BI decreases initially, but increases with increasing NaCl concentration.
Energies 11 02795 g005
Figure 6. Cumulative energy vs. stress curves for varyingly saturated siltstones, which indicates the crack propagation ranges of samples upon mechanical loading.
Energies 11 02795 g006
Figure 7. ARAMIS images of varyingly saturated siltstone samples; (a) dry, (b) water-saturated, (c) 10% NaCl-saturated, (d) 20% NaCl-saturated, and (e) 30% NaCl-saturated. Note that the colour maps indicate the sample deformation in both axial and lateral direction soon before failure.
Energies 11 02795 g007
Figure 8. SEM test results of (a) water-saturated (b) 10% NaCl-saturated (c) 20% NaCl brine-saturated and (d) 30% NaCl-saturated specimens. Note that the higher order concentrations of NaCl cause NaCl precipitation in siltstone pores, resulting in a slight strength increment.
Energies 11 02795 g008
Table 1. Various BI definitions used in the field.
EquationParametersTesting MethodReference
B 1 = τ p τ r τ p τ p —peak strength (MPa)
τ r —residual strength (MPa)
Stress-strain testBishop [16]
B 2 = D E O E D E —reversible strain
O E —total strain
Stress-strain testHucka and Das [17]
B 3 = A r e a   D C E A r e a   O A B C E A r e a   D C E —reversible energy
A r e a   O A B C E —total energy
Stress-strain test
B 4 = σ c σ t σ c + σ t σ c —compressive strength (MPa)
σ t —tensile strength (MPa)
Brazilian tensile test,
Compression test
B 5 = s i n θ θ —internal friction angle (o)Mohr’s envelope
B 6 = q σ c q —percentage of lines formed
σ c —compressive strength (MPa)
Protodyakonov impact test
B 7 = H μ H K H μ —micro-indentation hardness (MPa)
H —macro-indentation hardness (MPa)
K —constant (MPa)
Hardness test
B 8 = H K c H —hardness (MPa)
K c —fracture toughness (MPa·m1/2)
Hardness testLawn and Marshall [18]
B 9 = σ c σ t 2 σ c —compressive strength (MPa)
σ t —tensile strength (MPa)
Brazilian tensile test,
Compression test
Kahraman and Altindag [19]
B 10 = E H c K I C 2 E H c —indentation work
K I C 2 —fracture energy
Quinn and D Quinn [20]
B 11 = F m a x P F m a x —maximum force applied (kN)
P —penetration (mm)
Punch penetration testYagiz [21]
B 12 = ( E E m i n E m a x E m i n + υ υ m a x υ m i n υ m a x ) 2 E —Young’s modulus (GPa)
υ —Poisson’s ratio
m i n and m a x indicate the interval of interest
Stress-strain testRickman, Mullen, Petre, Grieser and Kundert [13],
Waters, et al. [22]
B 13 = Q Q + C + C L Q —weight of quartz
C —weight of carbonate
C L —weight of clay minerals
Mineral composition-based analysisJarvie, Hill, Ruble and Pollastro [9]
B 14 = Q + D o l Q + D o l + L m + C l + T o c Q —weight of quartz
D o l —weight of dolomite
L m —weight of limestone
C l —weight of clay minerals
T o c —weight of organic content
Mineral composition-based analysisGale [23]
B 15 = 1.8748 ϕ + 0.9679 ϕ —neutron porosityPorosity-based analysisYilmaz, et al. [24], Jin, et al. [25]
Table 2. Measured and calculated values of siltstone’s mechanical properties.
SampleNo.UCS (MPa)Avg. UCS (MPa)E (GPa)Avg. E (GPa)νAvg. νBI %Avg. BI %
Dry1124113.53839.50.280.2657575
2103410.2575
Water saturated17977.52829.50.30.284240
276310.2638
NaCl 10%16562.524.624.70.280.2652828.5
26024.80.2529
NaCl 20%1656425.425.250.250.243332
26325.10.2331
NaCl 30%16464.527.3270.180.183836.5
26526.70.1835

