Analyzing the Performance of Wave-Energy Generator Systems (SSG) for the Southern Coasts of Iran, in the Persian Gulf and Oman Sea


1
Department of Civil Engineering, University of Sistan and Baluchestan, Zahedan 987-98155, Iran
2
Department of Civil, Architectural and Environmental Engineering, University of Naples Federico II, 80125 Napoli, Italy
*
Author to whom correspondence should be addressed.
Energies 2018, 11(11), 3209; https://doi.org/10.3390/en11113209
Submission received: 13 October 2018
/
Revised: 3 November 2018
/
Accepted: 11 November 2018
/
Published: 19 November 2018
(This article belongs to the Section F: Electrical Engineering)
Abstract
:The Sea-wave Slot-cone Generator (SSG) wave-energy device is a type of electric energy converting structure that converts energy from sea waves, and which is designed and installed based on wave-overtopping in areas. Most of the previous studies have evaluated SSG systems based on hypothetical waves, considering the system geometry variations. However, it is important to consider the real wave conditions. This paper presents the results of a numerical study to investigate the performances of an SSG system in the context of the Persian Gulf and Oman Sea, where there is a strong need for renewable energies. The computational fluid dynamic (CFD) code Flow-3D was applied. First of all, available experimental data were applied to calibrate and evaluate the accuracy of the numerical model. Then, the real wave conditions on the coasts of the Persian Gulf and Oman Sea were imposed on the JONSWAP spectrum for the numerical modeling. Results of the study demonstrated that the hydraulic efficiency of the SSG system in the Persian Gulf and Oman Sea was low for wave heights lower than 0.5 m. The nominal efficiency of the system was relatively more than 60% for wave heights higher than 1 m; thus, the performance of the SSG system was suitably evaluated. Finally, the numerical results demonstrated that the most optimal conditions, with a nominal efficiency of 97%, were obtained for incident waves that had a height of 2 m and a period of 5.6 s. In this case, the hydraulic performance of the system was maximum.
1. Introduction
Wave energy can be considered as a focused form of solar energy. Winds are caused by differences in the Earth’s temperature and with blowing on the sea water, waves are produced. Subsequently, wind’s energy is partially changed into waves. The transferred energy and the surface wave depend on the wind’s speed, duration, and fetch length [1]. The global power of waves is estimated to be about 8000 to 80,000 trillion watt/hour annually (Tw10-1), which is the same order of magnitude as the electrical energy consumption in the world [2]. In various evaluations, the highest wave energy has been reported in western regions of America, Europe, and New Zealand. The best wave characteristics, for extraction as a renewable energy resource, are found in medium to high latitudes and on deep waters (more than forty meters), which reach power densities of 60–70 kW/m. However, only about two percent of the world’s 800,000 km of coastlines exceed a power density of 30 kW/m, with a technical potential of about 500 GWe, based on a conversion efficiency of forty percent [3]. The wave power is proportional to the square of the wave height, and to the square of the wave period. In winter, wave energy is at its highest magnitude. Wave energy can be expressed in two forms: Kinetic and potential. The cyclical motion of the wave proceeds the energy.
Energy availability is definitely an important factor in wave energy extraction, but a high energy potential usually exhibits exceptional wave conditions during long periods. Such a situation raises serious engineering challenges in designing and commissioning Wave Energy Converters, increasing the costs of development, construction, installation, insurance and maintenance of these systems. (Liberti et al. [4] and Iuppa et al. [5]). Nevertheless, the interest in Wave Energy Converters is increasing, and there are a number of devices that have passed the demonstration phase. Some researchers have proposed, in order to analyze the ease of implementation of Wave Energy Converters, it is important that a planning study is carried out that not only addresses energy extracted but also economic features [6,7].
Energy extraction has been investigated, through use of various equipment and systems, by a few researchers, such as Almeida [8], Franzitta and Curto [9], Ross [10], Khosravi et al. [11], Evans et al. [12], and Iuppa et al. [13].
Unlike wind turbine-based energy generation systems there are a wide variety of wave-energy technologies, due to various wave-energy absorptions, and depending on water depth and situation (coastal line, coastal proximity, and offshore). A recent study has revealed that more than 200 great energy extraction projects have been done in various study and operation stages (Luo et al. [14]). This number is increasing at the present time. Generally, wave energy can be absorbed using three different types of wave equipment, including attenuator wave-energy conversion systems, oscillating-water-column wave-energy conversion systems, and overtopping wave-energy conversion systems. Depending on its environmental and efficiency conditions, the appropriate method is employed in the future for coastal areas [15,16]. The most commonly used systems, operated in many countries, are Tapchan [17] and Wave Dragon [18], and also the only prototype under development under the Sea-wave Slot-cone Generator (SSG) system is Overtopping BReakwater for the Energy Conversion (OBREC). The prototype unit has been embedded in the rubble-mound breakwater at the port of Naples (Italy) (Contestabile et al. [19]).
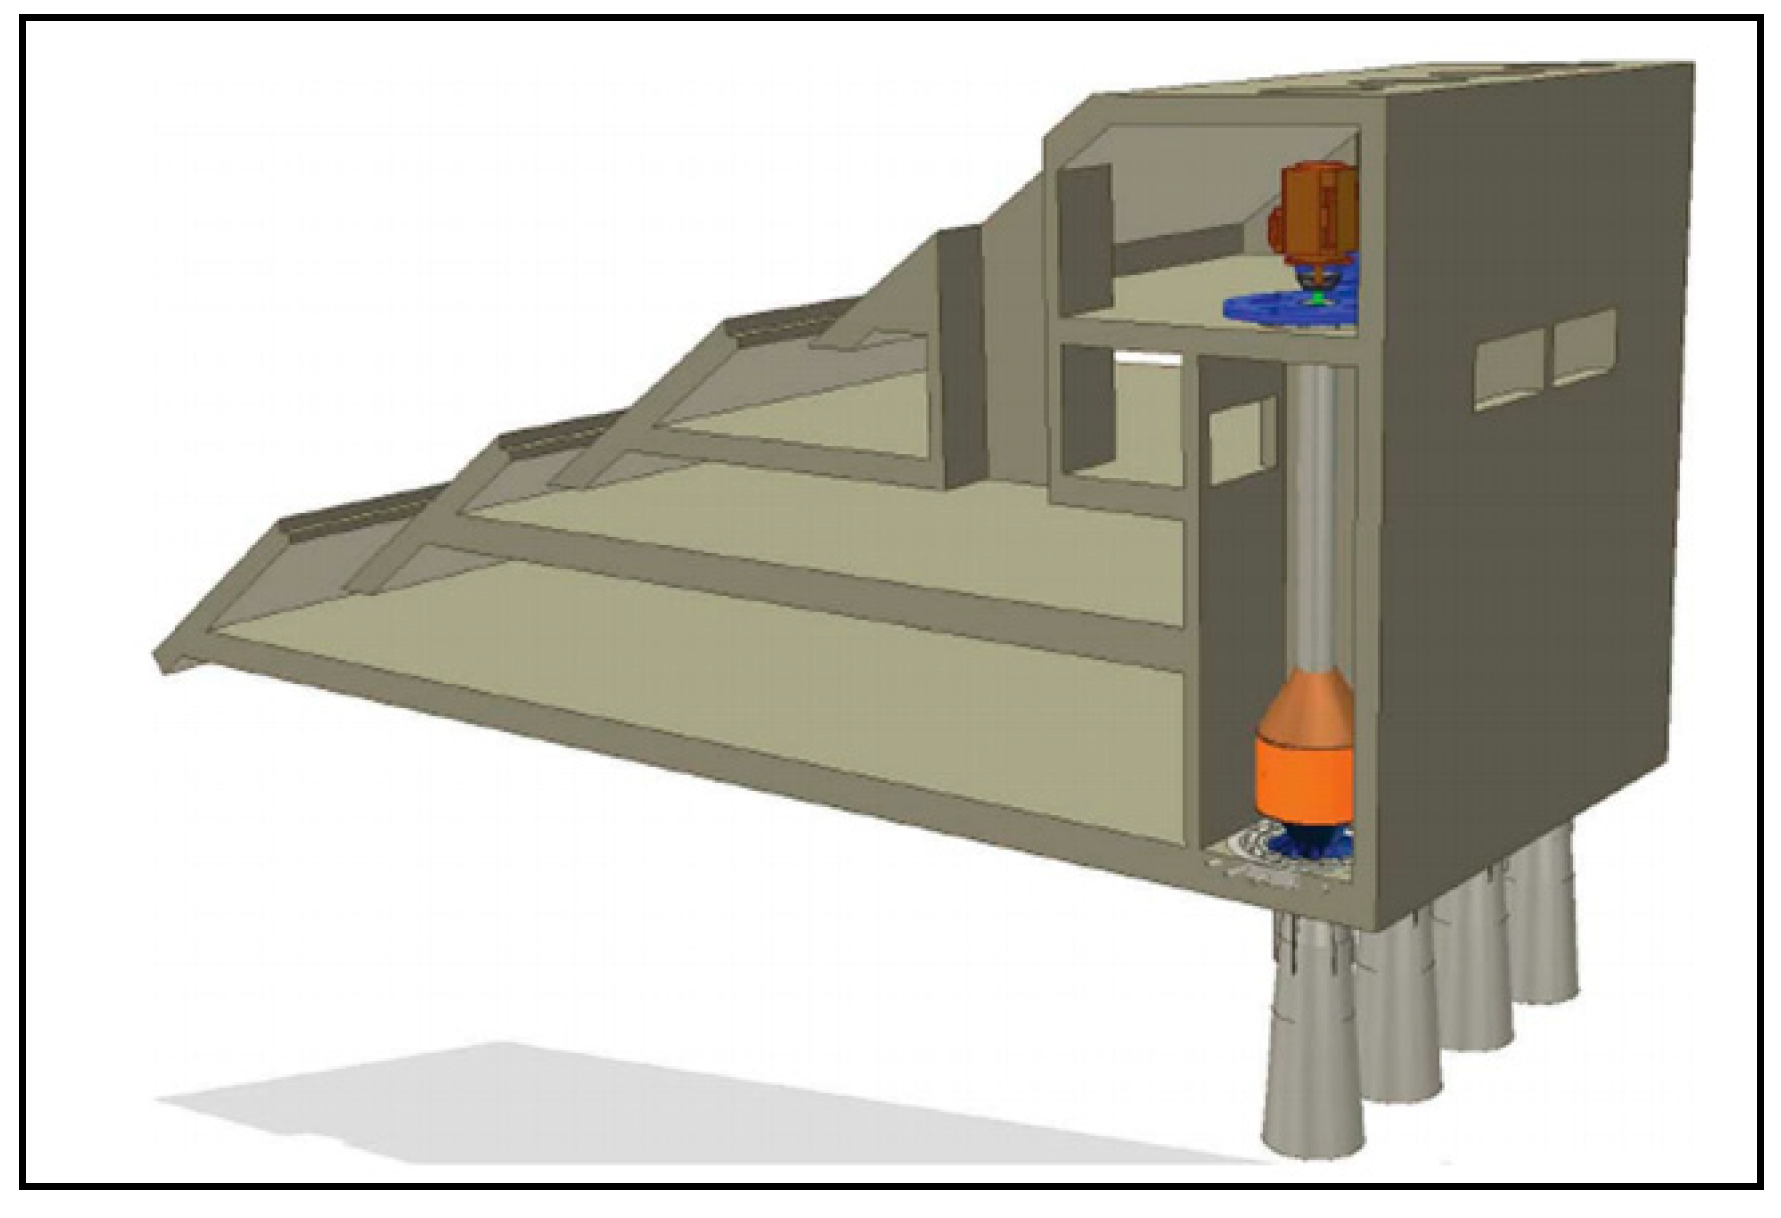
The Sea-wave Slot-cone Generator system is a type of wave energy, into electrical energy, converter. SSG workability is as following: Run-up waves, over the slope into the breakwater tanks, are trapped, along with the cascades falling from the common channel, to which all tanks are connected; then, turbine curtains are rotated at the existing place of each tank. These curtains cause the rotation of a vertical axis that is connected to a generator. In this way, the mechanical energy necessary for generator performance is provided. The overall configuration of the SSG system is shown in Figure 1.
There is a direct relationship between the SSG extractable energy extent and the average depth of the sea. The way of implementing this type of structure is similar to that used for the dike embankment or the Caisson concrete breakwaters [20,21], which were placed as precast or constructed on site. Behind the channel structure there is a tank for internal air to exit into during the entry of waves. The air trapped in the tank can then exit from the tank as no barrier is created. A part of the SSG geometry is optimized based on the wave run-up (Hyun and Jungrungruengtaworn [22], Iuppa et al. [23], and Buccino et al. [24]). Such a system works in the way that, even if a tank can be dehydrated by several structure tanks, there is no barrier between the entering flow and the turbine, and thus optimization is maximized. The multi-stage turbine innovation in the breakwater structure is shown in Figure 1.
At Aalborg University, in 2005, one of the most valuable experimental studies to investigate the hydraulic efficiency of energy generation systems using the SSG device was conducted [25]. In this study, the SSG system was investigated for use at Kvitsoy Island in Norway, under the conditions of the JONSWAP wave spectrum. Based on the studies conducted by Margheritini et al. (2009), the geometrical indices of wave entrance that influence the performance of the SSG system overpass include the run-up on-ramp of the SSG structure, the length of the tanks, the slope angle of the ramp, the slope angle of the plates for each tank, the vertical space between two subsequent tanks’ plates, the number of tanks, and the crest shape of the surfaces [25]. Furthermore, the most important complementary studies have looked at: Using the parallel plates on the slope to achieve the maximum efficiency [26], the effect of lateral walls on the performance [27], along with the analysis of reflective waves on SSG systems [28].
A short review on these systems, from their start-up to now, shows that most of the studies have been performed with hypothetical wave or laboratory characteristics. On the other hand, existing investigations have focused on SSG system geometry that has been developed for the target countries’ coasts. Due to the critical environmental conditions of the Middle East, including Iran, and the strong need for renewable energies in this region, it could be important to evaluate the performance of SSG systems on the coasts of the Persian Gulf and Oman Sea. Therefore, the present study applied the computational fluid dynamic (CFD) method to evaluate the performance of energy generation systems in the Persian Gulf and Oman Sea.
This paper is organized as it follows: Section 2 provides information on the experimental procedure and setup; in Section 3 and Section 4 the numerical CFD simulations are described and presented; Section 5 describes the calibration and verification of the model; in Section 6 the numerical CFD simulation are described for the case study and comparatively discussed with the physical model tests; Section 7 is devoted to an overall discussion with some concluding remarks; and in Section 8, conclusions are finally drawn.
2. Materials and Methods
2.1. Geometrical Characteristics of the SSG System
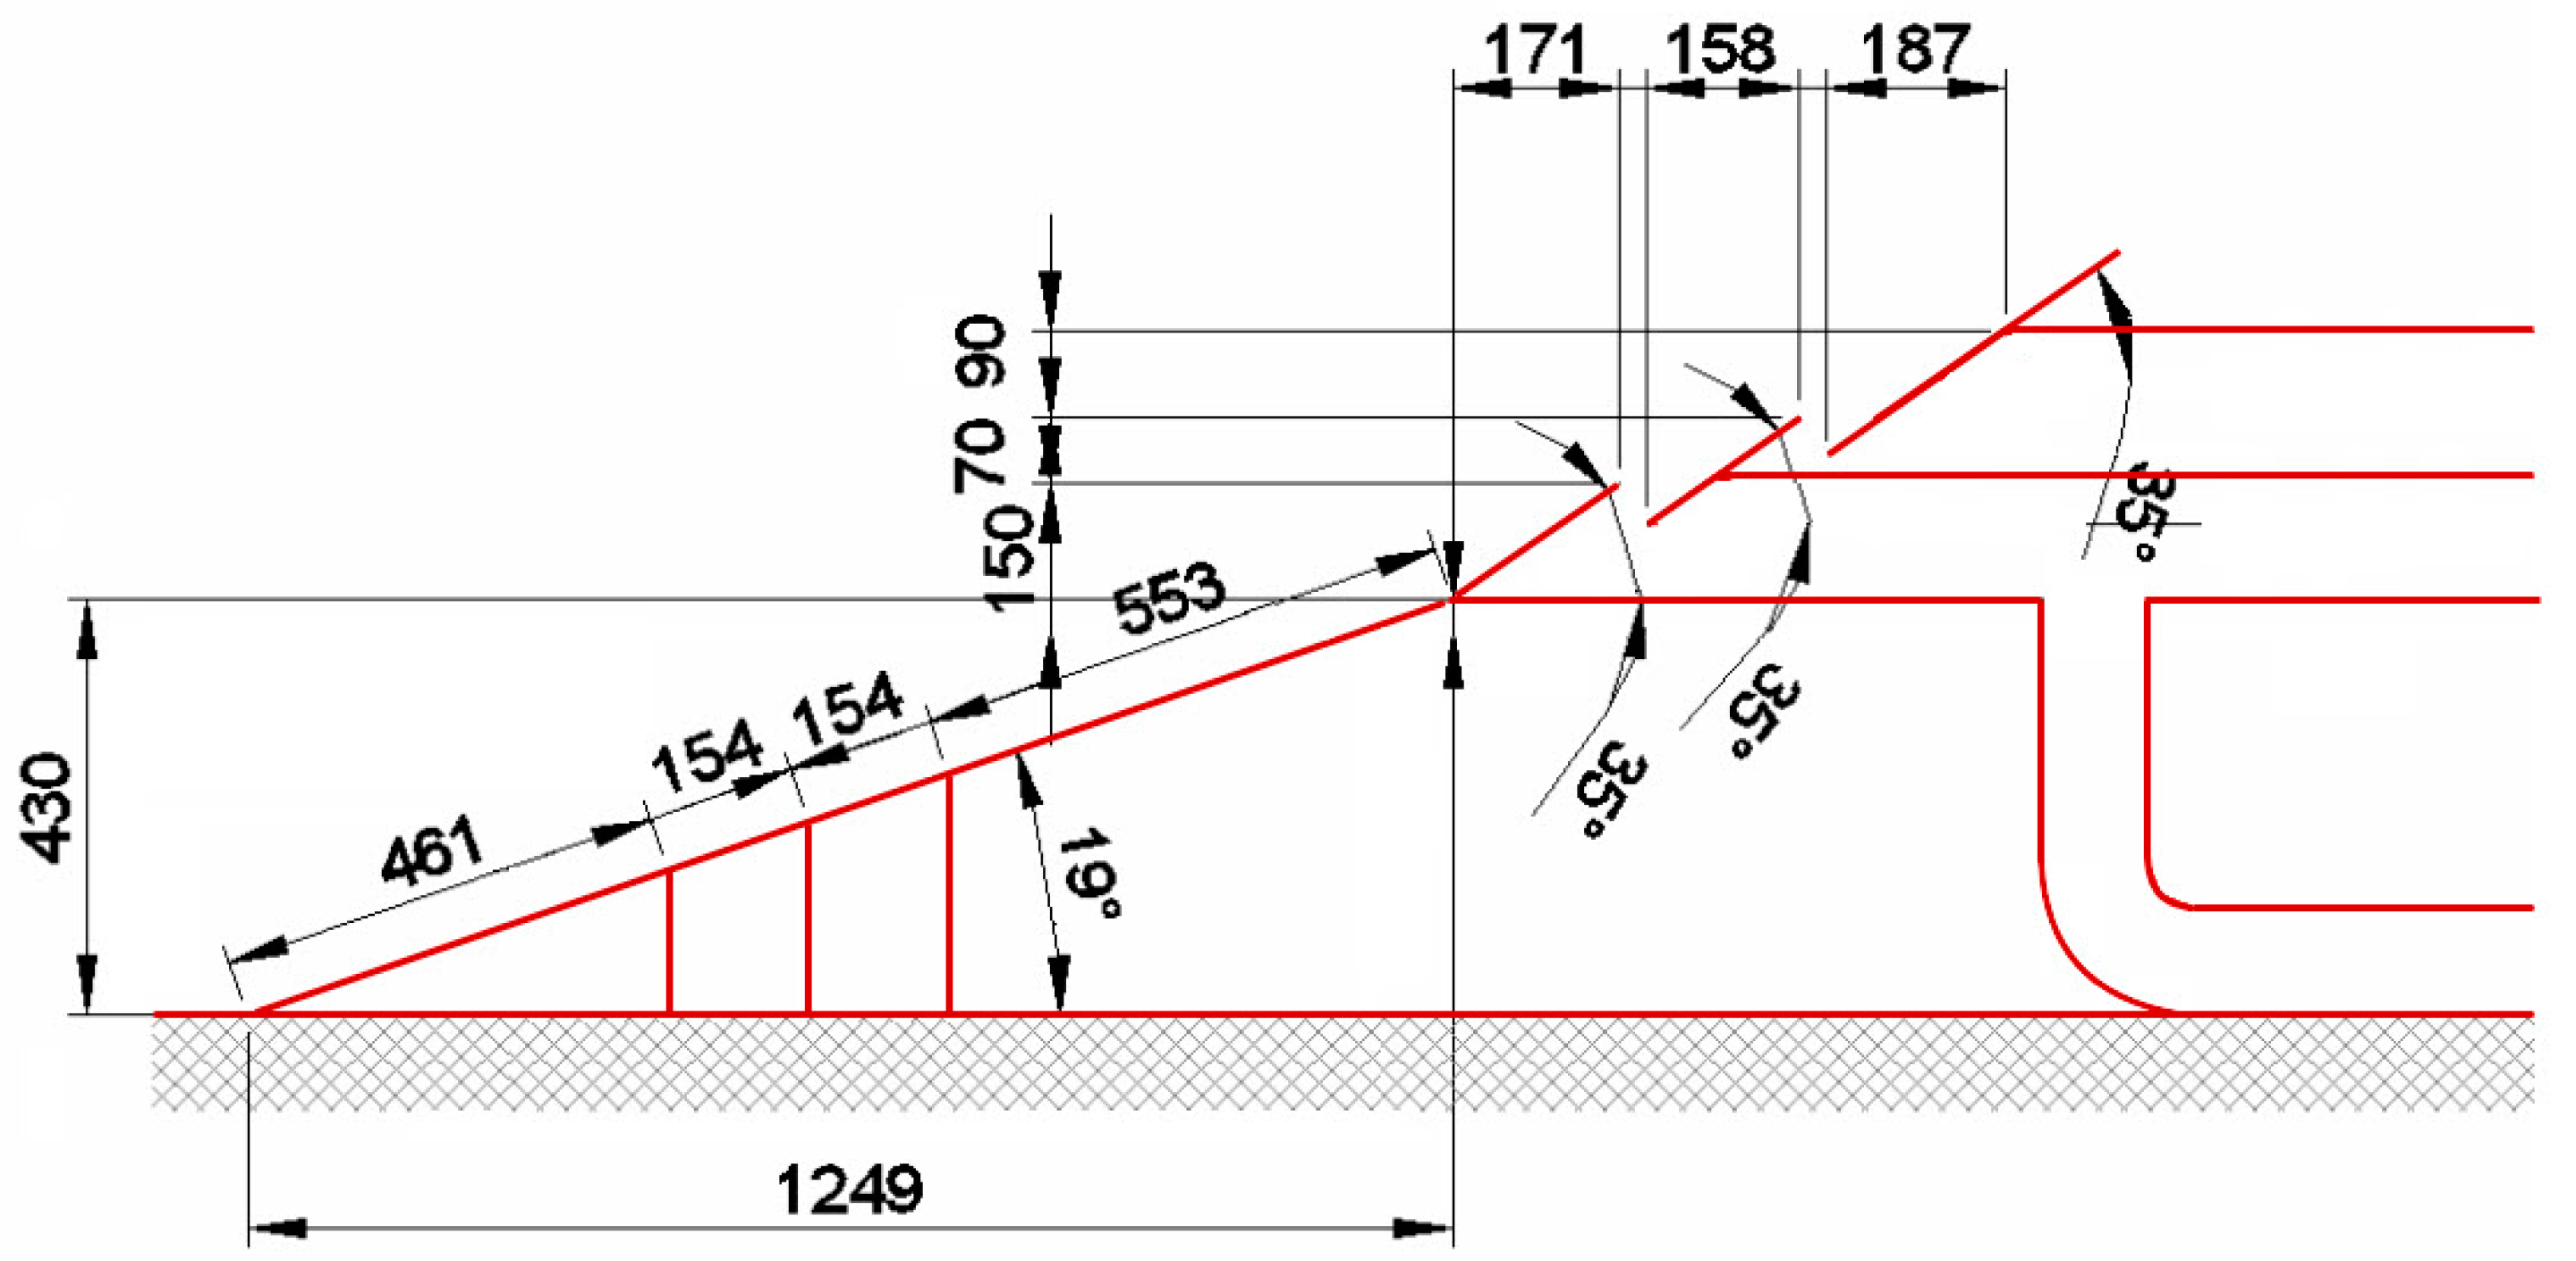
In the present study, the common geometry of the SSG system was used for 3-D incident wave simulation. The geometrical characteristics in the cross section of the SSG system are shown in Figure 2. In the Figure, tanks 1, 2, 3, and the SSG system body slope were similar to the model constructed in laboratory [25].
2.2. Hydraulic Efficiency
To investigate hydraulic efficiency of the SSG system, analytical and empirical relationships were used. The average wave power level per unit width (W/m) of the SSG system can be computed based on wave height and period as [25]:
where is the water density; g is gravity acceleration; Hs is the index wave height, and Te is the energy period, which has been estimated to be Tp/1.15 (Tp: wave peak period) [25]. Although Equation 1 is strictly valid only for deep water conditions, the error is less than 10% for a wide range of wave conditions [13].
In addition, the average potential power of flow overpasses in per unit width (W/m) can be computed as:
where qov,j represents the mean volume of water entering the jth tank, per unit width, and Rc,j is the crest height of the jth tank from the average water surface. Here, N shows the total number of tanks in the SSG system. Therefore, the hydraulic efficiency can be written as:
3. Flow-3D Software
Flow-3D (Version 10.0.0.1) is a commercial CFD code that was applied for the simulation of a wide range of issues related to the water and environment industry, from large hydropower projects to hydraulic and marine structures [29]. Flow-3D was also applied for simulating waves and various coastal structures (Movahedi et al. [30], Cavallaro et al. [31], Mansoori et al. [32], Maliki et al. [33], and Sayeed et al. [34,35]). The results of recent studies indicate that the Flow-3D code has been proved to simulate the performance of the SSG system. The hydraulic performance of the SSG systems on the coasts of the Persian Gulf and Oman Sea was evaluated through simulating the hydraulic conditions of waves and the geometry of the system. The numerical simulation was carried out using the numerical model of Flow-3D. Due to the use of finite volume method in a regular meshing, the employed discrete equations are related to the finite difference method. In Flow-3D, two methods have been used for simulation [36,37]. The first one is volume of fluid (VOF) which is used to indicate free surface behavior. The second method is the FAVOR, which is used to simulate solid surfaces and volumes, such as the geometric boundaries of the structures body [38]. Within the mesh block, the SSG system is defined as an obstacle that prevents flow through the body of the structure. To define the shape of the mesh, a technique that is called FAVOR was used. It is noticeable that all surfaces, curved or flat, with this first-order approximation have been constructed. This concept is too similar to the TIN which is used in geospatial surveys. During preprocessing of simulation, the location of the SSG system was defined and then retain static all over the modeling period.
Equations governing waves and fluid are the Navier–Stokes equations for momentum and the continuity equation for mass. These equations are like the partial differential equations (PDE). Therefore, the main equations to simulate 3-D waves and flow include differential equations of continuity, mass and momentum conservation laws in the direction of x, y, and z. The flow continuity equation is obtained from the law of conservation of mass through presenting the balance relation for a fluid element. The general continuity equation is:
where indicates the fraction of volume to flow and indicates fluid density. Velocity components u, v, and w are in the direction of x, y, and z, respectively. Ax is the fraction of the surface in the direction of x; Ay and Az are the fraction of the surface y and z axis. Fluid motion equations with velocity components of u, v, and w in three directions (i.e., Navier–Stokes equations) are:
where (Gx, Gy, Gz) represent mass accelerations and fx, fy, and fz stand for viscosity accelerations.
The numerical solution accuracy of Flow-3D, in the first-order accuracy method, depends on the temporal and spatial increment whilst running the model. When the mesh used in the finite volume method is uneven, numerical solution accuracy should be carefully selected, as the first-order accuracy is more appropriate in this case. In all cases, the first-order accuracy can be used for boundary conditions [39,40]. To create geometrical boundaries, geometrical conditions should be recalled as 3-D to the model.
4. Model Setup
Based on the laboratory model, the geometrical model was constructed with the width of 0.5 m in 3-D form. Figure 3 and Figure 4 show the 3-D geometry and longitudinal section of the SSG system. Notably, in the geometrical model construction, just like the laboratory model, a channel was considered at the middle of the model, to get the highest possible similarity to the physical model and to prevent any error in results.
For the numerical simulation of the SSG energy generator systems, using experimental data of [26], the fluid (sea water) was considered non-viscous and incompressible. Also, the density of air and its shear cut coefficient were equal to 1.2 kg/m3 and 0.073, respectively. The experimental model was built of wood, using standard materials, and an average roughness height of 0.3 mm (n = 0.01) was used. Accordingly, in the numerical model, the structure of the body is made of, a Manning’s roughness coefficient of n = 0.01 was applied. All of the simulation and calibration stages of the models were carried out with respect to the same experimental conditions.
The dimensions of the flume, for modeling and analyzing the potential performance of the SSG wave-energy generator systems in the southern coasts of Iran, in the Persian Gulf and Oman Sea, was 300 m length, 9 m width, and 25 m height. It should be noted that there was not a wave absorber module in the Flow-3D numerical model at the wave generation boundary. The distance from the wave generator to the structure was 300 m, which was enough to accommodate two wave lengths of incident waves, which the generator causes to reduce the effect of the wave reflection. To take into account different wave conditions in different periods, it was estimated that between 800 and 1000 waves enter into the SSG system.
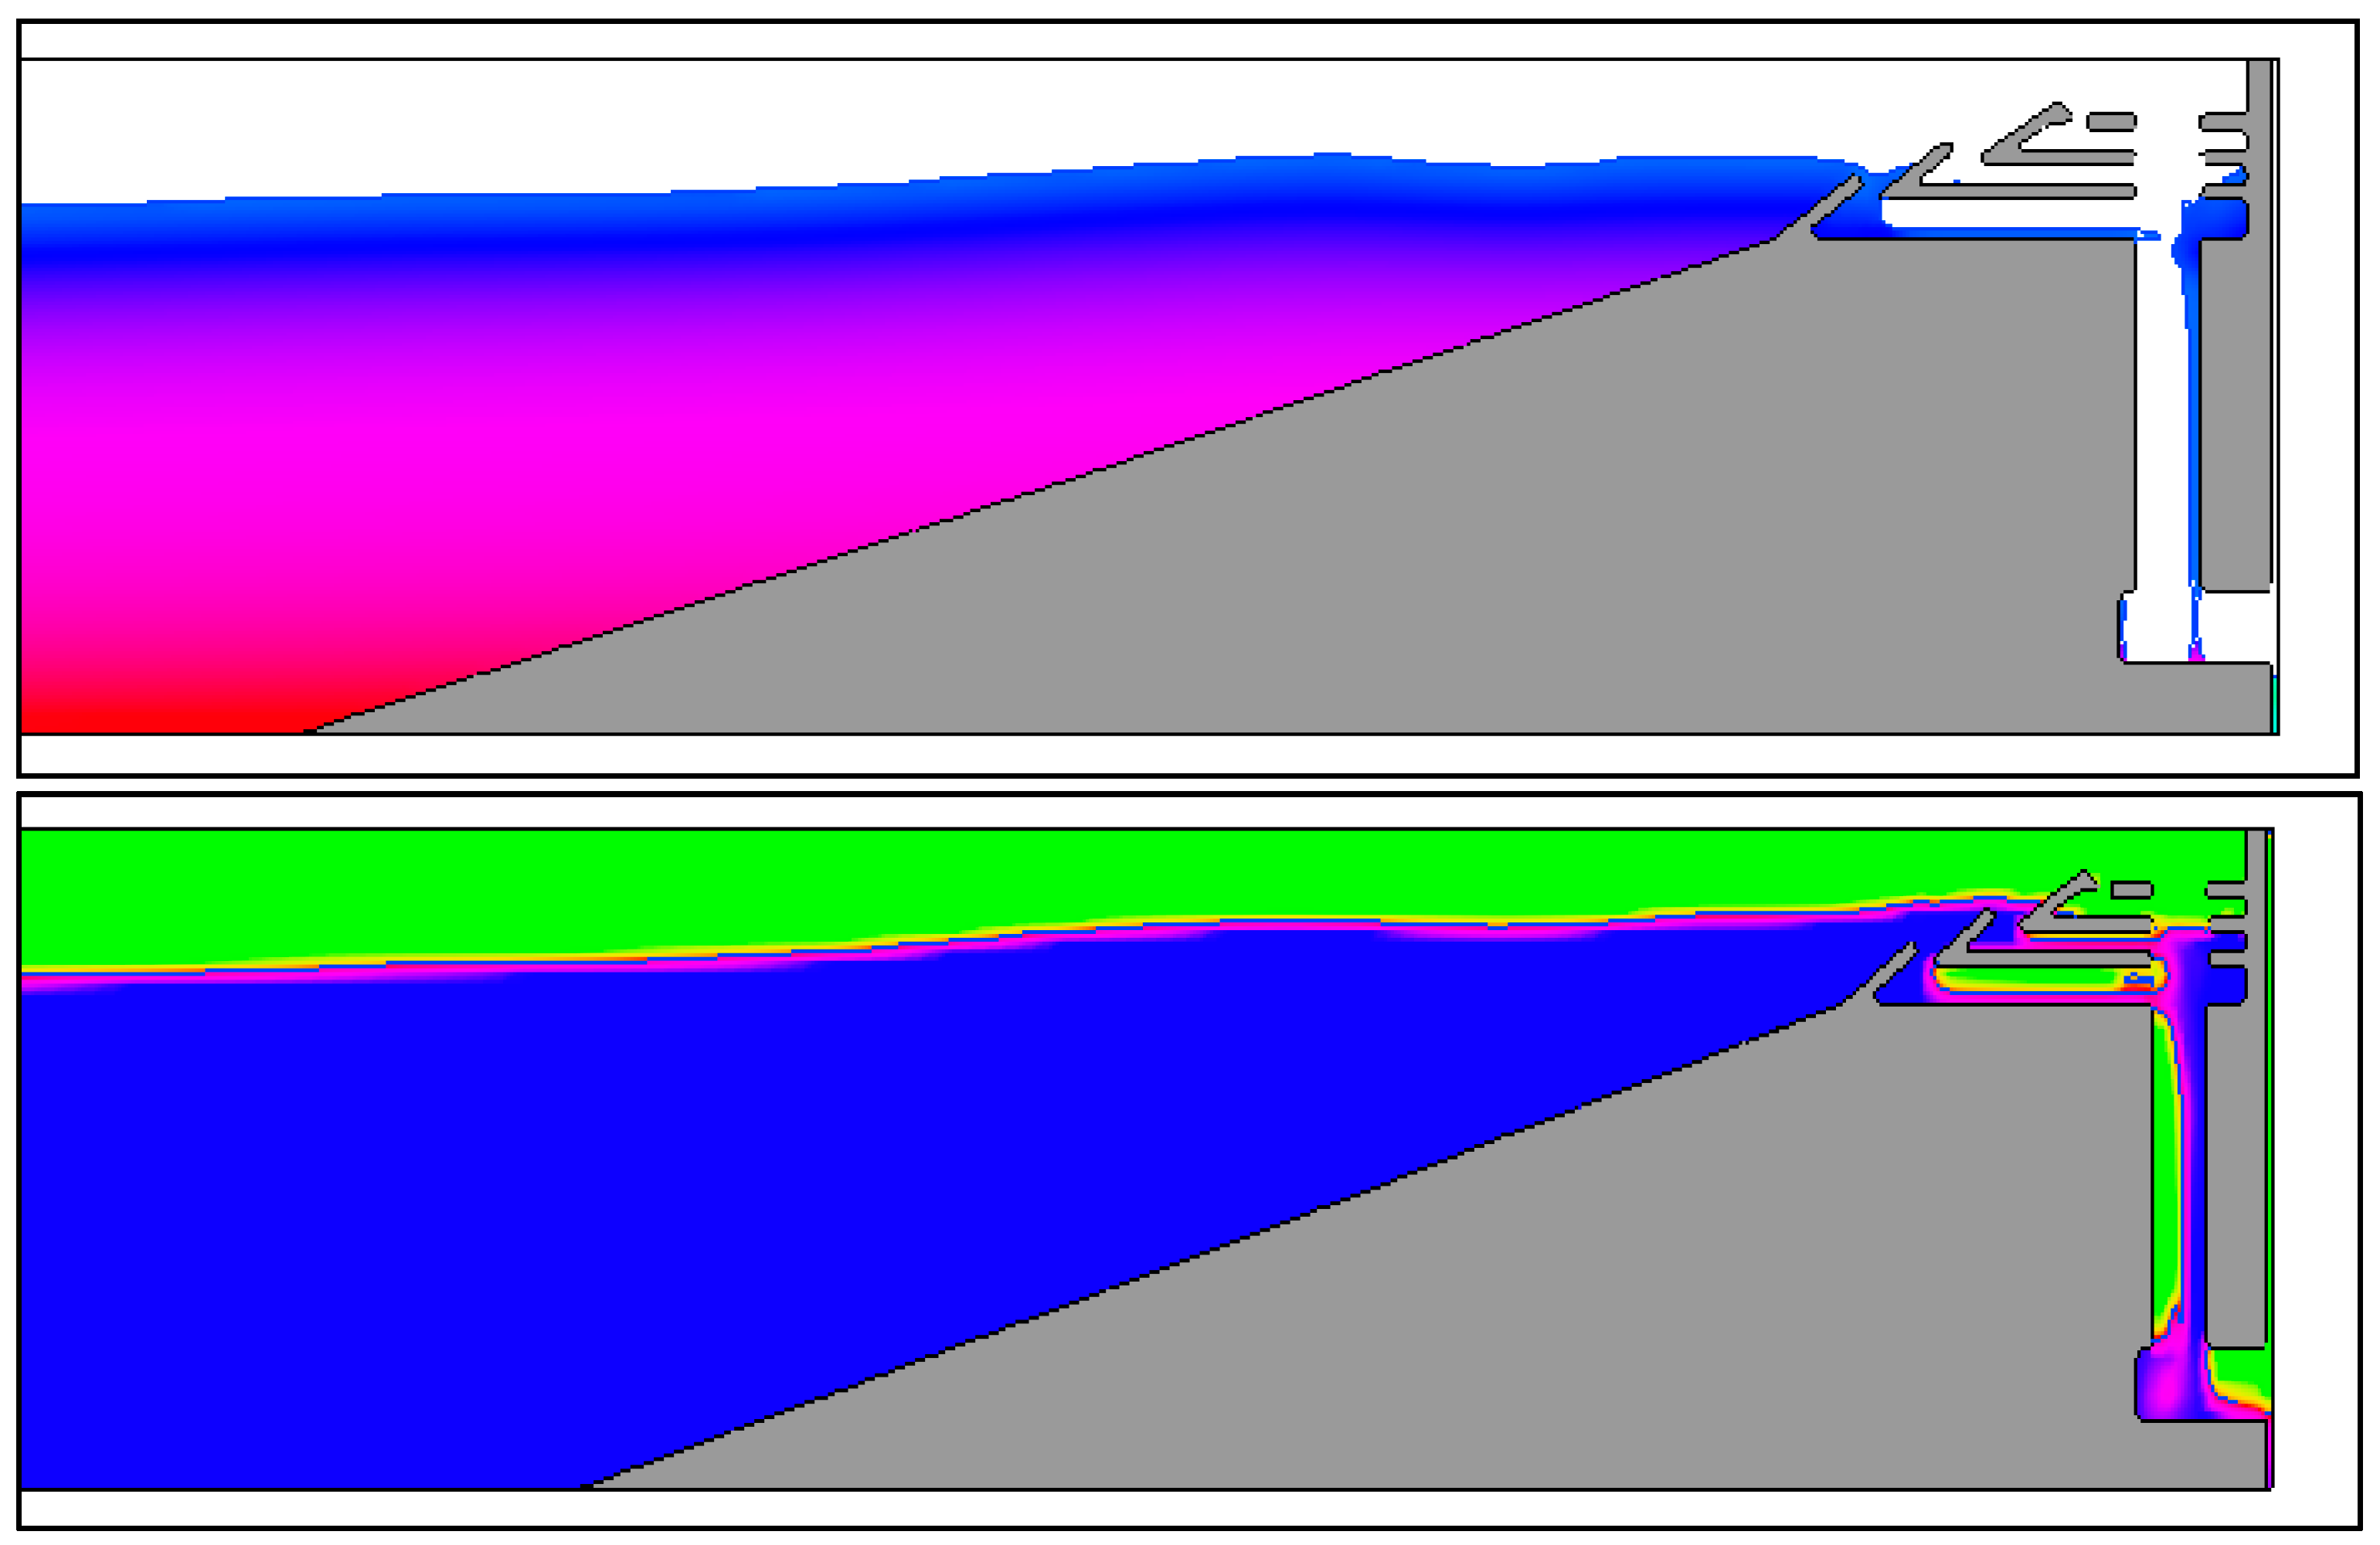
The first step in the numerical model was to calibrate the model. In such a way, the effects of external factors were minimized and the model conditions were approaching those of real conditions. The numerical model was also calibrated in terms of boundary conditions. To extract accurate data from a numerical or laboratory model, it is necessary to reach stable condition states. One of the most important parameters to be evaluated in these systems is the amount of discharge flow per unit length, as the flow rate is dependent on the simulation time. Therefore, the simulation time for all models should be considered in the same laboratory and numerical mode. Accordingly, according to the experimental model, the duration of the implementation of the numerical model was considered to be 3000 s. Figure 5, Figure 6 and Figure 7 show the way waves pass and encounter the SSG system during wave run-up. Wave flow was directed into the tank after entering into the provided duct.
Figure 8 shows the falling flow and the boundary conditions in the chamber for directing the flow out of the model. As shown, the flow was transferred to the energy generator guidance path after entering into the chamber.
According to the results of the numerical model, water level was still at the start of numerical model computations (T = 0.0 s). Regarding the spectrum of the model’s entering waves, used in the calibration, the extent of the output flow discharge was measured. Different tests were performed to achieve better results from Flow-3D, to compare possible alternatives, boundary conditions, and initial appropriate conditions, as well as to measure the sensitivity of the model to various parameters. It is well-known that the sensitivity of the numerical models to meshing and solution-field detachment is one of the most important issues in numerical models. Accordingly, various meshing patterns were proposed, and each of them had its own pros and cons. Flow-3D, relative to solid boundaries and meshing, showed relatively different behaviors compared to other dynamic fluid computational packages. To determine meshing limitations, some blocks were specified, in which all considered structure dimensions and free space were defined. All considered details in a block could be taken into consideration. Figure 9 shows a numerical model and FAVOR method for various meshing. According to the aforementioned explanations, it can be concluded that creating appropriate solid boundaries in numerical model meshing, particularly in geometrical models (including the proposed model), is the biggest limitation, and thus an appropriate selection can increase computational accuracy. In the present study, meshing was investigated as single-block and multiple-block in various tests, and the best meshing was selected for the simulations.
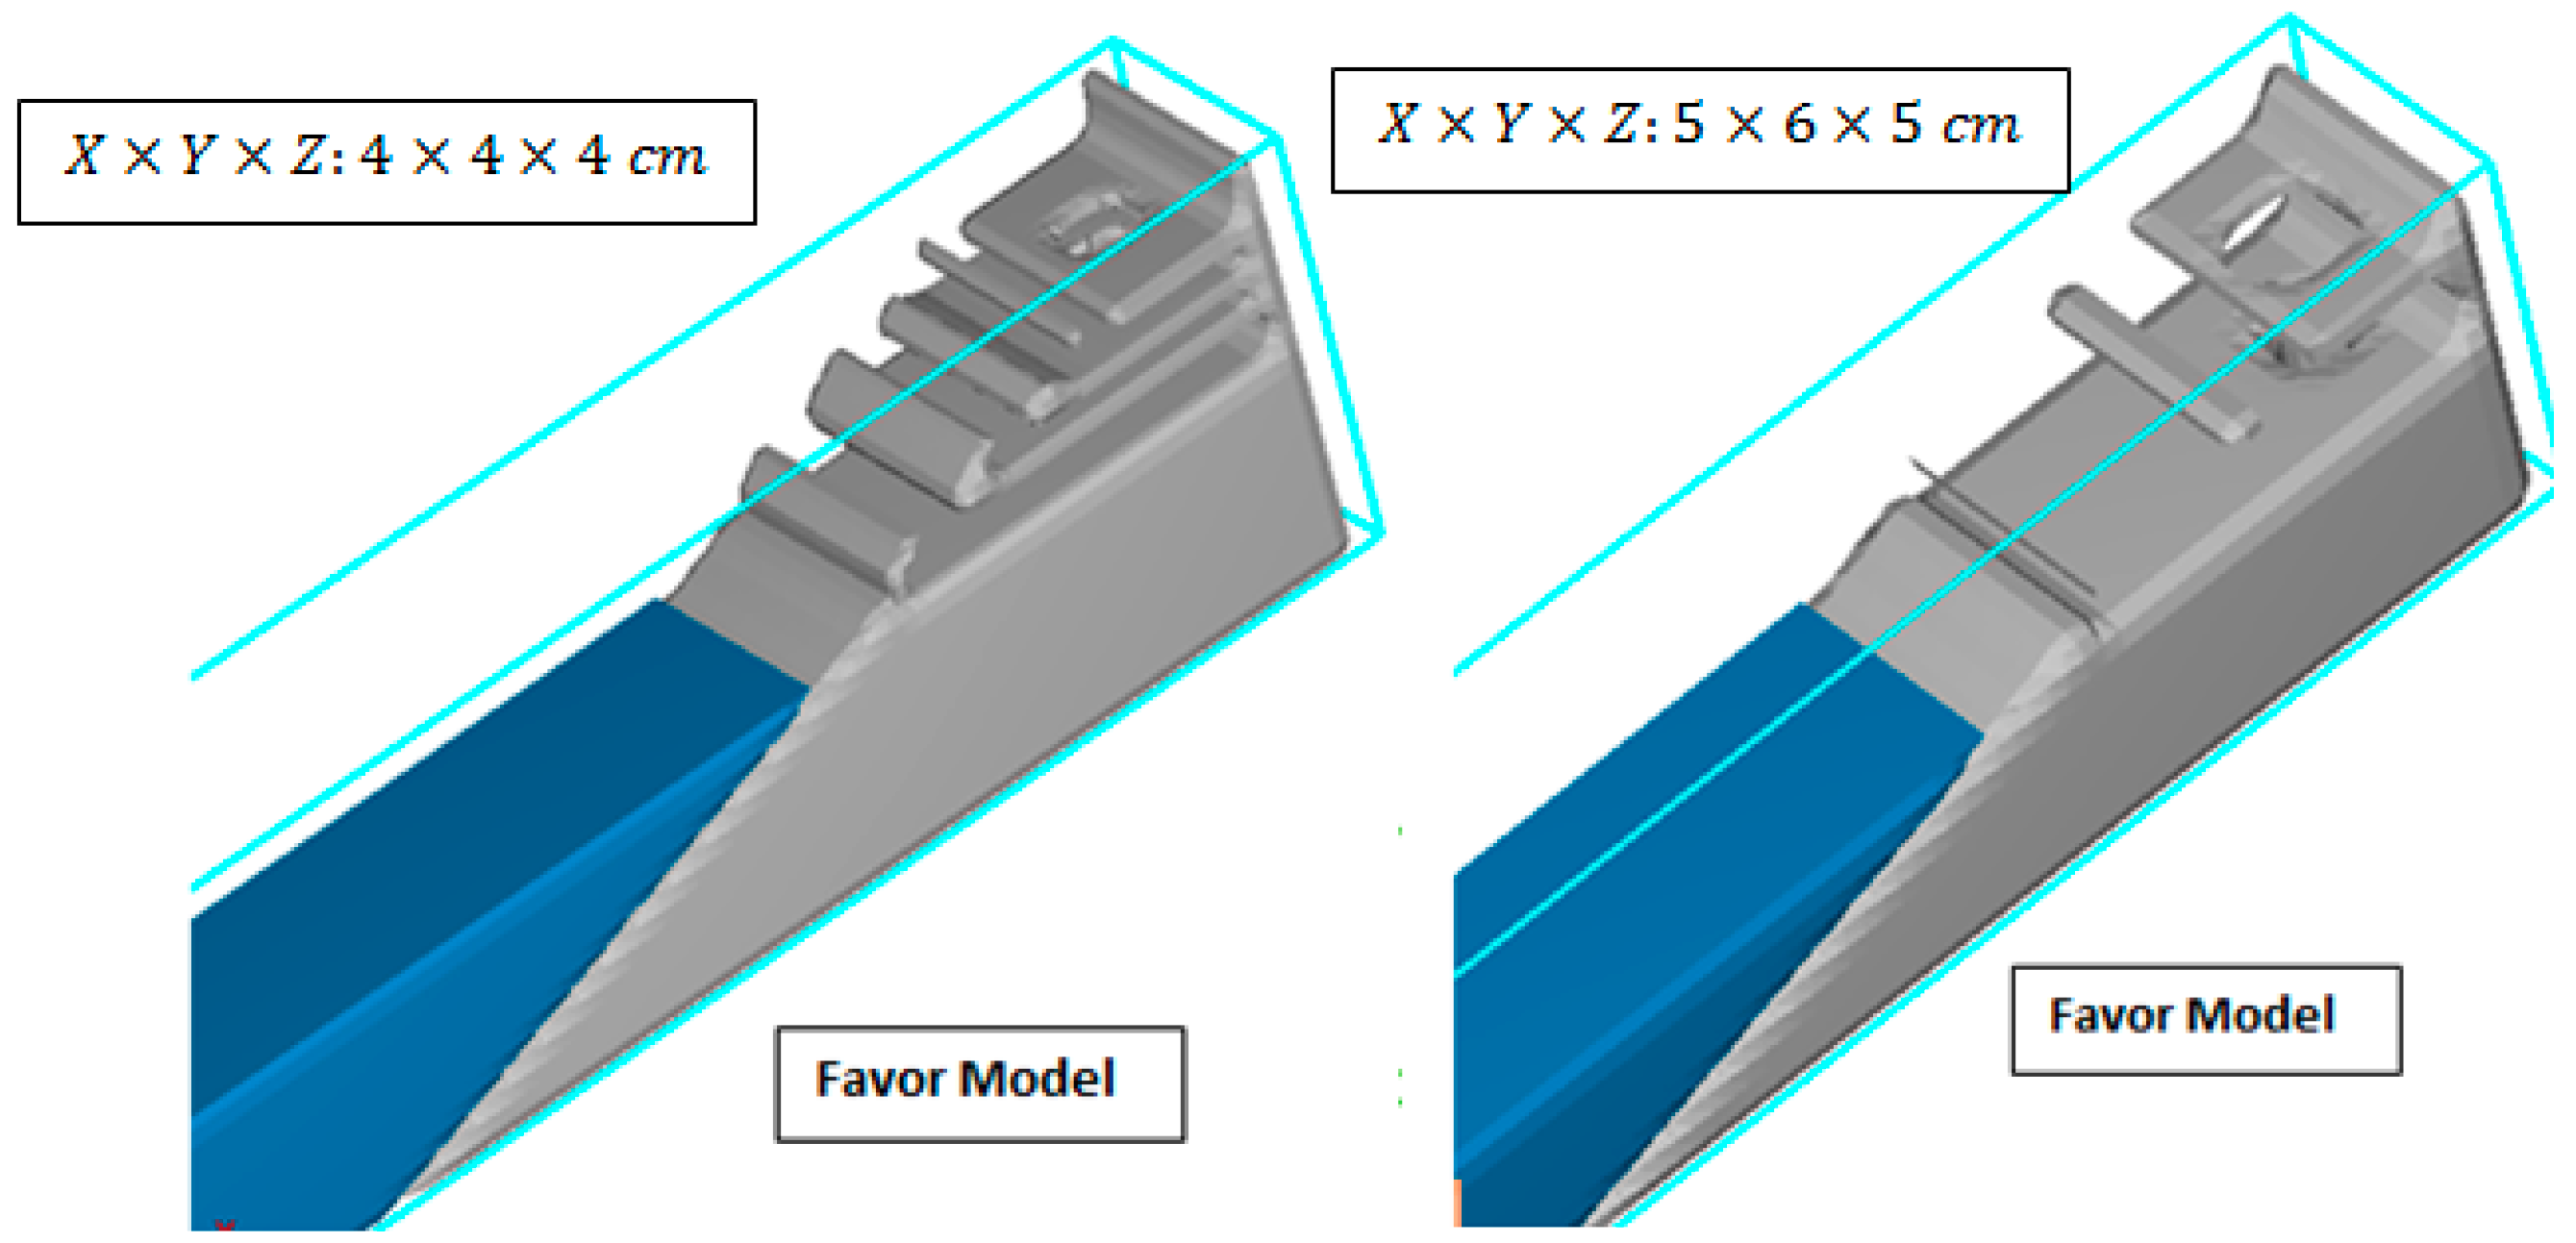
One of the most important advantages of Flow-3D, compared to other wave field and flow simulation models, is that it can determine and estimate the best solution field meshing based on the studied geometrical model. To determine the size of the computational field meshing in the SSG wave-energy extraction device, computational cells were firstly considered in length, width, and height of 5, 6, and 5 cm, respectively. After validating meshing cell dimensions through FAVOR, it was revealed that the selected cell dimensions for the SSG system geometry were inappropriate. In other words, total existing geometry was not covered by these cells. With respect to Figure 9, large meshing dimensions resulted in indeterminate solid boundary conditions in the model. Therefore, meshing dimensions should be minimized to determine solid boundaries exactly. In this regard, the model meshing dimensions in length, width, and height (X × Y × Z) were considered as 4, 4, and 4 cm, respectively. Although the solid boundary was estimated with higher validation, it seems that meshing dimensions should be considered smaller. Accordingly, a new meshing model with the dimensions of 2, 6, and 2 cm (X, Y, and Z, respectively) was considered (the smallest mesh size used in the modeling). Considering the model validation using FAVOR, new solid boundaries (in size), including the SSG system with all components, were defined based on the 3-D model constructed for the numerical model of Flow-3D. Various conditions of computational cell dimensions are shown in Figure 9.
After determining computational cell dimensions, the obtained numerical simulation results were calibrated and validated, and the computational error was identified for the laboratory model. To evaluate and validate the numerical model, four different conditions of wave spectrum were used. Figure 10 shows the wave spectrums applied on the numerical model. The numerical model was able to generate spectrums, with the conditions shown in Table 1, using the inlet wave spectrum on boundary conditions. Accordingly, in the simulated models, four spectrums, with various heights and periods, were applied to the constructed geometry. According to the laboratory model, the water height was 0.4 m. The RNG k-ε (Renormalization Group) turbulence model was applied to simulate the wave and flow fields. Flow-3D has the ability to simulate linear and nonlinear waves and irregular waves. In Flow-3D, an irregular wave is composed from many small regular wave with different amplitudes and frequencies and phase shifts. In Flow-3D, the JONSWAP and Piers-Moskowitz (P-M) spectrum are used to produce waves. The other wave energy spectrum can be used by entering a user-defined data file used in this article.
5. Calibration/Validation of the Model Using Experimental Data
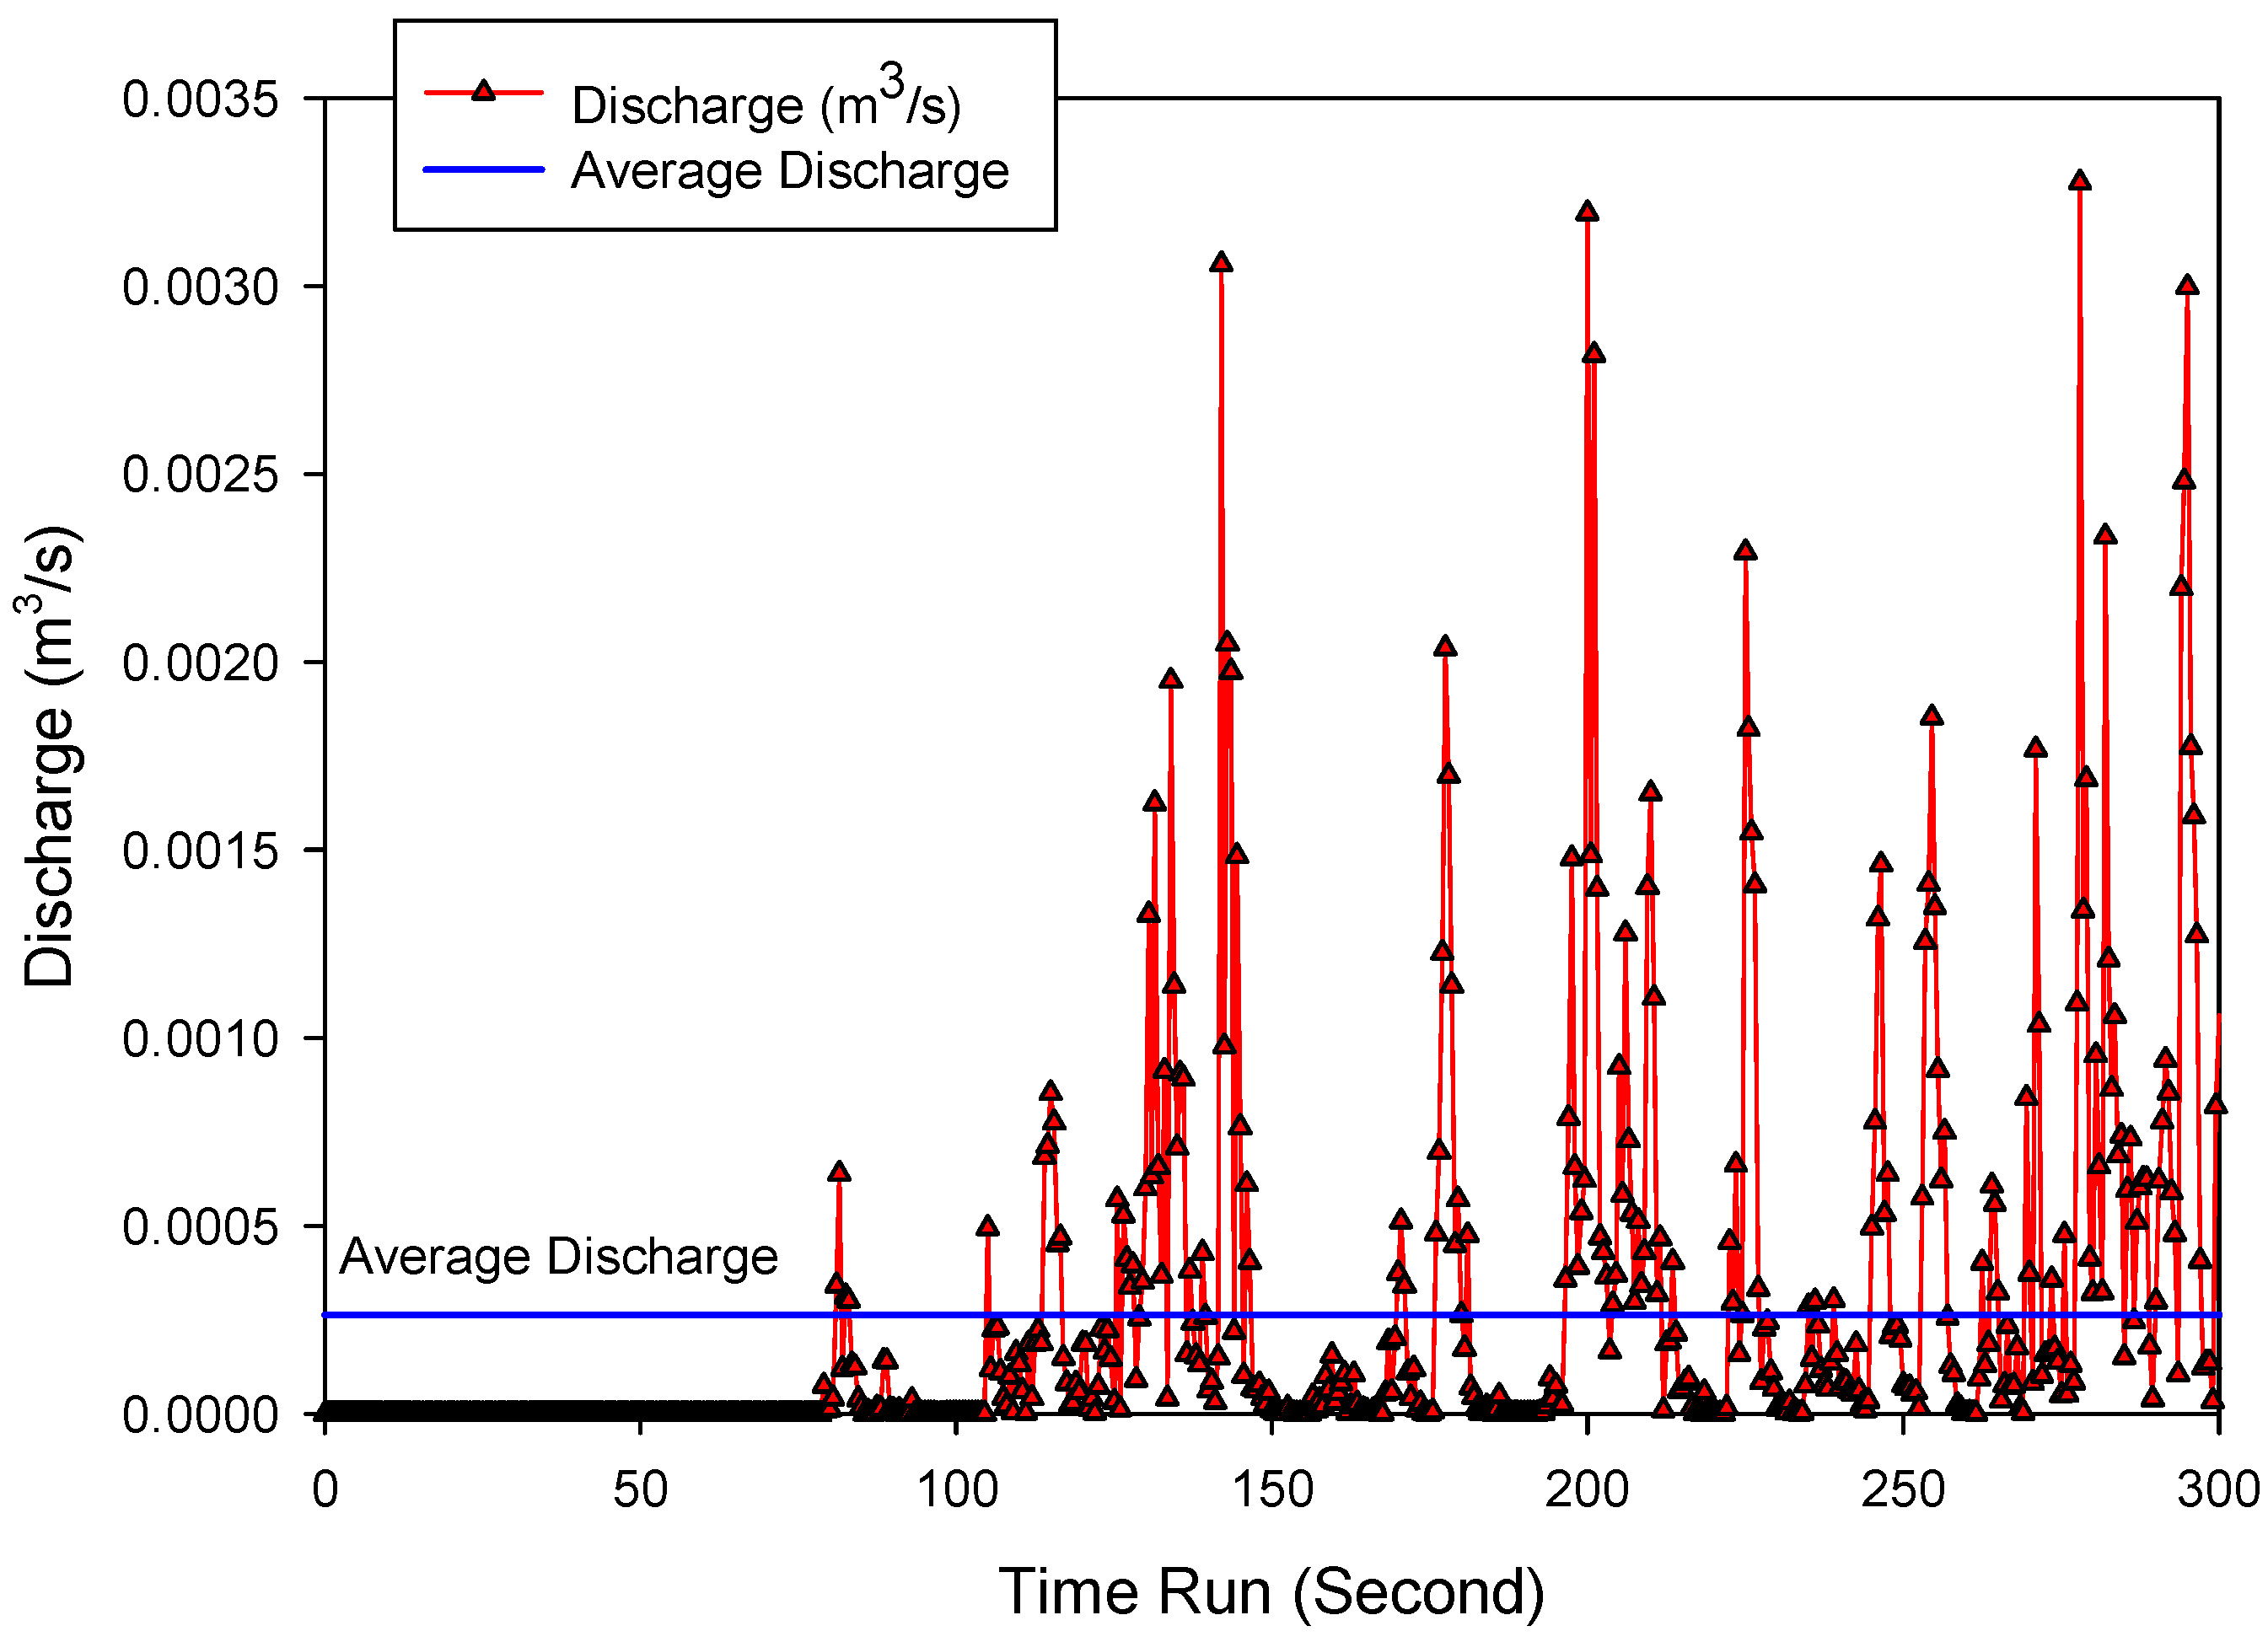
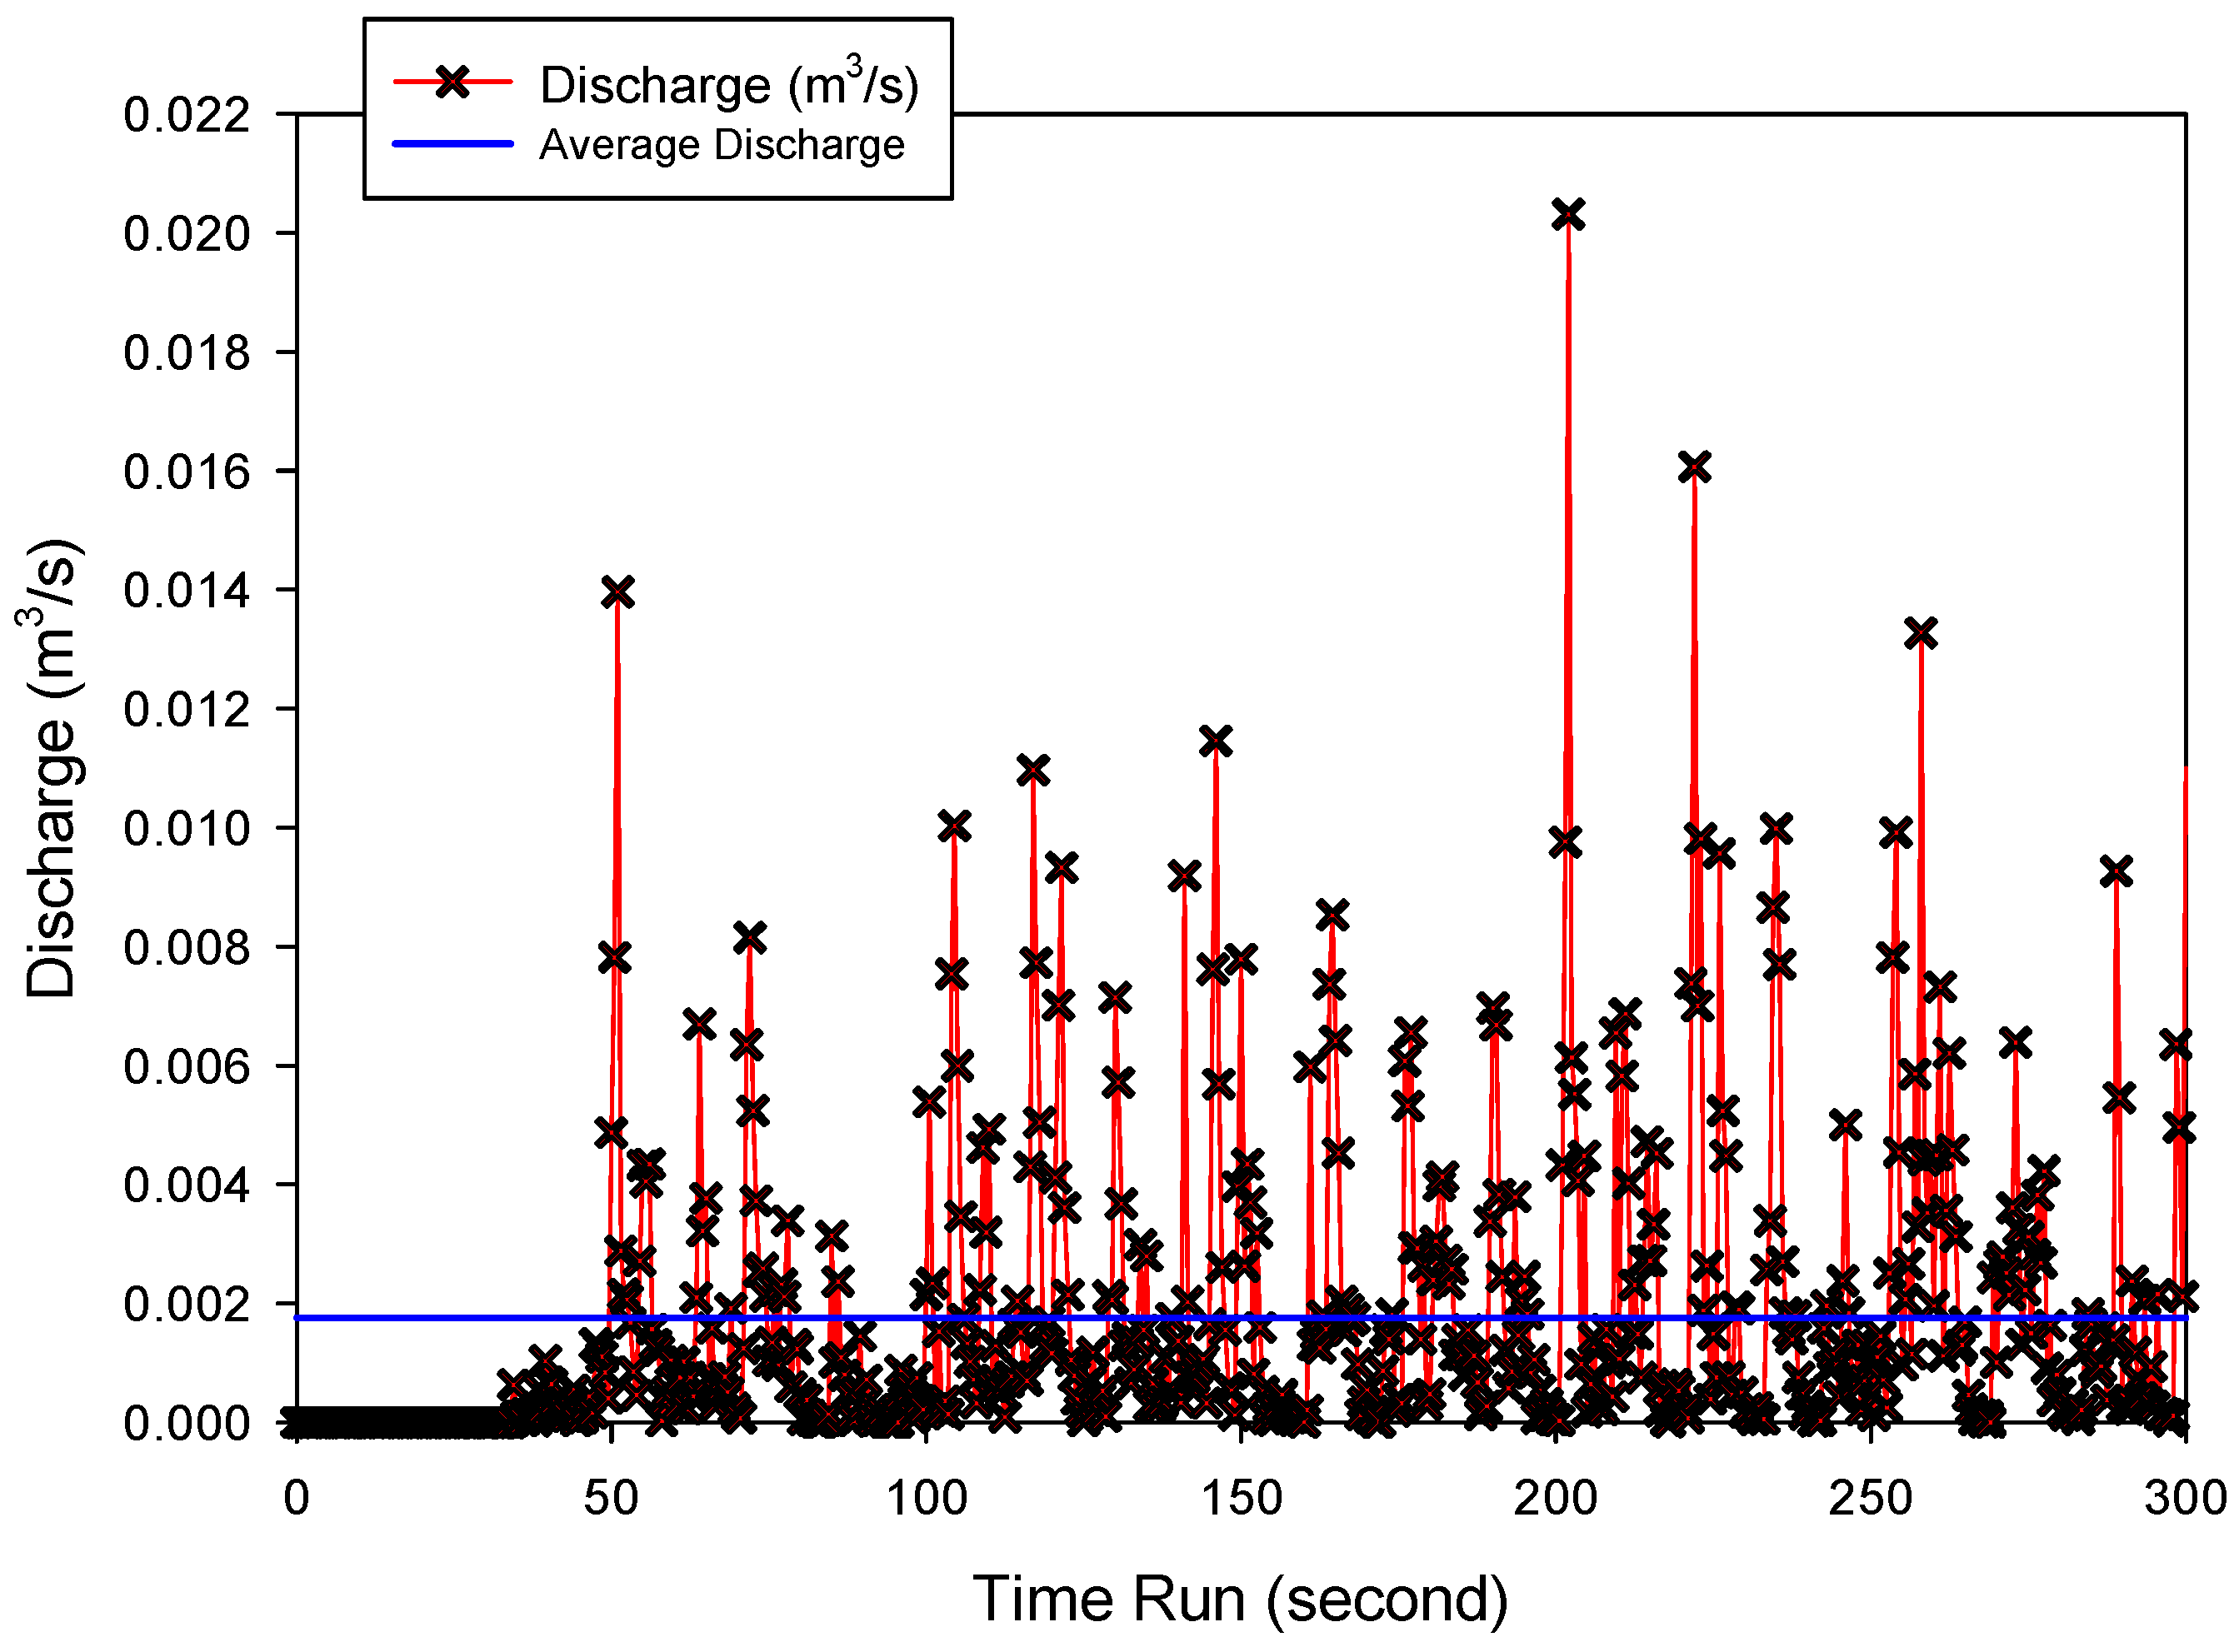
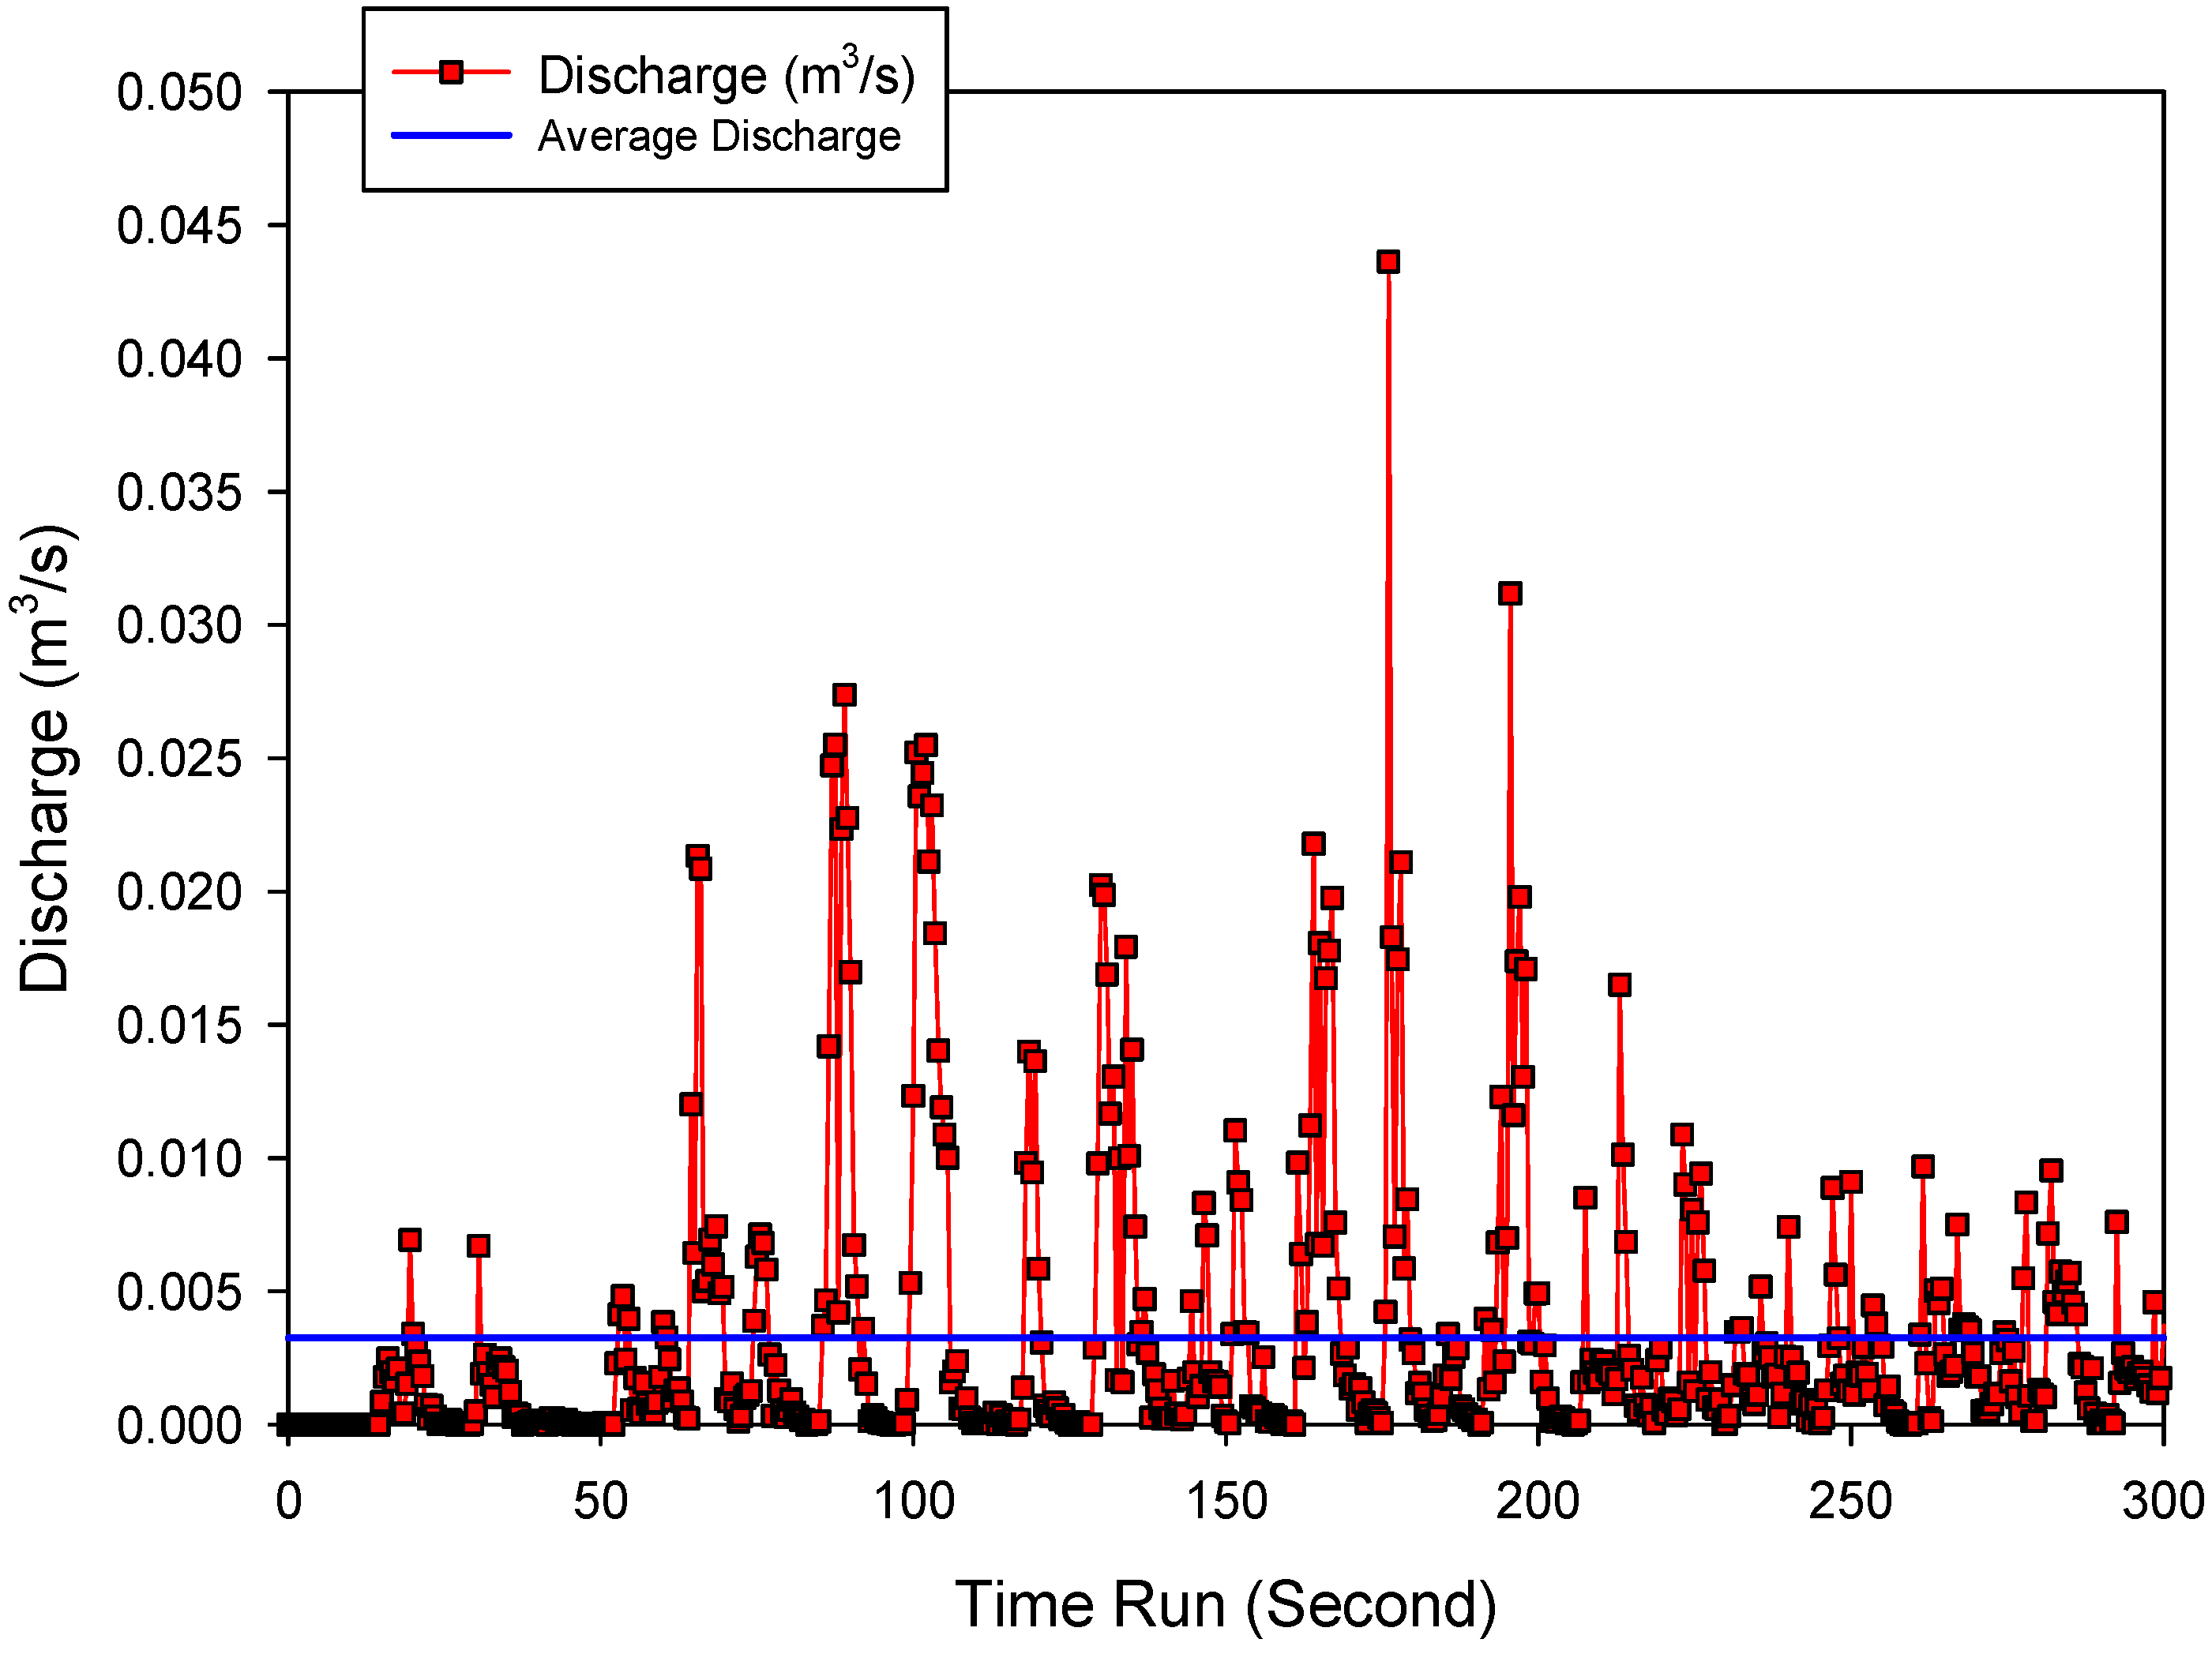
The most privilege of CFD is that it allows complete control over geometry and boundary conditions [41]. In addition, it provides simultaneously data at any point in the computation domain (“whole-flow field data”), and it doesn’t suffer from the requirements of the potential incompatibility caused by the scaling constraints, because simulations can be done on a full scale. The CFD also allows for an efficient parameter analysis of various configurations and conditions. However, the accuracy and reliability of CFD is a concern and calibration and validation studies are necessary. As a result, high-quality tests are necessary to provide data for validation studies [42]. Accordingly, the calibration and validation of models is presented in this section. The numerical model was implemented using the wave spectrum presented in Figure 10, and the results obtained from the output discharge of the SSG system waves, for the time of 300 s, were plotted. The error percentage of the numerical model was compared with the laboratory results to evaluate the model’s performance. Figure 11, Figure 12, Figure 13 and Figure 14 were prepared using 0.5 s intervals.
Table 2 shows the difference (in percentage) between the results of the numerical simulation and the laboratory model, for four types of input wave spectrum. The comparison between the discharge in the physical model and in the numerical model was done in terms of discharge per unit. Thus, in order to convert to prototype results, the following equation was used:
It should be noted that Bport represents the width in meters, which was 7.5 and 15 m in the real model and numerical model, respectively.
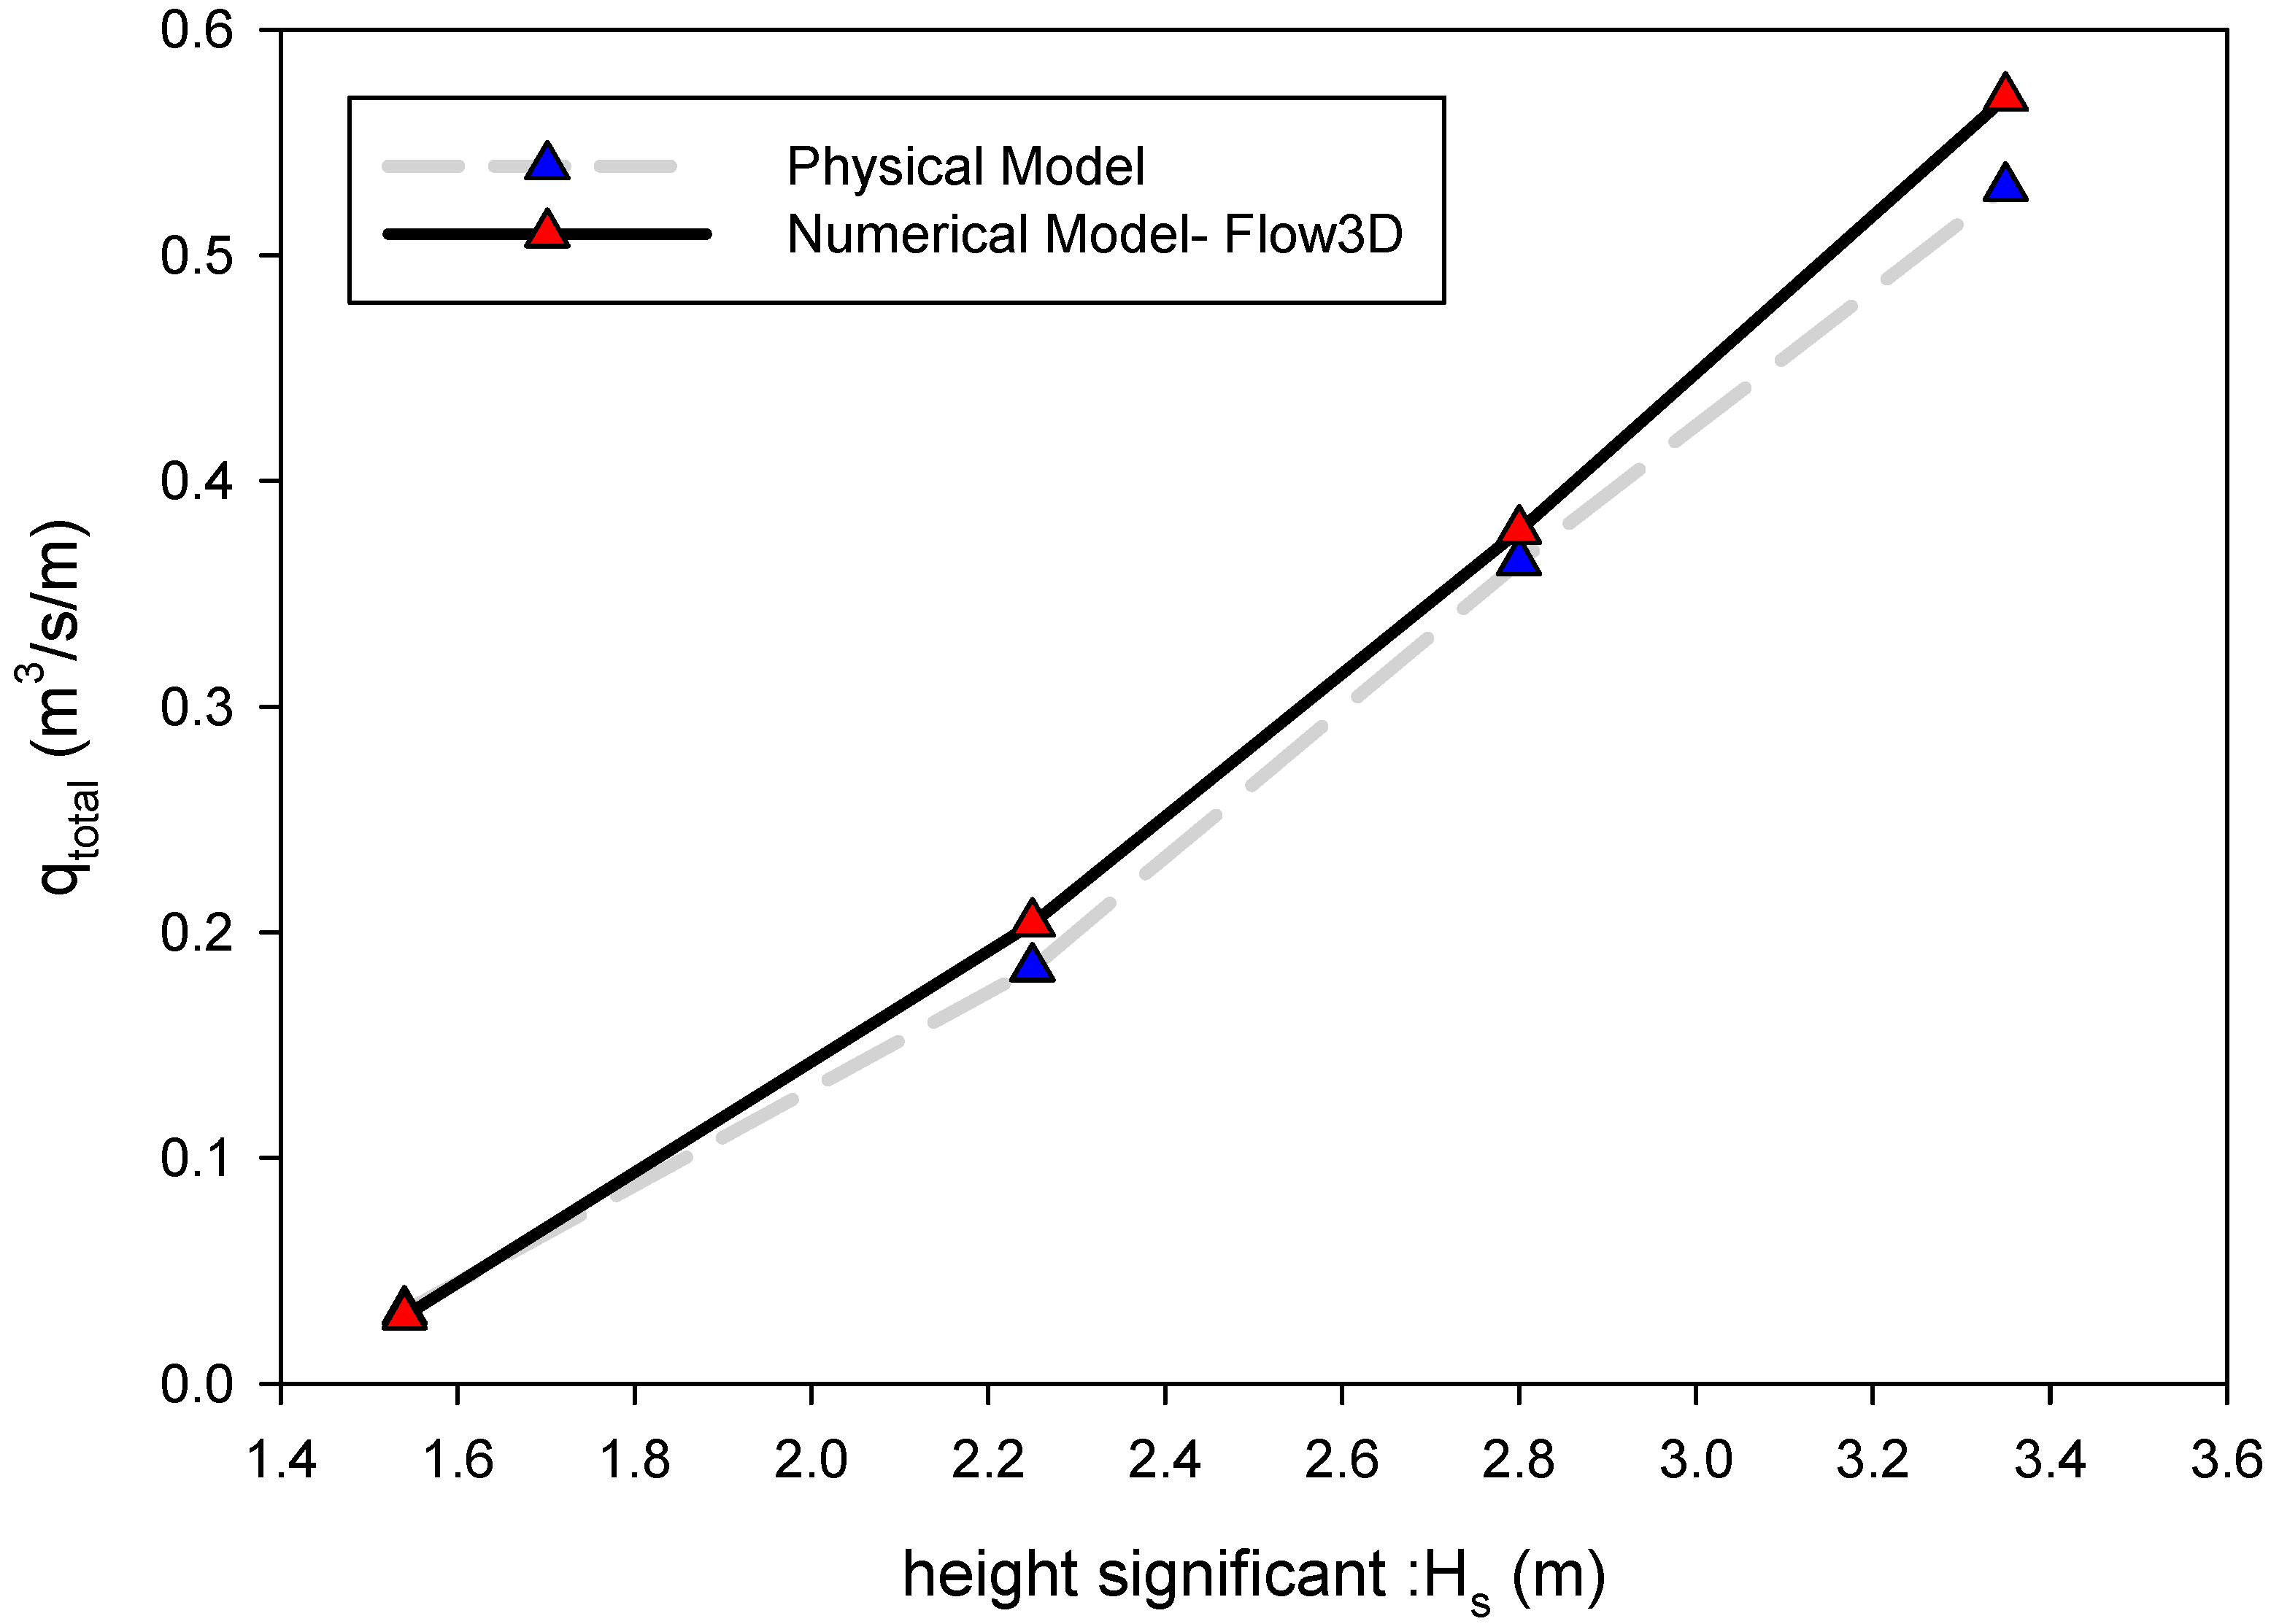
Table 2 shows that the maximum simulation error belongs to the wave spectrum of type B, and the simulation error percentage for the output discharge was about 10.7%. With respect to the acceptable error, numerical modeling was calibrated and verified. Figure 15 shows the output discharge of the numerical model in meter/height for the four spectrums under consideration. As observed, results of the numerical models and the laboratory results were in good agreement; therefore, the present calibrated model could be applied to investigate the waves on the coasts of the Persian Gulf and Oman Sea.
The average wave power (W/m) of the SSG wave-energy extraction device can be computed based on the height and period of the wave as:
where is the water density; g is gravity acceleration; Hs is the significant wave height, and the energy period Te is estimated—here simply set to be Tp/1.15 (Tp: wave peak period) [39]. Also, the average potential water overpasses power (W/m) can be computed as:
where is the average volume of water entering into the Jth tank (W) and is the height of the Jth tank crest from the average water level. In this equation, N represents the total number of tanks in the SSG energy generator water wave. The hydraulic efficiency was calculated according to Equation (3).
The evaluation of the results of the numerical modeling and the calculation of error is presented in Table 3. Notably, in Equation (8), for Rc,j, the average height of the tank was used to calculate the . Also, the average height of all three tanks was input into the equation for two other types of waves. In other words, for wave groups A and B, the height of Rc,j was 2.77 m and for the other wave group, it was 3.4 m.
6. Case Study: The Persian Gulf and Oman Sea
To evaluate the performance of the SSG energy generator in the Persian Gulf and Oman Sea, the required data near to the coast stations should be gathered. To this end, the required data was gathered from ports and navigation organizations. The data included latitude and longitude and the list of stations measuring wave characteristics. One of the important points in the employment of the SSG wave-energy extraction device is the depth of water in front of the structure. The efficiency of the structure is decreased under the impact of sediment deposition attack. To prevent such a phenomenon, the water depth in front of the structure should not be less than 15 m [43]. Considering the 15 m depth of water for these breakwaters obtained by Margheritini et al., they are acceptable, in terms of depth, for breakwaters in the ports of the Persian Gulf and Oman Sea. As the calibrated model was defined for a depth of 6 m, the model specifications should be changed to the depth of 15 m. Accordingly, the height equivalent to the wave run-up in the new model was changed to 15 m. In this model, since the height of the waves had no tangible change compared to the physical model, the height of the tanks had no change. Figure 19 shows a 3-D model, constructed from the considered breakwater, to simulate incident waves to the SSG energy generator breakwater in the Persian Gulf and Oman Sea conditions.
The geometrical model had the length of 60 m and width of 9 m and its maximum height was about 21 m. The current geometrical model in Flow-3D was recalled and all the conditions of the calibrated model were applied on the current model. Figure 20 shows the conditions of the SSG system in Flow-3D with the calibrated model meshing.
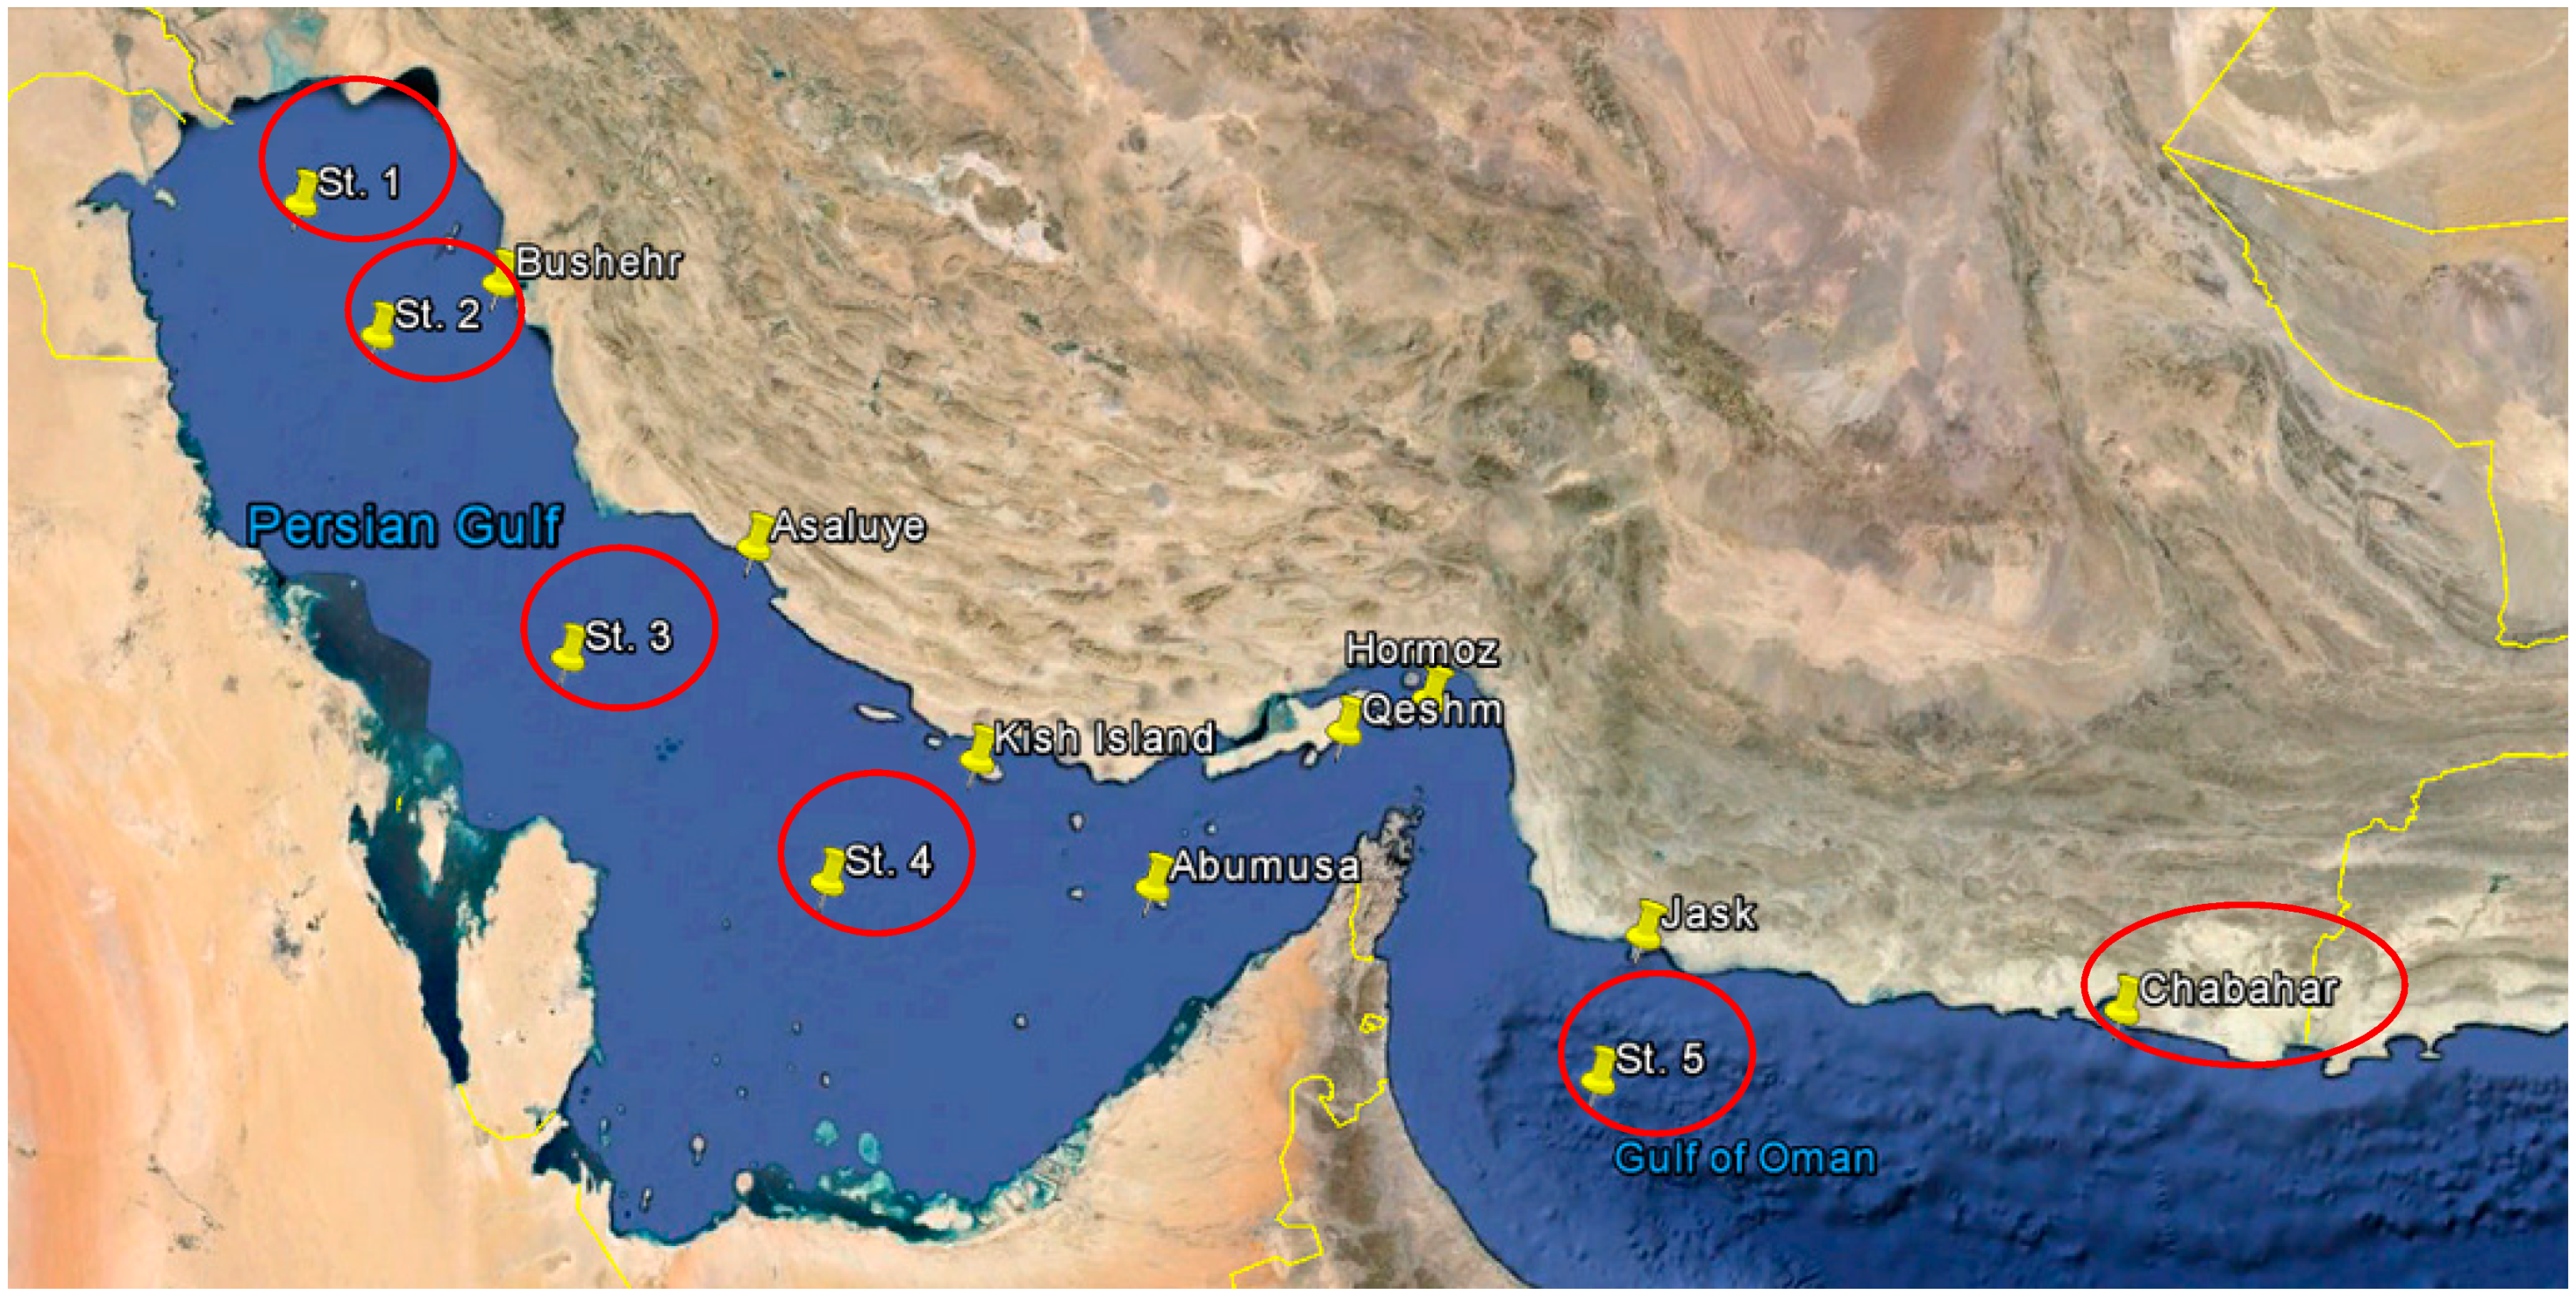
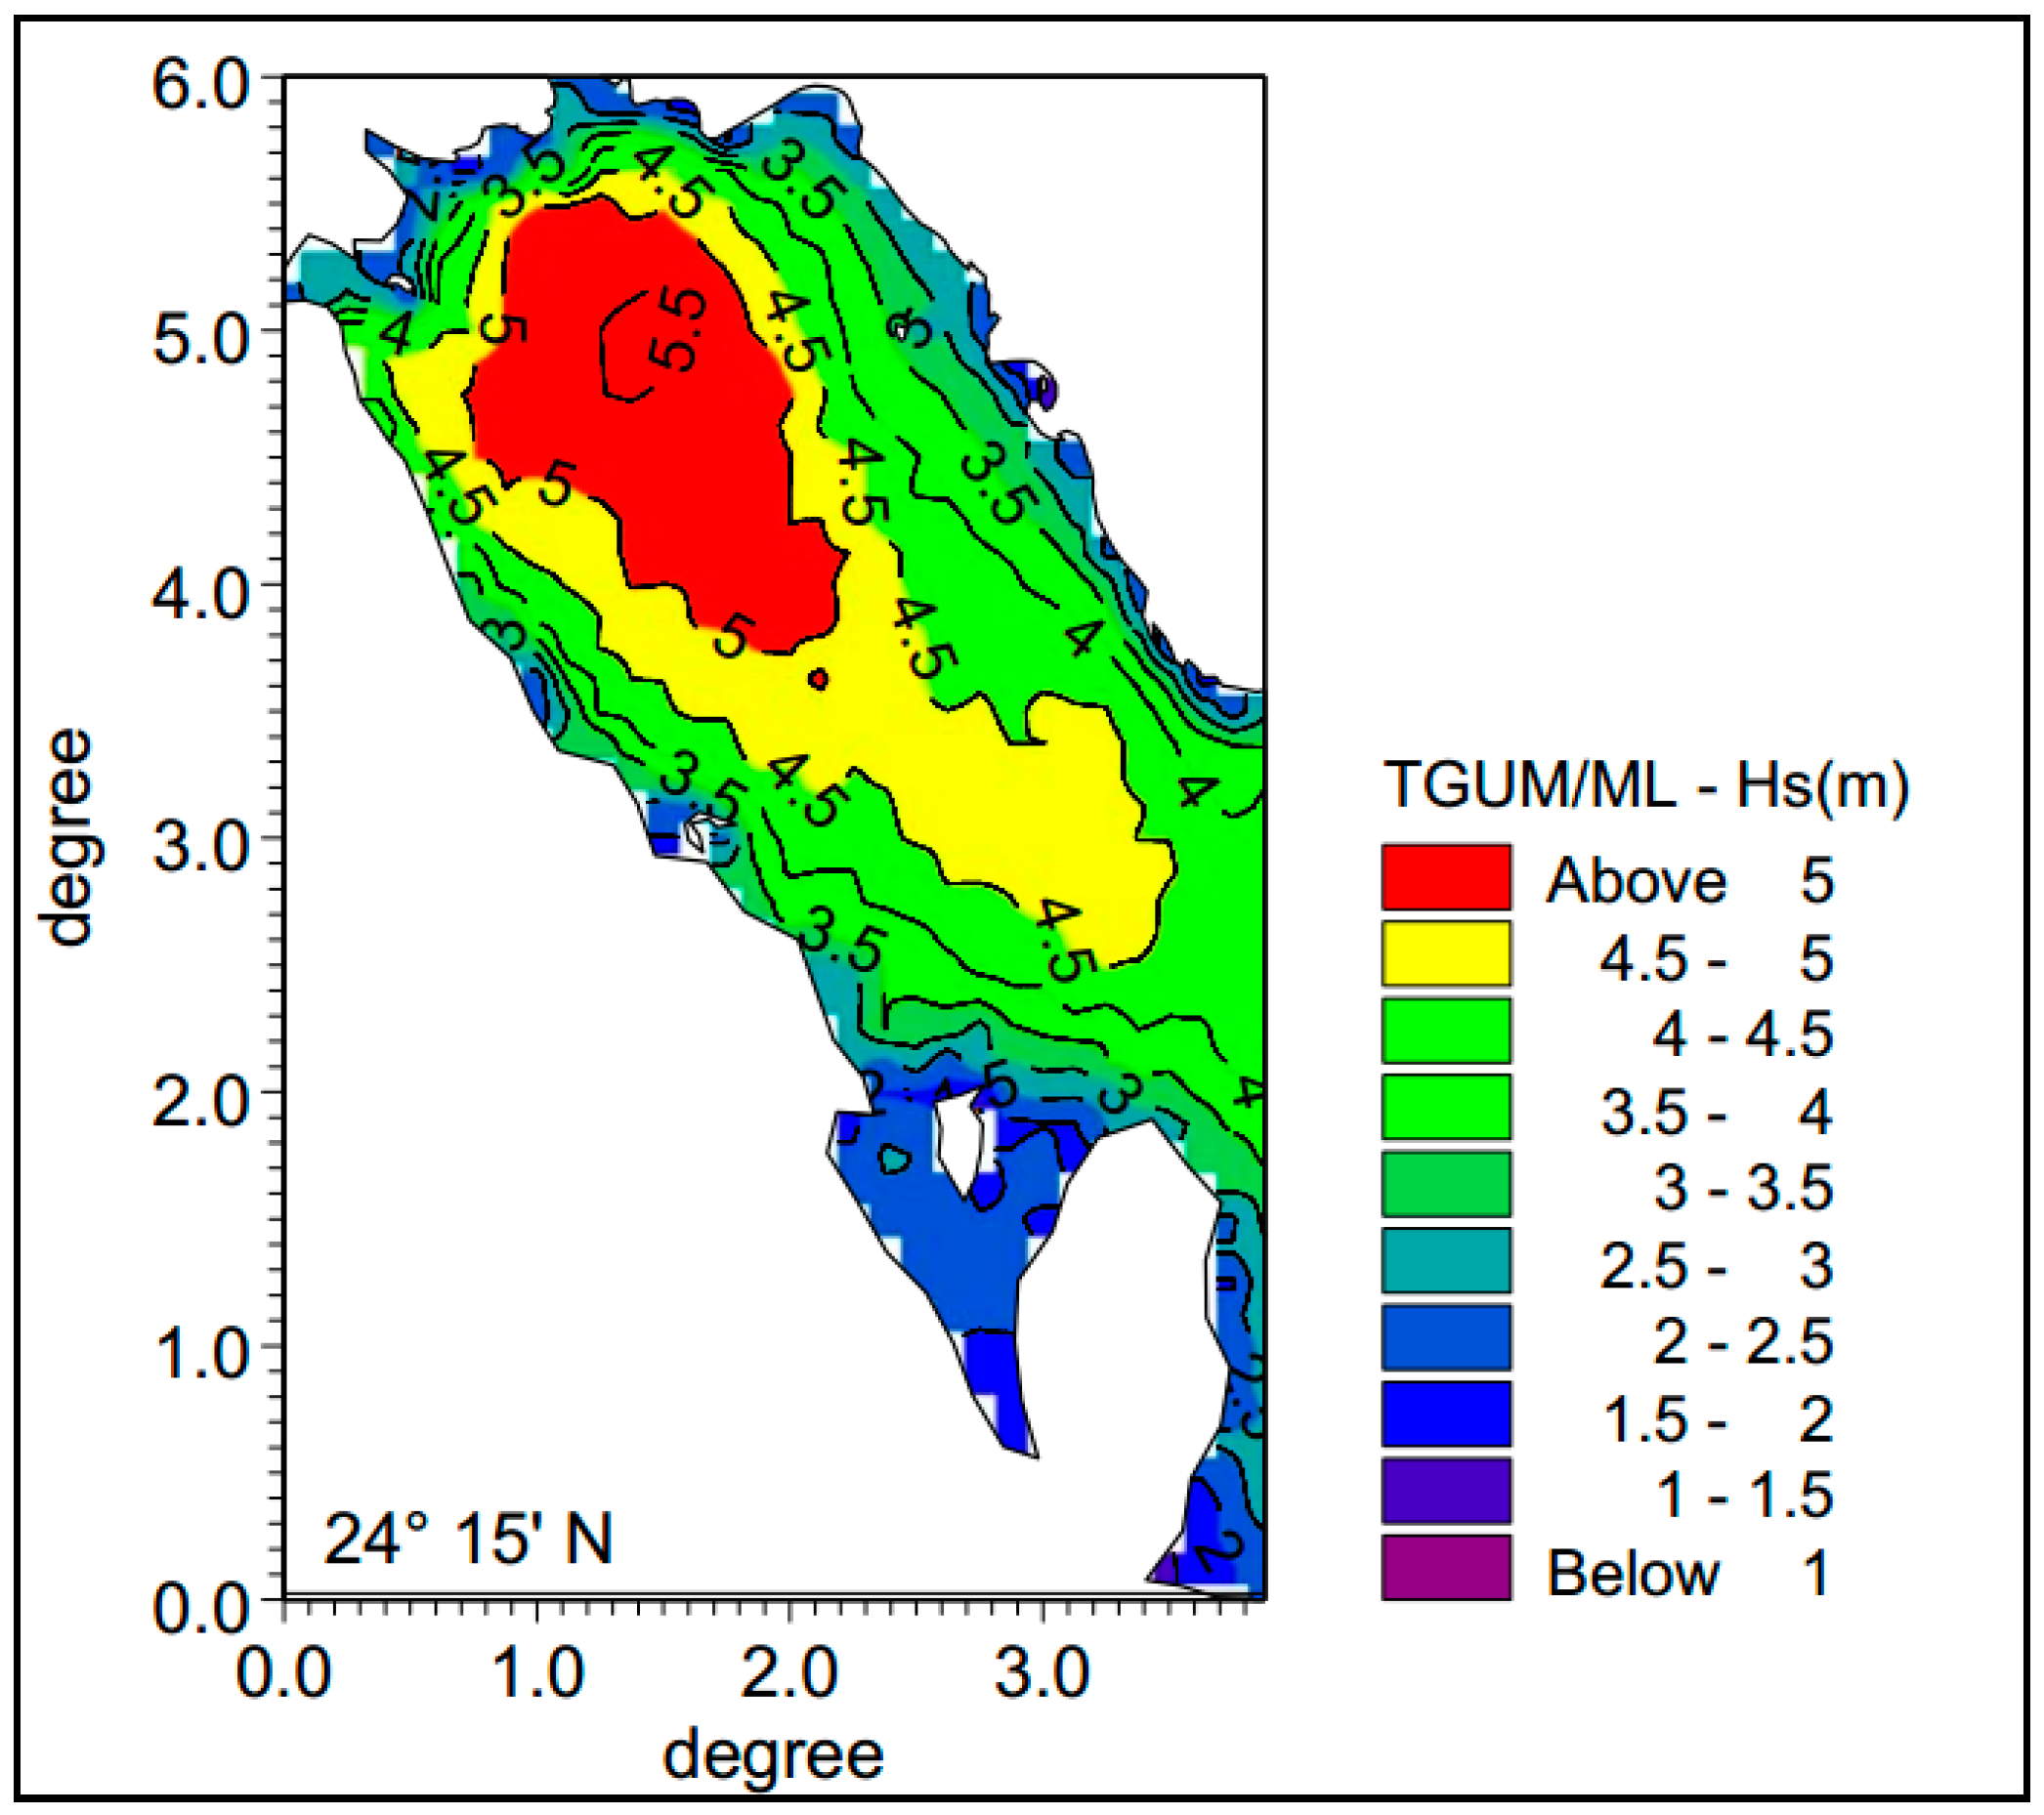
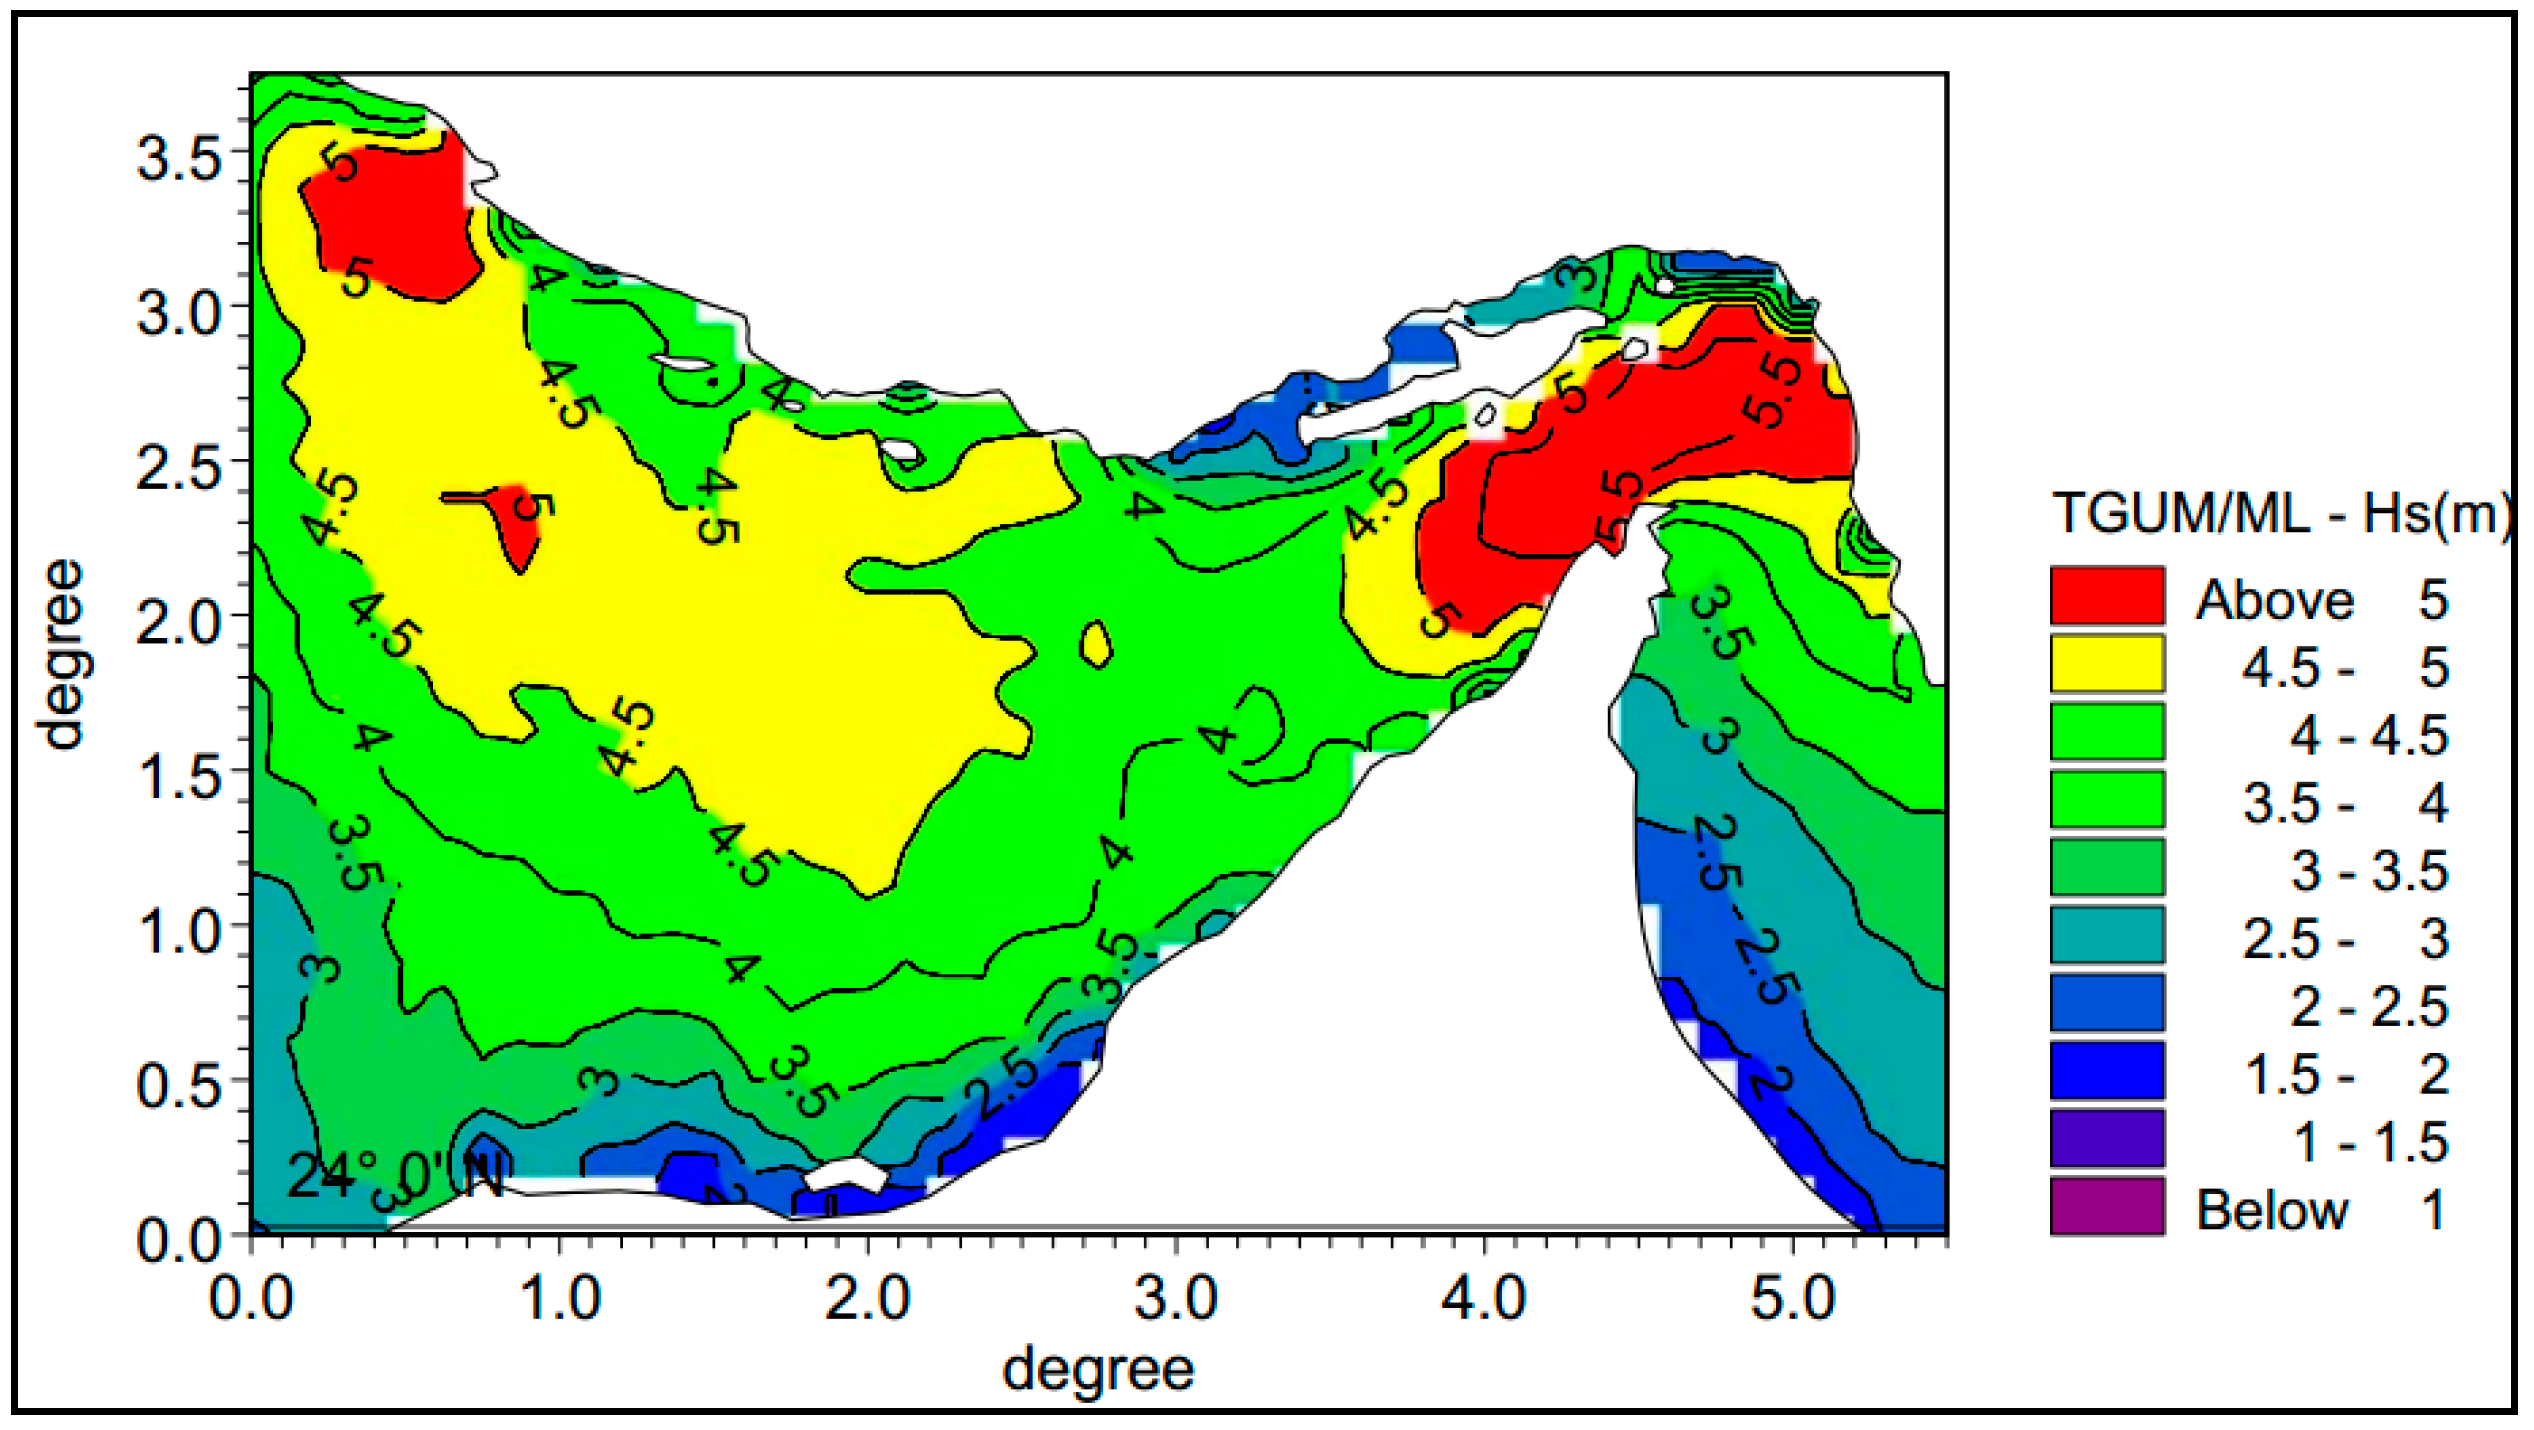
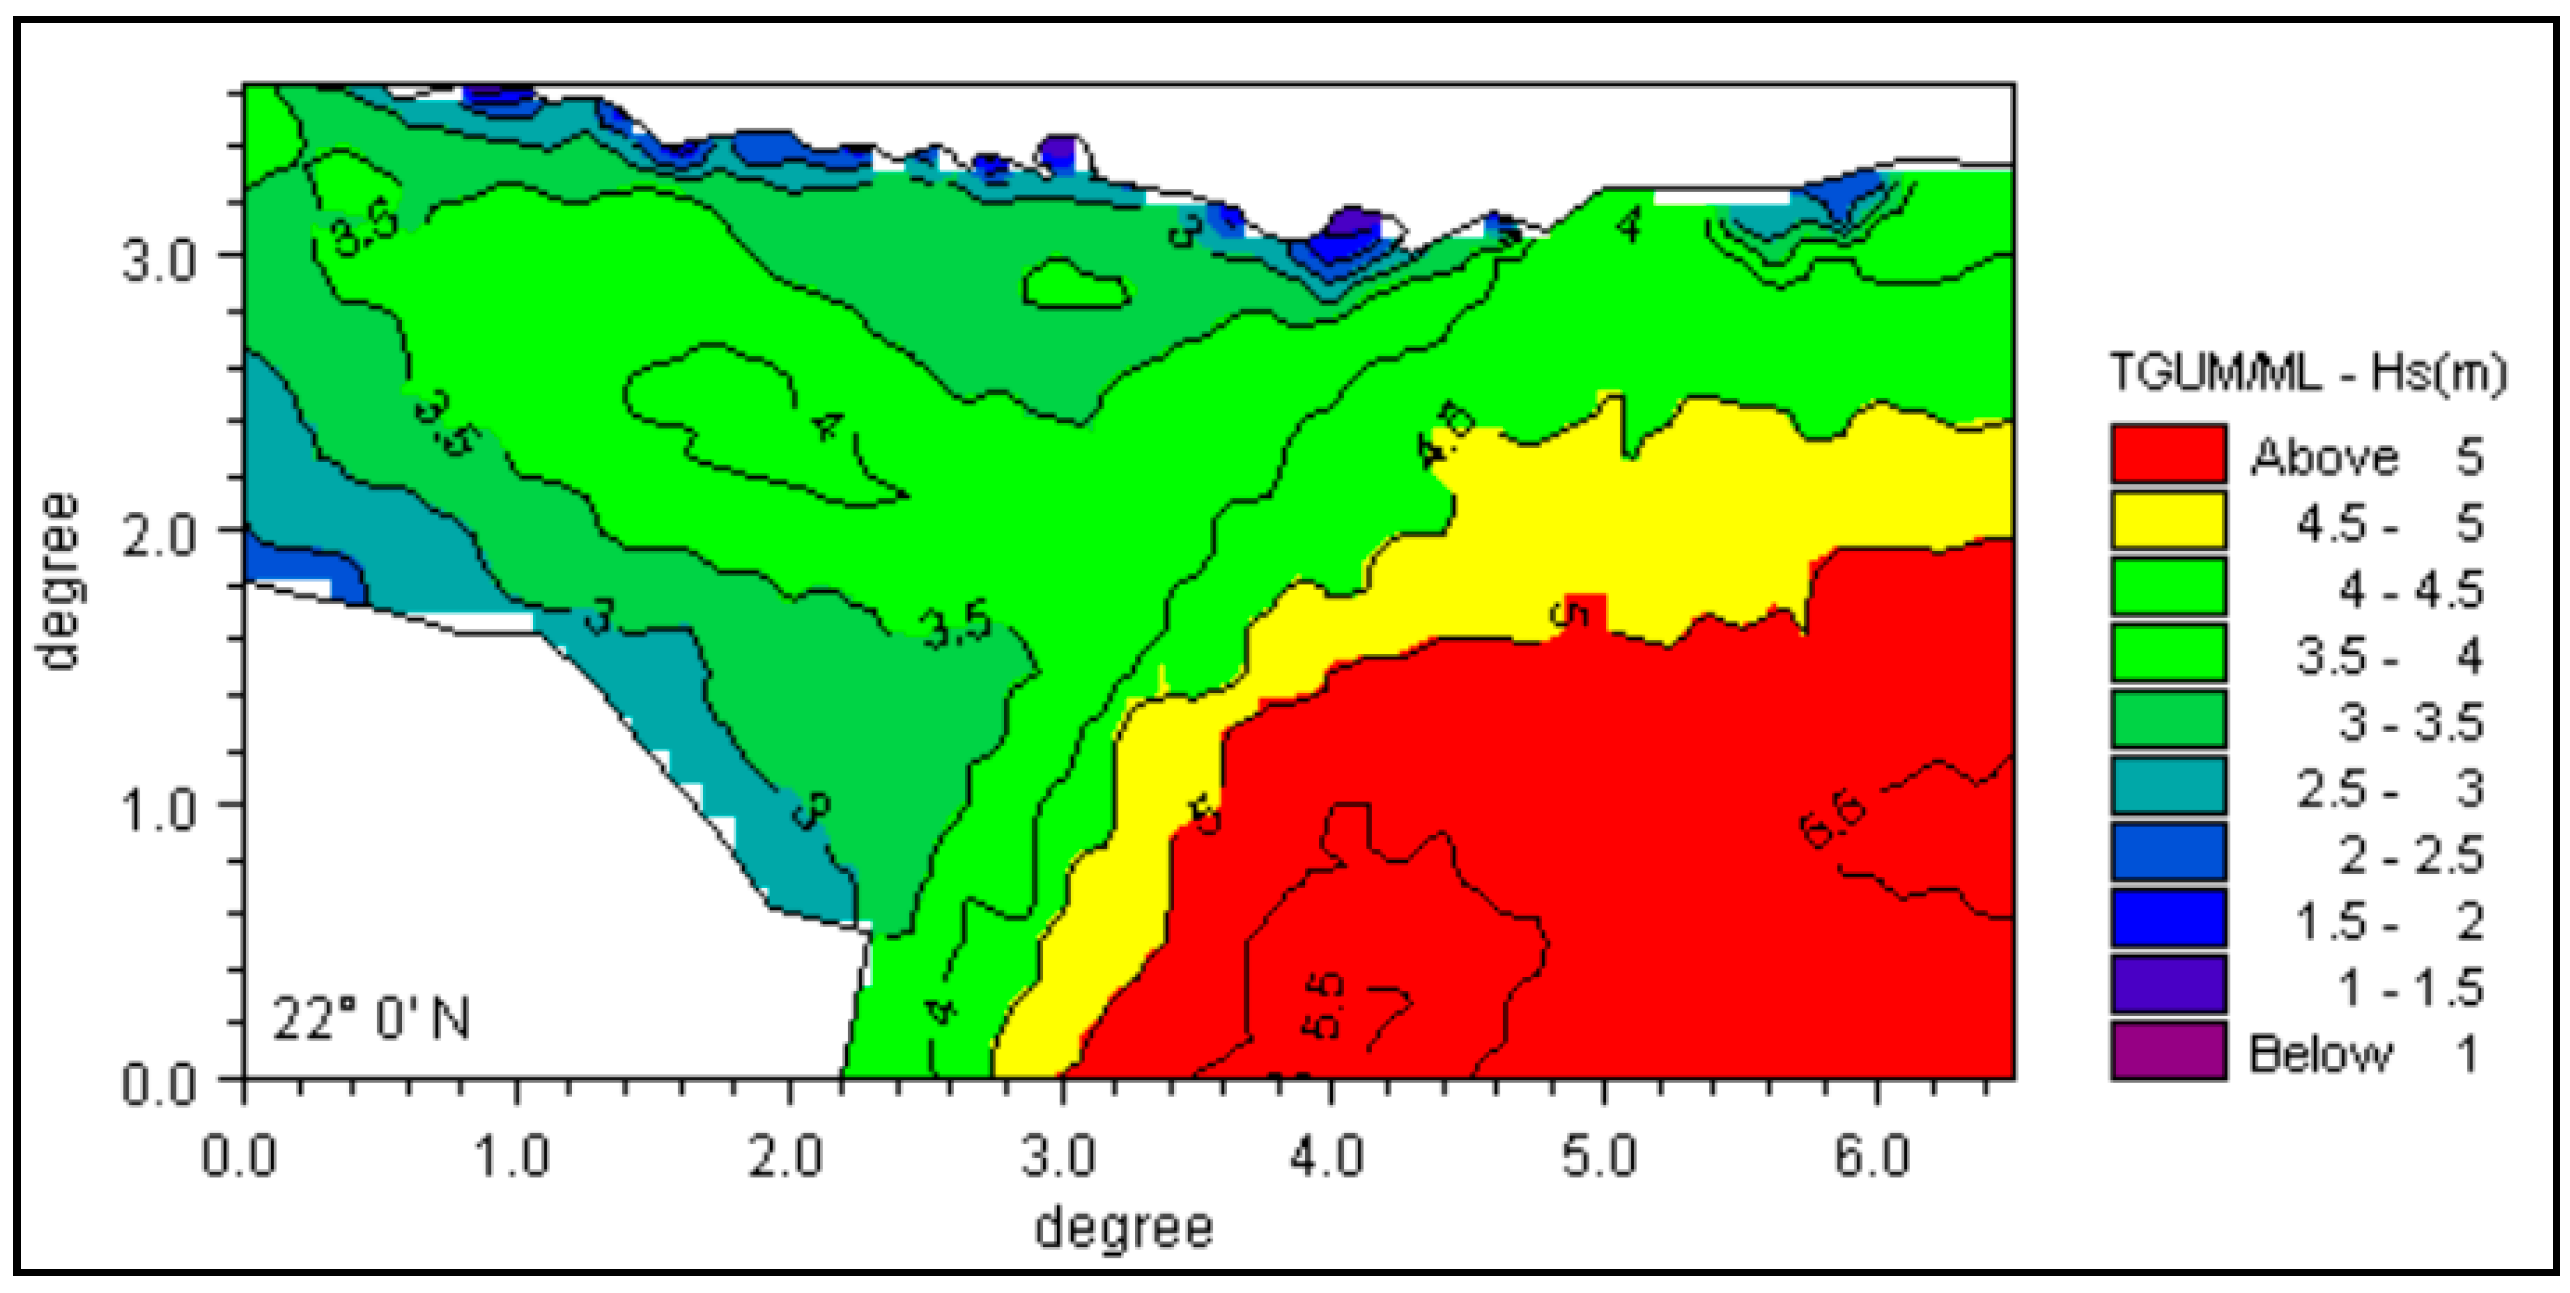
Reliable wave information is essential to the design of any coastal facility and the assessment of coastal processes, such as wave-energy generator systems. A detailed investigation of the wave climate on the Persian Gulf and Oman Sea, on the coastline of Iran, was carried out in support of a series of comprehensive studies for the ISWM (the Iranian Sea Wave Modelling) project by PMO (Ports and Maritime Organization). In This project, the objective was to develop long-term wave climate data for the entire length of the Iranian coastline, in the Persian Gulf and Oman Sea. The Oman Sea, and, to a lesser extent, the Persian Gulf is subject to a complex wave climate, with three distinct components: (1) Monsoon waves, generated during monsoon season (June to September), off the southern coastline of the Arabian Peninsula in the Indian Ocean, which approach from a southerly direction; (2) seas that are generated in the Oman Sea during the winter season and approach from a westerly to southwesterly directions; and (3) long-period swells that are generated in the Indian Ocean and approach from southerly to southeasterly directions. In these complicated wave conditions, in the coastal areas of the Persian Gulf and the Oman Sea, six points were chosen to cover the whole coastline. In these six points, a wide range of the wave heights and periods were selected to achieve realistic conditions. It should be noted that wave data were selected using the monthly mean wave characteristics in a one-year period, from 2015 to 2016. The stations that measured the hydro-dynamic characteristics of the waves are shown in Figure 21.
In this study, data from the Iranian Sea Wave Modelling (ISWM) project was used. The preliminary effort for studying the wave conditions, for the specified areas along the Iranian coastline, were undertaken by firstly deploying a few wave condition assessment stations, in onshore, in the vicinity of the Bushehr and Chabahar ports. Along with this major project, and other information base, of a kind that different short period measurements of wave characteristics, satellite information, and the results of large scale numerical modeling, enabled us to follow a hindcast model project in the Persian Gulf and Oman Sea, called ISWM. The major purpose of ISWM, which is defined by Port and Shipping Organization (PSO), is to recognize the wave characteristic in the Persian Gulf and Oman using the results of wave modelling. The (ISWM) results present the required wave characteristic for different usage in port and marine engineering fields. The INCO was tasked with this project with the assistance of DHI Water and Environment. The extreme value analysis was carried out using the extreme value analysis (EVA) software developed by DHI. The final wave height EVA analysis results for the 100-year return period are shown in Figure 22, Figure 23 and Figure 24 for the Persian Gulf, the Strait of Hormuz, and the Gulf of Oman, respectively [44].
7. Results
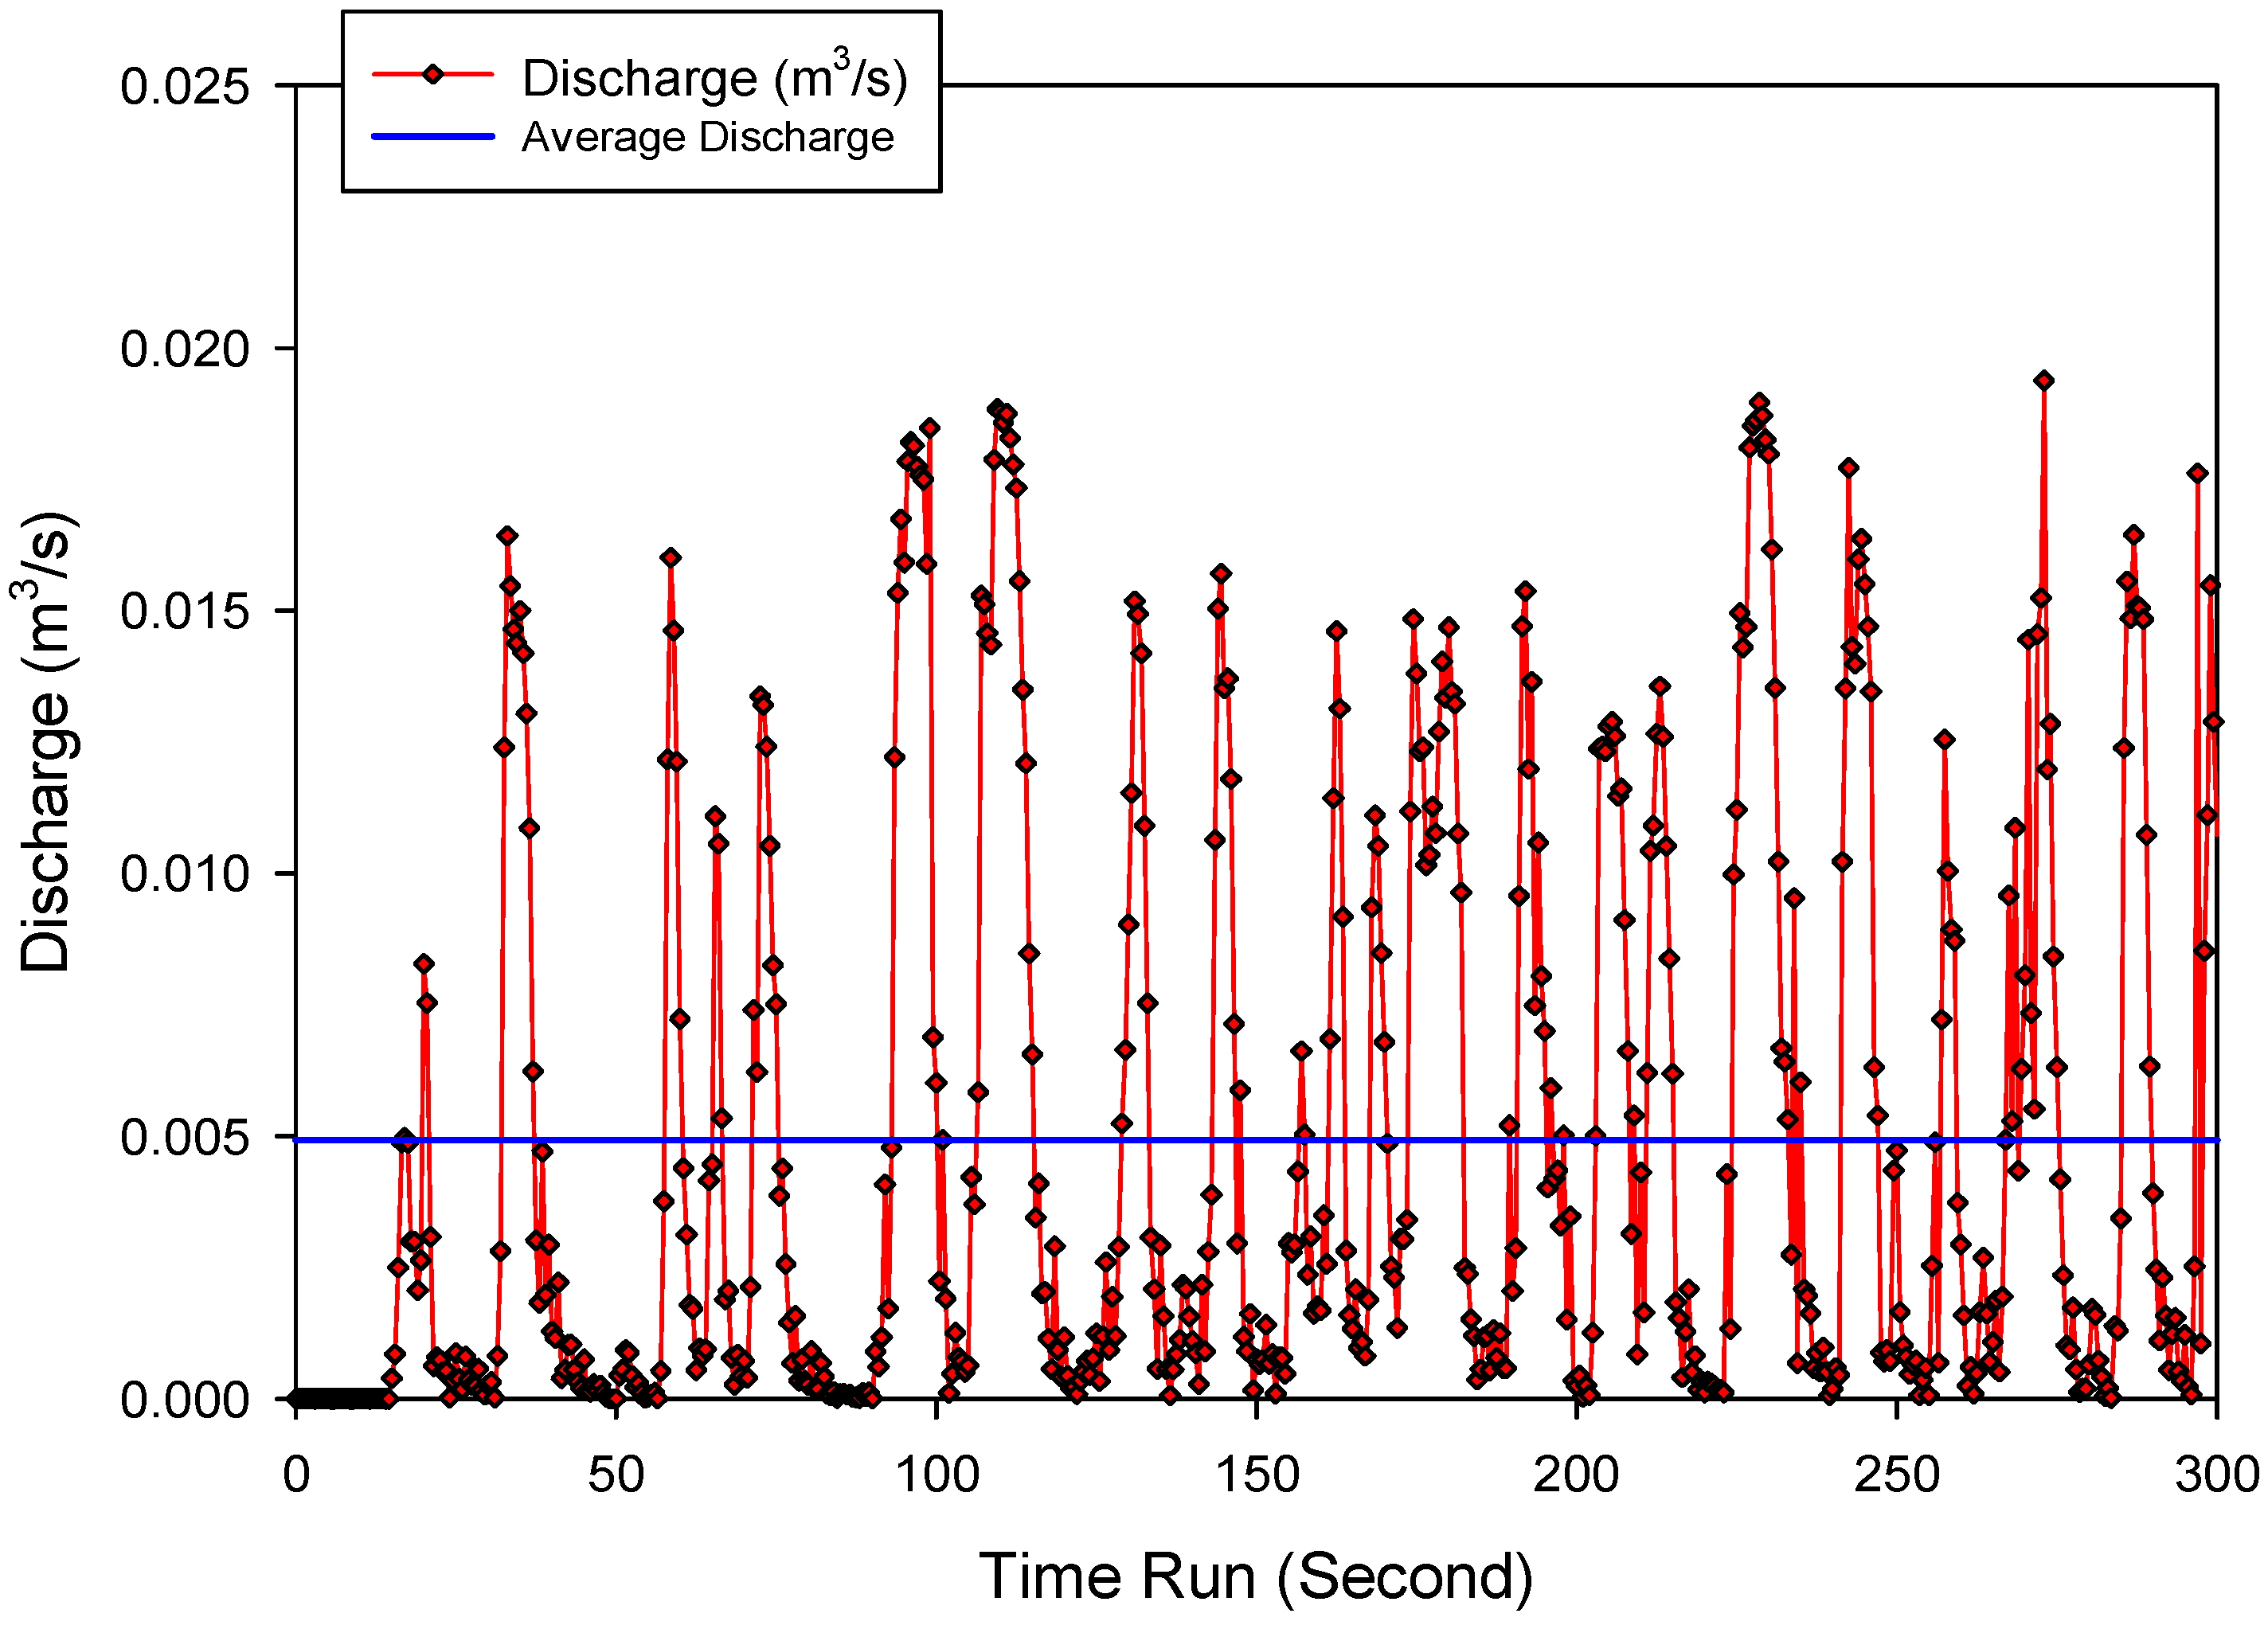
The output discharge levels for the simulation were calculated for the wave spectrum in the Persian Gulf and Oman Sea. Figure 25 shows the waves entering into the SSG system and the passing flow through the tanks. The numerical results for the average output discharge are presented in Figure 26, Figure 27, Figure 28, Figure 29, Figure 30 and Figure 31, where the discharge values had a width of 9 m. For all the simulations a time of 1800 s was considered.
8. Discussion
The efficiency of the SSG wave-energy extraction devices, for the wave conditions on the coasts of the Persian Gulf and Oman Sea, was computed. Table 5 lists the values of the hydraulic efficiency values for the considered wave conditions.
The numerical results showed that the hydraulic efficiency of the SSG wave-energy device for wave heights less than 0.5 m was very low (below 10%). For wave heights more than 1 m and wave periods more than 5 s, the hydraulic efficiency was more than 60%, which can be considered as a good level. Furthermore, for the short wave (SW) conditions in the Persian Gulf, the system efficiency was about 5%. In cases of normal wave (NW) conditions in the Persian Gulf, the system efficiency was about 8%. In addition, if the wave conditions in the Persian Gulf were large wave (LW), the system efficiency reached about 60%. For the SW conditions in the Persian Gulf, the system efficiency was not satisfactory (about 1%). On the other hand, the numerical results in the Oman Sea indicated higher efficiency for NW and LW conditions. The system efficiency for the NW conditions in the Oman Sea reached about 80%, which was the best hydraulic performance due to the value of the wave periods. Moreover, the system efficiency in the LW was about 70%, which is an appropriate efficiency.
Although the number is almost equal of positive storm surges and negative storm surges happen within 12 months, estimates of annual resources show that influenced by the storm surge weather, possible due to wave–tide action and reaction effects. However, the factors affecting annual database estimation were small, mainly compared to the database of uncertainty [45,46]. Since tide only resource assessment appears too great precision, but, because of a large amount of variability in immediate power, storm flood predictions may be required for the interpolation of tidal range energy into an electricity network. Something that is formerly accomplished routinely as the section of an early alarm system of coastal flood risk in the Persian Gulf and Oman Sea. To determine the maximum hydraulic efficiency of the SSG system, simulations were repeated whilst making changes to the wave simulation. In this regard, the maximum hydraulic efficiency of the model was determined when the applied wave height was almost two times more than the wave height of model four, shown in the previous part, and with the same period. The conditions of the significant wave height were about 2 m and the period of the selected wave was 5.6 s.
After applying the spectrum to the numerical model of the SSG system in the Persian Gulf and Oman Sea, numerical results were analyzed. Figure 32 presents the maximum overpass in the numerical model to determine the maximum hydraulic efficiency.
Table 6 shows the maximum hydraulic efficiency for the hypothetical conditions. The nominal efficiency of the SSG energy device was close to 97%.
As observed in Table 6, in addition to the wave height, wave period played an important role in hydraulic efficiency. The highest value of hydraulic efficiency of the SSG energy device belonged to the wave max spectrum. Although, in some conditions, maximum wave height, just like the conditions of spectrum 6, was higher than the wave height of spectrum 4, the hydraulic efficiency of spectrum 4 was higher due to its shorter period.
9. Conclusions
Numerical simulations can be used to evaluate and analyze the performance of the SSG wave-energy extraction device, and play an important role in the initial design, operation, and management of wave-energy extraction systems in different coastal conditions. Though, in recent years, the extraction of wave-energy in the Persian Gulf and Oman Sea has been investigated for specific cases, it is still necessary to evaluate the efficiency of these systems. Accordingly, in this study, numerical modeling was conducted to determine the efficiency of the SSG system in accordance with the conditions of the Persian Gulf and Oman Sea. Numerical simulation was performed using the Flow-3D software. The numerical results revealed that the hydraulic efficiency of the SSG wave-energy extraction device for wave heights less than 0.5 m was below 10%. For wave heights more than 1 m and wave periods more than 5 s, the hydraulic efficiency of the SSG wave-energy extraction device was more than 60%, which can be considered as a good level of efficiency. Accordingly, this study demonstrated that, in the Persian Gulf, SSG systems should be used in areas with higher wave heights and shorter periods to achieve the highest efficiency.
Author Contributions
K.K. designed and carried out the numerical simulations; G.A. is the article supervisor; C.G. edited the manuscript; and all authors read and approved the final manuscript.
Funding
This research received no external funding.
Conflicts of Interest
The authors declare no conflict of interest.
References
- Charlier, R.H.; Justus, J.R. Ocean Energies: Environmental, Economic and Technological Aspects of Alternative Power Sources; Elsevier Science: Amsterdam, The Netherlands, 1993. [Google Scholar]
- Vicinanza, D.; Contestabile, P.; Ferrante, V. Wave energy potential in the northwest of Sardinia (Italy). Renew. Energy 2013, 50, 506–521. [Google Scholar] [CrossRef]
- Pérez-Collazo, C.; Greaves, D.; Iglesias, G. A review of combined wave and offshore wind energy. Renew. Sustain. Energy Rev. 2015, 42, 141–153. [Google Scholar] [CrossRef]
- Liberti, L.; Carillo, A.; Sannino, G. Wave energy resource assessment in the Mediterranean, the Italian perspective. Renew. Energy 2013, 50, 938–949. [Google Scholar] [CrossRef]
- Iuppa, C.; Cavallaro, L.; Foti, E.; Vicinanza, D. Potential wave energy production by different wave energy converters around Sicily. J. Renew. Sustain. Energy 2015, 7, 061701. [Google Scholar] [CrossRef]
- Vicinanza, D.; Nørgaard, J.H.; Contestabile, P.; Andersen, T.L. Wave loadings acting on overtopping breakwater for energy conversion. J. Coast. Res. 2013, 65, 1669–1674. [Google Scholar] [CrossRef]
- Ranjbar, A.; Mahjouri, N. Development of an efficient surrogate model based on aquifer dimensions to prevent seawater intrusion in anisotropic coastal aquifers, case study: The Qom aquifer in Iran. Environ. Earth Sci. 2018, 77, 418. [Google Scholar] [CrossRef]
- Almeida, F. Big data: Concept, potentialities and vulnerabilities. Emerg. Sci. J. 2018, 2, 1–11. [Google Scholar] [CrossRef]
- Franzitta, V.; Curto, D. Sustainability of the renewable energy extraction close to the Mediterranean Islands. Energies 2017, 10, 283. [Google Scholar] [CrossRef]
- Ross, D. Power from Sea Waves; Oxford University Press: Oxford, UK, 1995. [Google Scholar]
- Khosravi, S.; Zamanifar, M.; Derakhshan-Barjoei, P. Analysis of Bifurcations in a Wind Turbine System Based on DFIG. Emerg. Sci. J. 2018, 2. [Google Scholar] [CrossRef]
- Evans, D.V.; de O. Falcao, A.F. Hydrodynamics of Ocean Wave-Energy Utilization; Springer: Berlin, Germany, 1985. [Google Scholar]
- Iuppa, C.; Cavallaro, L.; Vicinanza, D.; Foti, E. Investigation of suitable sites for wave energy converters around Sicily (Italy). Ocean Sci. 2015, 11, 543–557. [Google Scholar] [CrossRef] [Green Version]
- Luo, X.; Li, Q.; Xiong, S.; Liu, Z. Numerical study of the wake flow of a wind turbine with consideration of the inflow turbulence. Civ. Eng. J. 2018, 4. [Google Scholar] [CrossRef]
- Barzegar, M.H.; Fallahiyekta, M. Increasing the thermal efficiency of double tube heat exchangers by using nano hybrid. Emerg. Sci. J. 2018, 2. [Google Scholar] [CrossRef]
- Alavi, S.A.R.; Lay, E.N.; Makhmali, Z.S.A. A CFD study of industrial double-cyclone in HDPE drying process. Emerg. Sci. J. 2018, 2. [Google Scholar] [CrossRef]
- McCabe, A.; Bradshaw, A.; Widden, M.; Chaplin, R.; French, M.; Meadowcroft, J.P.S. FROG Mk 5: An Offshore Point Absorber Wave Energy Converter. In Proceedings of the Fifth European Wave Energy Conference, Cork, Ireland, 12–20 September 2003. [Google Scholar]
- Yamini, O.A.; Kavianpour, M.R.; Mousavi, S.H. Experimental investigation of parameters affecting the stability of articulated concrete block mattress under wave attack. Appl. Ocean Res. 2017, 64, 184–202. [Google Scholar] [CrossRef]
- Contestabile, P.; Ferrante, V.; di Lauro, E.; Vicinanza, D. Prototype Overtopping Breakwater for Wave Energy Conversion at Port of Naples. In Proceedings of the 26th International Ocean and Polar Engineering Conference, Rhodes, Greece, 26 June–2 July 2016. [Google Scholar]
- Takahashi, S.; Nakada, H.; Ohneda, H.; Shikamori, M. Wave Power Conversion by a Prototype Wave Power Extracting Caisson in Sakata Port. In Proceedings of the 23rd International Conference on Coastal Engineering, Venice, Italy, 4–9 October 1992; pp. 3440–3453. [Google Scholar]
- Hassan, M.A.; Ismail, M.A.M. Effect of soil types on the development of matric suction and volumetric water content for dike embankment during overtopping tests. Civ. Eng. J. 2018, 4, 668–688. [Google Scholar] [CrossRef]
- Jungrungruengtaworn, S.; Hyun, B.-S. Influence of slot width on the performance of multi-stage overtopping wave energy converters. Int. J. Nav. Archit. Ocean Eng. 2017, 9, 668–676. [Google Scholar] [CrossRef]
- Iuppa, C.; Contestabile, P.; Cavallaro, L.; Foti, E.; Vicinanza, D. Hydraulic performance of an innovative breakwater for overtopping wave energy conversion. Sustainability 2016, 8, 1226. [Google Scholar] [CrossRef]
- Buccino, M.; Stagonas, D.; Vicinanza, D. Development of a composite sea wall wave energy converter system. Renew. Energy 2015, 81, 509–522. [Google Scholar] [CrossRef] [Green Version]
- Margheritini, L.; Vicinanza, D.; Kofoed, J.P. Overtopping Performance of Sea Wave Slot Cone Generator. In Coasts, Marine Structures and Breakwaters 2009: Adapting to Change, Adapting to Change, Proceedings of the 9th International Conference, Edinburgh, UK, 16–18 September 2009; Thomas Telford Limited: London, UK, 2009. [Google Scholar]
- Vicinanza, D.; Margheritini, L.; Kofoed, J.P.; Buccino, M. The SSG wave energy converter: Performance, status and recent developments. Energies 2012, 5, 193–226. [Google Scholar] [CrossRef]
- Oliveira, P.; Taveira-Pinto, F.; Morais, T.; Rosa-Santos, P. Experimental evaluation of the effect of wave focusing walls on the performance of the Sea-wave Slot-cone Generator. Energy Convers. Manag. 2016, 110, 165–175. [Google Scholar] [CrossRef]
- Zanuttigh, B.; Margheritini, L.; Gambles, L.; Martinelli, L. Analysis of Wave Reflection from Wave Energy Converters Installed as Breakwaters in Harbour. In Proceedings of the 8th European Wave and Tidal Energy Conference, Uppsala, Sweden, 7–10 September 2009. [Google Scholar]
- Hirt, C.W.; Nichols, B. Flow-3D User’s Manual; Flow Science Inc.: Los Alamos, NM, USA, 1988. [Google Scholar]
- Movahedi, A.; Kavianpour, M.; Aminoroayaie Yamini, O. Experimental and numerical analysis of the scour profile downstream of flip bucket with change in bed material size. ISH J. Hydraul. Eng. 2017. [Google Scholar] [CrossRef]
- Cavallaro, L.; Iuppa, C.; Scandura, P.; Foti, E. Wave load on a navigation lock sliding gate. Ocean Eng. 2018, 154, 298–310. [Google Scholar] [CrossRef]
- Mansoori, A.; Erfanian, S.; Moghadam, F.K. A study of the conditions of energy dissipation in stepped spillways with Λ-shaped step using FLOW-3D. Civ. Eng. J. 2017, 3, 856–867. [Google Scholar] [CrossRef]
- Maliki, A.Y.; Musa, M.A.; Ahmad, M.F.; Zamri, I.; Omar, Y. Comparison of numerical and experimental results for overtopping discharge of the OBREC wave energy converter. J. Eng. Sci. Technol. 2017, 12, 1337–1353. [Google Scholar]
- Sayeed, T.; Colbourne, B.; Molyneux, D.; Akinturk, A.; Zaman, H. Experimental and numerical investigation of wave induced motions of partially submerged bodies approaching a fixed structure. Ocean Eng. 2018, 155, 115–130. [Google Scholar] [CrossRef]
- Sayeed, T.; Colbourne, B.; Molyneux, D.; Akinturk, A. Experimental and numerical investigation of wave forces on partially submerged bodies in close proximity to a fixed structure. Ocean Eng. 2017, 132, 70–91. [Google Scholar] [CrossRef]
- Daneshfaraz, R.; Ghaderi, A. Numerical investigation of inverse curvature ogee spillway. Civ. Eng. J. 2017, 3, 1146–1156. [Google Scholar] [CrossRef]
- Sicilian, J.M.; Hirt, C.W.; Harper, R.P. FLOW-3D: Computational Modeling Power for Scientists and Engineers; FSI-87-00-1; FSI: Los Alamos, NM, USA, 1987. [Google Scholar]
- Razavi, A.R.; Ahmadi, H. Numerical modelling of flow in morning glory spillways using FLOW-3D. Civ. Eng. J. 2017, 3, 956–964. [Google Scholar] [CrossRef]
- Kofoed, J.P. Model Testing of the Wave Energy Converter Sea Wave Slot-Cone Generator. Available online: http://www.forskningsdatabasen.dk/en/catalog/2389381641 (accessed on 1 May 2018).
- Sarhadi, A.; Jabbari, E. Investigating effect of different parameters of the submerged vanes on the lateral intake discharge located in the 180 degree bend using the numerical model. Civ. Eng. J. 2017, 3, 1176–1187. [Google Scholar] [CrossRef]
- Blocken, B.; Gualtieri, C. Ten iterative steps for model development and evaluation applied to computational fluid dynamics for environmental fluid mechanics. Environ. Model. Softw. 2012, 33, 1–22. [Google Scholar] [CrossRef]
- Taebi, S.; Golshani, A.; Chegini, V. Naiband Bay, Special Study Sites Report, Monitoring and Modelingstudies of Iranian Coasts, Bushehr Province; Jahad Water and Energy Research Company: Tehran, Iran, 2010. [Google Scholar]
- Margheritini, L.; Vicinanza, D.; Frigaard, P. SSG wave energy converter: Design, reliability and hydraulic performance of an innovative overtopping device. Renew. Energy 2009, 34, 1371–1380. [Google Scholar] [CrossRef]
- Taebi, S.; Golshani, A.; Chegini, V. ISWM Project, Phase 3; Iranian National Center for Oceanography: Tehran, Iran, 2005. [Google Scholar]
- Yamini, O.A.; Kavianpour, M.R.; Mousavi, S.H. Wave run-up and rundown on ACB Mats under granular and geotextile filters’ condition. Mar. Georesources Geotechnol. 2018, 36, 895–906. [Google Scholar] [CrossRef]
- Angeloudis, A.; Falconer, R.A.; Bray, S.; Ahmadian, R. Representation and operation of tidal energy impoundments in a coastal hydrodynamic model. Renew. Energy 2016, 99, 1103–1115. [Google Scholar] [CrossRef] [Green Version]
Figure 1.
Sketch of the Sea-wave Slot-cone Generator (SSG) wave-energy converter with turbine [25].
Figure 1.
Sketch of the Sea-wave Slot-cone Generator (SSG) wave-energy converter with turbine [25].

Figure 2.
Sketch of the laboratory model of the SSG system, with sizes shown (lengths in mm, angles in degree) [25].
Figure 2.
Sketch of the laboratory model of the SSG system, with sizes shown (lengths in mm, angles in degree) [25].

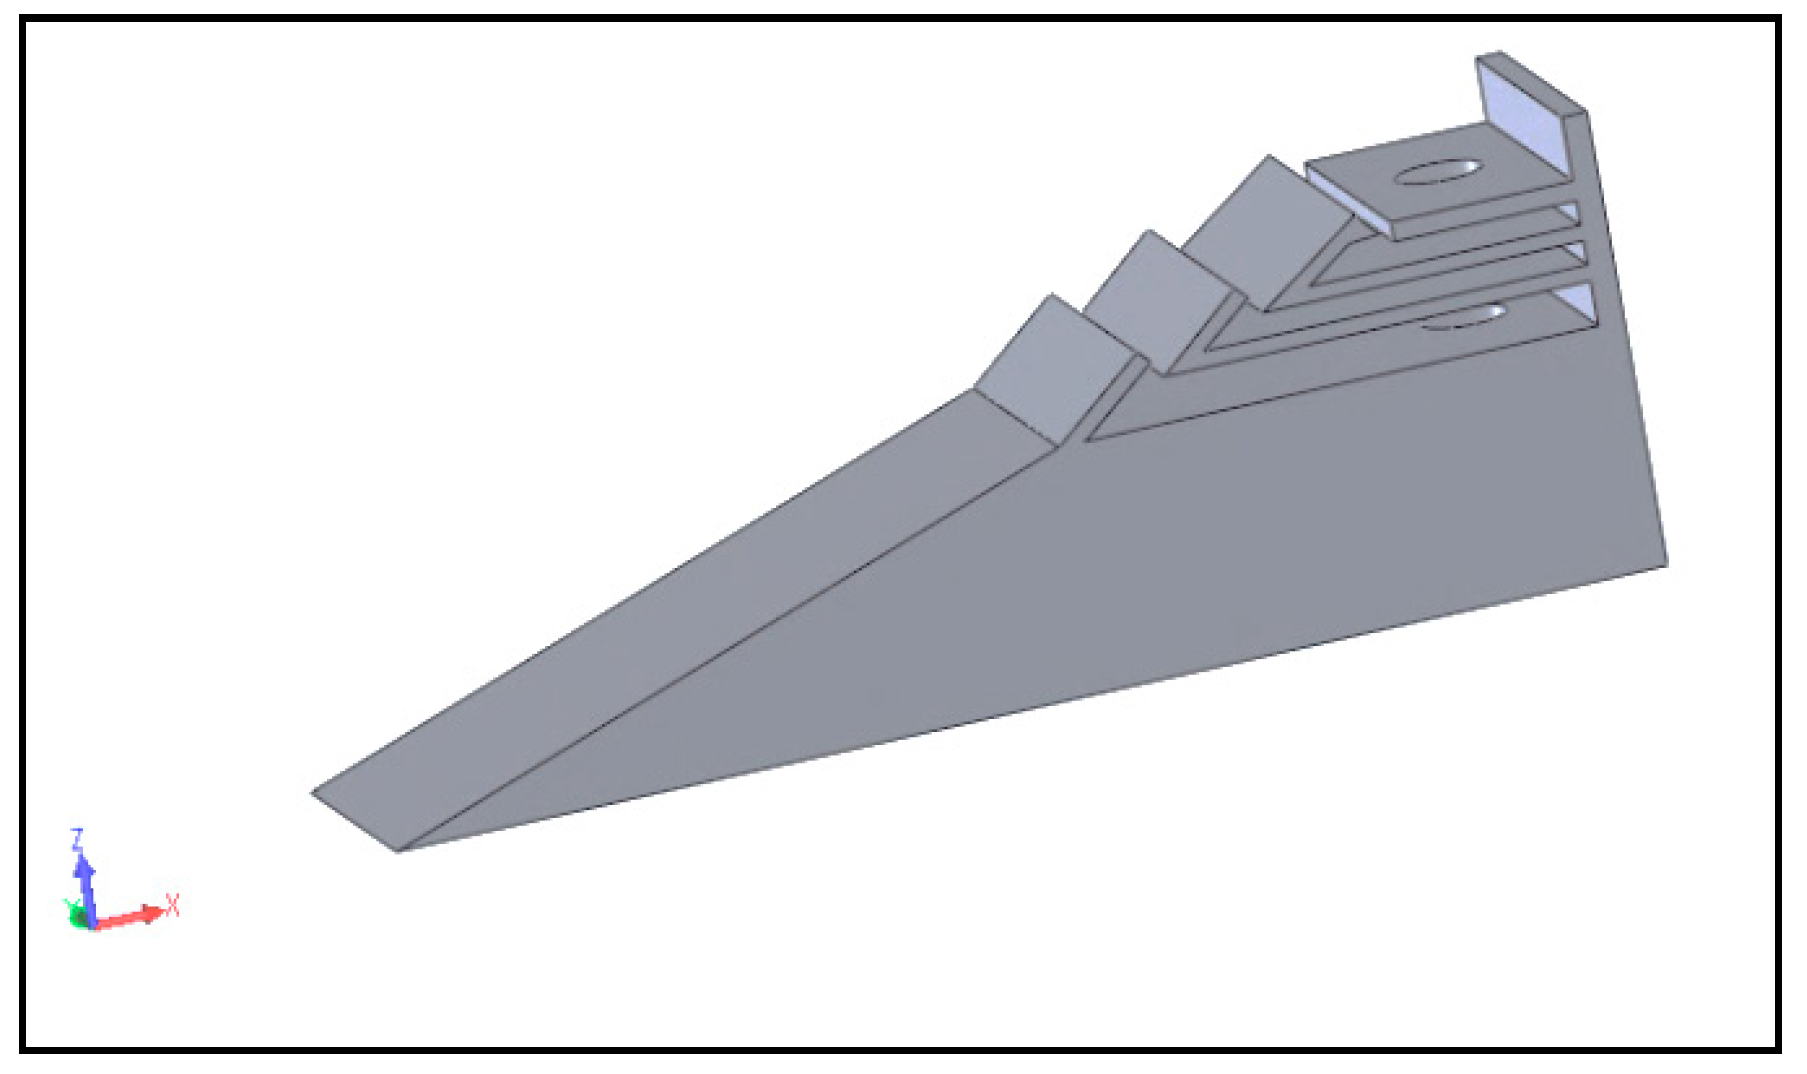
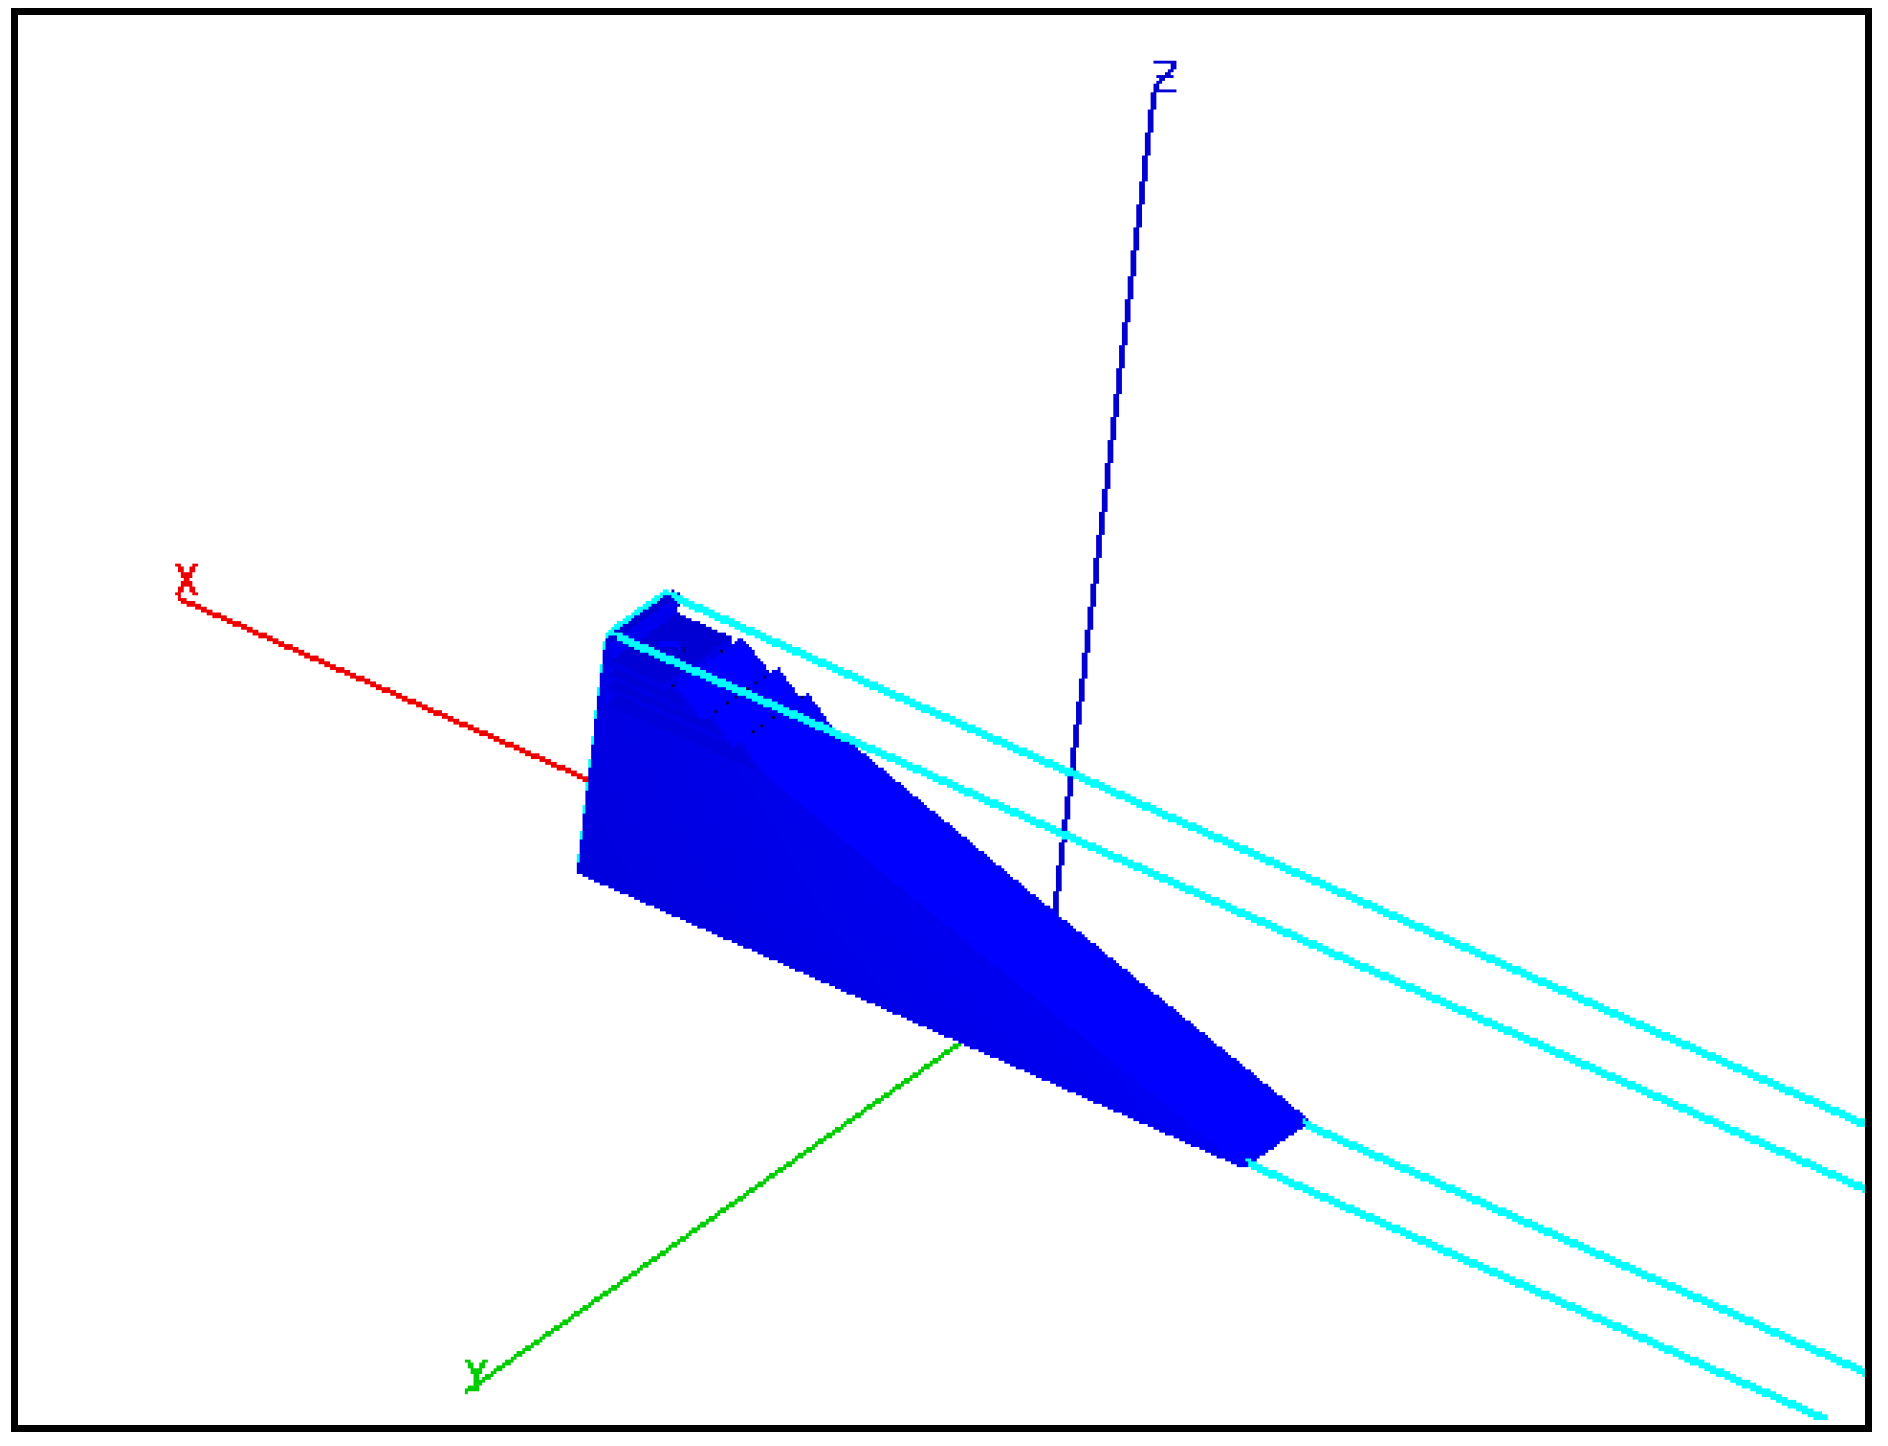
Figure 3.
A 3-D sketch of the geometry of the SSG energy generator device.

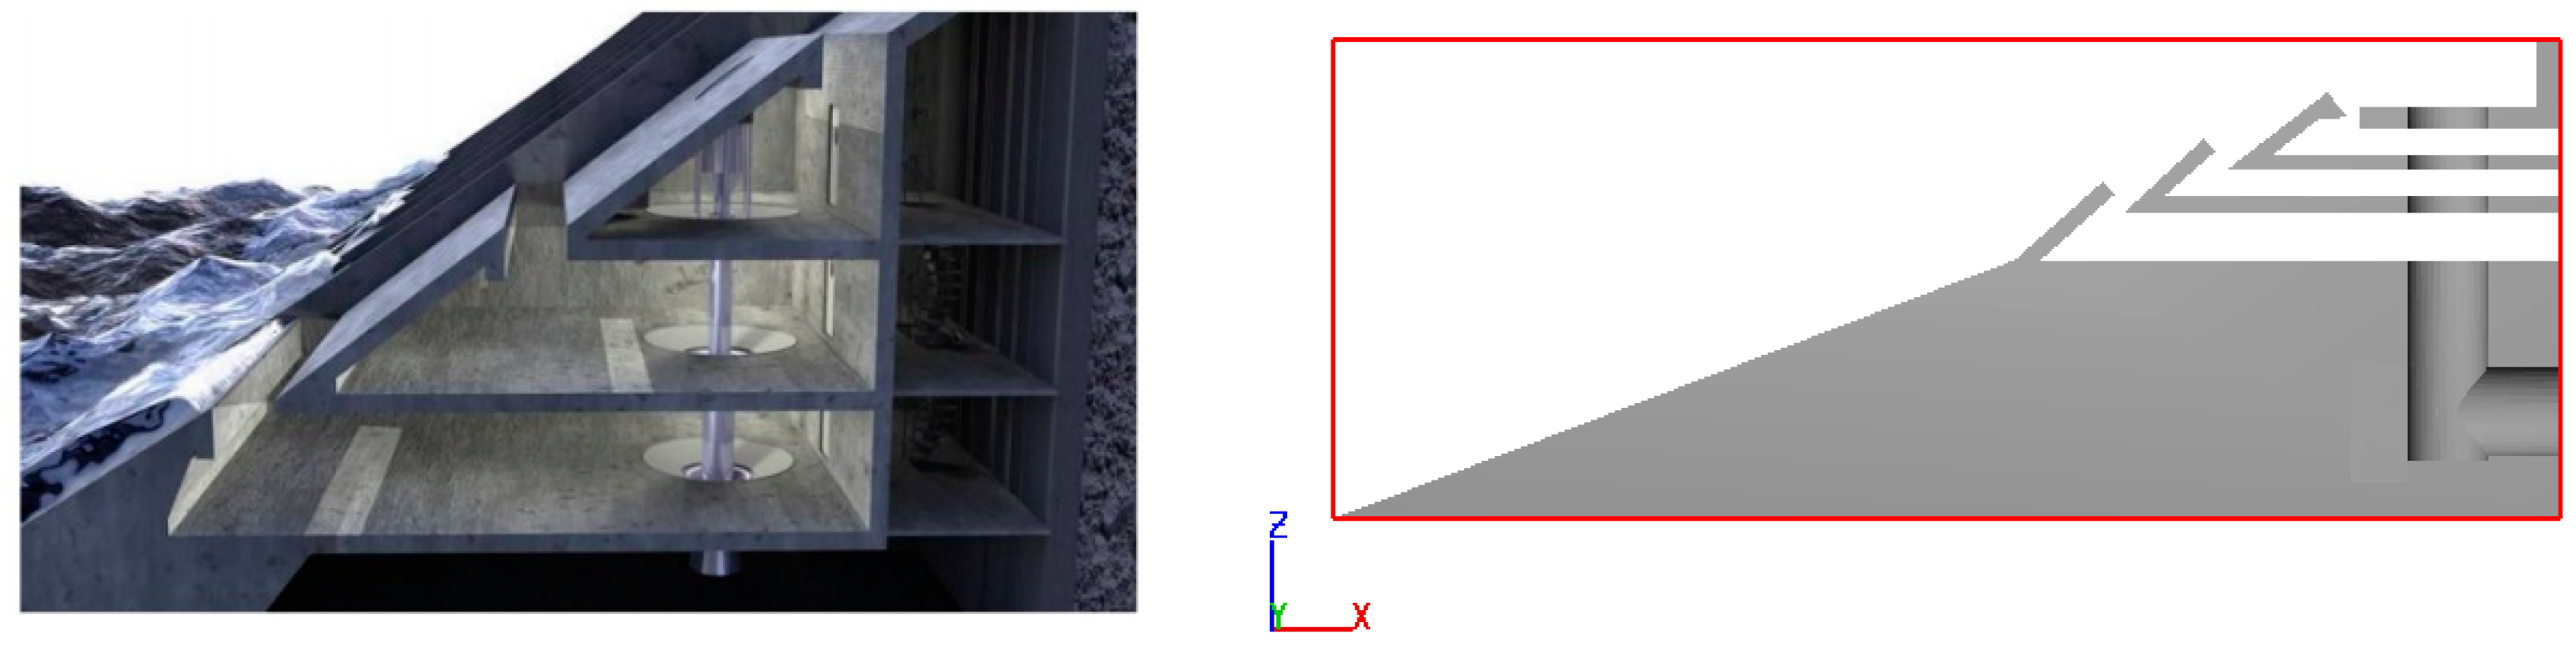
Figure 4.
A cross section of the SSG energy generator device [26].
Figure 4.
A cross section of the SSG energy generator device [26].

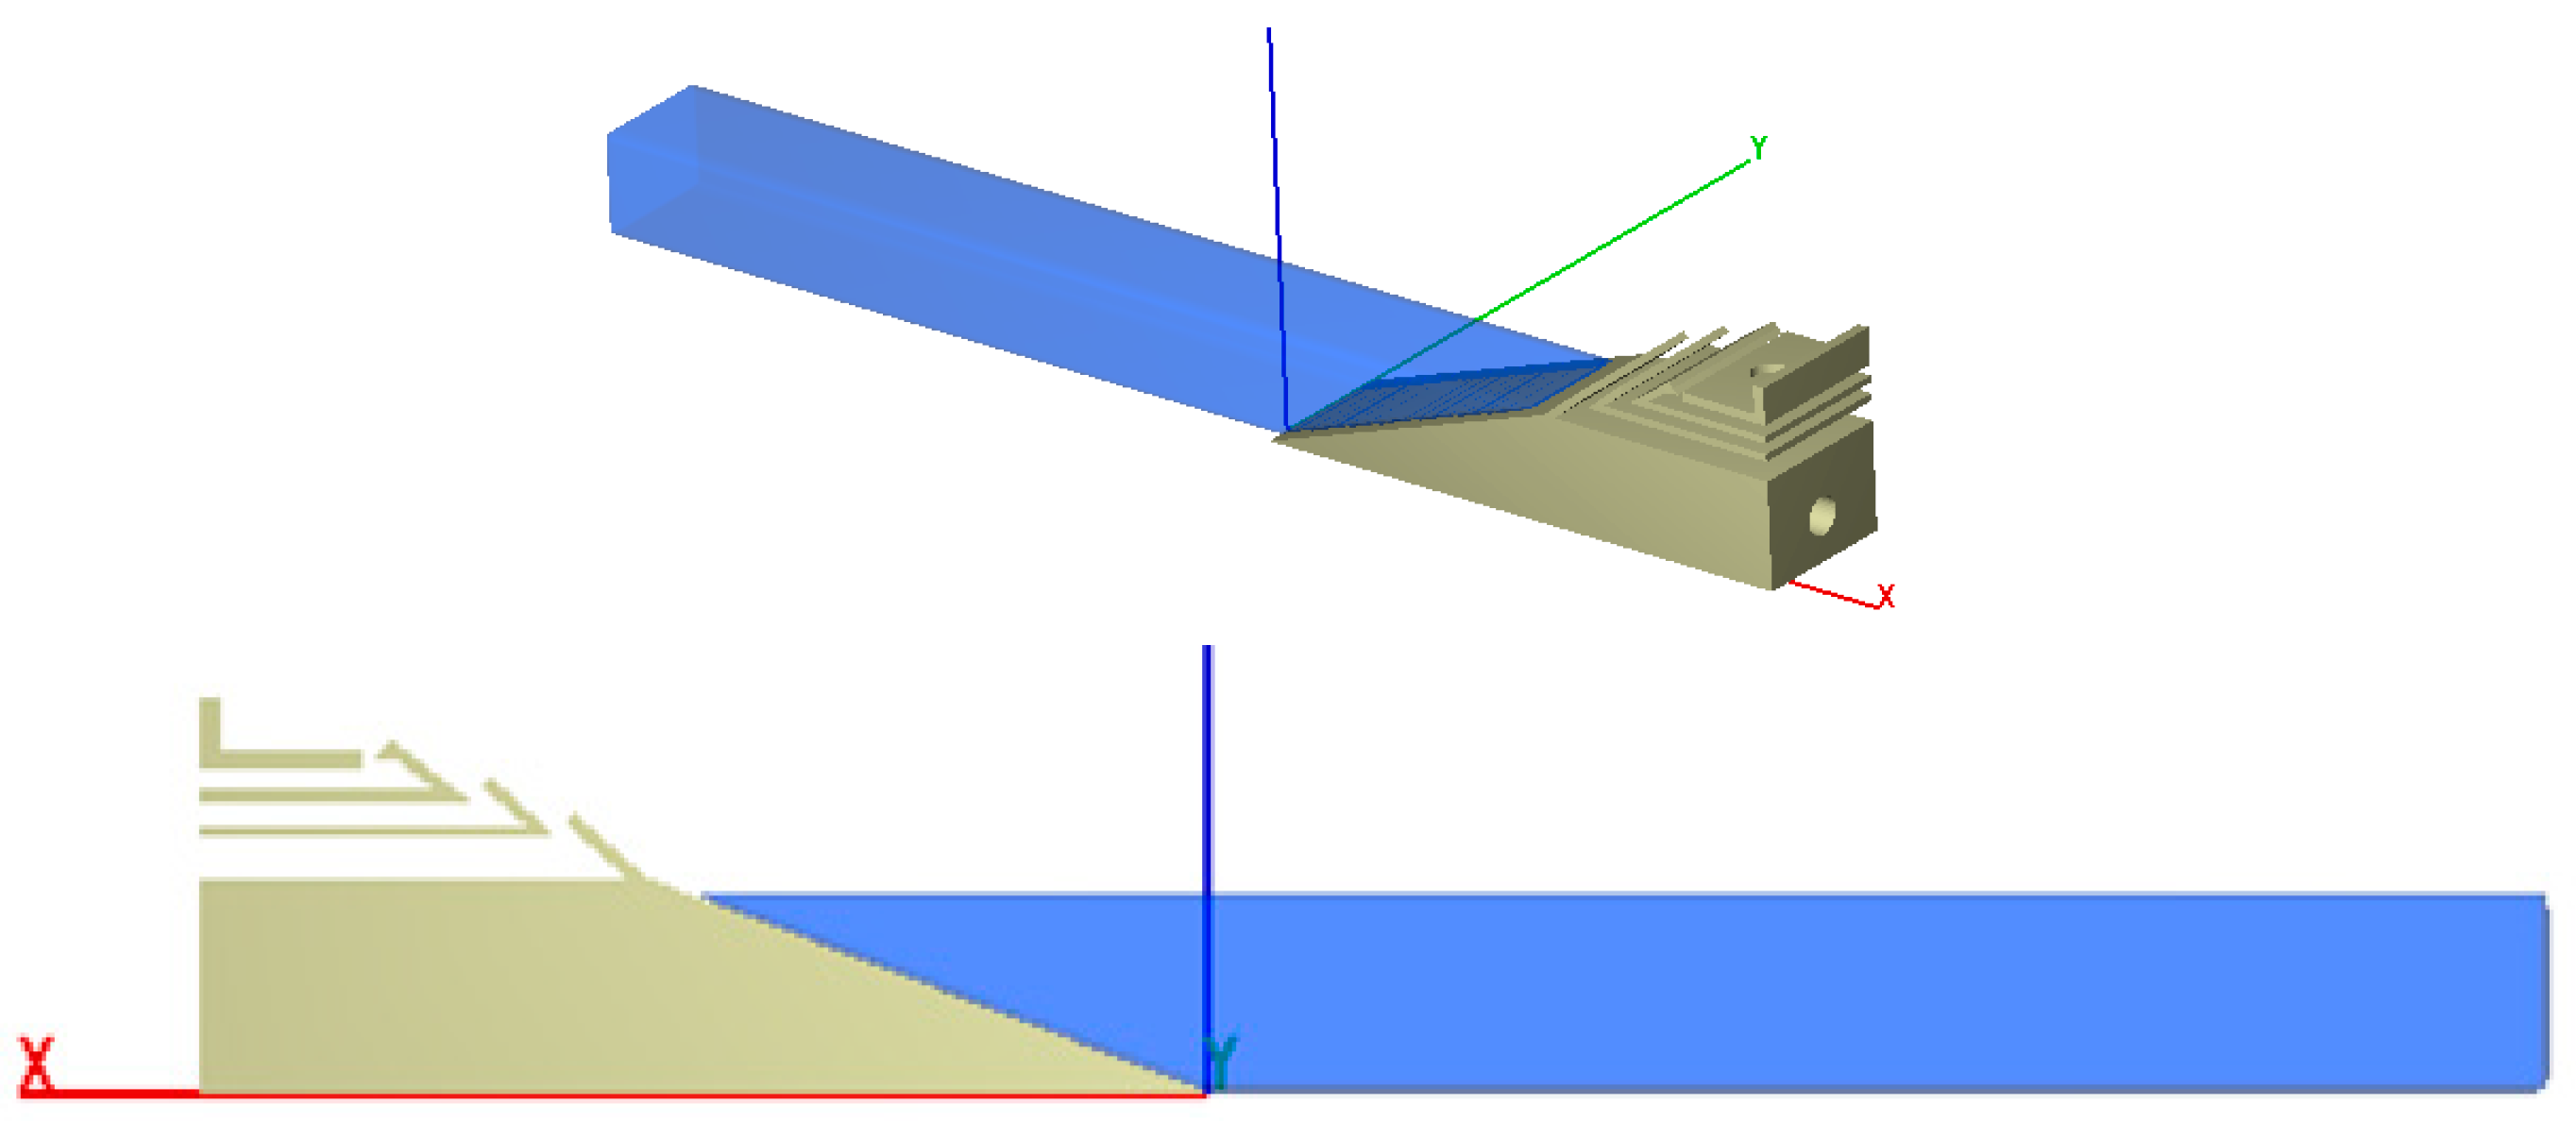
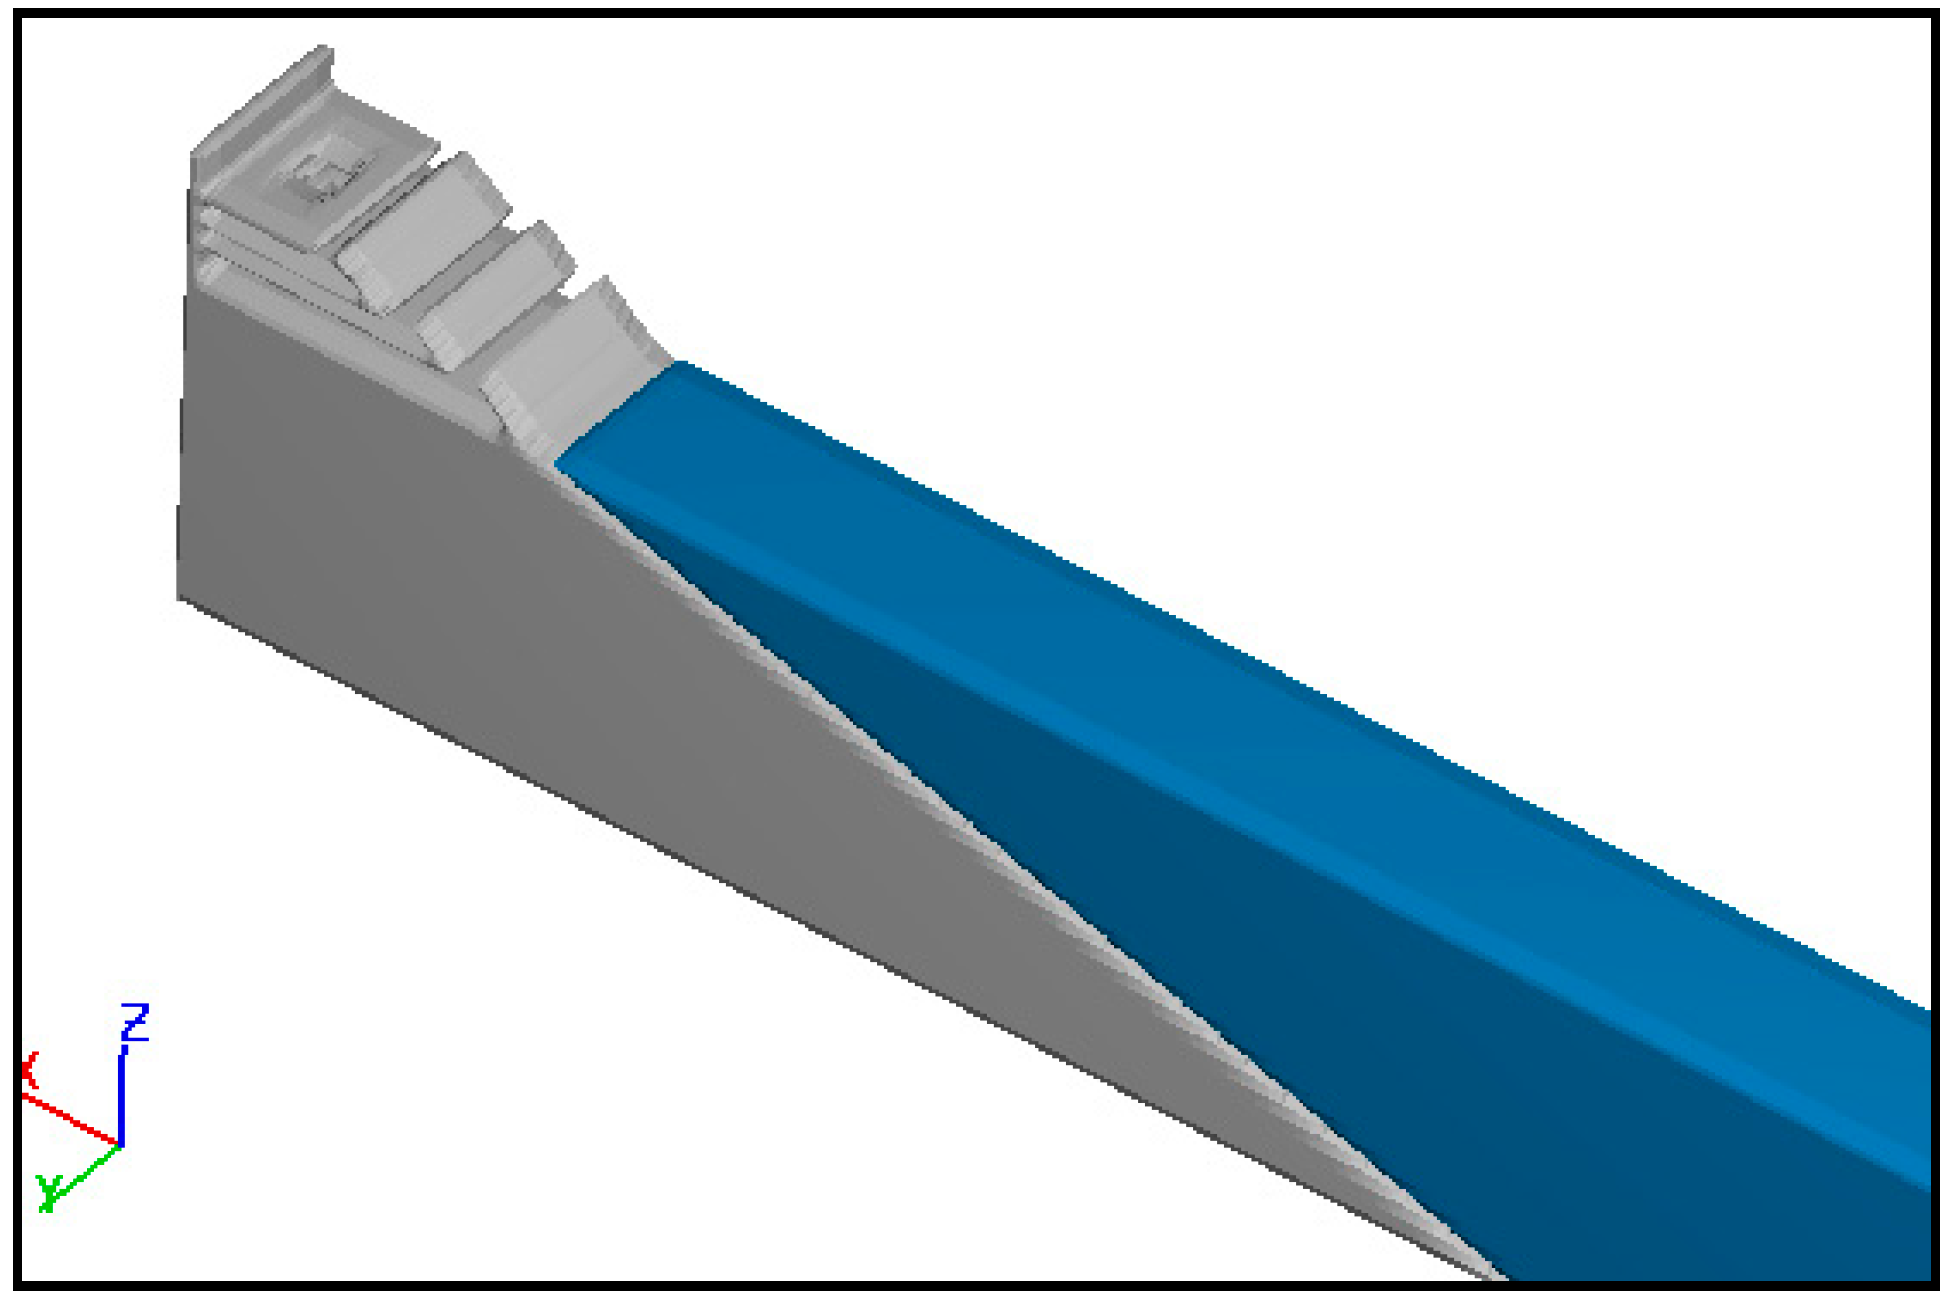
Figure 5.
A model of the SSG wave-energy extraction device with initial conditions (T = 0 s), shown in 3-D and 2-D.
Figure 5.
A model of the SSG wave-energy extraction device with initial conditions (T = 0 s), shown in 3-D and 2-D.

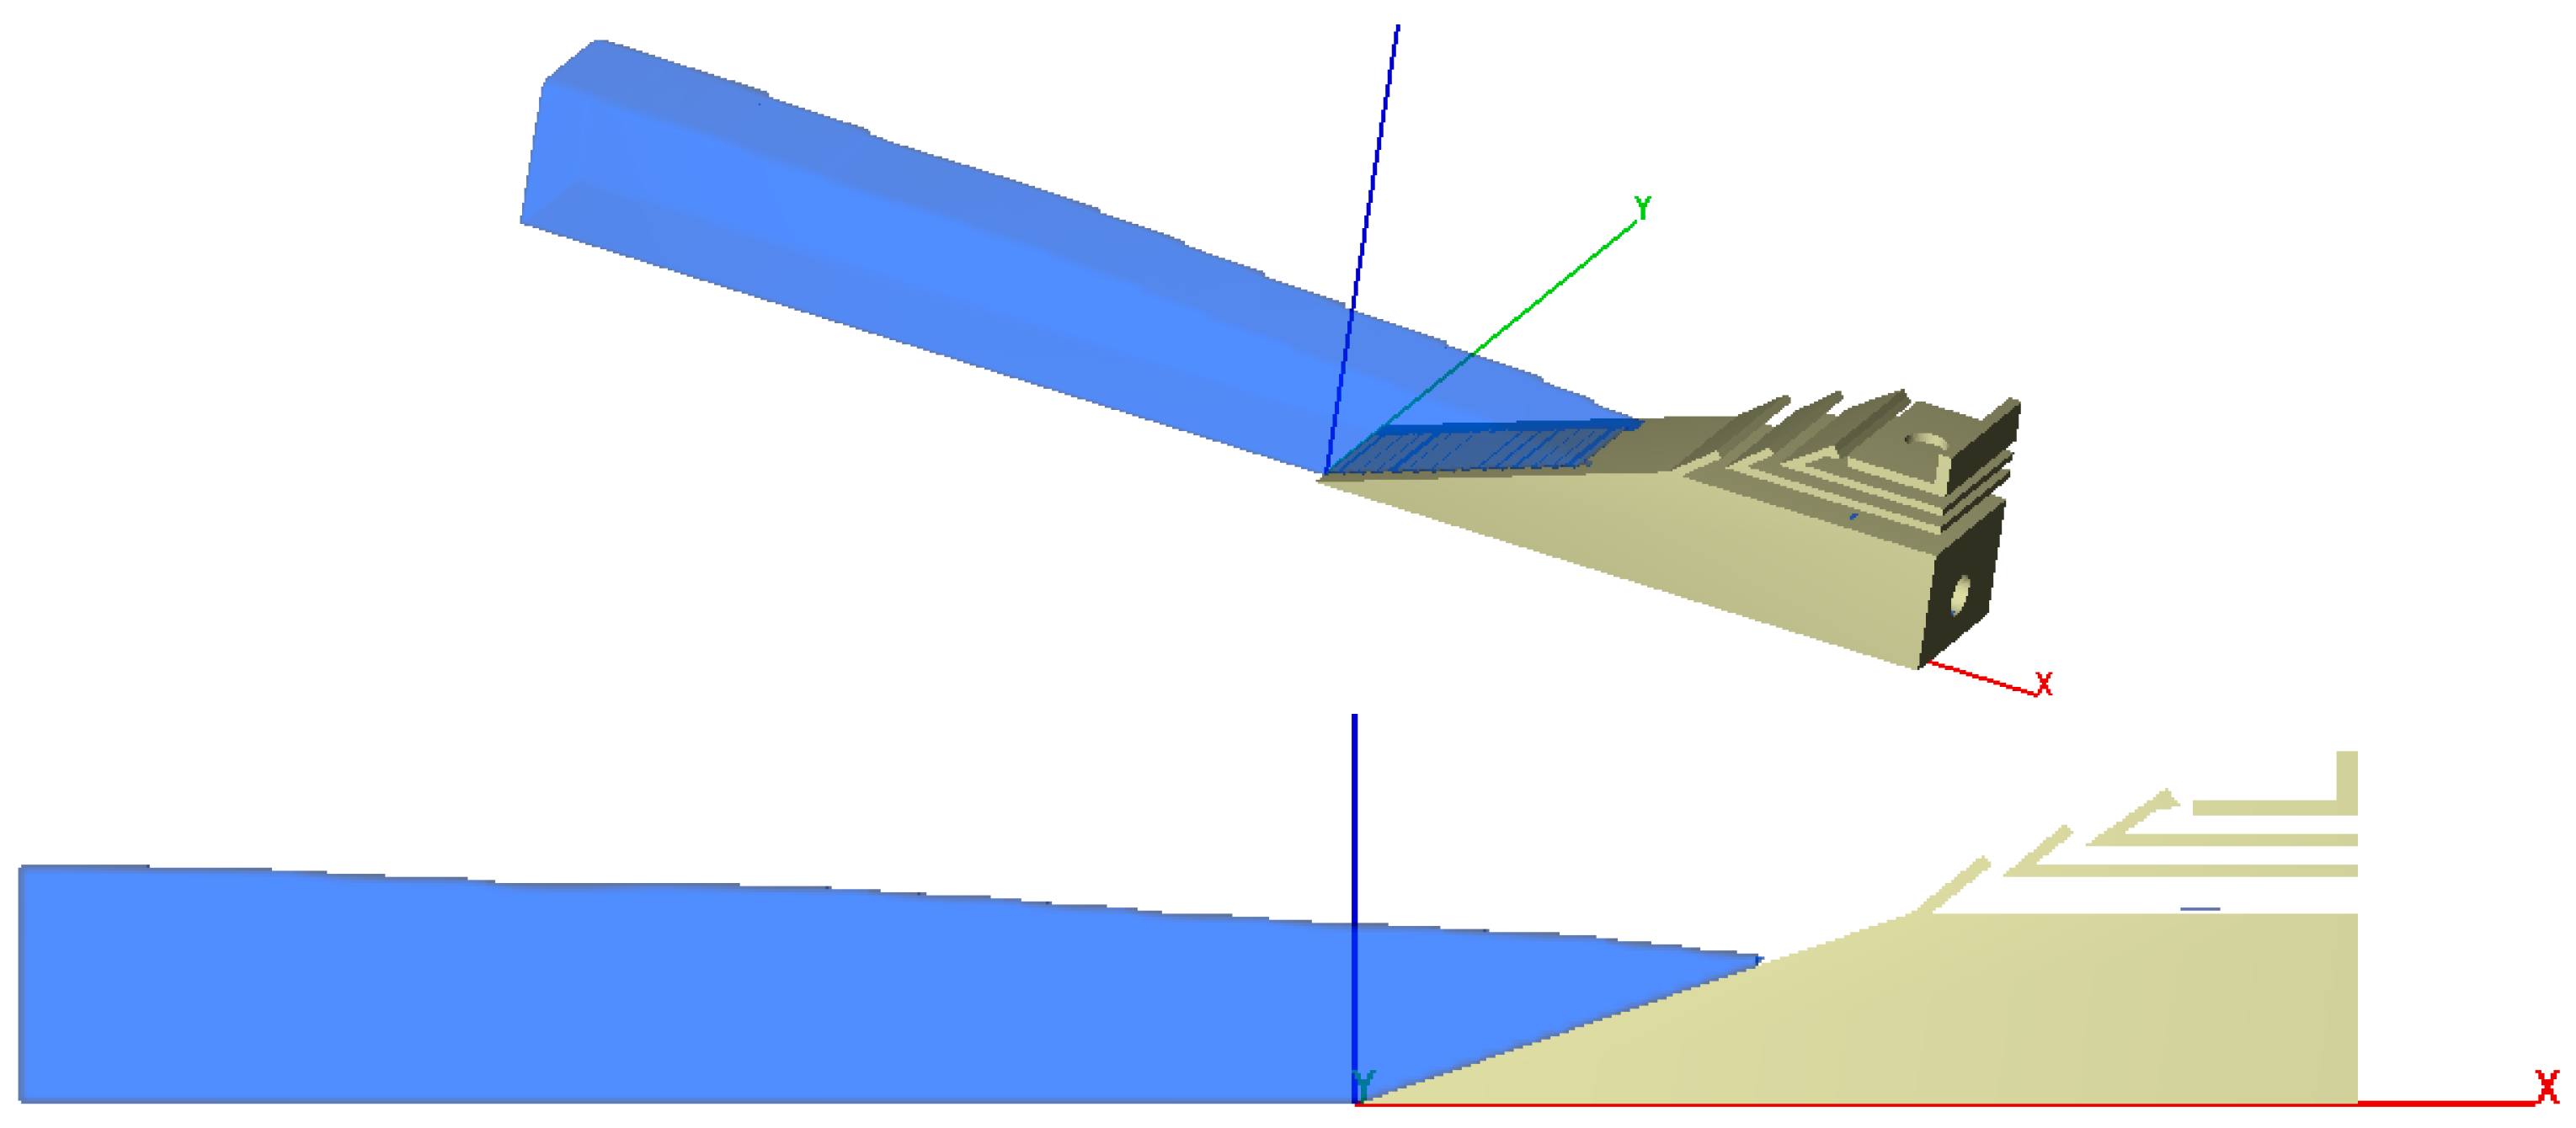
Figure 6.
A model of the wave run-down onto the SSG wave-energy extraction device during the simulation, shown in 3-D and 2-D.
Figure 6.
A model of the wave run-down onto the SSG wave-energy extraction device during the simulation, shown in 3-D and 2-D.

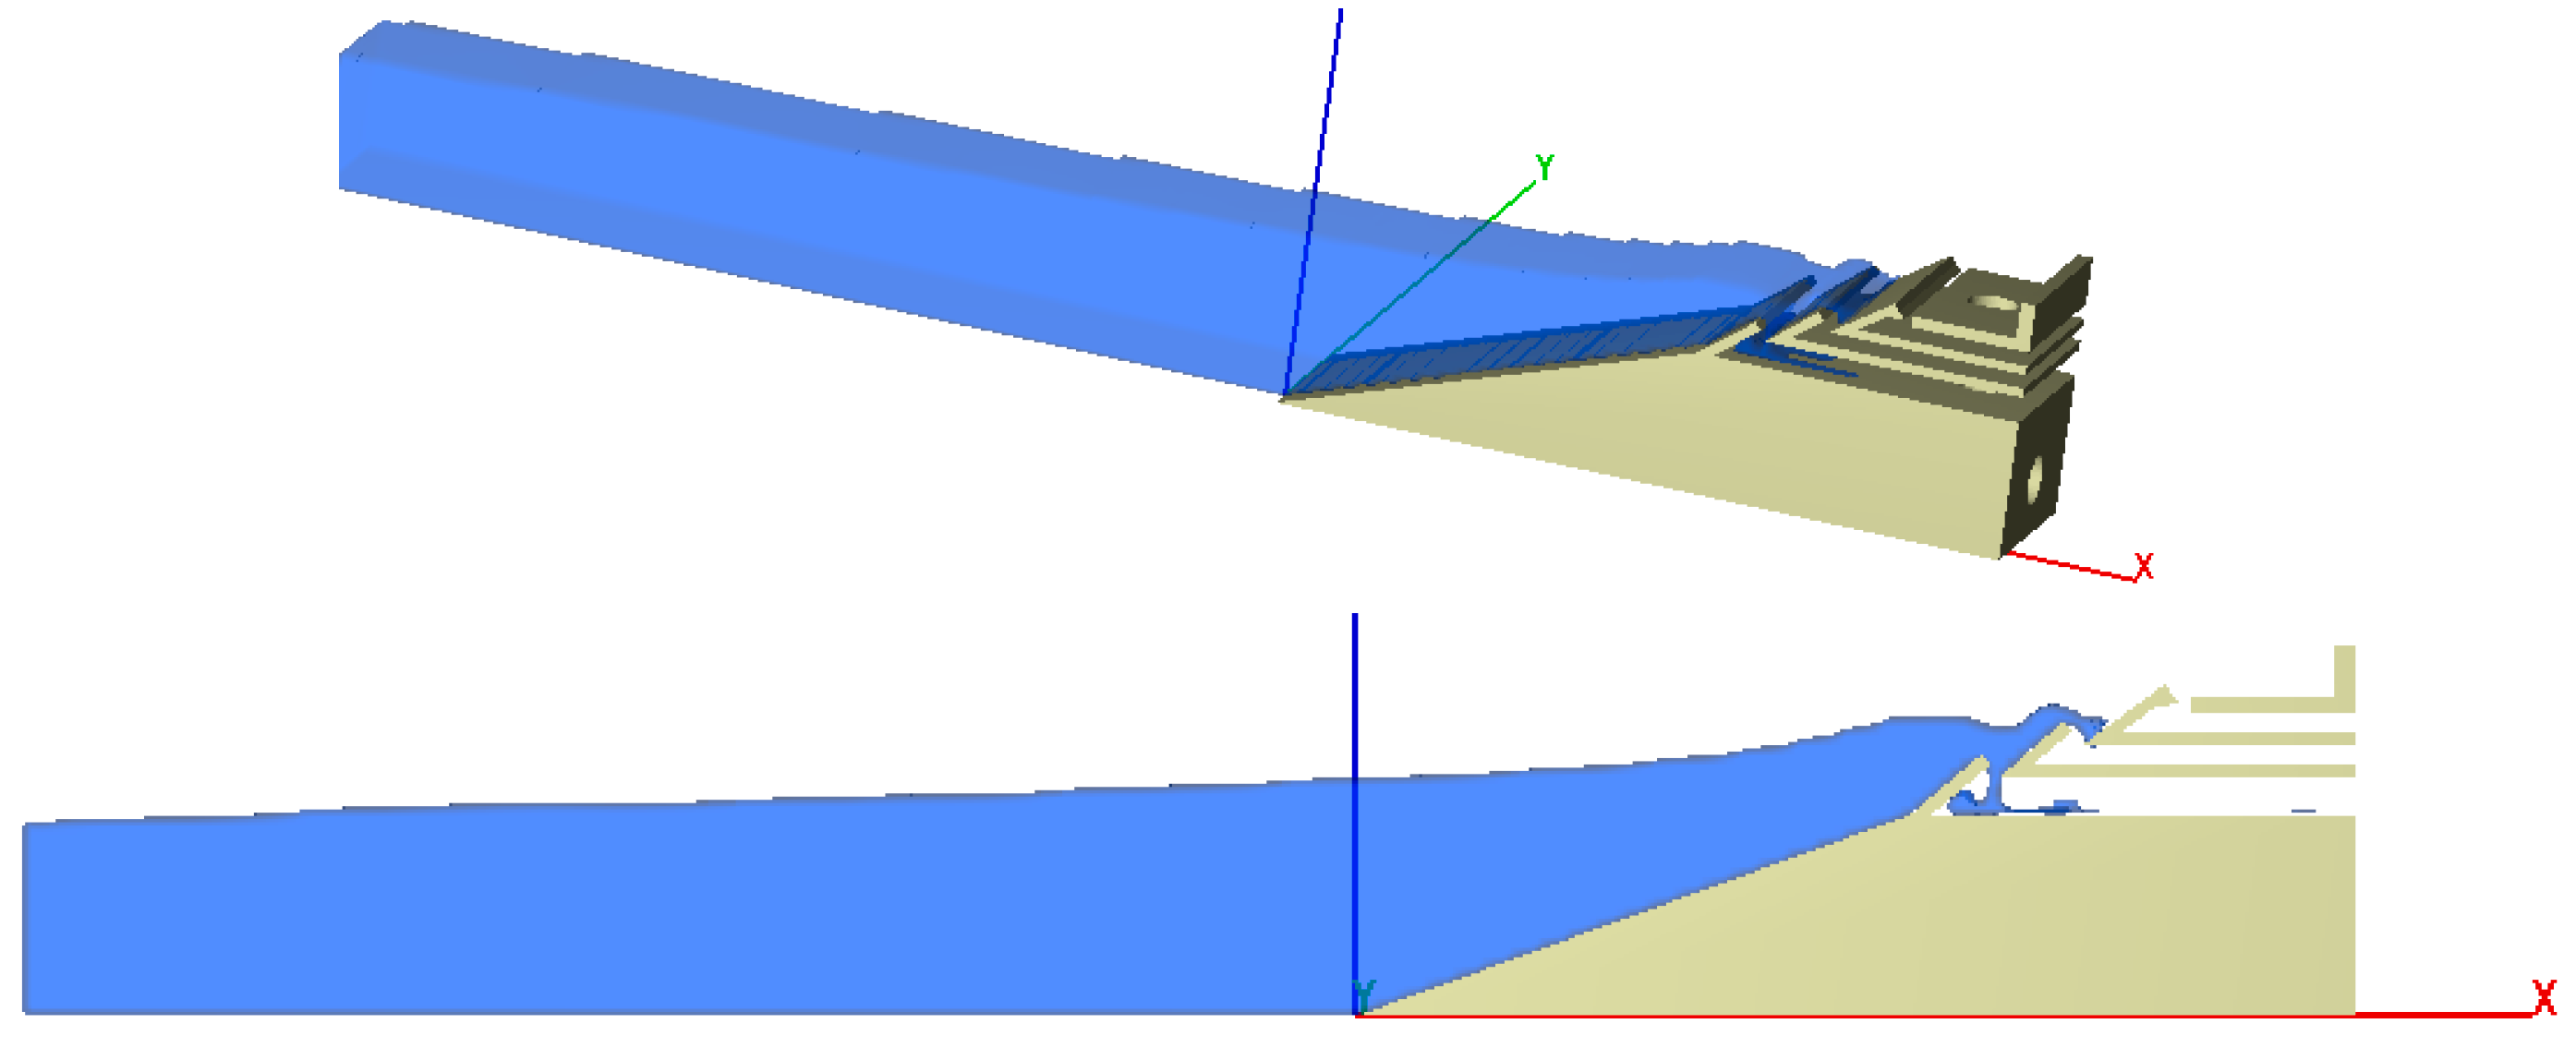
Figure 7.
A model of the wave run-up over the SSG wave-energy extraction device during the simulation, shown in 3-D and 2-D.
Figure 7.
A model of the wave run-up over the SSG wave-energy extraction device during the simulation, shown in 3-D and 2-D.

Figure 8.
The flow field condition, in the middle section of the SSG wave-energy extraction device, due to the run-up conditions of waves (fraction of fluid contours).
Figure 8.
The flow field condition, in the middle section of the SSG wave-energy extraction device, due to the run-up conditions of waves (fraction of fluid contours).

Figure 9.
The performance of fractional area-volume obstacle representation (FAVOR), with solid boundaries for different mesh sizes, and the SSG system mesh calibration in (X, Y, Z) dimensions.
Figure 9.
The performance of fractional area-volume obstacle representation (FAVOR), with solid boundaries for different mesh sizes, and the SSG system mesh calibration in (X, Y, Z) dimensions.


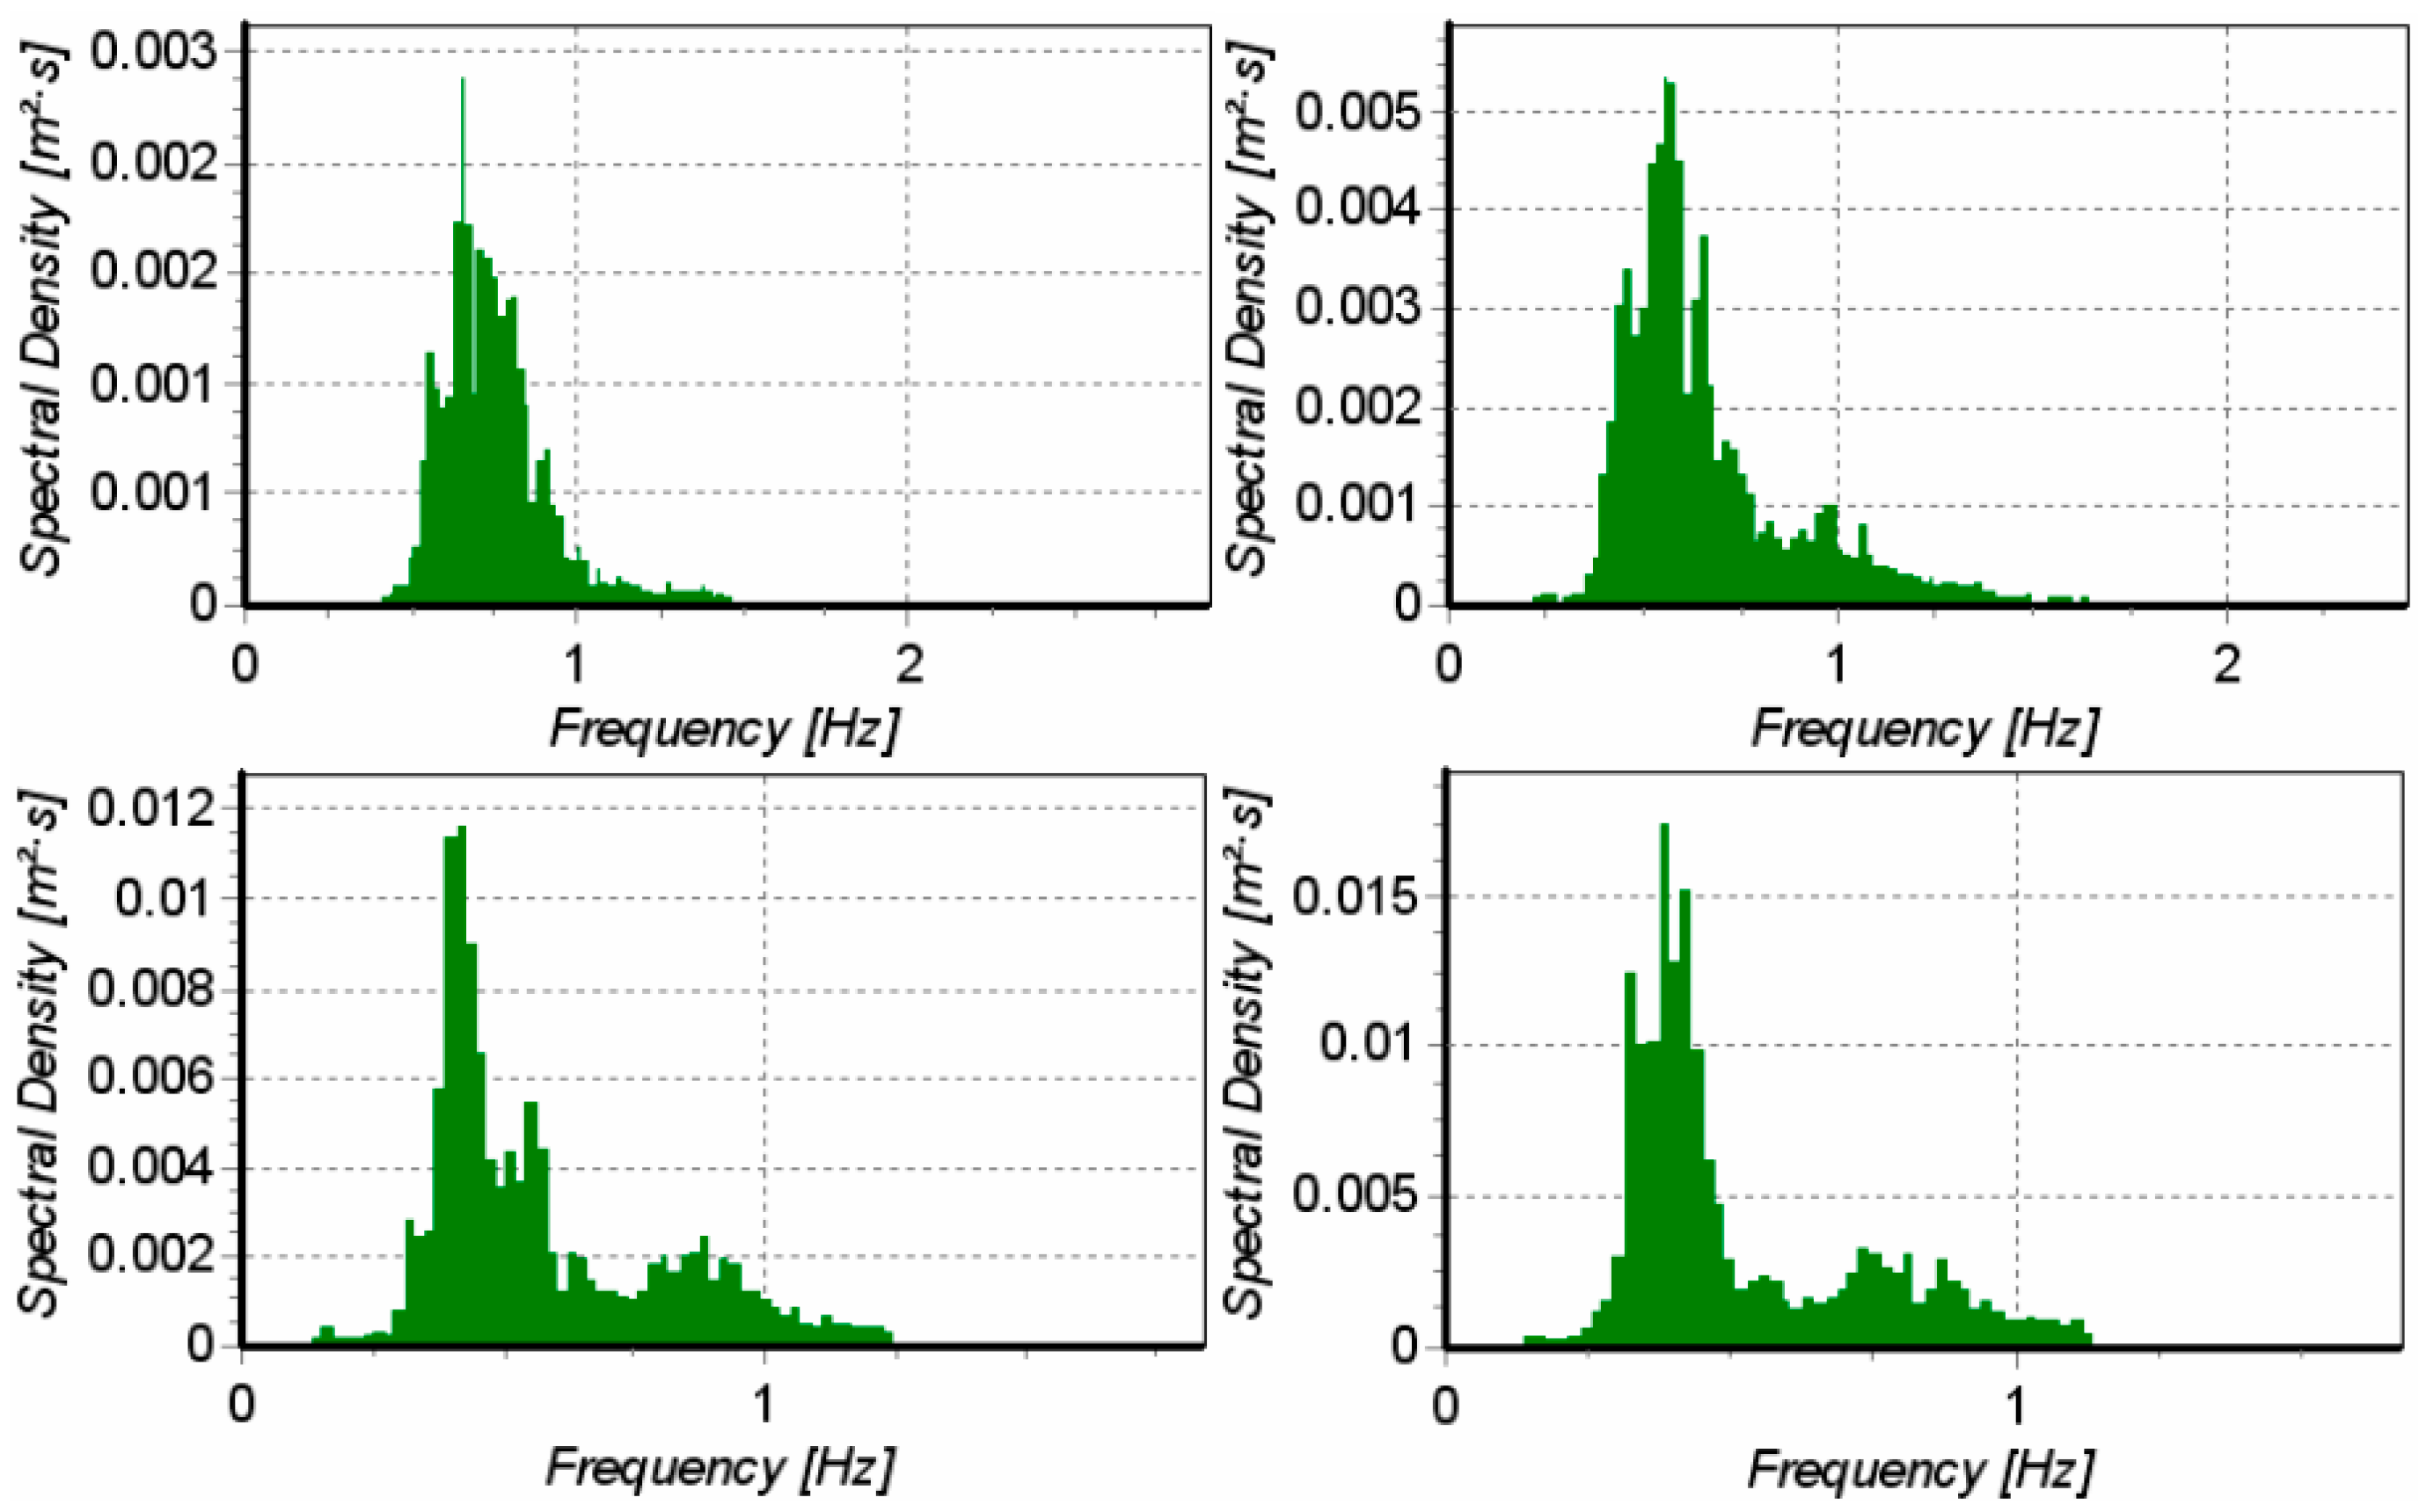
Figure 10.
Wave spectrum for four types of waves during the calibration period [25].
Figure 10.
Wave spectrum for four types of waves during the calibration period [25].

Figure 11.
Discharge versus time of the SSG system for the wave spectrum A.

Figure 12.
Discharge versus time of the SSG system for the wave spectrum B.

Figure 13.
Discharge versus time of the SSG system for the wave spectrum C.

Figure 14.
Discharge versus time of the SSG system for the wave spectrum D.

Figure 15.
Comparison between the laboratory model and numerical model in the SSG wave-energy extraction device, for four wave spectrums.
Figure 15.
Comparison between the laboratory model and numerical model in the SSG wave-energy extraction device, for four wave spectrums.

Figure 16.
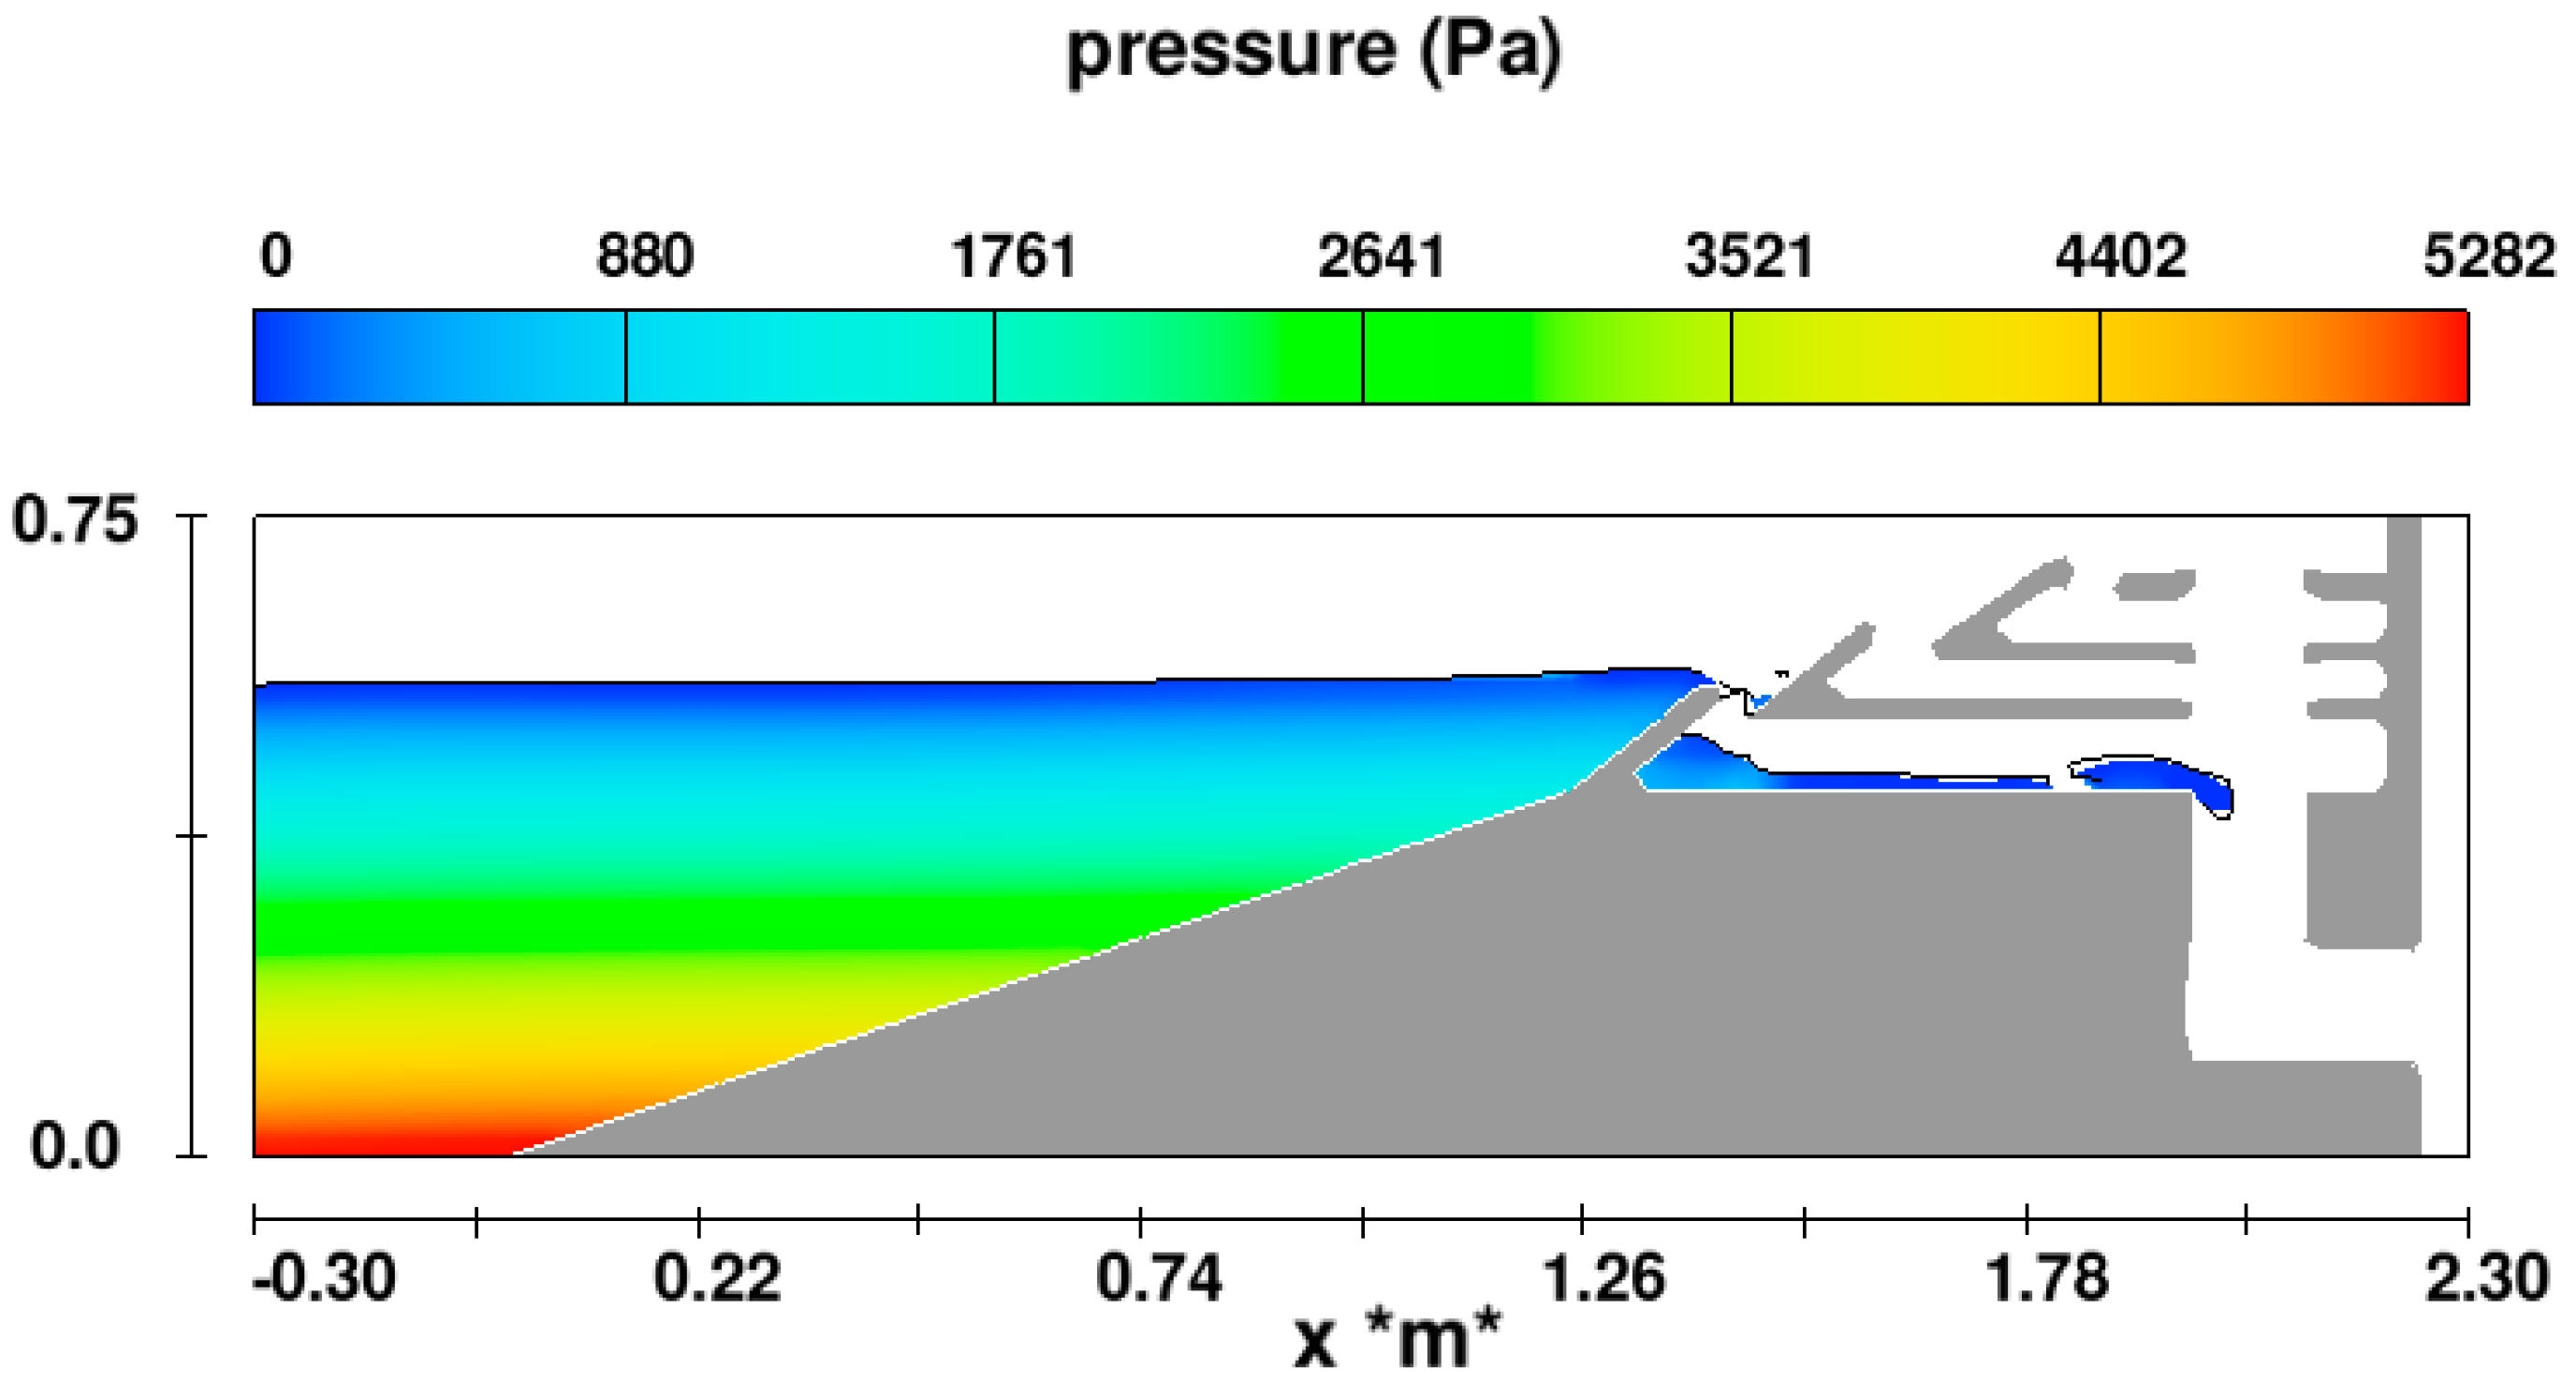
Pressure in the SSG wave-energy extraction device for wave spectrum A in a run-up wave.

Figure 17.
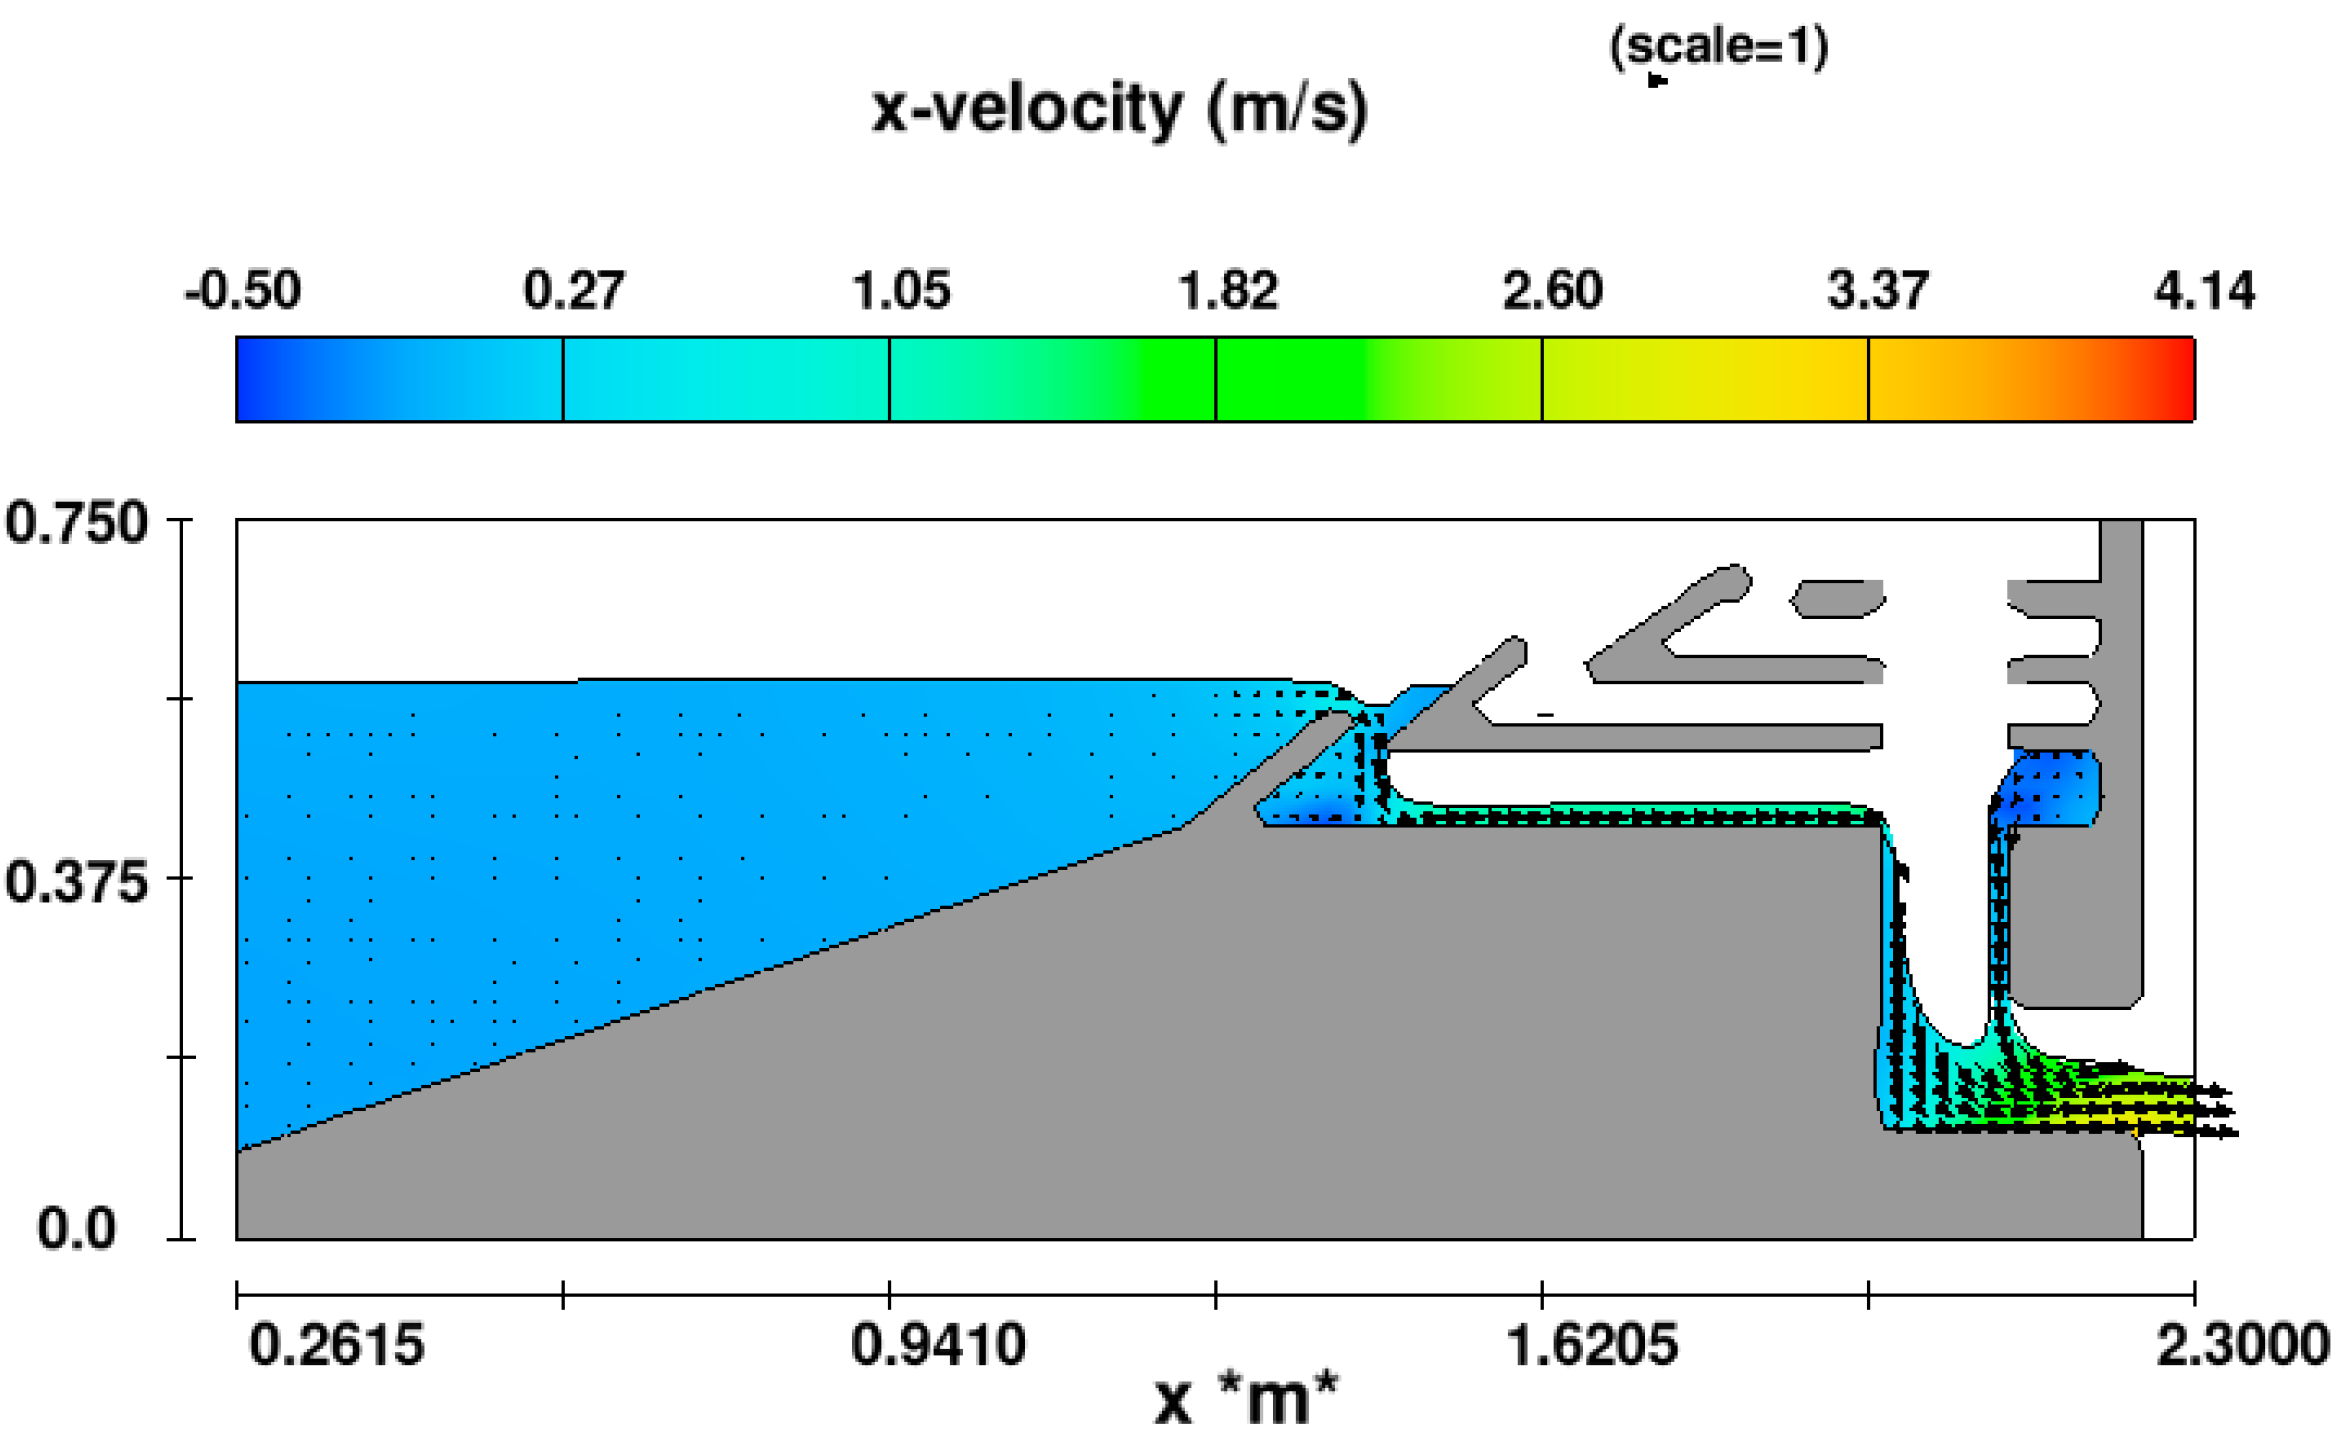
Velocity in the SSG wave-energy extraction device for wave spectrum B in a run-up wave.

Figure 18.
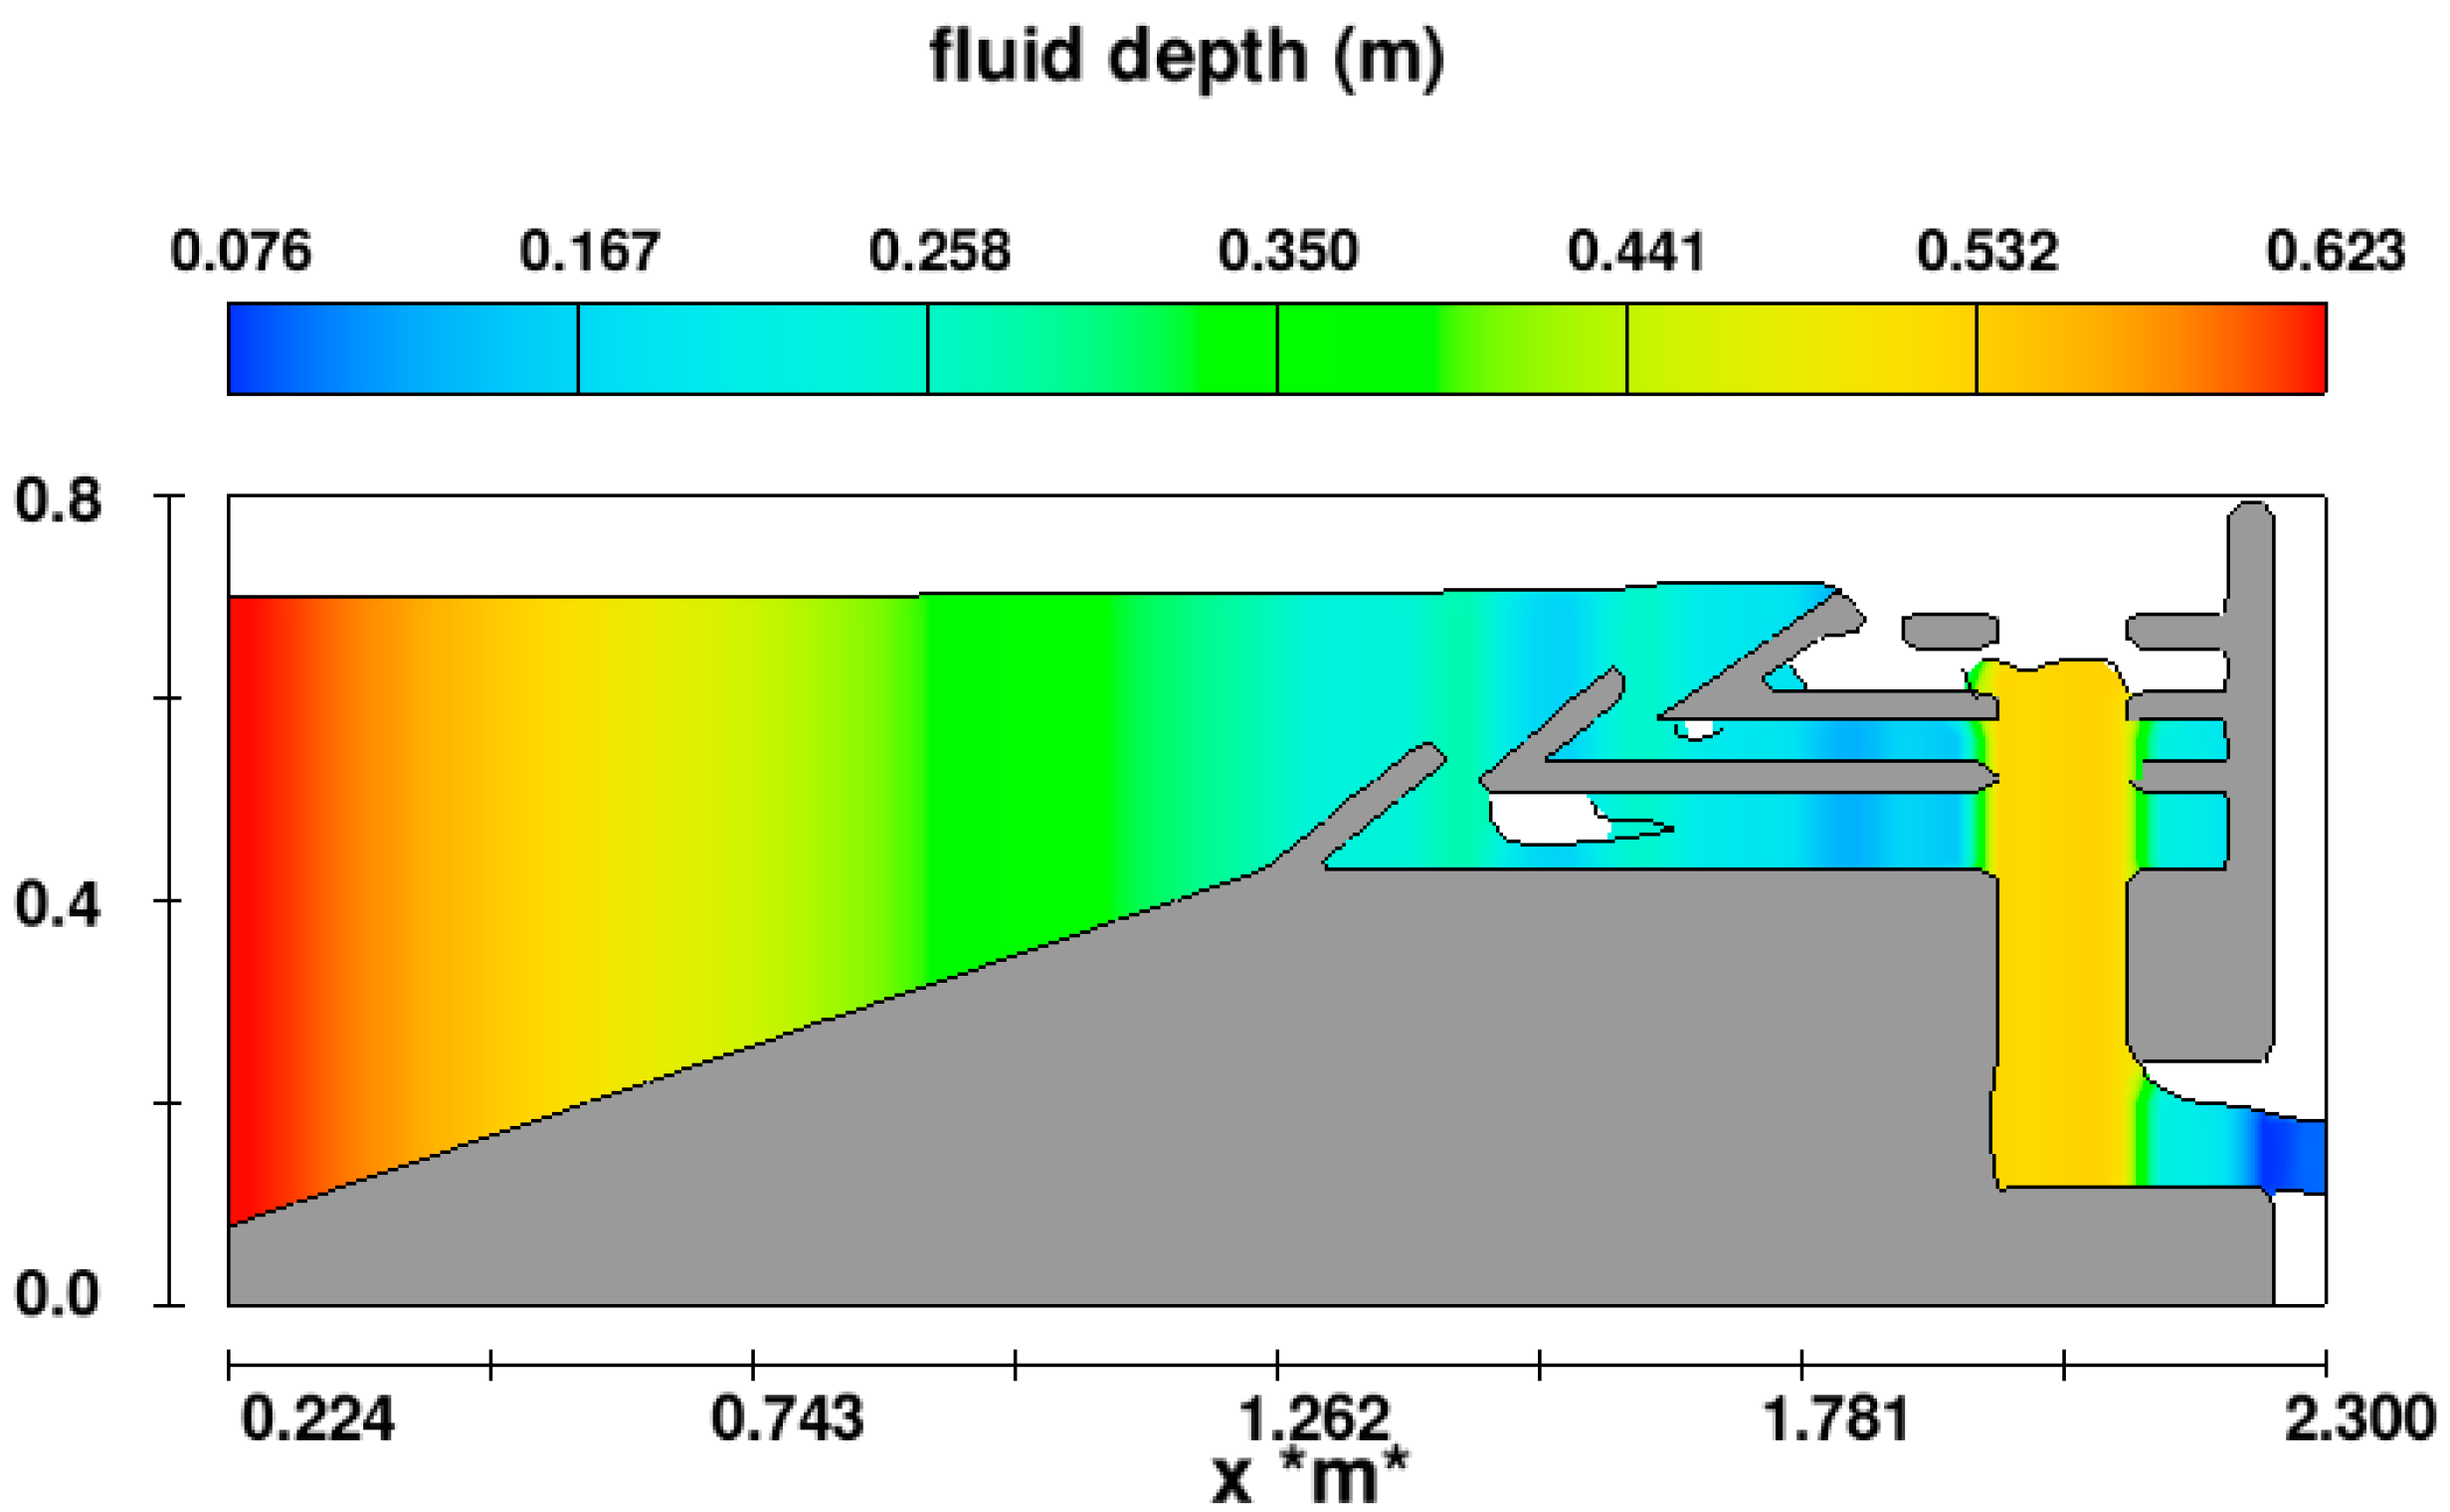
Fluid depth in the SSG wave-energy extraction device for wave spectrum D in the run-up wave.
Figure 18.
Fluid depth in the SSG wave-energy extraction device for wave spectrum D in the run-up wave.

Figure 19.
Construction of the solid model of the SSG wave-energy extraction device in the Persian Gulf and Oman Sea.
Figure 19.
Construction of the solid model of the SSG wave-energy extraction device in the Persian Gulf and Oman Sea.

Figure 20.
The FAVOR method of the SSG system, in a depth of 15 m with the calibrated model conditions.
Figure 20.
The FAVOR method of the SSG system, in a depth of 15 m with the calibrated model conditions.

Figure 21.
Location of the wave gauges in the Persian Gulf and Oman Sea.

Figure 22.
Extreme value analysis (EVA) results for wave height over a 100-year period in the Persian Gulf.
Figure 22.
Extreme value analysis (EVA) results for wave height over a 100-year period in the Persian Gulf.

Figure 23.
EVA results for wave height over a 100-year period in the Strait of Hormoz.

Figure 24.
EVA results for wave height over a 100-year period in the Oman Sea.

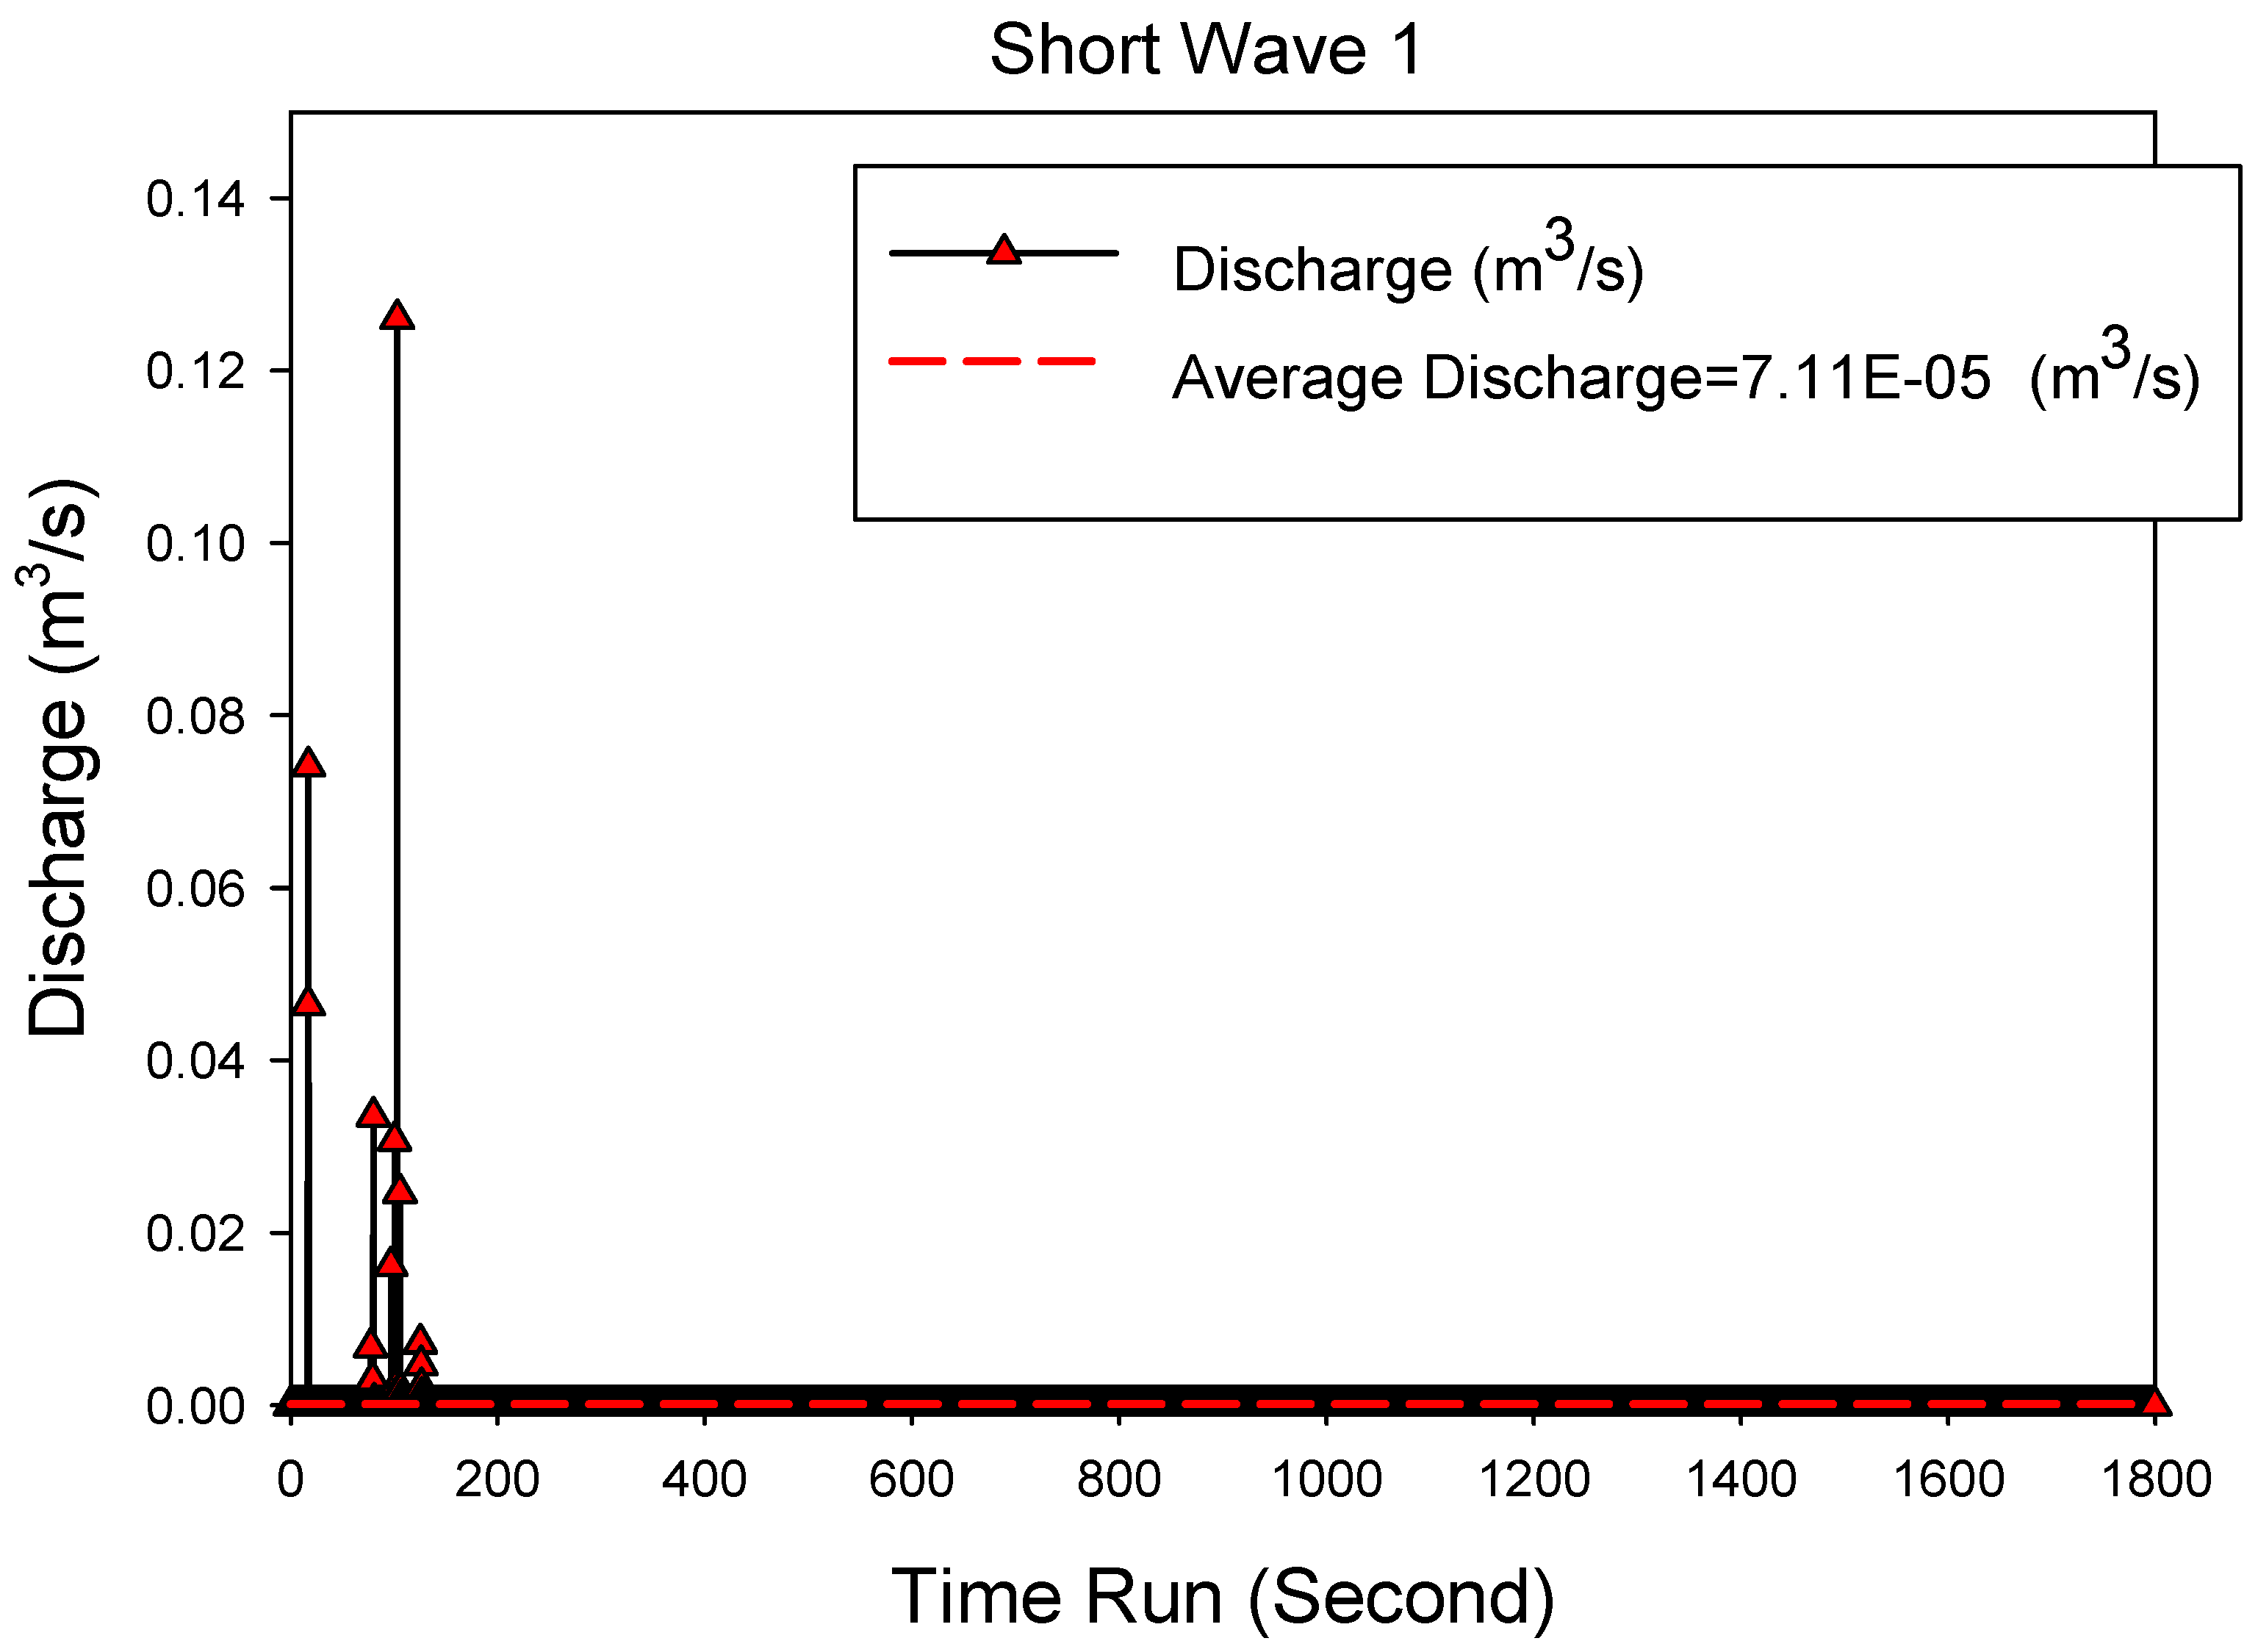
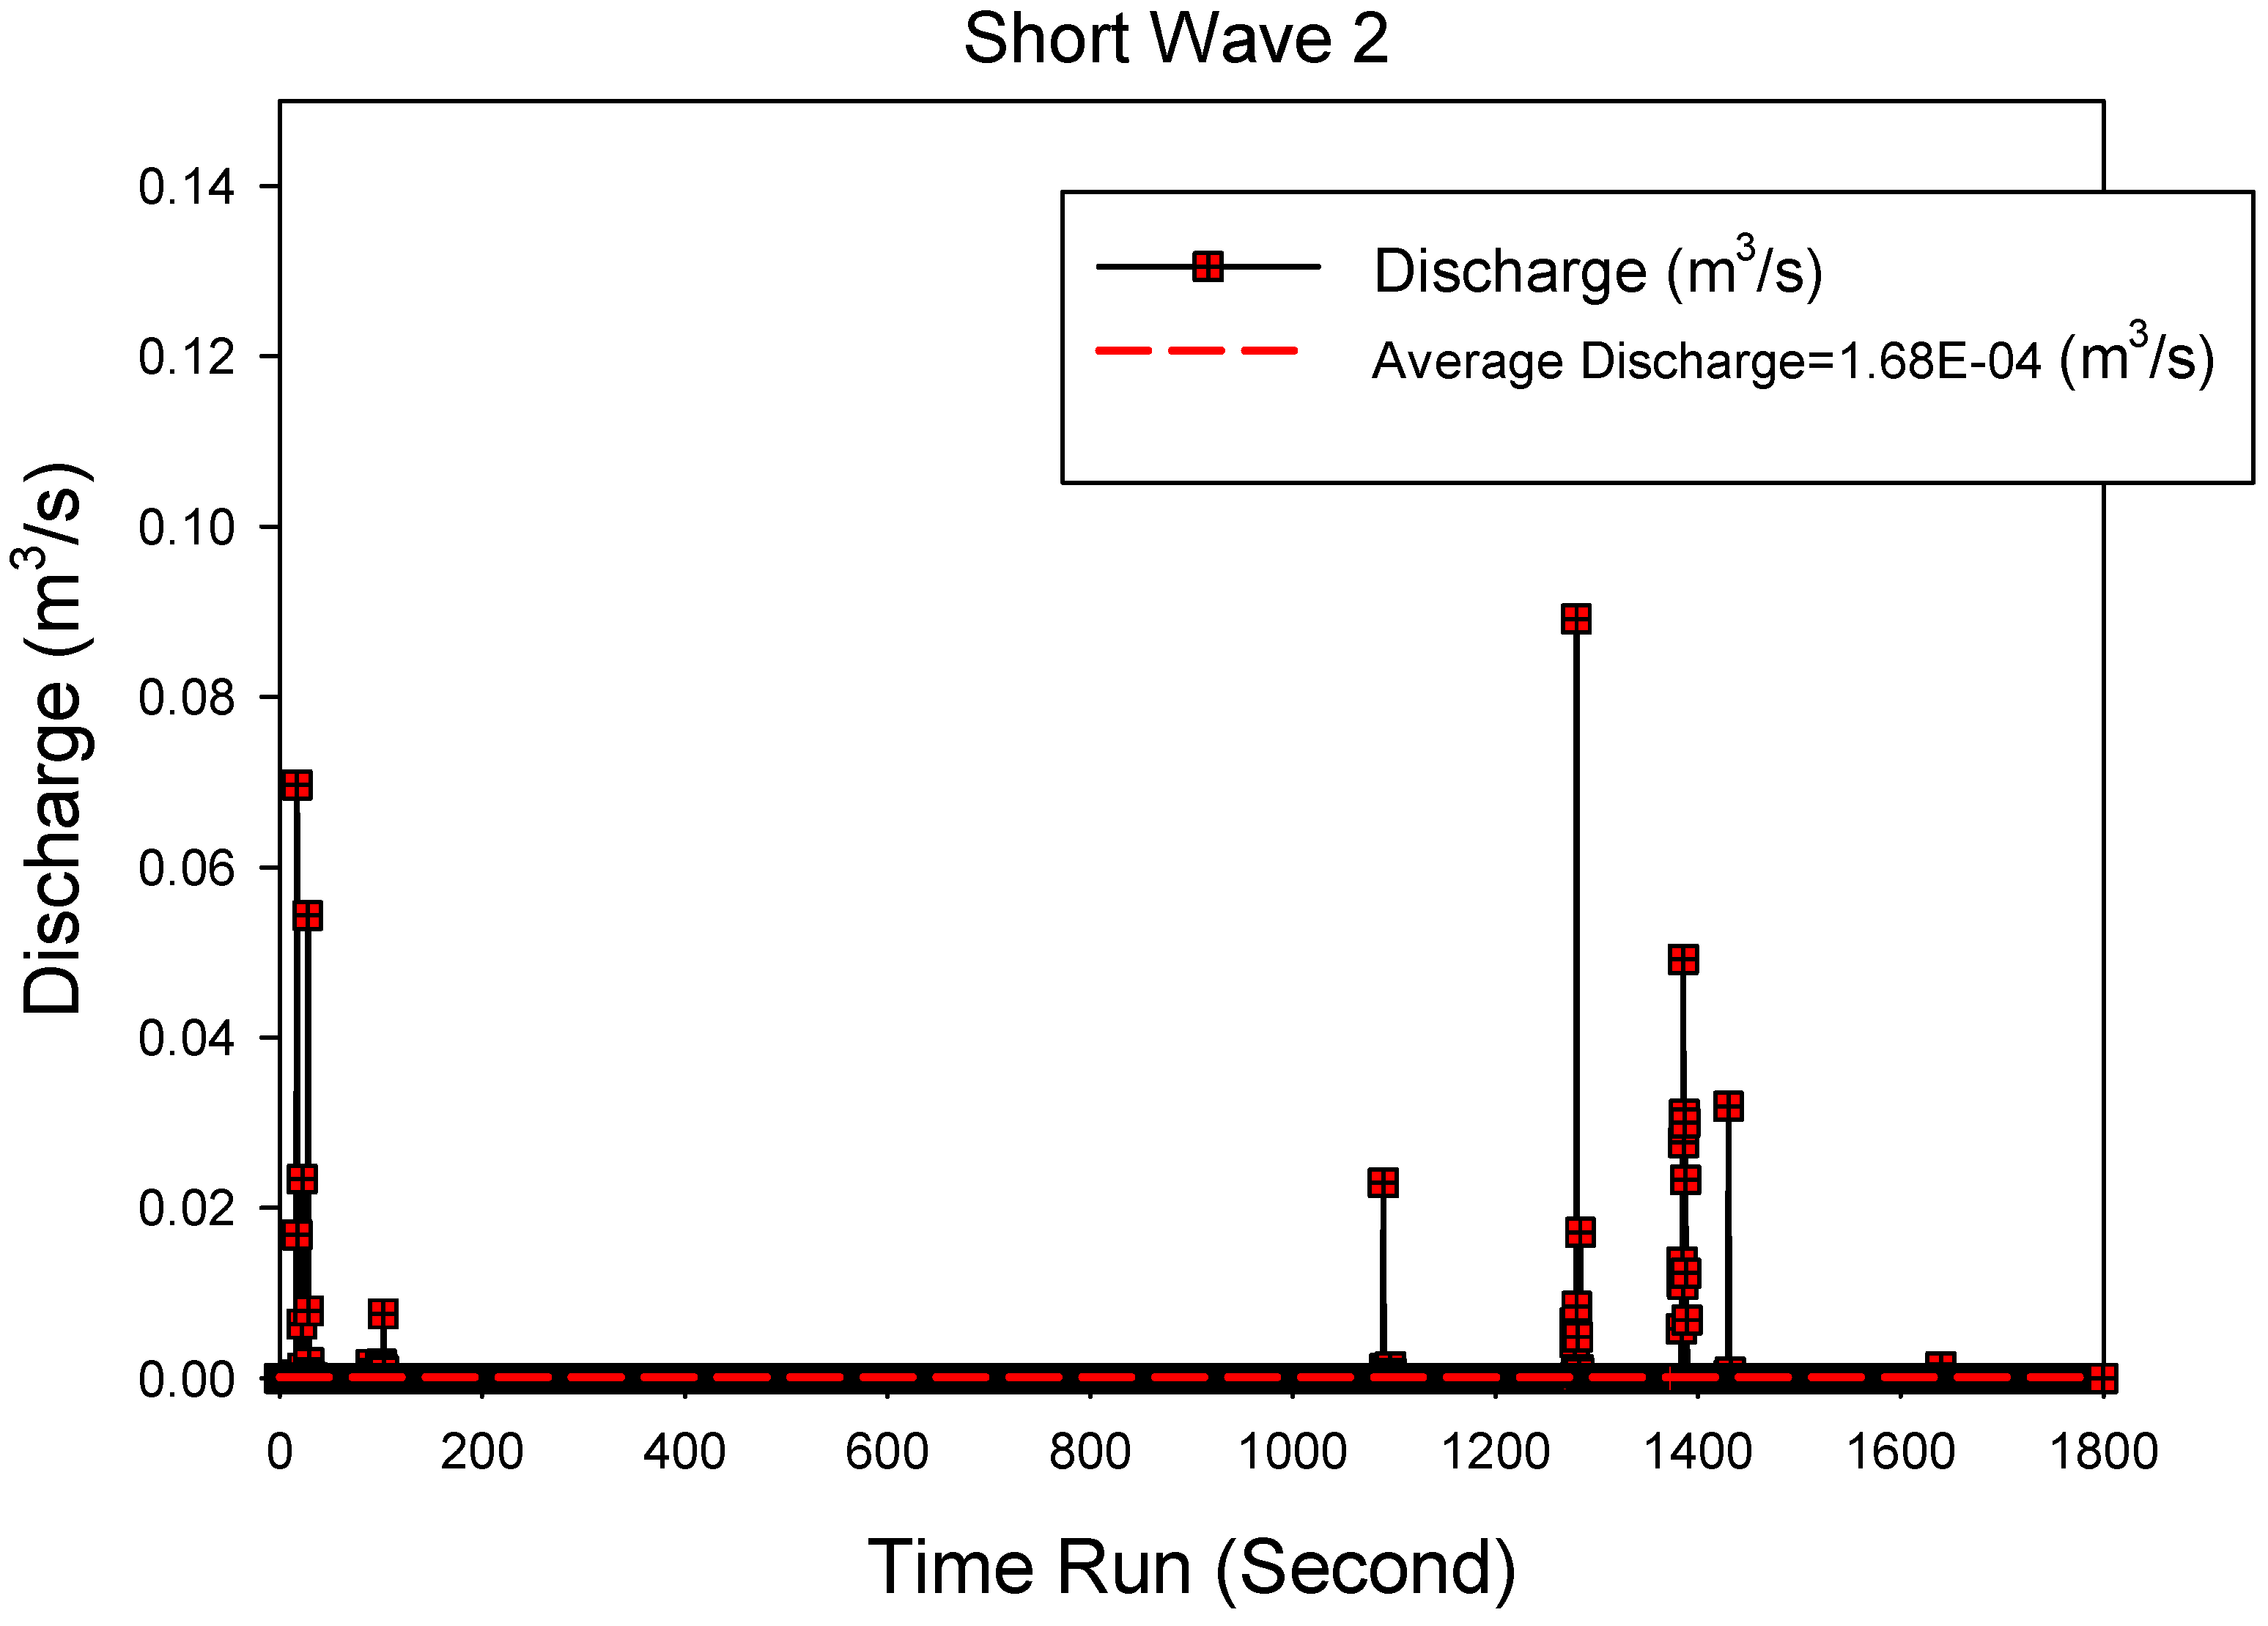
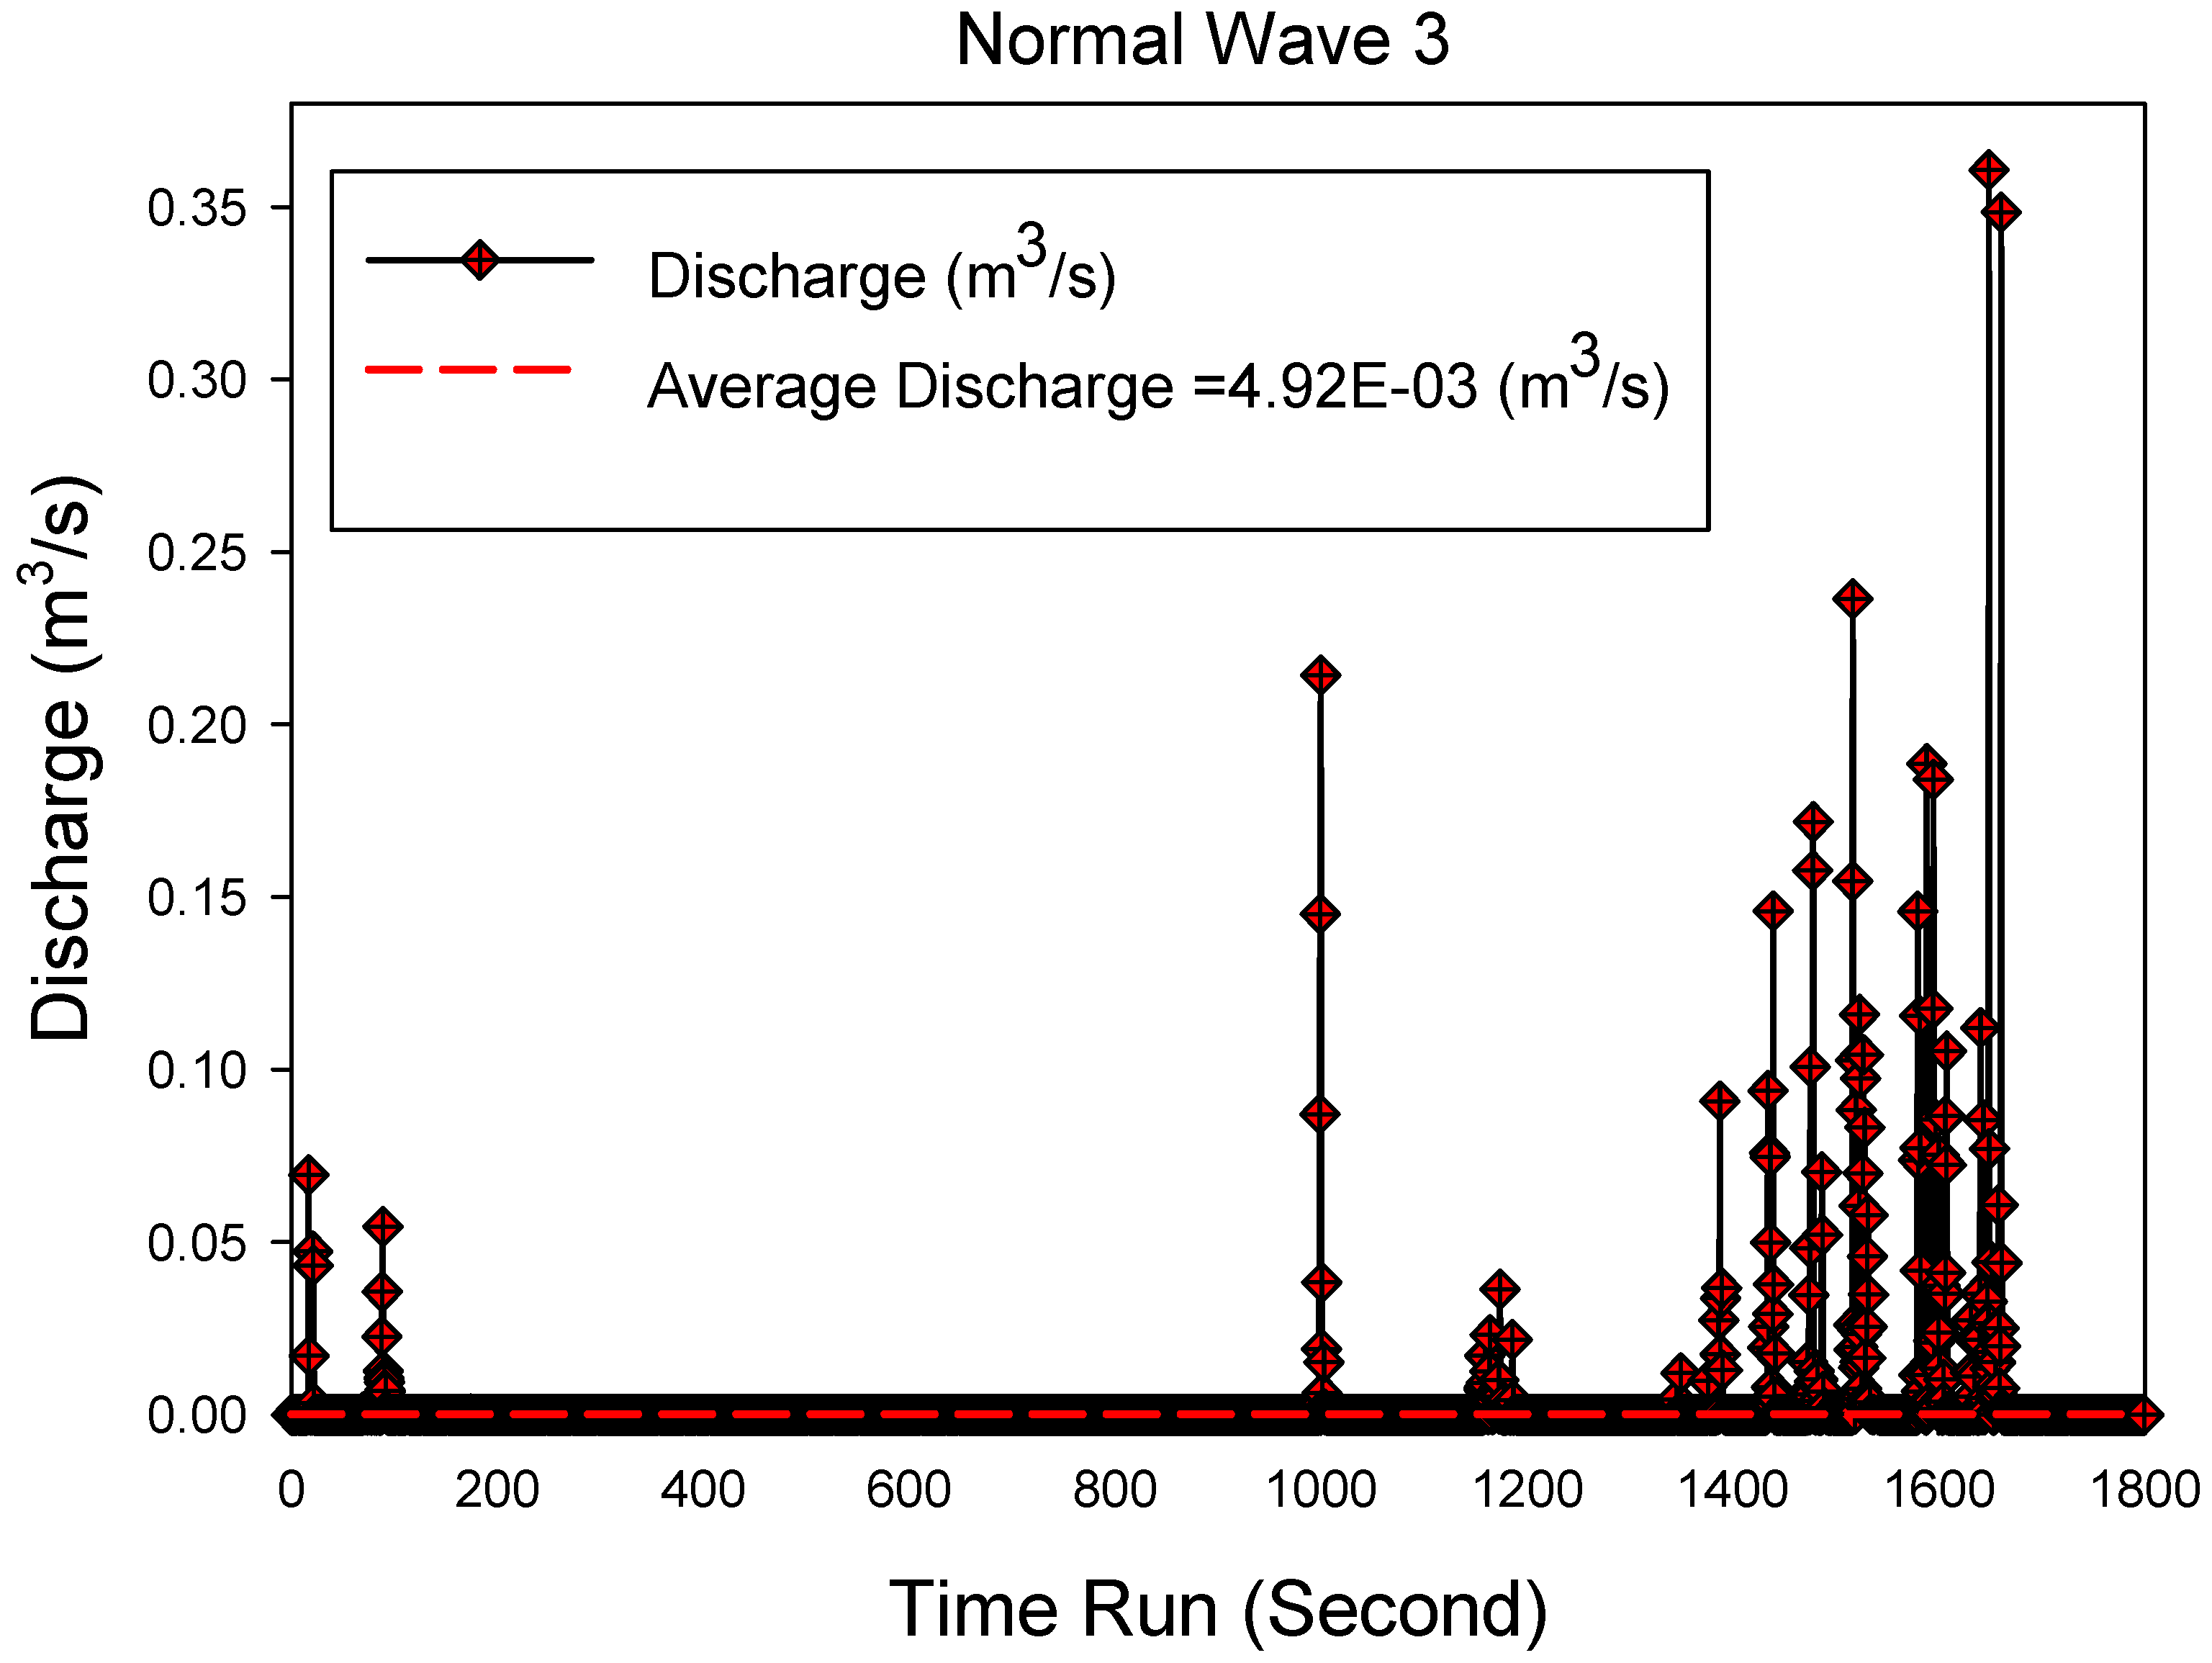
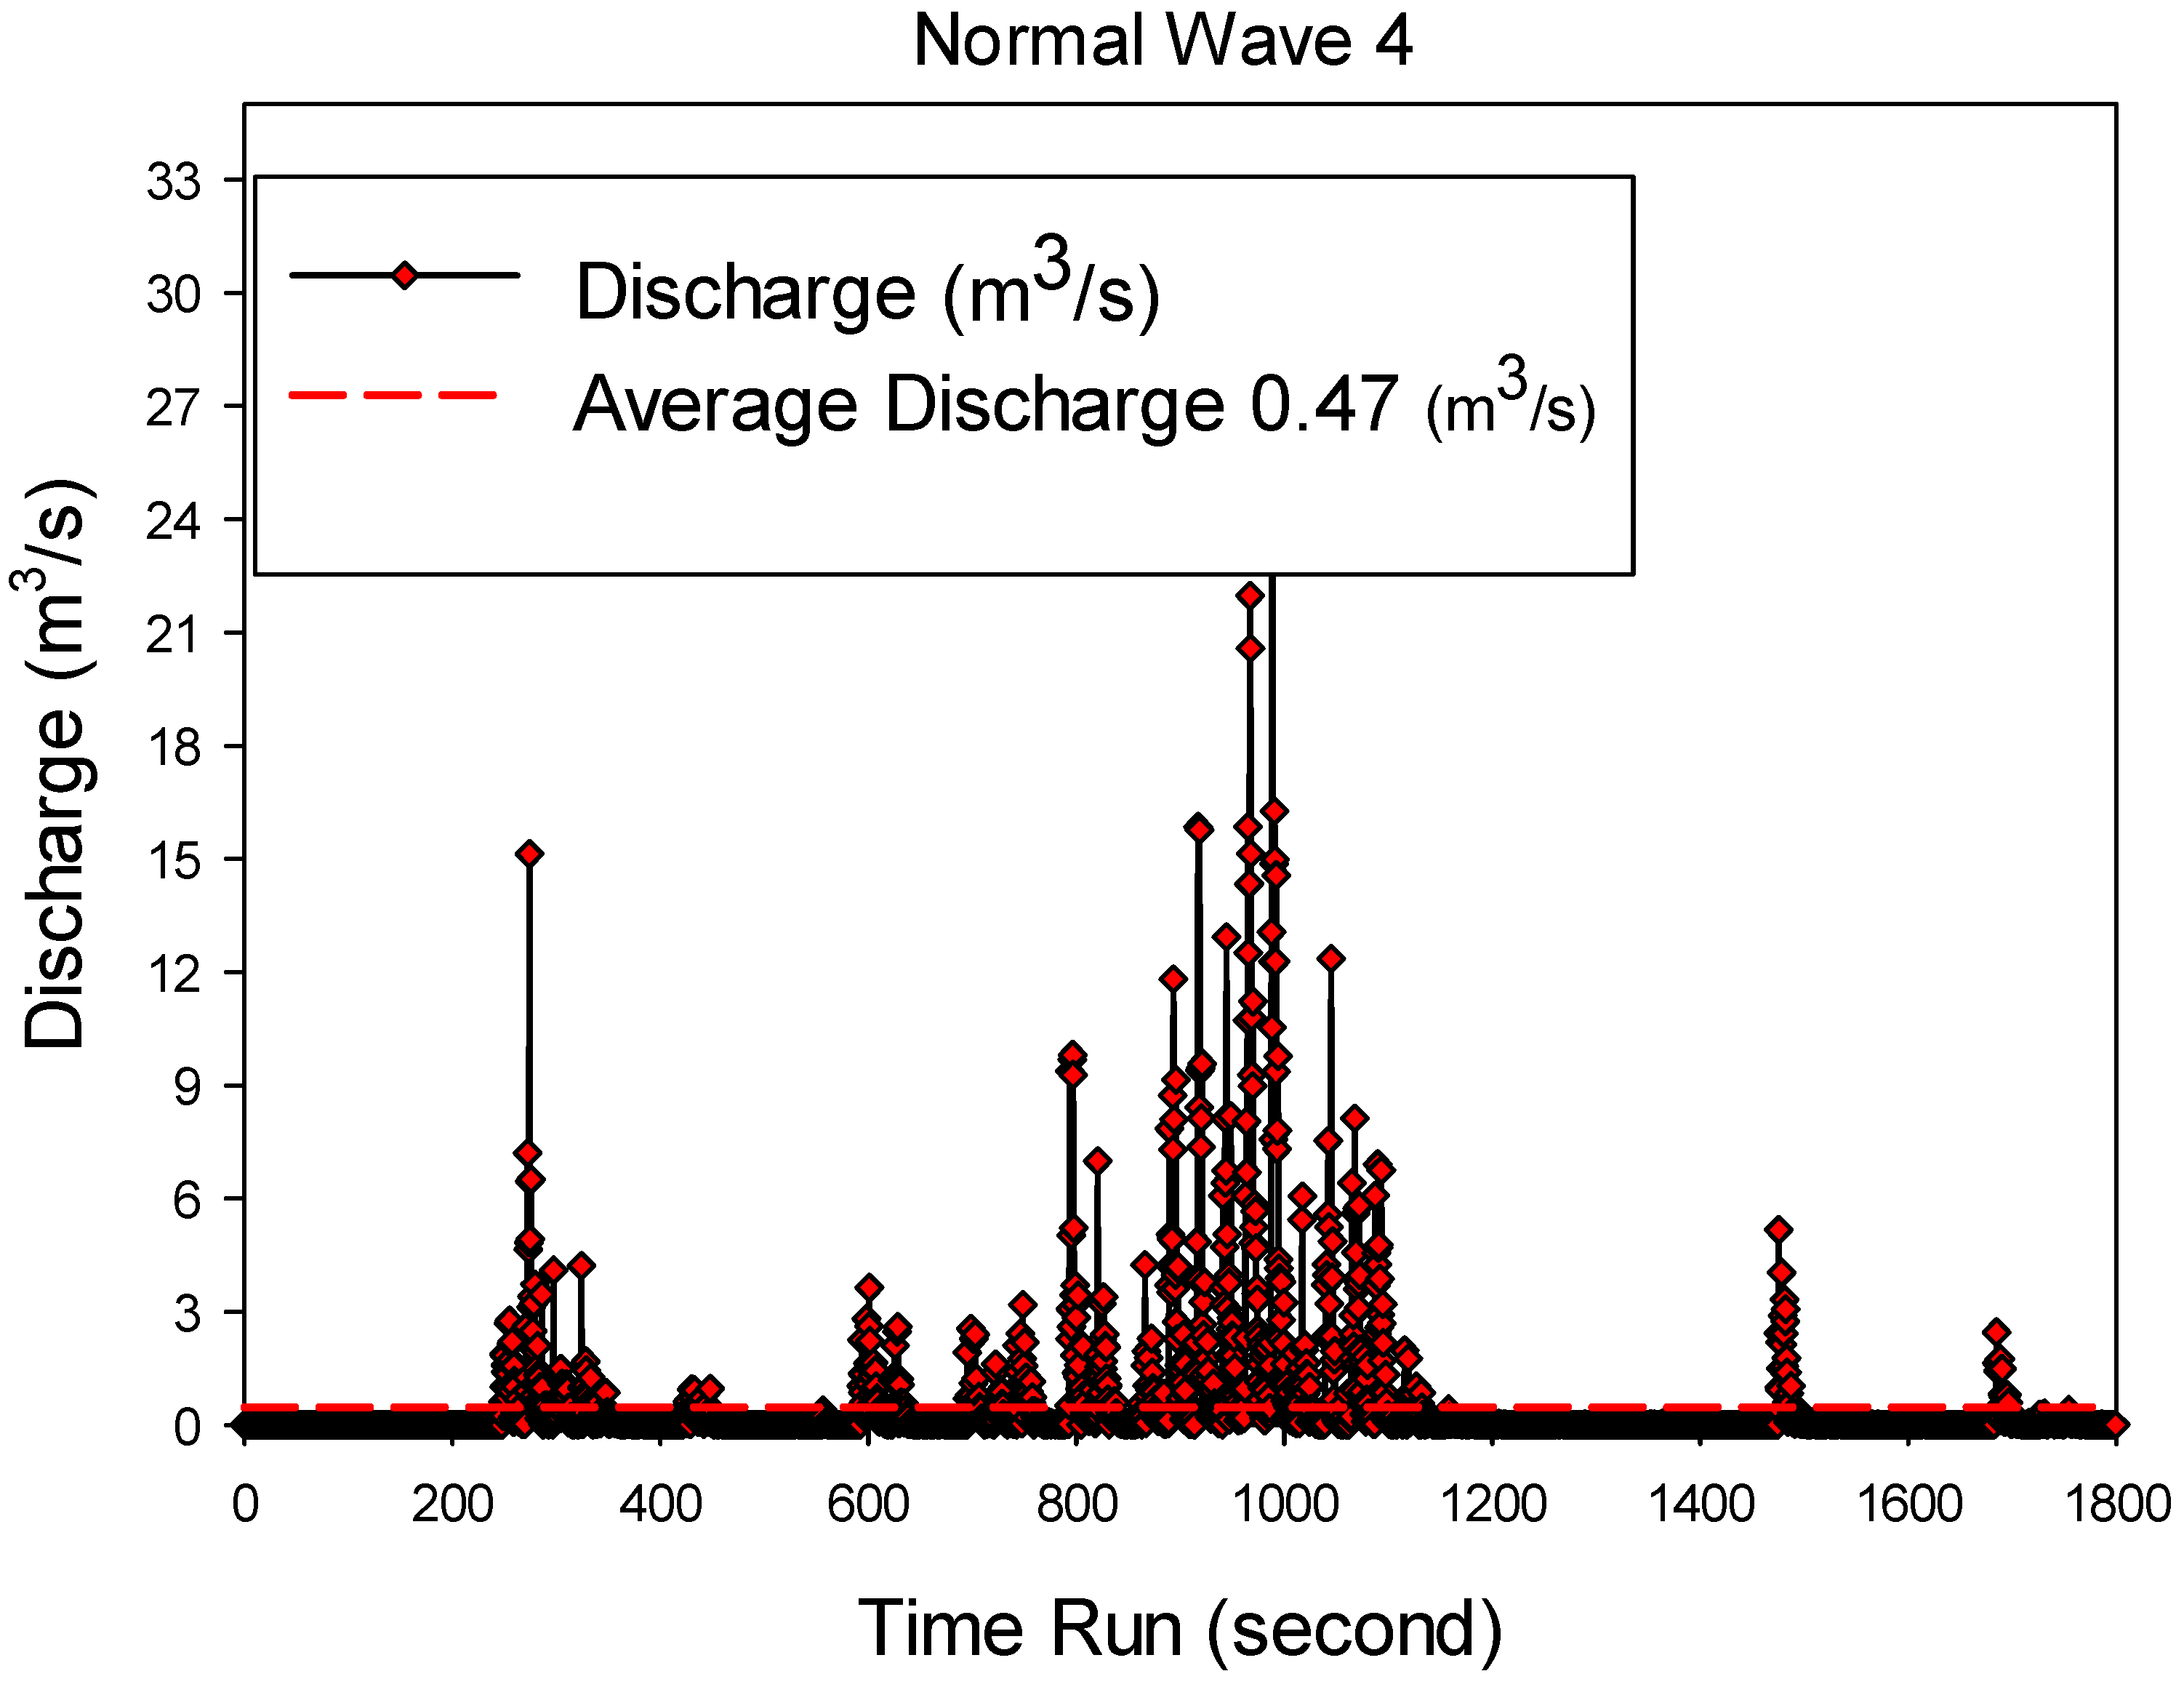
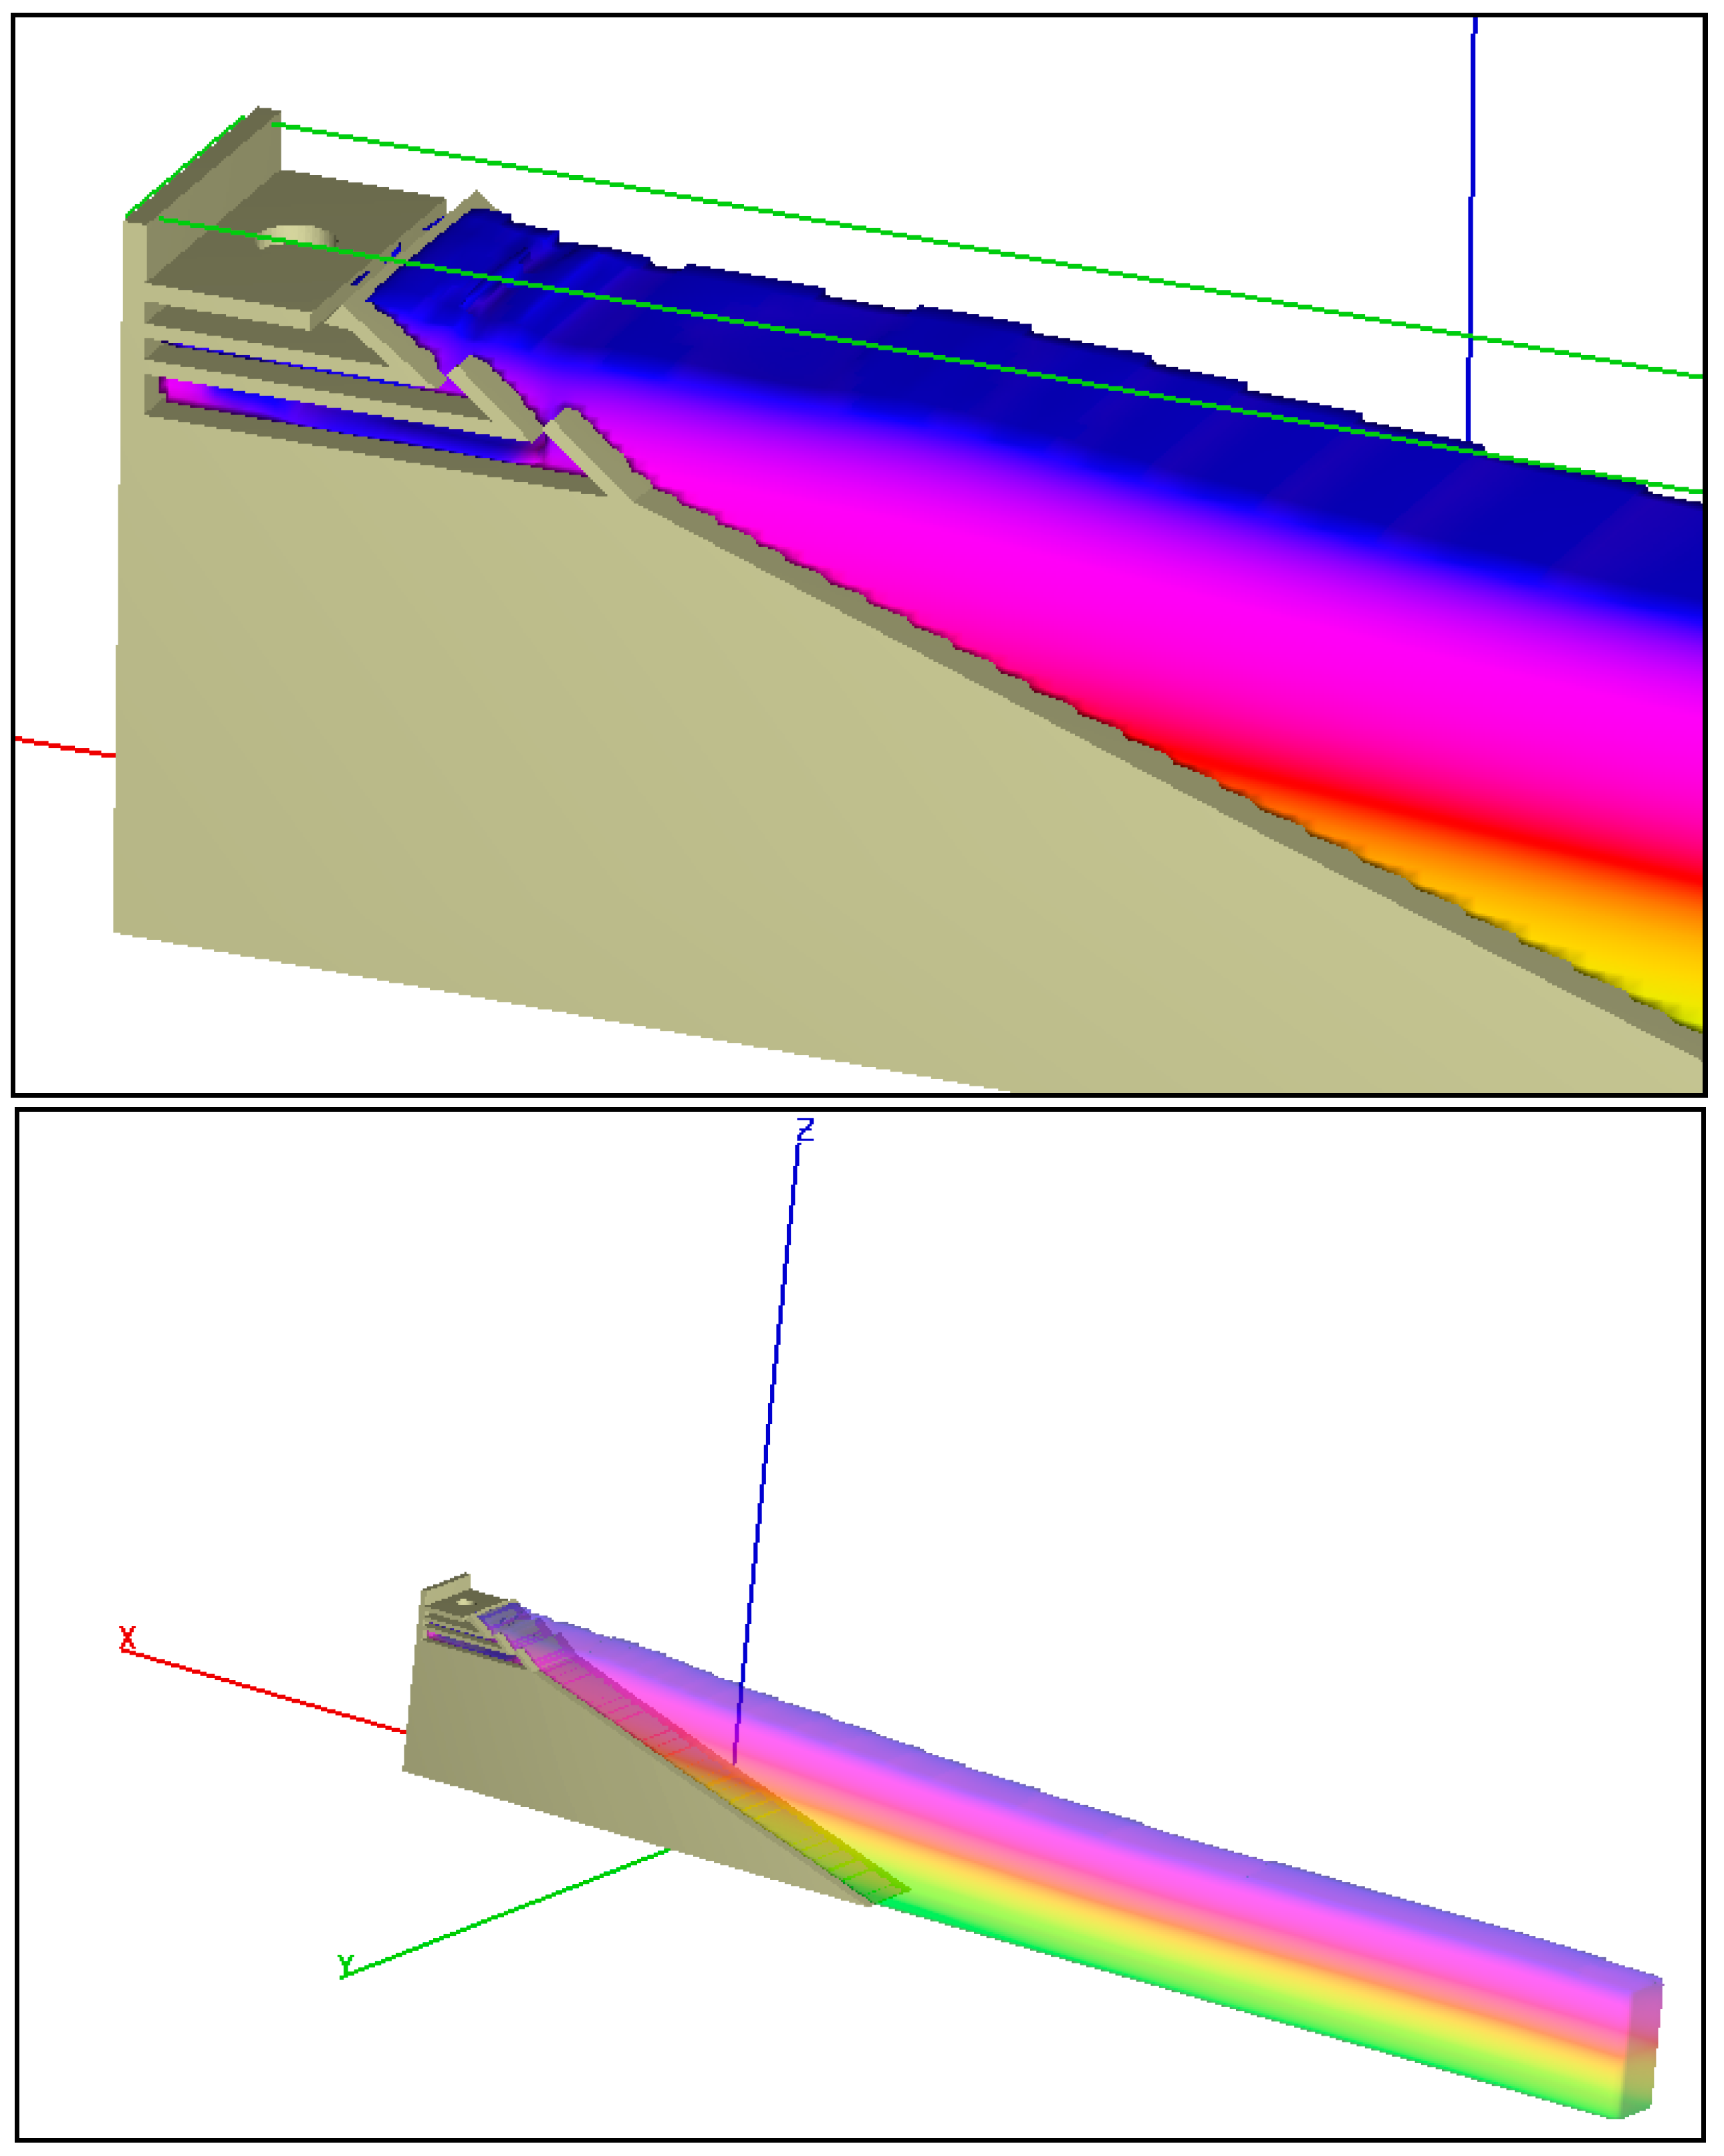
Figure 25.
Wave entry and flow in the SSG system, in the numerical model, for the wave conditions in the Persian Gulf and Oman Sea.
Figure 25.
Wave entry and flow in the SSG system, in the numerical model, for the wave conditions in the Persian Gulf and Oman Sea.

Figure 26.
Discharge versus time in the SSG system for wave spectrum 1.

Figure 27.
Discharge versus time in the SSG system for wave spectrum 2.

Figure 28.
Discharge versus time in the SSG system for wave spectrum 3.

Figure 29.
Discharge versus time in the SSG system for wave spectrum 4.

Figure 30.
Discharge versus time in the SSG system for wave spectrum 5.

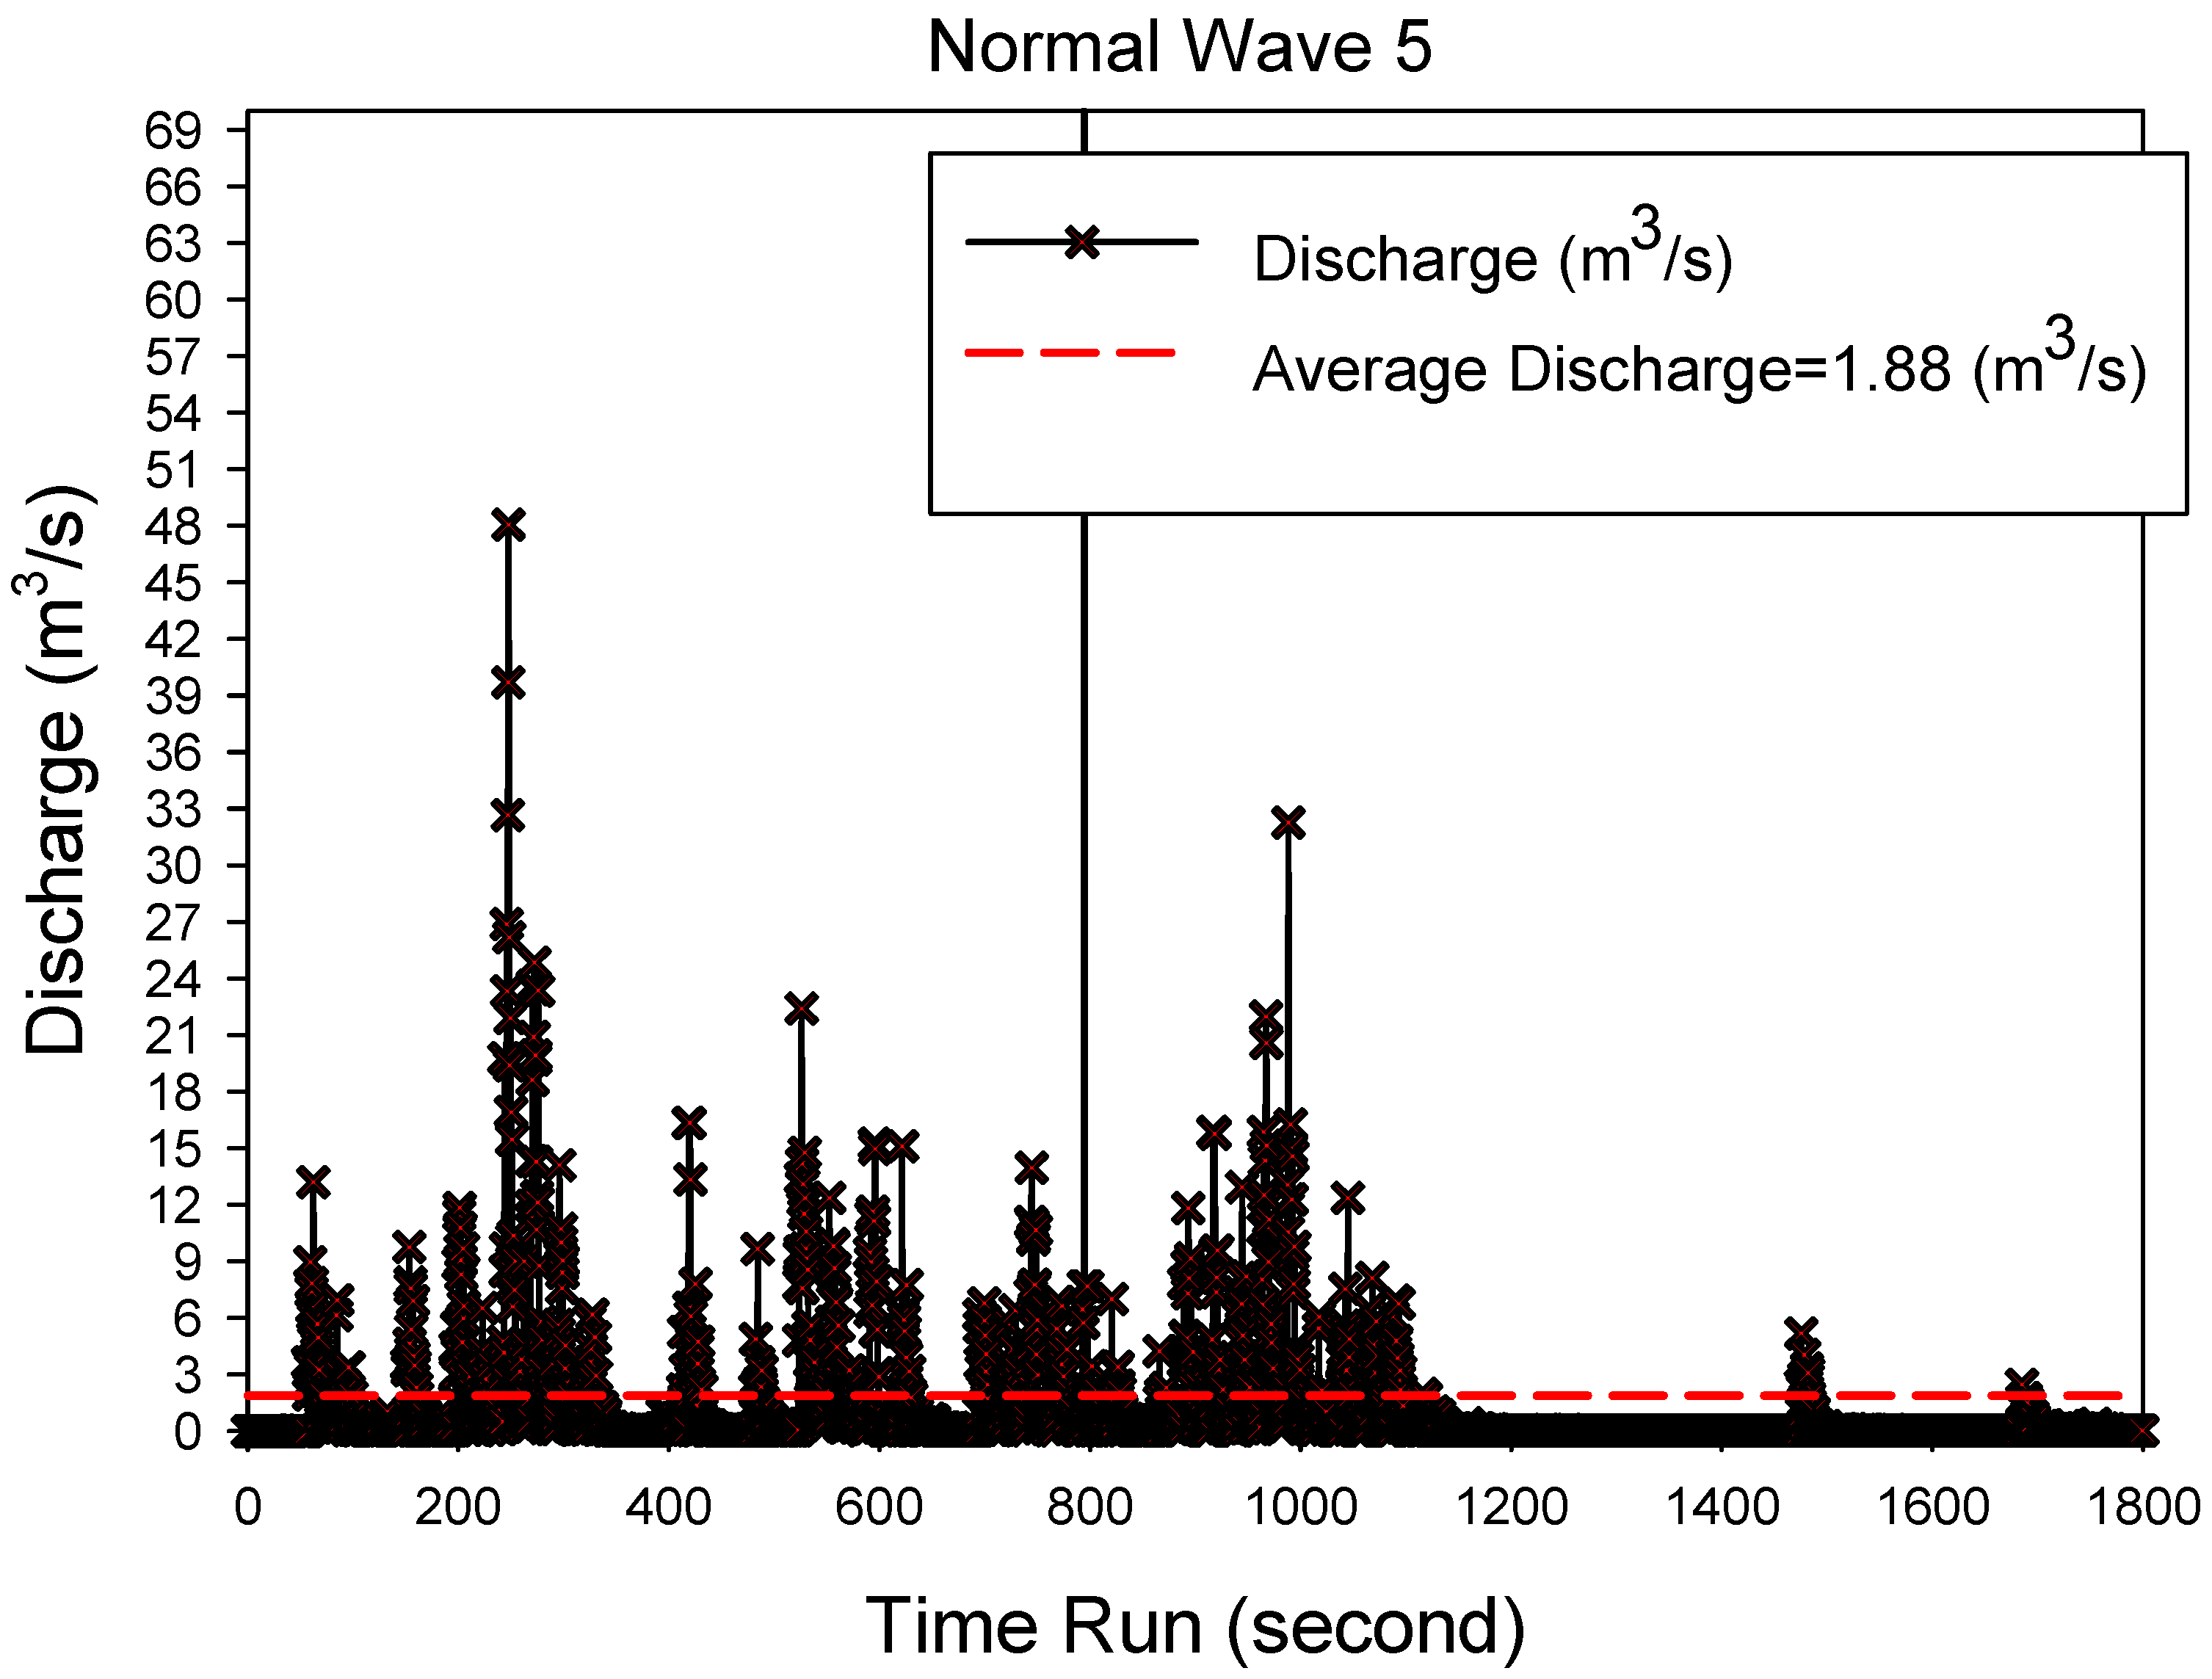
Figure 31.
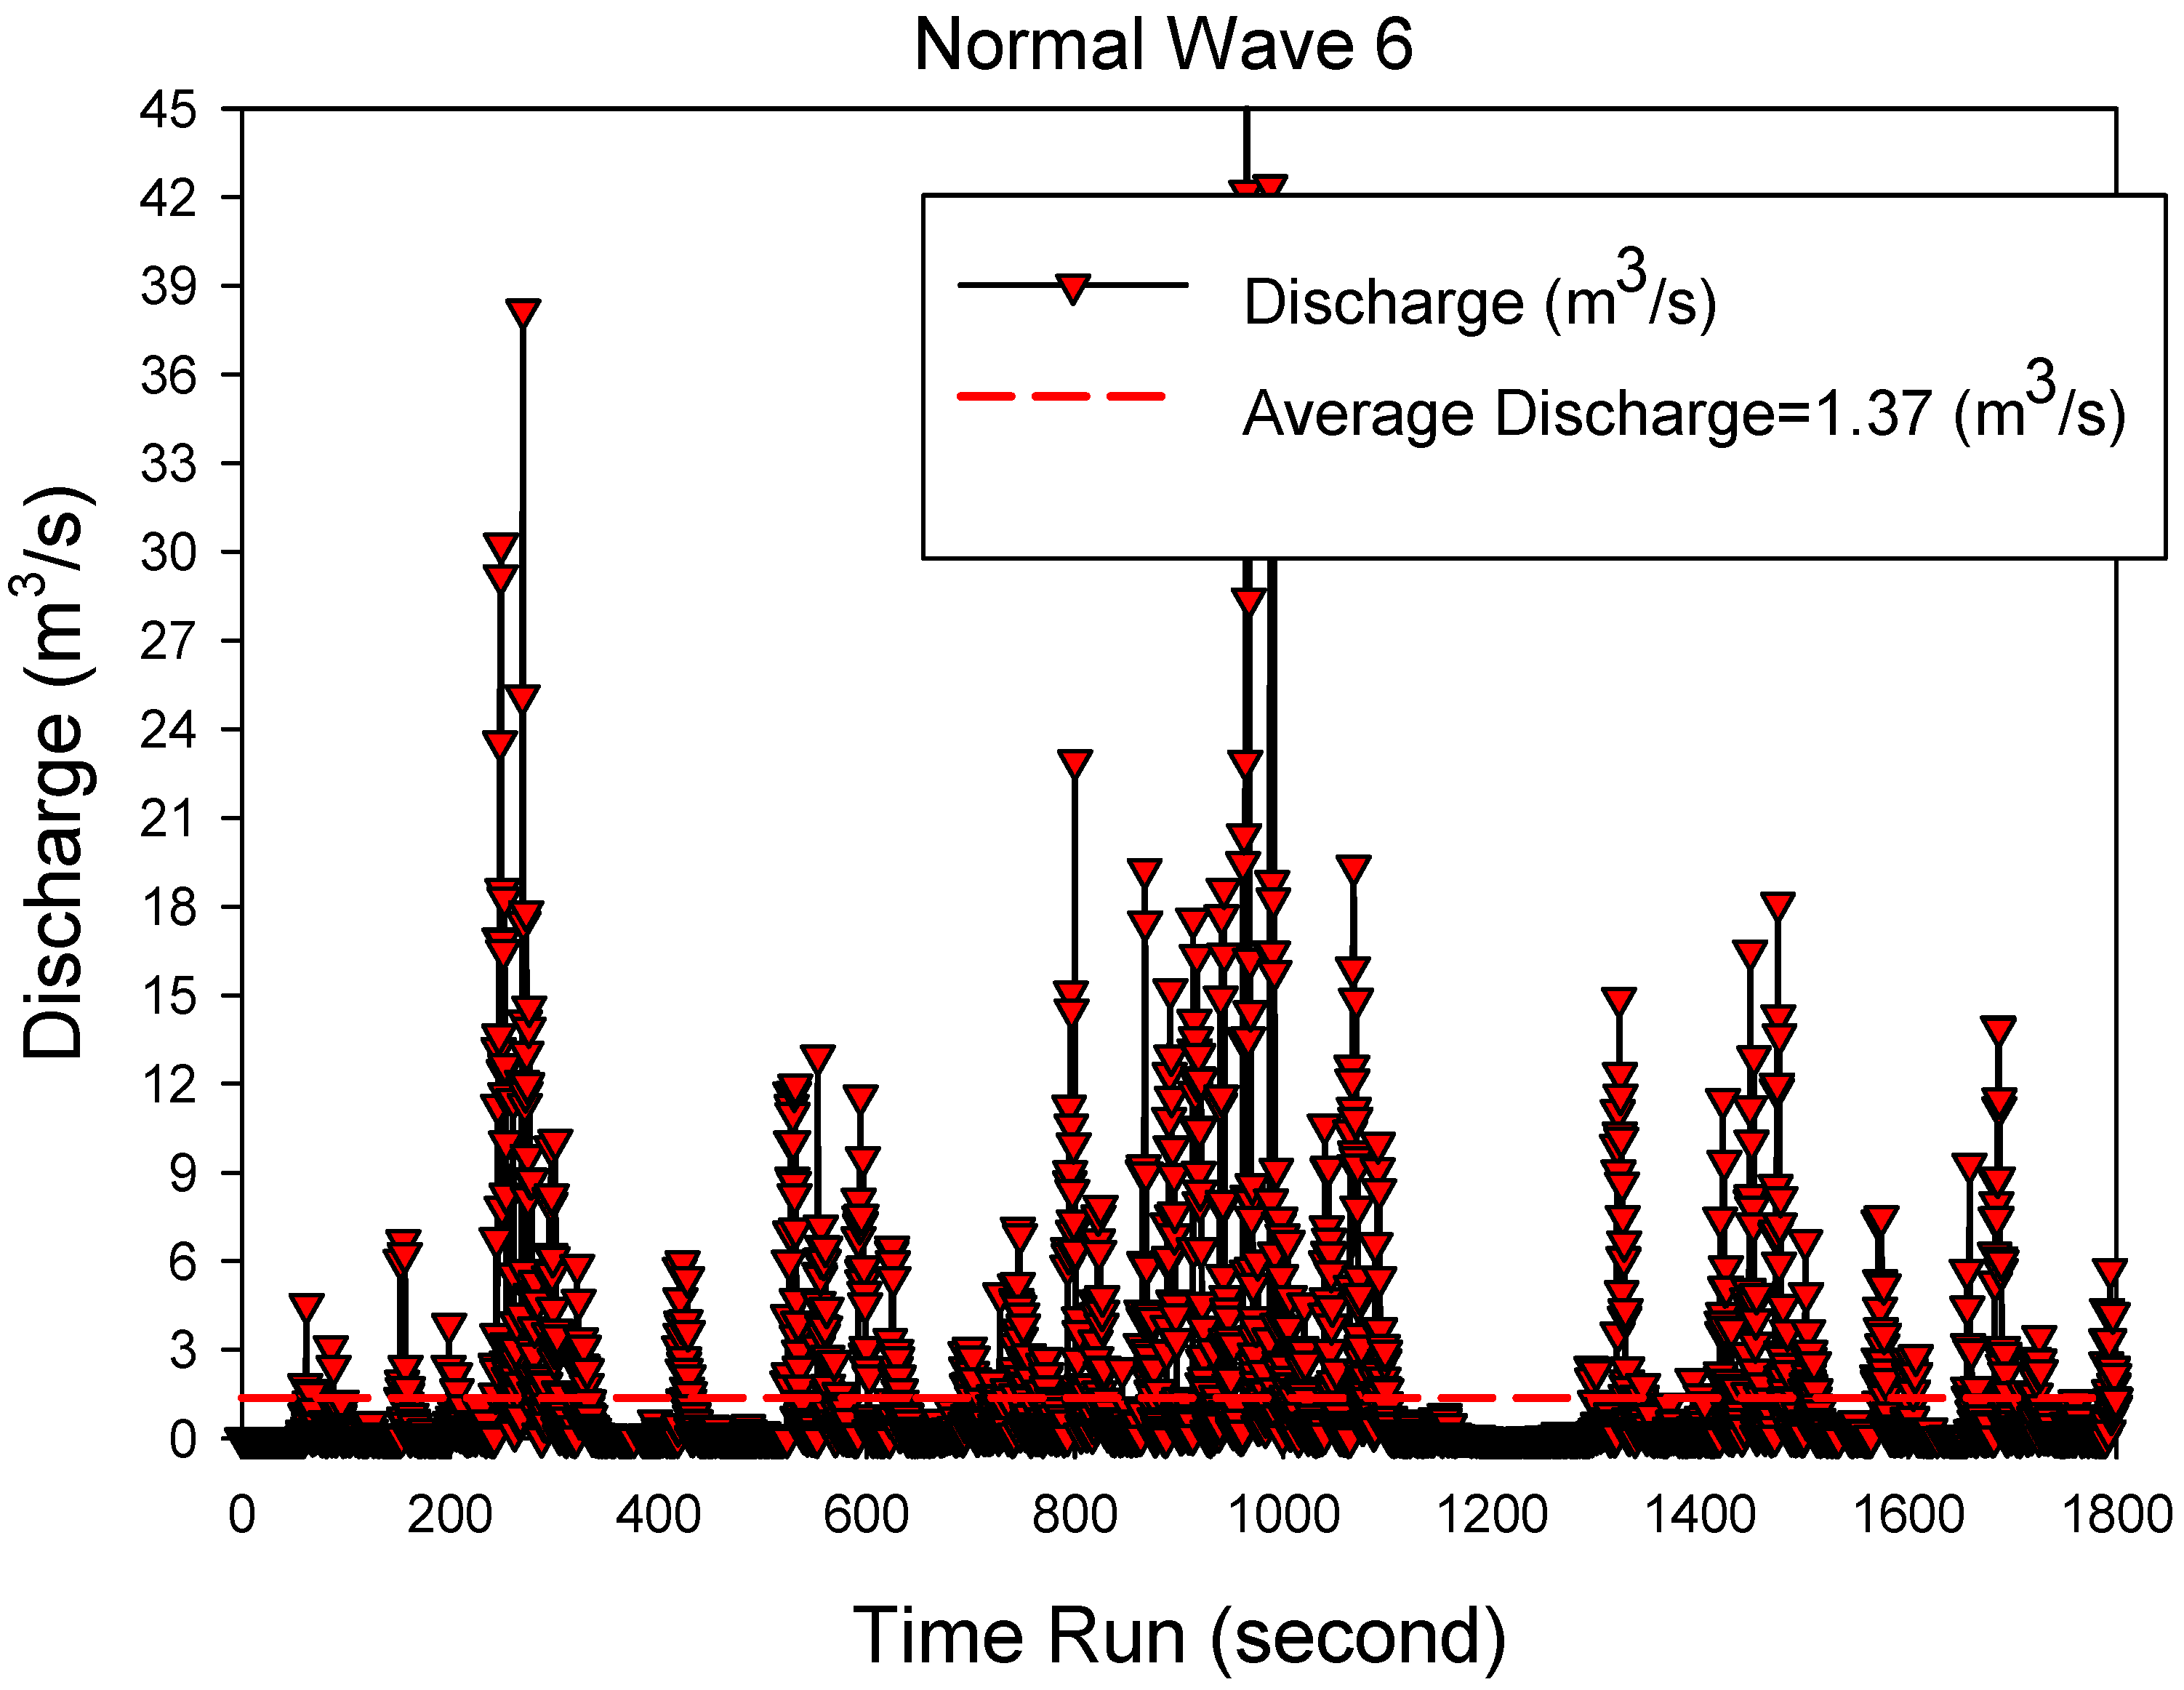
Discharge versus time in the SSG system for wave spectrum 6.

Figure 32.
The maximum overpass in the numerical model to determine the maximum hydraulic efficiency.
Figure 32.
The maximum overpass in the numerical model to determine the maximum hydraulic efficiency.


Table 1.
The types of input wave spectrum applied in the numerical model [25].
Table 1.
The types of input wave spectrum applied in the numerical model [25].
| Type | Wave Spectrum A | Wave Spectrum B | Wave Spectrum C | Wave Spectrum D |
|---|---|---|---|---|
| 1.5 | 2.5 | 3.5 | 4.5 | |
| 6.1 | 7.9 | 9.3 | 10.6 |
Table 2.
Error percentage of the simulated output discharge of the numerical model.
| Type of Spectrum | Wave Spectrum D | Wave Spectrum C | Wave Spectrum B | Wave Spectrum A |
|---|---|---|---|---|
| (m3/s/m) | 0.032 | 0.184 | 0.3664 | 0.53 |
| (m3/s/m) | 2.76 × 10⁻⁴ | 1.59 × 10⁻³ | 3.10 × 10⁻³ | 4.60 × 10⁻³ |
| (m3/s/m) | 2.64 × 10⁻⁴ | 1.76 × 10⁻³ | 3.26 × 10⁻³ | 4.29 × 10⁻³ |
| Error% | 4.50% | 10.70% | 5.10% | 6.70% |
Table 3.
The hydraulic efficiency of the numerical and laboratory models.
| Type of Spectrum | A | B | C | D |
|---|---|---|---|---|
| , realized (kW/m) | 6.2 | 17.1 | 31.2 | 50.9 |
| , Exp (kW/m) | 0.79 | 5.14 | 11.13 | 17.07 |
| , Flow-3D (kW/m) | 0.83 | 5.68 | 12.92 | 17.02 |
| Exp | 0.127 | 0.301 | 0.356 | 0.336 |
| Flow-3D | 0.133 | 0.33 | 0.41 | 0.334 |
| Error | 4.70% | 9.60% | 13.80% | 6% |
Table 4.
Wave conditions in the coastal stations of the Persian Gulf and Oman Sea.
| Type | Short Wave (SW) | Normal Wave (NW) | Large Wave (LW) | |||
|---|---|---|---|---|---|---|
| Fp | Hs | Fp | Hs | Fp | Hs | |
| Wave conditions in the Persian Gulf coast stations in Iran | 1.84 | 0.069 | 3.05 | 0.37 | 6.42 | 2.31 |
| 1 | 3 | 5 | ||||
| Wave conditions in the Oman Sea coast station in Iran | 3.63 | 0.2 | 5.6 | 1.05 | 6.14 | 1.84 |
| 2 | 4 | 6 | ||||
Table 5.
Hydraulic nominal efficiency model of the SSG wave-energy device, for the wave conditions of the Persian Gulf and Oman Sea.
Table 5.
Hydraulic nominal efficiency model of the SSG wave-energy device, for the wave conditions of the Persian Gulf and Oman Sea.
| Type of Spectrum | 1 | 2 | 3 | 4 | 5 | 6 |
|---|---|---|---|---|---|---|
| 1.84 | 3.63 | 3.05 | 5.60 | 6.42 | 6.14 | |
| 0.07 | 0.20 | 0.37 | 1.05 | 2.31 | 1.84 | |
| 0.00007 | 0.00017 | 0.00493 | 0.47000 | 1.88000 | 1.37000 | |
| 0.00001 | 0.00002 | 0.00066 | 0.06267 | 0.25067 | 0.18267 | |
| 0.00374 | 0.06198 | 0.17822 | 2.63525 | 14.62222 | 8.87275 | |
| 0.00021 | 0.00051 | 0.01487 | 2.14244 | 8.56975 | 6.24498 | |
| 0.057 | 0.008 | 0.083 | 0.813 | 0.586 | 0.704 |
Table 6.
Hydraulic nominal efficiency of the SSG wave-energy device in storm surge wave conditions.
| Type of Spectrum | 1 | 2 | 3 | 4 | 5 | 6 | Storm Surge |
|---|---|---|---|---|---|---|---|
| 1.84 | 3.63 | 3.05 | 5.60 | 6.42 | 6.14 | 5.60 | |
| 0.07 | 0.20 | 0.37 | 1.05 | 2.31 | 1.84 | 2.10 | |
| 0.00007 | 0.00017 | 0.00493 | 0.47000 | 1.88000 | 1.37000 | 2.25 | |
| 0.00001 | 0.00002 | 0.00066 | 0.06267 | 0.25067 | 0.18267 | 0.30 | |
| 0.00374 | 0.06198 | 0.17822 | 2.63525 | 14.62222 | 8.87275 | 10.54 | |
| 0.00021 | 0.00051 | 0.01487 | 2.14244 | 8.56975 | 6.24498 | 10.26 | |
| 0.057 | 0.008 | 0.083 | 0.813 | 0.586 | 0.704 | 0.97 |
© 2018 by the authors. Licensee MDPI, Basel, Switzerland. This article is an open access article distributed under the terms and conditions of the Creative Commons Attribution (CC BY) license (http://creativecommons.org/licenses/by/4.0/).
Share and Cite
MDPI and ACS Style
Khalifehei, K.; Azizyan, G.; Gualtieri, C. Analyzing the Performance of Wave-Energy Generator Systems (SSG) for the Southern Coasts of Iran, in the Persian Gulf and Oman Sea. Energies 2018, 11, 3209. https://doi.org/10.3390/en11113209
AMA Style
Khalifehei K, Azizyan G, Gualtieri C. Analyzing the Performance of Wave-Energy Generator Systems (SSG) for the Southern Coasts of Iran, in the Persian Gulf and Oman Sea. Energies. 2018; 11(11):3209. https://doi.org/10.3390/en11113209
Chicago/Turabian StyleKhalifehei, Kamran, Gholamreza Azizyan, and Carlo Gualtieri. 2018. "Analyzing the Performance of Wave-Energy Generator Systems (SSG) for the Southern Coasts of Iran, in the Persian Gulf and Oman Sea" Energies 11, no. 11: 3209. https://doi.org/10.3390/en11113209
Note that from the first issue of 2016, this journal uses article numbers instead of page numbers. See further details here.