Environmental and Operational Performance of CO2-EOR as a CCUS Technology: A Cranfield Example with Dynamic LCA Considerations


Gulf Coast Carbon Center, Bureau of Economic Geology, Jackson School of Geosciences, The University of Texas at Austin, 10100 Burnet Rd., Austin, TX 78758, USA
*
Author to whom correspondence should be addressed.
Energies 2019, 12(3), 448; https://doi.org/10.3390/en12030448
Submission received: 7 December 2018
/
Revised: 28 January 2019
/
Accepted: 28 January 2019
/
Published: 31 January 2019
(This article belongs to the Special Issue CO2 EOR and CO2 Storage in Oil Reservoirs)
Abstract
:This study evaluates the potential of carbon dioxide-enhanced oil recovery (CO2-EOR) to reduce greenhouse gas emissions without compromising oil production goals. A novel, dynamic carbon lifecycle analysis (d-LCA) was developed and used to understand the evolution of the environmental impact (CO2 emissions) and mitigation (geologic CO2 storage) associated with an expanded carbon capture, utilization and storage (CCUS) system, from start to closure of operations. EOR operational performance was assessed through CO2 utilization rates, which relate usage of CO2 to oil production. Because field operational strategies have a significant impact on reservoir engineering parameters that affect both CO2 storage and oil production (e.g., sweep efficiency, flood conformance, fluid saturation distribution), we conducted a scenario analysis that assessed the operational and environmental performance of four common and novel CO2-EOR field development strategies. Each scenario was evaluated with and without stacked saline carbon storage, an EOR/storage combination strategy where excess CO2 from the recycling facility is injected into an underlying saline aquifer for long-term carbon storage. The dynamic interplay between operational and environmental performance formed the basis of our CCUS technology analysis. The results showed that all CO2-EOR evaluated scenarios start operating with a negative carbon footprint and, years into the project, transitioned into operating with a positive carbon footprint. The transition points were significantly different in each scenario. Water-alternating-gas (WAG) was identified as the CO2 injection strategy with the highest potential to co-optimize EOR and carbon storage goals. The results provide an understanding of the evolution of the system’s net carbon balance in all four field development strategies studied. The environmental performance can be significantly improved with stacked storage, where a negative carbon footprint can be maintained throughout the life of the operation in most of the injection scenarios modelled. This information will be useful to CO2-EOR operators seeking value in storing more CO2 through a carbon credit program (e.g., the 45Q carbon credit program in the USA). Most importantly, this study serves as confirmation that CO2-EOR can be operationally designed to both enhance oil production and reduce greenhouse gas emissions into the atmosphere.
1. Introduction
Carbon dioxide-enhanced oil recovery (CO2-EOR) is a technology most commonly applied in the third and final stage of the development of mature oil fields to enhance oil production. For this reason, it is also referred to as a type of tertiary recovery. CO2-EOR has been applied successfully in the USA since the early 1970’s. The area with the most extensive history of CO2-EOR is the Permian Basin in West Texas and eastern New Mexico where more than 50 CO2-EOR projects operate [1]. The technology targets the residual oil in depleted oil reservoirs with the injection of CO2 [2]. The oil recovery process can be immiscible or miscible, with the highest oil recovery expected in miscible displacements [3]. In a miscible process CO2 enhances oil production by mixing with the residual oil as a solvent agent at pressures above the minimum miscibility pressure (MMP), which is the minimum pressure at which miscibility is achieved [3]. The reduced viscosity and expansion of the new CO2-oil phase decreases flow resistance toward oil producing wells. The produced CO2 is separated from the produced fluids, re-injected back into the reservoir and the process is repeated in a loop. However, not all the injected CO2 is produced back to the surface, as several mechanisms such as capillarity, dissolution, and the geologic structure, trap a significant percentage (as much as 50%) of the CO2 injection stream within the reservoir [4,5]. For oil field operators, the mass of CO2 trapped in the reservoir represents a loss which needs to be replaced with purchased CO2 in order to maintain the required CO2 injection rates. In cases where anthropogenic CO2 captured from industrial facilities is used for EOR, the anthropogenic CO2 lost into the formation could be considered as a geologically stored CO2 mass, a mass that would have entered the atmosphere as a greenhouse gas had it not been captured and utilized for EOR. Because of the latter, CO2-EOR technologies that use anthropogenic CO2 are also considered carbon capture, utilization, and storage (CCUS) technologies.
However, some have questioned the validity of CO2-EOR as an alternative for greenhouse gas emission reduction, as CO2 emissions result from the energy consumption throughout the EOR operation and, more significantly, from the combustion of the incremental oil produced. To answer the question of how much carbon is emitted in CO2-EOR projects, several carbon lifecycle analyses (LCA) have been conducted and are available in the literature.
LCA is a process that assesses the environmental impact that occurs throughout a product’s lifecycle, from raw materials acquisition through production, use, final treatment, recycling, and disposal. The process is standardized in ISO 14044:2006 [6] and encompasses four distinct phases: (1) goal and scope definition, (2) inventory analysis, (3) impact assessment, and (4) interpretation. Table 1 provides a list of the most relevant CO2-EOR LCA studies to date.
Oher studies address the issue of the potential disparity between the goals of EOR and the goals of carbon storage. In fact, the subject of co-optimization has been a focus of carbon capture, utilization, and storage (CCUS) research during the last decade [14,15,16]. In most studies, co-optimization is the process of finding a balance between the goals of EOR (i.e., produce more oil/money with less purchased CO2) and the goals of carbon storage (i.e., store more purchased CO2), which seem to conflict. In our study, we expand the goals of carbon capture and storage (CCS) from just storing CO2 to reducing greenhouse gas emissions, which requires a carbon balance analysis of CO2-EOR that accounts for CO2 emissions throughout the CCUS system. The efficient displacement of reservoir fluids with CO2 is a critical process which, when optimized, provides an opportunity for simultaneously enhancing oil production and associated carbon storage. Oil field operators develop their fields so that maximum oil production is obtained within the constraints of their field-specific settings. Many challenges (economic, geologic, resource access, etc.) are site specific and thus vary at each EOR field development. These differences influence the selection of CO2 injection strategies.
Throughout the history of CO2-EOR technology applications [17], several CO2 injection strategies have been developed to overcome operational shortfalls, such as early CO2 breakthrough due to viscous fingering or gravity override, and injectivity loss, among others. Water-alternating-gas (WAG) strategies, which alternate injection of brine and CO2, were designed and implemented to improve flood conformance by reducing the mobility contrast between the displacing and displaced fluids. The goal of such strategies is to avoid high residual oil saturations in un-swept or poorly swept rock volumes. However, loss of injectivity occurs to some degree during WAG in most floods [18,19], particularly in those with reservoir permeabilities below 10 millidarcies. To reduce injectivity loss, operators started adjusting WAG ratios and drilling new wells, all of which led to a significant variety of CO2 injection configurations that are EOR site-specific.
EOR operational considerations, such as the ones described, greatly affect associated geologic carbon storage volumes, which in turn affect the net carbon balance of the EOR operation. In fact, carbon storage is the only parameter in the net carbon balance equation that counters the environmental impact (CO2 emissions) of CCUS systems. Given the importance of this volume in the context of the CCUS carbon lifecycle, we focus on the understanding of reservoir responses to different field development schemes for EOR and how those schemes affect the energy demanding components of CCUS systems. To this end we conducted a scenario analysis that captured the range of reservoir responses to different CO2 injection strategies and analyzed the interplay between the subsurface performance and the energy needed to run the operation in the different scenarios.
2. Methods
We conducted a scenario analysis that captured the range of reservoir responses to different CO2 injection strategies. Reservoir responses are given in terms of CO2 utilization rates (our operational performance indicator) and carbon storage (our environmental performance indicator). Utilization rates refer to the volume of CO2 (in thousand standard cubic feet (Mscf)) that needs to be injected into the reservoir in order to produce one barrel of oil. We then coupled the subsurface performance with the energy needed to run the operation in the different scenarios. To this end we created two models: (1) a subsurface model that predicts reservoir responses in the form of incremental oil recovery, CO2 storage mass, and CO2 utilization rates; and (2) a surface model that estimates greenhouse gas emissions associated with operating a defined CCUS system.
With the subsurface model, we ran numerical reservoir simulations for four different novel and standard CO2 injection scenarios. The simulations were designed to evaluate the variability of CO2 utilization ratios and how they affect energy intensive system components. In addition, we included in all four scenarios a case where excess recycle CO2 was injected into an underlying saline aquifer, which significantly increases carbon storage volumes. The latter provides improved understanding of how EOR and saline storage can be co-managed as a CCUS project matures.
With the surface model, we estimated the indirect carbon emissions associated with the electricity required to operate a CCUS system with defined boundaries, as well as the direct carbon emissions within the boundary. An important distinction between emission types is that direct emissions are those emitted directly into the atmosphere within the system boundary, whereas indirect emissions are those emitted into the atmosphere outside the boundary from the energy consumption within the boundary.
2.1. Subsurface Modeling for EOR Operational Performance
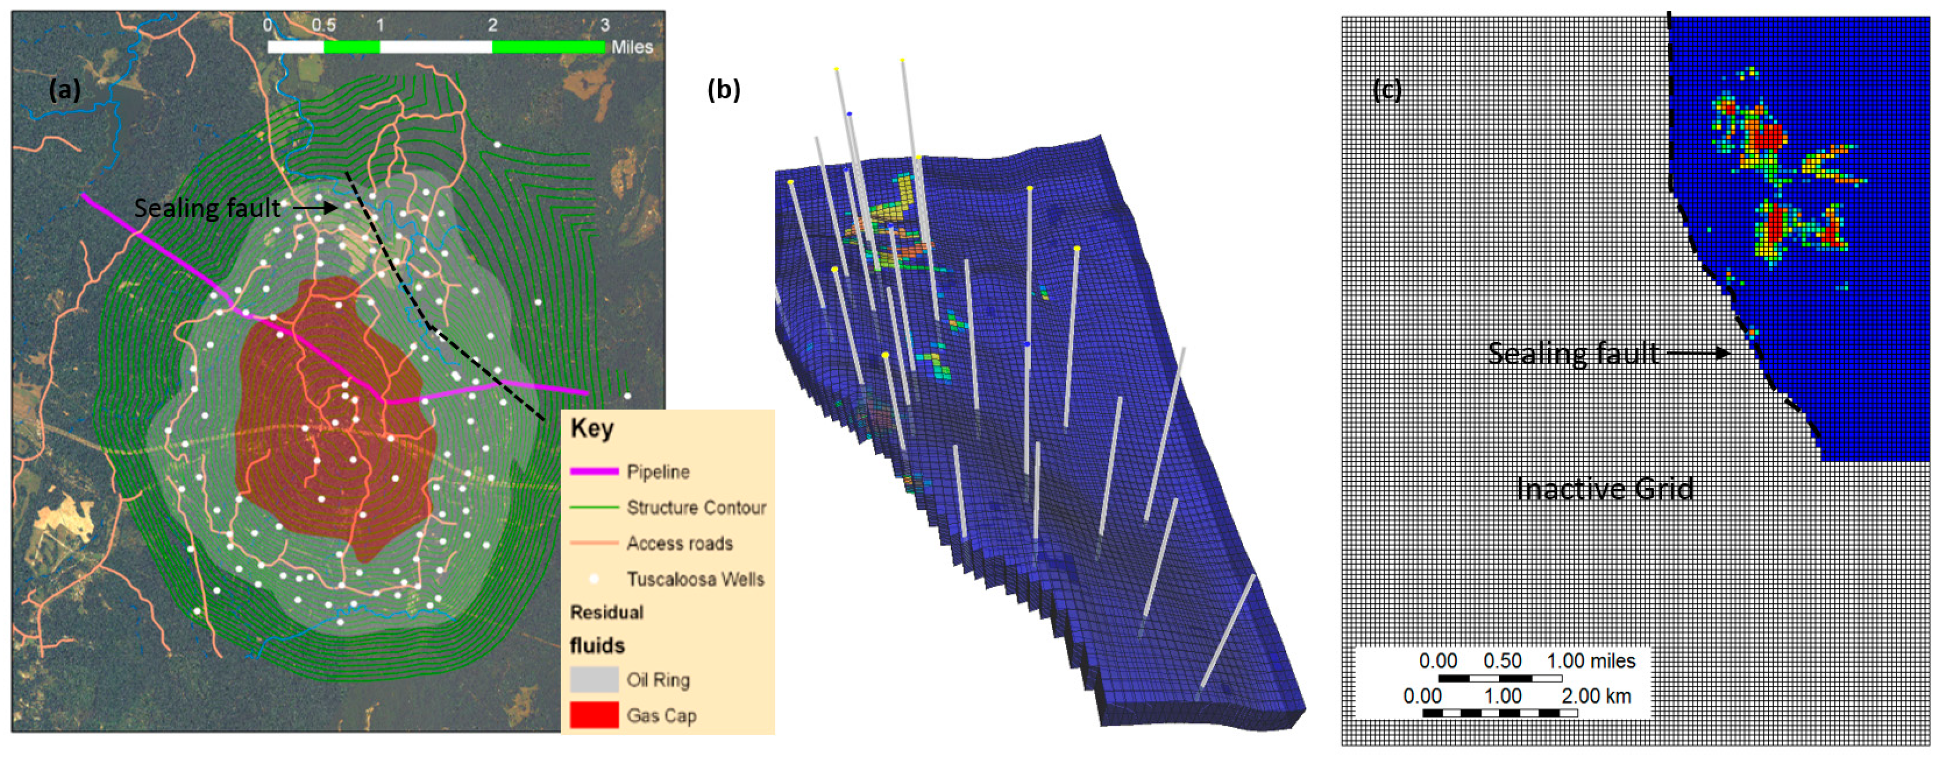
For our scenario evaluation, we performed compositional numerical reservoir simulation on a pre-existing static model of Cranfield, a 3000 m. deep clastic reservoir in southwestern Mississippi, USA. The CO2 injection zone in the Lower Tuscaloosa Formation is a four-way anticline with a diameter of 6.4 km (4 mi). The domal structure was created by a deep-seated inactive salt dome. In the Tuscaloosa interval, the formation dip angle ranges from 1° to 3°, with a structural closure of ∼75 m and an average thickness of ∼25 m. A NW-SE-trending crestal graben drops the apex of the dome, and one of the bounding normal faults offsets the Tuscaloosa reservoir in the area of study with a throw equal to the interval thickness. Differing water oil contacts (WOC) on either side of the fault at the time of field discovery, non-propagation of pressure during CO2 injection, and well-breakout observations suggest that the normal fault is non-transmissive in the horizontal direction, and that that the current maximum horizontal stress tends to close the fault.
The static model has been described in detail by Hosseini et al. [20]. Compositional numerical simulation was preferred over a black oil model to more accurately simulate the solvent CO2-EOR process, where CO2 is expected to dissolve into the oil phase to enhance oil production. Because compositional numerical simulation requires a large computational load, we used the north-eastern section of the static model (Figure 1), which is separated from the rest of the reservoir by the non-transmissive fault. We assumed that the modeled section (sector model), composed of 82,559 grid blocks, has minimal interaction with the producing zones in the south and west sides of Cranfield.
We then used a commercial package (CMG-GEM) to run the numerical simulations, and matched historic production from 1944 to 1964, as well as a shut-in period from 1964 to 2008 and the first four years of the current EOR tertiary stage. Pressure-volume-temperature (PVT) data were tuned and the solubility of CO2 into the aqueous phase (oil and brine) was included using Henry’s Law. A detailed description of the numerical reservoir simulation can be found in Hosseini et al. [21].
The sector model included 11 injection wells and 10 production wells (Figure 1b). Injection rates were constrained based on known injection volumes available from the observed CO2 injection period at each well location. A period of 25 years of injection was simulated for each of the CO2 injection scenarios.
For several technical and economic reasons, water-alternating-gas (WAG) has been the EOR development strategy of choice in the Permian Basin, where the history of CO2-EOR is richer. However, continued CO2 injection (CGI), was initially selected as the injection strategy to develop the much more porous and permeable clastic depositional systems of the onshore Gulf Coast. The use of CGI in this younger EOR region, resulted in CO2 injection volumes significantly larger (up to 6 times) than those of the Permian Basin. In the case of Cranfield, a Gulf Coast oil field, the operator selected CGI because it also operated a nearby natural CO2 accumulation, which made CO2 more readily available to the EOR site. Such decisions illustrate how the selection of field development strategies are site specific. Even though the CO2 used in Cranfield is from a natural source, we assumed the use of anthropogenic CO2 in all our scenarios.
Based on the history of CO2-EOR in the USA, we selected the four following CO2 injection scenarios:
- Continuous gas injection (CGI), where CO2 is injected continuously into the oil-bearing formation (this is the field development strategy at Cranfield);
- WAG, where CO2 and brine are injected in an alternating fashion to improve flood conformance and economics. We selected a WAG ratio of 1:1, 6 months of CO2 injection alternated with 6 months of brine injection;
- Water curtain injection (WCI), a continuous gas injection with the addition of peripheral water injection (commonly along the oil-water contact) in order to create a pressure barrier/curtain that contains the CO2 within the desired rock volume; and,
- Hybrid WAG + WCI.
2.2. Surface Modeling for CCUS Environmental Performance
Our environmental performance parameter is associated with the net volume of CO2 emission reduction, which is the difference (or balance) between the CO2 permanently stored in the oil reservoir and the greenhouse gas (GHG) penalty imposed by direct and indirect CO2 emissions in relation to a pre-established CCUS system boundary. In our lifecycle approach, the environmental impact is strictly related to these direct and indirect CO2 emissions. This impact is countered by the geologic CO2 storage that occurs through the process of EOR, which represents the only means for CO2 emission reduction.
Estimates of energy consumption are required for the carbon emissions accounting. This accounting is performed with a novel, dynamic LCA (d-LCA) approach with the goal of estimating the carbon balance evolution of the CCUS system as it operates. Unlike the LCA studies in Table 1, which estimate a single value of carbon emissions (usually at the end of the studied projects) our d-LCA produces monthly estimates of carbon emissions that are coupled with the subsurface model. This is an important contribution to LCA studies on CO2-EOR, as the production rate of the EOR product (oil) is highly variable throughout the operation, and so are the CO2 utilization rates.
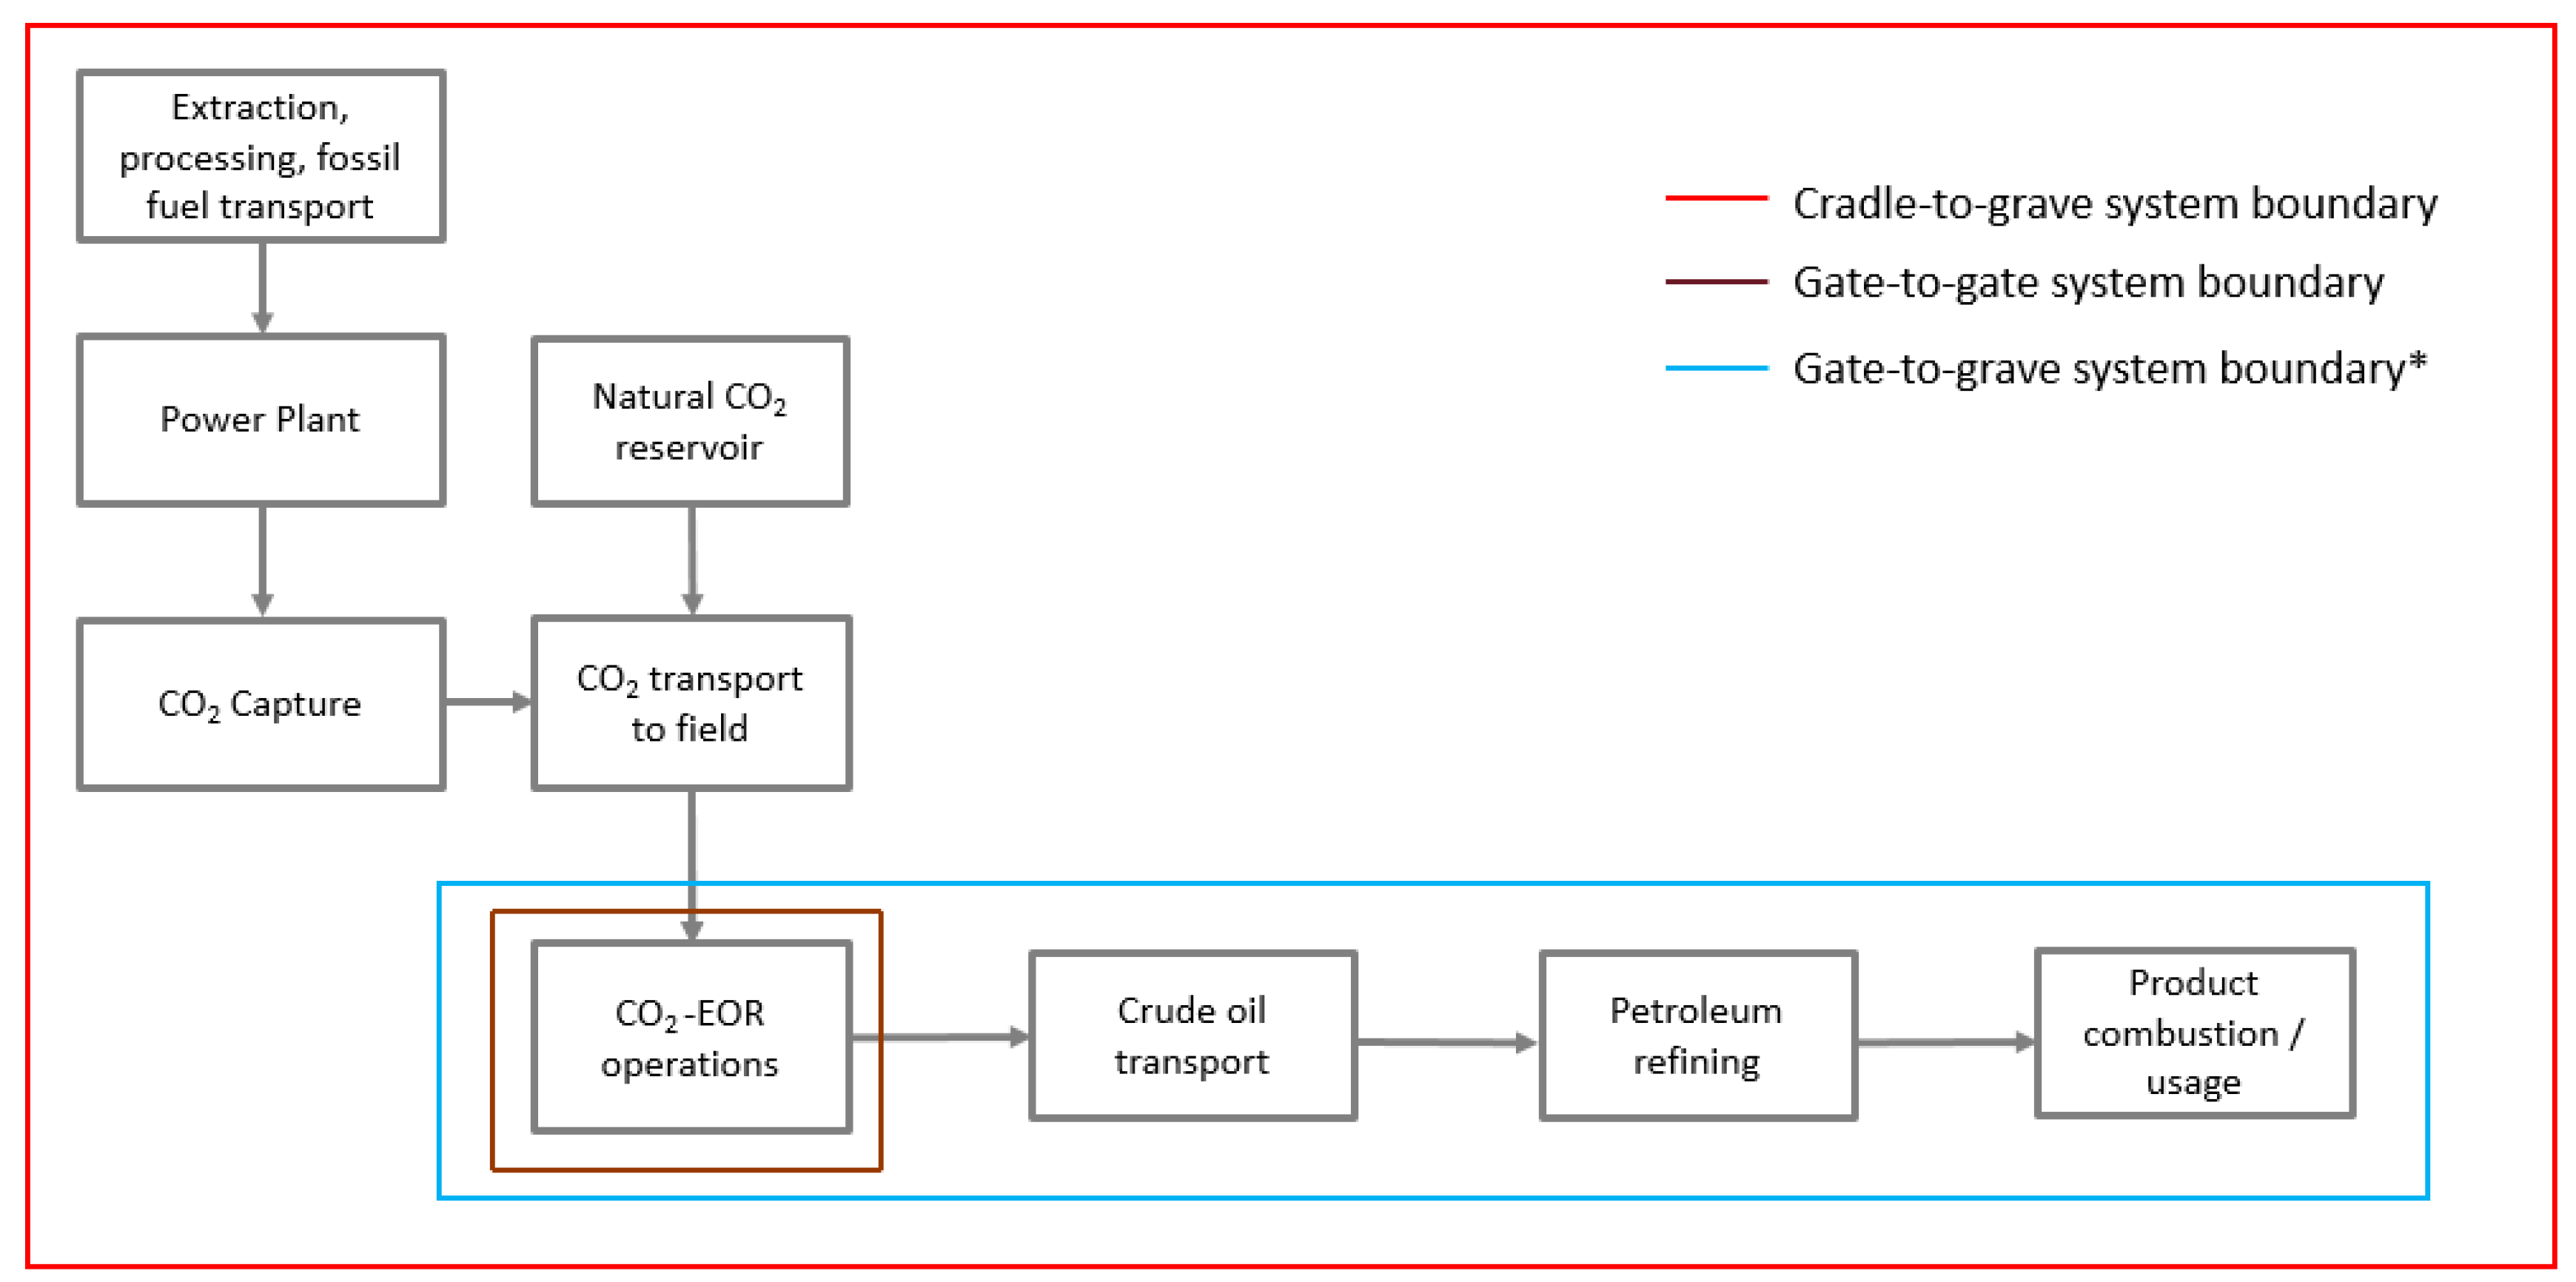
In LCA studies, the definition of boundaries is very important and is part of the goal and scope definition. We selected a gate-to-grave boundary for our energy consumption model. This boundary allows for the use of a single functional unit, which in this study is one barrel of produced oil. Different boundaries are used in carbon lifecycle analysis of CCUS systems, which complicates interpretations and comparisons. Figure 2 shows the general components of CCUS systems and the lifecycle boundaries most commonly used, including our gate-to-grave boundary.
In a CO2-EOR gate-to-grave system, the gate is the point where CO2 enters the oil field, regardless of the source, and the grave represents the combustion of the refined product, which in our study is a national average mix of combustible products (gasoline, diesel, kerosene, etc.) plus non-combustible products such as paraffin. The components inside the gate-to-grave boundary are: (1) the CO2-EOR operation, (2) the transportation of crude oil from the field to the refinery, (3) the crude oil refinery, and (4) the combustion of the mix of combustible products.
2.2.1. Carbon Emission Estimates at the CO2-EOR Site
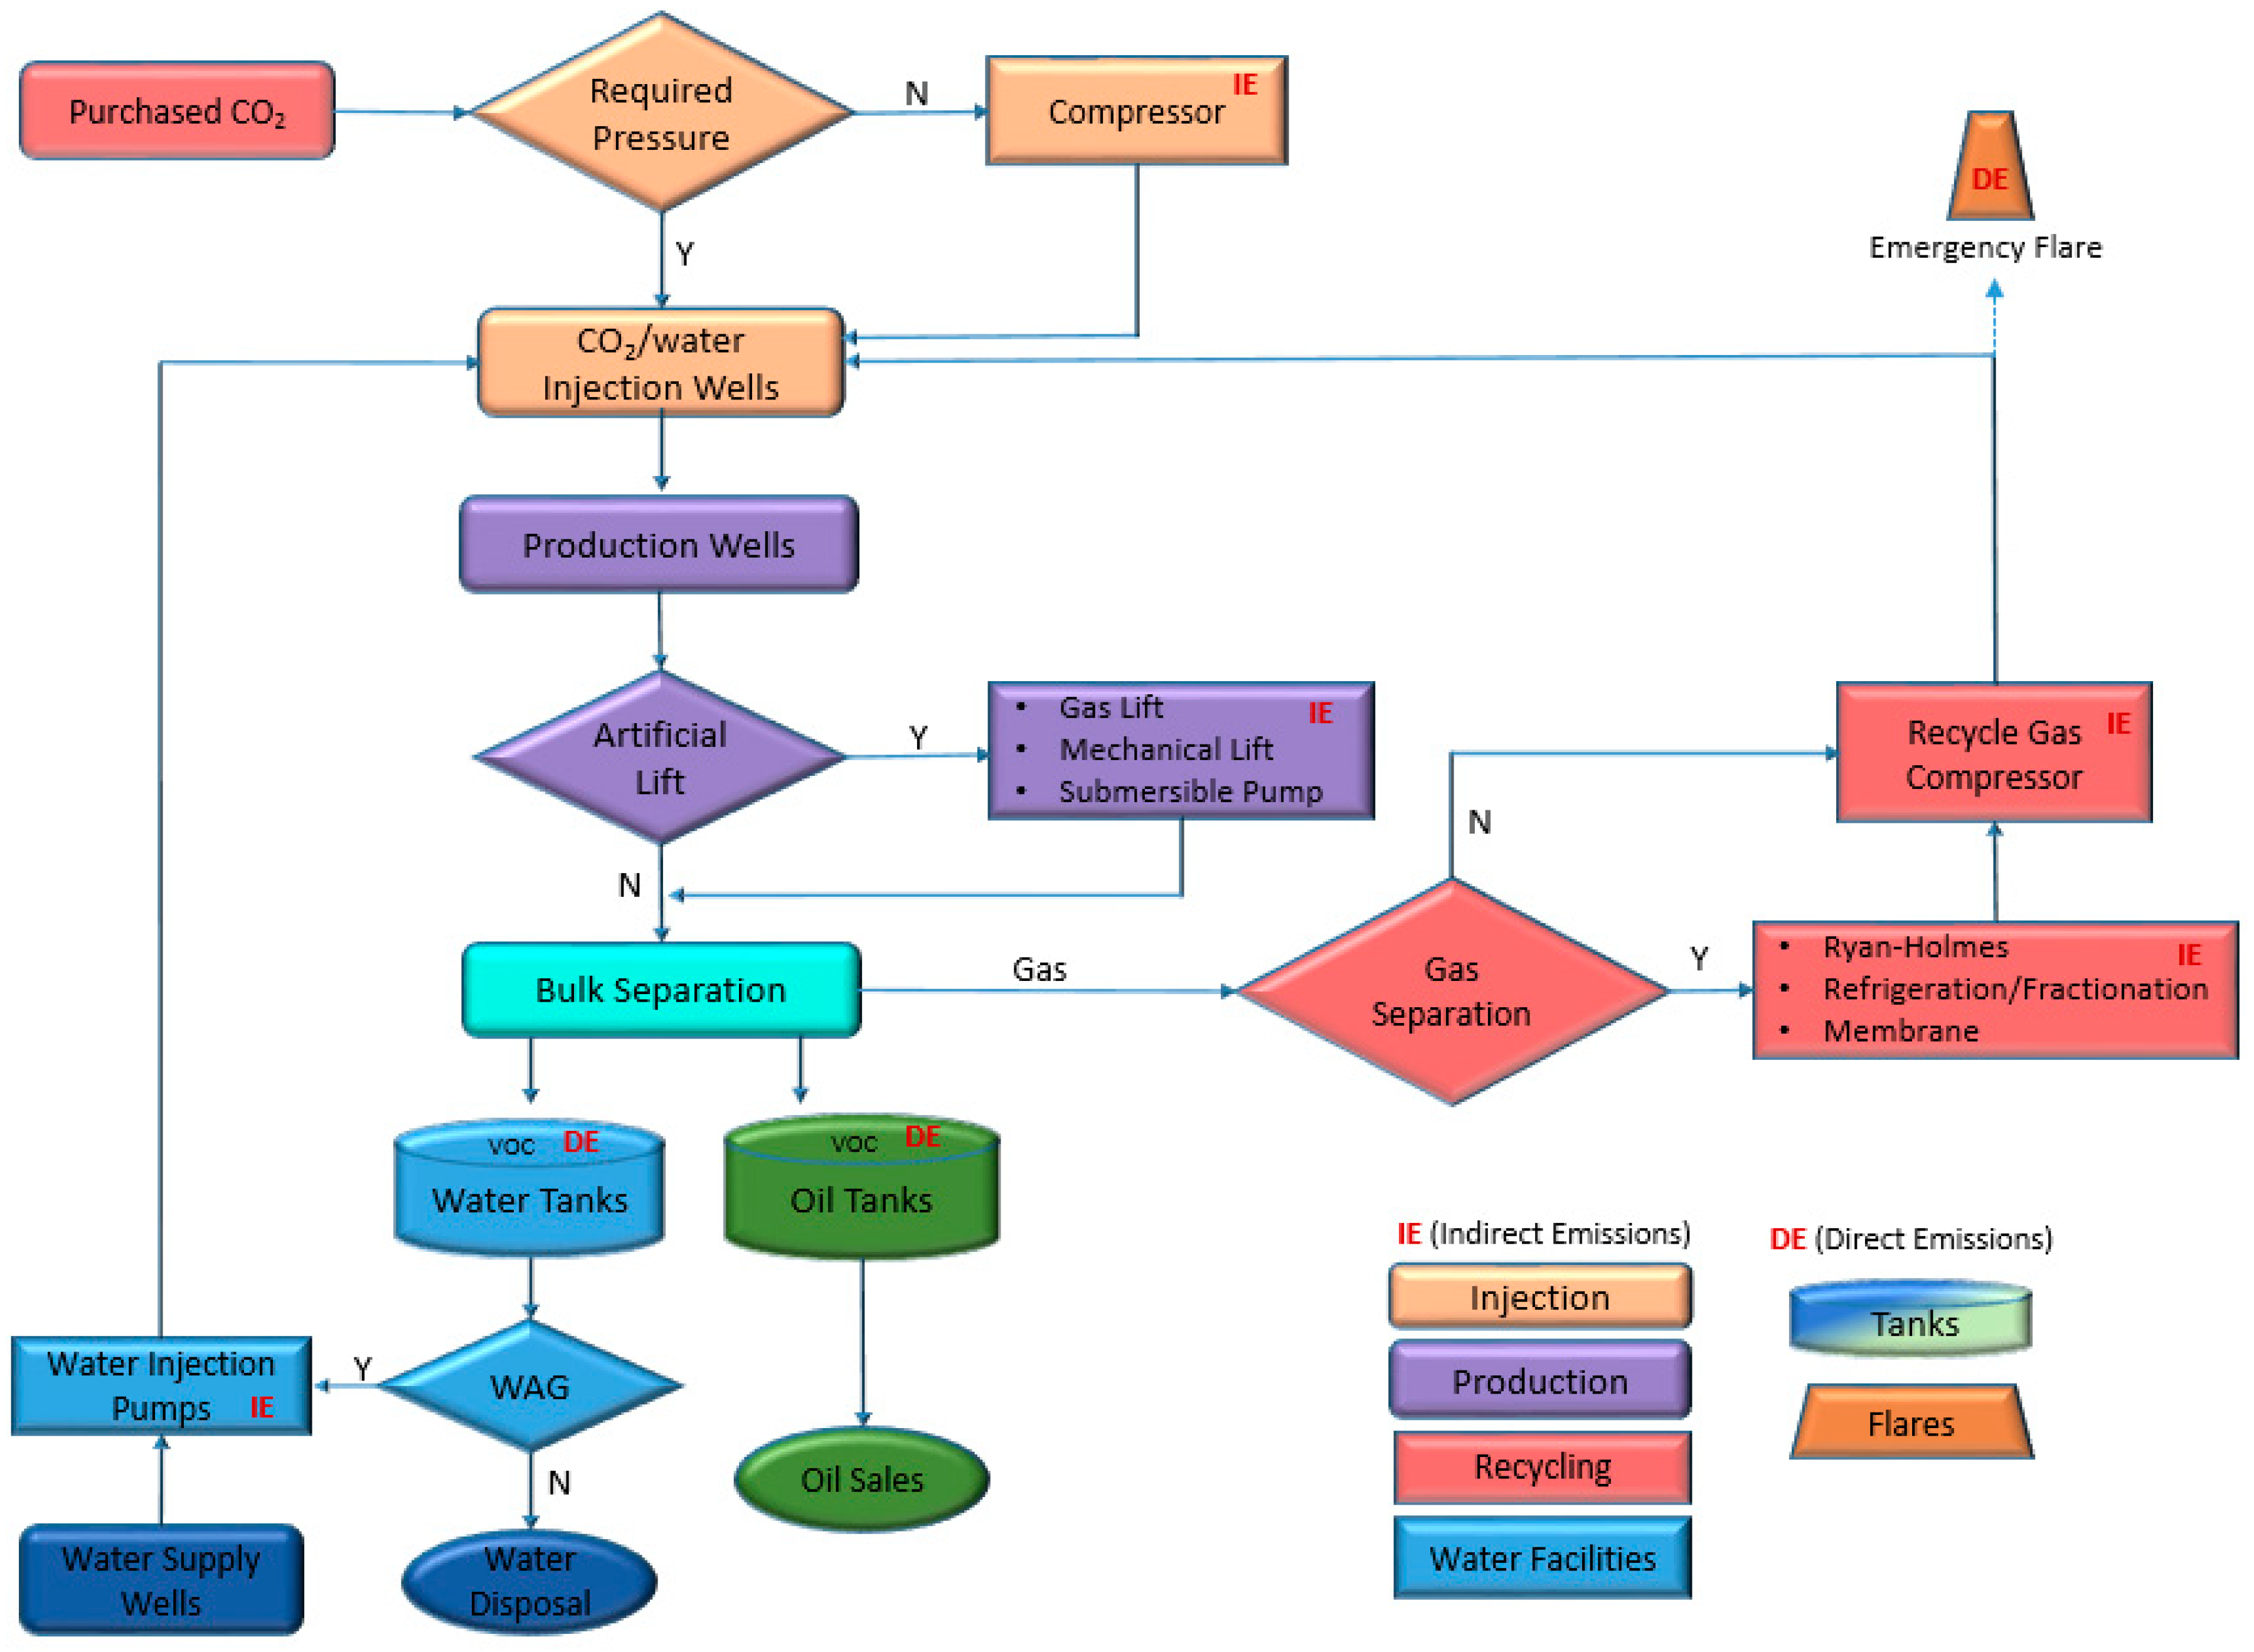
As CO2-EOR operations vary from site to site, we developed a methodology for the LCA inventory of direct and indirect CO2e emissions at the EOR site. The methodology follows a decision making diagram (Figure 3) that covers most CO2-EOR configurations and indicates the type and location of emission estimations.
Gas compression for injection is a significant, energy intensive component. At Cranfield, purchased CO2 enters the field at a pressure of 12,411 kPa. Produced CO2, which is recycled back into the oil reservoir, circulates through a central facility at an average pressure of 4,826 kPa. Purchased and recycled CO2 are compressed to the required injection pressure of 20,684 kPa. We used Equation (1) to estimate the horsepower requirements to compress the recycled CO2 to 20,684 kPa [12].
where,
- Rs = compression ratio per stage
- S = number of stages
- Q = gas flow rate, MMscf/D
- F = correction factor
The number of compression stages (S) depends on the compression ratio per stage, the theoretical discharge temperature and the operating regime (100% assumed). In order to avoid excessive material degradation or excessive thermal expansion, the compressor’s discharge temperature needs to remain below 149 °C (759 °R). Therefore, we assumed T < 149 °C (137 °C for the recycling gas and 117 °C for the purchased CO2). The integer value S (2 for the recycling gas compressor and 1 for purchased CO2 compressor) was estimated through an iterative process with Equations (2) and (3), satisfying the temperature condition.
where,
- Pd = discharge pressure (psi)
- Ps = suction pressure (psi).
- Td = discharge temperature (°R)
- Ts = suction temperature (°R)
- k = specific heat ratio.
We assumed a conservative estimate of k = 1.33 (the heat ratio of carbon dioxide), which is around 4% higher than the result of the produced gas samples from Cranfield. All these parameters have a high impact on the total required compression horsepower. Hydraulic horsepower was converted to kilowatt (1 HP = 0.7457 kW). We assumed 24 h of daily operations.
Analyses mimicked Cranfield operations to the extent possible. Production wells were gas lifted with CO2 during the first three months of activity to kick- start production. After three months, production was sustained by the energy of the reservoir, which was maintained by the CO2 injection. Gas and liquids were separated at the surface and produced gases (CO2 and reservoir gases) which were recycled back into the reservoir, without separation. Unlike in Cranfield, re-injecting produced, contaminated CO2 into the reservoir is not common practice in the Permian Basin, where CO2 is separated from the reservoir gases (methane, propane and others) to purify the CO2 injection stream. Contaminants in the CO2 can increase the minimum miscibility pressure, which reduces the effectiveness of the miscible displacement. However, gas separation facilities are expensive, and the gas separation process is energy intensive. Nuñez-López et al. [22] estimated the GHG intensity of different energy-demanding, CO2-EOR site components, including injection and production, bulk fluid separation, compression, and gas processing, and concluded that compression and gas separation were the most energy consuming processes within a gate-to-gate system.
Because the carbon balance of the operation changes depending on the decision to separate produced gases before re-injection, and on the type of gas separation technology selected, our energy consumption model included the variability of these operational choices. Gas separation technologies included: (1) fractionation, (2) refrigeration, (3) Ryan-Holmes, and (4) membrane. Results where production gases are re-injected (no separation) are also included. The utility requirements (electricity and natural gas) for the four gas separation processes considered are shown in Table 2.
The horsepower requirement for the energy intensive components of the gate-to-gate system (compression of injection gasses, gas lifting of production wells, surface fluid handling, and separation of produced gases) was estimated. As electricity networks have a different mix of electricity generation (coal, natural gas, solar, wind, etc.), the indirect emissions associated with the horsepower requirement estimates were calculated based on the local electricity grid (SRMV), which emits 468 kg CO2e/MWh and experiences 4.97% grid losses [23], where CO2e is carbon dioxide equivalent, a standard term used for measuring carbon footprint. It allows the inclusion of other GHG emissions in a common unit, based on their relative global warming potential (GWP) GWP factors (CH4: 25 and N2O: 298, 100-year GWP).
2.2.2. Carbon Emission Estimates Downstream of the CO2-EOR Site
We assumed a maximum pipeline transportation distance of 300 miles from the Cranfield field to the closest concentration of refineries in the USA This cluster refines about 75% of the total crude oil processed in the USA Gulf Coast area. Based on Cooney et al. [13], we assumed that USA crude oil is transported from the field to the refineries with an energy intensity of 260 BTU/tonne-mile or 189 J/kg-Km. We also assumed that this energy is 100% supplied by the local grid (SRMV). We estimated the refinery emission factor using a national average [24], determined from 2008 to 2014, of the fuel/energy consumption required to refine the produced crude oil, its energy content [11] and the emission factor per fuel used [23]. Emissions from electricity consumption include a 9% average penalty for national transmission losses. Finally, we estimated the end product combustion emission factor [10], assuming that 93% of the crude refined in the USA will produce CO2 emissions at the combustion end process. According to Jaramillo [10], the average heat content of crude oil refined at USA refineries is 6120 MJ/STB, with an average carbon content of 19.17 Tg C/EJ.
3. Results and Discussion
3.1. Scenarios without Stacked Carbon Storage in Saline Aquifers
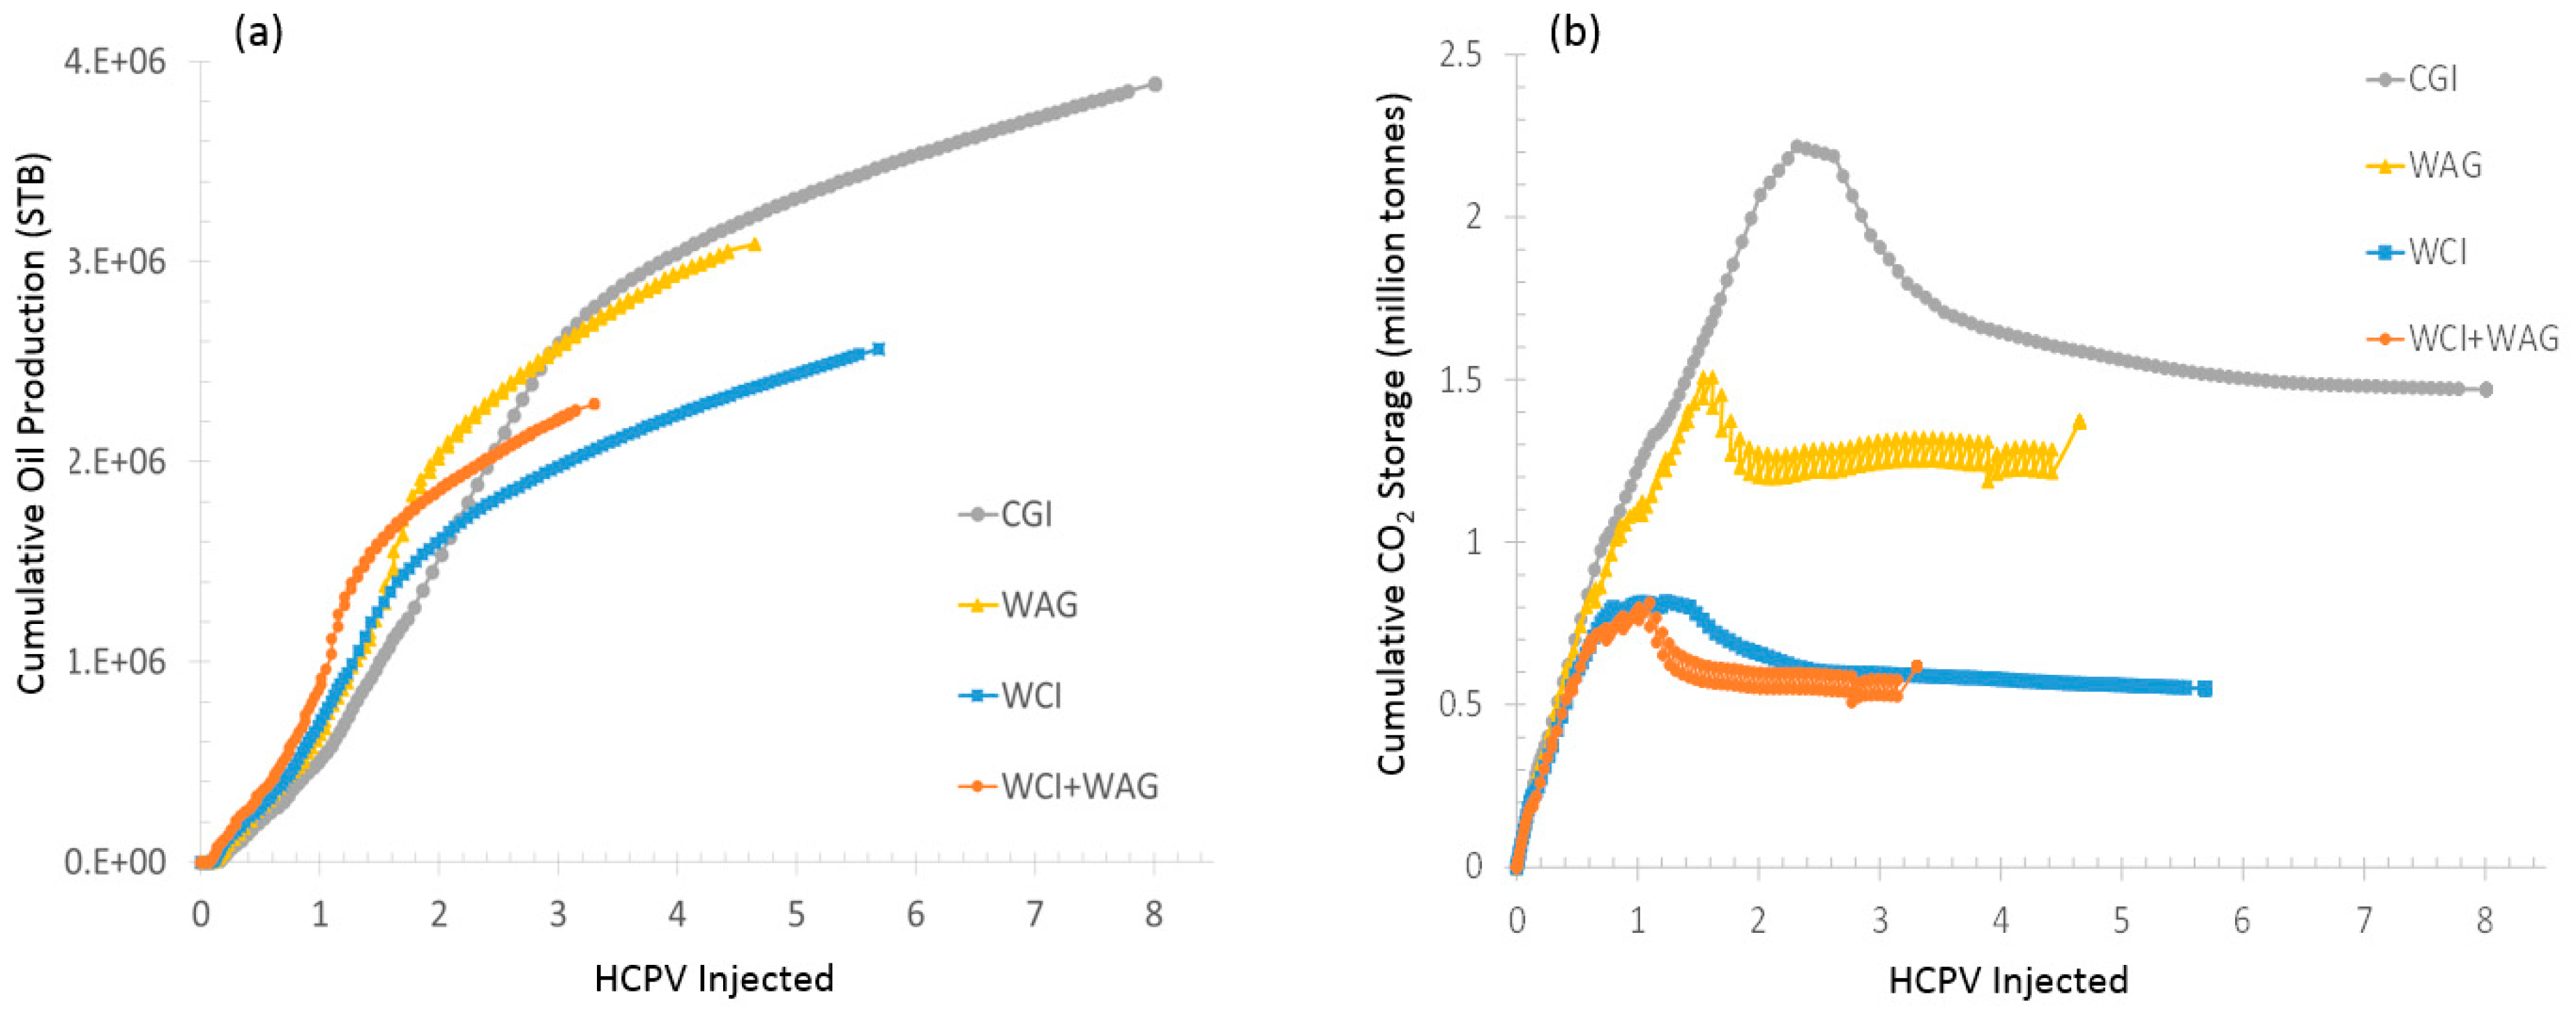
One of the goals of our scenario analysis was to capture a range of reservoir responses to different CO2 injection strategies. Results from our compositional numerical reservoir simulation for cumulative oil production and for geologic carbon storage are shown in Figure 4. Both parameters are plotted for our four CO2 injection scenarios as a function of the volumes of CO2 injected into the reservoir. The end points of all curves represent the closure of the 25-year injection period.
Figure 4a shows injection volumes were largest in the continuous gas injection scenarios (CGI and WCI). However, WAG produced more oil than WCI, and produced 80% of the oil produced by CGI with only 58% of the injected CO2. Figure 4b shows CO2 storage reached a maximum and then decreased with time. The maximum point was reached when the CO2 recycled exceeded the CO2 injection rate. Excess recycled gas was then assumed to be sent to adjacent CO2-EOR floods. As the excess CO2 exited the boundaries of the system, it was subtracted from the storage volumes. As expected, CO2 injection strategies that produced the most oil also stored the most CO2 (CGI and WAG), which confirms the argument that increased oil production also increases ultimate CO2 storage volume.
A better indicator of the efficiency of the CO2-EOR floods are the CO2 utilization rates (Figure 5), which refer to the volume of CO2 that needs to be injected to produce one barrel of oil. Gross utilization rates include total CO2 injection (purchased plus recycled CO2), whereas net utilization rates only consider purchased CO2.
Net utilization rates were lowest in our two water curtain scenarios. Ever though cumulative oil production was lowest in these two cases, the low net utilization shows the efficiency of the water curtain in assisting oil recovery, with less purchased CO2.
As expected, the lowest gross utilization rates were attributed to the two WAG scenarios, because CO2 is not injected continuously. An important observation is the variability in both net and gross utilization rates as the EOR operation progressed, particularly during the first six–eight years of operation. Most carbon lifecycle analyses use an average for EOR/storage efficiency in their calculations, but as demonstrated here, CO2 utilization rates vary significantly throughout the operation; such simplifications affect carbon balance results. Cooney et al. [13], acknowledged this as a potential improvement, which we have accomplished in this study.
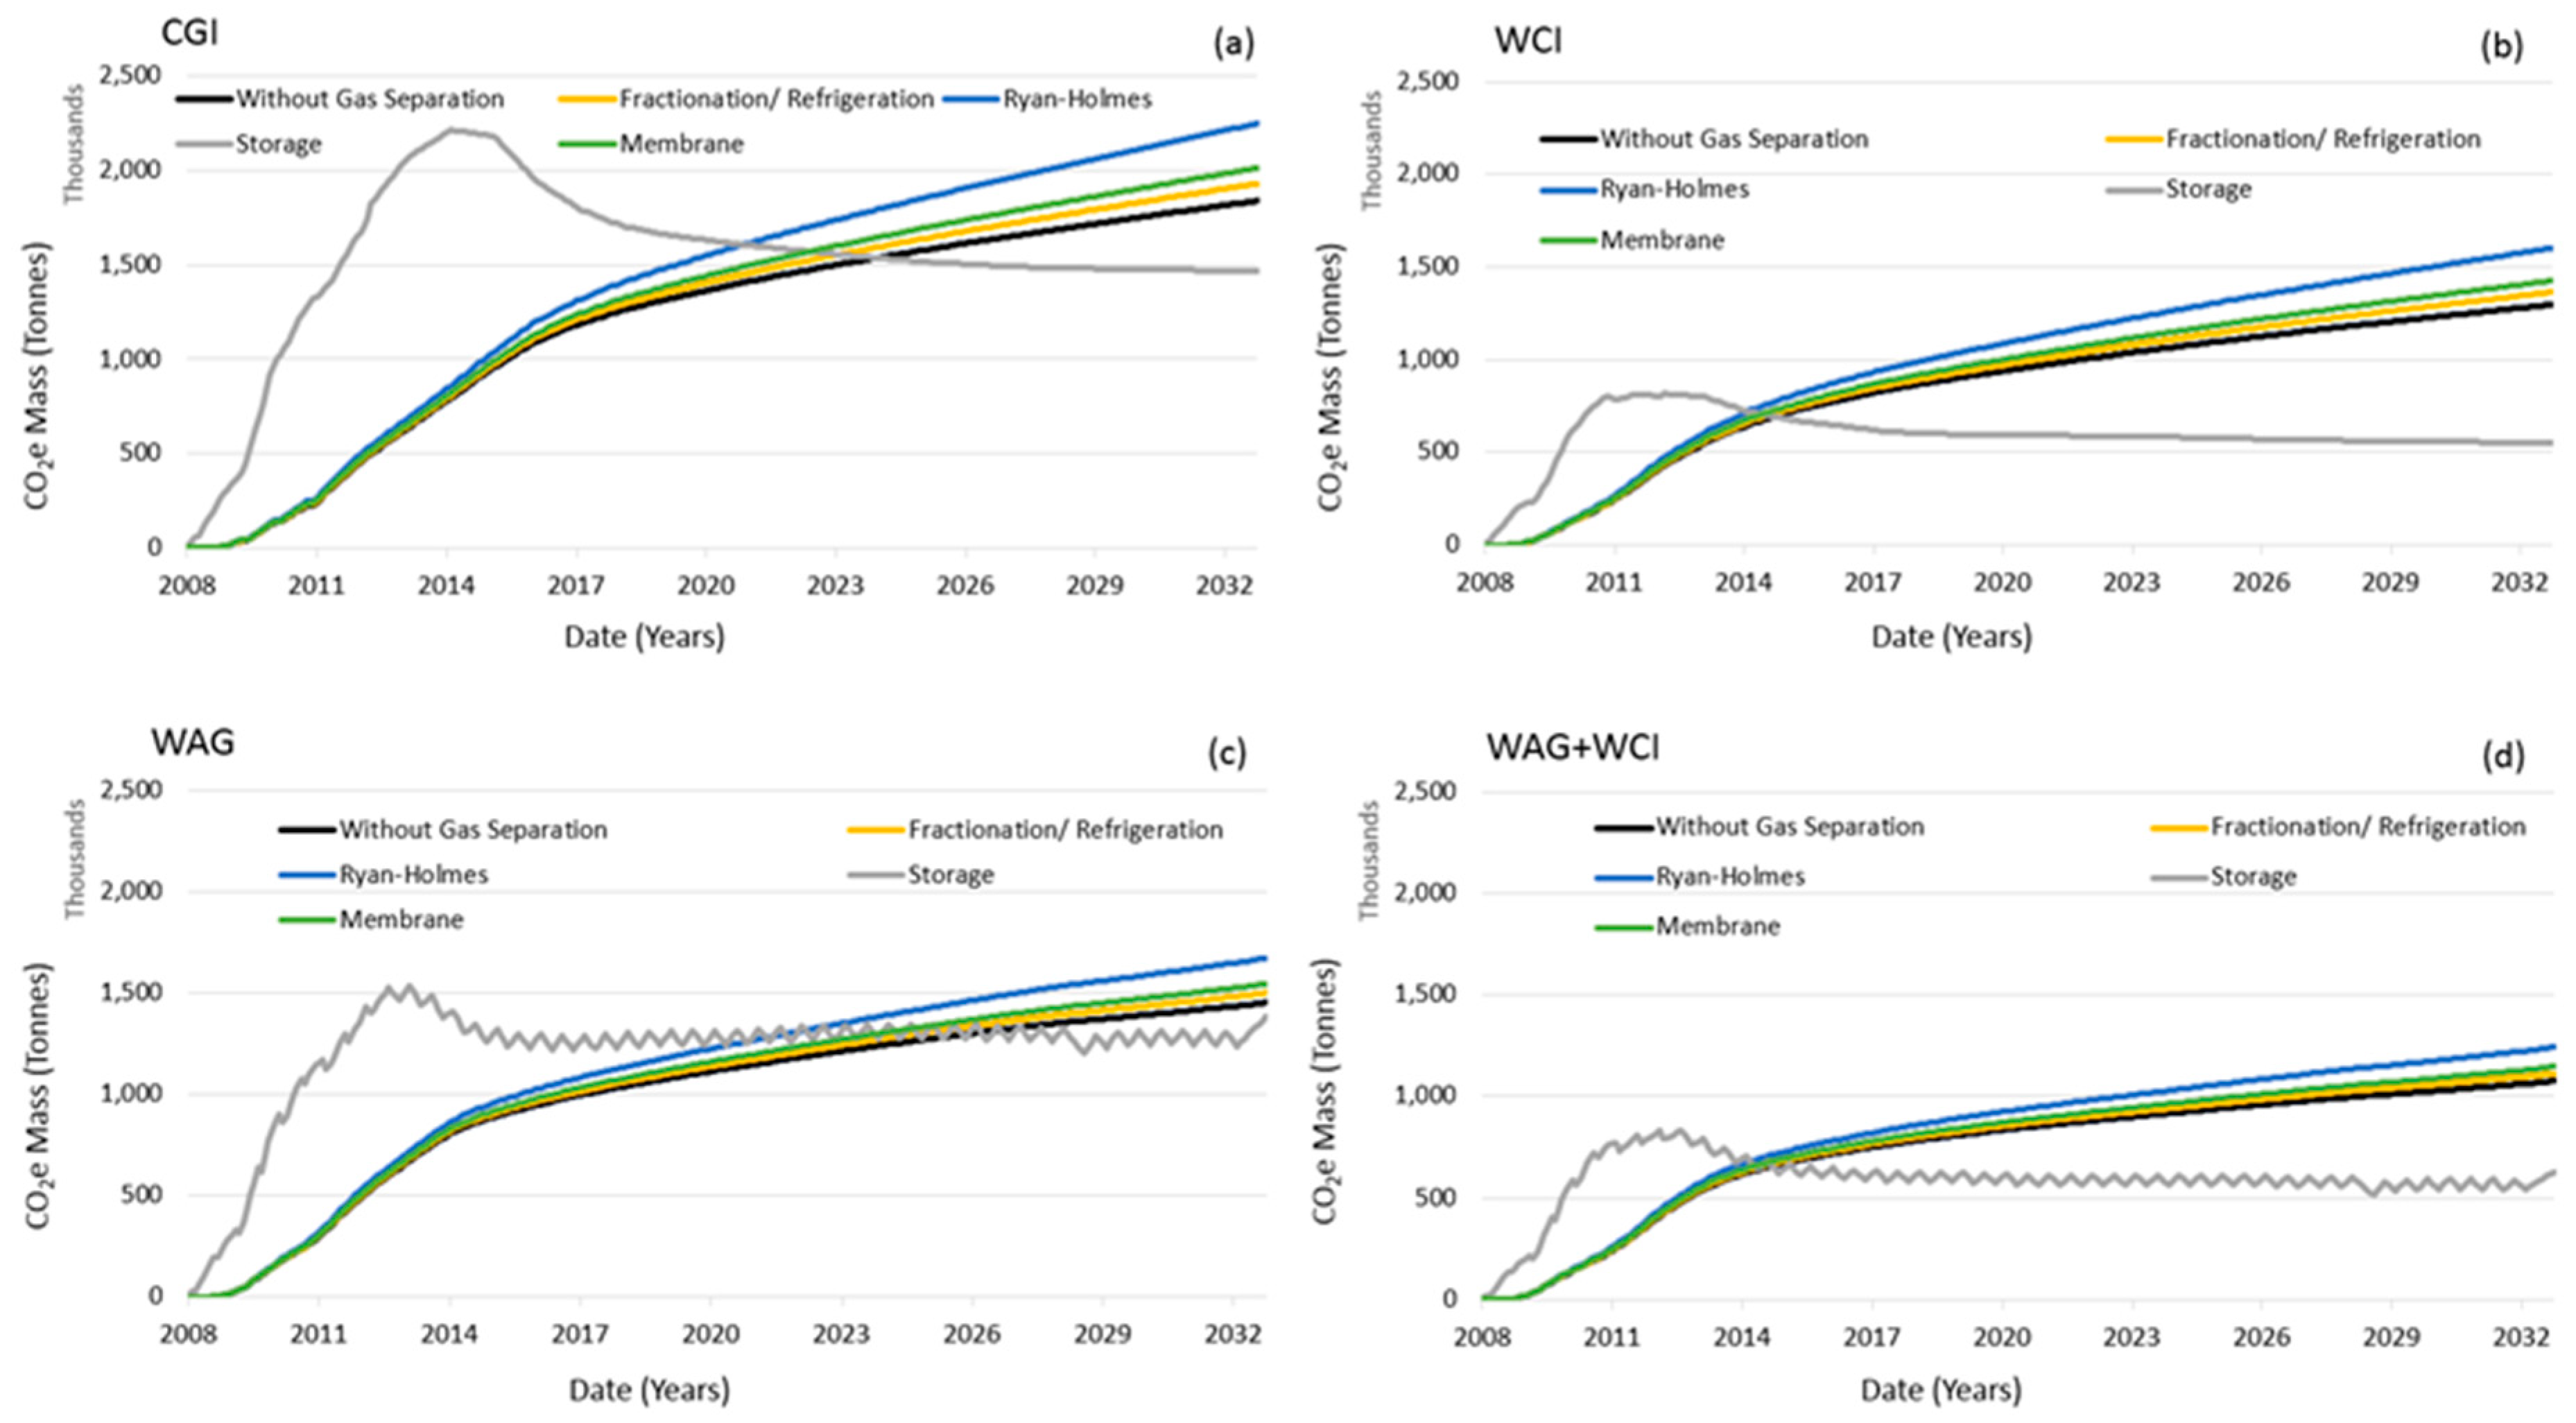
The gate-to-grave CO2e emission curves obtained with our surface model are superimposed on the carbon storage curves (Figure 6) to observe their relationship and identify the point at which storage and emissions cross in all our scenarios. Results show that the net carbon balance range was widest for the CGI scenario, which had the best initial environmental performance (i.e., it stored the most CO2). CGI remained carbon balance negative for thirteen to sixteen years, depending on the decision to purify the recycle gas and on the type of gas separation technology selected, whereas WAG remained negative for thirteen to eighteen years. The two scenarios with water curtain injection had the lowest environmental performance because of the significantly smaller volumes of stored CO2.
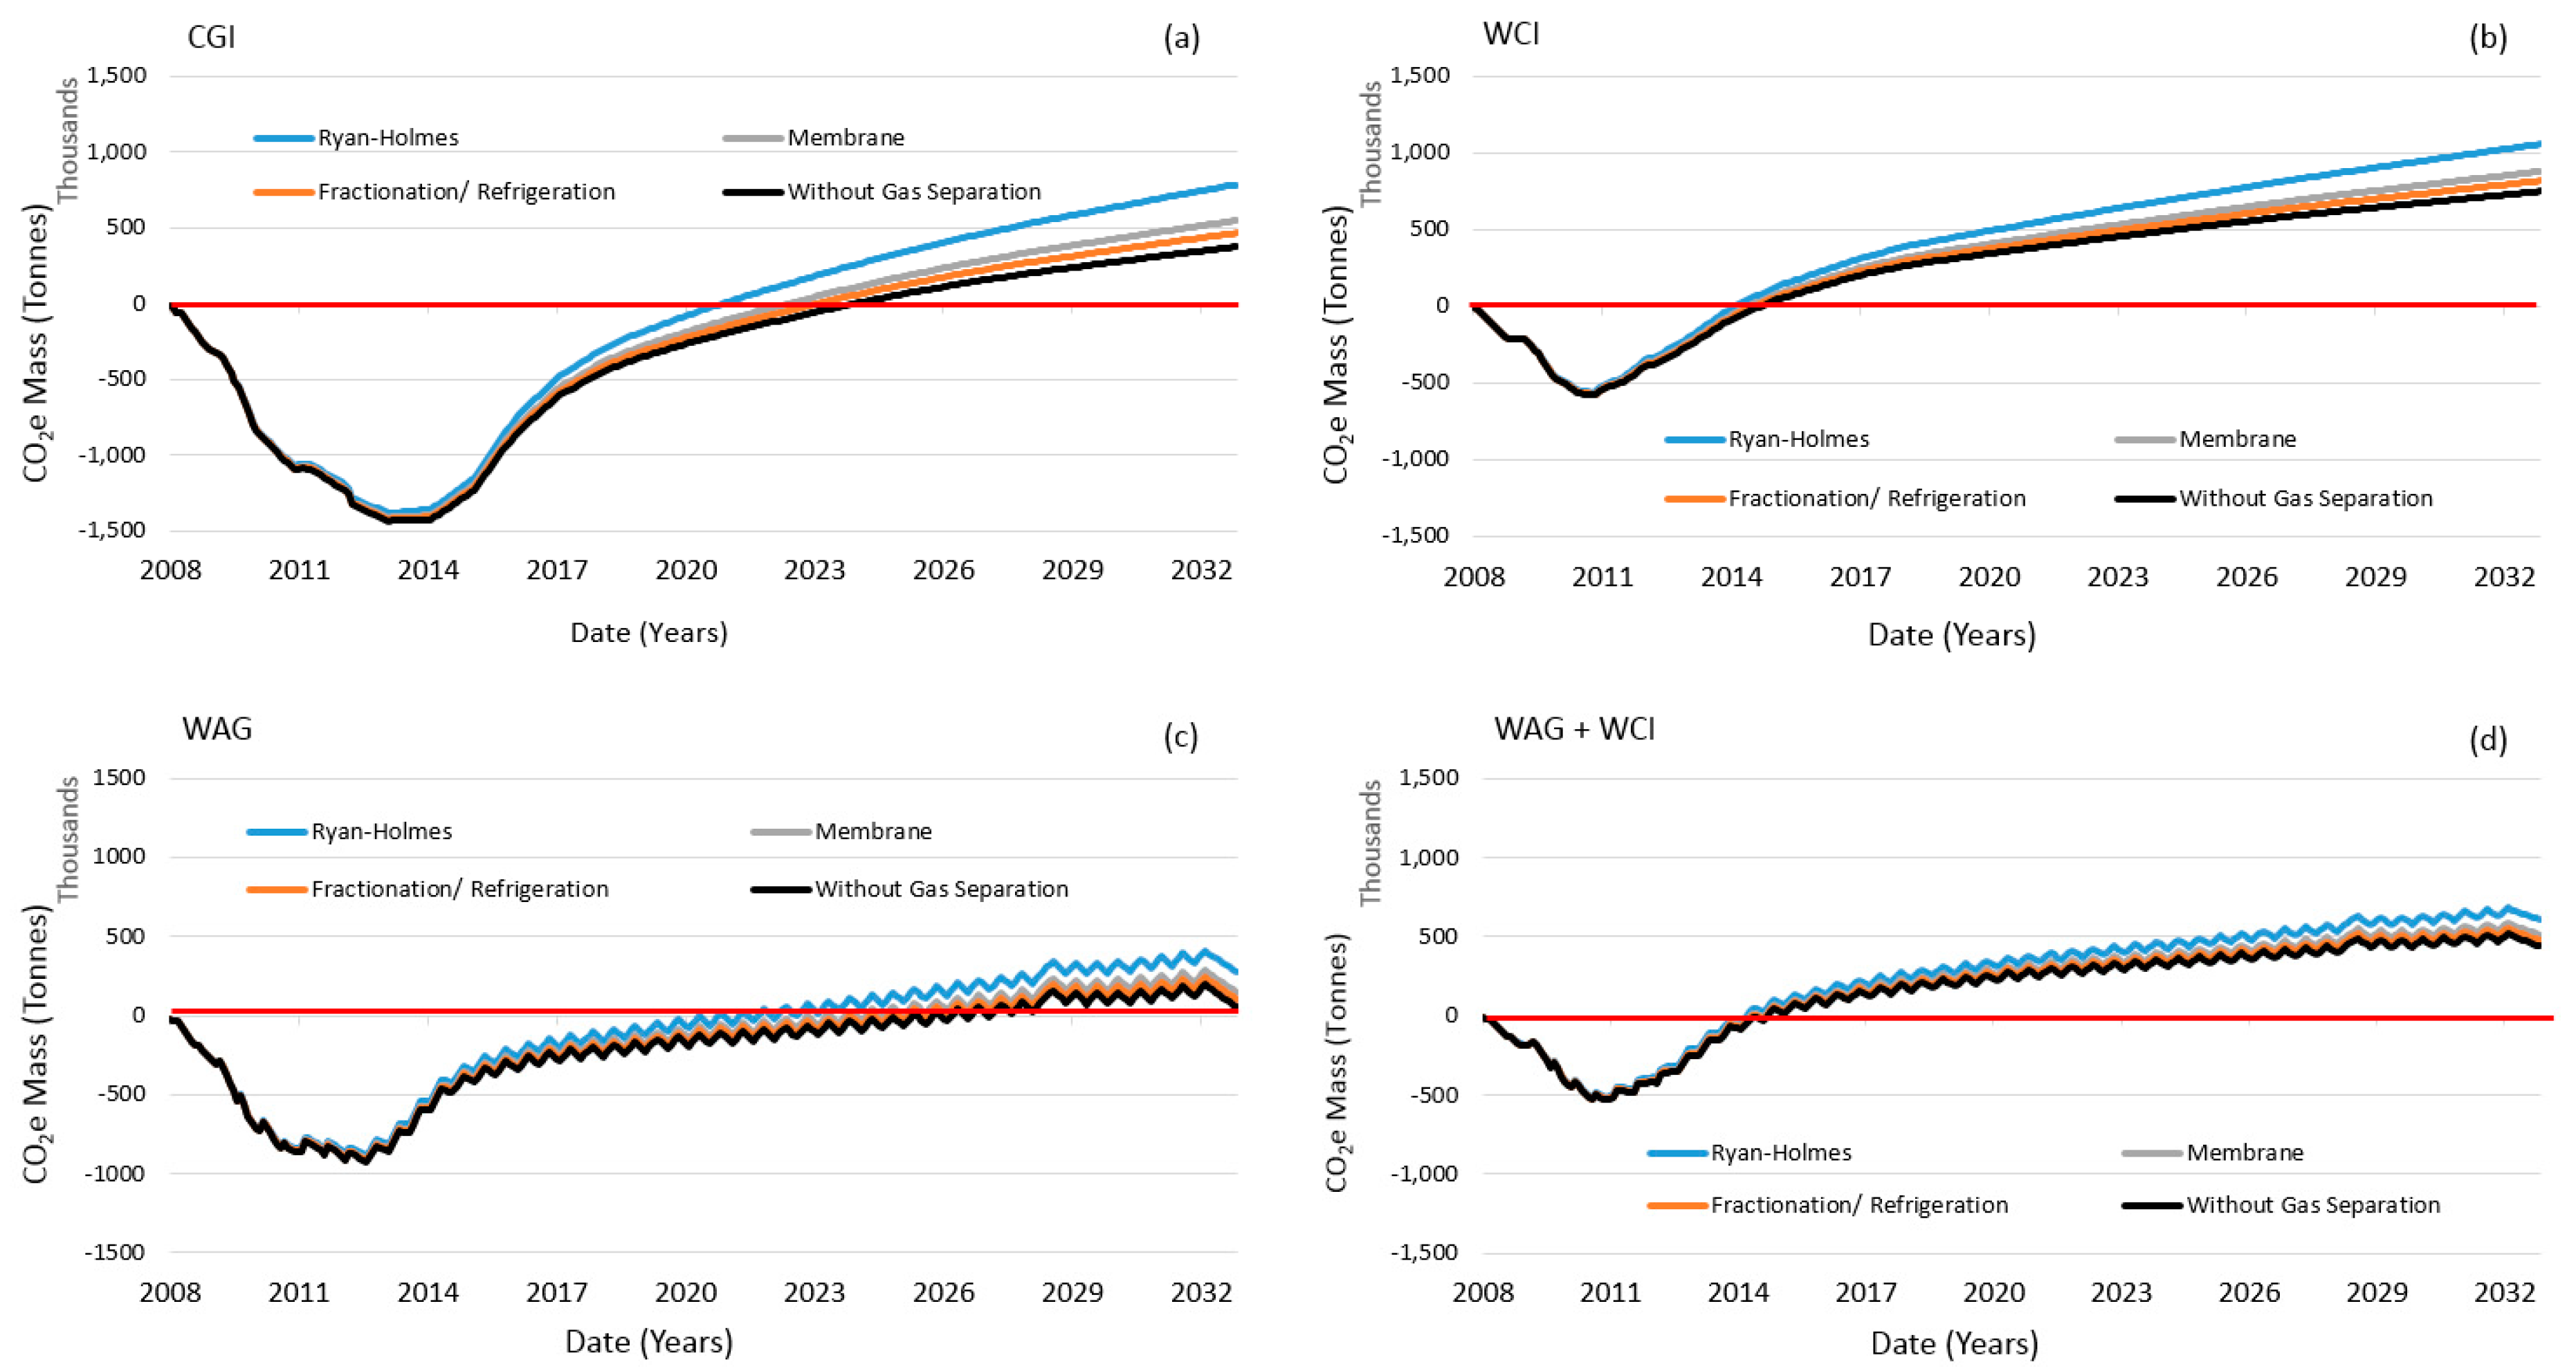
The evolution of the carbon balance of the gate-to-grave CCUS system is plotted in Figure 7 to help visualize the emission/storage relationship. A negative carbon balance (associated with the CCUS boundary) means that more CO2 has been stored than has been emitted into the atmosphere at that point in time. It also means that, for as long as the carbon balance is negative, the oil produced is net carbon negative and the CCUS system has operated with a negative carbon footprint. The main take-away from Figure 6 and Figure 7 is that all four scenarios started operating with a negative carbon footprint and, after years of operation transition into operating with a positive carbon footprint. Important decision making parameters at this transition point, such as cumulative oil production, cumulative carbon storage, length of the negative carbon footprint period, and CO2e emission rates are included in Table 3.
Understanding the carbon balance evolution of CCUS systems is one of the main contributions of this work. All pertinent LCA studies to date [7,8,9,10,11,12,13] have presented single-point results, commonly at the end of the EOR operation. Using that approach, we would have concluded that all scenarios had a positive carbon footprint, missing the important fact that all cases operated with a negative carbon footprint during the first years, with this period lasting over half the life of the operation in CGI and WAG scenarios.
3.2. Scenarios with Stacked Storage in Saline Aquifers
Another objective of the study was to evaluate the potential for improving environmental performance by assuming a stacked storage scheme, where excess CO2 from the recycling facility is injected into an underlying or associated saline aquifer for long term CO2 offtake and storage. The stacked storage scenarios were included in the study to provide a better understanding of how EOR and saline storage can be co-managed as a CCUS project matures.
Because in a stacked storage scheme, excess/offtake CO2 does not leave the system (as we assumed in non-stacked storage cases), it was therefore not subtracted from the storage volumes. Storage curves stabilized when recycled CO2 equaled injection rates (Figure 8). From this point in time onward, purchases of CO2 ceased, and all CO2 injected was recycled CO2. The plateauing of storage curves was expected as CO2 storage is assumed to be equal to purchased CO2. It is important to note that the CO2 injection volumes into the aquifer for saline CO2 storage are constrained by the volumes required by the EOR operation. Carbon emissions associated with the additional energy requirements needed for saline reservoir storage were considered and included in the total carbon emission estimates.
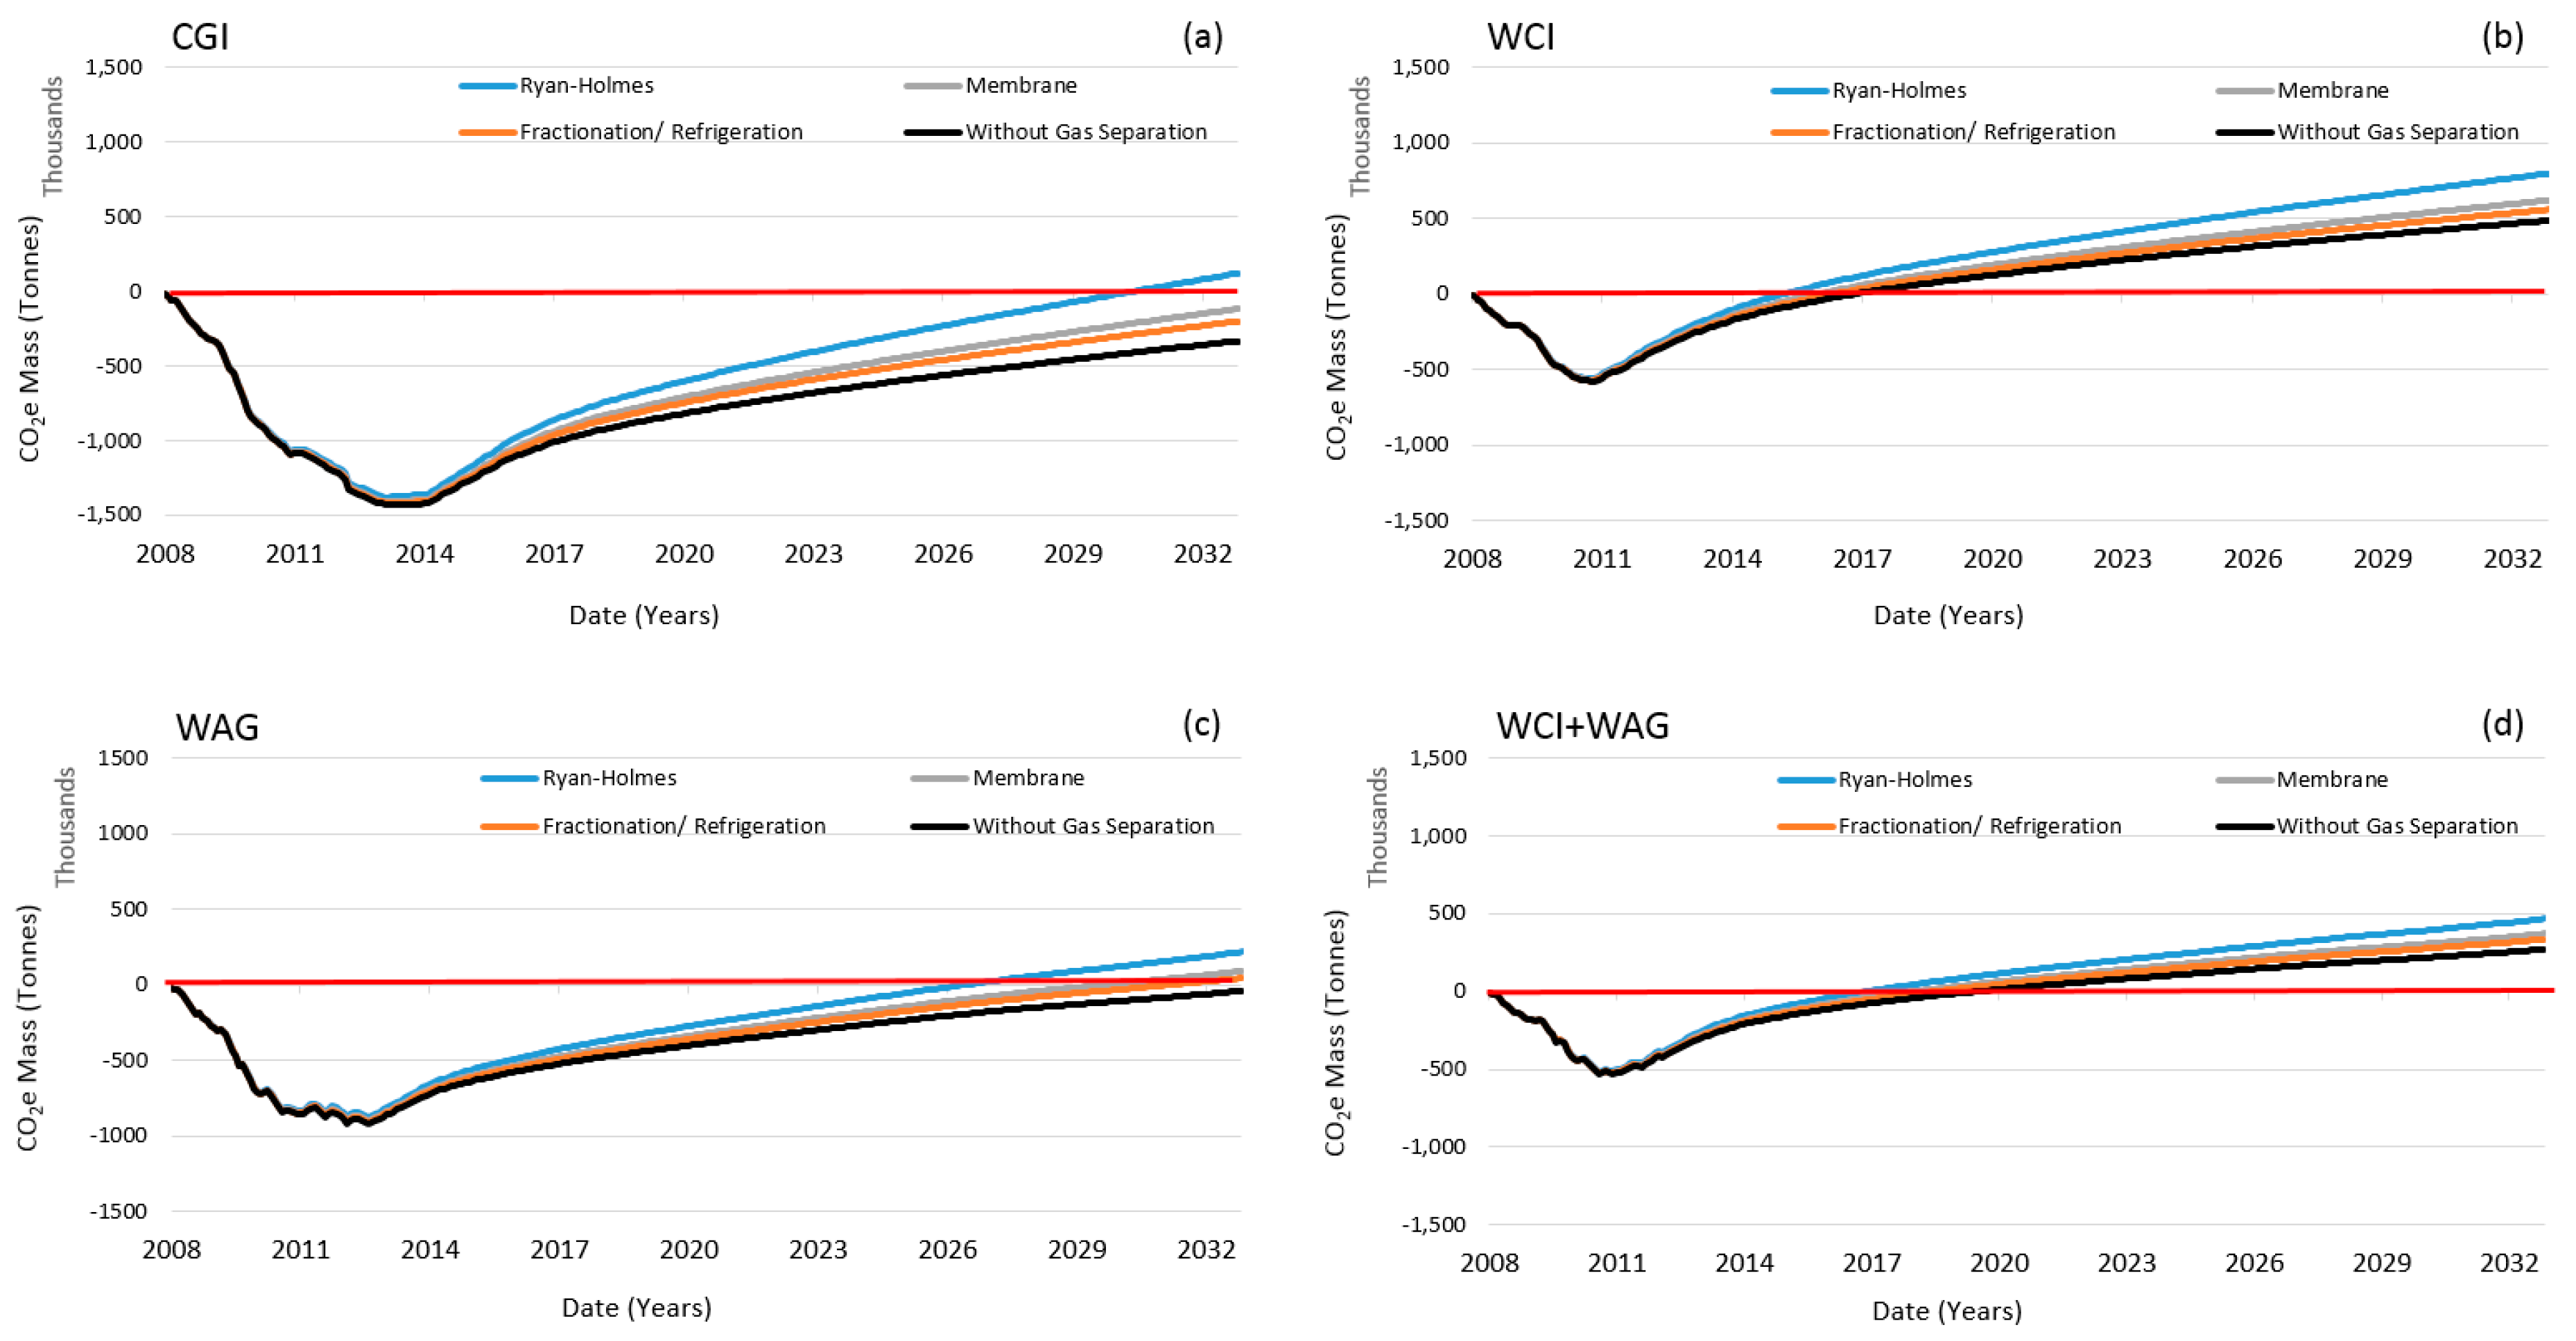
Figure 8 shows the carbon storage curve and the emissions curves of the gate-to-grave CCUS system (with and without gas separation) for our four CO2 injection scenarios. To improve the visualization of results, the carbon balance for the four scenarios with stacked saline storage is plotted in Figure 9. The most important observation is that in all scenarios the transition point either displaces to the right or simply disappears. Again, important decision making parameters at this transition point, such as cumulative oil production, cumulative carbon storage, length of the negative carbon footprint period, and greenhouse gas emission rates are included in Table 4.
In CGI, all scenarios remained net carbon negative except when Ryan Holmes gas separation was used, where the operation turned net carbon positive three years before the end of the project. In the WAG scenario, the net carbon negative period with saline storage extended from up to 18 years to potentially the entire life of the project if gases were not separated at the surface.
Again, the scenarios with water curtain injection presented the lowest environmental performance, which was mostly due to the smaller CO2 storage volumes and, to a lesser degree, to the additional energy required by the water curtain injection. Another observation is that the CO2 storage curves were very similar in these two scenarios. Water curtain scenarios are the most efficient in terms of the EOR process, and this was confirmed by the low net utilization rates. In these two scenarios, cumulative CO2 storage curves reached the same maximum value (~800,000 tonnes), which could be explained by the efficiency of the water curtain, whose purpose is to create a pressure barrier that prevents CO2 losses outside of the EOR rock volume. The similarity in the maximum storage reached in both water curtain scenarios is also an indication that this volume could be the maximum storage capacity of the rock volume inside the water curtain; that is, scenarios without a water curtain store more because the CO2 is not laterally constrained.
4. Conclusions
A dynamic assessment of reservoir performance coupled with energy consumption is necessary to understand the range and evolution of the carbon balance of CCUS systems. Our results show that all four CO2 injection scenarios started operating with a negative carbon footprint and at some point transitioned into operating with a positive carbon footprint. The negative carbon footprint period could be engineered to last longer through operational changes and, more significantly, with stacked saline carbon storage.
Results from our numerical reservoir simulation study confirm the premise that the optimized displacement of reservoir fluids with CO2 provides an opportunity for simultaneously enhancing oil production and associated carbon storage. In our reservoir simulations, the ultimate oil recovery in the CGI and WAG scenarios was largest, and so was the carbon storage at the end of 25 years of CO2 injection. Results from CO2 utilization ratio and oil production analyses showed that the hybrid scenario, which combined a WAG flooding strategy with a water curtain injection, was the most EOR-efficient. In this scenario, oil was recovered faster, producing earlier revenues and potentially the best project value. However, it did not perform well environmentally. The best initial environmental performance was achieved by the CGI scenario, even though WAG remained net carbon negative for as long as CGI and produced 80% of the oil produced by CGI with only 58% of the injected CO2. Based on our analysis, WAG appears to have better potential for EOR/storage co-optimization, providing the best compromise between environmental and operational performance.
Environmental performance can be significantly improved in a stacked storage scenario. Our stacked storage assessment provides a better understanding of how EOR and saline carbon storage can be co-managed as a CCUS project matures. Our analysis shows how WAG and CGI can be net carbon negative in a gate-to-grave system, throughout the entire CO2-EOR operation, regardless of the selected gas separation technology, and in spite of the assumption that only excess recycled CO2 was injected into the saline aquifer. In cases where the CO2-EOR operator sees value in storing more CO2 through a carbon credit program (e.g., the 45Q carbon credit program in the USA) and decides to inject more CO2 than the offtake from the EOR recycling facility, all CO2 injection strategies could potentially be net carbon negative.
Our study demonstrates the variability of the net carbon balance of CCUS systems. Net carbon balance not only varies among different EOR settings, but it also varies depending on the strategy selected to develop reservoirs with the same geologic setting. In addition, net carbon balance also varies significantly through time, as projects mature. This variability is mostly due to the efficiency of the EOR process, which controls oil recovery and associated carbon storage. Most studies on carbon lifecycle analysis of CO2-EOR use a range for EOR efficiency, commonly stated in barrels of oil produced per ton of CO2 purchased. Such simplifications provide a narrow view of carbon lifecycle variability of CO2-EOR.
Our results also provide an understanding of the interplay between environmental performance and economic oil production. This understanding can assist in the co-optimization of CO2-EOR and geologic carbon storage.
Author Contributions
Conceptualization, V.N.-L.; methodology, V.N.-L. and R.G.-E.; validation, V.N.-L., R.G.-E. and S.A.H.; formal analysis V.N.-L. and R.G.-E.; investigation, V.N.-L., R.G.-E. and S.A.H.; resources, V.N.-L., R.G.-E. and S.A.H.; data curation, V.N.-L., R.G.-E. and S.A.H.; writing—original draft preparation, V.N.-L.; supervision, V.N.-L.; project administration, V.N.-L.; funding acquisition, V.N.-L.
Acknowledgments
This study was funded and managed by the National Energy Technology Laboratory (NETL), a USA national laboratory under the Department of Energy (DOE), under award numbers DE-FE0024433 and DE-FC26-05NT42590. The authors thank and acknowledge the Gulf Coast Carbon Center and the Petroleum and Geosystems Engineering Department of the University of Texas at Austin for the cost sharing support. This manuscript was published with approval from the Bureau of Economic Geology’s Director.
Conflicts of Interest
The authors declare no conflict of interest.
Nomenclature
| HCPV | hydrocarbon pore volume |
| STB | stock tank barrel (at standard conditions) |
| kPa | kilopascal |
| CO2e | CO2 equivalent |
| MWh | megawatt hour |
| VOC | volatile organic compounds |
| Tg | teragram = 1012 grams = one million metric ton |
| EJ | exajoule = 1018 joules |
| MMscf | million standard cubic feet |
References
- Godec, M.L.; Kuuskraa, V.A.; Dipietro, P. Opportunities for Using Anthropogenic CO2 for Enhanced Oil Recovery and CO2 Storage. Energy Fuels 2013, 27, 4183–4189. [Google Scholar] [CrossRef]
- Verma, M.K. Fundamentals of Carbon Dioxide-Enhanced Oil Recovery (CO2-EOR)—A Supporting Document of the Assessment Methodology for z Recovery Using CO2-EOR Associated with Carbon Sequestration; Series No. 2015-1071; U.S. Geological Survey Open-File Report; US Geological Survey: Tucson, AZ, USA, 2015. [CrossRef]
- Mungan, N. Carbon Dioxide Flooding as an Enhanced Oil Recovery Process. J. Can. Pet. Technol. 1992, 31. [Google Scholar] [CrossRef]
- Hosseininoosheri, P.; Hosseini, S.A.; Núñez-López, V.; Lake, L.W. Impact of field development strategies on CO2 trapping mechanisms in a CO2–EOR field: A case study in the Permian Basin (SACROC unit). Int. J. Greenh. Gas Control 2018, 72. [Google Scholar] [CrossRef]
- Han, W.S. Evaluation of CO2 Trapping Mechanisms at the Sacroc Northern Platform: Site of 35 Years of CO2 Injection; The New Mexico Institute of Mining and Technology: Socorro, NM, USA, 2008. [Google Scholar]
- ISO 14040—Environmental Management—Life Cycle Assessment—Principles and Framework; International Standards Organization: Geneva, Switzerland, 1997; Available online: http://www.iso.org/iso/en/prods-services/otherpubs/iso14000/index.html (accessed on 15 January 2015).
- Aycaguer, A.C.; Lev-On, M.; Winer, A.M. Reducing Carbon Dioxide Emissions with Enhanced Oil Recovery Projects: A Life Cycle Assessment Approach. Energy Fuels 2001, 15, 303–308. [Google Scholar] [CrossRef]
- Suebsiri, J.; Wilson, M.; Tontiwachwuthikul, P. Life-cycle analysis of CO2 EOR on EOR and geological storage through economic optimization and sensitivity analysis using the Weyburn Unit as a case study. Ind. Eng. Chem. Res. 2006, 45, 2483–2488. [Google Scholar] [CrossRef]
- Hertwich, E.G.; Aaberg, M.; Singh, B.; Strømman, A.H. Life-cycle assessment of carbon dioxide capture for enhanced oil recovery. Chin. J. Chem. Eng. 2008, 16, 343–353. Available online: https://www.sciencedirect.com/science/article/pii/S1004954108600853?via%3Dihub (accessed on 10 February 2015). [CrossRef]
- Jaramillo, P.; Griffin, W.M.; McCoy, S.T. Life cycle inventory of CO2 in an enhanced oil recovery system. Environ. Sci. Technol. 2009, 43, 8027–8032. [Google Scholar] [CrossRef] [PubMed]
- DOE-NETL. Electricity Use of Enhanced Oil Recovery with Carbon Dioxide (CO2-EOR); DOE/NETL-2009/1354; DOE National Energy Technology Laboratory: Washington, DC, USA, 2009.
- Fox, C.E. CO2 EOR Carbon Balance at SACROC Year 2007; LP (Power Point Presentation); Kinder Morgan CO₂ Company: Houston, TX, USA, 2009. [Google Scholar]
- Cooney, G.; Littlefield, J.; Marriott, J.; Skone, T. Evaluating the Climate Benefits of CO2-Enhanced Oil Recovery Using Life Cycle Analysis. Environ. Sci. Technol. 2015, 49, 7491–7500. [Google Scholar] [CrossRef] [PubMed]
- Ampomah, W.; Balch, R.; Grigg, R.; McPherson, B.; Will, R.; Lee, S.; Dai, Z.; Pan, F. Co-optimization of CO2-EOR and storage processes in mature oil reservoirs. Int. J. Greenh. Gases Sci. Technol. 2016, 7, 128–142. [Google Scholar] [CrossRef]
- Leach, A.; Mason, C.F.; Velt, K. Co-Optimization of Enhanced Oil Recovery and Carbon Sequestration; NBER Working Paper Series # 15035; NBER: Cambridge, MA, USA, 2009; 30p. [Google Scholar]
- Dai, Z.; Viswanathan, H.; FessendenRahn, J.; Middleton, R.; Pan, F.; Jia, W.; Lee, S.Y.; McPherson, B.; Ampomah, W.; Grigg, R. Uncertainty quantification for CO2 sequestration and enhanced oil recovery. Energy Procedia 2014, 63, 7685–7693. [Google Scholar] [CrossRef]
- Hadlow, R.E. Update of industry experience with CO2 injection, Society of Petroleum Engineers. In Proceedings of the SPE 67th Annual Technical Conference and Exhibition, Washington, DC, USA, 4–7 October 1992; pp. 743–752. [Google Scholar] [CrossRef]
- Saneifar, M.; Heidari, Z.; Linroth, M.; Purba, S. Effect of Heterogeneity on Fluid-Injectivity Loss during Water-Alternating-Gas Injection in the Scurry Area Canyon Reef Operators Committee Unit. SPE Reserv. Eval. Eng. 2017, 20, 293–303. [Google Scholar] [CrossRef]
- Gorell, S.B. Implications of Water-Alternate-Gas injection, for Profile Control and Injectivity. In Proceedings of the SPE/DOE Enhanced Oil Recovery Symposium, Tulsa, OK, USA, 22–25 April 1992. [Google Scholar] [CrossRef]
- Hosseini, S.A.; Hamidreza, L.; Choi, J.W.; Nicot, J.P.; Lu, J.; Hovorka, S.D. Static and dynamic reservoir modeling for geological CO2 sequestration at Cranfield, Mississippi, USA. Int. J. Greenh. Gas Control 2013, 18, 449–462. [Google Scholar] [CrossRef]
- Hosseini, S.A.; Alfi, M.; Nicot, J.P.; Nuñez-López, V. Analysis of CO2 storage mechanisms at a CO2-EOR site, Cranfield, Mississippi. Int. J. Greenh. Gases Sci. Technol. 2018, 8, 469–482. [Google Scholar] [CrossRef]
- Nuñez-López, V.; Gil-Egui, R.; Gonzalez-Nicolas, A.; Hovorka, S.D. Carbon balance of CO2-EOR for NCNO classification. Energy Procedia 2017, 114, 6597–6603. [Google Scholar] [CrossRef]
- EPA. Emission Factors for Greenhouse Gas Inventories. Available online: https://www.epa.gov/sites/production/files/2015-07/documents/emission-factors_2014.pdf (accessed on 12 May 2016).
- U.S. Energy Information Administration (eia). Fuel Consumed at Refineries. WEB Page 2018-06-25. Available online: https://www.eia.gov/dnav/pet/pet_pnp_capfuel_dcu_nus_a.htm (accessed on 12 May 2016).
Figure 1.
(a) Structural contour map; (b) sector model showing structure and location of injection and production wells; (c) active and inactive grids used for reservoir simulation. The sealing fault is a closed boundary.
Figure 1.
(a) Structural contour map; (b) sector model showing structure and location of injection and production wells; (c) active and inactive grids used for reservoir simulation. The sealing fault is a closed boundary.

Figure 2.
Carbon capture, utilization, and storage (CCUS) system components and carbon lifecycle analysis (LCA) boundaries. * Study boundary.
Figure 2.
Carbon capture, utilization, and storage (CCUS) system components and carbon lifecycle analysis (LCA) boundaries. * Study boundary.

Figure 3.
Methodology for direct and indirect CO2 emissions inventory at the enhanced oil recovery (EOR) site.
Figure 3.
Methodology for direct and indirect CO2 emissions inventory at the enhanced oil recovery (EOR) site.

Figure 4.
(a) Cumulative oil production as a function of CO2 volume injected. (b) CO2 storage as a function of CO2 volume injected. HCPV = hydrocarbon pore volume.
Figure 4.
(a) Cumulative oil production as a function of CO2 volume injected. (b) CO2 storage as a function of CO2 volume injected. HCPV = hydrocarbon pore volume.

Figure 5.
(a) Net utilization ratio (purchased CO2 needed to produce one barrel of oil). (b) Gross CO2 utilization ratio (purchased plus recycled CO2 needed to produce one barrel of oil).
Figure 5.
(a) Net utilization ratio (purchased CO2 needed to produce one barrel of oil). (b) Gross CO2 utilization ratio (purchased plus recycled CO2 needed to produce one barrel of oil).

Figure 6.
CO2 storage mass (gray curves) versus CO2e emissions (colored curves) of the gate-to-grave CCUS system for: (a) continuous gas injection, (b) water curtain injection, (c) water-alternating-gas, and (d) the hybrid scenario.
Figure 6.
CO2 storage mass (gray curves) versus CO2e emissions (colored curves) of the gate-to-grave CCUS system for: (a) continuous gas injection, (b) water curtain injection, (c) water-alternating-gas, and (d) the hybrid scenario.

Figure 7.
Carbon balance (CO2e emissions minus CO2 storage) of the gate-to-grave CCUS system. (a) continuous gas injection, (b) water curtain injection, (c) water-alternating-gas, and (d) the hybrid scenario.
Figure 7.
Carbon balance (CO2e emissions minus CO2 storage) of the gate-to-grave CCUS system. (a) continuous gas injection, (b) water curtain injection, (c) water-alternating-gas, and (d) the hybrid scenario.

Figure 8.
CO2 storage (gray curves), including storage of excess recycle volumes into an underlying saline aquifer, versus CO2e emissions (colored curves) of the gate-to-grave CCUS system. (a) continuous gas injection, (b) water curtain injection, (c) water-alternating-gas, and (d) the hybrid scenario.

Figure 9.
Carbon balance (CO2e emissions minus CO2 storage) of the gate-to-grave CCUS system with stacked saline carbon storage. (a) continuous gas injection, (b) water curtain injection, (c) water-alternating-gas, and (d) the hybrid scenario.
Figure 9.
Carbon balance (CO2e emissions minus CO2 storage) of the gate-to-grave CCUS system with stacked saline carbon storage. (a) continuous gas injection, (b) water curtain injection, (c) water-alternating-gas, and (d) the hybrid scenario.


Table 1.
Greenhouse gas (GHG) emissions from previous lifecycle analysis (LCA) studies on carbon dioxide-enhanced oil recovery (CO2-EOR), from oil field sites to end product combustion.
Table 1.
Greenhouse gas (GHG) emissions from previous lifecycle analysis (LCA) studies on carbon dioxide-enhanced oil recovery (CO2-EOR), from oil field sites to end product combustion.
| Reference | Study Remarks | GHG Emissions | ||
|---|---|---|---|---|
| CO2-EOR Field Site | Refinery Operations | Product Combustion | ||
| Aycaguer [7] | Storage: 2.6 kg CO2/kg of oil produced (4.5 kg CO2/kg gasoline produced) and 0.1 kg CH4 per kg oil. General conclusion: GHG generated by gasoline combustion is offset by CO2 storage in the reservoir. | 0.4 kg CO2/kg oil | 4.8 kg CO2/kg gasoline | |
| Suebsiri [8] | Storage: 18.60 Mton CO2. General conclusion: EOR has the capacity to store 30% of the total CO2 emissions from the EOR process through the refinery and end usage. | 1.4 Mtonne CO2 (0.06 ton CO2/ton CO2 recycled) | 3.3 Mtonne CO2/130 MMbbl | 61 Mtonne CO2/130 MMbbl |
| Hertwich [9] | General conclusion: a combined cycle power plant with carbon capture has substantially lower GHG emissions than a gas power plant without CCS. | 19.1 kg CO2e per standard cubic meter of oil | ||
| Jaramillo [10] | Storage (SACROC case): 85 Mtonne CO2e Storage: 0.2 tonnes CO2/bbl oil produced Emissions: 3.7–4.7 ton CO2 emitted/ton CO2 injected General conclusion: 0.62 tonnes of CO2 will need to be injected (and stored) per bbl of oil produced in order to offset system emissions. | SACROC case: 22.7 Mtonne CO2e | SACROC: 20.1 Mtonne CO2e | SACROC: 159 Mtonne CO2e |
| DOE-NETL [11] | This study quantifies electricity requirements of CO2-EOR expressed in kWh per barrel of incremental oil. | 27–98 kWh/bbl | ||
| Fox [12] | Net Storage at EOR site: 241.5 Mton CO2. (93% of CO2 purchased) Net storage including product combustion: 126.5 Mton CO2 sequestered (49%) | 18.5 Mtonne CO2 (0.1 ton CO2/bbl) | 97 Mtonne CO2 | |
| Cooney [13] | LCA analysis on 3 system boundaries: Gate-to-gate, cradle-to-gate, and cradle-to-grave. | 60–165 kg CO2e/bbl (including land use + construction) | ||
Mtonne = million metric ton, MMbbl = million barrel.
Table 2.
Utility requirements for gas separation processes. Modified from [11].
Table 2.
Utility requirements for gas separation processes. Modified from [11].
| Gas Processing Energy Requirements | Fractionation | Refrigeration | Ryan-Holmes | Membrane |
|---|---|---|---|---|
| Electricity (kWh/tonnes gas) | 13.8 | 13.8 | 62.8 | 26.1 |
| Natural Gas (kg natural gas/kg EOR gas) | 1.91 × 10⁻⁶ | 1.45 × 10⁻⁶ | n/a | 6.64 × 10⁻² |
Table 3.
Important CCUS parameters at the transition point (CO2 storage = CO2e emissions). Scenarios without stacked saline carbon storage.
Table 3.
Important CCUS parameters at the transition point (CO2 storage = CO2e emissions). Scenarios without stacked saline carbon storage.
| Parameter at Transition Point | CGI | WCI | WAG | WAG + WCI |
|---|---|---|---|---|
| Cumulative oil production (million barrels) | 3–3.2 | 1.38–1.45 | 2.4–2.7 | 1.34–1.4 |
| Percent of ultimate recovery (%) | 79–83 | 54–56 | 80–87 | 59–61 |
| Cumulative carbon storage/emissions (million tonnes) | 1.5–1.65 | 0.7–0.75 | 1.26–1.3 | 0.65–0.7 |
| Negative carbon footprint period (yrs.) | 13 up to 16 | 6 up to 6.7 | 14 up to 18 | 6 up to 6.4 |
| Negative carbon footprint period (% of project life) | 52 up to 64 | 24 up to 26.8 | 56 up to 72 | 24 up to 25.6 |
| Emission rate (tonnes CO2e/barrel) | 0.50–0.54 | 0.49–0.53 | 0.48–0.51 | 0.48–0.50 |
Table 4.
Important CCUS parameters at the transition point (CO2 storage = CO2e emissions). Scenarios with stacked saline carbon storage.
Table 4.
Important CCUS parameters at the transition point (CO2 storage = CO2e emissions). Scenarios with stacked saline carbon storage.
| Parameter at Transition Point | CGI * | WCI | WAG * | WAG + WCI |
|---|---|---|---|---|
| Cumulative oil production (million barrels) | 3–3.2 | 1.38–1.45 | 2.4–2.7 | 1.34–1.4 |
| Percent of ultimate recovery (%) | 79–83 | 54–56 | 80–87 | 59–61 |
| Cumulative carbon storage/emissions (million tonnes) | 2.4 | 0.8 | 1.52 | 0.8 |
| Negative carbon footprint period (yrs.) | 22.5 up to life | 6 up to 9 | 19 up to life | 9 up to 12 |
| Negative carbon footprint period (% of project life) | 90 up to life | 24 up to 36 | 76 up to life | 36 up to 48 |
| Emission rate (tonnes CO2e/barrel) | 0.75–0.80 | 0.55–0.78 | 0.56–0.63 | 0.57–0.60 |
* transition point not reached in some gas separation scenarios.
© 2019 by the authors. Licensee MDPI, Basel, Switzerland. This article is an open access article distributed under the terms and conditions of the Creative Commons Attribution (CC BY) license (http://creativecommons.org/licenses/by/4.0/).
Share and Cite
MDPI and ACS Style
Núñez-López, V.; Gil-Egui, R.; Hosseini, S.A. Environmental and Operational Performance of CO2-EOR as a CCUS Technology: A Cranfield Example with Dynamic LCA Considerations. Energies 2019, 12, 448. https://doi.org/10.3390/en12030448
AMA Style
Núñez-López V, Gil-Egui R, Hosseini SA. Environmental and Operational Performance of CO2-EOR as a CCUS Technology: A Cranfield Example with Dynamic LCA Considerations. Energies. 2019; 12(3):448. https://doi.org/10.3390/en12030448
Chicago/Turabian StyleNúñez-López, Vanessa, Ramón Gil-Egui, and Seyyed A. Hosseini. 2019. "Environmental and Operational Performance of CO2-EOR as a CCUS Technology: A Cranfield Example with Dynamic LCA Considerations" Energies 12, no. 3: 448. https://doi.org/10.3390/en12030448
Note that from the first issue of 2016, this journal uses article numbers instead of page numbers. See further details here.