Improved Consistent Interpretation Approach of Fault Type within Power Transformers Using Dissolved Gas Analysis and Gene Expression Programming

Department of Electrical and Computer Engineering, Curtin University, Perth, WA 6102, Australia
Energies 2019, 12(4), 730; https://doi.org/10.3390/en12040730
Submission received: 29 January 2019
/
Revised: 18 February 2019
/
Accepted: 19 February 2019
/
Published: 22 February 2019
Abstract
:Dissolved gas analysis (DGA) of transformer oil is considered to be the utmost reliable condition monitoring technique currently used to detect incipient faults within power transformers. While the measurement accuracy has become relatively high since the development of various off-line and on-line measuring sensors, interpretation techniques of DGA results still depend on the level of personnel expertise more than analytical formulation. Therefore, various interpretation techniques may lead to different conclusions for the same oil sample. Moreover, ratio-based interpretation techniques may fail in interpreting DGA data in case of multiple fault conditions and when the oil sample comprises insignificant amount of the gases used in the specified ratios. This paper introduces an improved approach to overcome the limitations of conventional DGA interpretation techniques, automate and standardize the DGA interpretation process. The approach is built based on incorporating all conventional DGA interpretation techniques in one expert system to identify the fault type in a more consistent and reliable way. Gene Expression Programming is employed to establish this expert system. Results show that the proposed approach provides more reliable results than using individual conventional methods that are currently adopted by industry practice worldwide.
1. Introduction
Because power transformers are considered as the crux of transmission and distribution electricity networks, utilities and other power network stakeholders around the globe are aiming to adopt reliable, automated and non-invasive techniques for power transformer condition monitoring and diagnosis. To avoid transformer catastrophic failures that may result in a significant loss of revenue and business interruption due to electricity outages, incipient faults should be identified as soon as they emerge and a proper remedial action should be taken. Dielectric oil within power transformer is regularly tested using various chemical and electrical diagnostic techniques to detect developed transformer internal faults at early stages [1,2]. Among current transformer diagnostic techniques, dissolved gas in oil analysis (DGA) is widely accepted as a reliable tool to detect power transformer incipient faults [3]. DGA technique was developed based on the fact that different gases are evolved in transformer oil as a result of the decomposition of the oil and paper insulation due to the high thermal and electric stresses they are exposed to during transformer operational life [4]. These gases are formed at specific temperature ranges as defined in the combustible gas generation temperature [5] and Hastead’s thermal charts [6]. Gases produced due to oil decomposition are hydrogen (H2), methane (CH4), acetylene (C2H2), ethylene (C2H4) and ethane (C2H6). Carbon monoxide (CO) and carbon dioxide (CO2) can be produced due to cellulose degradation, atmospheric leak or as a result of long term oxidation of transformer oil [7]. The amount of produced gases and the rate of generation reflect the general health condition of the transformer and can be used to identify various transformer internal faults and can be employed along with other transformer condition monitoring parameters to estimate the remnant operational life of the transformer [8,9,10,11]. Partial discharge activity produces H2 and CH4 while arcing generates all gases including traceable amount of C2H2 [12]. While DGA measurement techniques are well developed in both real time and laboratory-based environments, the interpretation of results remains a challenge research area that calls for further improvement to enhance the accuracy of the current conventional interpretation methods as so far, there is no globally accepted technique for DGA interpretation [1]. DGA interpretation techniques such as key gas method [3], Doernenburg, Roger and IEC ratio methods [13,14] and Duval triangle method [15] are widely used by various utilities for DGA results identification and quantification. These techniques depend on personnel experience more than mathematical formulation. Hence, they may result in different conclusions for the same oil sample [16].
Ratio-based methods such as Roger, Doerenburg and IEC which employ either four or three gas ratios for DGA data interpretation are only usable if a substantial amount of the gas employed in the ratio is present else the method leads to out-of-code ratio and will not be able to identify the type of fault [6]. Therefore these methods can be used to identify faults rather than detecting it.
The key gas method employs combination of individual gases and total combustible gas concentration for fault identification within the transformer [6,17]. While the application of this method is a straightforward exercise, it is considered very conservative as a transformer may operate safely even though this interpretation technique indicates imminent risk providing gas evolution rate is not constantly increasing. For this reason, key gas it is not widely accepted as an effective tool for evaluating power transformers DGA results [3].
Duval triangle is a graphical technique that employs the concentration ratio of three gases in a triangle comprising different zones for thermal, partial discharge and arcing faults [18]. The main drawback of this technique is that the proposed triangle does not encompass an area for normal DGA results, hence similar to the ratio-based techniques, this method can only be used to identify the fault type of faulty transformers.
Table 1 summarizes the methodology, pros and cons of the five DGA interpretation techniques discussed above.
Due to the limitations of conventional DGA interpretation techniques and because of the availability of DGA data, researchers were motivated to develop computer-based approaches for DGA interpretation using artificial intelligent (AI) techniques with a main goal of overcoming the drawbacks of the ratio-based methods in particular when multiple faults exist within the transformer [18,19,20,21,22,23,24,25]. As per [19] conventional DGA interpretation techniques are not consistent and they may result in different interpretations for the same oil sample. To automate, standardize and enhance the accuracy and consistency of the current DGA conventional interpretation techniques, a fuzzy logic model that incorporates the key features of Doerenburg, Roger, IEC ratio methods along with key gas and Duval triangle methods was developed and presented in [19]. However, the proposed model did not take into account the rate of gas evolution and the automatic adaption of model’s rules based on data history to enhance its accuracy.
Another attempt to enhance the DGA interpretation accuracy is presented in [26], in which 386 oil samples were used to validate the proposed interpretation approach. However, the proposed technique relies on the ratio of 5 gases with respect to total combustible gases without taking into account the history of previous DGA data. Also, the accuracy of the proposed technique has not been widely confirmed due to the lack of data it was verified against. A particle swarm optimization technique is presented in [27] to classify various faults within power transformers based on DGA results. While the technique revealed good accuracy, its practical application may not be an easy task, in particular for online DGA sensors. In [28], IEC ratio method is used to train a deep belief network in order to enhance the accuracy of the DGA interpretation. However, as a ratio-based method, the accuracy of the proposed model to detect incipient faults cannot be guaranteed. Transformer insulation health index is quantified in [29] based on DGA data and other oil quality factors without investigating various DGA interpretation techniques. While an adaptive neuro fuzzy inference system for DGA interpretation is presented in [30] that facilitate adaptive learning, the model is developed based on ratio methods only which makes the model suitable to identify faults with significant amount of gases used in such ratios with limited accuracy in identifying incipient faults with minimum fault gas concentration.
In this paper, a new expert system that takes the gas evolution rate into account and has the ability of learning and tuning is introduced. This expert system is based on Gene Expression Programming as briefly explained below.
2. Gene Expression Programming
Gene Expression Programming (GEP) is a learning technique that can find relationships between variables and builds mathematical models revealing these relationships [31,32,33,34,35]. Like genetic algorithm (GA) and genetic programming (GP), GEP selects populations of individuals based on their fitness and presents genetic variation using one or more operator. However, the nature of individuals is different in the three mentioned algorithms. While the individuals in GA are of linear strings of fixed length (chromosomes), they are of nonlinear entities of different sizes and shapes (expression tree) in GP. On the other hand, the individuals in GEP are encoded as linear strings of fixed length expressed as nonlinear entities of different sizes and shapes. Hence, GEP comprises the key features of the GA and GP. The main feature of GEP is the ability of formulating a mathematical expression between the dependent and independent variables that performs well for all fitness cases. The GEP process as shown in the flowchart of Figure 1 starts by creating a random generation of the chromosomes after which the fitness of each individual is evaluated. The chromosomes are modified through genetic operations (mutation, gene recombination, and transposition) to create a new generation. The process is continued until a termination criteria; number of generations or least error is obtained. The gene in GEP comprises head and tail. While the length of the head is selected based on the investigated problem, the length of the tail depends on the length of the head and the number of independent variables in the investigated problem.
3. Proposed GEP Model
To establish a general DGA interpretation model, all possible transformer faults along with the current conventional interpretation techniques are integrated as shown in Table 2. In this Table, F2 represents thermal fault of various temperature ranges as per the codes of the five conventional interpretation techniques shown in the Table. On the other hand F3 represents partial discharge and F4 is for arcing fault. The model is designed to provide a health index (h) between 2 and 8 that represents the three faults listed in Table 2. A value between 0 and 2 is reserved for normal transformer operation and is designated as F1 while F5 is assigned for invalid code in case of ratio methods (IEC, Roger and, Doerenburg).
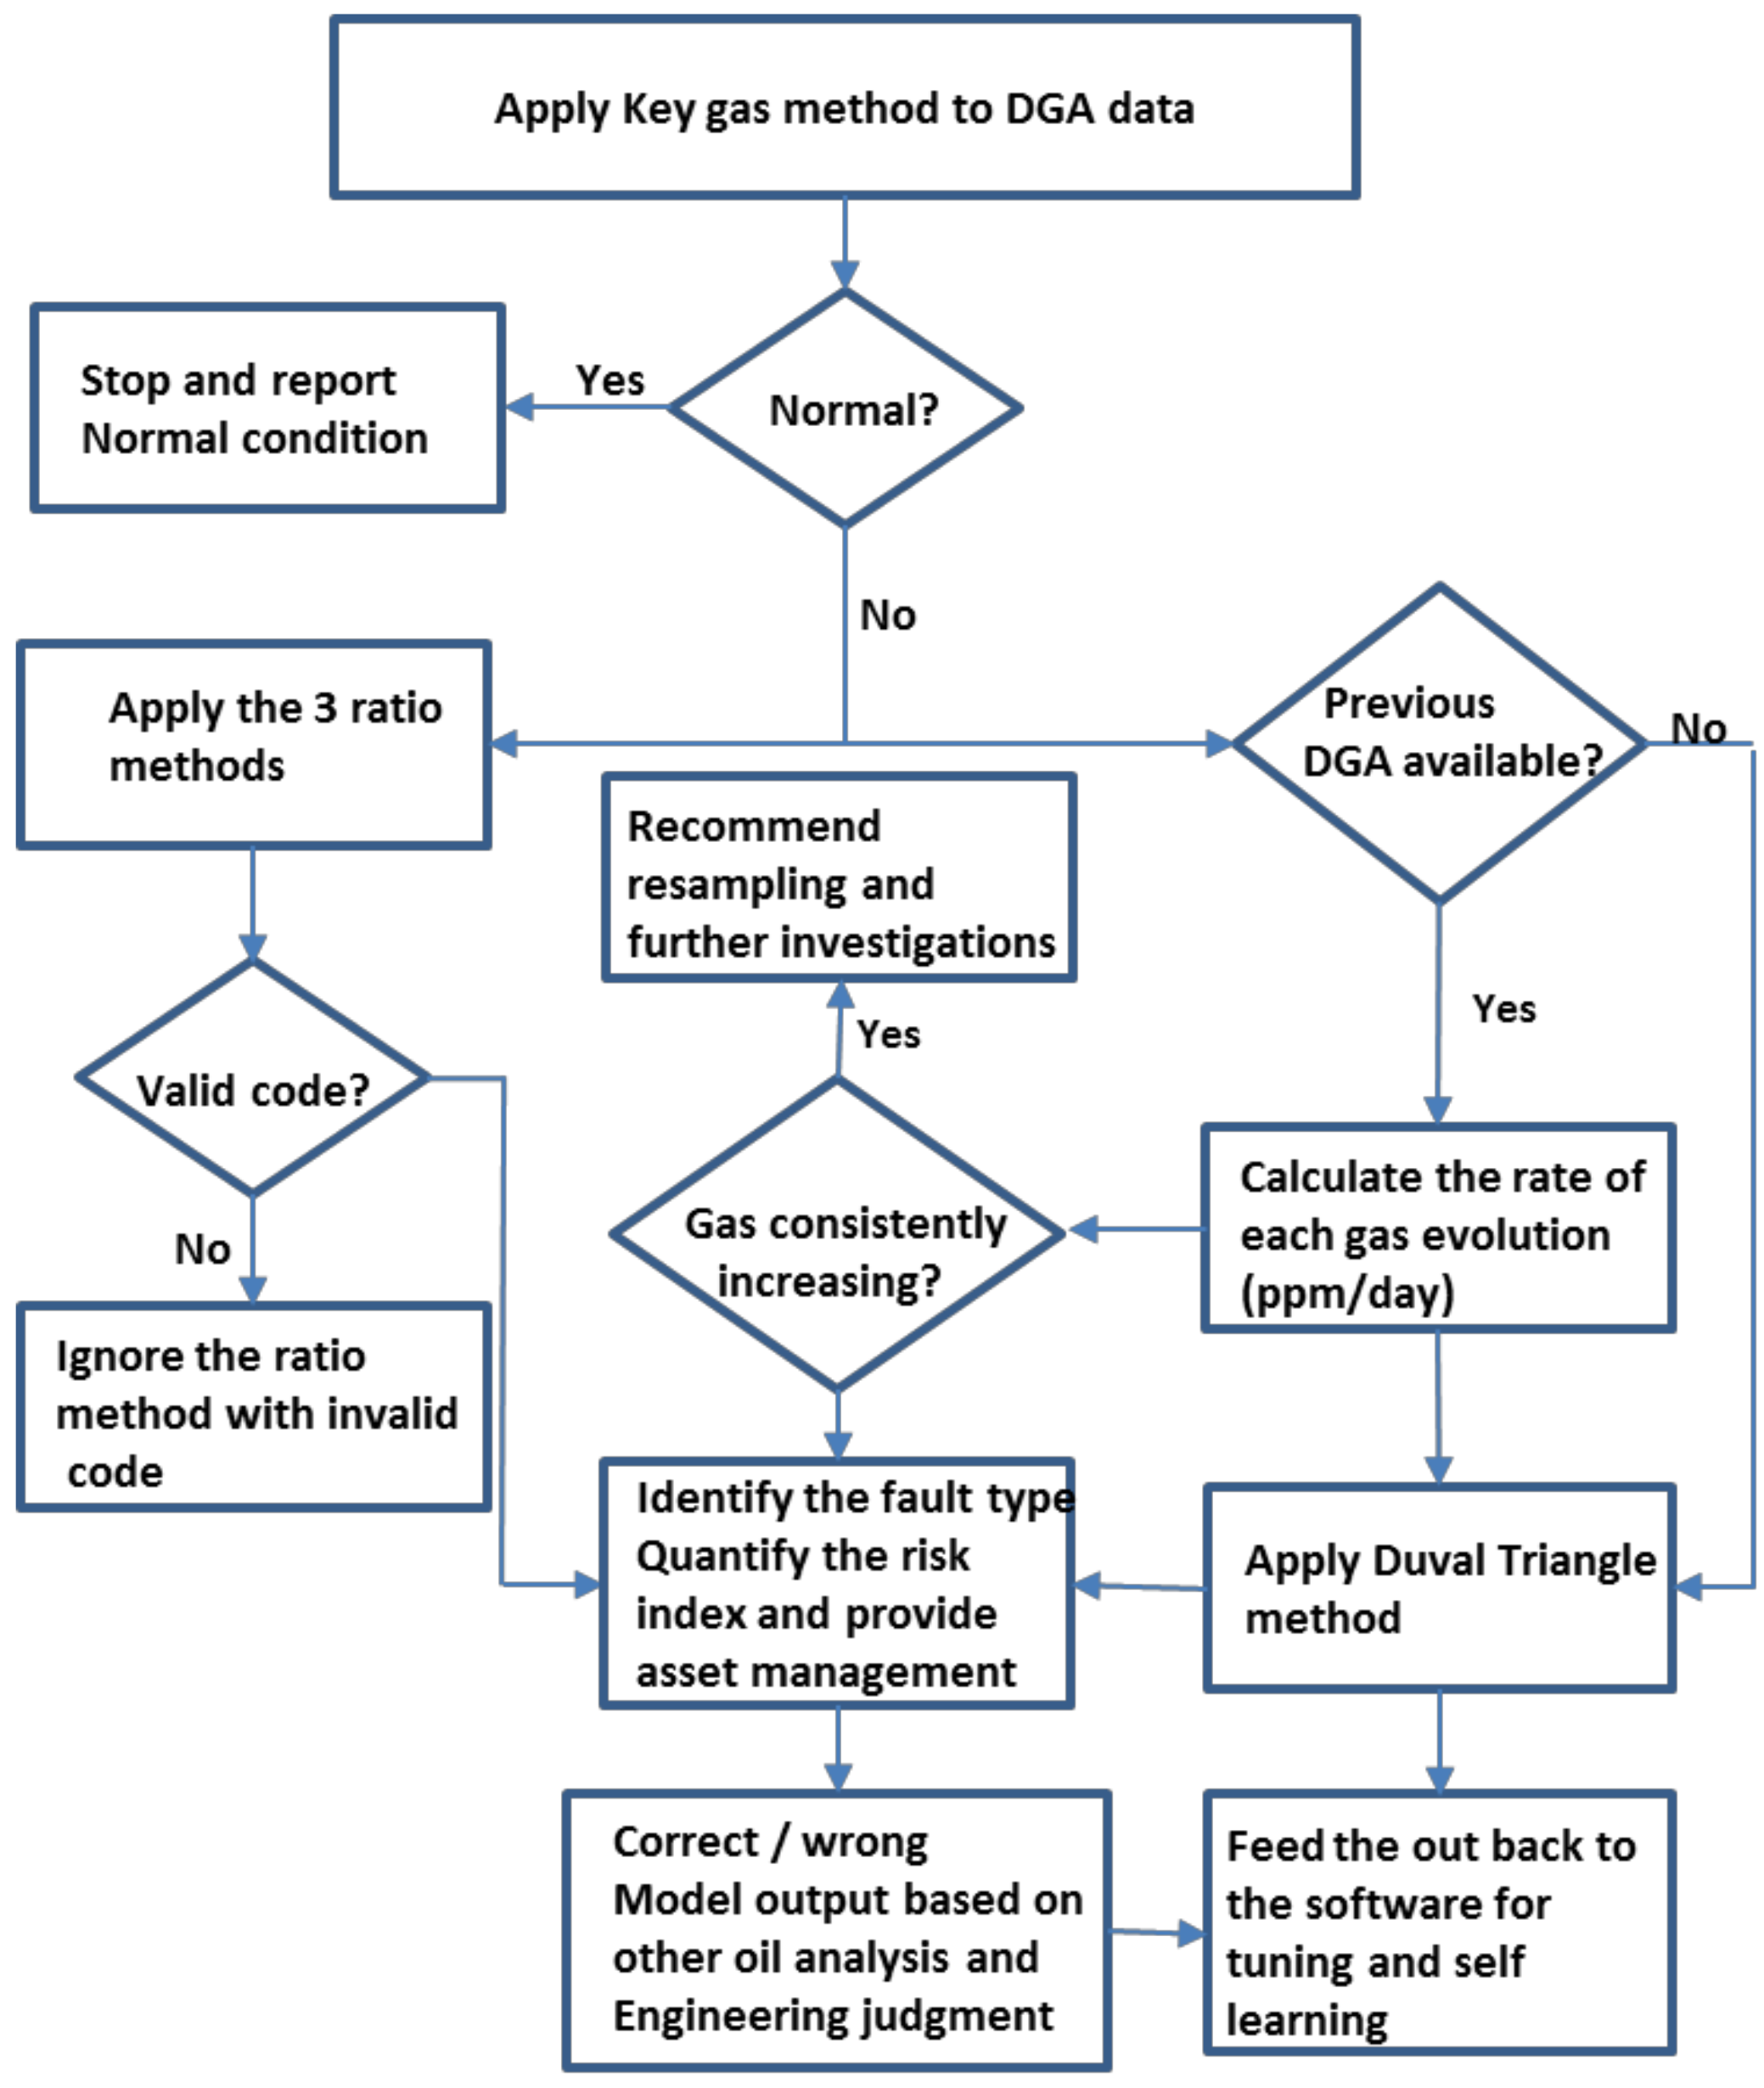
As stated above, there is no 100% consistency among the existing DGA interpretation techniques. The proposed approach in [19], did not take into account the rate of gas evolution, self-tuning of the developed rules based on the model’s output and for some DGA samples, the degree of criticality is not correctly reflected. To overcome these limitations, this approach is amended to the one shown in Figure 2. In the revised approach, the process starts by applying the key gas method to the measured DGA data. As key gas is the most conservative method among all existing interpretation techniques, the model reports normal analysis without any further investigations for oil samples comprising gases concentration less than condition 1 specified by the standards of this method [3]. On the other hand, if the key gas method detects abnormal analysis, the model performs further investigations on the same DGA oil sample using Duval triangle and the three ratio-based methods. Where previous DGA data for the same transformer are available, the rate of gas evolution is calculated by the model and is used in Duval triangle analysis instead of the absolute DGA measurements. Availability of the rate of gas evolution facilitates a proper asset management decision by the model. If any ratio-based method results in out-of-code value, the model eliminates its contribution to the final decision. The overall model output is identified based on the same weights provided in [19] however, these weights can be continuously adapted based on the results of the model that are to be stored and assessed against further oil analysis along with engineering judgment. The model also provides a more reliable health index of which fault type and a proper asset management decision can be identified as proposed in Table 3.
It is to be noted that while [36] presented an application for GEP to ease the DGA interpretation process, the proposed model did not combine all conventional techniques in one equation based on their accuracy levels. Also, the transformer health index based on the proposed model is not provided. Furthermore, in the aforementioned paper normal state is identified based on the IEC ratio method. It is well known that all ratio methods (including IEC) are not suitable to identify normal condition as these methods are only valid when a significant amount of the gases used in the proposed ratios exist in the oil sample which makes them suitable for quantifying the fault type rather than identifying it.
Input variables to the proposed model are the concentration of the seven key gases in parts per million (ppm) and the output is divided into 4 sets including all health conditions that operating transformers may exhibit as summarized in Table 2 and Table 3. To investigate whether thermal fault involving cellulose or not, the ratio CO2/CO is used. Although CO and CO2 can be found at normal condition due to atmospheric leak or as a result of oil long term oxidation which makes this ratio not a reliable indicator for paper degradation, it can be used as a flagship for further paper investigations and testing such as furan analysis and degree of polymerization. GEP is used to build models for the most popular DGA interpretation techniques that include key gas method, Roger, Doerenburg and IEC ratio methods and Duval triangle method. The individual outputs of these methods are weighted in accordance to [19] to calculate one health index between 0 and 8 as stated in Table 2.
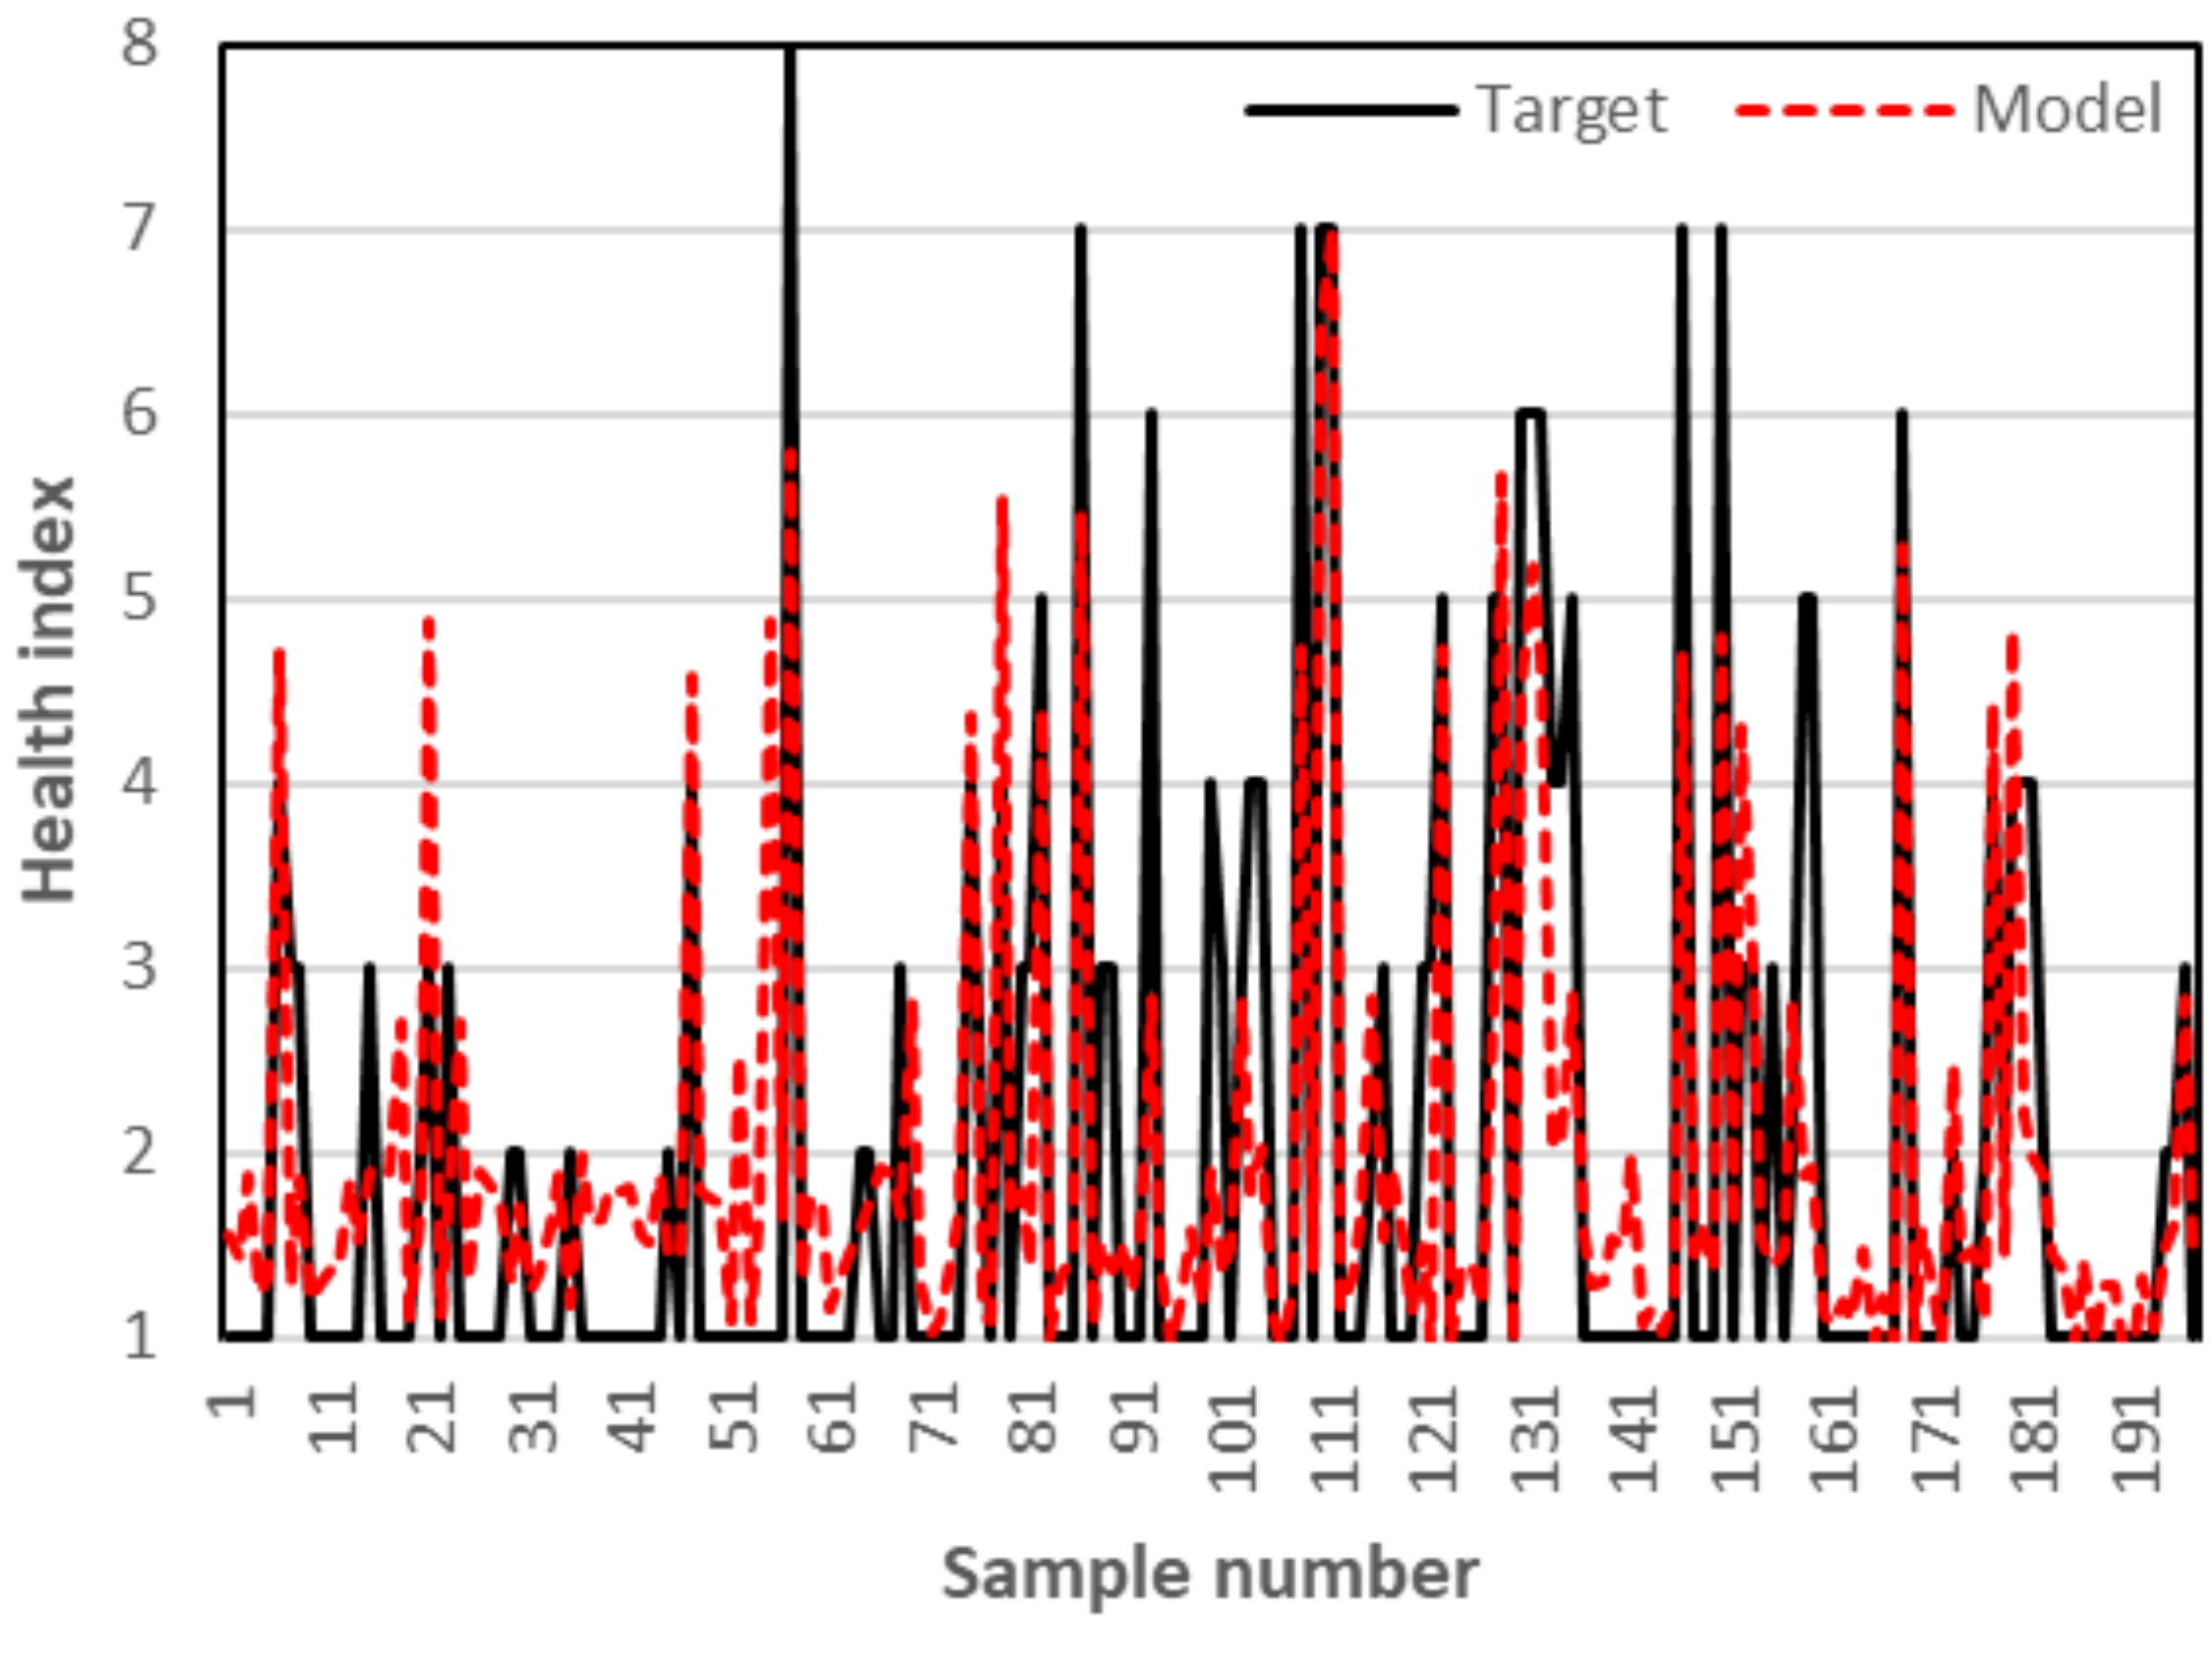
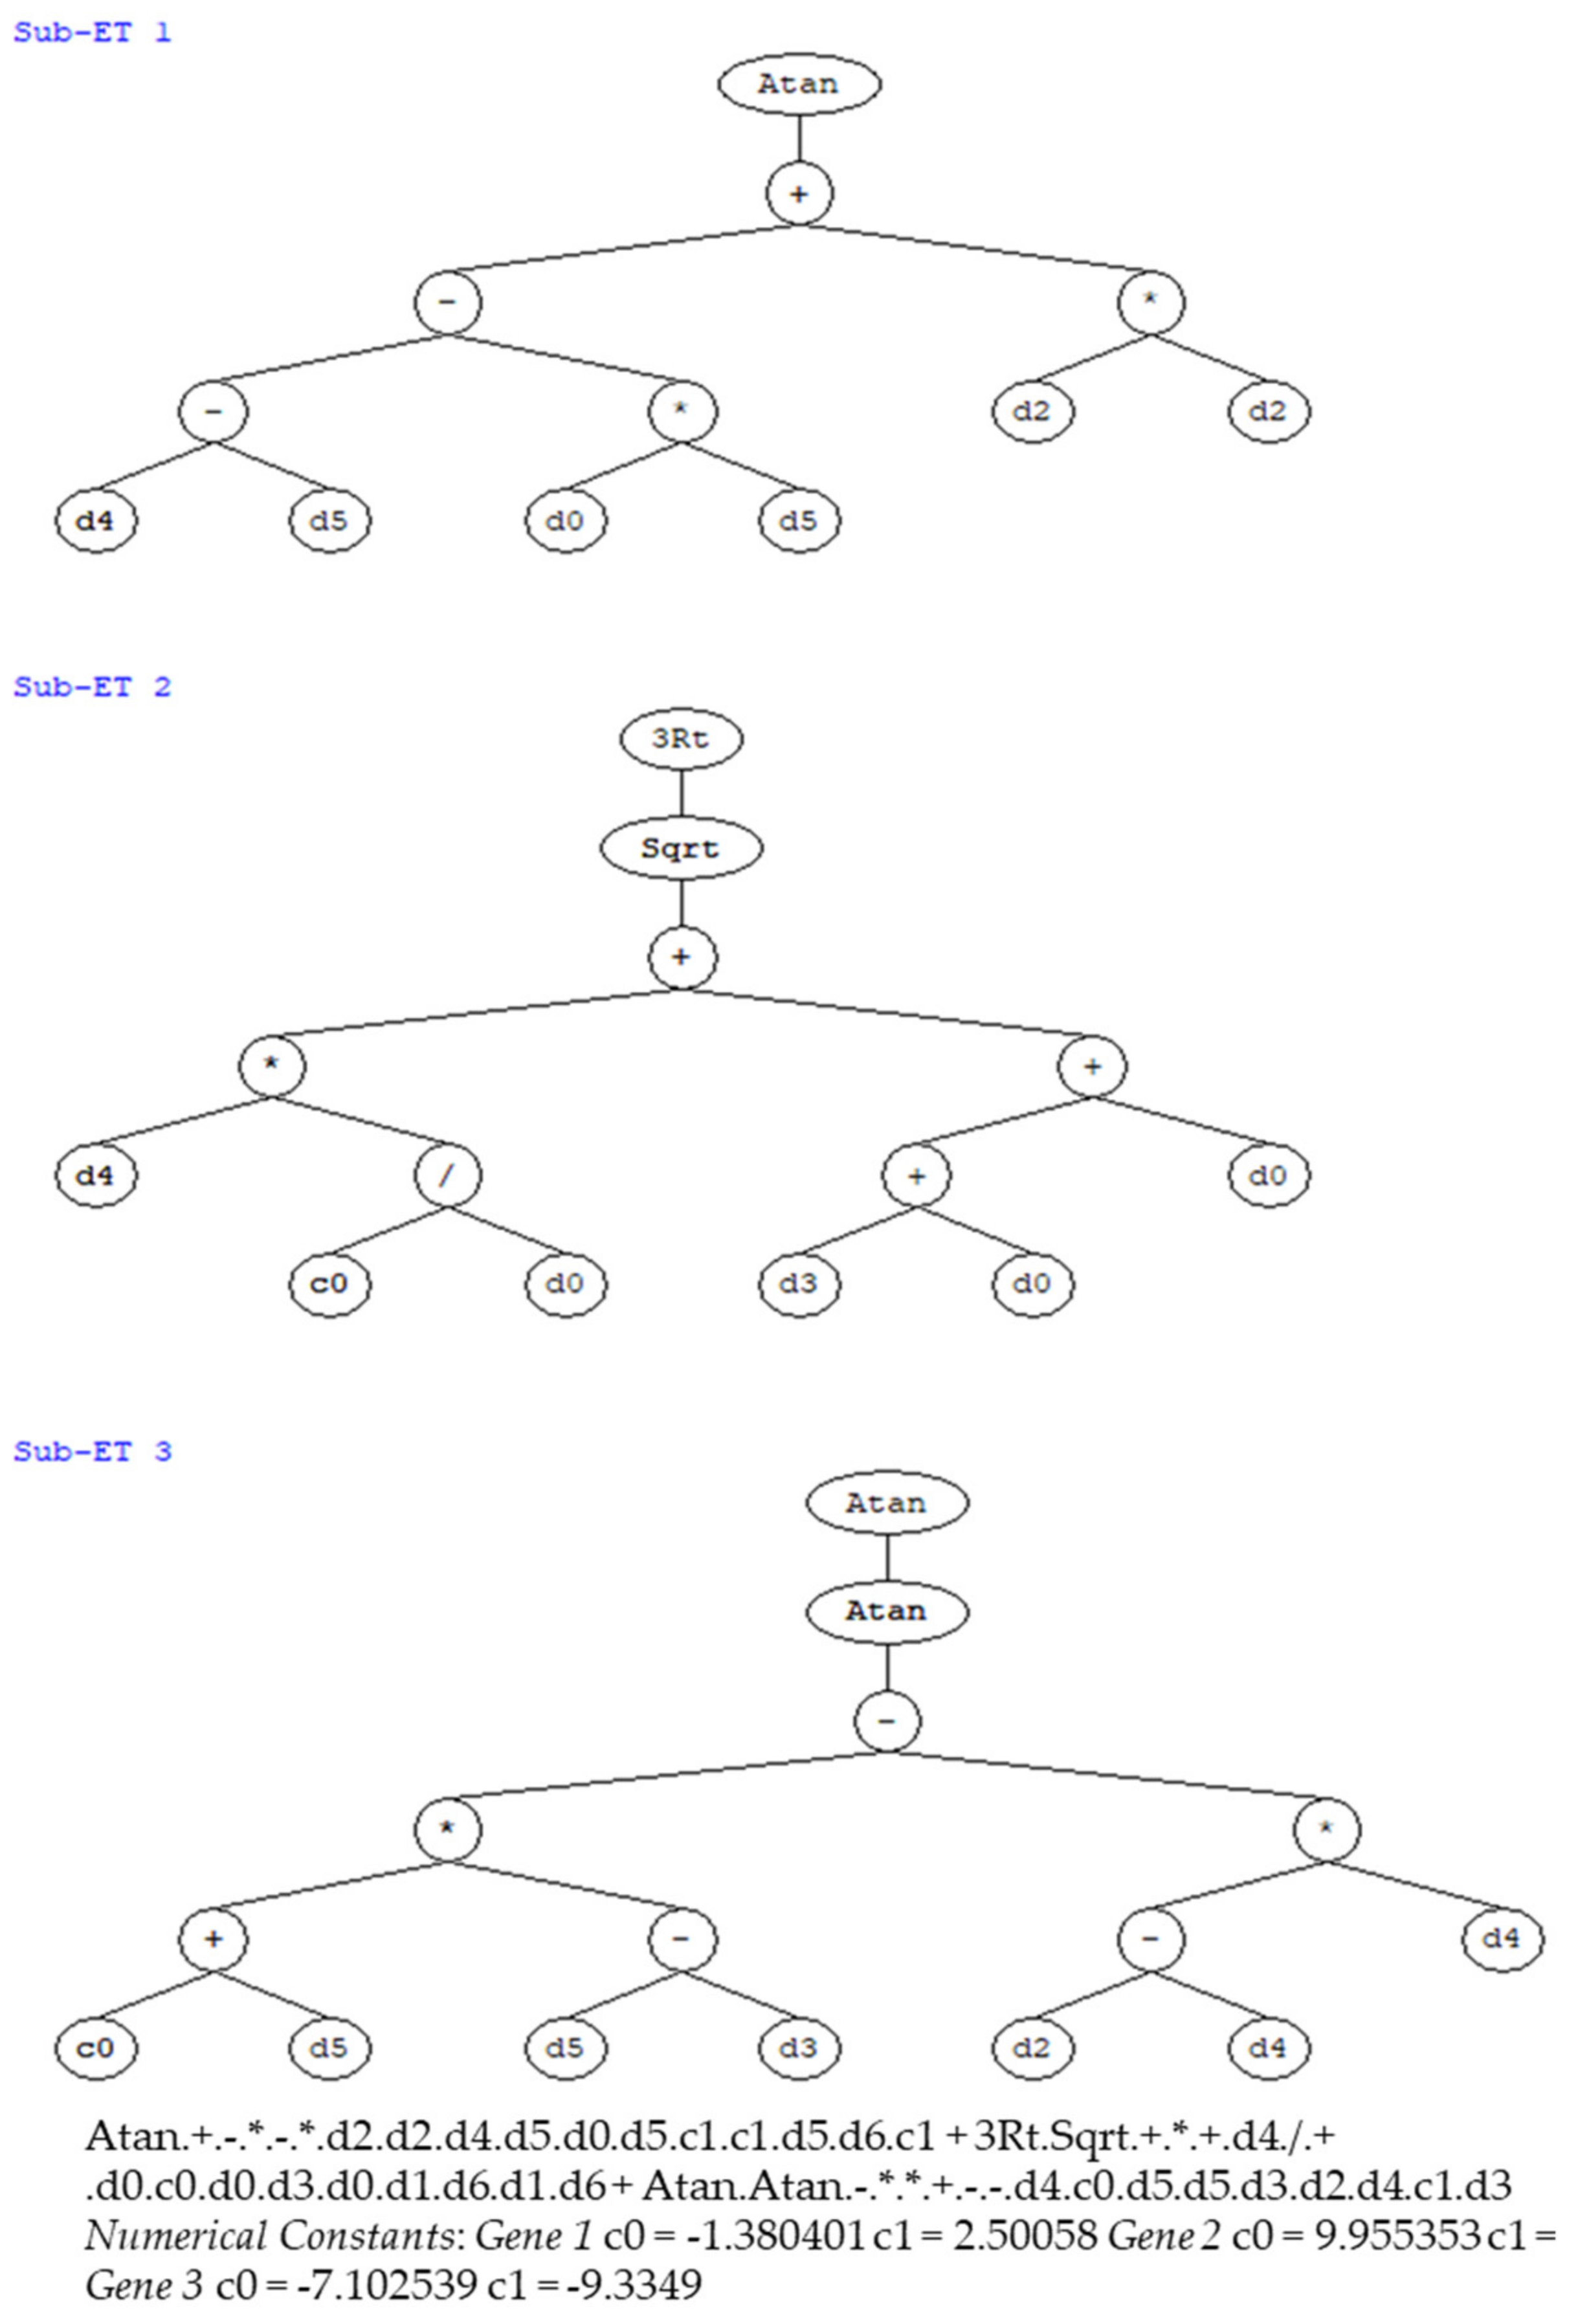
All models are developed based on the method’s guidelines and standards. 660 DGA sample data were collected from various operating transformers under different operating, age and health conditions. The health condition of each transformer was confirmed through engineering judgement along with other complimentary testing such as partial discharge, Furan contents, dielectric dissipation factor, moisture contents and frequency response analysis [37]. 70% of the collected data were used to train the proposed GEP model that was developed as per the flow chart in Figure 2. The remaining 30% of the collected data were used to validate the model. Figure 3 shows the health index returned by the model along with the actual health index calculated based on practical confirmed faults for 198 DGA samples used during the validation stage. The root square error between transformer health index calculated by the model and the actual health index is 0.38 with a correlation coefficient of 0.8 which reveals a satisfactory performance for the developed model. The main feature of the GEP model is its ability to retune in order to increase its accuracy and its capability to estimate a mathematical correlation between the dependent and independent variables which is an advantage for practical applications. Figure 4 shows the genes along with the expression tree of the proposed GEP model. In the generated genes and expression tree, parameters from d0 to d6 represent the input 7 key gases to the model (CH4, C2H4, C2H2, C2H6, H2, CO2, CO) while c0 and c1 are constants generated by the model. It is to be noted that the functions used in the expression tree are user-defined functions and can be changed based on the nature of the investigated problem. In the model shown in Figure 4 functions such as arctangent (Atan), cube root (3RT), square root (sqrt) along with mathematical operations; addition (+), subtraction (−), division (/) and multiplication (*) are selected to define the mathematical correlation between dependent and independent variables. The expression tree shown in Figure 4 is read similar to a text from top to bottom left to right to generate the corresponding mathematical relationship.
4. Results and Discussions
The model is tested with DGA results of H2 (75 ppm), CH4 (87 ppm), C2H6 (58 ppm), C2H4 (40 ppm), C2H2 (10 ppm), CO (260 ppm), CO2 (950 ppm) as detected in a transformer oil sample using DGA measurements. As the amount of all key gases and the total dissolved combustible gas are within condition-1 of the IEEE standard [13], the model overall output is only based on the key gas method as per the flow chart in Figure 2. Thus, the model reflects a health index h=1 i.e., normal condition.
The model output is h = 7 for inputs H2 (15 ppm), CH4 (335 ppm), C2H6 (15 ppm), C2H4 (13 ppm), C2H2 (120 ppm), CO (53 ppm), CO2 (950 ppm). This high criticality is owing to the high amount of C2H2.
For inputs H2 (15 ppm), CH4 (650 ppm), C2H6 (480 ppm), C2H4 (890 ppm), C2H2 (12 ppm), CO (240 ppm), CO2 (3015 ppm), the model provides a health index of 5.8 which is attributed to the high concentration of CH4 and C2H4.
For DGA sample of H2 (410 ppm), CH4 (350 ppm), C2H6 (70 ppm), C2H4 (130 ppm), C2H2 (27 ppm), CO (170 ppm), CO2 (940 ppm), the model provides a health index of 4.5 due to the high values of the hydrocarbon gases. The CO2/CO ratio also indicates cellulose degradation.
4.1. Comparison with Other AI-based Models
As mentioned in the introduction section, a fuzzy logic-based DGA interpretation model is presented in [19]. While this model integrates all conventional DGA interpretation techniques based on pre-specified weighting factors, the model does not take into account the evolution rate of the individual gases nor the dynamic change in weighting factors and adaptive learning of the model. To assess the robustness of the new GEP-based model proposed in this paper, DGA data in [19] are re-assessed using the developed GEP model and compared with the fuzzy logic results of [19] as listed in Table 4.
In Table 4, the first 3 samples show normal condition because the concentration of all key gases in these samples is below the fault limit of key gas method. Hence both models result in “no fault” condition and the GEP provides a health index of 1. Samples 4, 5 and 6 comprise high concentration of C2H4 and CH4 which reflects a thermal fault. Both models result in “thermal fault” and the GEP model indicates a health index between 2 and 4 for the three samples. The high concentration of C2H2 in samples 7, 8 and 9 indicates arcing fault. The two models outputs coincide with this analysis. Depends on the severity of fault, the GEP model provides a health index ranges between 6 and 8 for these three samples. According to Table 3, these units should be taken out of service for further investigation for the source of arcing. The high concentration of H2 in DGA samples 10 and 12 in Table 4 indicates low energy discharge (corona) that both models result in. While the output of the fuzzy-logic-based model in [19] reflects corona fault for DGA sample 11, the GEP model results in arcing fault. This is attributed to the considerable amount of C2H2 in this oil sample.
To compare the proposed model with other artificial intelligent (AI)-based models published in the literature, DGA results in [38] have been re-assessed using the proposed GEP model. In [38], 10 DGA samples are assessed using four AI-based models namely; artificial neural network (ANN), support vector machine (SVM), extreme learning machine (ELM) and self-adaptive evolutionary extreme learning machine (SaE-ELM). The authors in [38] divided possible faults into partial discharge (PD), discharges of low energy (D1), discharges of high energy (D2), thermal fault less than 300 °C (T1), thermal fault between 300 °C and 700 °C (T2) and thermal fault higher than 700 °C (T3). Table 5 shows the results of the 10 investigated DGA samples as published in [38] along with the result of the GEP model proposed in this paper.
While other models show faulty cases for DGA samples 1, 3, 6 and 8, the proposed GEP model results in “no fault”. This is attributed to the fact that the concentration of the key gases of these samples are below the maximum normal limits provided in the key gas analysis standard. While other models reflected thermal fault for samples 2, 4, 7 and 10, the GEP model suggests a corona fault due to the high concentration of H2 in such samples. Due to the relatively high concentration of C2H4 in sample 5, all models including GEP suggest thermal fault. Sample 9 comprises high concentration of all gases except C2H2 which reveal thermal fault along with high energy discharge. All models in [38] result in thermal fault and the proposed GEP model indicates high energy discharge.
4.2. Evaluation of the Model on Units with DGA History
The trend of gases evolution is investigated for some transformers with DGA history. Some of these results are presented below.
DGA samples were collected yearly for a 28 MVA, 11/34.7 kV power transformer. Results during the period 2013 to 2016 are shown in Table 6 (all gases concentrations are in ppm). The increment increase in H2 and CO2 indicate thermal fault involving cellulose. The GEP model results in 4.5 health index for such transformer. More frequent DGA samples are recommended and further oil assessment should be conducted.
Due to the high concentration of H2 in the first DGA sample of another power transformer shown in Table 7, it was recommended to observe the gas evolution based on weekly samples and degas the oil. After 4 weeks all key gas concentrations indicated normal operation as can be seen from sample 5 in the table. GEP model reflected a health index of 0.5 for such transformer.
While the CO2/CO in the DGA samples collected for a third power transformer (Table 8) indicates normal cellulose aging, the trend increase in H2 indicates low energy electrical discharge and the GEP model provided a health index of 4 for such transformer.
4.3. Advantage of the Proposed Model Over Conventional Interpretation Techniques
To confirm that DGA is not an exact science and conventional interpretation techniques may lead to different outcomes for the same oil sample, some DGA data are listed in Table 9 with the type of fault revealed by the five conventional interpretation methods along with the fault type suggested by the GEP model.
The first 3 samples in Table 9 indicate normal operation by the key gas method. Other ratio-based methods indicate either out-of-code or false interpretation. According to the flow chart in Figure 2, the output of the GEP model will be only based on the key gas method and hence provides normal operation for these three samples. It is to be noted that the CO2/CO ratio depends on the individual concentration of the two gases and is significant when the concentration of CO2 and CO becomes considerable. For example sample 3 in Table 9 indicates a ratio of 0.2 however, individual concentration of both gases is not significant and hence normal operation can be confirmed. On the other hand while the CO2/CO ratio in samples 1 and 2 is above 10, the high concentration of both gases should be investigated and furan analysis is recommended.
The high concentration of the H2 in samples 4 indicates partial discharge activity. The high concentration of CO and CO2 in this sample may be an indication for paper degradation even though their ratio is far above 10. The developed GEP model integrates the results of the conventional techniques based on their accuracy levels to provide an overall result (F3). As indicated in the flow chart of Figure 2, in case of out-of-code result for a ratio-based method (e.g., IEC in this case), its contribution to the overall result is eliminated.
The high concentration of C2H2 in sample 5 reflects an arcing fault which was resulted by 3 conventional techniques along with the developed GEP model.
While the above results show a good performance for the developed GEP model, there is uncertainty of the health index reflected by the model. Also, accuracy of the model in detecting multiple faults is limited. These limitations can be improved through training the model using wide range of DGA data covering all types of faults. Also, as the model was built based on the weights published in [19], the accuracy may be improved by adapting these weights using more DGA results.
5. Conclusions
This paper presents a gene expression programming-based model to analyze the dissolved gas analysis data. The developed model takes into account the history of the transformer DGA and is easy to adapt based on the obtained results. While the model shows satisfactory performance, its accuracy can be improved further by considering more DGA samples. The implemented model reflects a general health condition of the investigated DGA sample using five interpretation techniques that are combined using specific weighting factors calculated based on a consistency analysis performed on collect DGA samples from operating power transformers. These weighting factors are not stationary and can be adapted through more DGA results. The developed model is easy to implement within existing online DGA sensors to automate and standardize the interpretation process of the measured characteristic gases.
Funding
This research received no external funding.
Conflicts of Interest
The author declares no conflict of interest.
References
- Abu Bakar, N.; Abu-Siada, A.; Islam, S. A Review of DGA Measurement and Interpretation Techniques. IEEE Electr. Insul. Mag. 2014, 30, 39–49. [Google Scholar] [CrossRef]
- Abu Bakar, N.; Abu-Siada, A.; Islam, S. A Review on Chemical Diagnosis Techniques for Transformer Paper Insulation Degradation. In Proceedings of the Australasian Universities Power Engineering Conference, AUPEC’13, Hobart, Australia, 29 September–3 October 2013. [Google Scholar]
- Guide for Diagnostic Field Testing of Electric Power Apparatus—Part 1, Oil-Filled Power Transformers, Regulators, and Reactors; IEEE: Piscataway, NJ, USA, 1995; Volume 62.
- Abu Bakar, N.; Abu-Siada, A. A New Method to Detect Dissolved Gases in Transformer Oil using NIR-IR Spectroscopy. IEEE Trans. Dielectr. Electr. Insul. 2017, 24, 409–419. [Google Scholar] [CrossRef]
- Hydroelectric Research and Technical Services Group. Facilities, Illustrations, Standards and Techniques; Transformer Maintenanc; US Department of Interior Bureau of Reclamation: Denver, CO, USA, 2000; Volume 3, pp. 1–81. [Google Scholar]
- IEEE Guide for the Interpretation of Gases Generated in Oil-Immersed Transformers; IEEE Std C57; 104-2008 (Revision of IEEE Std C57.104-1991); IEEE: Piscataway, NJ, USA, 2009; pp. 1–27.
- Abu-Siada, A.; Sin, P.; Islam, S. A Novel Fuzzy Logic Approach for Furan Estimation in Transformer Oil. IEEE Trans. Power Deliv. 2012, 27, 469–474. [Google Scholar] [CrossRef]
- Abu Bakar, N.; Abu-Siada, A. Fuzzy Logic Approach for Transformer Remnant Life Prediction and Asset Management Decision. IEEE Trans. Dielectr. Electr. Insul. 2016, 23, 3199–3208. [Google Scholar] [CrossRef]
- Abu-Siada, A.; Islam, S.; Lai, S. Remnant Life Estimation of Power Transformer using Oil UV-Vis Spectral Response. In Proceedings of the IEEE PES Power Systems Conference & Exhibition (PSCE), Seattle, WA, USA, 15–20 March 2009. [Google Scholar]
- Hashemnia, N.; Abu-Siada, A.; Islam, S. Detection of Power Transformer Bushing Faults and Oil Degradation using Frequency Response Analysis. IEEE Trans. Dielectr. Electr. Insul. 2016, 23, 222–229. [Google Scholar] [CrossRef]
- Forouhari, S.; Abu-Siada, A. Application of Adaptive Neuro Fuzzy Inference System to Support Power Transformer Life Estimation and Asset Management Decision. IEEE Trans. Dielectr. Electr. Insul. 2018, 25, 845–852. [Google Scholar] [CrossRef]
- Hydroelectric Research and Technical Services Group. Facilities, Instructions, Standards and Techniques; Transformer Diagnostics; US Department of Interior Bureau of Reclamation: Denver, CO, USA, 2003; Volume 3, pp. 1–63. Available online: https://www.usbr.gov/power/data/fist/fist3_31/fist3-31.pdf (accessed on 21 February 2019).
- Rogers, R. IEEE and IEC Codes to Interpret Incipient Faults in Transformers, Using Gas in Oil Analysis. IEEE Trans. Electr. Insul. 1978, E-13, 349–354. [Google Scholar] [CrossRef]
- Mineral Oil-Impregnated Electrical Equipment in Service-Interpretation of Dissolved and Free Gas Analysis; IEC 60599; International Electrotechnical Commission: Geneva, Switzerland, 1997.
- Duval, M. New techniques for dissolved gas-in-oil analysis. IEEE Electr. Insul. Mag. 2003, 19, 6–15. [Google Scholar] [CrossRef]
- Muhamad, N.; Phung, B.; Blackburn, T. Comparative study and analysis of DGA methods for mineral oil using fuzzy logic. In Proceedings of the International Power Engineering Conference, IPEC 2007, Singapore, 3–6 December 2007; pp. 1301–1306. [Google Scholar]
- Duval, M. The duval triangle for load tap changers, non-mineral oils and low temperature faults in transformers. IEEE Electr. Insul. Mag. 2008, 24, 22–29. [Google Scholar] [CrossRef]
- Abu-Siada, A.; Hamood, S. A New Fuzzy Logic Approach to Identify Power Transformer Criticality using Dissolved Gas-in-Oil Analysis. Int. J. Electr. Power Energy Syst. 2015, 67, 401–408. [Google Scholar] [CrossRef]
- Abu-Siada, A.; Islam, S. A Novel Approach to Identify Transformer Criticality using DGA. In Proceedings of the Condition Monitoring and Diagnosis, CMD 2010, Tokyo, Japan, 6–11 September 2010. [Google Scholar]
- Abu-Siada, A.; Hmood, S. Fuzzy Logic Approach for Power Transformer Asset Management Based on Dissolved Gas-in-Oil Analysis. Chem. Eng. Trans. 2013, 33, 997–1002. [Google Scholar]
- Abu-Siada, A.; Islam, S. A New Approach to Identify Transformer Criticality and Asset Management Decision using Dissolved Gas Analysis. IEEE Trans. Dielectr. Electr. Insul. 2012, 19, 1007–1012. [Google Scholar] [CrossRef]
- Zhenyuan, W.; Yilu, L.; Griffin, P.J. Neural net and expert system diagnose transformer faults. IEEE Comput. Appl. Power 2000, 13, 50–55. [Google Scholar] [CrossRef]
- Abu-Siada, A.; Arshad, M.; Islam, S. Fuzzy Logic Approach to Identify Transformer Criticality using Dissolved Gas Analysis. In Proceedings of the IEEE PES General Meeting, Detroit, MI, USA, 24–29 July 2010. [Google Scholar]
- Hongzhong, M.; Zheng, L.; Ju, P.; Jingdong, H.; Limin, Z. Diagnosis of power transformer faults on fuzzy three-ratio method. In Proceedings of the 7th International Power Engineering Conference, Singapore, 29 November–2 December 2005; pp. 1–4. [Google Scholar]
- Islam, S.; Wu, T.; Ledwich, G. A novel fuzzy logic approach to transformer fault diagnosis. IEEE Trans. Dielectr. Electr. Insul. 2000, 7, 177–186. [Google Scholar] [CrossRef]
- Ghoneim, S.; Taha, I. A new approach of DGA interpretation technique for transformer fault diagnosis. Int. J. Electr. Power Energy Syst. 2016, 81, 265–274. [Google Scholar] [CrossRef]
- Peimankar, A.; Weddell, S.; Jalal, T.; Lapthorn, A. Evolutionary multi-objective fault diagnosis of power transformers. Swarm Evol. Comput. 2017, 3, 62–75. [Google Scholar] [CrossRef]
- Dai, J.; Song, H.; Sheng, G.; Jiang, X. Dissolved gas analysis of insulating oil for power transformer fault diagnosis with deep belief network. IEEE Trans. Dielectr. Electr. Insul. 2017, 24, 2828–2835. [Google Scholar] [CrossRef]
- Ashkezari, A.; Ma, H.; Saha, T.; Ekanayake, C. Application of fuzzy support vector machine for determining the health index of the insulation system of in-service power transformers. IEEE Trans. Dielectr. Electr. Insul. 2013, 20, 965–973. [Google Scholar] [CrossRef]
- Khan, S.; Equbal, M.; Islam, T. A comprehensive comparative study of DGA based transformer fault diagnosis using fuzzy logic and ANFIS models. IEEE Trans. Dielectr. Electr. Insul. 2015, 22, 590–596. [Google Scholar] [CrossRef]
- Zhaohui, G.; Gaobin, L.; Zhenkun, Y.; Min, J. Automatic Modeling of Complex Functions with Clonal Selection-Based Gene Expression Programming. In Proceedings of the 3rd International Conference on Natural Computation (ICNC), Hainan, China, 24–27 August 2007; pp. 228–232. [Google Scholar]
- Ferreira, C. Gene Expression Programming: A New Adaptive Algorithm for solving Problems. Complex Syst. 2001, 13, 87–129. [Google Scholar]
- Ferreira, C. Gene Expression Programming: Mathematical Modelling by an Artificial Intelligence; Springer: Berlin/Heidelberg, Germany, 2006. [Google Scholar]
- Abu-Siada, A.; Islam, S.; Lai, S. A Novel Application of Gene Expression Programming in Transformer Diagnostics. In Proceedings of the AUPEC’08, Sydney, Australia, 14–17 December 2008. [Google Scholar]
- Abu-Siada, A. Correlation of furan concentration and spectral response of transformer oil-using expert systems. Sci. Meas. Technol. 2011, 5, 183–188. [Google Scholar] [CrossRef]
- Malik, H.; Mishra, S. Application of Gene Expression Programming (GEP) in Power Transformers Fault Diagnosis Using DGA. IEEE Trans. Ind. Appl. 2016, 52, 4556–4565. [Google Scholar] [CrossRef]
- Hashemnia, N.; Abu-Siada, A.; Masoum, M.; Islam, S. Characterization of Transformer FRA Signature under Various Winding Faults. In Proceedings of the Condition Monitoring and Diagnosis Conference, Bali, Indonesia, 23–27 September 2012. [Google Scholar]
- Li, S.; Wu, G.; Gao, B.; Hao, C.; Xin, D.; Yin, X. Interpretation of DGA for transformer fault diagnosis with complementary SaE-ELM and arctangent transform. IEEE Trans. Dielectr. Electr. Insul. 2016, 23, 586–595. [Google Scholar] [CrossRef]
Figure 1.
General Flowchart for GEP algorithm.

Figure 2.
Flow chart of the proposed DGA interpretation approach.

Figure 3.
Performance of the developed GEP model.

Figure 4.
Expression tree and genes for the proposed GEP model.


Table 1.
A comparison of the five DGA interpretation techniques.
| Method | Methodology, Pros and Cons | Detected Faults | Used Gases |
|---|---|---|---|
| Key gas | concentration of all 7 key gases is required, easy to implement, conservative. | partial discharge, arcing thermal faults. | CO, CO2, H2, CH4, C2H2, C2H4 and C2H6 |
| Duval Triangle | relies on graphical analysis, indicates detailed faults, does not comprise normal zone | partial discharge, low/high energy discharge, thermal faults at various temperatures | CH4, C2H2, and C2H4 |
| Doernenburg | employs 4 ratios, gases should meet minimum threshold limits, may lead to out-of-code result. | thermal decomposition, partial discharge, arcing | H2, CH4, C2H2, C2H4 and C2H6 |
| Rogers | uses 4 ratios that were modified to three ratios, gases used in the ratios should exceed a minimum level, may lead to out-of- code result. | partial discharge, arcing, thermal faults at various temperatures. | H2, CH4, C2H2, C2H4 and C2H6 |
| IEC | same three ratios as in the revised Roger method with different ratio ranges and interpretations, may lead to out-of-code result. | partial discharge, low/high energy discharge, thermal faults at various temperatures. | H2, CH4, C2H2, C2H4 and C2H6 |
Table 2.
Possible fault types within transformer oil samples.
| Method | F2 (2 < h < 4) Thermal Fault Oil/Cellulous | F3 (4 < h < 6) Electrical Fault (Corona) | F4 (6 < h < 8) Electrical Fault (Arcing) |
|---|---|---|---|
| Roger | Thermal fault <150 °C; 150–300 °C; 300–700 °C; >700 °C | Low energy electrical discharge | High energy electrical discharge |
| IEC | Thermal fault <150 °C; 150–300 °C; 300–700 °C; >700 °C | Low energy electrical discharge | High energy electrical discharge |
| Doeren. | Thermal decomposition | Partial discharge | Arcing |
| Duval | Thermal fault <300 °C; 300–700 °C; >700 °C | Low energy electrical discharge | High energy electrical discharge |
| Key gas | Thermal decomposition | Low energy electrical discharge | High energy electrical discharge |
| Principal gas | Oil (C2H4) Cellulose (CO) | H2 | C2H2 |
Table 3.
Model output health index and corresponding proposed asset management decision.
| Health Index | Fault Diagnosis | Asset Management Decision |
|---|---|---|
| 0 ≤ h < 2 | No fault. | Continue normal operation. |
| 2 ≤ h < 4 | Thermal fault within Cellulose and/or oil insulation. | Exercise caution. Reduce loading. Check gas generation rate monthly. |
| 4 ≤ h < 6 | Low energy discharge. Low temperature thermal fault. Cellulose insulation degradation. | Exercise caution. Furan analysis is recommended. Check gas generation rate monthly. |
| 6 ≤ h < 8 | High energy discharge. Medium to high temperature thermal fault. Cellulose insulation degradation. Winding circulating current. Significant cellulose degradation. Excessive oil decomposition. | Exercise extreme caution. Check gas generation rate weekly or daily. Reduce loading (below 50%). Further oil analysis must be conducted. Oil must be degassed/filtered. Plan for outage. |
Table 4.
Comparison of the GEP model with the fuzzy logic model in [19].
Table 4.
Comparison of the GEP model with the fuzzy logic model in [19].
| Samples | H2 | CH4 | C2H2 | C2H4 | C2H6 | CO | CO2 | Output of the Model in [21] | Output of GEP Model (h) |
|---|---|---|---|---|---|---|---|---|---|
| 1 | 2 | 7 | 0 | 0 | 0 | 0 | 132 | No fault | No fault (1) |
| 2 | 54 | 0 | 0 | 4 | 0 | 106 | 1303 | No fault | No fault (1) |
| 3 | 47 | 12 | 0 | 8 | 0 | 115 | 1113 | No fault | No fault (1) |
| 4 | 80 | 619 | 0 | 2480 | 326 | 268 | 2952 | Thermal | Thermal (3) |
| 5 | 231 | 3997 | 0 | 5584 | 1726 | 0 | 2194 | Thermal | Thermal (3.8) |
| 6 | 507 | 1053 | 17 | 1440 | 297 | 22 | 2562 | Thermal | Thermal (3.5) |
| 7 | 127 | 24 | 81 | 32 | 0 | 0 | 2024 | Arcing | Arcing (6.5) |
| 8 | 441 | 207 | 261 | 224 | 43 | 161 | 1123 | Arcing | Arcing (7.6) |
| 9 | 217 | 286 | 884 | 458 | 14 | 176 | 1544 | Arcing | Arcing (7.8) |
| 10 | 160 | 10 | 1 | 1 | 3 | - | - | Corona | Corona (4.1) |
| 11 | 240 | 20 | 96 | 28 | 5 | - | - | Corona | Arcing (6.4) |
| 12 | 2587 | 7.88 | 0 | 1.4 | 4.7 | - | - | Corona | Corona (4.3) |
Table 5.
Comparison of the GEP model with other AI-based models in [38].
Table 5.
Comparison of the GEP model with other AI-based models in [38].
| Sample Number | H2 | CH4 | C2H2 | C2H4 | C2H6 | Outcomes of Various AI-based Models | ||||
|---|---|---|---|---|---|---|---|---|---|---|
| ANN | SVM | ELM | SaE-ELM | GEP model (h) | ||||||
| 1 | 58 | 13.4 | 0.2 | 1.8 | 0.8 | D2 | D2 | D2 | D2 | No fault (1) |
| 2 | 103 | 5.8 | 0.7 | 7.3 | 5 | T1 | T3 | T1 | T1 | Corona (4) |
| 3 | 45 | 29 | 0 | 15.7 | 8 | D1 | D1 | D1 | D1 | No fault (1) |
| 4 | 416 | 21 | 1 | 43.1 | 10.5 | T1 | T3 | T1 | T3 | Corona (4.3) |
| 5 | 59 | 53 | 0.8 | 60.3 | 17.7 | T2 | T2 | T2 | T2 | Thermal (2.5) |
| 6 | 10.5 | 4.8 | 2.2 | 4.8 | 5 | D1 | D1 | D1 | D1 | No fault (1) |
| 7 | 137 | 97 | 1.5 | 29 | 12 | T2 | T2 | T2 | T2 | Corona (4.1) |
| 8 | 89 | 73 | 5 | 6.8 | 6 | D2 | D2 | D2 | D2 | No fault (1) |
| 9 | 240 | 157 | 0.8 | 127 | 98 | T2 | T2 | T2 | T2 | High energy discharge (6) |
| 10 | 116 | 104 | 0 | 51 | 36 | T2 | T2 | T2 | T2 | Corona (4.1) |
Table 6.
DGA history of transformer 1.
| Gas | Sample 1 | Sample 2 | Sample 3 | Sample 4 | Sample 5 |
|---|---|---|---|---|---|
| H2 | 296 | 110 | 444 | 1893 | 3894 |
| CH4 | 2 | 4 | 3 | 5 | 8 |
| C2H6 | 1 | 1 | 2 | 2 | 2 |
| C2H4 | 1 | 1 | 3 | 3 | 2 |
| C2H2 | <1 | <1 | <1 | <1 | <1 |
| CO | 183 | 243 | 318 | 359 | 377 |
| CO2 | 2257 | 3741 | 3826 | 4760 | 5310 |
Table 7.
DGA history of transformer 2.
| Gas | Sample 1 | Sample 2 | Sample 3 | Sample 4 | Sample 5 |
|---|---|---|---|---|---|
| H2 | 1975 | 2931 | 1614 | 1904 | <5 |
| CH4 | 7 | 7 | 6 | 7 | <1 |
| C2H6 | 2 | 2 | 2 | 2 | <1 |
| C2H4 | 4 | 2 | 3 | 2 | 1 |
| C2H2 | <1 | <1 | <1 | <1 | <1 |
| CO | 445 | 412 | 480 | 285 | 14 |
| CO2 | 3101 | 5096 | 6803 | 6653 | 192 |
Table 8.
DGA history of transformer 3.
| Gas | Sample 1 | Sample 2 | Sample 3 | Sample 4 | Sample 5 |
|---|---|---|---|---|---|
| H2 | 20 | 30 | 258 | 249 | 1233 |
| CH4 | 2 | 3 | 4 | 4 | 5 |
| C2H6 | 2 | 1 | 2 | 2 | 2 |
| C2H4 | 16 | 11 | 21 | 25 | 27 |
| C2H2 | <1 | <1 | <1 | <1 | <1 |
| CO | 158 | 126 | 173 | 177 | 224 |
| CO2 | 2386 | 1670 | 2898 | 2958 | 3425 |
Table 9.
DGA samples with the five conventional interpretation techniques and the developed GEP model.
Table 9.
DGA samples with the five conventional interpretation techniques and the developed GEP model.
| Sample Number | Gas Concentration (ppm) | Conventional Interpretation Methods | Fault Type Revealed by GEP Model | ||||||||||
|---|---|---|---|---|---|---|---|---|---|---|---|---|---|
| CH4 | C2H4 | C2H2 | C2H6 | H2 | CO2 | CO | Key Gas | Roger | Duval | Doernenb. | IEC | ||
| 1 | 0 | 0 | 0 | 2 | 51 | 9386 | 541 | F1 | F5 | F5 | F4 | F5 | F1 |
| 2 | 0 | 0 | 0 | 0 | 53 | 7030 | 537 | F1 | F3 | F5 | F4 | F5 | F1 |
| 3 | 27 | 4 | 1 | 49 | 1 | 53 | 254 | F1 | F4 | F4 | F4 | F4 | F1 |
| 4 | 68 | 0 | 0 | 0 | 1088 | 53,048 | 387 | F3 | F3 | F3 | F5 | F5 | F3 |
| 5 | 24 | 32 | 81 | 0 | 127 | 2024 | 0 | F4 | F3 | F4 | F4 | F3 | F4 |
© 2019 by the author. Licensee MDPI, Basel, Switzerland. This article is an open access article distributed under the terms and conditions of the Creative Commons Attribution (CC BY) license (http://creativecommons.org/licenses/by/4.0/).
Share and Cite
MDPI and ACS Style
Abu-Siada, A. Improved Consistent Interpretation Approach of Fault Type within Power Transformers Using Dissolved Gas Analysis and Gene Expression Programming. Energies 2019, 12, 730. https://doi.org/10.3390/en12040730
AMA Style
Abu-Siada A. Improved Consistent Interpretation Approach of Fault Type within Power Transformers Using Dissolved Gas Analysis and Gene Expression Programming. Energies. 2019; 12(4):730. https://doi.org/10.3390/en12040730
Chicago/Turabian StyleAbu-Siada, Ahmed. 2019. "Improved Consistent Interpretation Approach of Fault Type within Power Transformers Using Dissolved Gas Analysis and Gene Expression Programming" Energies 12, no. 4: 730. https://doi.org/10.3390/en12040730
Note that from the first issue of 2016, this journal uses article numbers instead of page numbers. See further details here.