Estimation of the Compressive Strength of Corrugated Cardboard Boxes with Various Openings


1
Institute of Structural Analysis, Poznan University of Technology, Piotrowo Street 5, 60-965 Poznań, Poland
2
Institute of Applied Mechanics, Poznan University of Technology, Jana Pawła II Street 24, 60-965 Poznań, Poland
*
Author to whom correspondence should be addressed.
Energies 2021, 14(1), 155; https://doi.org/10.3390/en14010155
Submission received: 4 December 2020
/
Revised: 24 December 2020
/
Accepted: 26 December 2020
/
Published: 30 December 2020
(This article belongs to the Special Issue Strain Energy in Composite Structures)
Abstract
:This paper presents mixed analytical/numerical method for estimating the static top-to-bottom compressive strength of corrugated packaging with different ventilation openings and holes, in which the torsional and shear stiffness of corrugated cardboard as well as the panel depth-to-width ratio are included. Analytical framework bases on Heimerls assumption with a modification to a critical force, which is here computed by a numerical algorithm. The proposed method is compared herein with the successful McKee formula and is verified with the large number of experiment results of various packaging designs made of different qualities of corrugated cardboard. The results show that, for various hole dimensions or location of openings in no-flap and flap boxes, the estimation error may be reduced up to three times than in the simple analytical approach.
1. Introduction
The packaging industry plays an important role in the modern world. The leading material used in this field is a corrugated cardboard. Corrugated boxes are used in many branches of various industries, mainly to transport goods or products from one place to another. During the transportation and storage, the boxes are subject to considerable loading. In order to ensure appropriate strength of the boxes, it is necessary to use appropriate estimation method and/or to conduct a series of experiments to determine a behavior of the corrugated material and the whole construction of the box. The strength estimation becomes challenging when box contains, e.g., hand holes and/or openings. Correct characterization of material properties of the corrugated board and precise estimation technique of the box strength allows to design the carton boxes in line with the sustainable development strategy. In the material such as corrugated board, there are two characteristic in-plane directions of orthotropy related to fiber orientation. The first one is perpendicular to the main axis of the corrugation and it is called the machine direction (MD). It is parallel to the paperboard fiber alignment. The second one is parallel to it and called cross direction (CD).
One possibility for analysis of strength of the corrugated boxes is the execution of several iterative experiments, in the loop in which testing, validation and optimization of the box design take place. In the packaging industry the most commonly used are compressive, bending or bursting strength tests of corrugated board. Another important material property to examine is also a humidity, which has a big impact on the box strength. However, the most important and practical are the box compression test (BCT) and the edge crush test (ECT).
Another possibility is to use analytical formulas for prediction compressive strength of boxes made from corrugated boards available in the literature. The formulas should be as simple as possible to make it useful for practical applications. Over the years, many different approaches has been proposed. The parameters used in these formulas can be categorized intro three groups: paper, board and box parameters [1]. In the first group, one can distinguish two tests—ring crush test (RCT), Concora liner test (CLT), liner type, weights of liner and fluting, corrugation ratio and a constant related to fluting. The parameters of board include thickness, flexural stiffnesses in MD and CD, ECT and moisture content. The parameters of boxes are dimensions, perimeter, applied load ratio, stacking time, buckling ratio and printed ratio. In 1952, Kellicutt and Landt used the parameters of paper (RCT, flute constant) and the box (perimeter, box constant) to propose one of the first formula for prediction of compressive strength of boxes [2]. Maltenfort related the critical force in the BCT to the parameters of the paper (CLT, liner type) and box dimensions [3]. The most popular and widely used formula has been proposed by McKee, Gander and Wachuta in 1963 [4]. They took into account the parameters of the paperboard (ECT, flexural stiffnesses) and the box perimeter. The formula is applicable for some relatively simple containers. Over the years, many researchers tried to extend the applicability of the McKee’s approach. Probably one of the first is the work of Allerby et al. [5] from 1985, in which the authors modified constant and exponents of the McKee’s formula. Two years later, Schrampfer et al. extended applicability of the McKee relationship for a wider range of cutting methods and equipment [6]. Batelka et al. included in this relationship also the dimensions of the box [7], while Urbanik et al. took into account also the Poisson’s ratio [8]. In the original paper of McKee et al. [4], an arbitrary chosen constant value was used, which makes their approach limited only for some typical boxes. This constant was later analyzed in more complicated cases by Garbowski et al. [9]. If one would like to include also the transverse shear, the additional tests are required and therefore updated formulation should be used, which was recently modified by Aviles et al. [10] and later by Garbowski et al. [11,12].
On the contrary, in the analysis of corrugated boxes numerical methods are very often used to compute the strength of the boxes. The most common method is the finite element method (FEM), which was successfully applied in many research on numerical analysis of boxes made from corrugated cardboards, including investigations of buckling phenomena [13] or transverse shear stiffness of corrugated cardboards [14,15].
In numerical simulations, the corrugated paperboards are commonly modelled as sandwich panels [16]. The main goal in the numerical analysis is to obtain results as accurate as possible with computational costs as small as possible. Thus, there is a need of using models, which are simplification of the real objects without losing adequacy to reality. In the numerical analysis of layered materials [17,18,19] and constructions, made from such materials, it is useful to perform a process called homogenization [20,21]. As a consequence, instead of structure of layers made from different materials one can obtain one layer characterized by effective properties of the composite. Application of the external loads to the homogenized plate should give similar effect like for the composite material with heterogeneous core. One of the homogenization methods, which was based on strain energy and can be applied for sandwich panels, was proposed by Hohe [22]. In this approach, an equivalence of a representative element of the heterogeneous and homogenized elements was assumed. A period homogenization method, in which an equivalent membrane and pure bending characteristic of period plates is obtained, has been also proposed by Buannic et al. [23]. They applied a modified version of this approach to take into account the transfer shear effect in the analysis of sandwich panels. Biancolini used the FEM for analysis of a micromechanical part of the considered plate [24]. Appling the energy equivalency between the model and the equivalent plate, he obtained the stiffness properties of the considered plate. Abbès and Guo decomposed the plates into two beams in directions of the plate to obtain the torsion rigidity of the orthotropic sandwich plates [25]. Two approaches to homogenization have been compared by Marek and Garbowski. These considerations were based on the classical laminated plate theory and the deformation energy equivalence method [26] or based on inverse analysis [27].
The strength of the boxes made from corrugated cardboards can be reduced by many factors, including moisture, prints, perforations, etc. However, one of the most common factor for loss of the strength of boxes is the presence of openings on the walls of the package, as most of the boxes contain ventilation or at least hand holes [28]. This issue was a subject of some recently published papers. Fadji et al. [29] investigated an effect of the geometrical features of the holes, including height, area, orientation, shape and number of holes on the strength of boxes. The influence of ventilation holes on the stability and strength of the boxes using FEM was examined by Fadiji et al. [30]. They considered certain type of boxes, which are commonly used in the fresh fruit industry, in which the ventilation holes play an important role.
To the best knowledge of the authors, there is no research in which the effect of losing strength caused by holes is taken into account in the analytical prediction of the box strength. In this paper, we extend the applicability of the approach presented in [9] for corrugated boxes with holes.
2. Materials and Methods
2.1. Ultimate Compressive Strength of a Single Panel
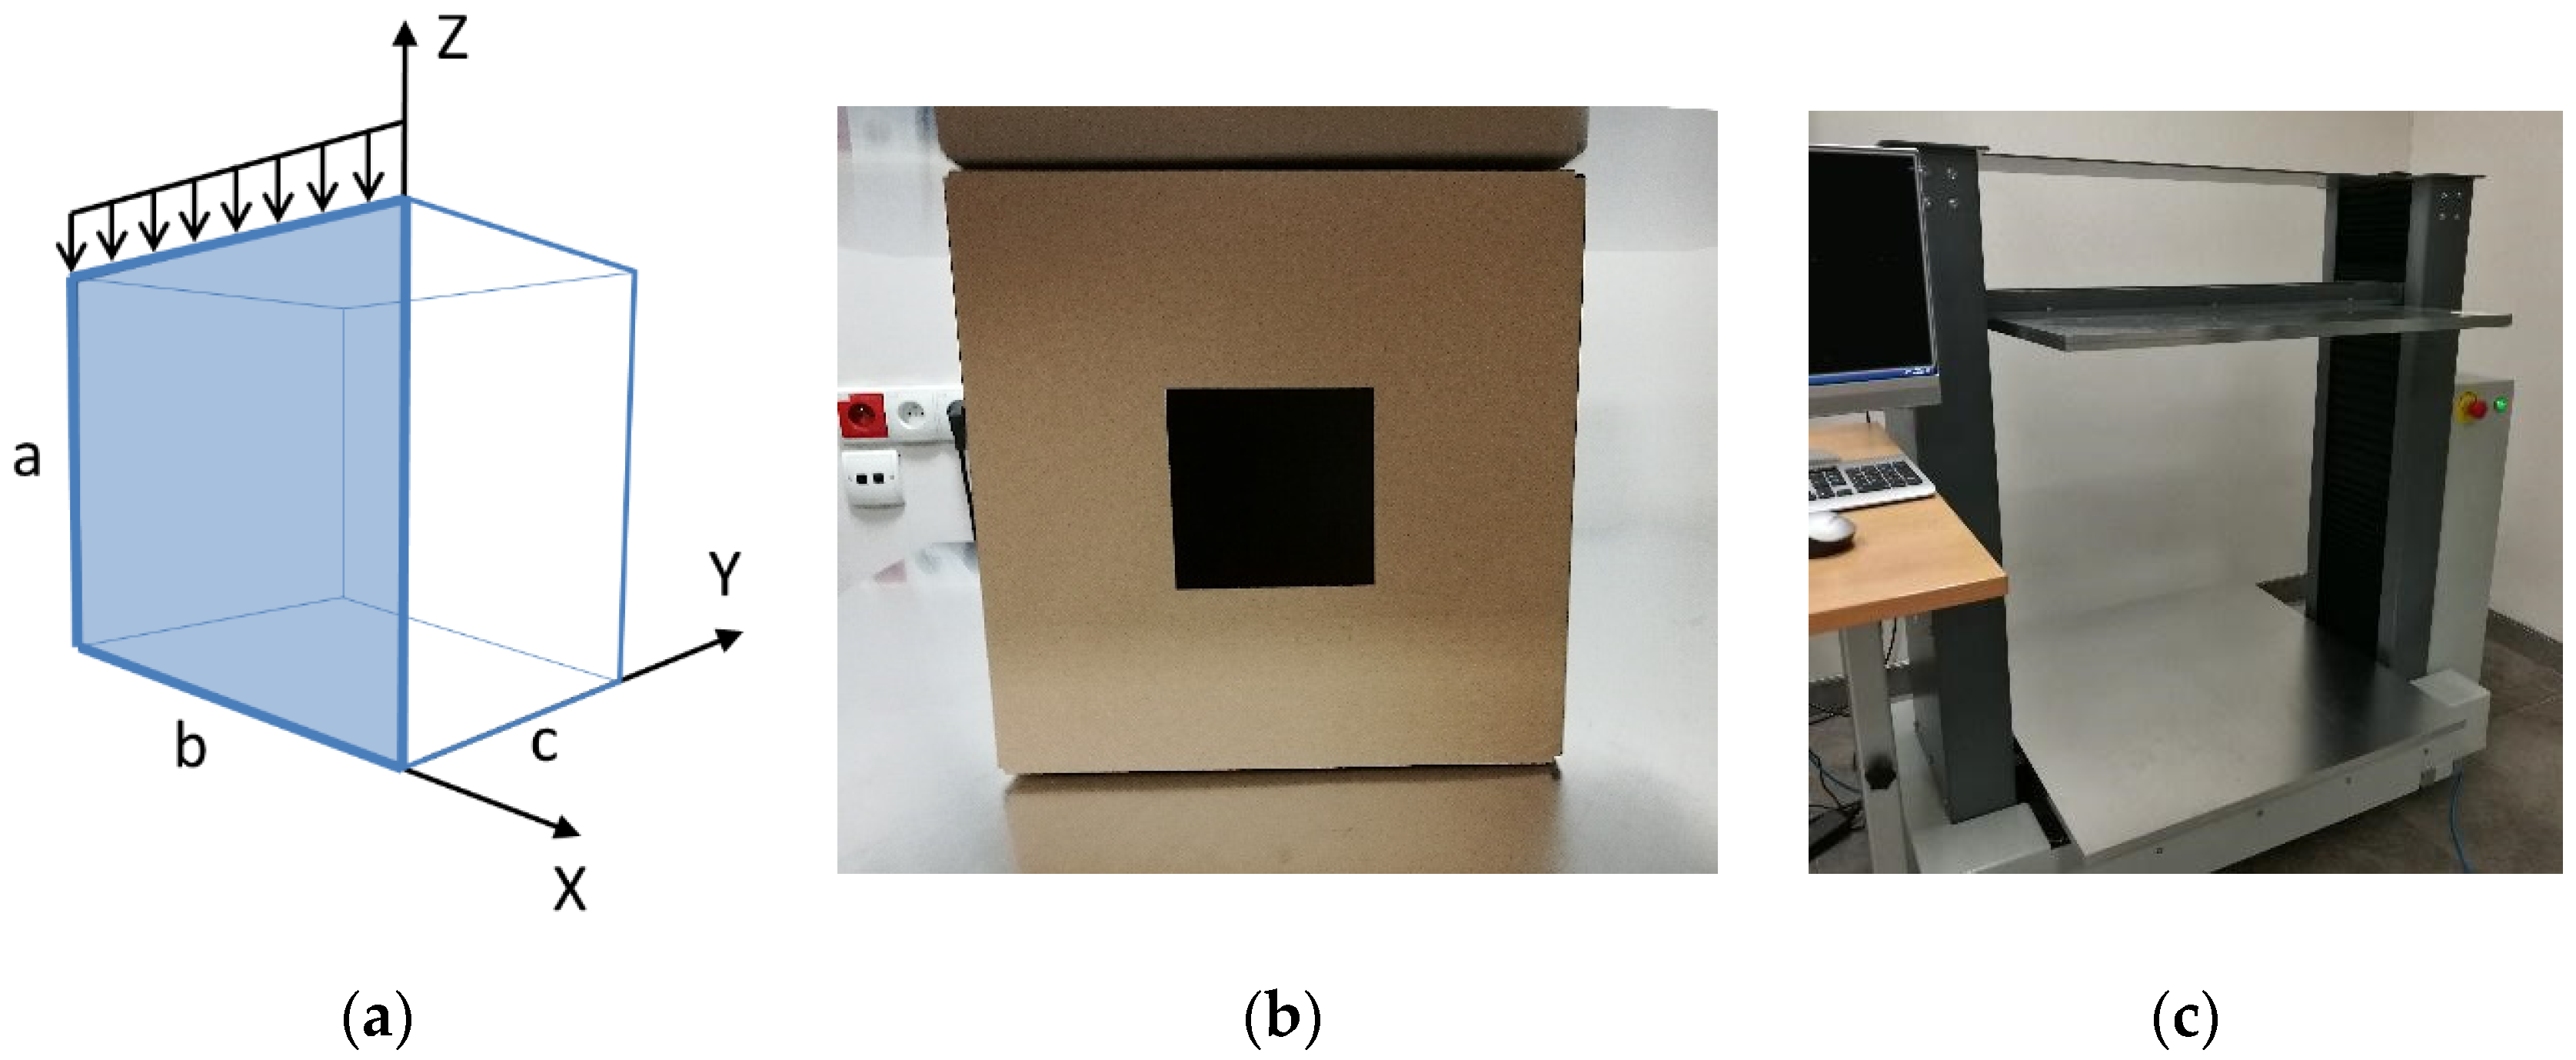
The most popular and the simplest approach used these days for computation of ultimate compressive load of corrugated cardboard boxes was proposed by McKee et al. [4]. The starting point in their study was the determination of the ultimate plate load of a rectangular panel with dimensions , loaded vertically on the upper edge, in which the plate under consideration is a separated panel of a box (Figure 1a), despite the fact that the box is loaded as a three-dimensional structure during the compression test (Figure 1b). All four edges of the each separated plate are pinned in the out-of-plane direction, and the bottom edge is additionally constrained along in the vertical direction. The basis for the derivation given by McKee et al. is the empirical formula presented in Heimerl [31], where the load at failure [N/mm] is the result of a combination of buckling force and compressive strength, namely:
where is an exponent, , is a certain constant, is a critical load of a corrugated panel [N/mm] and is the edge-loaded compressive strength of a corrugated board in cross direction [N/mm].
To include the nonlinear material effect when no elastic buckling occurs the above formula was later modified by Urbanik et al. [8,13]:
where . Integer plays an activating role and if it is equal 1, it corresponds to elastic buckling (), while if it is equal , it corresponds to inelastic buckling, so the ultimate load is proportional to , namely:
In both cases, if the selected panel of a corrugated box does not have any openings, see Figure 1a, the analytical formula describing the critical load for a rectangular orthotropic plate [9,33,34,35] can be utilized:
where is the critical load of the panel with dimensions (—panel height, —panel width [mm]), is a dimensionless buckling coefficient that depends, among others, on the ratio , boundary conditions applied to the plate edges, the buckling mode and a material characteristics, is the effective bending stiffness in the MD [N/mm] and is the effective bending stiffness in the CD [N/mm]. In this study, the first buckling mode was used for computations in all cases. In this buckling mode, the displacements of panel with and without hole usually represent a shape of the half-wave in both directions.
All fibrous materials, including corrugated cardboard, are characterized by orthotropy, which means that the mechanical properties in such materials change depending on the direction, here CD/MD. The buckling coefficient for such panels takes the following form:
where defines a buckling mode and counts the half-waves along the load direction, is an effective torsion stiffness [N/mm] and , and are in-plane Poisson’s ratios.
2.2. Buckling—McKee’s Formula
If the analyzed panel does not contain any holes, a simplified formula for critical load computation can be utilized. Such a formula was suggested by McKee et al. [4], in order to maximally simplify the complicated equations describing the critical load of compressed orthotropic plates so that the use of these equations could be common and practical. Therefore, the authors replaced Equation (5) with a simpler formula:
where and is a plate parameter assumed to be equal to 0.5, which leads to: . They also assumed that the plate has equal sides, i.e., and therefore (where is the box perimeter), which led to further simplification of Equation (5) to the form:
2.3. Buckling—Finite Element Method
However, if the analyzed panel contains any openings, the analytical approach becomes impractical due to the lack of an universal solution for a panel with different holes. In such a case, the numerical method works best, although it is more difficult to implement, it is very general and allows to determine the critical load of panels with any shape and boundary conditions, including holes with complex shapes. In this study, the buckling was computed for each separated panel in the 3D space having all external edges fixed in out of plane direction, additionally the bottom edge was fixed in the vertical direction, other BC’s were inactive.
The critical load can be calculated from the formula:
where is a critical loading multiplier, i.e., the smallest eigenvalue and is a distributed load on a panel upper edge [N/mm].
To calculate the critical force multiplier, the following two-step algorithm should be used. In the first step, we need to:
- discretize the panel with finite elements (FE), see Figure 2a,
- compute the stiffness matrix of each element,
- assemble the global stiffness matrix of a whole panel,
- compute nodal forces representing initial loading configuration , i.e., for loading multiplier (one-parameter loading assumed ),
- take boundary conditions into account,
- solve equation to obtain nodal displacements in pre-buckling state:
- extract element displacements (from displacements of the system ) and compute in each element the generalized stresses .
In the second step, we need to:
- generate initial geometrical stress matrices for each element and the whole panel ,
- formulate initial buckling problem:
- solve the eigenproblem to determine the pairs , where is a number of degrees of freedom, is th eigenvalue, is th eigenvector (post-buckling deformation mode).
In order to compute stiffness matrix of the plate, the proper formulation of the FE must be used. In the classical plate FE, the field variables are approximated through shape functions according to the associated node values as follows:
where is a shape function associated with node and is a number of nodes in the element:
is the displacement vector in the -th node.
The membrane, bending and shear strains associated to the displacement in Equation (11) can be therefore obtained as follows:
where:
The energy functional of the plate can be finally obtained as follows:
where , ; and are stiffnesses of the plates [9]. By using Lagrange’s equations for the Equation (19), the characteristic equation of the system is obtained as follows:
where:
and:
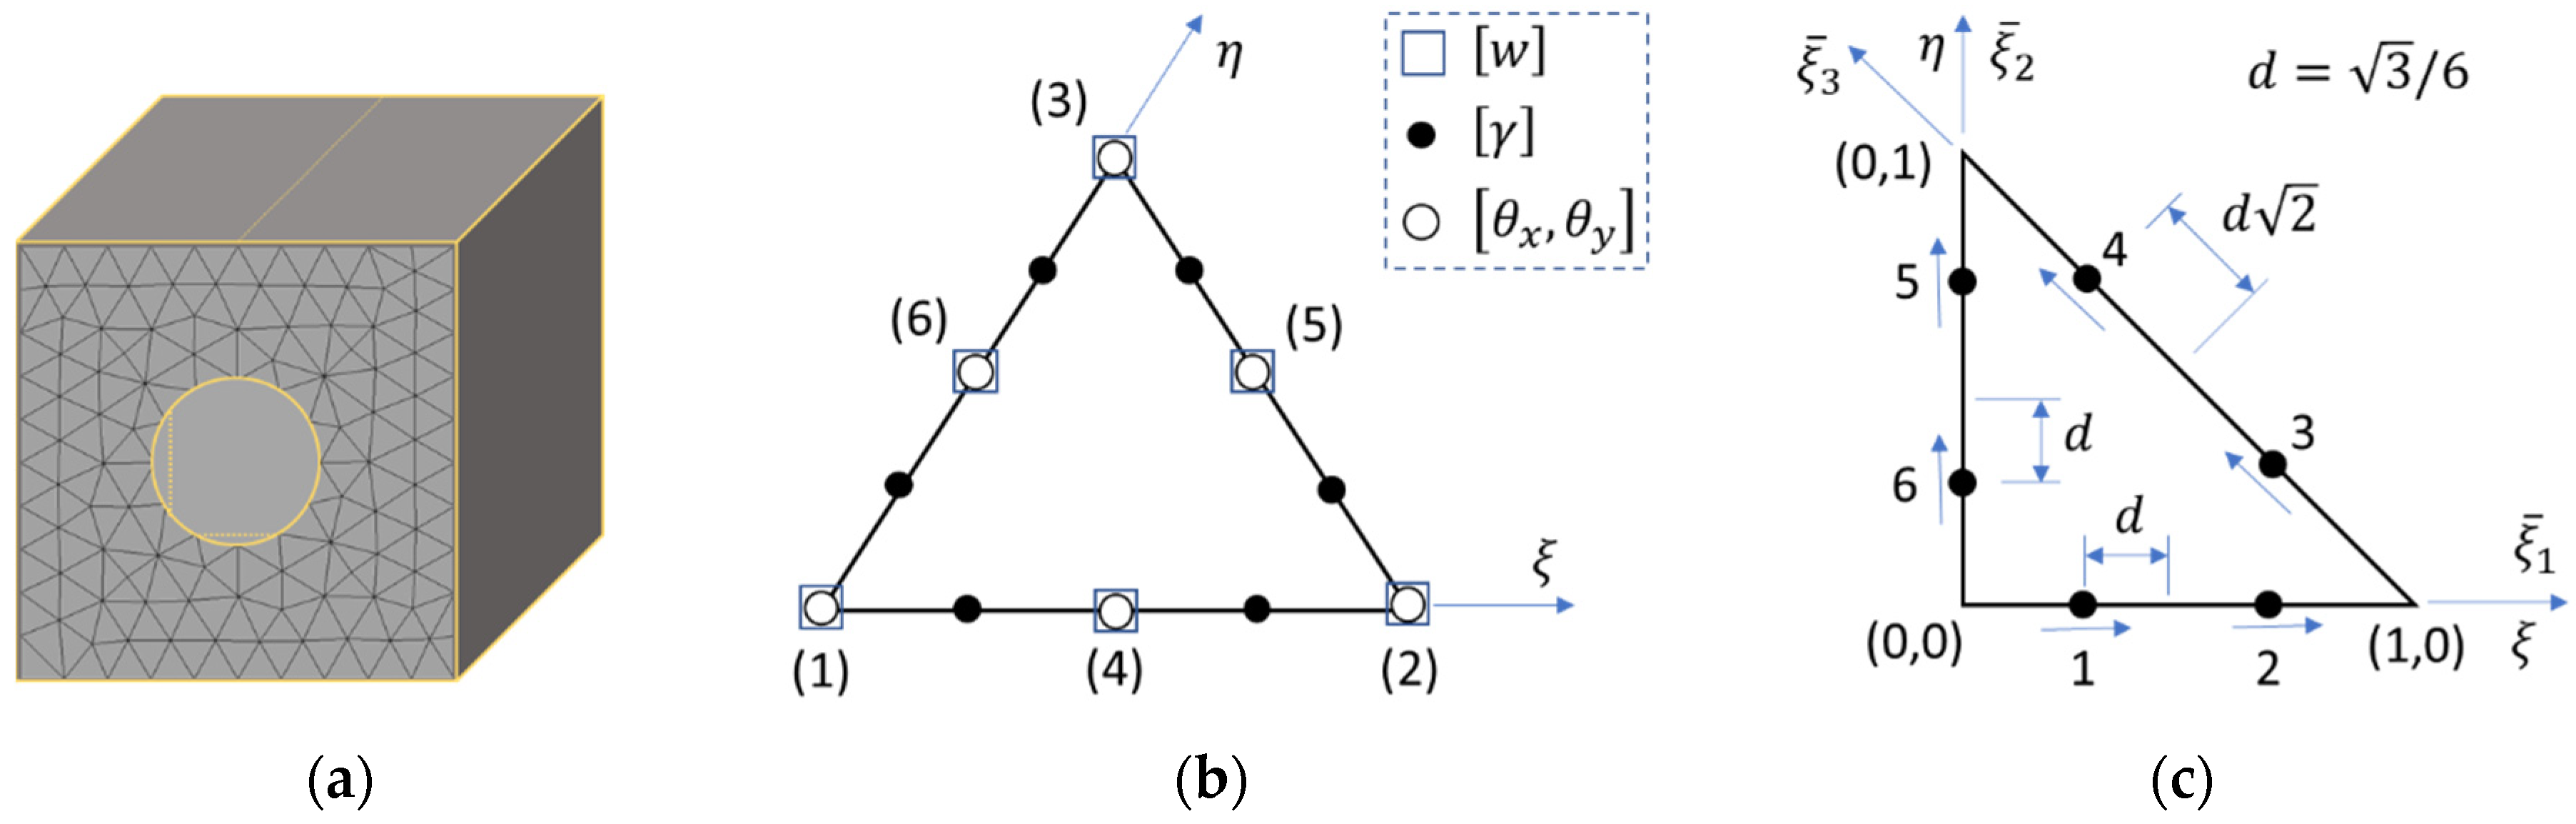
As the geometry of each panel does not have to be regular, especially in the case of panels with openings, it was assumed that the FE mesh will be made of shell triangular elements. Most Reissner-Mindlin triangular shell FE described in the literature were developed using the assumed transverse shear strain techniques. Here, the 6-noded quadratic triangle FE with assumed linear shear strains was utilized. Zienkiewicz et al. [36] developed such a 6-noded plate triangle with a standard quadratic interpolation for the rotations and the deflection, and the assumed linear transverse shear strain field in the following form:
i.e.,:
Figure 2b,c show the position of the six shear sampling points and the directions. Following the procedure presented in Appendix A, we find:
where:
Matrix is computed by Equation (A24) in Appendix A. A full 3-point Gauss quadrature is used here for the numerical integration of element transverse shear stiffness matrix:
2.4. Box Compression Strength—McKee’s Formula
To compute failure load of a single panel we substitute the buckling force derived from Equation (7) into Equation (1), after [4] we have:
which can be simplified to:
where , under the assumption [4] that is constant if and equals approximately 1.33, while and , is equal to:
To calculate the failure load of the entire box, it is enough to multiply Equation (33) by the , which is the perimeter of the box. The original assumption [4] was that the width and length of a box are equal (i.e., ) thus the compressive strength of a box, known as the long McKee formula, reads:
The empirical observations [4] that , led to a further simplification and finally to the most known short form of McKee’s equation:
where , with previously assumed value of , equals:
So, Equation (36) takes the final form:
This is the most commonly used formula. However, its accuracy is acceptable only for the simplest boxes. The McKee formula should not be used if the length to width ratio or the height to length ratio of the box is too large [9]. The same problem appear when box contains any openings or ventilation holes. To overcome this limitations we have derived an analytical formulation for box strength from Equation (1), in which the critical force is computed using numerical methods instead of analytical formulas. Both will be shown in the following sections.
2.5. Box Compression Strength—General Case
In order to calculate the compressive strength of a single panel of a box, see Figure 1a, the force described by the formula (1) should be multiplied by the -th panel width or . To get the failure load of an entire box (), it is required to sum up the compressive strength of all panels. Thus, in the general case, we get the following:
where indicates the -th panel of width or (). and are the critical forces of panels of width and , respectively (see Figure 1a). and are the reduction factors taking into account the ratio of the compressive strength of the plate with and without a hole for plate width and , respectively. and are the reduction coefficients due to in-plate aspect ratio of the box dimensions, defined as:
2.6. Practical Considerations
Equation (39) uses different definitions of the critical force, i.e., Equations (4) and (8), depending on whether the -th panel contains any hole or not. In any case, the values of constants and in Equation (39) are required. As suggested by other authors [4,39,40,41], and were assumed.
The compressive strength of rectangular boxes with various openings (with base dimensions , as shown in Figure 1a) after taking the typical values of and in Equation (39) takes the form:
where and are defined in:
- (a)
- Equation (4)—for orthotropic rectangular plates without holes (analytical),
- (b)
- Equation (8)—for orthotropic rectangular plates with various openings (numerical – FEM).
In all of the above equations describing the critical force , all definitions of width should be replaced by , e.g., Equation (4) should read:
3. Results
3.1. Box Compression Strength—Experiment vs. Estimation
In the following section, experimental and computational examples regarding boxes are presented and the applicability of the analytical-numerical approach is validated. In the paper, the analyzed cases represent the simplest slotted-type boxes with holes varied in size, position at the panel side and location on the longer or shorter wall. Two typical designs of FEFCO boxes with an addition of different holes were considered, i.e., FEFCO F200—packaging without upper flaps, see Figure 3, and FEFCO F201—packaging with flaps, see Figure 4. Two box dimensions were considered, namely, mm and mm (length, width and height, respectively). Moreover, three positions of the opening at the panel side were assumed, i.e., in the upper corner (O1), in the middle of the package height at the edge of the panel (O2) and in the center of the panel (O3). Also, two cases were considered, in which the opening was at the shorter wall (B), and at the longer wall (L) of the box. In most cases, the openings were square, but rectangular openings were also considered. The hole dimensions for cases O1B1S, O2B1S, O3B1S, O1L1S, O2L1S and O3L1S were the same, namely, mm. For O3B1S1a, O3B1S1b, O3B1S1c and O3B1S1d they varied with dimensions of and mm, respectively. For O3L1S1a, O3L1S1b, O3L1S1c, O3L1S1d and O3L1S1e they varied with dimensions of and mm, respectively. For O3L1Ra and O3L1Rb the dimensions were and mm.
For the purposes of this study, the selected boxes were tested in a box compression testing machine, namely BCT-19T10 from FEMat [32]; see Figure 1c. According to the specifications, the machine measures the force up to 10 kN with a resolution of 0.1 N. The displacement accuracy is 0.001 mm. In order to get reliable results, 4–6 samples of each packaging design were tested. In the study, for all cases the number of tested samples exceeded 180. The boxes were manufactured from different three-layer corrugated cardboard, namely, 350, 380, 400, and 480 g/m2. All those cardboards had B or E flute, their thickness was 1.49, 1.52, 1.59, 2.80 and 2.82 mm. All cases tested are presented in Table 1 and Table 2 for FEFCO type boxes of F200 and F201, respectively. In Table 1 and Table 2 “opening type” columns contain the information about the opening, for instance O1B1S, means that the opening was located in the corner (O1) of the shorter wall (B). “Cardboard quality” columns contain the code of cardboard, for instance 3B400-1, means that three layer cardboard and B flute was used with 400 g/m2, 1st material production.
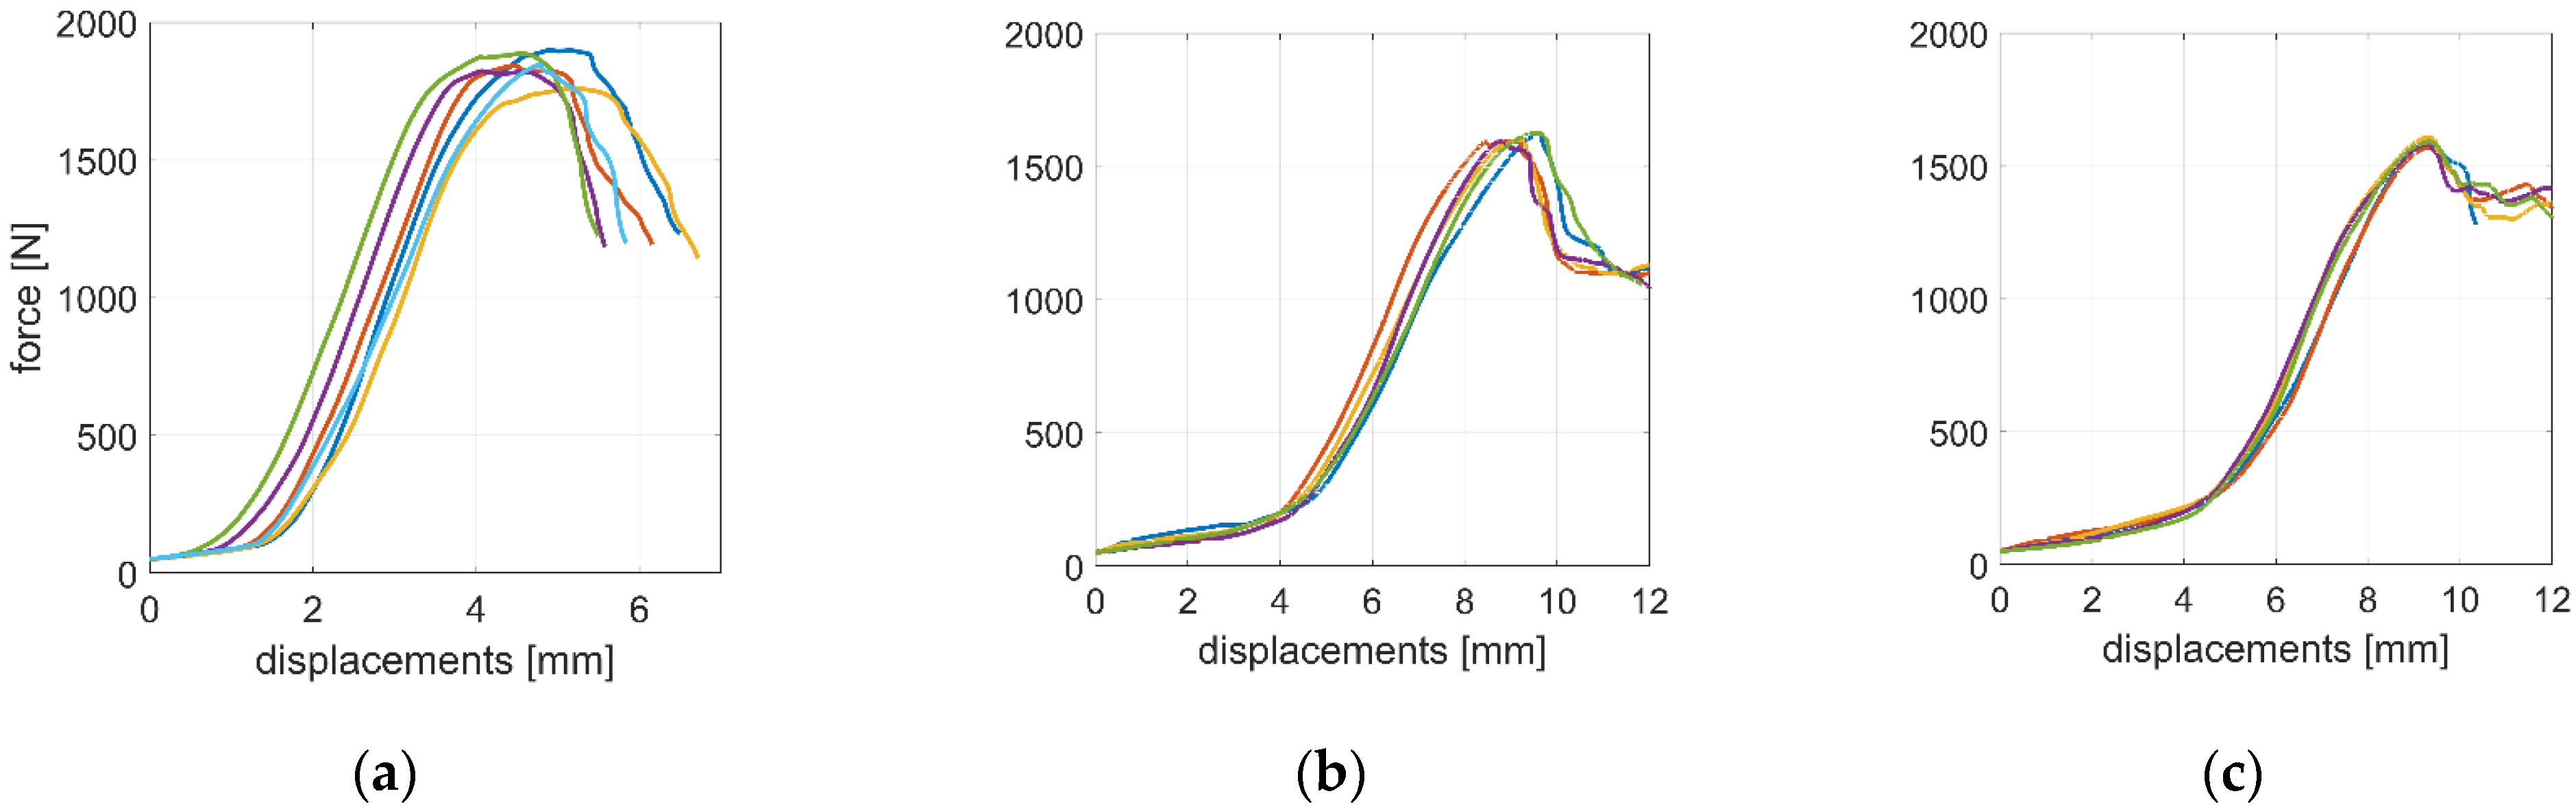
During the tests, the boxes were folded by one operator manually, and the flaps of the packaging were taped at the bottom and top, if applicable. All packaging structures were cut on a plotter, so the material was not converted. Also, each box was inspected for visual damage of the cardboard before it was submitted to displacement control protocol tests. TAPPI standard T402 was applied, the samples were laboratory conditioned, i.e., temperature 23 °C ± 1 °C and relative humidity of 50% ± 2% was hold. Figure 5 demonstrates examples of laboratory measurements for selected designs of packaging with holes, namely F200–O1B1S, F201–O3B1S1c and F201–O3L1S1d. The curves of force versus displacement are shown; a good repeatability of the measurement results is observed. The samples were not inspected after the measurements in order to determine the deformation or damage mechanism.
Moreover, the measured strength of the boxes with openings selected in this study serve as a validation data for those obtained with analytical-numerical approach proposed here, see Equation (39). In order to use Equation (39) the critical buckling loads of box panels (with and without openings) were required. The material data used for computing critical loads by FEM are presented in Table 3. The cardboard qualities were also presented in Table 1 and Table 2. All input data for Equation (39) used for the computations were attached in Supplementary Materials, separately for F200 and F201.
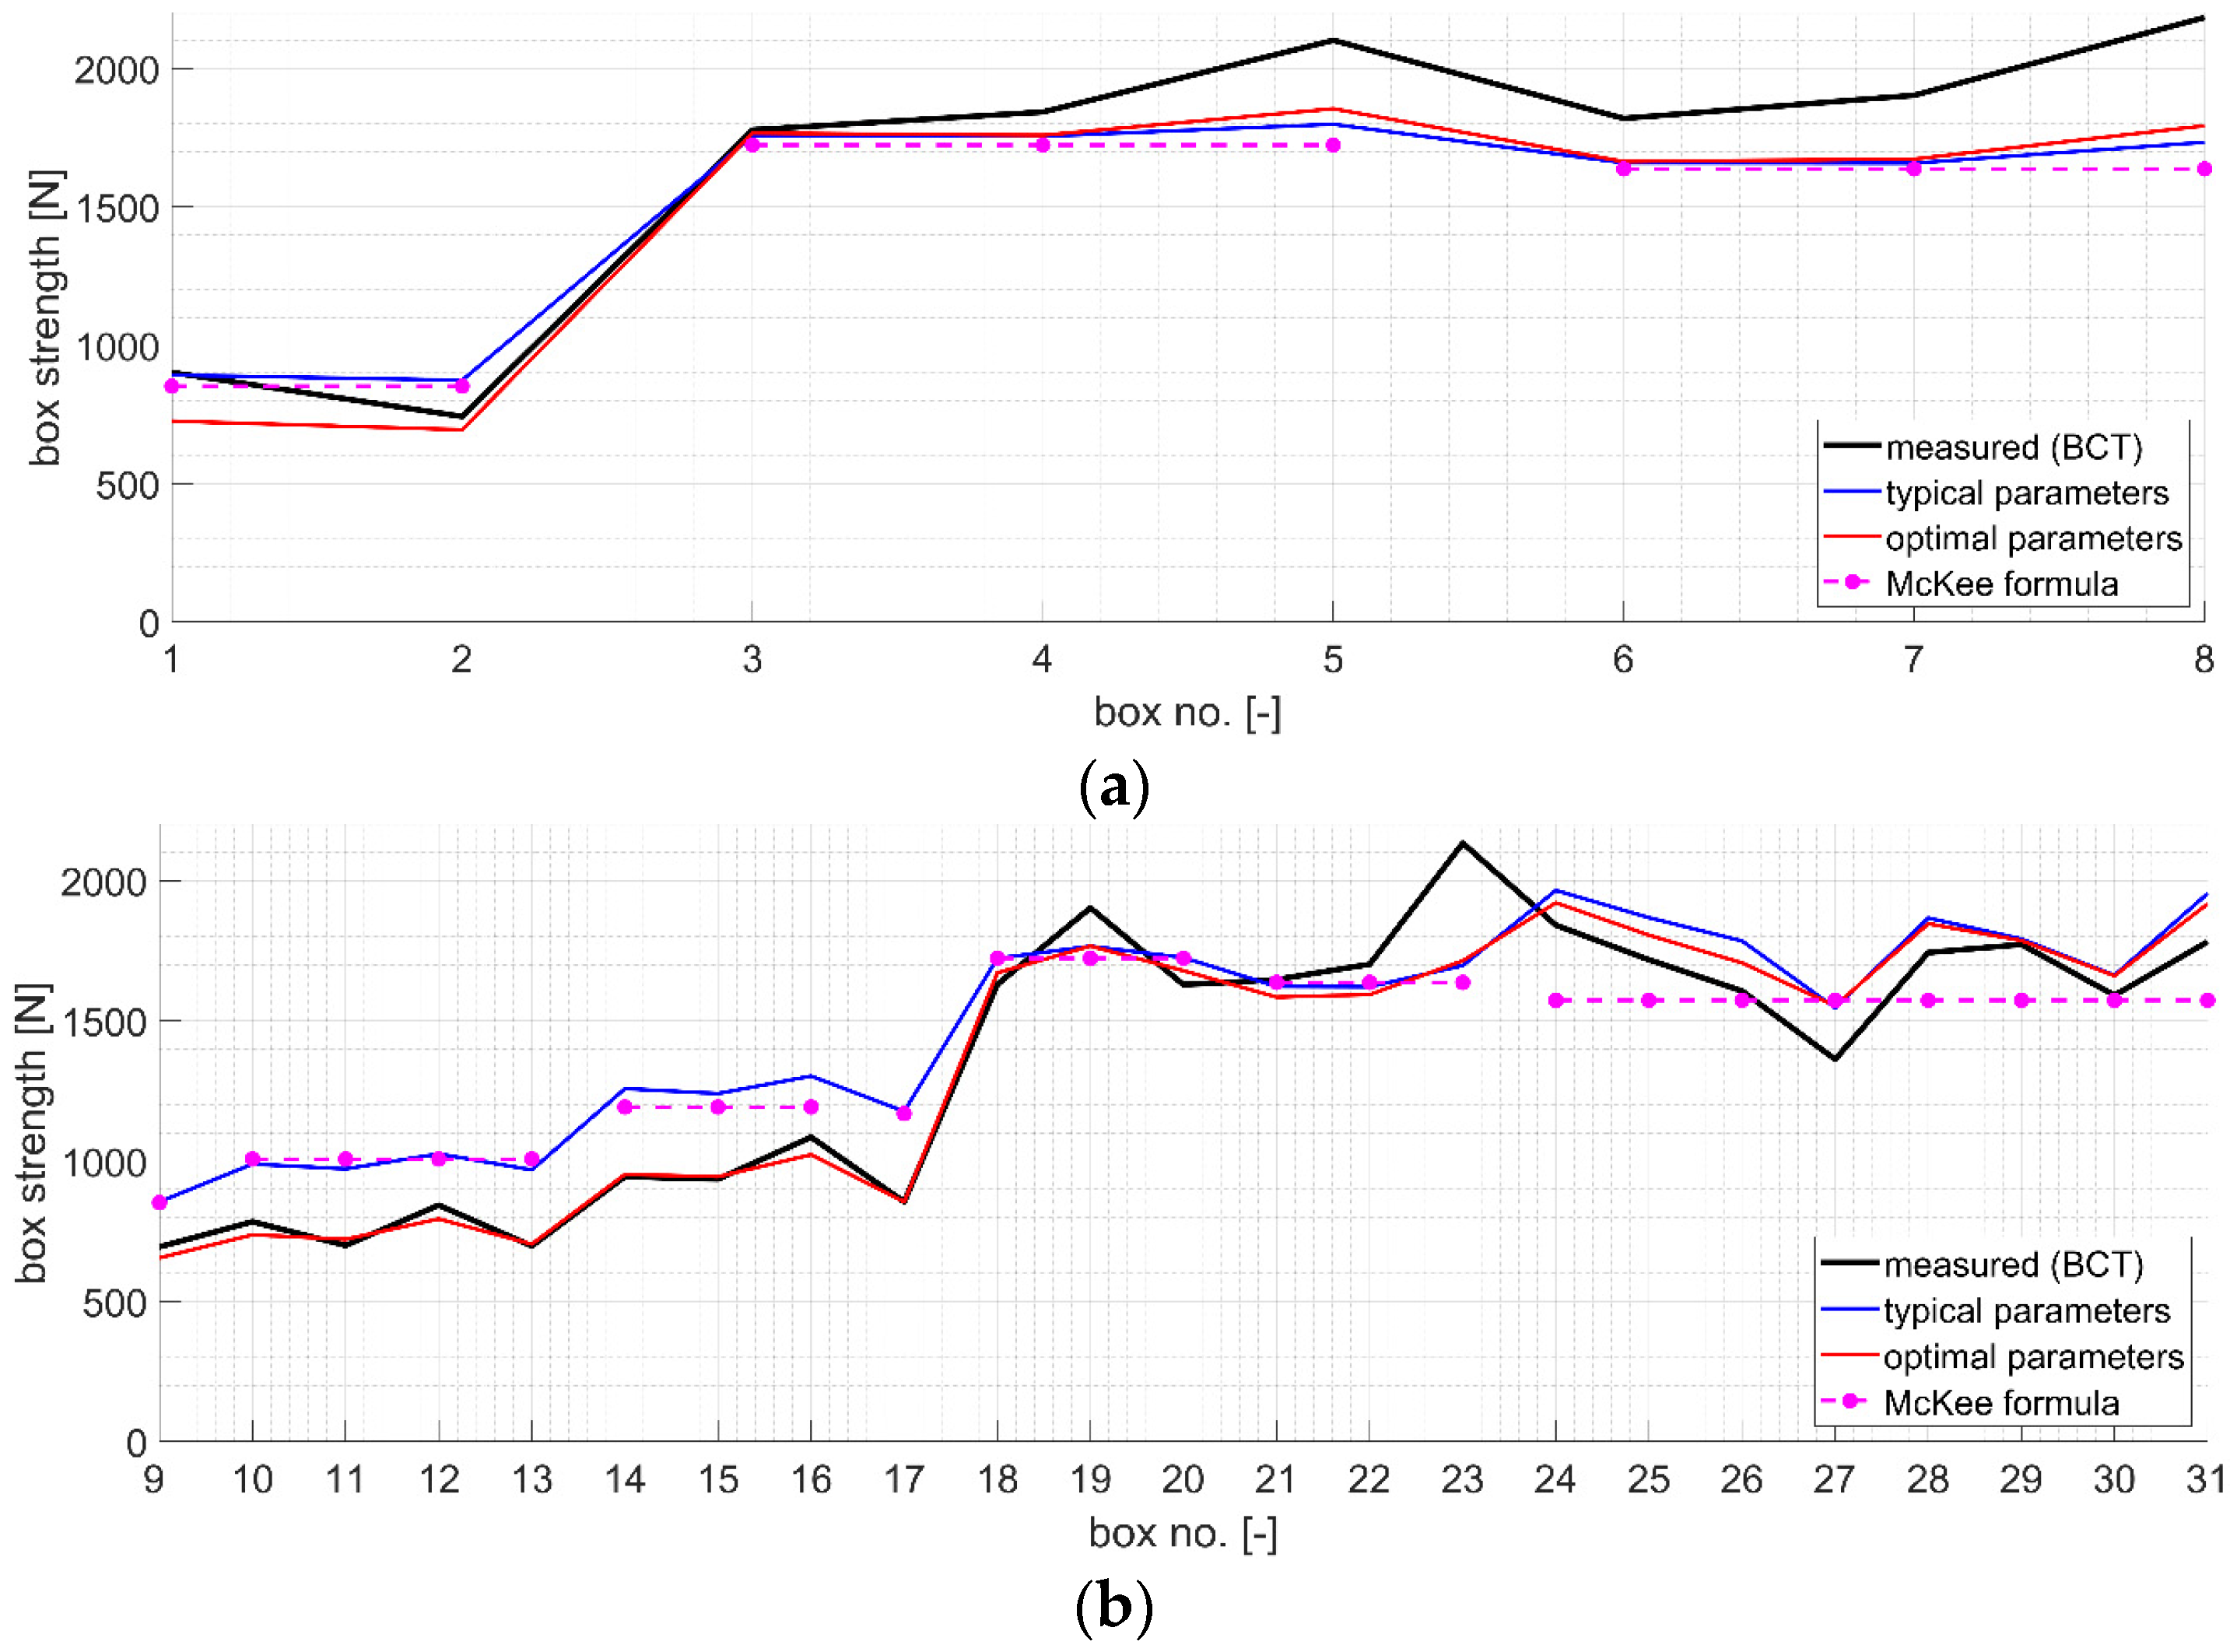
In Figure 6, the data from the tests were presented graphically (black plot), also separately for F200 (Figure 6a) and F201 (Figure 6b) boxes. Table 1, Table 2 and Figure 6 show the mean values of the ultimate load measured at the box failure (BCT). In Figure 6, also the values obtained from the analytical-numerical approach proposed were presented (blue plot), see Equation (39). In the analytical-numerical approach presented, and used are the typical values taken from the literature, namely and , see Equation (42).
The error of the method proposed may be calculated by the comparing the computed values with the ultimate loads measured, namely:
where is an experimental average value of the box compression strength for a box with a particular geometry, cardboard quality used and the type of opening and is its counterpart obtained via analytical-numerical approach proposed here. The mean error obtained for approach proposed here with typical parameters of and was equal to 14.9%.
Also, similar computations for all boxes were performed by using the McKee formula. The results are presented in Figure 6 (dashed magenta plot), see Equation (38). In a similar way, the mean error of McKee short formula was computed, which was equal to 15.5%.
3.2. Reduction of the Estimation Error—Optimal Parameters
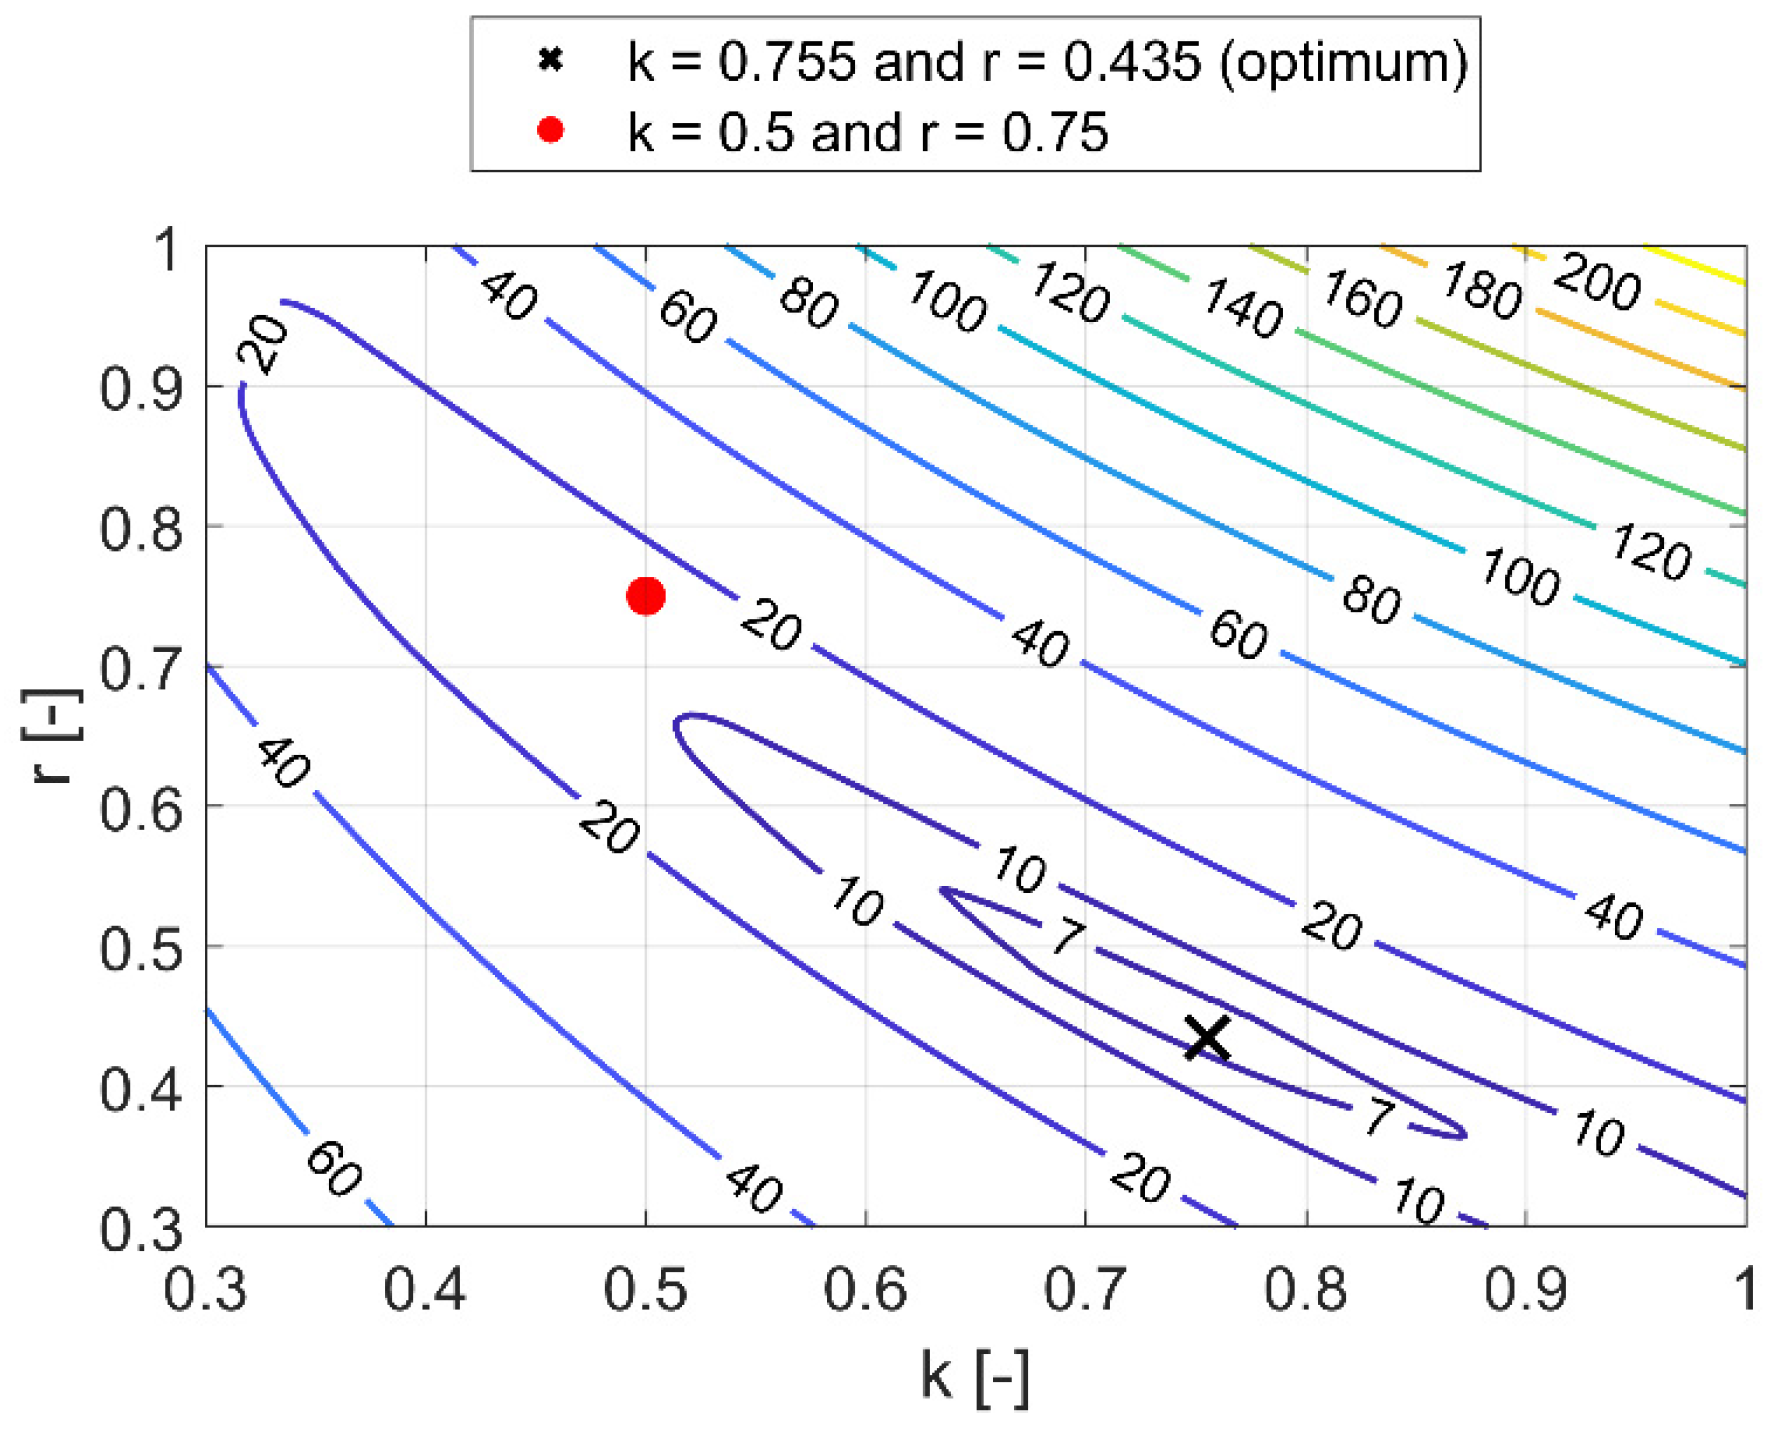
To determine how much the estimation error of the proposed method depends on the parameters (), the computations for different sets of those parameters were performed for the experimental data obtained in the course of this research. The values of and, see Equation (39), were modified and the mean error was computed for particular pair of those parameters. Notice that the typical values of and from the literature are 0.5 and 0.75, respectively, see Equation (42). The mean errors obtained by systematic computations are presented by contour plot in Figure 7. The contour plot values were computed by averaging the magnitudes from Equation (44) for all box designs. The interval of and was the same for both parameters, namely, from 0.3 to 1.0.
Table 4 summarizes the mean errors computed for typical set of parameters ( and ) and for the optimal parameter set obtained via optimization ( and ). The optimal solution was obtained by the systematic search in the space, see contour plot in Figure 7. Optimal set of and parameters used in the Equation (39) gives the lowest computed mean error. The mean estimation errors using typical and optimal set of parameters were equal 14.9% (red dot in Figure 7) and 6.5% (black cross in Figure 7), respectively. Note that in Figure 7 the surface has a characteristic valley, in which optimal value was found. The value of mean error obtained by the use of the optimal parameters in the proposed analytical-numerical method is about three times smaller than the error obtained by the use of typical values of and .
Having the optimal values of parameters (, ), see Table 4, the analytical solutions may be revalidated for considered designs of boxes. The results are presented in Figure 6, see red plot. As expected, the value obtained from optimization are closer to the values measured than those computed for typical and .
4. Discussion
Given these results, the conclusion can be drawn that the best performance of the computational approach was obtained by the proposed analytical-numerical method with the optimal parameters. If the typical parameter were used the error was much bigger. The simple McKee formula gave almost three times bigger estimation error than for the method proposed with optimal parameters. Using optimally selected parameters of and greatly reduces the error in estimating the strength of boxes with openings considered in the study.
Notice that for the method proposed the difference in modelling boxes of FEFCO F200 and F201 was not observed, i.e., the errors are moderately similar. The mean error for optimal parameters for F200 boxes was equal 6.8%, while for F201 boxes was equal 5.2%. Considering the box strengths, see Figure 6a,b, one can notice that the greater grammage of the cardboard, the obtained value of the box strength is greater. However, in the cases 24–31 (480 g/m2) the calculated values are lower than for the cases 18–23 (400 g/m2), this is caused by the different papers (predominance of recycled or virgin fibers) used for the production of these corrugated boards, which is noticeable through measured material properties, see Table 3. Comparing the parameters of the first three cardboard qualities: 3B400A1-1, 3B400A1-3 and 3B480-1, one can observe that the values are very close to each other and the ECT values, used in the original McKee formula, are even greater for the cardboards of lower grammage.
In general, the box strength is greater if the hole is smaller and its location is closer to the center of the panel. It can be noticed in Figure 6b for the cases 24–26, which are ordered according to the increasing size of hole for the same cardboard quality and location of the hole—on the shorter wall (B) in the center of panel (O3). The only exception can be observed comparing the cases 27–31, in which experimentally for the greater hole (case 29) the greater box strength was obtained than for smaller hole (case 28). This issue is suspected to be caused by a initial imperfections of the corrugated board used for the production of these boxes.
It should be underlined that for particular cardboard quality, the McKee formula gives constant estimation of box strength. McKee formula results are independent from the opening type (its position, shape or size). For instance, see the results for boxes from no. 24 up to 31 in Figure 6b, which are presented for 3B480-1 cardboard quality. In the study, not only various design of boxes with holes were tested, also the cardboard with different quality was considered and packaging characterized with different overall dimensions of width, length and height. Such systematic design of experiments allows to use those data as a part of the input for numerical training, e.g., the artificial network. Using artificial intelligence algorithms could be especially beneficial for optimal selection of various structure parameters (not only two parameters selected in this study), if other crucial effects for reliable strength estimation of boxes would be determined. Among others, the structural parameters may describe the position of the opening, its area or shape. etc. This could be the interest of further research.
5. Conclusions
The strength of regular flap boxes is easily determined with a use of a simple McKee formula, however, if the box dimensions are not in standard proportions, the McKee formula becomes inaccurate, as shown in our previous study. If the box contains any openings the use of pure analytical formulas become even more impractical, because the loss of accuracy is very noticeable. The article presents the analytical formula feed with numerically obtained data for estimation of the strength of boxes with openings of various dimensions and locations.
The proposed method was verified on the basis of experimental data, which covered various examples of cardboard packaging. In the paper, the tested cases represent the simplest boxes with holes varied in size, position at the panel side and position at the longer or shorter wall. Also, two design of boxes with different cardboard qualities were considered, namely, modified design of FEFCO F200 and FEFCO 201. Qualities of three layer cardboards with E and B flute were used.
Due to the use of the new calculating approach proposed here, the estimation error was on average reduced three times compared to the simplified McKee analytical method. Proposed approach seems to be very promising in considering more complicated cases of boxes with complex geometries or/and materials. Thus, future studies will be devoted to adapting the analytical-numerical approach proposed here to estimate the strength of boxes with perforations of different properties. The study may concern shelf-ready boxes, in which the perforation of different cutting patterns may be used. Properties of the perforations could be also selected in the artificial intelligence algorithms as mentioned structural parameters, which among other factors, determines/decreases the strength of the box. Especially that new innovative methods of perforating are currently being tested in the corrugated board industry.
Supplementary Materials
The following are available online at https://www.mdpi.com/1996-1073/14/1/155/s1. In TXT files, the computational results based on which Figure 6 was generated are presented, In these files, 1st and 2nd columns are and parameters. 3rd column is ECT value for particular cardboard quality. 4th to 7th columns are critical loads of the ith panel (obtained from FEM). 8th to 11th columns are the reduction factors due to in-plate aspect ratio of the box panel, , where and denotes the number of the panel. 12th to 15th columns are the reduction factors taking into account the ratio of the compressive strength of the plate with and without a hole, , where and denotes the number of the panel. 16th to 19th columns are the widths of the -th panel of the box.
Author Contributions
T.G. (Tomasz Garbowski): Conceptualization, Methodology, Software, Writing—Original Draft, Writing—Review & Editing, Supervision, Project Administration, Funding Acquisition; T.G. (Tomasz Gajewski): Software, Validation, Formal analysis, Investigation, Writing—Original Draft, Writing—Review & Editing, Visualization; J.K.G.: Writing—Original Draft, Writing—Review & Editing, Data Curation, Supervision, Funding Acquisition. All authors have read and agreed to the published version of the manuscript.
Funding
The APC was funded by the Ministry of Science and Higher Education, Poland, grant at Poznan University of Technology, grant number 0411/SBAD/0001.
Institutional Review Board Statement
Not applicable.
Informed Consent Statement
Not applicable.
Acknowledgments
Special thanks to the FEMAT company (www.fematsystems.pl) for the financial support of this research project. The authors also thank AQUILA VPK Września for providing samples of corrugated cardboard for the study.
Conflicts of Interest
The authors declare no conflict of interest.
Appendix A
Derivation of the Substitute Transverse Shear Strain Matrix
An isoperimetric Reissner–Mindlin plate element with nodes is assumed here, for which the rotation, the vertical deflection and the also transverse shear strains are independently interpolated according to the following equations:
We also assume that this interpolation satisfies the conditions:
In the first step, the transverse shear strains are interpolated in the natural coordinate system as:
where specifies the number of polynomial expansion sampling points for and in the element.
The transverse shear strains in the cartesian system are then obtained as:
where is the in-plane Jacobian matrix [37,44,45]:
The transverse shear along a natural direction strain is defined as:
where is the angle between the direction and the natural axis.
The shear strains are sampled along the directions at each of the points. From Equation (A6) we obtain the following:
where:
where , etc. denote transverse shear values at each sampling point. From Equation (A3) it is found that:
Substituting Equation (A10) into (A7) gives:
where is a matrix. Vector is obtained as
Combining Equations (A3), (A7) and (A12) gives:
The relationship between the Cartesian and the natural transverse shear strains at each sampling point is:
where is the in-plane Jacobian matrix at the th sampling point. Thus:
Substituting Equations (A13) and (A15) into (A4) gives:
where:
are the shape functions.
The relationship between the transverse shear strains in cartesian coordinate system and the nodal displacements in each element can be written by the weighted residual procedure [37,46] as:
where and are arbitrarily chosen weighting functions, e.g., Galerkin weighting, i.e., . Substituting Equations. (A16) and the equation above into (A18) [37] gives:
Equation (A19) is then used to obtain the shear strains at the sampling points for each element as:
with:
If the point collocation method is used in Equation (A18), i.e., where is the Dirac delta at the th sampling point (), we obtain:
where is the value of the original transverse shear strain matrix at the th sampling point, so finally:
where is the substitute transverse shear strain matrix given by:
References
- Sohrabpour, V.; Hellström, D. Models and software for corrugated board and box design. In Proceedings of the 18th International Conference on Engineering Design (ICED 11), Copenhagen, Denmark, 15–18 October 2011. [Google Scholar]
- Kellicutt, K.; Landt, E. Development of design data for corrugated fiberboard shipping containers. Tappi J. 1952, 35, 398–402. [Google Scholar]
- Maltenfort, G. Compression strength of corrugated containers. Fibre Contain. 1956, 41, 106–121. [Google Scholar]
- McKee, R.C.; Gander, J.W.; Wachuta, J.R. Compression strength formula for corrugated boxes. Paperboard Packag. 1963, 48, 149–159. [Google Scholar]
- Allerby, I.M.; Laing, G.N.; Cardwell, R.D. Compressive strength—From components to corrugated containers. Appita Conf. Notes 1985, 1–11. [Google Scholar]
- Schrampfer, K.E.; Whitsitt, W.J.; Baum, G.A. Combined Board Edge Crush (ECT) Technology; Institute of Paper Chemistry: Appleton, WI, USA, 1987. [Google Scholar]
- Batelka, J.J.; Smith, C.N. Package Compression Model; Institute of Paper Science and Technology: Atlanta, GA, USA, 1993. [Google Scholar]
- Urbanik, T.J.; Frank, B. Box compression analysis of world-wide data spanning 46 years. Wood Fiber Sci. 2006, 38, 399–416. [Google Scholar]
- Garbowski, T.; Gajewski, T.; Grabski, J.K. The role of buckling in the estimation of compressive strength of corrugated cardboard boxes. Materials 2020, 13, 4578. [Google Scholar] [CrossRef]
- Avilés, F.; Carlsson, L.A.; May-Pat, A. A shear-corrected formulation of the sandwich twist specimen. Exp. Mech. 2012, 52, 17–23. [Google Scholar] [CrossRef]
- Garbowski, T.; Gajewski, T.; Grabski, J.K. Role of transverse shear modulus in the performance of corrugated materials. Materials 2020, 13, 3791. [Google Scholar] [CrossRef]
- Garbowski, T.; Gajewski, T.; Grabski, J.K. Torsional and transversal stiffness of orthotropic sandwich panels. Materials 2020, 13, 5016. [Google Scholar] [CrossRef]
- Urbanik, T.J.; Saliklis, E.P. Finite element corroboration of buckling phenomena observed in corrugated boxes. Wood Fiber Sci. 2003, 35, 322–333. [Google Scholar]
- Nordstrand, T. Basic Testing and Strength Design of Corrugated Board and Containers. Ph.D. Thesis, Lund University, Lund, Sweden, 2003. [Google Scholar]
- Nordstrand, T.; Carlsson, L. Evaluation of transverse shear stiffness of structural core sandwich plates. Comp. Struct. 1997, 37, 145–153. [Google Scholar] [CrossRef]
- Pozorski, Z.; Wojciechowski, S. The influence of symmetrical boundary conditions on the structural behaviour of sandwich panels subjected to torsion. Symmetry 2020, 12, 2093. [Google Scholar] [CrossRef]
- Yan, J.; Wang, G.; Li, Q.; Zhang, L.; Yan, J.D.; Chen, C.; Fang, Z. A comparative study on damage mechanism of sandwich structures with different core materials under lightning strikes. Energies 2017, 10, 1594. [Google Scholar] [CrossRef] [Green Version]
- Zhang, X.; Jin, X.; Xie, G.; Yan, H. Thermo-fluidic comparison between sandwich panels with tetrahedral lattice cores fabricated by casting and metal sheet folding. Energies 2017, 10, 906. [Google Scholar] [CrossRef] [Green Version]
- Duan, Y.; Zhang, H.; Sfarra, S.; Avdelidis, N.P.; Loutas, T.H.; Sotiriadis, G.; Kostopoulos, V.; Fernandes, H.; Petrescu, F.I.; Ibarra-Castanedo, C.; et al. On the use of infrared thermography and acousto-ultrasonics NDT techniques for ceramic-coated sandwich structures. Energies 2019, 12, 2537. [Google Scholar] [CrossRef] [Green Version]
- Garbowski, T.; Jarmuszczak, M. Homogenization of corrugated paperboard. Part 1. Analytical homogenization. Pol. Pap. Rev. 2014, 70, 345–349. (In Polish) [Google Scholar]
- Garbowski, T.; Jarmuszczak, M. Homogenization of corrugated paperboard. Part 2. Numerical homogenization. Pol. Pap. Rev. 2014, 70, 390–394. (In Polish) [Google Scholar]
- Hohe, J. A direct homogenization approach for determination of the stiffness matrix for microheterogeneous plates with application to sandwich panels. Compos. Part B 2003, 34, 615–626. [Google Scholar] [CrossRef]
- Buannic, N.; Cartraud, P.; Quesnel, T. Homogenization of corrugated core sandwich panels. Comp. Struct. 2003, 59, 299–312. [Google Scholar] [CrossRef] [Green Version]
- Biancolini, M.E. Evaluation of equivalent stiffness properties of corrugated board. Comp. Struct. 2005, 69, 322–328. [Google Scholar] [CrossRef]
- Abbès, B.; Guo, Y.Q. Analytic homogenization for torsion of orthotropic sandwich plates: Application. Comp. Struct. 2010, 92, 699–706. [Google Scholar] [CrossRef]
- Marek, A.; Garbowski, T. Homogenization of sandwich panels. Comput. Assist. Methods Eng. Sci. 2015, 22, 39–50. [Google Scholar]
- Garbowski, T.; Marek, A. Homogenization of corrugated boards through inverse analysis. In Proceedings of the 1st International Conference on Engineering and Applied Sciences Optimization, Kos Island, Greece, 4–6 June 2014; pp. 1751–1766. [Google Scholar]
- Singh, J.; Olsen, E.; Singh, S.P.; Manley, J.; Wallace, F. The effect of ventilation and hand holes on loss of compression strength in corrugated boxes. J. Appl. Packag. Res. 2008, 2, 227–238. [Google Scholar]
- Fadiji, T.; Coetzee, C.J.; Opara, U.L. Compression strength of ventilated corrugated paperboard packages: Numerical modelling, experimental validation and effects of vent geometric design. Biosyst. Eng. 2016, 151, 231–247. [Google Scholar] [CrossRef]
- Fadiji, T.; Ambaw, A.; Coetzee, C.J.; Berry, T.M.; Opara, U.L. Application of the finite element analysis to predict the mechanical strength of ventilated corrugated paperboard packaging for handling fresh produce. Biosyst. Eng. 2018, 174, 260–281. [Google Scholar] [CrossRef]
- Heimerl, G.J. Determination of plate compressive strengths. In National Advisory Committee for Aeronautics; Technical Note Number 1480; National Advisory Committee for Aeronautics (NACA): Washington, DC, USA, 1947. [Google Scholar]
- FEMat Systems. Available online: http://www.fematsystems.pl/en/systems/bct/ (accessed on 26 March 2020).
- Ventsel, E.; Krauthammer, T. Thin Plates and Shells. Theory, Analysis, and Applications; Marcel Dekker, Inc.: New York, NY, USA; Basel, Switzerland, 2001. [Google Scholar]
- Norstrand, T. On buckling loads for edge-loaded orthotropic plates including transverse shear. Comp. Struct. 2004, 65, 1–6. [Google Scholar] [CrossRef]
- Wang, C.M.; Wang, C.Y.; Reddy, J.N. Exact Solutions for Buckling of Structural Members; CRC Press: Boca Ratton, FL, USA, 2005. [Google Scholar]
- Zienkiewicz, O.C.; Taylor, R.L.; Papadopoulus, P.; Onate, E. Plate bending elements with discrete constraints: New Triangular Elements. Comput. Struct. 1990, 35, 505–522. [Google Scholar] [CrossRef]
- Zienkiewicz, O.C.; Taylor, R.L. The Finite Element Method for Solid and Structural Mechanics, 6th ed.; Butterworth-Heinemann: Oxford, UK, 2005. [Google Scholar]
- Onate, E.; Castro, J. Derivation of plate elements based on assumed shear strain fields. In Recent Advances on Computational Structural Mechanics; Ladeveze, P., Zienkiewicz, O.C., Eds.; Elsevier Pub: Amsterdam, The Netherlands, 1991. [Google Scholar]
- Buchanan, J.S.; Draper, J.; Teague, G.W. Combined board characteristics that determine box performance. Paperboard Packag. 1964, 49, 74–85. [Google Scholar]
- Shick, P.E.; Chari, N.C.S. Top-to-bottom compression for double wall corrugated boxes. Tappi J. 1965, 48, 423–430. [Google Scholar]
- Wolf, M. New equation helps pin down box specifications. Package Eng. 1972, 17, 66–67. [Google Scholar]
- FEMat Systems. Available online: http://www.fematsystems.pl/en/systems/bse/ (accessed on 26 September 2020).
- Garbowski, T.; Borysiewicz, A. The stability of corrugated board packages. Pol. Pap. Rev. 2014, 70, 452–458. (In Polish) [Google Scholar]
- Hughes, T.R.J. The finite element method. In Linear Static and Dynamic Analysis; Prentice Hall: Upper Saddle River, NJ, USA, 1987. [Google Scholar]
- Onate, E. Structural Analysis with the Finite Element Method. Vol. 1: Basis and Solids; Springer-CIMNE: Berlin/Heidelberg, Germany, 2009. [Google Scholar]
- Onate, E.; Zienkiewicz, O.C.; Suarez, B.; Taylor, R.L. A general methodology for deriving shear constrained Reissner-Mindlin plate elements. Int. J. Numer. Meth. Eng. 1992, 33, 345–367. [Google Scholar] [CrossRef]
Figure 1.
(a) A single panel of width and height separated from cardboard packaging as a supported plate under compression; (b) cardboard packaging in press during box compression testing; (c) box compression press used in laboratory tests [32].
Figure 1.
(a) A single panel of width and height separated from cardboard packaging as a supported plate under compression; (b) cardboard packaging in press during box compression testing; (c) box compression press used in laboratory tests [32].

Figure 2.
(a) triangular mesh on a single panel with circular opening; (b) eighteen degrees of freedom triangular Reissner-Mindlin plate FE; (c) isoperimetric formulation of 6-node triangle FE.
Figure 2.
(a) triangular mesh on a single panel with circular opening; (b) eighteen degrees of freedom triangular Reissner-Mindlin plate FE; (c) isoperimetric formulation of 6-node triangle FE.

Figure 3.
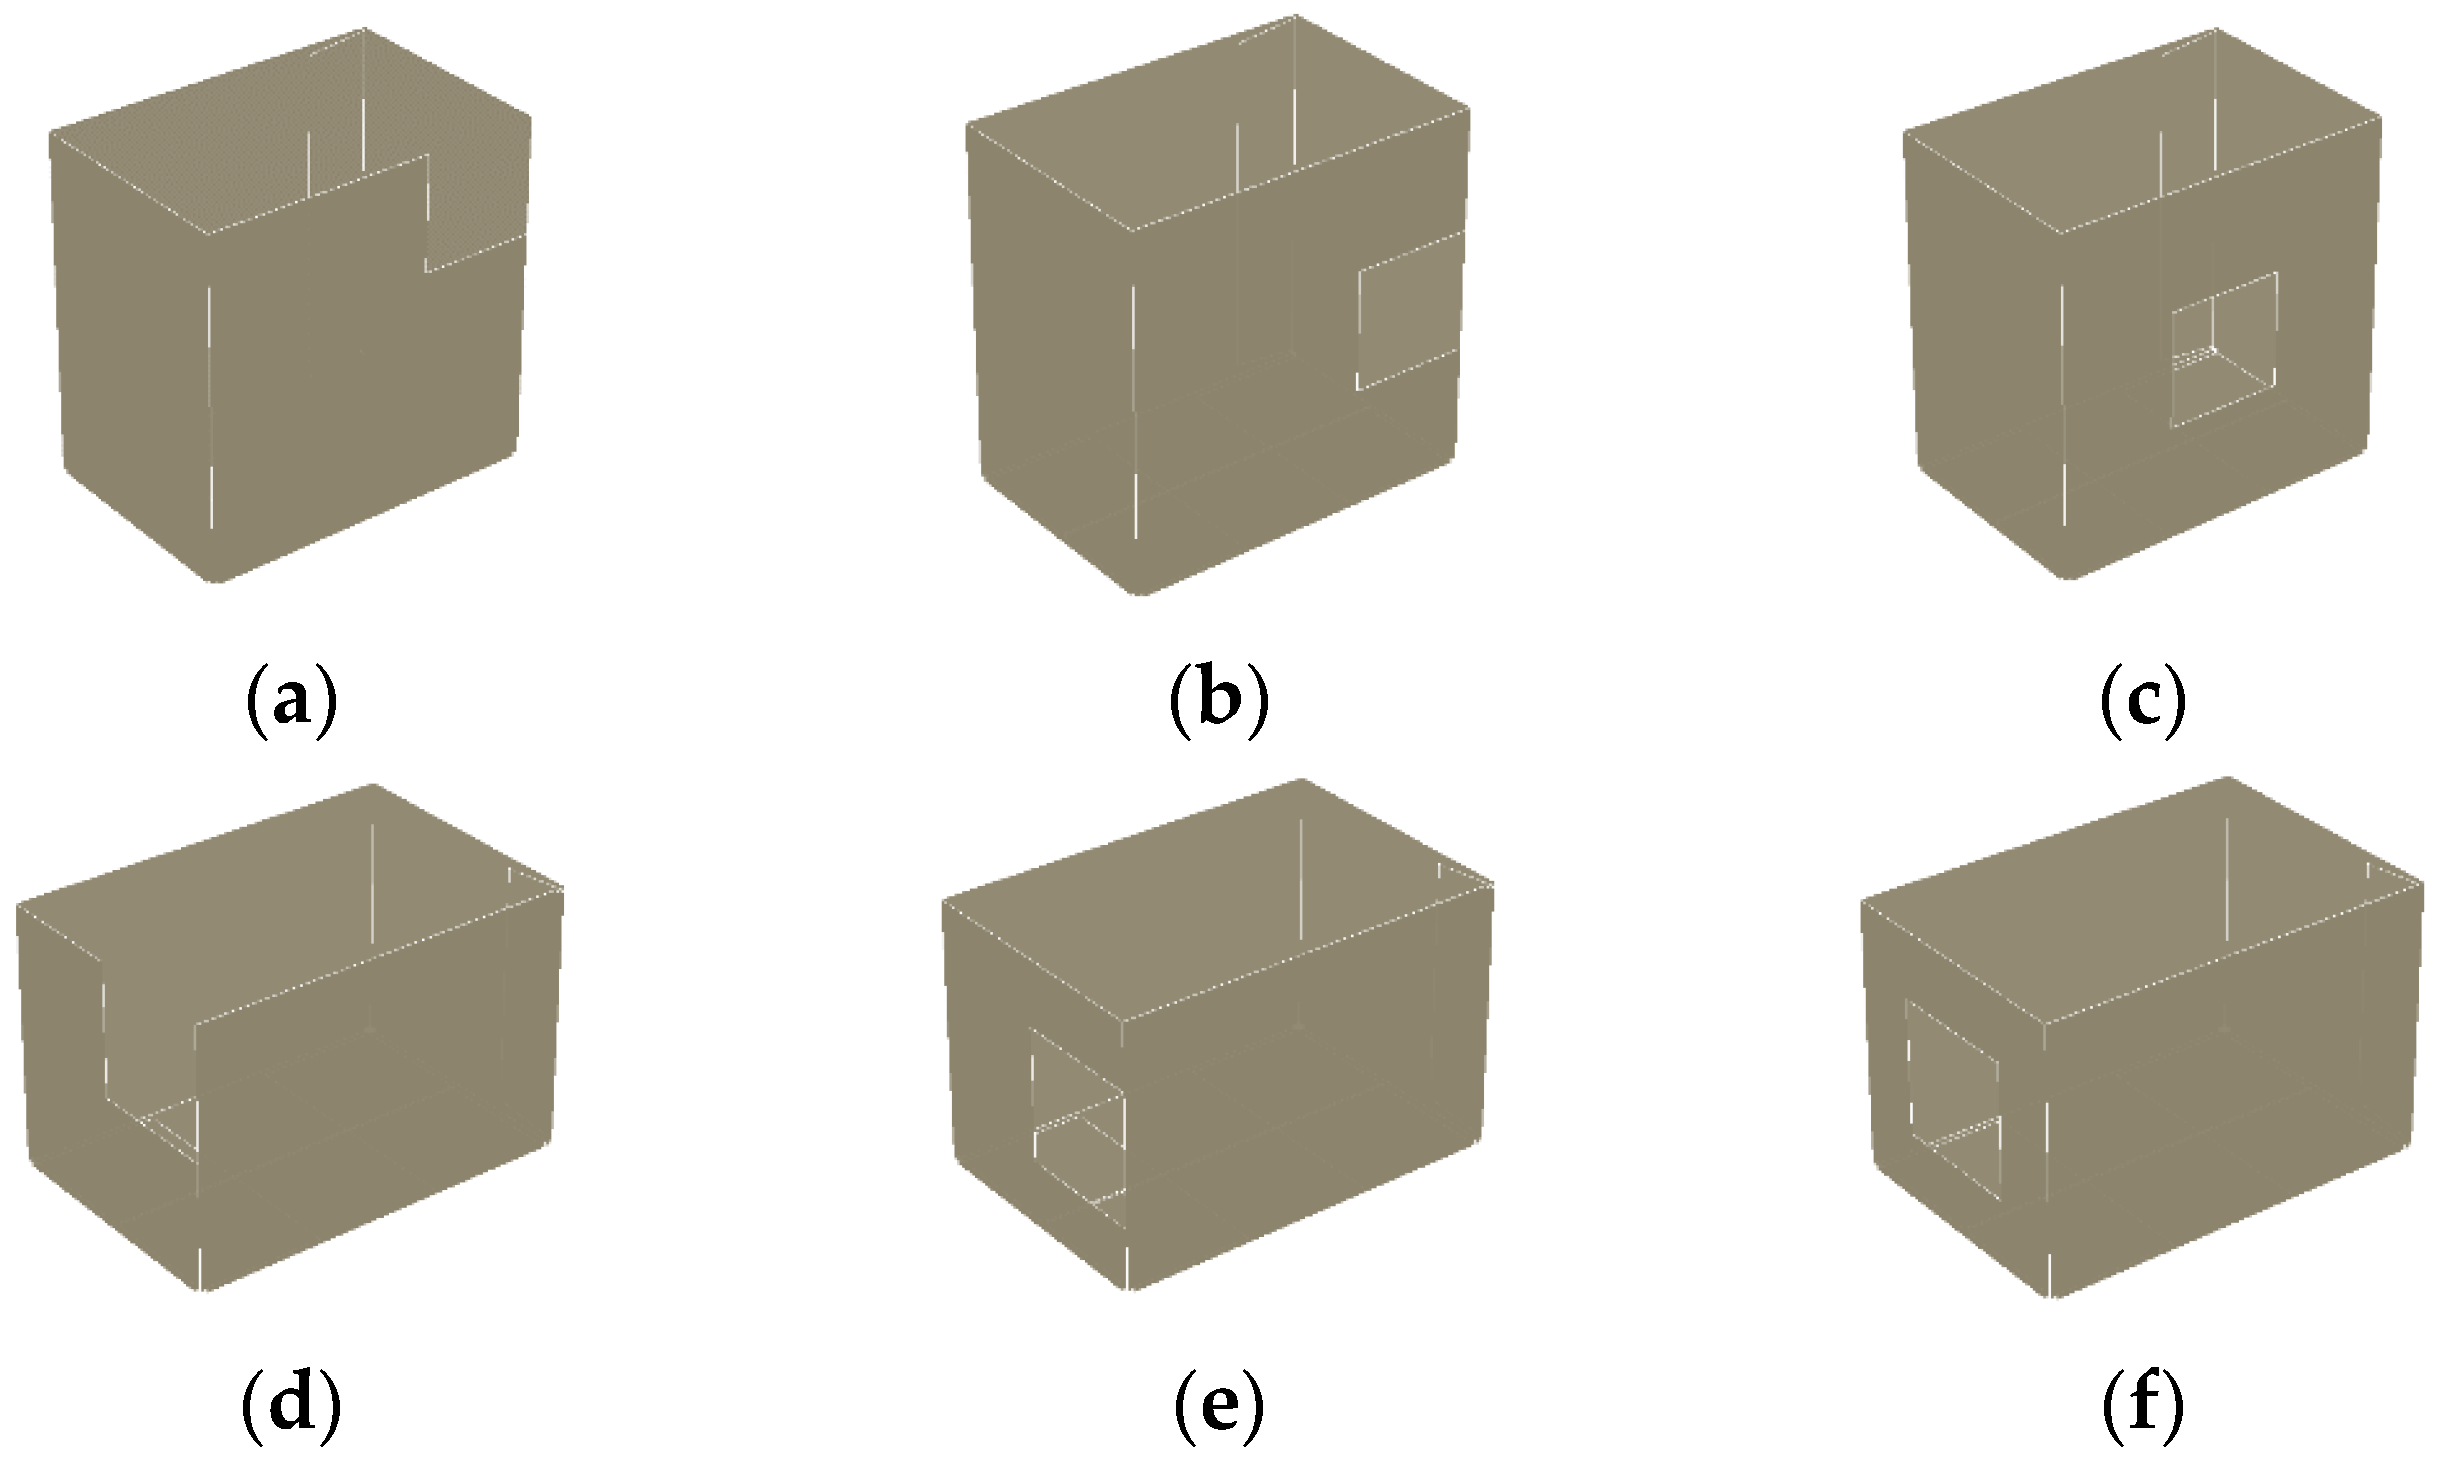
Designs of boxes without upper flaps with openings considered in the study—modifications of FEFCO F200 with box height of mm: (a) O1L1S, (b) O2L1S, (c) O3L1S and box height of mm (d) O1B1S, (e) O2B1S, and (f) O3B1S.
Figure 3.
Designs of boxes without upper flaps with openings considered in the study—modifications of FEFCO F200 with box height of mm: (a) O1L1S, (b) O2L1S, (c) O3L1S and box height of mm (d) O1B1S, (e) O2B1S, and (f) O3B1S.

Figure 4.
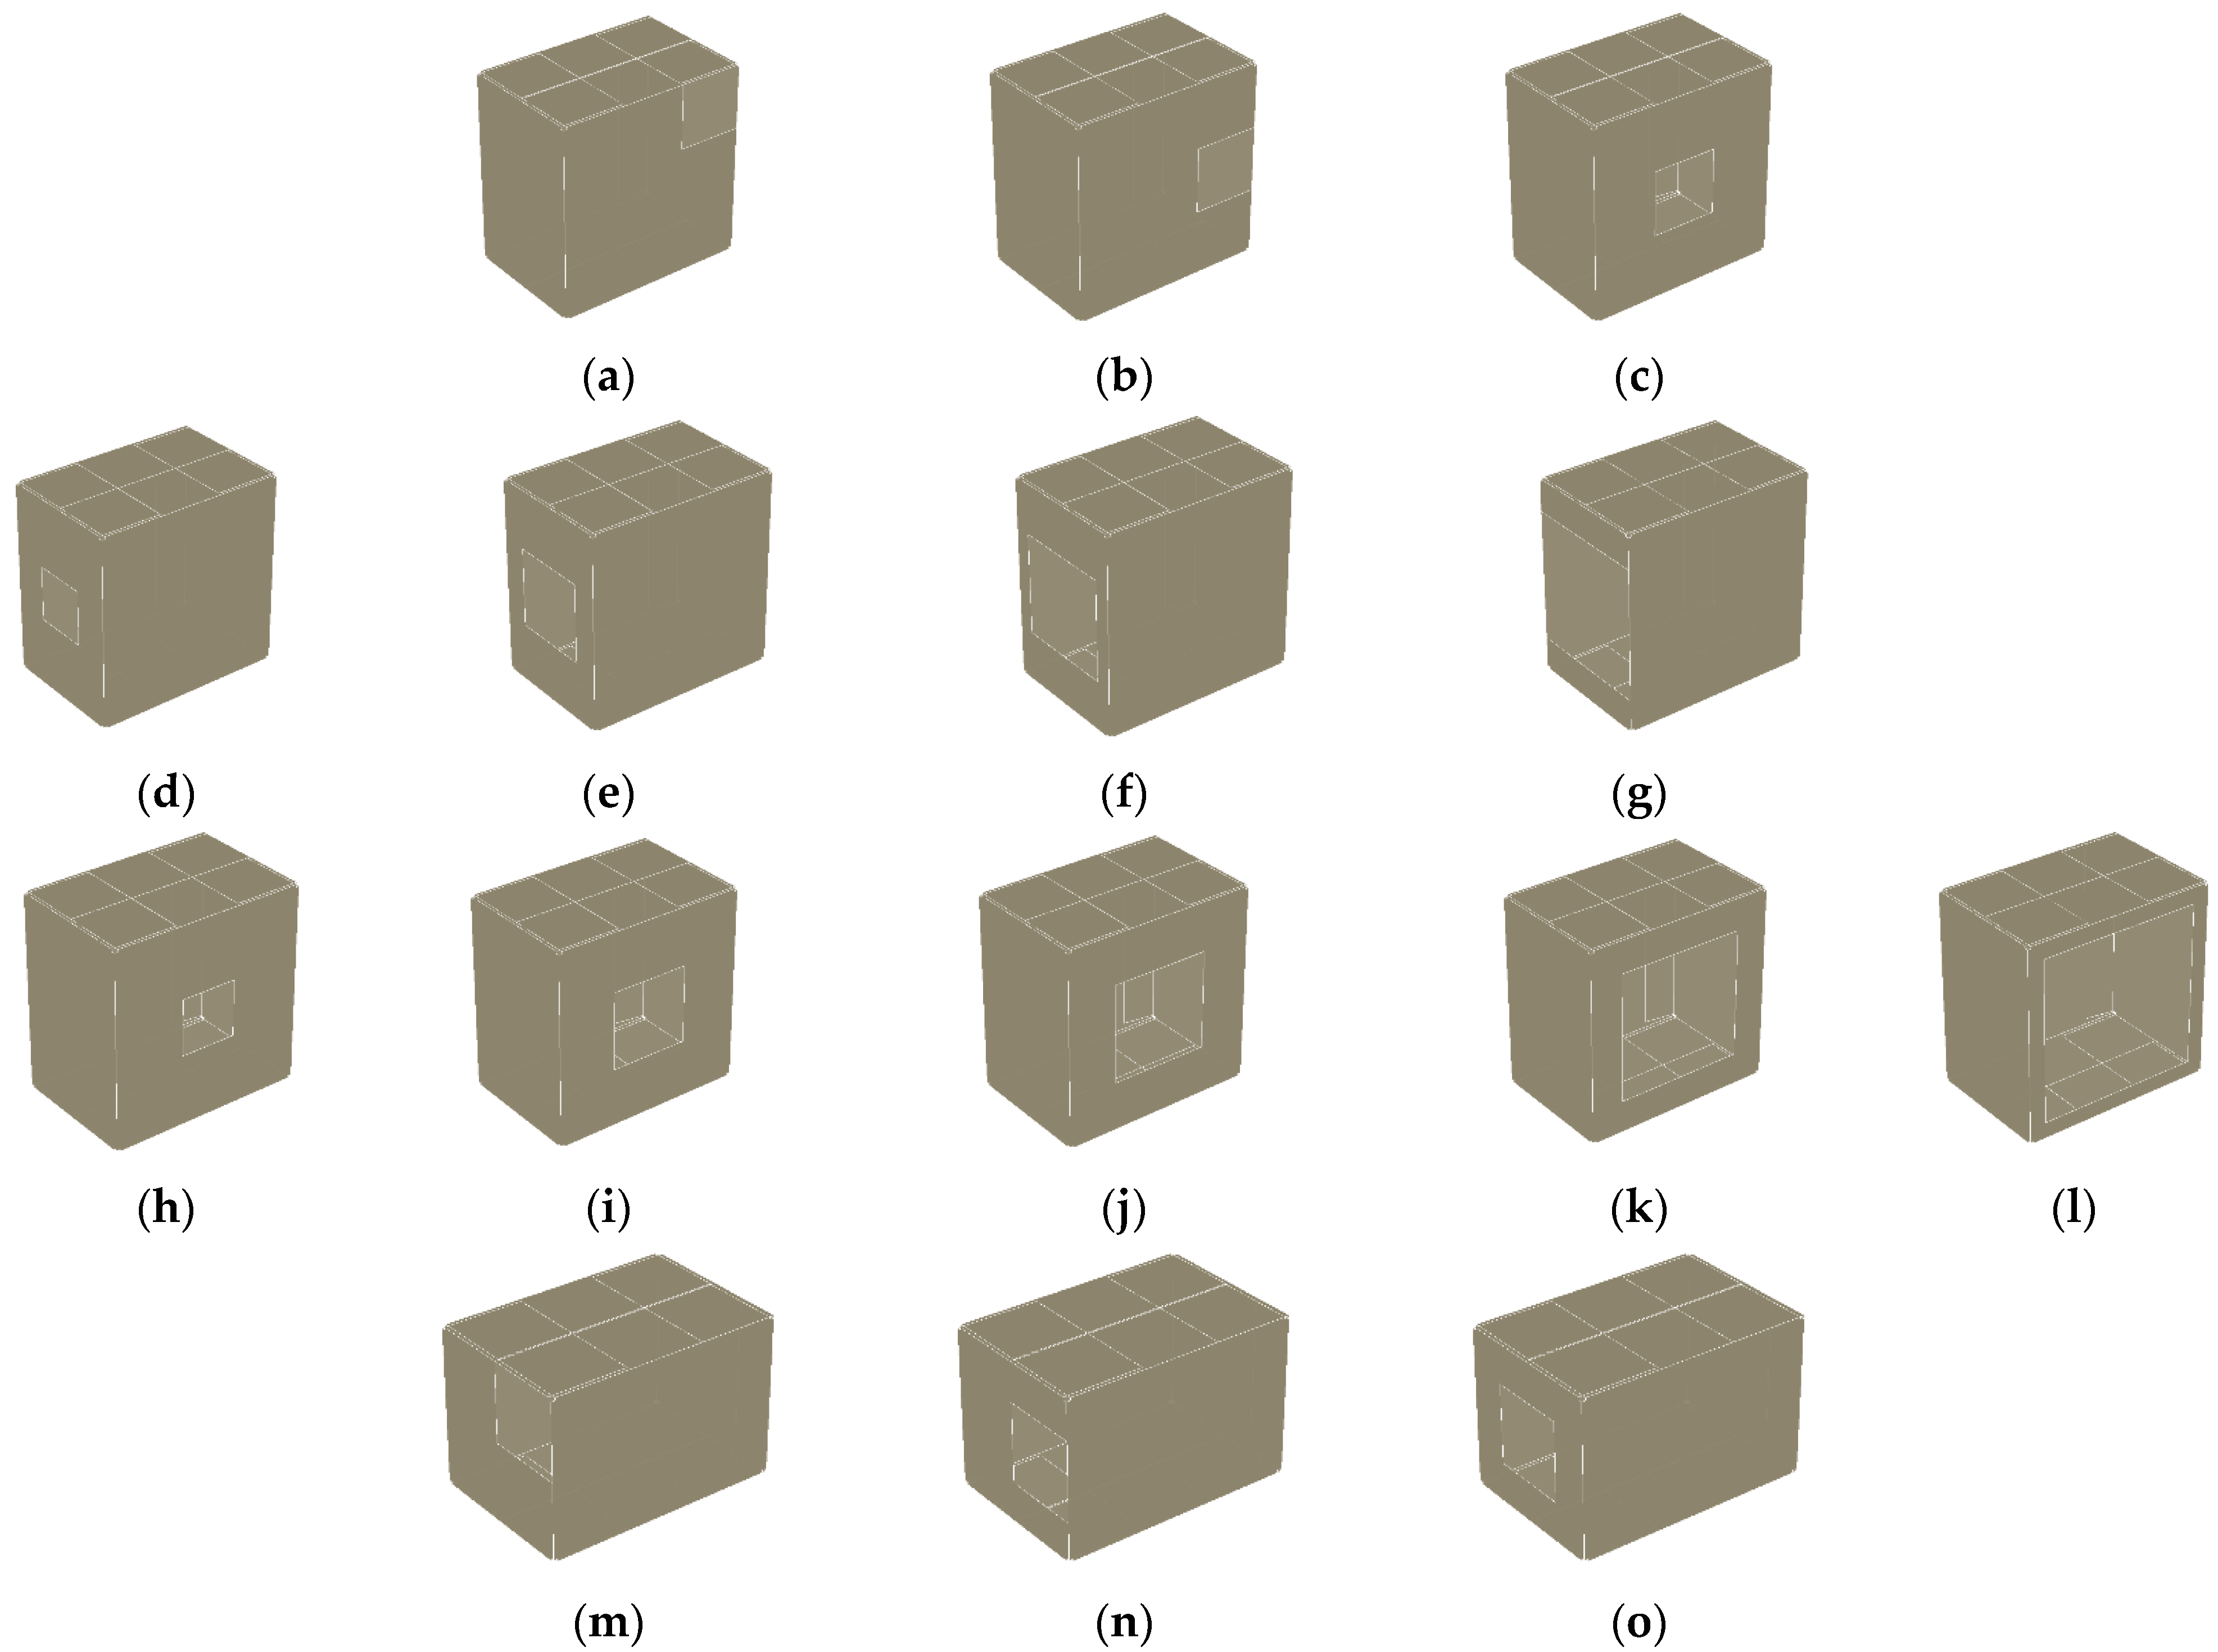
Designs of flap boxes with openings considered in the study—modifications of FEFCO F201 with box height of mm: (a) O1L1S, (b) O2L1S, (c) O3L1S, (d), O3B1S1a (e) O3B1S1b, (f) O3B1S1c, (g) O3B1S1d, (h) O3L1S1a, (i) O3L1S1b, (j) O3L1S1c, (k) O3L1S1d, (l) O3L1S1e and with box height of mm: (m) O1B1S, (n) O2B1S, and (o) O3B1S.
Figure 4.
Designs of flap boxes with openings considered in the study—modifications of FEFCO F201 with box height of mm: (a) O1L1S, (b) O2L1S, (c) O3L1S, (d), O3B1S1a (e) O3B1S1b, (f) O3B1S1c, (g) O3B1S1d, (h) O3L1S1a, (i) O3L1S1b, (j) O3L1S1c, (k) O3L1S1d, (l) O3L1S1e and with box height of mm: (m) O1B1S, (n) O2B1S, and (o) O3B1S.

Figure 5.
Example measurements from a box compression test machine [32] for different boxes and holes: (a) F0200—O1B1S, (b) F201—O3B1S1c and (c) F201O3L1S1d.
Figure 5.
Example measurements from a box compression test machine [32] for different boxes and holes: (a) F0200—O1B1S, (b) F201—O3B1S1c and (c) F201O3L1S1d.

Figure 6.
Measured box compression strengths (black line), computed by a method proposed with typical (blue line) and optimal (red line) parameters of and, and McKee formula (dashed magenta line) for FEFCO type boxes of (a) F200 and (b) F201.
Figure 6.
Measured box compression strengths (black line), computed by a method proposed with typical (blue line) and optimal (red line) parameters of and, and McKee formula (dashed magenta line) for FEFCO type boxes of (a) F200 and (b) F201.

Figure 7.
Contour plot of mean errors [%] obtained for presented method, see Equation (39), and different values of and .
Figure 7.
Contour plot of mean errors [%] obtained for presented method, see Equation (39), and different values of and .


Table 1.
Experimental data for FEFCO F200 boxes for different: opening type, box height, cardboard quality and box compression strength.
Table 1.
Experimental data for FEFCO F200 boxes for different: opening type, box height, cardboard quality and box compression strength.
| No. | Opening Type | Box Height [mm] | Cardboard Quality | Box Strength [N] |
|---|---|---|---|---|
| 1 | O3B1S | 200 | 3E350-3 | 901.4 |
| 2 | O2B1S | 200 | 3E350-3 | 742.3 |
| 3 | O2B1S | 200 | 3B400A1-1 | 1777.9 |
| 4 | O1B1S | 200 | 3B400A1-1 | 1842.7 |
| 5 | O3B1S | 200 | 3B400A1-1 | 2101.6 |
| 6 | O1L1S | 300 | 3B400A1-3 | 1819.4 |
| 7 | O2L1S | 300 | 3B400A1-3 | 1903.0 |
| 8 | O3L1S | 300 | 3B400A1-3 | 2184.3 |
Table 2.
Experimental data for FEFCO F201 boxes for different: opening type, box height, cardboard quality and box compression strength.
Table 2.
Experimental data for FEFCO F201 boxes for different: opening type, box height, cardboard quality and box compression strength.
| No. | Opening Type | Box Height [mm] | Cardboard Quality | Box Strength [N] |
|---|---|---|---|---|
| 9 | O1B1S | 200 | 3E350-3 | 694.3 |
| 10 | O3B1S | 200 | 3E350-5 | 783.8 |
| 11 | O1L1S | 300 | 3E350-5 | 699.3 |
| 12 | O3L1S | 300 | 3E350-5 | 842.9 |
| 13 | O2B1S | 200 | 3E350-5 | 697.5 |
| 14 | O3B1S | 200 | 3E380A2-1 | 944.6 |
| 15 | O2L1S | 300 | 3E380A2-1 | 935.7 |
| 16 | O3L1S | 300 | 3E380A2-1 | 1085.3 |
| 17 | O1L1S | 300 | 3E380A2-2 | 854.8 |
| 18 | O1B1S | 200 | 3B400A1-1 | 1630.0 |
| 19 | O3B1S | 200 | 3B400A1-1 | 1902.9 |
| 20 | O2B1S | 200 | 3B400A1-1 | 1629.0 |
| 21 | O1L1S | 300 | 3B400A1-3 | 1647.5 |
| 22 | O2L1S | 300 | 3B400A1-3 | 1701.9 |
| 23 | O3L1S | 300 | 3B400A1-3 | 2133.6 |
| 24 | O3B1S1a | 300 | 3B480-1 | 1841.1 |
| 25 | O3B1S1b | 300 | 3B480-1 | 1717.9 |
| 26 | O3B1S1c | 300 | 3B480-1 | 1606.6 |
| 27 | O3L1S1e | 300 | 3B480-1 | 1362.9 |
| 28 | O3L1S1b | 300 | 3B480-1 | 1743.5 |
| 29 | O3L1S1c | 300 | 3B480-1 | 1772.4 |
| 30 | O3L1S1d | 300 | 3B480-1 | 1591.3 |
| 31 | O3L1S1a | 300 | 3B480-1 | 1782.3 |
Table 3.
Material data for the cardboard qualities used in FEM computations of critical loads [42,43].
| No. | Cardboard Quality | Thickness [mm] | ECT | |||||
|---|---|---|---|---|---|---|---|---|
| 1 | 3B400A1-1 | 2.82 | 5.79 | 3484.8 | 1789.8 | 2262.1 | 7.73 | 12.78 |
| 2 | 3B400A1-3 | 2.80 | 5.50 | 3443.5 | 1565.5 | 2115.5 | 6.09 | 11.30 |
| 3 | 3B480-1 | 2.82 | 5.29 | 3491.2 | 1820.1 | 2359.9 | 5.66 | 12.40 |
| 4 | 3E350-3 | 1.49 | 3.96 | 958.9 | 431.5 | 870.2 | 2.49 | 2.79 |
| 5 | 3E350-5 | 1.49 | 4.68 | 878.6 | 376.9 | 904.0 | 2.86 | 2.97 |
| 6 | 3E380A2-1 | 1.59 | 5.41 | 1272.1 | 505.4 | 1084.5 | 3.83 | 3.86 |
| 8 | 3E380A2-2 | 1.52 | 5.31 | 1042.9 | 445.1 | 963.2 | 3.39 | 3.70 |
Table 4.
Mean error of McKee formula and the method proposed for typical and optimal set of and parameters.
Table 4.
Mean error of McKee formula and the method proposed for typical and optimal set of and parameters.
| Case | k [—] | r [—] | Mean Error [%] |
|---|---|---|---|
| McKee formula | 0.4215 | 0.746 | 15.5 |
| method proposed (typical parameters) | 0.500 | 0.750 | 14.9 |
| method proposed (optimal parameters) | 0.755 | 0.435 | 6.5 |
Publisher’s Note: MDPI stays neutral with regard to jurisdictional claims in published maps and institutional affiliations. |
© 2020 by the authors. Licensee MDPI, Basel, Switzerland. This article is an open access article distributed under the terms and conditions of the Creative Commons Attribution (CC BY) license (http://creativecommons.org/licenses/by/4.0/).
Share and Cite
MDPI and ACS Style
Garbowski, T.; Gajewski, T.; Grabski, J.K. Estimation of the Compressive Strength of Corrugated Cardboard Boxes with Various Openings. Energies 2021, 14, 155. https://doi.org/10.3390/en14010155
AMA Style
Garbowski T, Gajewski T, Grabski JK. Estimation of the Compressive Strength of Corrugated Cardboard Boxes with Various Openings. Energies. 2021; 14(1):155. https://doi.org/10.3390/en14010155
Chicago/Turabian StyleGarbowski, Tomasz, Tomasz Gajewski, and Jakub Krzysztof Grabski. 2021. "Estimation of the Compressive Strength of Corrugated Cardboard Boxes with Various Openings" Energies 14, no. 1: 155. https://doi.org/10.3390/en14010155
Note that from the first issue of 2016, this journal uses article numbers instead of page numbers. See further details here.