
Assessment of Indoor Air Parameters in Building Equipped with Decentralised Façade Ventilation Device


Department of Building Physics and Renewable Energy, Faculty of Environmental, Geomatic and Energy Engineering, Kielce University of Technology, 25-314 Kielce, Poland
Energies 2021, 14(4), 1176; https://doi.org/10.3390/en14041176
Submission received: 2 February 2021
/
Revised: 11 February 2021
/
Accepted: 18 February 2021
/
Published: 22 February 2021
(This article belongs to the Special Issue Energy-Saving, Comfort, and Healthier Strategies for Smart Buildings)
Abstract
:The study contains an analysis of a decentralised unit installed in a building façade, where air supply and exhaust cycles are swapped by proper positioning of dampers. The analysis was carried out in real conditions in an office building. The Computational Fluid Dynamics (CFD) simulation is an important element of the system design, and has become more and more widely used. Simulation of the analysed unit has shown air stream distribution in a room. Moreover, it allowed for determination of indoor air temperature. Completed analysis and CFD simulations allow for the observation that façade ventilation systems provide a good way to improve the indoor microclimate, as they effectively reduce air pollution. The decentralised façade ventilation unit reduced the carbon dioxide concentration to a level lower than 1000 ppm and maintained the indoor air temperature in the range of 19.5–22 °C. The error for CFD simulation equals 0.5%, which is not much. The results of research and analysis show that the highest reduction of carbon dioxide concentration occurred when supply/exhaust time equalled 10 min. At the same time, when supply/exhaust time equalled 10 min, the indoor air temperature was the lowest of the recorded values.
1. Introduction
Considering the importance of air quality, and taking into account the financial aspects, the search for a method which allows for the improvement of microclimate in rooms is much needed. Decentralised façade ventilation is one possible solution. Poor indoor air quality significantly affects the health and condition of people staying in rooms. It may also reduce the productivity of building users and increase the absence frequency of employees [1,2,3,4,5,6,7,8]. In educational facilities, it may reduce learning efficiency [9,10,11,12,13,14]. The current trend connected with the energy efficiency of buildings disturbs the microclimate of interiors ventilated naturally. Building managers want to reduce heat losses, so they insulate buildings. This, in turn, increases the air tightness of buildings. Less air flowing into the building has an adverse effect on indoor air quality, inducing a rise in temperature, humidity and pollution in the air. This may result in the occurrence of mould fungi on baffles, which, in turn, are destructive to the structure and their spores may cause allergies and asthma [15,16]. According to the World Health Organization (WHO) report [17], 3.8 million deaths in the world in 2016 resulted from air pollution. In low- and average-income countries, air pollution is responsible for the deaths of 10% of people, and in high income countries 0.2%. In China alone total deaths due to bad air conditions reached 111,000 and the number of emergency doctor visits 4.3 million [18].
Carbon dioxide is one of the indoor air pollutants in occupied spaces. Its concentration in rooms which are naturally ventilated could even exceed 5000 ppm [19]. The assumed acceptable concentration of carbon dioxide is 700 ppm above its concentration outside a building [20]. Since its relationship with some pollutants is too weak, carbon dioxide cannot be deemed an undisputable air quality indicator [21,22]. Nevertheless, a too high CO2 concentration may have an adverse effect on health (headaches and dizziness, nausea, fatigue). Therefore, determining whether its reduction is possible through efficient ventilation is an important element of indoor air quality improvement [23,24,25,26].
Building façade sealing makes it necessary to control air humidity in naturally ventilated buildings. According to the literature [27], the volume of steam appearing in a room during a week reaches up to 100 kg. To maintain air humidity in a room at a more or less constant level requires intensive removal of steam [28]. At the same time, the share of steam contained in the air and penetrating through the baffles as a result of the diffusion process in humidity balance, determined on the basis of the standard EN 13,788 [29], ranges from 1% to 3% of total steam emissions [30].
The analyses carried out so far have proven the increase of indoor air humidity in thermally upgraded facilities [31]. This means that investors, while focusing on the improvement of a single parameter, undertake actions affecting other indoor environment properties. This unequivocally indicates the need for a look at the building as a whole—the structure with its technical equipment—if any modifications are to be introduced in the facility.
Ventilation systems are technical equipment which reduce the concentration of air pollution. Observations demonstrated in literature [32] indicate that the interrelation of air leaks through any gaps and pressure differences is the key to understanding the interactions between the building façade and the Heating, Ventilation and Air Conditioning (HVAC) systems. The pressure field must be under control so as to ensure that buildings are designed and built safe, healthy, durable, comfortable and cost-effective. The most efficient way to increase the volume of air exchanged in buildings is to use mechanical ventilation systems. However, in existing buildings, it is often impossible to introduce any ventilation system due to structural reasons or because there is insufficient space to install air ducts. Decentralised ventilation systems have become an increasingly popular way to improve indoor conditions. It is a solution which supplies and exhausts air from a single room. These systems enable the intensification of air exchange if the natural ventilation is insufficient. Moreover, they do not require much space for installation in the building. They are installed individually in the room’s façade. They can be built as “mini” air handlers equipped with heat recovery exchanger or as units that alternately supply and exhaust air. Usually, they are installed in rooms situated in opposite sections of a building. While one unit supplies air, the unit on the opposite side exhausts it. Both units swap their cycles after a specific amount of time. The switch from air supply to air exhaust is possible owing to either a reversible fan or a special arrangement of dampers, opening and closing alternately, in pairs.
One of the methods used to process microclimate parameters with a simultaneous reduction of energy consumption is the system characterised in literature [33]. The employed compact heating and ventilation system integrated in a prefabricated wooden frame built-in into the façade was improving indoor air quality while reducing energy consumption by 25%. Decentralised ventilation units provide another way to improve air quality in rooms. These can be either independent units for individual room ventilation or units installed in walls and equipped with a single fan. The first solution includes units—which are much like heat recovery units—equipped with two fans, a heat exchanger and filters. As for on-wall equipment, these are large size units. The second solution includes units that alternately supply and exhaust air. We can distinguish units with a reversible fan that operates in a 70-s cycle. After this time the direction of air flow through the unit is changed. Another solution is a unit equipped with fan always pumping air in one direction (Figure 1). In this case a system of dampers runs air stream via the duct system inducing alternate supply and exhaust of air. In the second case it is possible to adjust air supply and exhaust cycle length depending on the damper closing and opening frequency setting.
The results of studies on centralised and decentralised ventilation carried out by M.K. Kim and L. Baldini, 2016 [34] proved that among the analysed systems, the decentralised system reached the lowest energy demand and the highest energy efficiency. High energy efficiency resulted from pressure loss minimisation.
The results of efficiency analysis regarding decentralised systems integrated with building façade were also discussed by Coydon et al. 2015 [35]. The authors proposed using the calorimetric method to evaluate energy characteristics of ventilation systems. They have emphasised that in the case of decentralised equipment and the occurrence of “short circuit”, supply air drawing is particularly important. This phenomenon is positive as regards energy consumption, yet negative from the point of view of air exchange.
Considering energy-related advantages of decentralised systems and problems with indoor air conditioning, it is necessary to carry out studies and analyses of solutions of this sort. The purpose of the article was the evaluation of the ability of decentralised façade ventilation devices to dilute the gas pollution and their ability to maintain the internal temperature at the level corresponding with legislation. In the article, there were presented the experimental data, which were measured in real conditions, in the office building equipped with the decentralised façade ventilation device. The CFD simulation was conducted. This simulation was validated with values of measured temperature in the room. The work of the device was evaluated using statistical method as well.
2. Materials and Methods
The analysis covered a patented [36] room ventilation unit (Figure 2). The unit is equipped with a single fan alternately supplying and exhausting air depending on current cycle, and with four dampers that close and open by turns. An element forming both air intake and exhaust is fixed onto the outside façade, while inside the room there is the end component, working as an air supply device and outlet at the same time. Air supply/exhaust cycle execution depends on current position of automatically controlled dampers.
According to Figure 3, air drawn-in through air intake NW-7 flows through an air filter that purifies it from solid particles. Dampers NW-2 in plot 2 and NW-3 in plot 7 are open, while dampers NW-1 in plot 8 and NW-4 in plot 4 are closed. Air is supplied via plots 1–2–3–12–11–10–7–6–13 and grate N/W-8. In the second phase of the cycle—air exhausted from the room—dampers NW-1 in plot 8 and NW-4 in plot 4 are open, and dampers NW-2 in plot 2 and NW-3 in plot 7 are closed. Air is exhausted through grate NW-8 and plots 13–5–4–12–11–10–8–9–1—the same direction of air flow through the fan as in the first cycle. Duct fan NW-6 operates continuously, but air is pumped through different routes, depending on supply/exhaust cycle phase. Box NW-5 is fitted in plot 10, intended for the installation of the heat recovery exchanger. Damper actuators allow automatic control of their opening and closing that ensures smooth unit operation. The control system allows for setting the duration of individual cycles. The time spent on opening and closing of the dampers equals 19 s (resulting from the technical characteristics of the element).
2.1. The Procedure of the Experiment and Specification of the Measurement Devices
The measurement of carbon dioxide concentration, indoor air temperature and humidity was carried out using indoor air quality monitors (Table 1). At the same time, outside air parameters were measured in a weather station (Table 2). The velocity and volume of supply and exhaust air was measured using a balometer (Table 3). The experimental measurement lasted 26 weeks. This period was divided into two-week series. During each series, the measurements were conducted continuously with a time step of 10 s. The setting of the time supply/exhaust air of the decentralised façade ventilation device was changed during the experiment. The setting was 2 min for 8 weeks, 4 min for 8 weeks and 10 min for 10 weeks.
The purpose of the analysis was to determine possibilities for microclimate forming in a room equipped with a decentralised unit. A CFD simulation (of numerical fluid mechanics) was performed. The tests of an object working in real conditions allowed verification and validation of the model.
The measurements were carried out in the autumn–winter–spring season (they were started on November 2017 and finished on March 2018). The measurement period were selected because in this period the greatest growths of carbon dioxide concentration in the naturally ventilated buildings are observed. The subject of the research was an office room and it was located in a temperate climate in Poland. The values of external temperature characteristic for object localization and the period of experimental measurement are in the range −20 °C–+10 °C. The outdoor air temperature fluctuated during the measurements because analysis was being conducted in real conditions. The analysed building, before applying decentralized ventilation, was ventilated naturally. It was built in 2015. The external doors are located on the south side, while the windows are on the south, north and west sides. To measure there were three air quality monitors used which were located: in the workplace 0.8 m above the floor (spot 1), in a windowsill 0.88 m above the floor (spot 2), and in a central point of the room 1.5 m above the floor (spot 3). In Figure 4, the blue colour indicates the location of air supply/exhaust hole, and violet indicates the locations of measuring instruments.
At this stage, we checked how the unit affects indoor air parameters without heat recovery in a room ventilation unit. However, the study will involve applying different possibilities in this regard in order to find the optimal solution. Air supply/exhaust proceeded along a wall situated opposite to the users’ workspace so as to avoid the risk for people to feel the draught.
2.2. The Simulation Procedure
In the applied solution, the air outflow from the premises during the supply cycle and the supply during the exhaust cycle took place through a small slit in the door between the premises. Therefore, it was necessary to use a discretization mesh with small cell size of 0.025 × 0.025 × 0.025 m, resulting in 2,008,164 cells of the model. The basis for the numerical method used were the equations: continuity Equation (1), conservation equation for species (2), momentum Equation (3) and energy Equation (4).
where ρ is the fluid density (kg·m−3), t is the time (s), u is the velocity vector (m·s−1), Yi is the mass fraction of the i-th molecule, Di is the material diffusivity of the i-th molecule (m2·s−1), mi‴ is the mass of the i-th molecule in a unit of volume (kg·m−3), p is the pressure (Pa), f is the external force (N), τ is the stress tensor (N·m−2), h is the enthalpy (J·kg−1), is the heat release rate per volume unit, q is the heat flux vector (W·m−2) and ε is the kinetic energy dissipation rate (m2·s−3).
For the turbulence simulation the Large Eddy Simulation (LES) method was used. It enables a more accurate capturing of the turbulent flows compared to the traditional Reynolds-Averaged Navier-Stokes (RANS) approach [37]. This method connects the RANS method and the Direct Numerical Simulation (DNS) method. The LES equation is based on the filter used for the Navier-Stokes (NS) equation (continuity of mass and momentum equations) and it introduces separation into large scale vortex and microburst phenomena. For the large scale the flow is resolved and numerically solved, whilst for the small scale, the flow is unresolved and represented by a sub-grid scale model. It is thus possible to directly calculate the large vortices and the vortices involved in the cascade energy transfer process.
The stress tensor is expressed by Formula (5).
where μ is the viscosity (Pa·s−1).
The matrix equation can be seen in Formula (6).
The dynamic viscosity for the LES method used is determined according to Smagorinsky’s analysis in the form of Equation (7).
It was assumed that the stochastic components of the flow at the velocity-specified inlet boundaries are neglected because the level of turbulence at the inflow boundaries is negligible. For the velocity inlet, the fluctuations are added to the mean specified velocity. To solve the equations the FDS6.5.2 software was used.
As part of the model verification, the suitability for testing was checked by assessing the possibility of correct modelling of characteristic physical phenomena associated with the design of ventilation systems. In the analysed object, there were individual air flows characteristic of the supply and the exhaust ventilation system. The calculations were carried out using the available software options and the recommendations given in the manual.
The calculations took into account the boundary conditions provided by data from the experiment conducted on the premises: the initial indoor air temperature was equal to 22 °C and the parameters of the supply/exhaust air were determined using a balometer and they were changing during the test. The inlet/outlet of the room ventilation unit had a diameter of 100 mm, while the slit dimensions in the door between the premises was 25 × 104 mm.
The validation of the CFD model was performed by comparing results to experimental data by measuring the indoor air temperature when the ventilation device was working.
The analysed room (Figure 5) was equipped with two tables and two chairs. The air was supplied/exhausted from the decentralised façade ventilation device along the external wall. The air, through the gap in the lower part of the internal door, was outflow in the supply cycle and inflow in the exhaust cycle. The simulations of changes in the air velocity on the premises, indoor air temperature and CO2 concentration were carried out. This created visualizations made for the vertical cross-section of the premise. The supply/exhaust air velocity was changing in the range 0.1–3.4 m·s−1. This parameter was from the experimental measurements and was used like a boundary condition for inlet/outlet (Table 4 and Table 5).
2.3. The statistical Method
Variance analysis was applied to evaluate the proposed solution statistics. Tukey’s multiple comparison tests were carried out. The reduction of CO2 concentration (characteristic—reduction) and influence of the ventilation device on the internal temperature (characteristic—temperature) was analysed. The groups of compared data were determined by setting (air supply/exhaust cycle duration: 2 min, 4 min, 10 min).
3. Results and Discussion
The CFD was used to simulate changes in indoor air parameters during execution of supply and exhaust cycles. The simulation results were validated based on the experimental measurements of the indoor air temperature. Temperature was measured in two spots in the room (workplace and central point). Completed analysis proves compliance of the measured values with those obtained from simulations (error 0.5%). Figure 6 presents changes in temperature values during the air supply cycle for the setting of two min in the axis of the supply air stream. In this cycle, air driven by generated overpressure is pumped through a gap under the inner door to an adjacent room. The low-temperature air stream flows into the room along the external wall and directed into the gap at the bottom of the door to the adjacent room. The range of the cold air stream increases due to the increase in speed. After 19 s this range equals the half the length of the rooms. After this time, the stream range begins to decrease as a result of the reduction of the airflow speed. Such air distribution allows the indoor air temperature in the workplace to stay at 20–22 °C. These values correspond with measurements, with error equal to 0.5%, and the level of reliability of the measured values equal to 0.92.
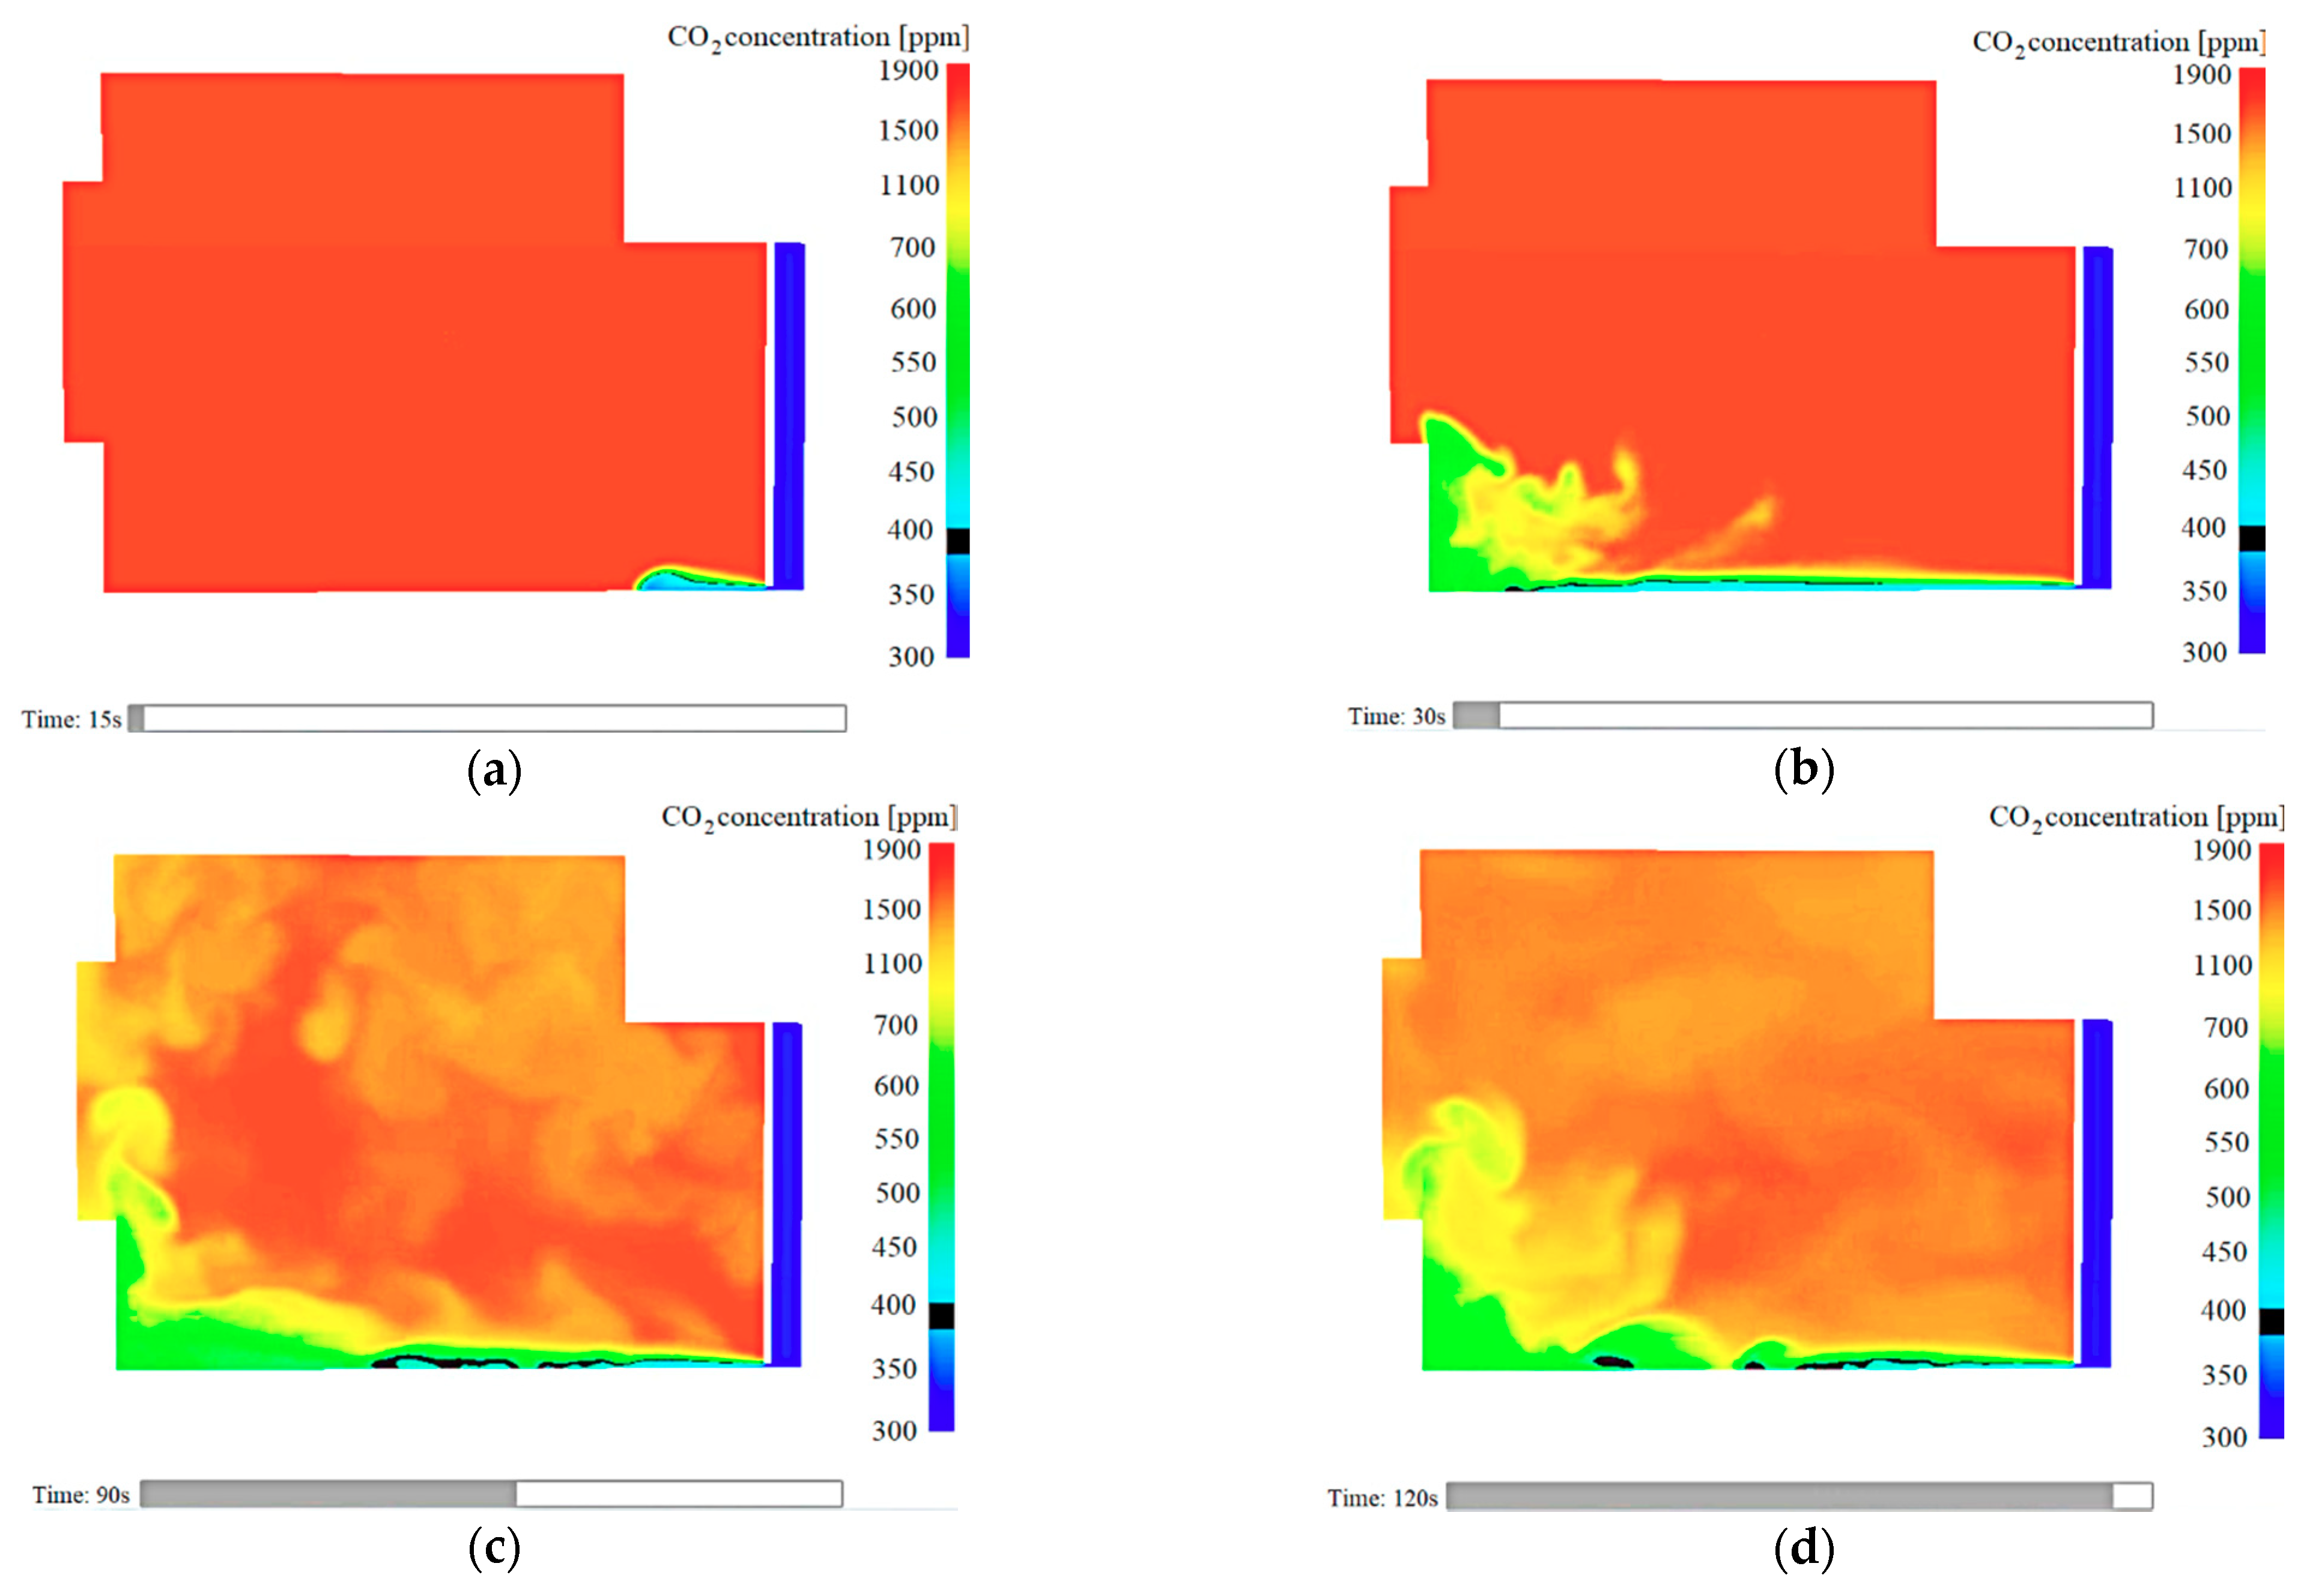
Figure 7 and Figure 8 demonstrate the simulation of changes in carbon dioxide concentration in a room for the setting of two min. During the air supply cycle the air is driven by generated overpressure through a gap under the inner door to an adjacent room. On the other hand, negative pressure is generated in the exhaust cycle, allowing air inflow from the adjacent room in a reverse direction. In the simulated room the initial CO2 concentration of 1500 ppm was assumed. After a supply time of two min, the air supply from the decentralized supply system diluted the carbon dioxide to the limit value in the area from the floor to a height of 1.5 m from the floor (in the workplace it was 700 ppm). A longer supply time (four min) allowed for the reduction of the CO2 concentration in the entire room volume. The exhaust cycle (the air was exhausted through the decentralised façade ventilation system and supplied through the gap in the interior door) caused the greatest reduction of the CO2 concentration. The exhaust time of two min allows the CO2 concentration to reduce by half.
At the same time, the simulation allowed for determining indoor air temperature in different room volume spots. In the workplace, the temperature ranged from 19.25 to 22 °C. For longer settings (ten min), according to completed simulation the temperature remained within 17–22 °C. It was possible to obtain a comfortable temperature at the workplace due to the way the air stream was supplied along the external wall. However, as research [38] shows, a person standing near the supply/exhaust element of the façade ventilation unit will feel discomfort. In order to avoid overcooling, it is possible to use heat recovery in the device in the form of a storage heat exchanger, or the solution described by Santamaria et al. [39]. On the other hand, reduction of carbon dioxide concentration was higher for the higher setting.
The results of the completed simulation are confirmed by the analysis of measured values (Figure 9). The average hourly values of the measured data for each series were calculated. The daily trajectories of the average values for each of 13 series were presented on the chart. Measured values proved minor daily temperature fluctuations in each of the three measurement spots.
Figure 10 shows recorded values of temperature in the workplace, depending on time setting and outdoor temperature. The tests were carried out in real conditions; therefore, it was impossible to adjust the outside air temperature. However, the diagram shows that for similar outdoor air temperatures, indoor air temperature was slightly lower in the case of longer air supply time. The temperature was still within the comfort temperature range, but with a longer supply/exhaust time, a further reduction of the temperature could occur. This means that planned research on applying heat recovery in the unit is well-grounded. It should be emphasised that the central heating system was off in the analysed room. The only source of heat was the air inflowing from the adjacent room during the exhaust cycle.
Completed air humidity analysis (Figure 11) proved that values satisfying thermal comfort requirements according to the standard EN 15251:2012 [40] were obtained in the room, independently of changing the outdoor air parameter. No impact of outside air humidity on the value of this parameter inside rooms was observed, although outdoor air humidity was much higher.
Carbon dioxide concentration in inside air was analysed to determine the unit effect on indoor air quality. Figure 12 presents the trajectory of changes in CO2 concentration over time. Carbon dioxide concentration increases visibly after the users enter the room. On the other hand, a gradual drop in gas concentration is observed after the unit activation at 12:10.
The measured values were used for statistical evaluation of the ventilation device. Box diagrams in Figure 13 present distribution of the reduction characteristic (carbon dioxide concentration) in groups determined by the setting factor levels (air supply/exhaust cycle duration: 2 min, 4 min, 10 min). The outlier in Figure 13 is the result of a random event, but given the huge amount of data, the method of analysis can be considered effective despite the one outlier.
Tukey’s multiple comparison tests carried out for the reduction characteristic in groups determined according to the setting factor levels have proven that the average value of the reduction characteristic for setting = 10 is significantly higher than the average reduction value in groups corresponding to setting = 4 or 2. Average reduction values in groups determined by setting = 2 or 4 do not differ significantly.
Variance analysis was also used to assess the impact of the unit on inside temperature. Box diagrams in Figure 14 present distribution of the temperature (of indoor air) characteristic in groups determined by the setting factor levels (air supply/exhaust cycle duration: 2 min, 4 min, 10 min). A statistically significant main effect of the setting has been observed.
4. Conclusions
This analysis of one of the façade room ventilation units carried out in real conditions has proven that this solution satisfies (in periods of low external temperature) all relevant requirements, which means it dilutes enough of the gas contaminants without chilling the rooms. Indoor air parameters were measured (including indoor air temperature, humidity and supply air velocity). The outside air temperature was fluctuating during the measurements, however those periods when the temperature was −10 °C were chosen for the analysis. Outside air was delivered to the room through a room ventilation unit without heating. Obtained results proved that air temperature in the room did not drop below the value specified for thermal comfort. Similarly, air humidity remained at the level defined as acceptable, complying with applicable regulations.
The functioning of the façade unit was also put to statistical analysis. Obtained results show that the proposed solution improves the interior microclimate as it reduces pollution concentration (in this case carbon dioxide), while the rooms are not excessively chilled. However, the duration of the air supply/exhaust cycle should be taken into account. Due to the considerable velocity of air flowing into the room (up to 3.4 m/s), too long of an air supply cycle may cause people to feel the draught. Therefore, it is advisable to use a heater, heating coil or heat recovery exchanger, which will be the subject of further studies on the system. Heat recovery in devices with cyclic supply/exhaust can be performed by storage heat exchangers. These can be exchangers with solid storage mass or liquid storage mass. However, further research is needed in this area to find the most optimal solution. In spite of all advantages of the façade ventilation units the legal regulations of some countries require verification. The regulations state that integrated air intake and outtake are only allowed to be mounted on the roof, not on the façade.
The system was also put to the CFD simulation. A model was developed to allow visualisation of air flow in the room, indoor air temperature distribution and a carbon dioxide reduction method. The temperature, measured in two spots in the room (workplace and central point), was used to verify obtained results. Completed analysis proves compliance of the measured values with those obtained from simulations (error 0.5%).
An unquestionable advantage of decentralised systems is that they can be installed both in new and existing facilities and that there is no need to provide any additional ducts in buildings. Obtained results show that the proposed solution satisfies all relevant requirements; however, in order to improve its functionality, studies need to be carried out on the possibility of heat recovery from exhaust air.
5. Patents
There is a patent resulting from the work reported in this manuscript: Zender-Świercz E., Piotrowski J. Urządzenie do wentylowania pomieszczeń, 2017 Patent nr PL 228,624 B1.
Funding
This research was funded by the program of the Minister of Science and Higher Education under the name: “Regional Initiative of Excellence” in 2019–2022 project number 025/RID/2018/19, financing amount PLN 12,000,000.
Institutional Review Board Statement
Not applicable.
Informed Consent Statement
Not applicable.
Data Availability Statement
The data presented in this study are available on request from the corresponding author.
Conflicts of Interest
The author declares no conflict of interest.
References
- Huttunen, K. Indoor air pollution. In Clinical Handbook of Air Pollution-Related Diseases; Capello, F., Gaddi, A.V., Eds.; Springer International Publishing: Cham, Switzerland, 2018; pp. 107–114. [Google Scholar]
- Daisey, J.M.; Angell, W.J.; Apte, M.G. Indoor air quality, ventilation and health symptoms in schools: An analysis of existing information. Indoor Air 2003, 13, 53–64. [Google Scholar] [CrossRef]
- Mendell, M.J.; Heath, G.A. Do indoor pollutants and thermal conditions in schools influence student performance? A critical review of the literature. Indoor Air 2005, 15, 27–52. [Google Scholar] [CrossRef]
- Seppanen, O.A.; Fisk, W.J.; Mendell, M.J. Association of ventilation rates and CO2 concentrations with health and other responses in commercial and institutional buildings. Indoor Air 1999, 9, 226–252. [Google Scholar] [CrossRef]
- Haverinen-Shaughnessy, U.; Moschandreas, D.J.; Shaughnessy, R.J. Association between substandard classroom ventilation rates and students’ academic achievement. Indoor Air 2010, 21, 121–131. [Google Scholar] [CrossRef] [PubMed]
- Tham, K.W. Effects of temperature and outdoor air supply rate on the performance of call center operators in the tropics. Indoor Air 2004, 14, 119–125. [Google Scholar] [CrossRef]
- Apte, M.G.; Fisk, W.J.; Daisey, J.M. Associations between indoor CO2 concentrations and sick building syndrome symptoms in U.S. office buildings: An analysis of the 1994–1996 BASE study data. Indoor Air 2000, 10, 246–257. [Google Scholar] [CrossRef] [Green Version]
- Apte, M.G.; Fisk, W.J.; Daisey, J.M. Indoor carbon dioxide concentrations and SBS in office workers. In Proceedings of the Healthy Building 2000, Espoo, Finland, 6–10 August 2000; Volume 1, pp. 133–138. [Google Scholar]
- Sowa, J. Jakość powietrza we wnętrzach jako istoty element pływający na komfort pracy. Cyrkulacje 2017, 37, 32–33. [Google Scholar]
- Telejko, M.; Zender–Świercz, E. An attempt to improve air quality in primary schools. In Proceedings of the 10th International Conference: Environmental Engineering, Vilnius, Lithuania, 27–28 April 2017. [Google Scholar] [CrossRef]
- Klavina, A.; Proskurina, J.; Rodins, V.; Martinsone, I. Carbon dioxide as indoor air quality indicator in renovated schools in Latvia. In Proceedings of the Indoor Air 2016, the 14th International Conference of Indoor Air Quality and Climate, Ghent, Belgium, 3–7 July 2016. [Google Scholar]
- Lan, L.; Wargocki, P.; Lian, Z. Quantitative measurement of productivity loss due to thermal discomfort. Energy Build. 2011, 43, 1057–1062. [Google Scholar] [CrossRef]
- Roelofsen, P. The impact of office environments on employee performance: The design of the workplace as a strategy for productivity enhancement. J. Facil. Manag. 2002, 1, 247–264. [Google Scholar] [CrossRef]
- Johnson, D.L.; Lynch, R.A.; Floyd, E.L.; Wang, J.; Bartels, J.N. Indoor air quality in classrooms: Environmental measures and effective ventilation rate modeling in urban elementary schools. Build. Environ. 2018, 136, 185–197. [Google Scholar] [CrossRef]
- Dedesko, S.; Siegel, J.A. Moisture parameters and fungal communities associated with gypsum drywall in buildings. Microbiome 2015, 3, 71. [Google Scholar] [CrossRef] [Green Version]
- Mensah-Attipoe, J.; Toyinbo, O. Fungal growth and aerosolization from various conditions and materials. In Fungal Infection; IntechOpen: London, UK, 2019. [Google Scholar]
- World Health Organization. World Health Statistics 2018 (WHO–WHS): Monitoring Health for the SDGS; WHO: Geneva, Switzerland, 2018. [Google Scholar]
- Xie, T. Indoor air pollution and control technology. IOP Conf. Ser. Earth Environ. Sci. 2018, 170, 032084. [Google Scholar] [CrossRef]
- Zender-Świercz, E. Improving the indoor air quality using the individual air supply system. Int. J. Environ. Sci. Technol. 2017, 15, 689–696. [Google Scholar] [CrossRef] [Green Version]
- ASHRAE Standard. Ventilation for Acceptable Indoor Air Quality; ANSI/ASHRAE Standard 62.1-2016; ASHRAE: Atlanta, GA, USA, 2017. [Google Scholar]
- Ramalho, O.; Wyart, G.; Mandin, C.; Blondeau, P.; Cabanes, P.-A.; Leclerc, N.; Mullot, J.-U.; Boulanger, G.; Redaelli, M. Association of carbon dioxide with indoor air pollutants and exceedance of health guideline values. Build. Environ. 2015, 93, 115–124. [Google Scholar] [CrossRef]
- Marchetti, N.; Cavazzini, A.; Pasti, L.; Catani, M.; Malagù, C.; Guidi, V. A campus sustainability initiative: Indoor air quality monitoring in classrooms. In Proceedings of the 2015 XVIII AISEM Annual Conference, Trento, Italy, 3–5 February 2015; pp. 1–4. [Google Scholar]
- Bonino, S. Carbon dioxide detection and indoor air quality control. Occup. Health Saf. 2016, 85, 46–48. [Google Scholar]
- Khazaei, B.; Shiehbeigi, A.; Kani, A.R.H.M.A. Modeling indoor air carbon dioxide concentration using artificial neural network. Int. J. Environ. Sci. Technol. 2019, 16, 729–736. [Google Scholar] [CrossRef]
- Pitarma, R.; Marques, G.; Caetano, F. Monitoring indoor air quality to improve occupational health. Adv. Intell. Syst. Comput. 2016, 445, 13–21. [Google Scholar]
- Sireesha, N.L. Correlation amongst indoor air quality, ventilation and carbon dioxide. J. Sci. Res. 2017, 9, 179–192. [Google Scholar] [CrossRef] [Green Version]
- Mijakowski, M. Wilgotność powietrza w relacjach człowiek, środowisko wewnętrzne, architektura. In Problemy Jakości Powietrza Wewnętrznego w Polsce; Oficyna Wydawnicza Politechniki Warszawskiej: Warsaw, Poland, 2005; pp. 105–121. [Google Scholar]
- Kisilewicz, T. O związkach między szczelnością budynków, a mikroklimatem, komfortem wewnętrznym i zużyciem energii w budynkach niskoenergetycznych. Napędy Sterow. 2014, 12, 94–97. [Google Scholar]
- ISO. ISO 13788:2013-05 Hygrothermal Performance of Building Components and Building Elements—Internal Surface Temperature to Avoid Critical Surface Humidity and Interstitial Condensation—Calculation Methods; ISO: London, UK, 2013. [Google Scholar]
- Pogorzelski, J.A. Zagadnienia cieplno—Wilgotnościowe przegród budowlanych. In Budownictwo Ogólne; Budowli, F., Klemm, P., Eds.; Arkady: Warsaw, Poland, 2005; Volume 2. [Google Scholar]
- Zender-Swiercz, E.; Telejko, M. Impact of insulation building on the work of ventilation. Procedia Eng. 2016, 161, 1731–1737. [Google Scholar] [CrossRef] [Green Version]
- Bomberg, M.; Kisilewicz, T.; Nowak, K. Is there an optimum range of airtightness for a building? J. Build. Phys. 2015, 39, 395–421. [Google Scholar] [CrossRef]
- Dermentzis, G.; Ochs, F.; Siegele, D.; Feist, W. Renovation with an innovative compact heating and ventilation system integrated into the façade—An in-situ monitoring case study. Energy Build. 2018, 165, 451–463. [Google Scholar] [CrossRef]
- Kim, M.K.; Baldini, L. Energy analysis of a decentralized ventilation system compared with centralized ventilation systems in European climates: Based on review of analyses. Energy Build. 2016, 111, 424–433. [Google Scholar] [CrossRef]
- Coydon, F.; Herkel, S.; Kuber, T.; Pfafferott, J.; Himmelsbach, S. Energy performance of façade integrated decentralised ventilation systems. Energy Build. 2015, 107, 172–180. [Google Scholar] [CrossRef]
- Zender-Świercz, E.; Piotrowski, J. Urządzenie do Wentylowania Pomieszczeń. Patent PL 228,624 B1, 15 November 2017. [Google Scholar]
- Blocken, B. LES over RANS in building simulation for outdoor and indoor applications: A foregone conclusion? Build. Simul. 2018, 11, 821–870. [Google Scholar] [CrossRef] [Green Version]
- Zender-Świercz, E. Microclimate in rooms equipped with decentralized façade ventilation device. Atmosphere 2020, 11, 800. [Google Scholar] [CrossRef]
- Santamaria, B.M.; Gonzalo, F.D.A.; Pinette, D.; Gonzalez-Lezcano, R.-A.; Aguirregabiria, B.L.; Ramos, J.A.H. Application and validation of a dynamic energy simulation tool: A case study with water flow glazing envelope. Energies 2020, 13, 3203. [Google Scholar] [CrossRef]
- European Standard. EN 15251 Indoor Environmental Input Parameters for Design and Assessment of Energy Performance of Buildings Addressing Indoor Air Quality, Thermal Environment, Lighting and Acoustics; European Standard: Brussels, Belgium, 2010. [Google Scholar]
Figure 1.
Decentralised façade ventilation system installed on wall.

Figure 2.
Room ventilation unit: (a) view from above of the device, (b) front view of the device, (c) side view of the device.
Figure 2.
Room ventilation unit: (a) view from above of the device, (b) front view of the device, (c) side view of the device.

Figure 3.
Room ventilation unit in a cutaway.

Figure 4.
Arrangement of air monitoring units in the analysed room (the dimensions in meters).

Figure 5.
The geometry of the premise in the CFD simulation.

Figure 6.
The simulation of changes in indoor air temperature in the axis of stream while supplying unheated outdoor air. A side view of the room. Time of supply 2 min; (a) view after 5.4 s from starting supply; (b) view after 19 s from starting supply; (c) view after 40 s from starting supply; (d) view after 100 s from starting supply.


Figure 7.
Simulation of changes in the reduction of carbon dioxide concentration while supplying outdoor air. A side view of the room. Time of supply 2 min; (a) view after 4 s from starting supply; (b) view after 30 s from starting supply; (c) view after 90 s from starting supply; (d) view after 120 s from starting supply.

Figure 8.
Simulation of changes in the reduction of carbon dioxide concentration while exhausting air. A side view of the room. Time of exhaust 2 min; (a) view after 15 s from starting exhaust; (b) view after 30 s from starting exhaust; (c) view after 90 s from starting exhaust; (d) view after 120 s from starting exhaust.

Figure 9.
Average air temperature values for localisation workplace. (The colours refer to different measuring series).
Figure 9.
Average air temperature values for localisation workplace. (The colours refer to different measuring series).

Figure 10.
Trajectories of changes in indoor and outdoor air temperature in the workplace (a) setting: 2 min, (b) setting: 10 min.
Figure 10.
Trajectories of changes in indoor and outdoor air temperature in the workplace (a) setting: 2 min, (b) setting: 10 min.

Figure 11.
Average values of air humidity in workplace.

Figure 12.
Trajectory of changes in average values of carbon dioxide concentration in air, in the room.
Figure 12.
Trajectory of changes in average values of carbon dioxide concentration in air, in the room.

Figure 13.
Box diagrams illustrating distribution of reduction characteristic in groups determined by setting factor levels; the whiskers—minimum and maximum values; the green point—median.
Figure 13.
Box diagrams illustrating distribution of reduction characteristic in groups determined by setting factor levels; the whiskers—minimum and maximum values; the green point—median.

Figure 14.
Box diagrams illustrating distribution of the temperature characteristic in groups determined by setting factor levels, where: T—temperature [°C]; the whiskers—minimum and maximum values; the green point—median.
Figure 14.
Box diagrams illustrating distribution of the temperature characteristic in groups determined by setting factor levels, where: T—temperature [°C]; the whiskers—minimum and maximum values; the green point—median.


Table 1.
The specifications of indoor air quality monitors (PS32).
| Parameter | Measurement Range | Resolution of Indications | Unit | Accuracy |
|---|---|---|---|---|
| carbon dioxide concentration | 0 ÷ 5000 | 1 | ppm | ±(20 + 3% of meas. value) |
| temperature | 0 ÷ 100 | 0.1 | °C | ±0.5 |
| humidity | 10 ÷ 45 | 0.1 | % | ±2 |
Table 2.
The specifications of meteorological station (Vantage Pro2).
| Parameter | Measurement Range | Resolution of Indications | Unit | Accuracy |
|---|---|---|---|---|
| temperature | −40 ÷ 65 | 0.1 | °C | 0.5 |
| humidity | 1 ÷ 100 | 1 | % | 3% RH; 4% over 90% |
Table 3.
The specifications of balometer station (ProHood PH731).
| Parameter | Measurement Range | Resolution of Indications | Unit | Accuracy |
|---|---|---|---|---|
| volumetric flow rate | 42–4250 | 1 | m3·h | ±3% read out value ±12 m3·h >85 m3·h |
| air speed | 0.125–12.5 | 0.01 | m·s−1 | ±3% read out value ±0.04 m/s >0.25 m·s−1 |
| absolute pressure | 356–1016 | 1 | mmHg | ±2% read out value |
| temperature | −40–121 | 0.1 | °C | ±0.3% °C |
| humidity | 5–95 | 0.1 | % | ±3% RH |
Table 4.
The boundary conditions of the CFD simulations for supply cycle.
| No. | Name | Boundary Condition | Comments |
|---|---|---|---|
| 1 | inlet | velocity_inlet | speed profile from the experiment |
| 2 | internal_wall | wall | |
| 3 | exteranl_wall | wall | |
| 4 | outlet_gap | pressure_outlet |
Table 5.
The boundary conditions of the CFD simulations for exhaust cycle.
| No. | Name | Boundary Condition | Comments |
|---|---|---|---|
| 1 | outlet | velocity_outlet | speed profile from the experiment |
| 2 | internal_wall | wall | |
| 3 | exteranl_wall | wall | |
| 4 | inlet_gap | pressure_outlet |
Publisher’s Note: MDPI stays neutral with regard to jurisdictional claims in published maps and institutional affiliations. |
© 2021 by the author. Licensee MDPI, Basel, Switzerland. This article is an open access article distributed under the terms and conditions of the Creative Commons Attribution (CC BY) license (http://creativecommons.org/licenses/by/4.0/).
Share and Cite
MDPI and ACS Style
Zender–Świercz, E. Assessment of Indoor Air Parameters in Building Equipped with Decentralised Façade Ventilation Device. Energies 2021, 14, 1176. https://doi.org/10.3390/en14041176
AMA Style
Zender–Świercz E. Assessment of Indoor Air Parameters in Building Equipped with Decentralised Façade Ventilation Device. Energies. 2021; 14(4):1176. https://doi.org/10.3390/en14041176
Chicago/Turabian StyleZender–Świercz, Ewa. 2021. "Assessment of Indoor Air Parameters in Building Equipped with Decentralised Façade Ventilation Device" Energies 14, no. 4: 1176. https://doi.org/10.3390/en14041176
Note that from the first issue of 2016, this journal uses article numbers instead of page numbers. See further details here.