
Transformer Oil Quality Assessment Using Random Forest with Feature Engineering


1
Faculty of Sciences and Technology, University of Mascara, Route de Mamounia, Mascara BP 305-29000, Algeria
2
Intelligent Control and Electrical Power Systems Laboratory, Faculty of Electrical Engineering, Djilali Liabes University of Sidi Bel Abbes, Sidi Bel Abbes BP 89-22000, Algeria
3
Research Chair on the Aging of Power Network Infrastructure (ViAHT), University of Quebec in Chicoutimi, Chicoutimi, QC G7H 2B1, Canada
*
Author to whom correspondence should be addressed.
Energies 2021, 14(7), 1809; https://doi.org/10.3390/en14071809
Submission received: 24 February 2021
/
Revised: 14 March 2021
/
Accepted: 20 March 2021
/
Published: 24 March 2021
(This article belongs to the Special Issue Condition Monitoring and Machine Learning Strategies for Electrical Apparatus)
Abstract
:Machine learning is widely used as a panacea in many engineering applications including the condition assessment of power transformers. Most statistics attribute the main cause of transformer failure to insulation degradation. Thus, a new, simple, and effective machine-learning approach was proposed to monitor the condition of transformer oils based on some aging indicators. The proposed approach was used to compare the performance of two machine-learning classifiers: J48 decision tree and random forest. The service-aged transformer oils were classified into four groups: the oils that can be maintained in service, the oils that should be reconditioned or filtered, the oils that should be reclaimed, and the oils that must be discarded. From the two algorithms, random forest exhibited a better performance and high accuracy with only a small amount of data. Good performance was achieved through not only the application of the proposed algorithm but also the approach of data preprocessing. Before feeding the classification model, the available data were transformed using the simple k-means method. Subsequently, the obtained data were filtered through correlation-based feature selection (CFsSubset). The resulting features were again retransformed by conducting the principal component analysis and were passed through the CFsSubset filter. The transformation and filtration of the data improved the classification performance of the adopted algorithms, especially random forest. Another advantage of the proposed method is the decrease in the number of the datasets required for the condition assessment of transformer oils, which is valuable for transformer condition monitoring.
1. Introduction
Power transformers are the most important and critical equipment in substations. In these transformers, insulating oils fulfil a two-fold function: serving as a coolant and dielectric liquid [1,2]. Under service conditions, the oil undergoes a slow and steady-state degradation due to aging, high temperature, and chemical reactions such as oxidation [3]. These interrelated mechanisms contribute to the formation of water, sludge, acids, dissolved gases, and other decay contents, which lead to a decrease in dielectric strength and a concomitant increase in oil viscosity. These factors influence the insulation dielectric properties and heat dissipation efficiency, which are the primary objectives of oil [4]. The oil condition must be regularly analyzed and reclaimed or replaced when necessary to prevent sudden transformer failure, which can lead to high time consumption and resource costs [3]. IEC 60422, BS 5730, and IEEE Std 637 can be used as guides to set the testing frequency. Moreover, these guides can provide the recommended limits for tests and actions that should be taken based on results [5]. Common diagnostic techniques depend on testing based on physical, chemical, and electrical parameters. In general, physical measurements involve the determination of parameters such as temperature, vibration, and acoustic emission. However, the most frequently used diagnostic methods that provide useful information about transformation insulation conditions are chemical and electrical analyses [6,7]. Furthermore, these measurements are referred to as oil quality tests that serve as oil deterioration indicators [8]. Based on these indicators, the actions that should be taken by maintenance engineers regarding the insulating oil are eased. The interpretation of test results is challenging because of the complexity of the structure and degradation mechanism of transformers [9]. An expert analyst must be present during diagnosis [10]. The right decision is essential because a misinterpretation may cause transformer damage, thereby exposing workers to fatal accidents, colossal economic losses, network shut down, and the removal of the network from service. Thus, intelligent techniques and their applications, which can be used to store human experience and react intelligently and automatically to help inexperienced analysts in making the right decisions, must be investigated. Furthermore, this intelligence can be integrated into an overall online system as a part of smart grid monitoring systems [9]. Numerous investigations on the application of intelligent techniques for the monitoring and diagnosis of transformers have been reported in the literature [11,12,13,14]. In most studies, irrespective of whether these studies are listed in this paper, intelligent techniques are applied either to interpret dissolved gas analysis data or to predict transformer health index conditions. However, to the best of authors’ knowledge, only few articles addressing the problem of transformer oil quality assessment through artificial intelligence are available in the literature. Researchers have investigated the performance of artificial neural networks (ANNs), especially the back propagation (BP) algorithm trained using Levenberg–Marquard and momentum techniques [15,16,17] and fuzzy logic [18] for the assessment of transformer oil quality. These studies have presented some limitations, which may have arisen either from the approach used by the authors to address the subject or from the intelligent techniques employed. For the study methodology, the authors did not conducted preprocessing. However, preprocessing of data is an important step in artificial intelligence processes that can provide additional information for better prediction. Therefore, the researchers used only raw data to develop prediction models. The amount of data used for validation was limited to few cases, which was insufficient for generalization. In addition, the primary drawback of all ANN-based algorithms is that they require a large dataset for proper training to guarantee reliable analyses [19,20]. ANNs have highly limited analysis capacity—in particular, with back propagation learning, which often leads to an overfitting phenomenon with low generalization ability. Fuzzy logic does not directly handle the measured data, and the derivation of their rules may be difficult [15]. Recently, with an increase in the capacity of computers to process data, new machine-learning (ML) algorithms have been developed to assess power equipment conditions [21,22].
In this study, new ML techniques were applied to diagnose the condition of transformer oils. Two well-known algorithms, namely J48 decision tree and random forest, were tested and compared based on a dataset of 91 samples collected from in-service power transformers of the Algerian National Society for Electricity and Gas (SONELGAZ). The aim behind the application of these two algorithms is to assess the improvement in terms of decision-making accuracy versus the previously applied algorithms such as ANN and FL, especially when the data are properly preprocessed.
Given the aforementioned shortcomings of the previous works, the difference between our contributions and the other ones can be summarized as follows:
- The proposed classifiers (J48 and random forest) have not been used before for assessing the quality of transformer oils. The reason why these algorithms are used is because they have had numerous successful applications in many fields, such as image processing, biomedicine, and economic pattern classification, due to their antinoising advantages and better model generalization abilities [14]. In addition, due to lack of data, algorithms such as J48 decision tree and random forest are more appropriate for building the prediction model with a relatively small amount of data.
- Before feeding the algorithms, the data used were preprocessed by passing through different filters that fall within the so-called features engineering. The goal of this is to change the shape of the data so that the prediction algorithms can acquire additional information that helps improve classification capabilities.
For the model validation, all the data were used to simultaneously train and test the classification model instead of employing the available data for only training and then testing the model for a few new cases, as performed in most studies available in the literature. This approach is known as cross-validation (CV). The algorithm performance was tested before and after each data filtration process to observe the influence of each filtering step on the output of the classifier.
• The remainder of this paper is organized as follows: the physicochemical tests are described in Section 2. The description of the raw data that feed the classification algorithms, accompanied by a brief overview of the J48 and random forest algorithms as well as the different filters used to preprocess the data is reported in Section 3. This section ends with the metrics used to assess the performance of the classifiers and the validation approach of the proposed model. In Section 4, the obtained results with a discussion of our findings are reported. Finally, the conclusions with some directions for future perspectives are given in Section 5.
2. Oil Quality Testing
The oil condition highly affects the performance and service life of transformers. A combination of electrical, physical, and chemical tests was performed to monitor changes in the electrical properties, extent of contaminants, and deterioration degree in the insulating oil. The results were used to establish preventive maintenance procedures and prevent costly shutdowns and premature equipment failure to extend the service life of the equipment. A wide range of tests are available for the condition assessment of insulating oils. Table 1 presents the most commonly used tests and their important properties. The threshold levels of these tests are specified in ASTM D3487 for new oils [23] and IEEE Guide C57.637-2015 for service oils [24].
3. Materials and Methods
3.1. Description of Data
In this study, six physical and chemical tests were conducted on the 91 transformer oil samples obtained from in-service transformers with a voltage range of 72–170 kV. The dataset contains the six parameters—namely, color, kinematic viscosity (cSt), acidity (mgKOH/g), dissipation factor (tgδ), dielectric strength (kV), and water content (ppm). The expert’s decision regarding the action to be taken is one of the following four categories: status quo, filter, reclaim, and discard. The actions taken by the experts are usually based on guides established by the standard bodies IEC and IEEE, industrial companies and research institutes, who classify the in-service oils into groups according to their states. For each group, a specific corrective action is recommended [26]. IEEE have defined these four groups for in-service oils [27]:
- Group I—oils that are in satisfactory condition for continued use.
- Group II—oils that only require reconditioning (by settling, filtering, centrifuging, and vacuum drying or degassing [28]) for further service.
- Group III—oils in poor condition. Such oil should be reclaimed (restored to usefulness by the removal of contaminants and products of degradation such as polar, acidic, or colloidal materials from used electrical insulating liquids by chemical or adsorbent means [28]) or disposed of depending upon economic considerations.
- Group IV—oils in such a poor condition that it is technically advisable to dispose of them.
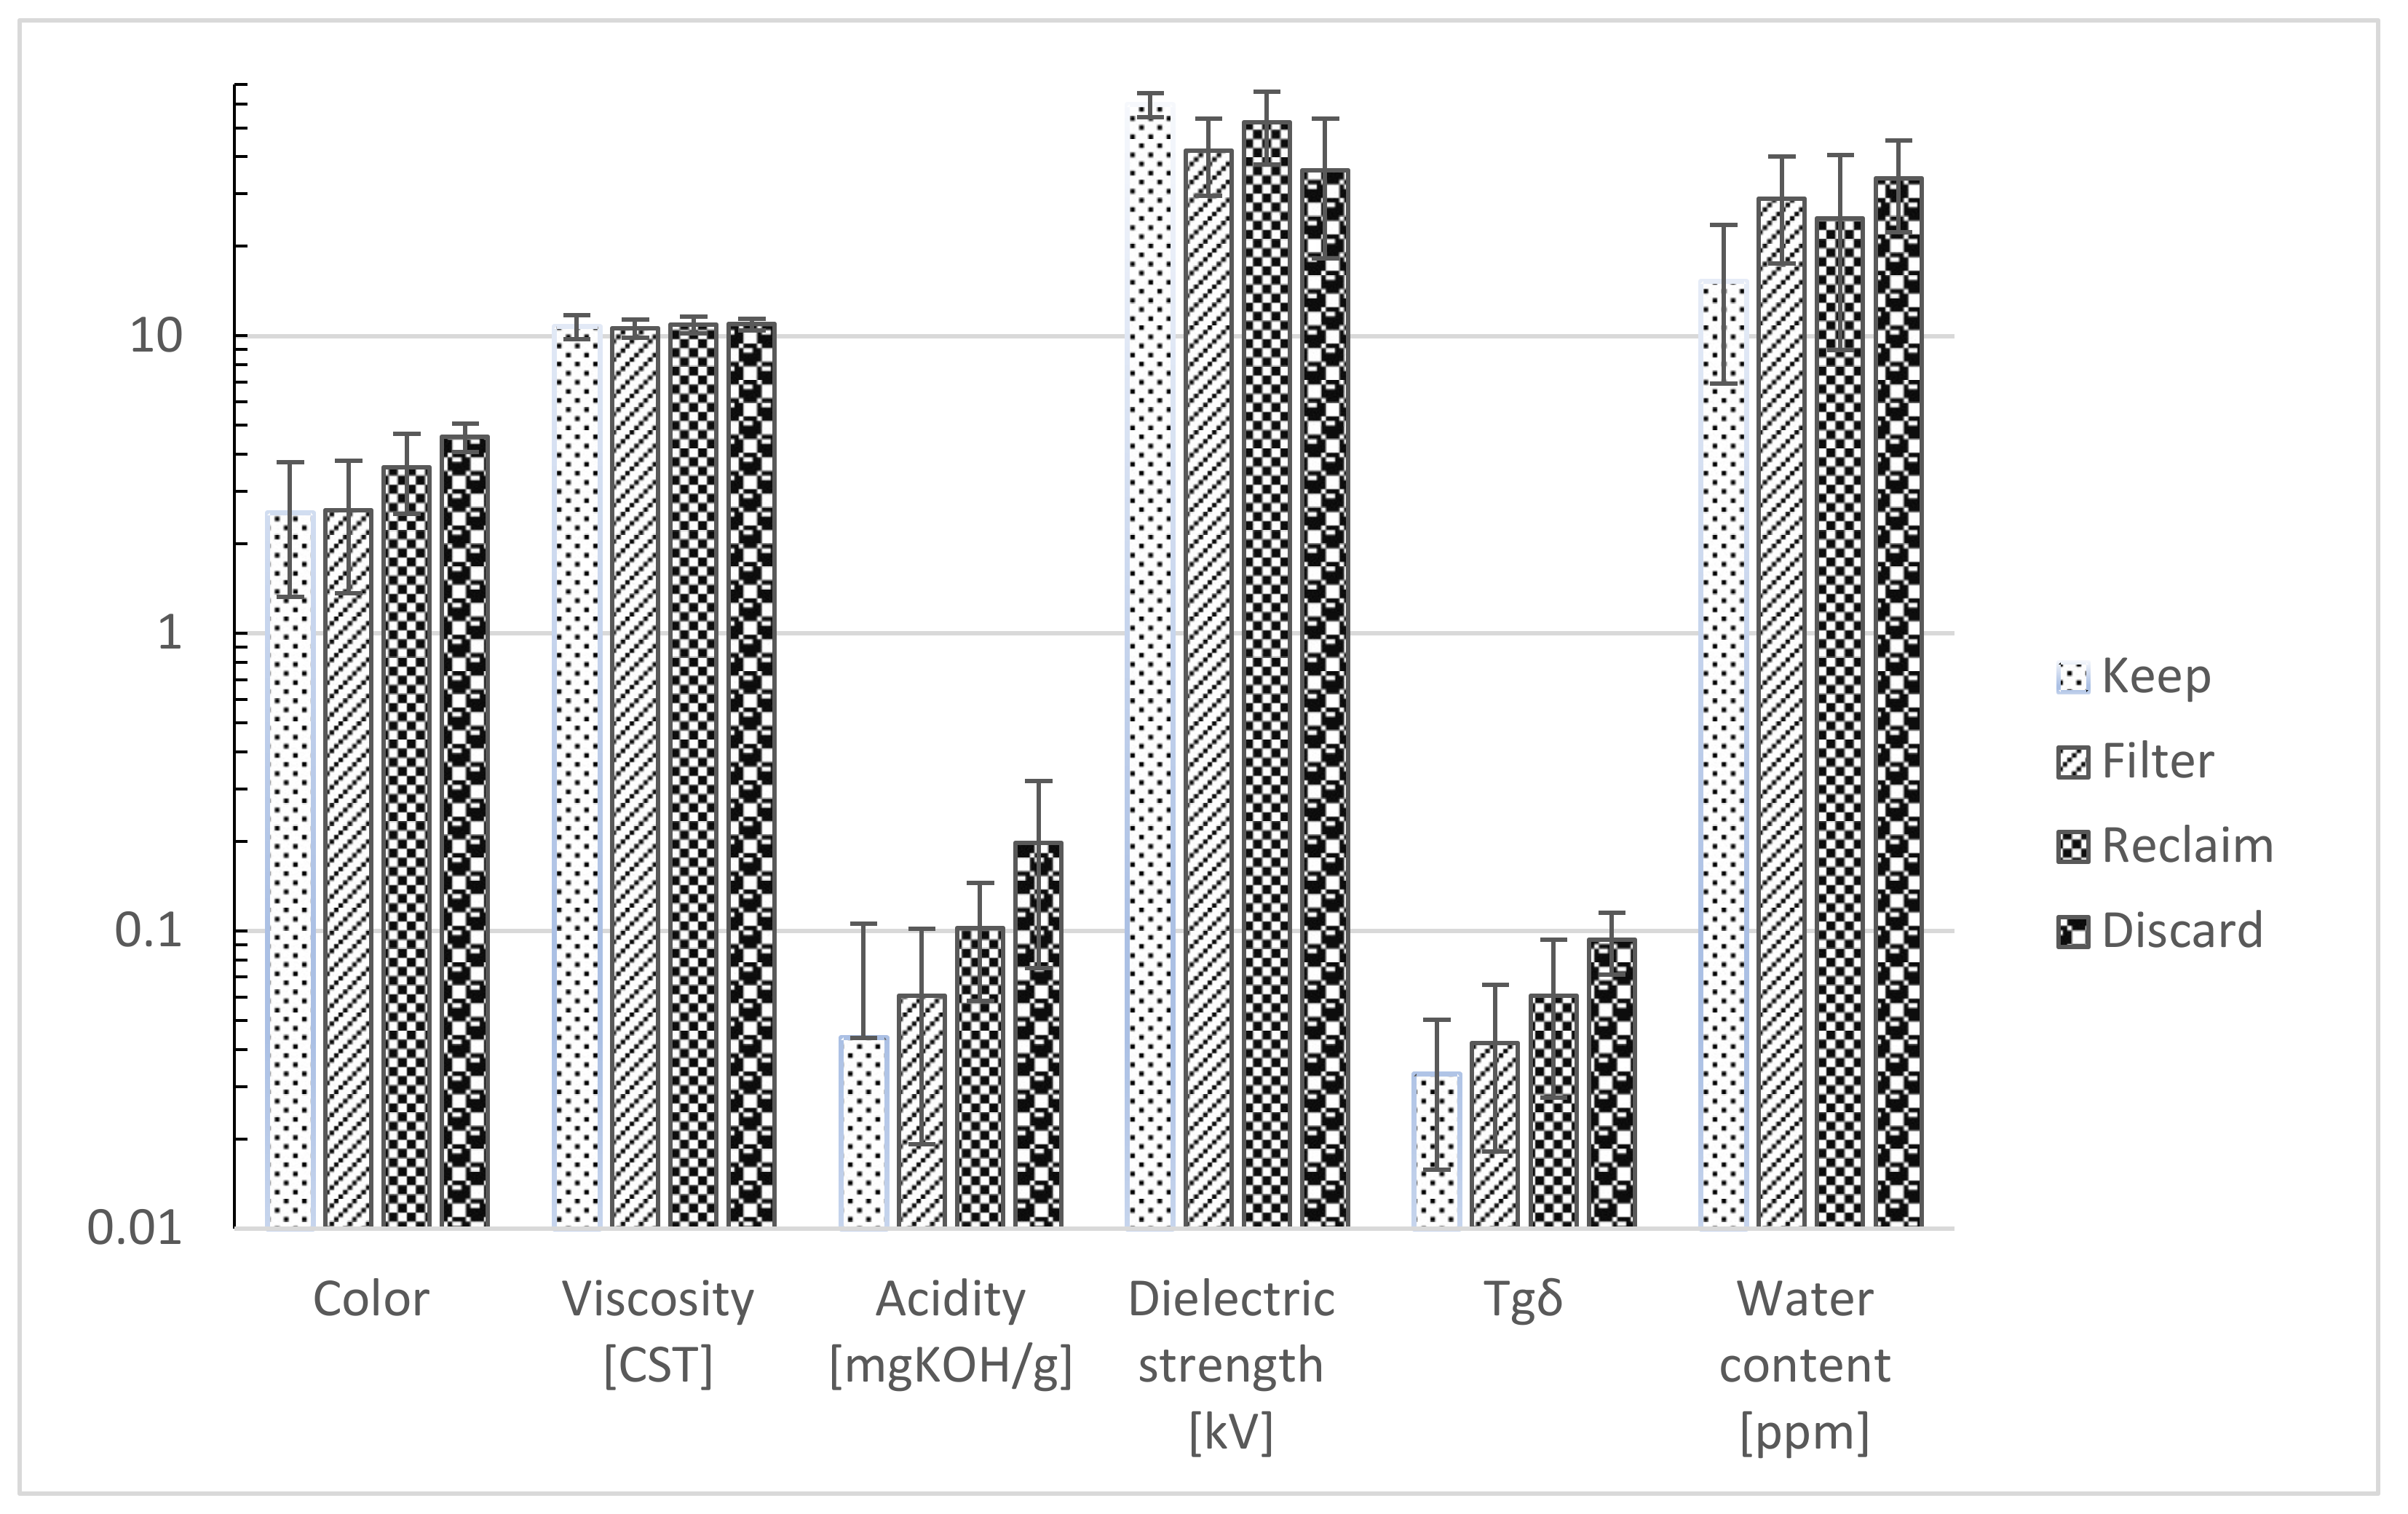
To understand the shape and distribution of the data used, Figure 1 presents the plot of the average values and standard deviations of different tests for each decision category. The decisions in the graph are arranged from the category of oil that indicates a good quality to deteriorated oil: from keeping the oil in status quo, to filtering, reclaiming, then definitely discarding and changing it.
Almost all the oil quality indicators are good in the oils that should be used in service (Figure 1). The oil quality gradually decreases in the other oils, except for the viscosity indicator, for which the change is insignificant. The fact that viscosity remains almost unaffected by aging is confirmed by results reported in [29].
The oil parameters usually influence each other [4,30]. With an increase in the moisture content, the electrical strength of the insulating oil decreases (Figure 1). Although the oil to be filtered is better than that to be reclaimed according to most parameters (color, viscosity, acidity, and tgδ), this is not the case according to the comparison of their dielectric strengths because the water content in the oil to be reclaimed is less than that in the oil to be filtered. This phenomenon also occurs when the acidity increases; it substantially affects the dissipation factor [30]. To undertake a highly explicit analysis and help engineers in condition monitoring by identifying the relevant parameters from that are not interrelated, a correlation analysis was performed. Table 3 presents correlation coefficients between various parameters on the basis of the data provided.
The most interrelated parameters are tgδ (Table 3). Water content is highly and negatively correlated with dielectric strength and moderately related with the acidity. Acidity influences also the color of in-service oil, so as the acidity of the oil increases, the color becomes darker and darker.No mutual relationship exists between viscosity and any other parameter. The correlation among different variables in this dataset may help in understanding how certain feature-engineering techniques such as, PCA or correlation-based feature selection, can be used to manipulate data for extracting new informative features or reducing irrelevant and misleading features.
3.2. Algorithms
3.2.1. J48 Decision Tree
Decision tree induction is a very popular and practical approach for pattern classification. The decision tree is constructed generally in a greedy, top-down recursive manner. The tree can be constructed in a breadth first manner or depth first manner. The decision tree structure consists of a root node, internal nodes and leaf nodes. The classification rules are derived from the decision tree in the form of [if… then… else…]. These rules are used to classify the records with an unknown value for class label [31].
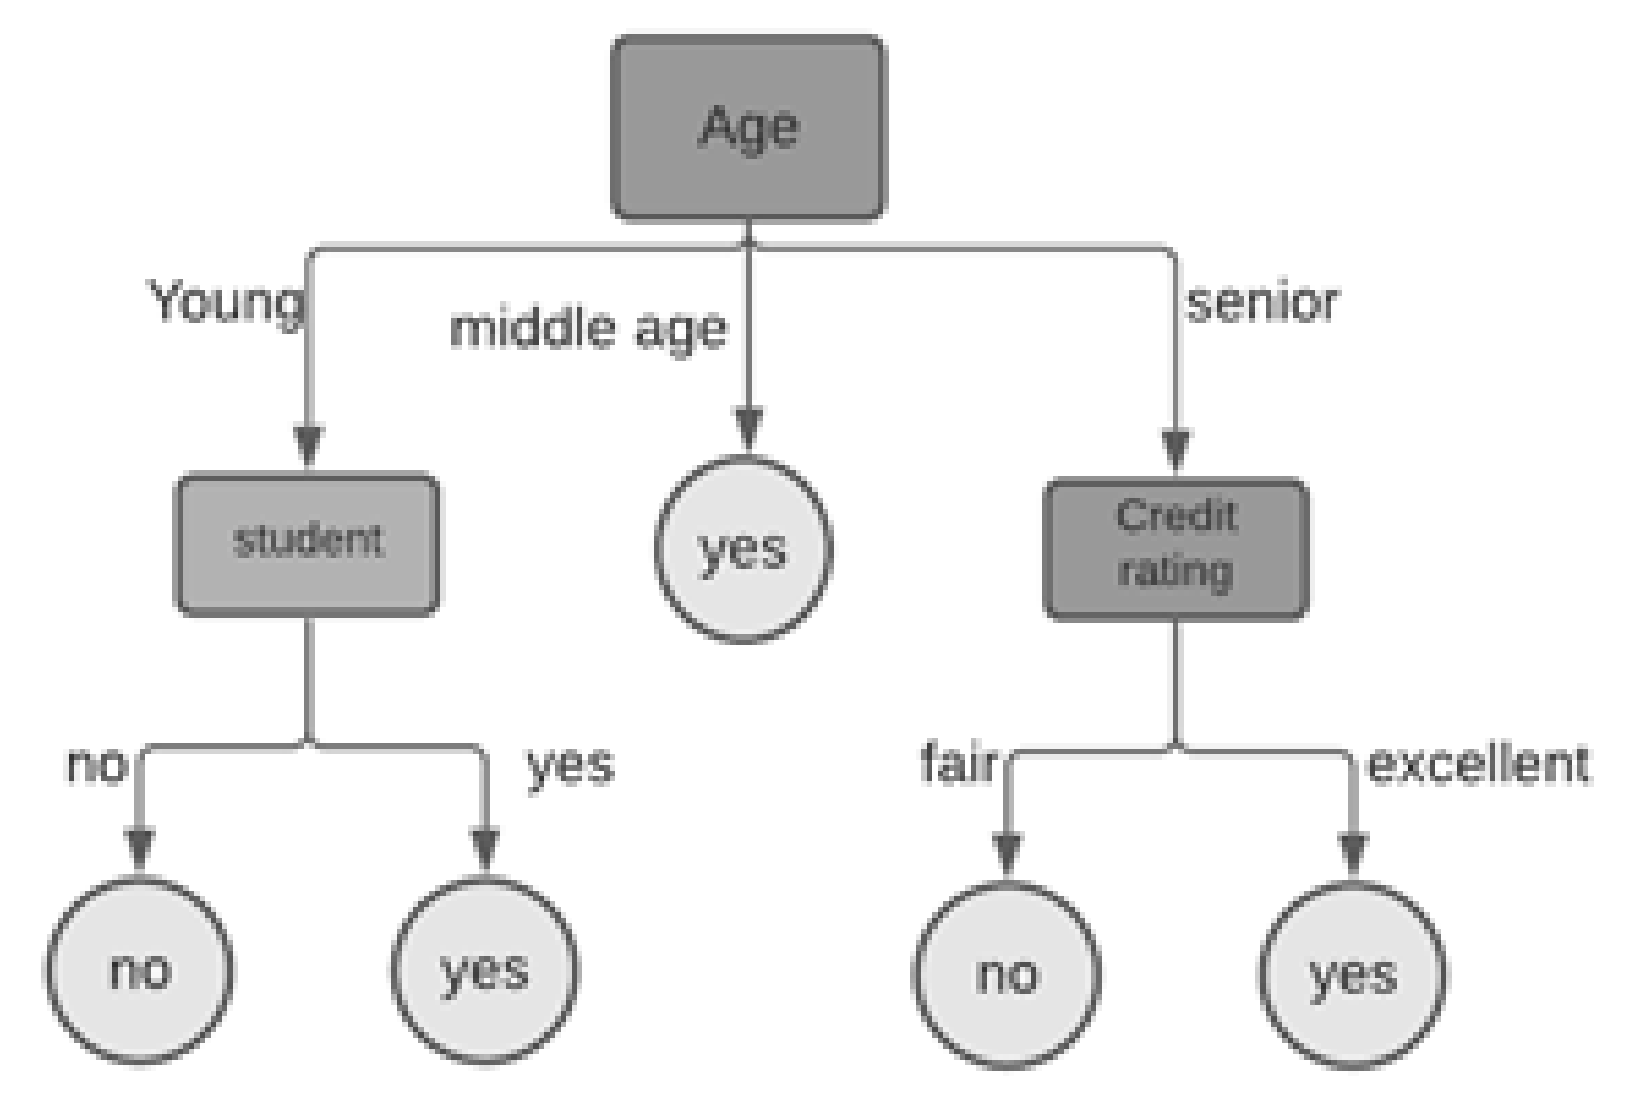
J48 is the final JAVA public version of the C4.5 decision tree [32]. C4.5 is a well-known decision tree algorithm designed and implemented by Quinlan. Today, C4.5 has probably become the most widely used and studied decision tree algorithm [33]. J48 builds decision trees from training dataset by making use of the fact that each attribute of the data can be used to make a decision by splitting it into smaller subsets. J48 uses the concept of information entropy and examines the difference in entropy; this difference in entropy is called the normalized information gain. The attribute with the highest normalized information gain is used to make the decision. J48 works well with both continuous and discrete attributes and data with missing attribute values. It also gives an option for pruning trees after creation [34]. Examples of decision trees can be seen in Figure 2. The picture explains whether a customer will buy a laptop or not. From this decision tree, one may observed that if a customer is young and a student, the likelihood that he will purchase a laptop is high [35].
3.2.2. Random Forest
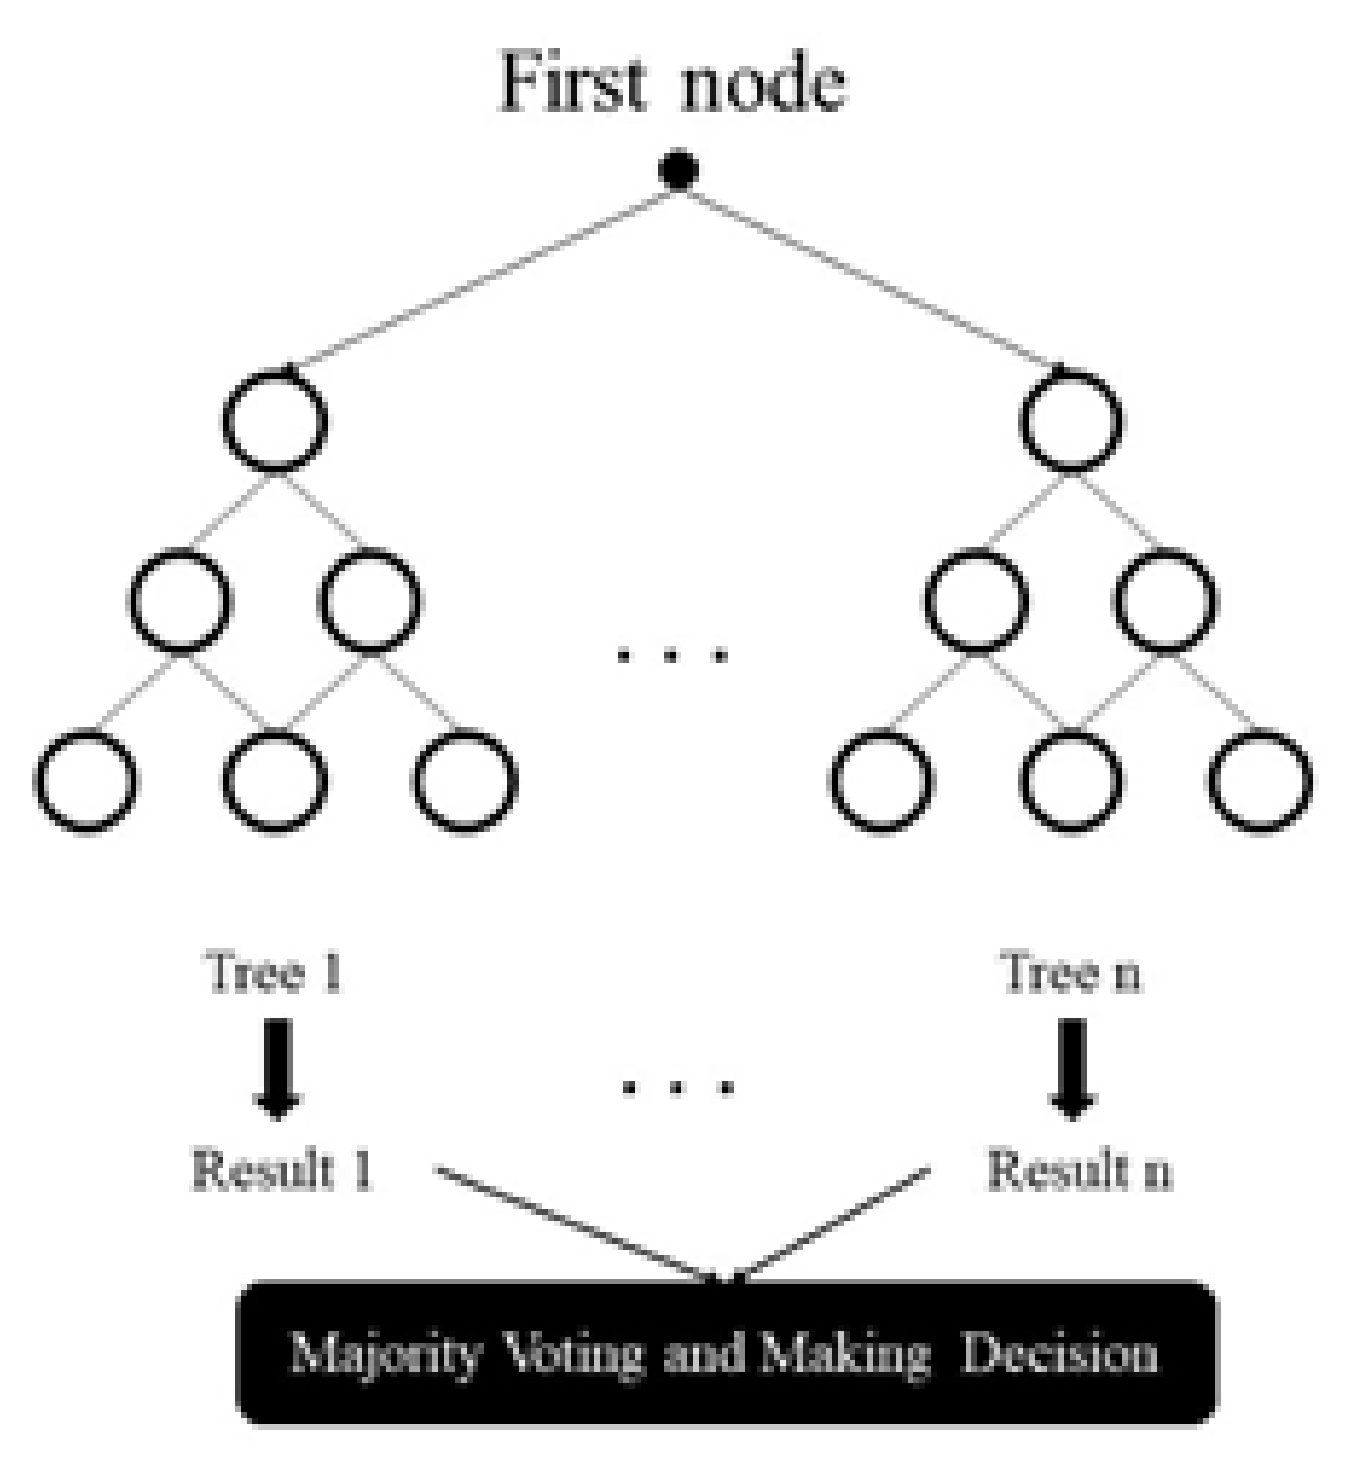
Substantial gains in classification and regression accuracy can be achieved by using ensembles of trees, where each tree in the ensemble is grown in accordance with a random parameter. Final predictions are obtained by aggregating over the ensemble. As the base constituents of the ensemble are tree-structured predictors, and since each of these trees, is constructed using an injection of randomness, these procedures are called “random forests” [36].
The random forest model is created by a great number of decision trees. This method simply averages the prediction result of trees, which is called a forest. In addition, this model has three random concepts: randomly choosing training data when making trees, selecting some subsets of features when splitting nodes, and considering only a subset of all features for splitting each node in each simple decision tree. During the training of data in a random forest, each tree learns from a random sample of the data points. A schematic illustration of the random forest is indicated in Figure 3 [37].
The important advantages of the random forest method are its ability to handle a numerous input attributes and its spontaneity [38].
3.3. Feature Extraction
Feature extraction is performed to obtain some transformation of original features to generate other highly significant features [39]. The most popular feature extraction approach is principal component analysis (PCA).
3.3.1. PCA
PCA was first proposed in [40]. As a linear unsupervised method, it is used to determine the optimum directions representing the variation in data. The original coordinates do not necessarily represent the variation direction. The PCA is employed to find the orthogonal directions, which represent the data with the least error and convert the samples of correlated variables into those of linearly uncorrelated features. Therefore, PCA can be considered as a rotating coordinate system [41].
Another feature extraction technique tested was simple k-means.
3.3.2. K-Means Algorithm
The k-means algorithm is the most famous algorithm used to cluster data by separating the samples into n groups of equal variances, which is achieved by minimizing a criterion called the inertia or within-cluster sum of squares. This algorithm is used to select the centroids that minimize the inertia or within-cluster sum of square criterion. It is successfully used for multiclass classifications [42]
3.4. Feature Selection
Data usually comprise features that can be irrelevant, misleading, or redundant, which increases the search space size rendering further data processing difficult and thus not contributing to the learning process. Feature subset selection is the process of selecting the optimum features that are useful to discriminate classes. A feature selection algorithm (FSA) is a computational model provoked using a certain definition of relevance [38]. Correlation-based feature selection (CFsSubset) was adopted to select the most informative features from the features acquired from the feature extraction process.
CFsSubset is used to evaluate the prediction of each attribute in terms of redundancy and the relationship between them. It is used to select the features having a large correlation with the class [43].
3.5. Validation of Classifiers
In ML, validation is a statistical method of evaluating and comparing learning algorithms by dividing data into two segments: one is used to train a model and the other is used to validate the model. Cross-validation (CV), especially k-fold CV, is a commonly adopted technique when the data are insufficient [21]. In this method, the whole dataset is divided into k equally sized parts. The k-1 parts are used to train the classifier, and the remaining groups are utilized for testing in each step. This process is repeated k times. Finally, the average of k results is calculated to determine classifier performance [44]. In this study, k was selected as 10.
3.6. Evaluation Metrics
To assess the performance of the proposed approaches, two criteria were selected: accuracy and areas under receiver operating characteristic (ROC). Accuracy refers to the proportion of correctly classified samples over the total number of samples: 50% and 100% represent random and perfect, respectively [45]. Accuracy is generally never reported, and if solely used with unbalanced datasets (the number of data points vary greatly from class to class), the result undergoes a severe distortion. The area under the ROC is a plot of the true positive rate (TPR) against the false positive rate (FPR) obtained when the discrimination threshold of the classifier varies. The area under the ROC provides values between (0, 1). When discrimination performs relatively better, its value is 1, and a bad classification causes values to be close to 0.5 [21].
TPR is the ratio of actual positives correctly identified as positive.
TPR = (TP/(TP + FN))
FPR is the ratio of the negative samples incorrectly identified as positive.
FPR = (FP/(FP + FN))
True positive (TP)—when both the actual and predicted classes of the data point are 1.
True negative (TN)—when both the actual and predicted classes of the data point are 0.
False positive (FP)—when the actual and predicted classes of data point are 0 and 1, respectively.
False negative (FN)—when the actual and predicted classes of data point are 1 and 0, respectively.
All the above terms can be extracted from the so-called confusion matrix. The confusion matrices represent the counts of predicted and actual values for each class. The correct prediction obtained by the appropriate classifier means the prediction is consistent with the expert’s diagnosis.
4. Experiments and Discussion of Results
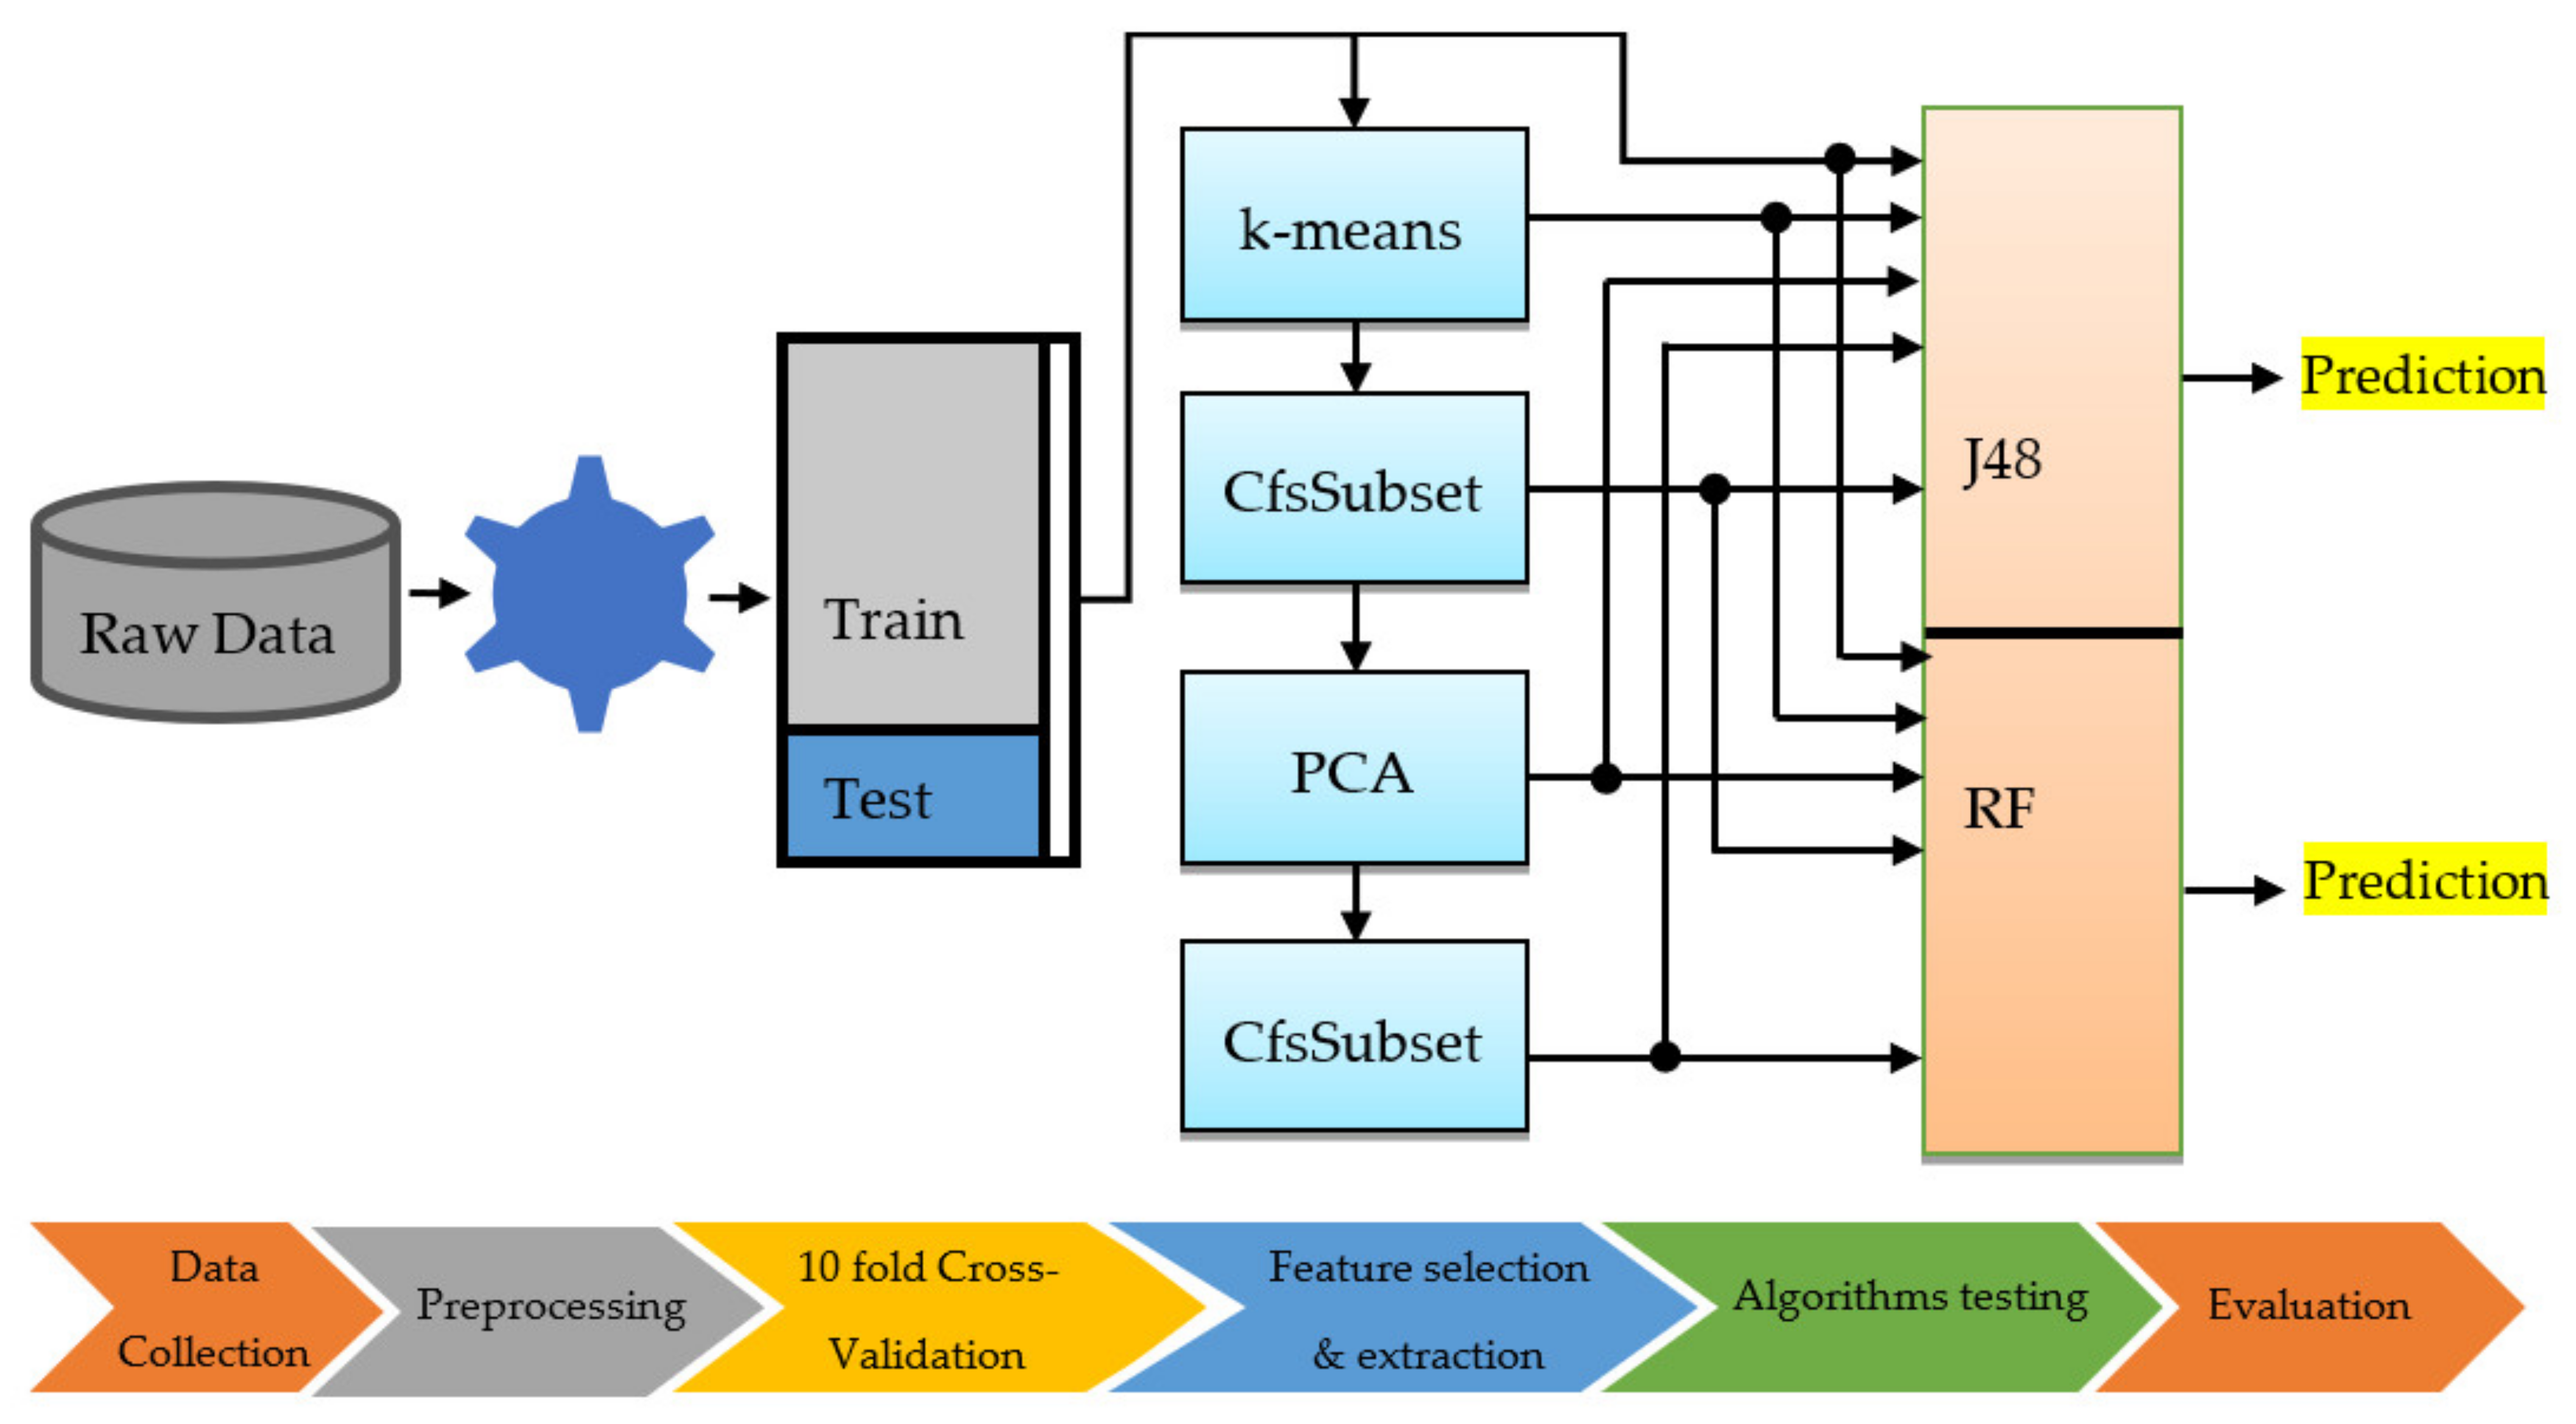
Figure 4 illustrates the flowchart and process of the proposed scheme for the classification of transformer oil based on the measurement of their aging parameters. The data collected were first preprocessed to impute missing values and eliminate outliers. Subsequently, to overcome the problem of insufficient data, the available data were split into training and testing sets by using the principle of 10-fold CV techniques. Afterwards, feature selection and extraction were performed through four substeps: the split data were passed to the first filter named “k-means”, which resulted in new features acquired from the original characteristics of the oil. The new features were then filtered using the “CfsSubsetEval” algorithm to select the most appropriate attributes and eliminate the irrelevant or unhelpful attributes. The two aforementioned steps were repeated to extract and further select other features, but the principal component analysis was employed for feature extraction instead of using “k-means”. The outcome of each step was evaluated on two classifiers: the J48 decision tree and its improved version, random forest.
Figure 5 presents the results obtained after the implementation of the process presented in Figure 4 on Waikato’s environment for knowledge analysis software (University of Waikato, New Zealand), a free and open-source data mining system [46]. The results represent a comparative study between two well-known algorithms: J48, a basic representation of the decision tree, and random forest, which corresponds to a collection of combined decision trees.
The random forest-based approach provided higher performance than J48 for global accuracy or global AUC at all the stages, before and after the application of different filters (Figure 5). The average differences between the two classifiers for accuracy and AUC are 5% and 10%, respectively. The application of feature extraction followed by the selection of the most relevant features, from all the resulted features, boosts the performance of the two classifiers, especially of random forest in the final two filters, where PCA followed by the CfsSubsetEval feature selector overcomes the lack of Simple k-means with CfsSubsetEval.
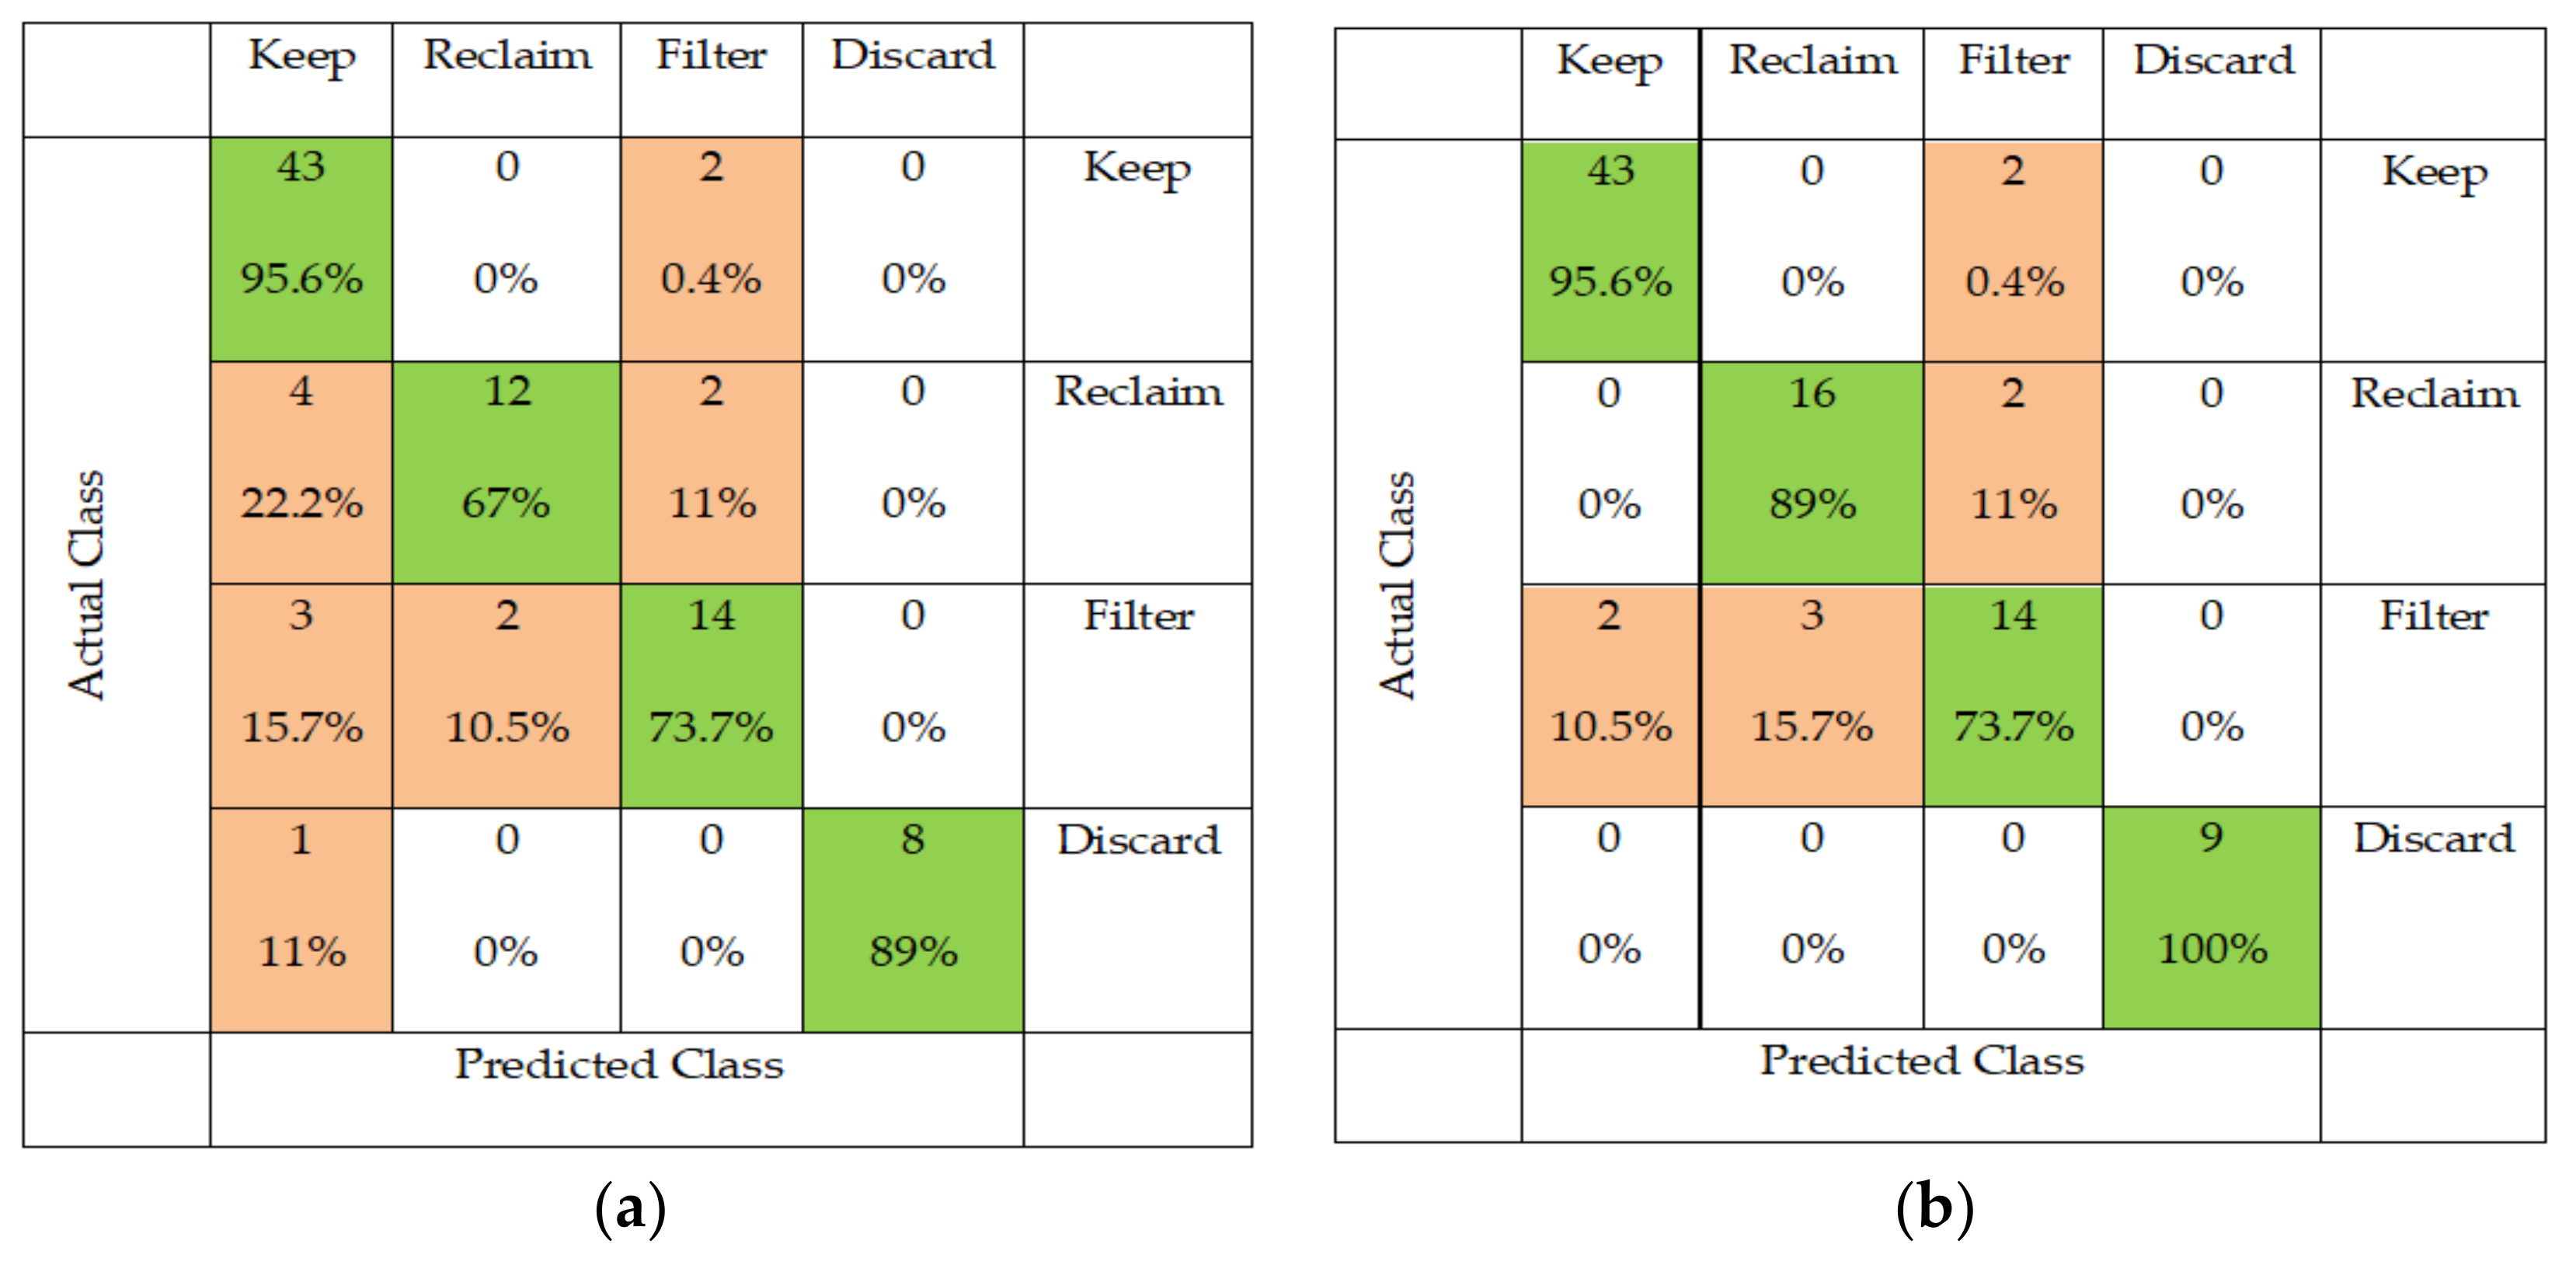
To investigate strengths and weaknesses of the proposed classifiers on each category of oil, a confusion matrix is provided and presented in Figure 6.
According to the confusion matrix, the performance of the random forest was improved compared to J48 decision tree by increasing the number of correctly classified cases, especially for the “Reclaim” and “Discard” categories. In addition, although there are misclassified cases, the algorithms have put them into the near class. For instance, in the random forest confusion matrix, the two misclassified instances which in fact belong to the class “keep”, were placed under the class “Filter”, which represents the nearest category to “keep” class in terms of order of oil quality and not classified them as “Reclaim” or “Discard”. The same principle was followed in the other misclassified instances.
Usually, in studies in which machine-learning techniques are applied, it is preferable to give examples of cases in which the performance of the approach adopted is compared with the expert’s decision. Table 4 provides a comparison between the actual decision of the expert and the prediction of the proposed classifiers on a dataset of 10 new samples.
Both algorithms perform well on new entries, except for one case among 10 where the J48 decision tree failed to predict the correct class.
Since some data are available and shown in Table 4, we tried to form an explanation for how and why the expert made these decisions about the fate of these oils based on a simple comparison between the real values of oil parameters and the limit values. The decision is “Keep” for cases where the parameter values do not exceed or close the limit values. For the cases, where the decision was to filter the oil, the expert saw that the water content exceeded the limit value and that it needed drying, whether it affected dielectric strength or not. The origin of water content should be detected. The in-service oils fall in the “Reclaim” category when color is considerably changed due to presence of acidity, polar particles or dissolved contaminants. The characteristics of highly contaminated oils are very far from the limit values recommended by standards. Their recovery is possible but it would be more expensive than their replacement.
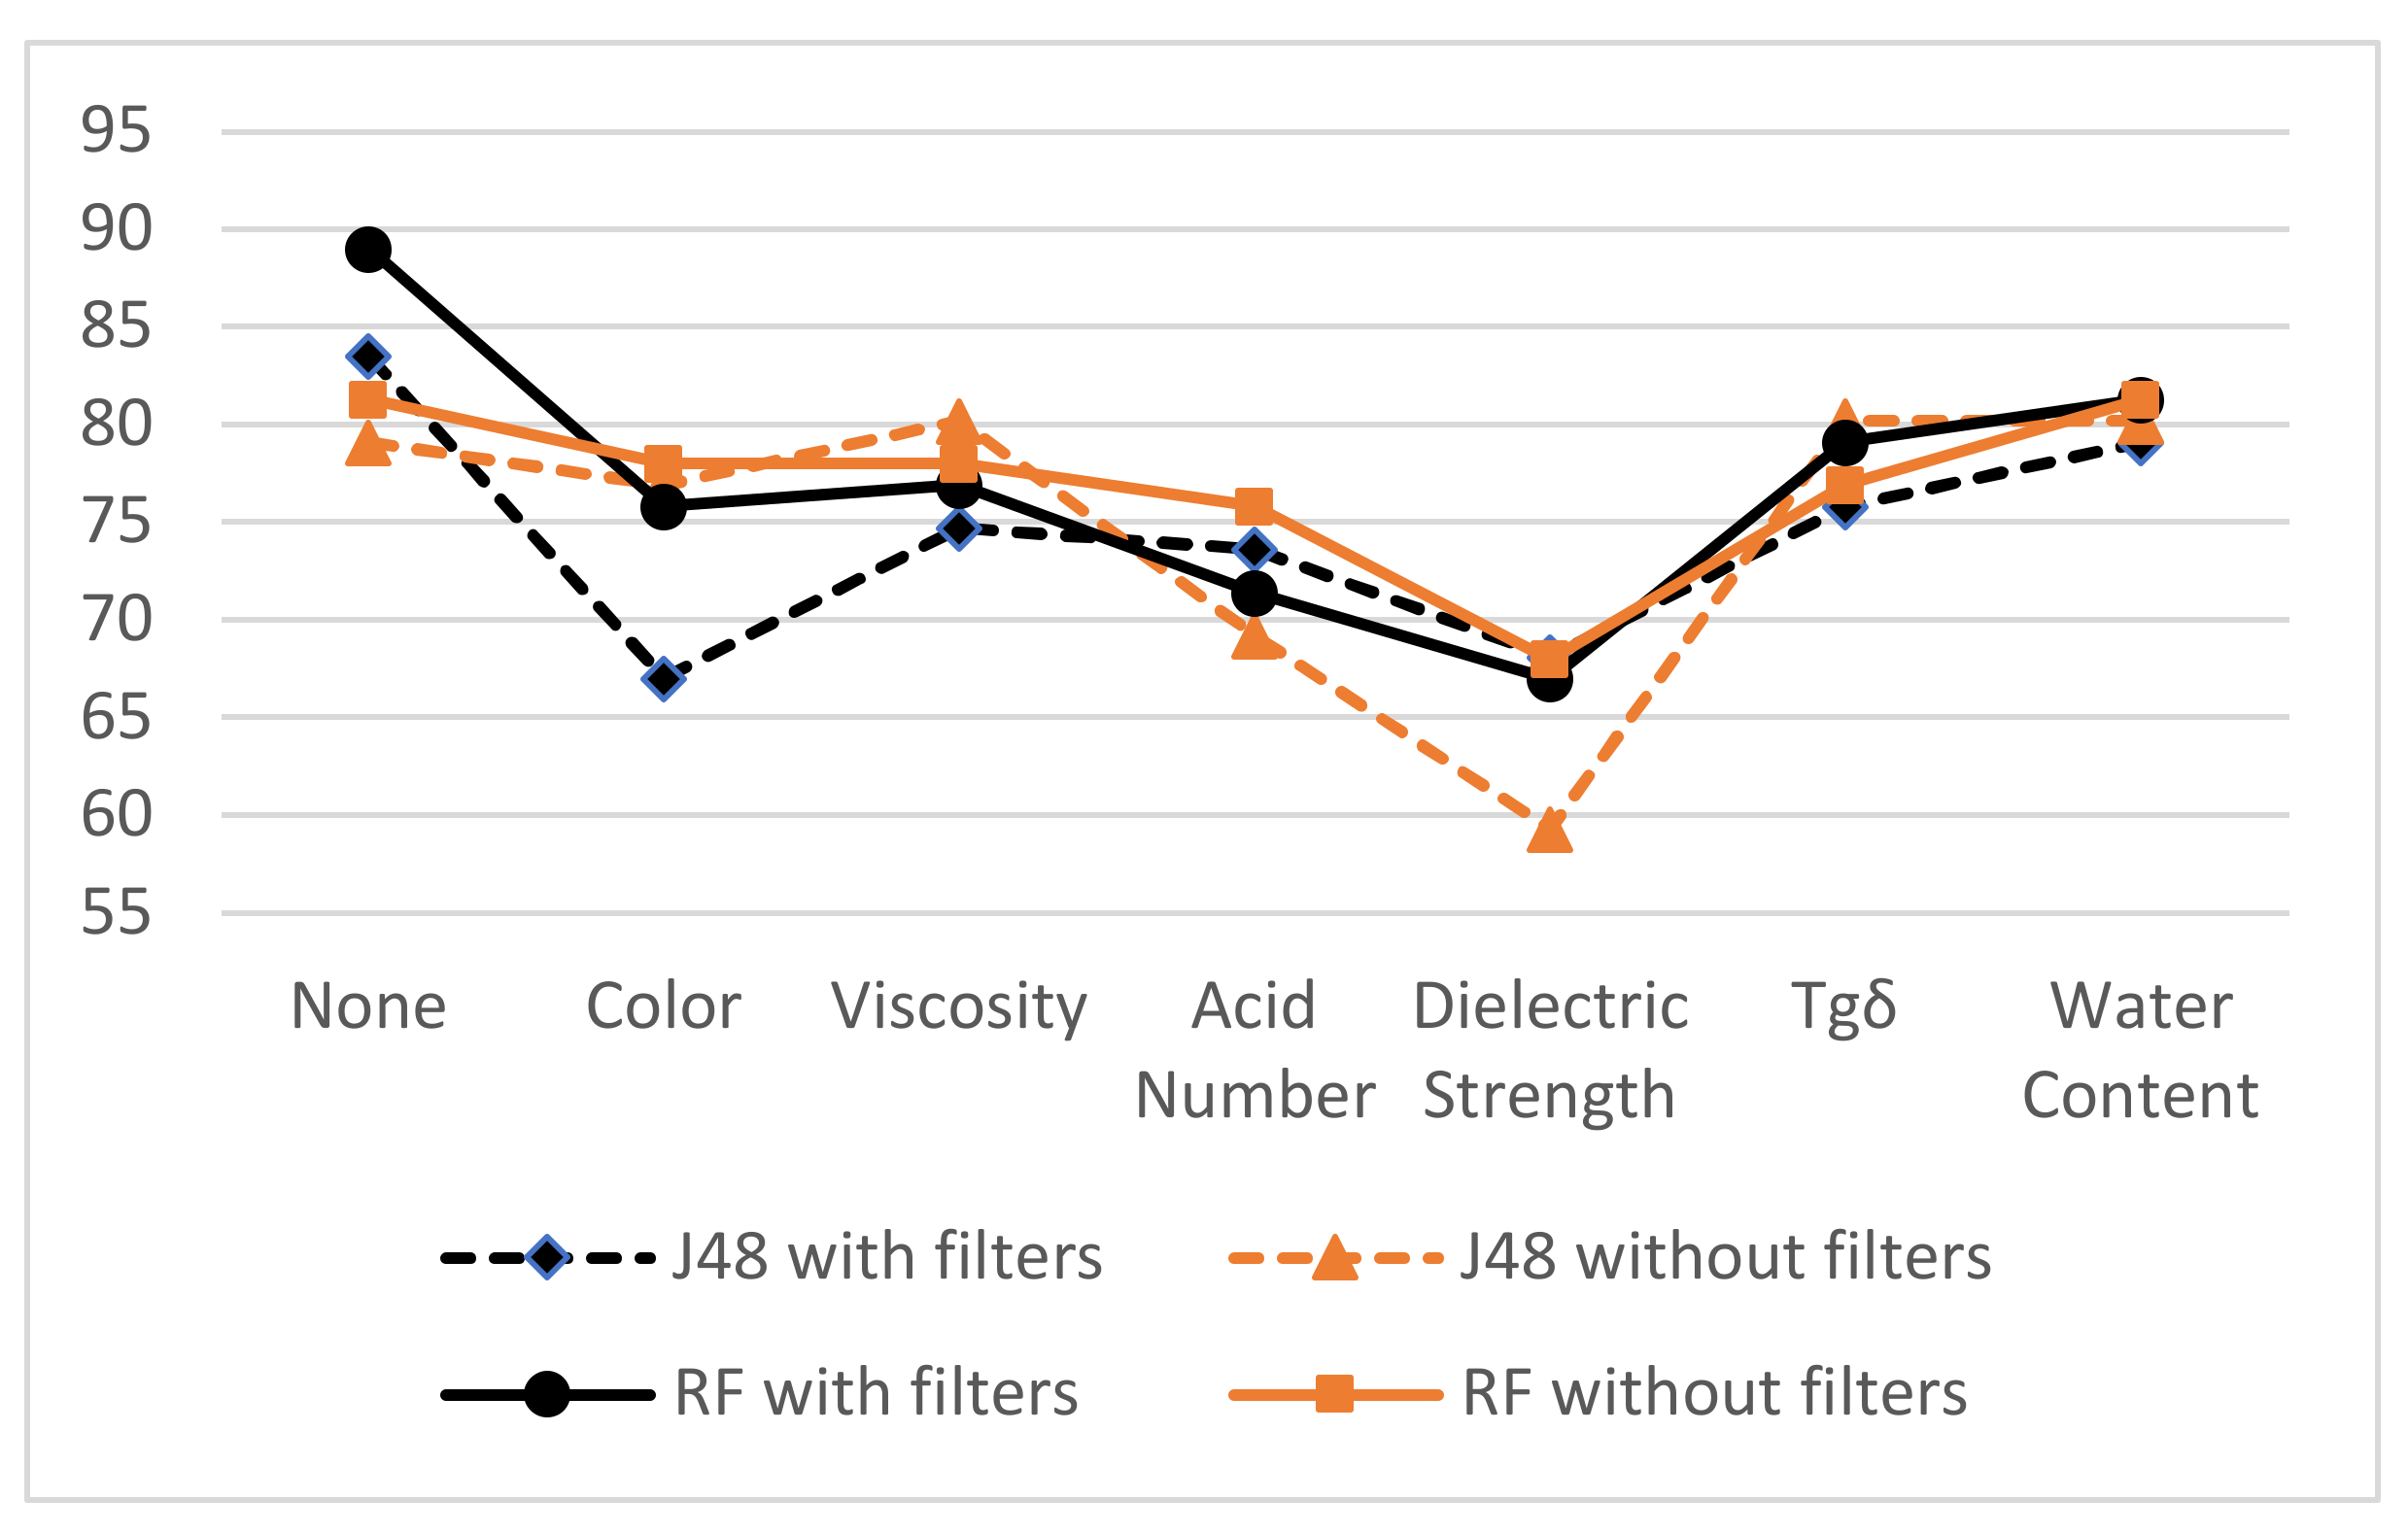
In such multivariate systems, there are inputs and outputs, such as in machine-learning systems. There is usually a difference in the significance and influence of various inputs on the prediction results. An additional study was conducted to observe the effect of removing one parameter on the accuracy of prediction (Figure 7). The study was performed on the two proposed algorithms using raw and filtered data.
All parameters have an influence, but the dielectric strength, the acid number and the color, respectively, are the most influential.
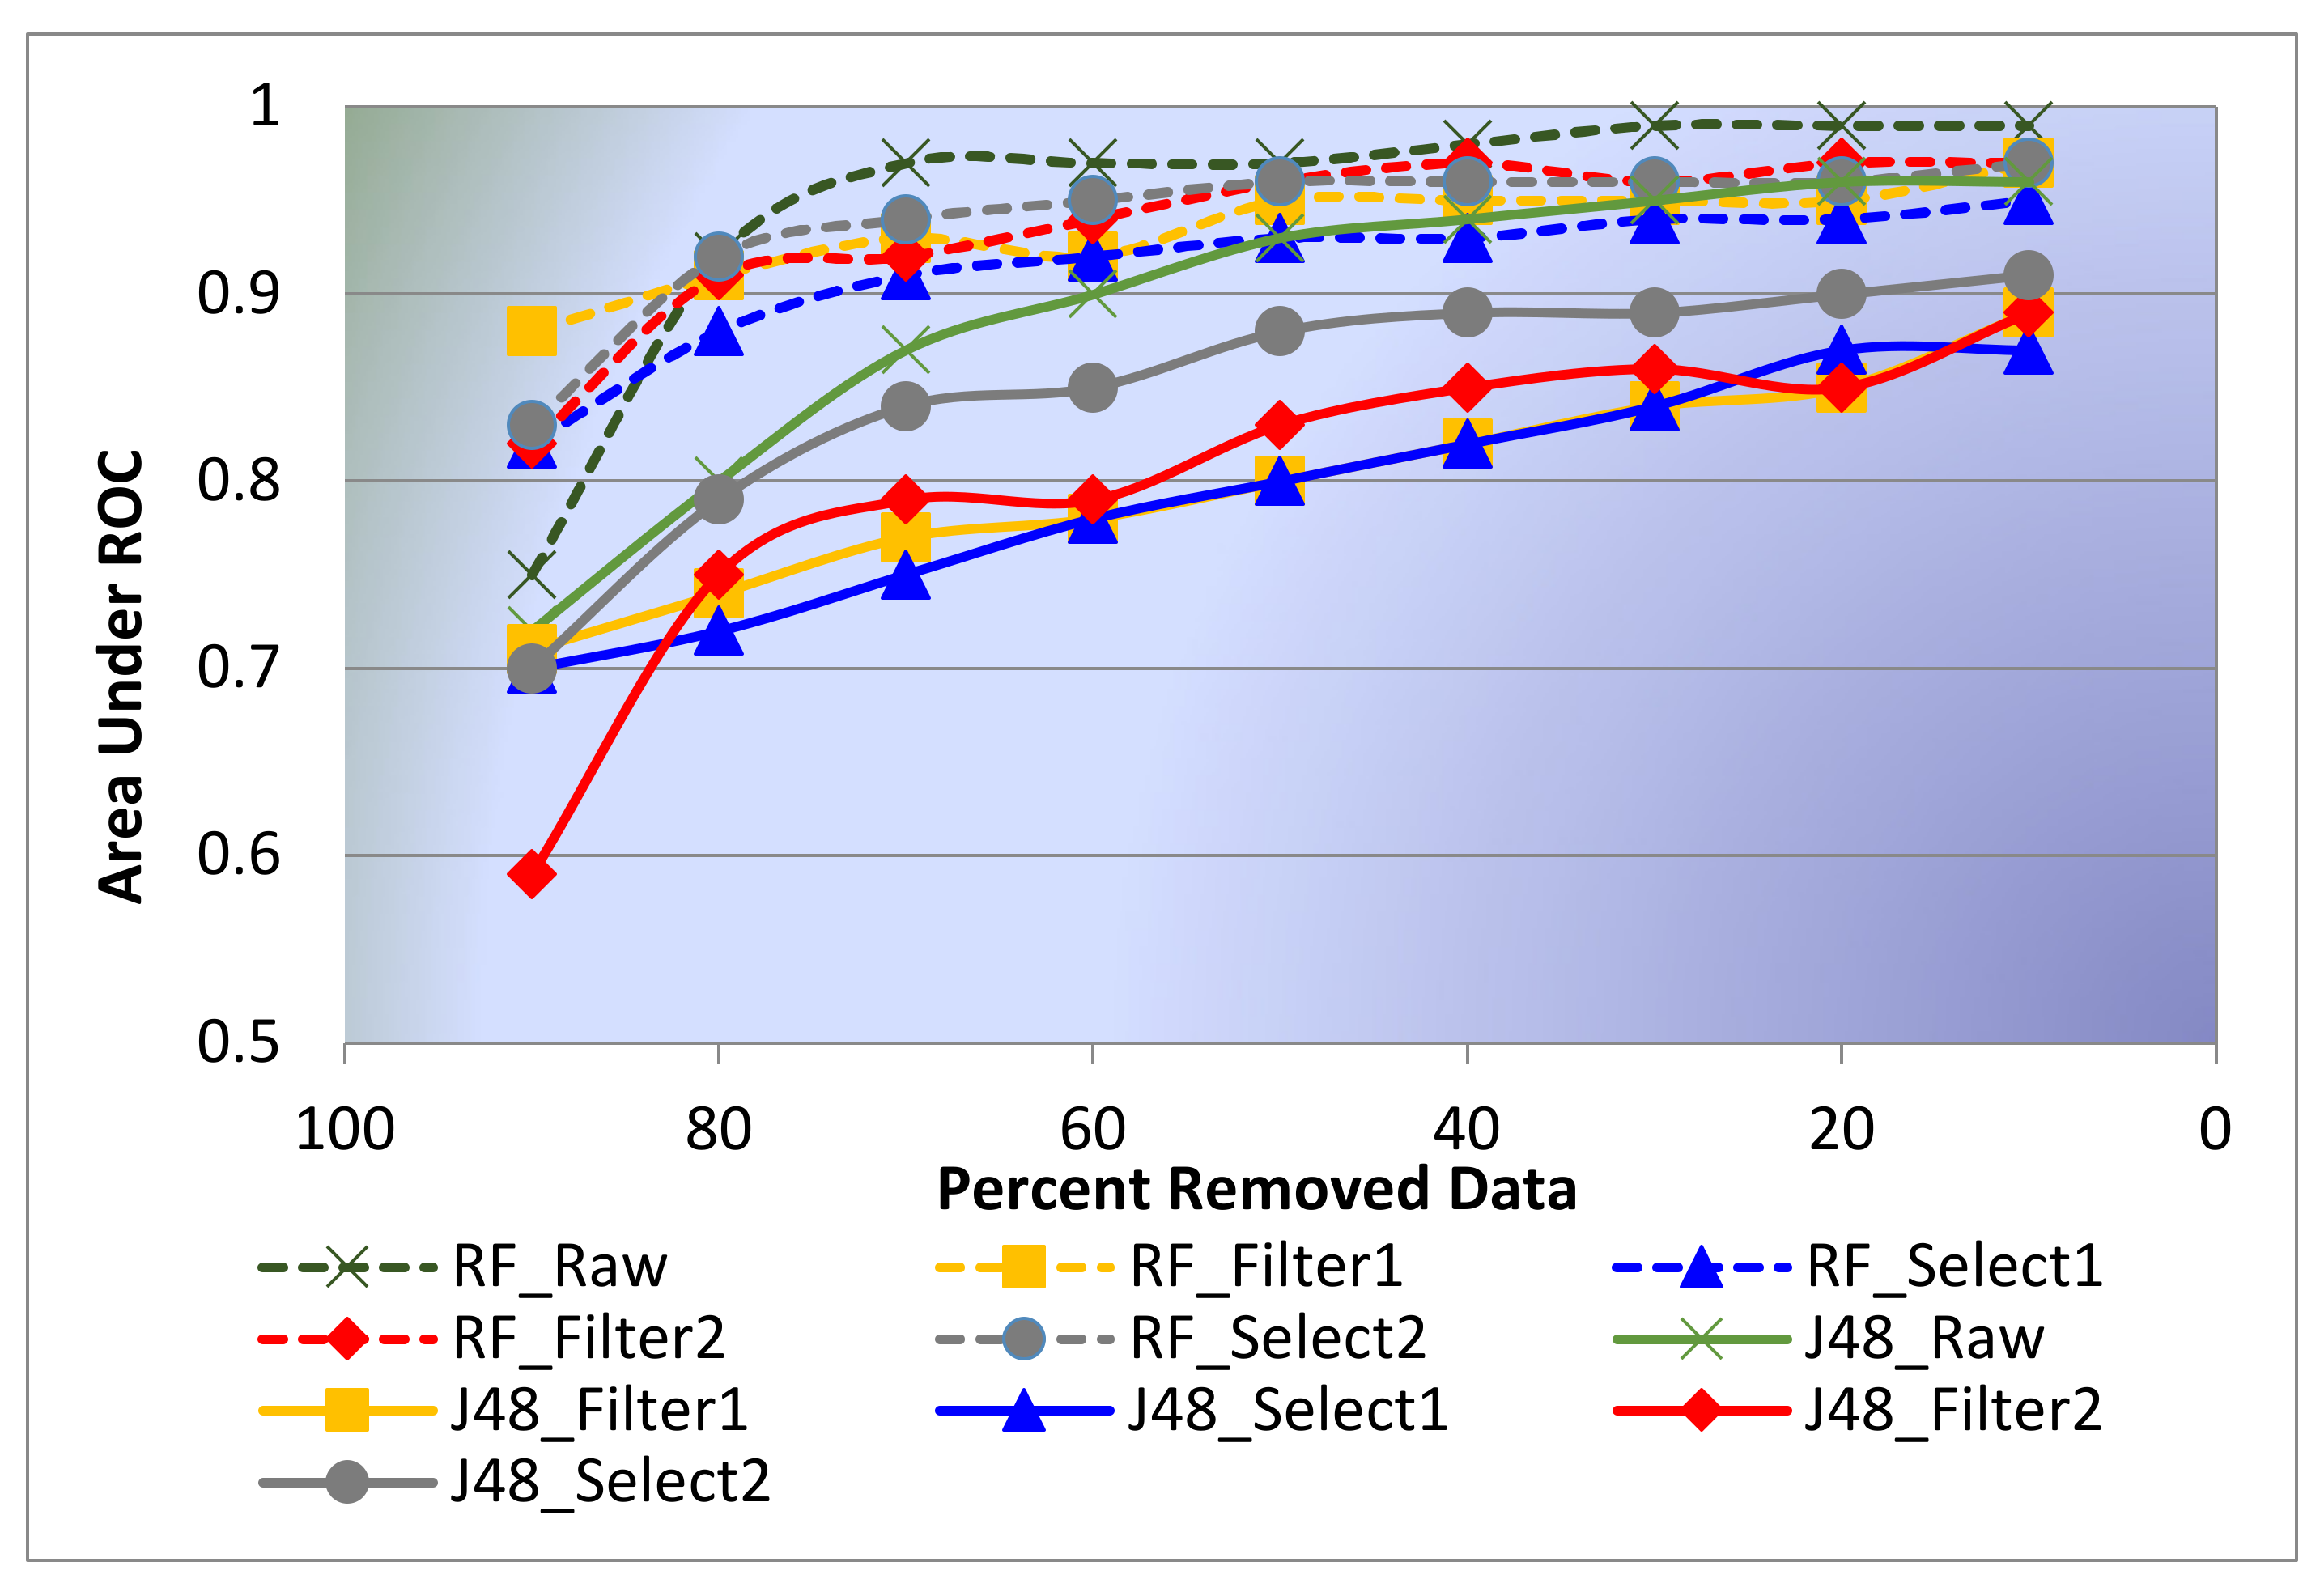
Obtaining a high classification performance is essential, and performance is related to the amount of the available data that are similar as it is related to a well-selected classifier. The learning curve, which describes the relationship between the training set size and classifier performance [47], can provide a quantitative view on the benefits of adding the training samples to the learning algorithm.
Figure 8 shows the learning curves for the two classifiers, J48 and random forest, with all filtering stages. Random forest performs better than J48 irrespective of the data size (Figure 8). In addition, random forest rapidly converges to good results. According to curves presented in Figure 4, approximately only 30% of the available data are adequate to achieve satisfactory results. However, the J48 algorithm requires a relatively larger amount of data to attain a performance similar to the performance of random forest, and when the data are added, the J48 algorithm continually improves.
5. Conclusions
In addition to their primary functions as electric insulators and coolants and in arc discharge extinction, dielectric fluids play a vital role in keeping electric power equipment in a good condition. The quality control of these fluids provides a general idea about whether the fluids can fulfil the aforementioned tasks. Usually, human experts perform the control, which makes the process frustrating, costly, time consuming, and competitively ineffective, especially with the emergence of the smart grid concept, growth of electrical networks, and deregulation of the energy sector. Condition automation monitoring becomes a necessity, and the evolution of the artificial intelligence and machine-learning techniques has helped in this monitoring. The performance of two machine-learning algorithms (J48 decision tree and random forest) in terms of classifying the maintenance actions that should be taken for in-service transformer oils was compared. The conclusions drawn from the obtained results are as follows:
- -
- By exploring the used datasets, the change in the quality of oil is reflected in the physicochemical parameters, except the viscosity, which is not affected. Oil parameters influence each other, and acidity and water content are the most influential parameters. Both observations are consistent with the finding of some studies [4,48,49], which confirms that our data are actual and suitable for machine learning.
- -
- Random forest is superior to the J48 algorithm for classification with an 89% accuracy and 0.96 AUC. In the J48 algorithm, the accuracy and AUC do not exceed 83.3% and 0.83, respectively.
- -
- The performance of the used classifier is not the only factor affecting the result quality; the data preprocessing method also influences this quality. Two strategies of data preprocessing are applied in the present paper through four steps, and a distinct improvement was achieved. In the first step, feature extraction was performed, where the original features were transformed into new features by using the simple k-means technique. Subsequently, the new features were filtered using the “CfsSubsetEval” algorithm to adopt only the relevant features in the second step. The same steps were then repeated, but for feature extraction PCA was performed instead of simple k-means.
- -
- Random forest exhibits a better performance than J48 irrespective of the data size, and it does not require large amounts of data to achieve relatively better results.
The final overall conclusion is that this study could be expanded by enriching the data used to build classification models and adding other parameters that may give an insight into other aspects of the oil condition or oil/paper condition. Additionally, the present work can be continued by associating the resulting model from this study with an overall online monitoring system after accompanying transformers with online connected field-test devices.
Author Contributions
All authors contributed equally to the reported research and writing of the paper. All authors have read and agreed to the published version of the manuscript.
Funding
This research received no external funding.
Institutional Review Board Statement
Not applicable.
Informed Consent Statement
Not applicable.
Data Availability Statement
Not applicable.
Acknowledgments
This project was financially supported by the Directorate General for Scientific Research and Technological Development—Algerian Ministry of Higher Education and Scientific Research.
Conflicts of Interest
The authors declare no conflict of interest.
References
- Krontiris, A. Fuzzy Systems for Condition Assessment of Equipment in Electric Power Systems. Ph.D. Thesis, Darmstadt University of Technology, Darmstadt, Germany, March 2012. [Google Scholar]
- Boudraa, S.; Mokhnache, L.; Fofana, I. Artificial neural networks for predicting the gassing tendency under electrical discharge in insulating oil for extended time. J. Electr. Eng. 2014, 14, 45–52. [Google Scholar]
- Meshkatoddini, M.R. Aging Study and Lifetime Estimation of Transformer Mineral Oil. Am. J. Eng. Appl. Sci. 2008, 1, 384–388. [Google Scholar] [CrossRef] [Green Version]
- Rao, U.M.; Fofana, I.; Betie, A.; Senoussaoui, M.L.; Brahami, M.; Briosso, E. Condition monitoring of in-service oil-filled transformers: Case studies and experience. IEEE Electr. Insul. Mag. 2019, 35, 33–42. [Google Scholar] [CrossRef]
- Pahlavanpour, B.; Roberts, I.A. Transformer oil condition monitoring. In IEE Colloquium on Transformer Life Management (Ref. No. 1998/510); The Institution of Engineering and Technology: London, UK, 1998. [Google Scholar]
- Chakravorti, S.; Dey, D.; Chatterjee, B. Recent Trends in the Condition Monitoring of Transformers: Theory, Implementation and Analysis; Springer-Verlag: London, UK, 2013. [Google Scholar]
- N’cho, J.S.; Fofana, I.; Hadjadj, Y.; Beroual, A. Review of Physicochemical-Based Diagnostic Techniques for Assessing Insulation Condition in Aged Transformers. Energies 2016, 9, 367. [Google Scholar] [CrossRef]
- James, R.E.; Su, Q. Condition Assessment of High Voltage Insulation in Power System Equipment, Power and Energy; The Institution of Engineering and Technology: London, UK, 2008. [Google Scholar]
- Ma, H.; Saha, T.K.; Ekanayake, C.; Martin, D. Smart Transformer for Smart Grid—Intelligent Framework and Techniques for Power Transformer Asset Management. IEEE Trans. Smart Grid 2015, 6, 1026–1034. [Google Scholar] [CrossRef] [Green Version]
- Mokhnache, L. Application de RN Dans le Diagnostique et la Prédiction des Isolations HT (Neural Network Application for the Diagnostic and the Prediction of High Voltage Isolation). Ph.D Thesis, Ecole National Polytechnique Alger, Algiers, Algeria, January 2004. [Google Scholar]
- Ma, H.; Saha, T.K.; Ekanayake, C.; Allen, D. Modern Machine Learning Techniques for Power Transformer Condition Assessment. CIGRE Session 44; CIGRE: Paris, France, 2012. [Google Scholar]
- Prasojo, R.A.; Suwarno, S. Power Transformer Paper Insulation Assessment based on Oil Measurement Data using SVM-Classifier. Int. J. Electr. Eng. Inform. 2018, 10, 661–673. [Google Scholar] [CrossRef]
- Ma, H.; Saha, T.K.; Ekanayake, C. Machine Learning Techniques for Power Transformer Insulation Diagnosis. In Proceedings of the AUPEC 2011, Brisbane, Australia, 1–6 September 2011. [Google Scholar]
- Alqudsi, A.; El-Hag, A. Application of Machine Learning in Transformer Health Index Prediction. Energies 2019, 12, 2694. [Google Scholar] [CrossRef] [Green Version]
- Chen, X.; Cui, H.; Luo, L. Fault Diagnosis of Transformer Based on Random Forest. In Proceedings of the 2011 Fourth International Conference on Intelligent Computation Technology and Automation, Shenzhen, China, 28–29 March 2011; pp. 132–134. [Google Scholar]
- Mokhnache, L.; Boubakeur, A. Comparison of different back-propagation algorithms used in the diagnosis of transformer oil. Annu. Rep. Conf. Electr. Insul. Dielectr. Phenom. 2003, 244–247. [Google Scholar] [CrossRef]
- Mokhnache, L.; Boubakeur, A.; Nait Said, N. Application of Neural Networks Paradigms in the Diagnosis and Thermal Ageing Prediction of Transformer Oil. In Proceeding of 14th International Conference on Dielectric Liquids (ICDL 2002), Graz, Austria, 7–12 July 2002. [Google Scholar]
- Mokhnache, L.; Kada, C.; Boubakeur, A.; Nait Said, N. Fuzzy Logic System for Oil Insulated Transformer Diagnosis. In Proceedings of the 5th International Conference on Quality, Reliability and Maintenance, Oxford, UK, 1–2 April 2004. [Google Scholar]
- Siddique, M.A.A.; Mehfuz, S. Artificial neural networks based incipient fault diagnosis for power transformers. In Proceedings of the 2015 Annual IEEE India Conference (INDICON), New Delhi, India, 17–20 December 2015; pp. 1–6. [Google Scholar]
- Thang, K.; Aggarwal, R.; McGrail, A.; Esp, D. Analysis of power transformer dissolved gas data using the self-organizing map. IEEE Trans. Power Deliv. 2003, 18, 1241–1248. [Google Scholar] [CrossRef]
- Senoussaoui, M.E.; Brahami, M.; Fofana, I. Combining and comparing various machine-learning algorithms to improve dissolved gas analysis interpretation. IET Gener. Transm. Distrib. 2018, 12, 3673–3679. [Google Scholar] [CrossRef]
- Piotr, M.; Yann, L. Statistical machine learning and dissolve gas analysis: A Review. IEEE Trans. Power Deliv. 2012, 27, 1791–1799. [Google Scholar]
- Wang, M.; Vandermaar, A.J.; Srivastava, K.D. Review of condition assessment of power transformers in service. IEEE Electr. Insul. Mag. 2002, 18, 12–25. [Google Scholar] [CrossRef]
- IEEE C57.637-2015-IEEE Guide for the Reclamation of Mineral Insulating Oil and Criteria for Its Use; IEEE Std C57.637-2015 (Revision of IEEE Std 637-1985); IEEE SA standard association: New York, NY, USA, 2015; pp. 1–38.
- Hochard, B. Le Transformateur de Puissance; Technique et documentation (Lavoisier): Paris, France, 1988. [Google Scholar]
- Hadjadj, Y. Exploration de Techniques Physicochimiques et Conception d’un Capteur en Ligne Pour le Diagnostic des Transformateurs de Puissance. Ph.D Thesis, University of Quebec in Chicoutimi, Chicoutimi, QC, Canada, 2015. [Google Scholar]
- Myers, D.; Kelly, J.J.; Parrish, R.H. Transformer Maintenance Guide; Transformer Maintenance Institute: Akron, OH, USA, 1981. [Google Scholar]
- N’cho, J.S.; Fofana, I.; Beroual, A.; Aka-Ngnui, T.; Sabau, J. Aged Oils Reclamation: Facts and Arguments based on Laboratory Studies. IEEE Trans. Dielectr. Electr. Insul. (TDEI) 2012, 19, 1583–1592. [Google Scholar] [CrossRef]
- Abdi, S.; Boubakeur, A.; Haddad, A.; Harid, N. Influence of Artificial Thermal Aging on Transformer Oil Properties. Electr. Power Components Syst. 2011, 39, 1701–1711. [Google Scholar] [CrossRef]
- Saha, T.; Darveniza, M.; Hill, D.; Le, T. Electrical and chemical diagnostics of transformers insulation. B. Accelerated aged insulation samples. IEEE Trans. Power Deliv. 1997, 12, 1555–1561. [Google Scholar] [CrossRef]
- Christopher, A.B.A.; Balamurugan, S.A.A. Prediction of warning level in aircraft accidents using data mining techniques. Aeronaut. J. 2014, 118, 935–952. [Google Scholar] [CrossRef] [Green Version]
- Ashkezari, A.D.; Ma, H.; Saha, T.K.; Ekanayake, C. Application of fuzzy support vector machine for determining the health index of the insulation system of in-service power transformers. IEEE Trans. Dielectr. Electr. Insul. 2013, 20, 965–973. [Google Scholar] [CrossRef] [Green Version]
- Quinlan, J.R. C4.5: Programs for Machine Learning; Morgan Kaufmann: San Mateo, CA, USA, 1993. [Google Scholar]
- Bhargava, N.; Sharma, S.; Purohit, R.; Rathore, P.S. Prediction of recurrence cancer using J48 algorithm. In Proceedings of the 2017 2nd International Conference on Communication and Electronics Systems (ICCES), Coimbatore, India, 19–20 October 2017; pp. 386–390. [Google Scholar]
- Maulana, M.F.; Defriani, M. Logistic Model Tree and Decision Tree J48 Algorithms for Predicting the Length of Study Period. J. Penel. IImu. Komp. Syst. Embed. Log. 2020, 8, 39–48. [Google Scholar] [CrossRef]
- Biau, G. Analysis of a random forests model. J. Mach. Learn. Res. 2012, 13, 1063–1095. [Google Scholar]
- Nabipour, M.; Nayyeri, P.; Jabani, H.; Mosavi, A.; Salwana, E.; Shahab, S. Deep Learning for Stock Market Prediction. Entropy 2020, 22, 840. [Google Scholar] [CrossRef]
- Breiman, L. Random Forests. Mach. Learn. 2001, 45, 5–32. [Google Scholar] [CrossRef] [Green Version]
- Rokach, L. Ensemble-based classifiers. Artif. Intell. Rev. 2010, 33, 1–39. [Google Scholar] [CrossRef]
- Khalid, S.; Khalil, T.; Nasreen, S. A survey of feature selection and feature extraction techniques in machine learning. In Proceedings of the Science and Information Conference (SAI), London, UK, 27–29 August 2014; pp. 372–378. [Google Scholar]
- Pearson, K. On lines and planes of closest fit to systems of points in space. Lond. Edinb. Dublin Philos. Mag. J. Sci. 1901, 2, 559–572. [Google Scholar] [CrossRef] [Green Version]
- Ghojogh, B.; Samad, M.N.; Mashhadi, S.A.; Kapoor, T.; Ali, W.; Karray, F.; Crowley, M. Feature selection and feature extraction in pattern analysis: A literature review. arXiv 2019, arXiv:1905.02845. [Google Scholar]
- Chang, M.-C.; Bus, P.; Schmitt, S. Feature extraction and k-means clustering approach to explore important features of urban identity. In Proceedings of the 16th IEEE International Conference on Machine Learning and Applications, ICMLA 2017, Cancun, Mexico, 18–21 December 2017; pp. 1139–1144. [Google Scholar]
- Khammas, B.M.; Monemi, A.; Bassi, J.S.; Ismail, I.; Nor, S.M.; Marsono, M.N. Feature selection and machine learning classification for malware detection. J. Teknol. 2015, 77, 234–250. [Google Scholar] [CrossRef] [Green Version]
- Cantürk, İ.; Karabiber, F. A machine learning system for the diagnosis of Parkinson’s disease from speech signals and its application to multiple speech signal types. Arab. J. Sci. Eng. 2016, 41, 5049–5059. [Google Scholar] [CrossRef]
- Witten, I.H.; Frank, E. Data Mining: Practical Machine Learning Tools and Techniques; Morgan Kaufmann: Boston, MA, USA, 2005. [Google Scholar]
- Weiss, S.M.; Battistin, A. Generating Well-Behaved Learning Curves: An Empirical Study. In Proceedings of the International Conference on Data Mining (DMIN), The Steering Committee of The World Congress in Computer Science, Computer Engineering and Applied Computing (WorldComp), Las Vegas, NV, USA, 21–24 July 2014; pp. 1–4. [Google Scholar]
- Hadjadj, Y.; Fofana, I.; Sabau, J.; Briosso, E. Assessing insulating oil degradation by means of turbidity and UV/VIS spectrophotometry measurements. IEEE Trans. Dielectr. Electr. Insul. 2015, 22, 2653–2660. [Google Scholar] [CrossRef]
- Fofana, I.; Bouaicha, A.; Farzaneh, M.; Sabau, J. Ageing Behaviour of Mineral Oil and Ester Liquids: A Comparative Study. In Proceedings of the 2008 Annual Report Conference on Electrical Insulation and Dielectric Phenomena, Quebec, QC, Canada, 26–28 October 2008; pp. 87–90. [Google Scholar] [CrossRef]
Figure 1.
Average values and standard deviations of different parameters for each decision category.
Figure 1.
Average values and standard deviations of different parameters for each decision category.

Figure 2.
The typical decision tree model.

Figure 3.
Schematic illustration of a random forest.

Figure 4.
Flowchart of the proposed method.

Figure 5.
Comparison of accuracy and Area Under ROC Curve for different approaches.

Figure 6.
Testing confusion matrix: (a) J48; (b) random forest.

Figure 7.
Impact of each parameter on classification accuracy.

Figure 8.
AUC learning curves for different approaches.


Table 1.
Insulating oil tests.
| Type of Test | ASTM Method | Significance/Effects |
|---|---|---|
| Dielectric Breakdown | D877, D1816 | Describes the oil’s function as an insulant. This parameter is affected by moisture, particles, cellulose fibers and temperature. |
| Neutralization Number | D644, D974 | Represents a measure of the trace amount of acidic or alkaline contaminants in the insulating liquid. With increasing oxidation level of in-service oil, polar compounds, particularly organic acids form in the oil. |
| Interfacial Tension (IFT) | D971 | Indicates the presence of polar contaminants, acids, solvents, varnish. This is a useful screening method for in-service oils exposed to soaps, acids, varnishes, and solvents. |
| Water Content | D1533 | Increases electric conductivity and dissipation factor and lowers the electric strength. Moisture increase may arrive from excessive paper decomposition. |
| Power Factor | D924 (100, 25 C) | Describes the insulating liquid’s function as a dielectric. This parameter is affected by contaminants (moisture, conductive particles, dissolved metals, peroxides, acids, salts/overheating, etc.) |
| Oxidation Inhibitor (DBPC 1) | D2668, D1473 | Represents a quantitative assessment of the amount of inhibitors by mass in the liquids. With increase in aging, the inhibitors are consumed and need to be replenished when needed. |
| Metals in Oil | The presence of metal contaminants may affect many oil properties. This is generally indicative of pump wear, arcing or sparking with metal. |
1 DBPC—Dibutyl Paracresol.
Table 2.
Standards and oil test limits adopted by SONELGAZ.
| Test Item | Standard | Limit Values |
|---|---|---|
| Color | ASTM D1500 | ≤2 |
| tgδ | IEC 60250, | <0.3 |
| Acidity (mgKOH/g) | IEC 60296 | <0.1 |
| Viscosity (cSt) | NF-T-60 100 | <10.5 |
| Dielectric strength (kV) | IEC 60156 | ≥40 |
| Water content (ppm) | ISO 12-760 | <30 |
Table 3.
Correlation matrix of the physico-chemical parameters.
| Color | Viscosity | Acid Number | Dielectric Strength | Tgδ | Water Content | |
|---|---|---|---|---|---|---|
| Color | 1 | |||||
| Viscosity | 0.041859 | 1 | ||||
| Acid Number | 0.445081 | 0.103748 | 1 | |||
| Dielectric Strength | −0.13946 | −0.03912 | −0.26409 | 1 | ||
| Tgδ | 0.262958 | 0.111397 | 0.695077 | −0.32828 | 1 | |
| Water Content | 0.133563 | 0.190597 | 0.367912 | −0.55923 | 0.295186 | 1 |
Table 4.
Comparison of actual decision and predicted classification for new data cases.
| Test Item | Colour | Viscosity | Acidity | Dielectric Strength | Tgδ | Water Content | Actual Decision | J48 Prediction | RF Prediction | |
|---|---|---|---|---|---|---|---|---|---|---|
| Limit Values | 2 | 10.5 | 0.1 | 40 | 0.3 | 30 | ||||
| Data instances | 1 | 0.7 | 10.23 | 0.012 | 57 | 0.072 | 16 | Keep | Keep | Keep |
| 2 | 2.3 | 10.87 | 0.091 | 22 | 0.019 | 40 | Filter | Filter | Filter | |
| 3 | 4.5 | 11.19 | 0.42 | 30 | 0.55 | 42 | Discard | Discard | Discard | |
| 4 | 2.9 | 10.97 | 0.021 | 65 | 0.018 | 7 | Keep | Keep | Keep | |
| 5 | 3.4 | 11.5 | 0.07 | 57 | 0.105 | 23 | Reclaim | Keep | Reclaim | |
| 6 | 1 | 12.45 | 0.046 | 56 | 0.15 | 31 | Keep | Keep | Keep | |
| 7 | 2 | 10 | 0.106 | 50 | 0.025 | 35 | Filter | Filter | Filter | |
| 8 | 2 | 12.3 | 0.062 | 52 | 0.020 | 32 | Keep | Keep | Keep | |
| 9 | 4 | 12 | 0.08 | 48 | 0.022 | 37 | Reclaim | Reclaim | Reclaim | |
| 10 | 4 | 12 | 0.3 | 30 | 0.6 | 42 | Discard | Discard | Discard |
Publisher’s Note: MDPI stays neutral with regard to jurisdictional claims in published maps and institutional affiliations. |
© 2021 by the authors. Licensee MDPI, Basel, Switzerland. This article is an open access article distributed under the terms and conditions of the Creative Commons Attribution (CC BY) license (http://creativecommons.org/licenses/by/4.0/).
Share and Cite
MDPI and ACS Style
Senoussaoui, M.E.A.; Brahami, M.; Fofana, I. Transformer Oil Quality Assessment Using Random Forest with Feature Engineering. Energies 2021, 14, 1809. https://doi.org/10.3390/en14071809
AMA Style
Senoussaoui MEA, Brahami M, Fofana I. Transformer Oil Quality Assessment Using Random Forest with Feature Engineering. Energies. 2021; 14(7):1809. https://doi.org/10.3390/en14071809
Chicago/Turabian StyleSenoussaoui, Mohammed El Amine, Mostefa Brahami, and Issouf Fofana. 2021. "Transformer Oil Quality Assessment Using Random Forest with Feature Engineering" Energies 14, no. 7: 1809. https://doi.org/10.3390/en14071809
Note that from the first issue of 2016, this journal uses article numbers instead of page numbers. See further details here.