
The Correlation of Transformer Oil Electrical Properties with Water Content Using a Regression Approach
by
 , , and
Sifeddine Abdi
1,* ,
,
Noureddine Harid
2,
Leila Safiddine
3,
Ahmed Boubakeur
4 and
and
Abderrahmane (Manu) Haddad
5,*
1
LREA, Department of Electrical Engineering, Faculty of Technology, Medea University, Medea 26000, Algeria
2
APEC Centre, Department of Electrical and Computer Engineering, Khalifa University, Abu Dhabi 127788, United Arab Emirates
3
Dielectric Oil Laboratory, SADEG SPA, SONELGAZ, Blida 09100, Algeria
4
LRE, Department of Electrical Engineering, Ecole Nationale Polytechnique, Algiers 16200, Algeria
5
Advanced High Voltage Engineering Research Centre, School of Engineering, Cardiff University, The Parade, Cardiff CF24 3AA, UK
*
Authors to whom correspondence should be addressed.
Energies 2021, 14(8), 2089; https://doi.org/10.3390/en14082089
Submission received: 23 February 2021
/
Revised: 21 March 2021
/
Accepted: 26 March 2021
/
Published: 9 April 2021
(This article belongs to the Special Issue Advances in Oil Power Transformers)
Abstract
:An experimental investigation is conducted to measure and correlate the impact of the water content on the electrical characteristics of the mineral oil for transformers, particularly the breakdown voltage, the resistivity, and the dielectric dissipation factor. Regression method is carried out to compare the results obtained through laboratory experiments with those predicted using an analytical model. A treatment to reduce water content in oil involving filtration, degassing and dehydration using a SESCO mobile station was applied to the new, regenerated, and used oil samples in service. The breakdown voltage, the resistivity, and the dielectric dissipation factor of the samples were measured. Regression analysis using an exponential model was applied to examine the samples electrical properties. The results show that, after treatment, the breakdown voltage and resistivity increase as the water content decreases, unlike the dielectric dissipation factor which exhibits a decreasing trend. This trend is found to be similar for the three oil samples: new, regenerated, and used. The results of the regression analysis give close agreement with the experimental results for all the samples and all studied characteristics. The model shows strong correlation with high coefficients (>90%).
1. Introduction
Oil immersed transformers are amongst the key components in the electrical power apparatus. They are exposed to electrical, thermal, and chemical stresses during their service life, which can cause liquid and paper insulation to deteriorate, undermining their efficiency. Condition assessment and monitoring of the transformer insulation is crucial for mitigating this deterioration, thereby reducing energy losses and costly systems disruptions. The monitoring is systematically centered on electrical, chemical, and physical properties analysis of the oil [1,2,3,4]. Moisture is known to be one of the factors having the most adverse effect on transformer paper and oil insulation. It reduces the dielectric strength and the partial discharge (PD) inception voltage, which affects the electrical properties [5,6,7].
The most significant factors that favor moisture ingress in transformers are aging and external factors. The moisture equilibrium properties of oil and paper insulation are well-known and widely used to predict the amount of moisture [8,9]. When the moisture in oil has reached its steady state, tests can be used to measure the humidity in Reference [10,11]. The work reported in Reference [12] shows that more than 99% of moisture exists in the paper insulation, and the rest remains in the oil.
Water can be present in mineral oils in a number of physical and physico-chemical states which may be united together into a boundary state. For physical states, water takes a molecular distributed state, associated state, colloidal state (fine dispersion) and emulsion state. For physico-chemical states; it takes cluster state, adsorbed state, clathrate state and chemisorbed state. The total volume of water in these liquids, regardless of the state, is the water content of insulating oil [11].
The moisture due to aging mechanism leads to reduced dielectric strength and increased viscosity especially for the aged oil. Hence, the electrical properties deteriorate; the breakdown voltage and the resistivity decrease, and the dielectric dissipation factor increase as reported by several researchers [13,14,15,16,17]. The degree of polymerization (DP) and tensile strength (TS) of paper are reduced and these precipitate the deterioration of the solid insulation. The aging mechanism also leads to the formation of dissolved gases in oil, hence degrading the physico-chemical properties of the insulation system [6,18,19]. Consequently, assessing and monitoring the oil/paper insulation is crucial in order to maintain a reliable operation of power transformers.
In a prior investigation [20], it was reported that the transformer oil thermal aging causes a rise in the quantity of water in oil. The electrical properties of the oil, such as dielectric strength and resistivity, are strongly affected by this rise, as was confirmed by many research studies [21,22,23]. The interdependence between the electrical parameters of insulating oil and its water content has been studied by many researchers. Some researchers have used a regression approach to model this interdependence. However, the developed models considered every electrical property separately [24,25].
Correlating between the oil’s breakdown voltage, its resistivity and dielectric dissipation factor offer an attractive tool for assessing the amount of water in transformer oil. This study seeks to explore such correlations between the variations in water content and these three electrical characteristics of oil obtained from experimental investigations. Three transformer oil samples were tested: new, regenerated, and used. For the new and regenerated samples, a quantity of water was added to the oil samples to increase their water content. The three samples were given a physical treatment with a SESCO mobile station to decrease their water content. The oil samples electrical properties were measured during the treatment process. The measurements of the breakdown voltage, the resistivity, and the dielectric dissipation factor were conducted in accordance with the relevant standards. After that, the relationship between the samples electrical properties and the water content variation was examined. Regression approach is applied to the experimental results in order to find a mathematical model showing strong correlation between the numerical and experimental results of the the breakdown voltage, the resistivity, and the dielectric dissipation factor after reducing water content.
2. Experimental Work
2.1. Experiment Preparation
The experiment included three oil samples: new, regenerated, and used produced by APAR INDUSTRIES LTD oil originally from India, commonly used as transformer insulation in power transport and transmission networks in Algeria. The key characteristics of the transformer oil samples were measured as specified in relevant standards and are summarized in Table 1.
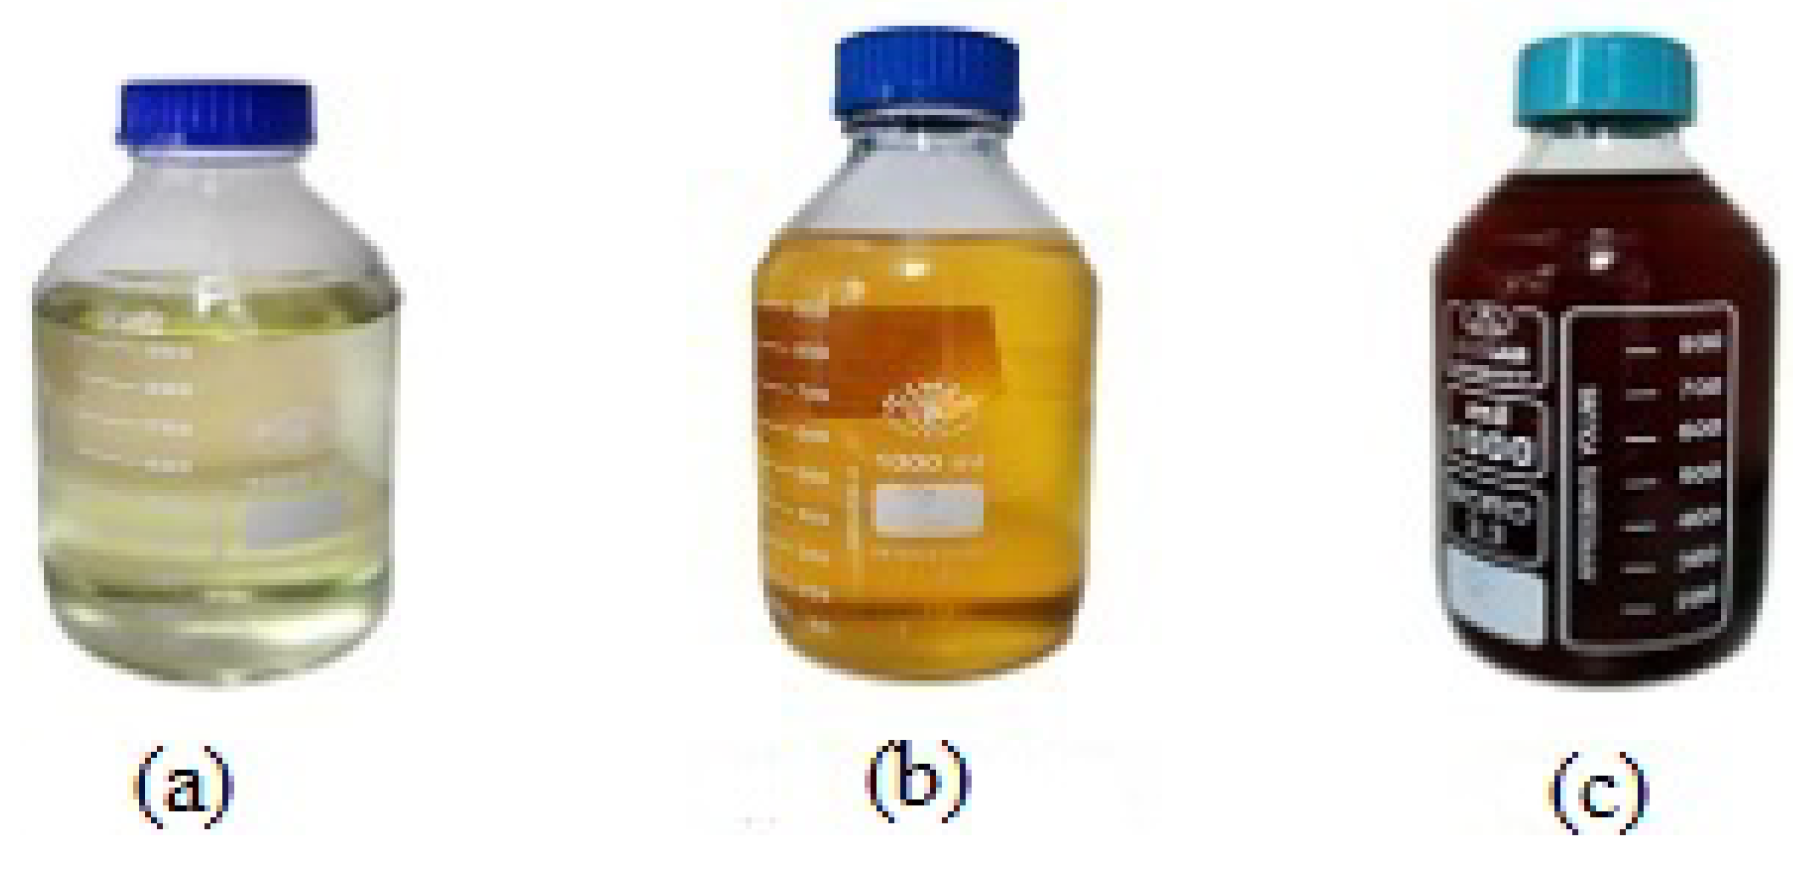
The three oil samples used in the experiment are shown in Figure 1. As specified in the standard [26], the color of the sample reflects clearly its condition. The darker the color, the more degraded is the oil, with the new sample showing a transparent color. The regenerated sample’s color is improved from dark to yellow following treatment.
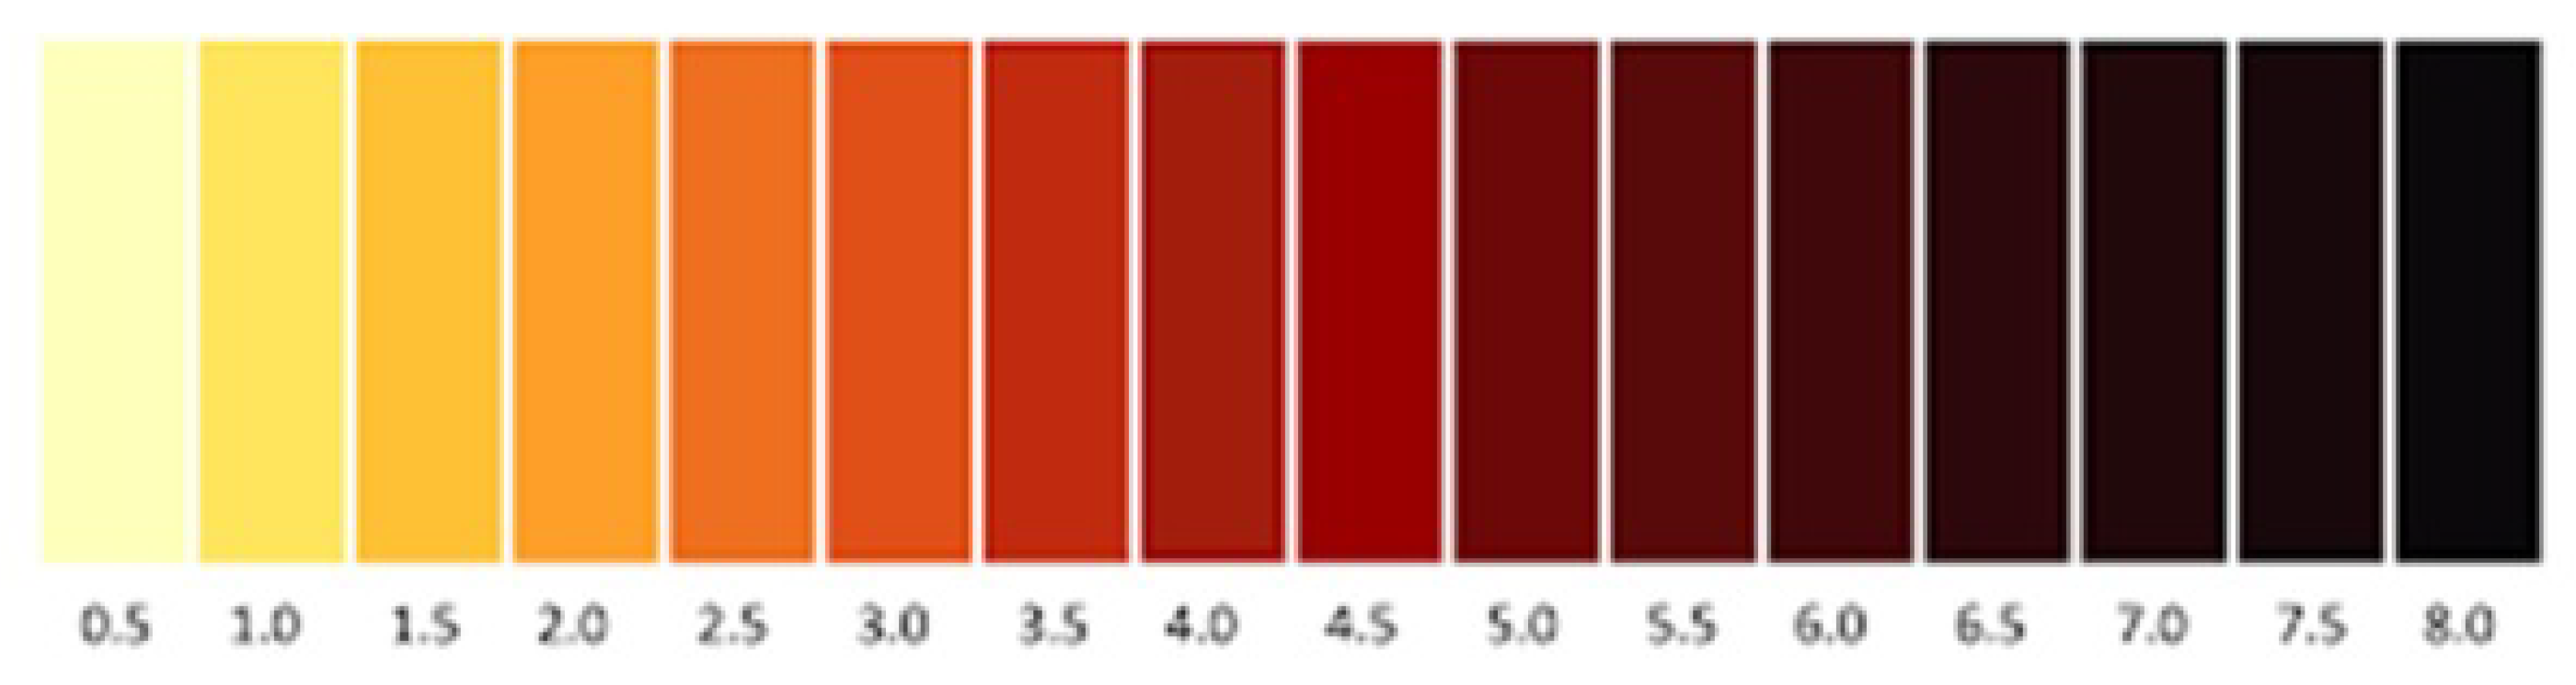
The ASTM color scale given in Reference [26] presents the color values of mineral oil. It undergoes from 0 value, corresponding to water white, to reach a value of 8, which is dark, by 0.5 increment unit. The color scale representation is presented in Figure 2.
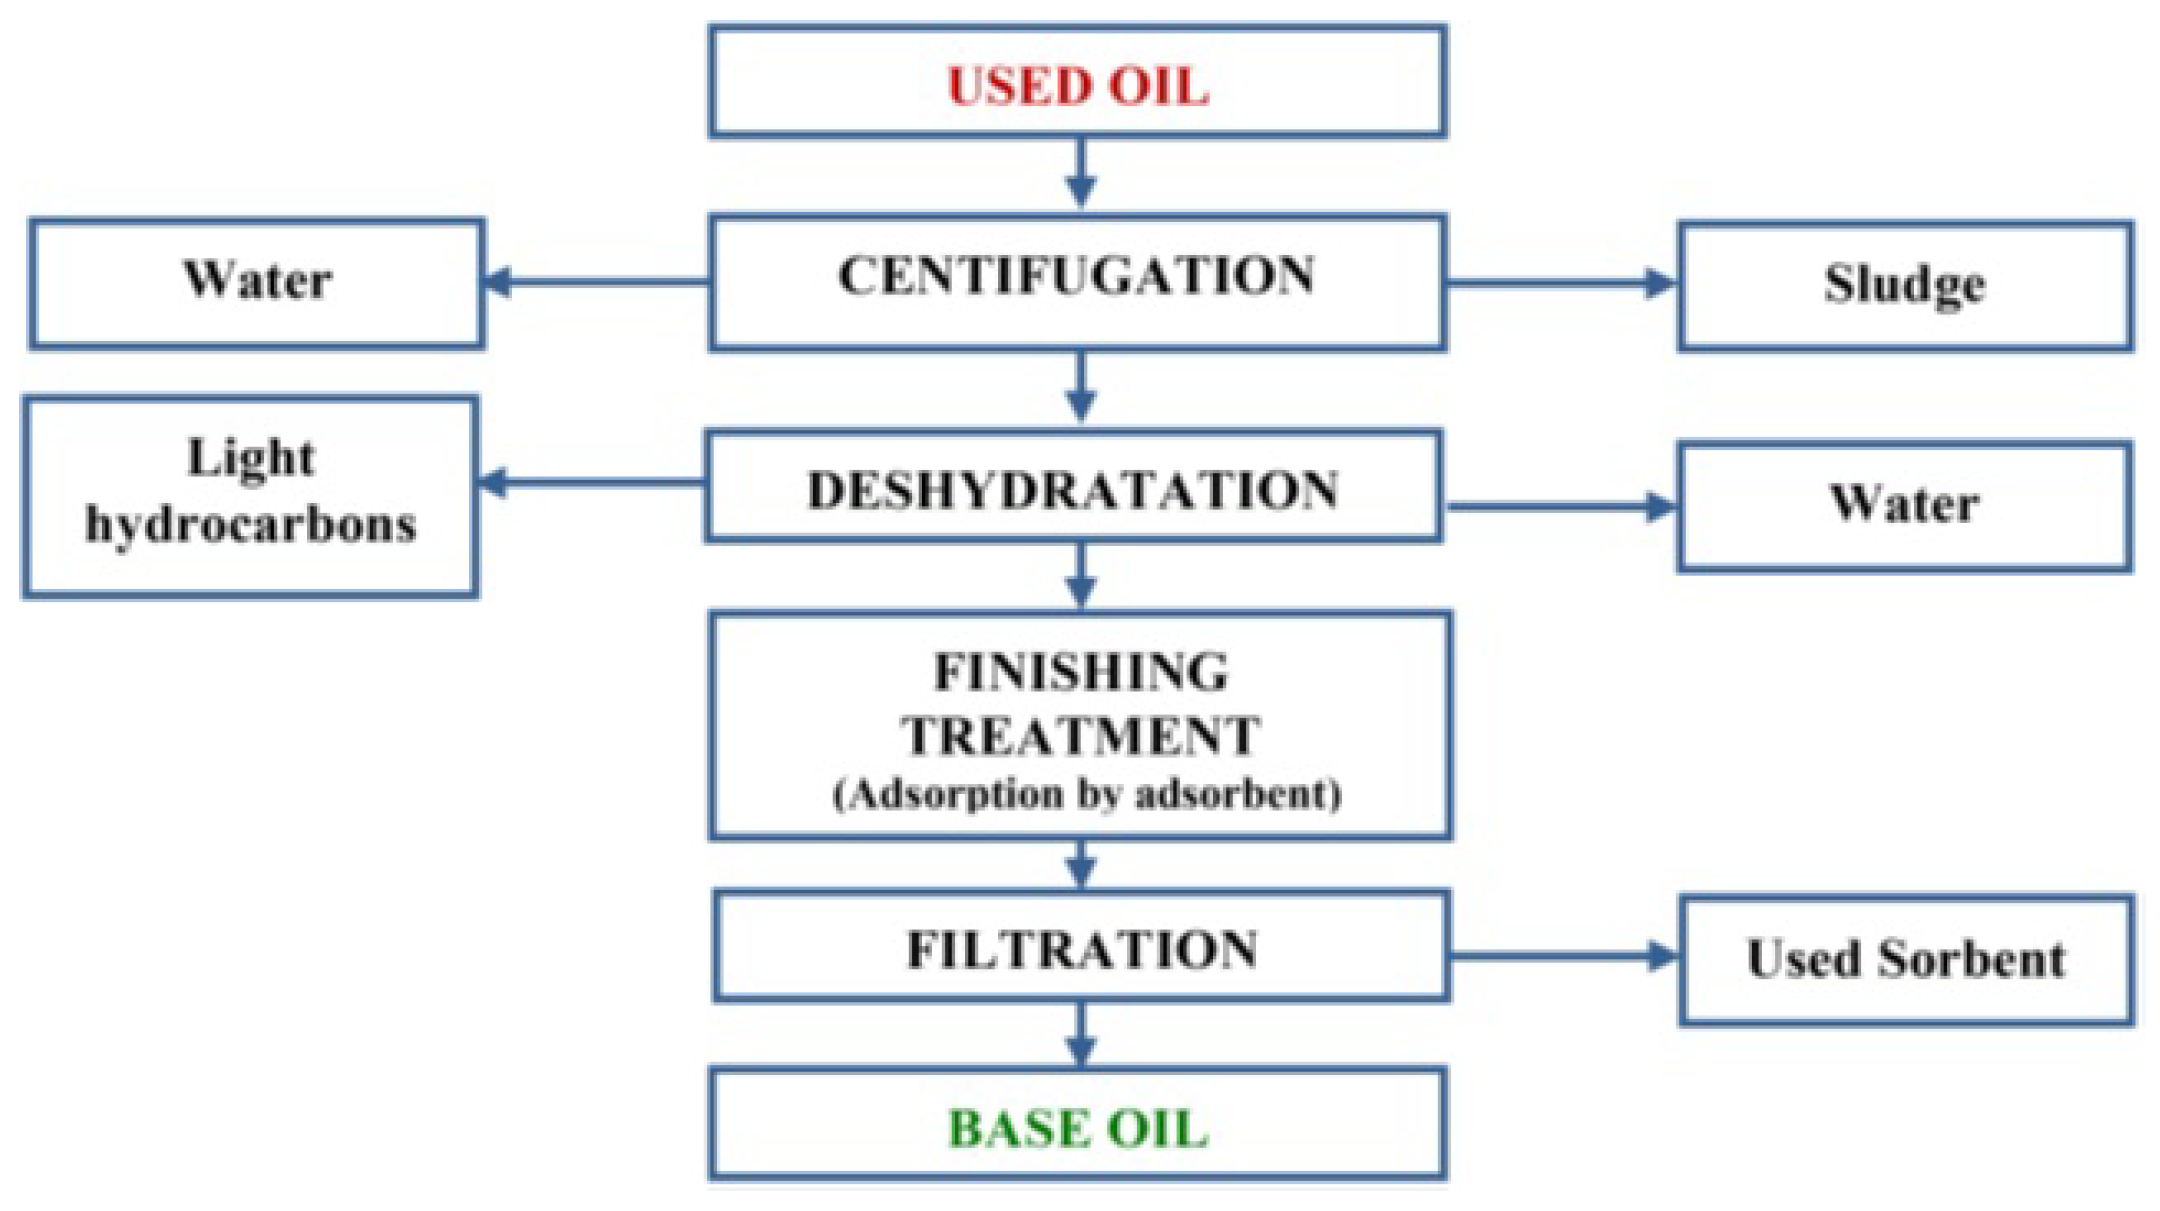
The regenerated oil sample was collected from the reclamation or regeneration of degraded oil sample. This process is based on the removal of acidic elements, water and aging by-products in the oil using adsorption processes with activated bentonite as adsorbent. Figure 3 shows the adsorption processes, which include drying, filtering, sedimentation, and removing impurities [27,28]. The regeneration treatment is conducted in accordance with IEC 60422 Standard [29].
2.2. Method of Physical Treatment
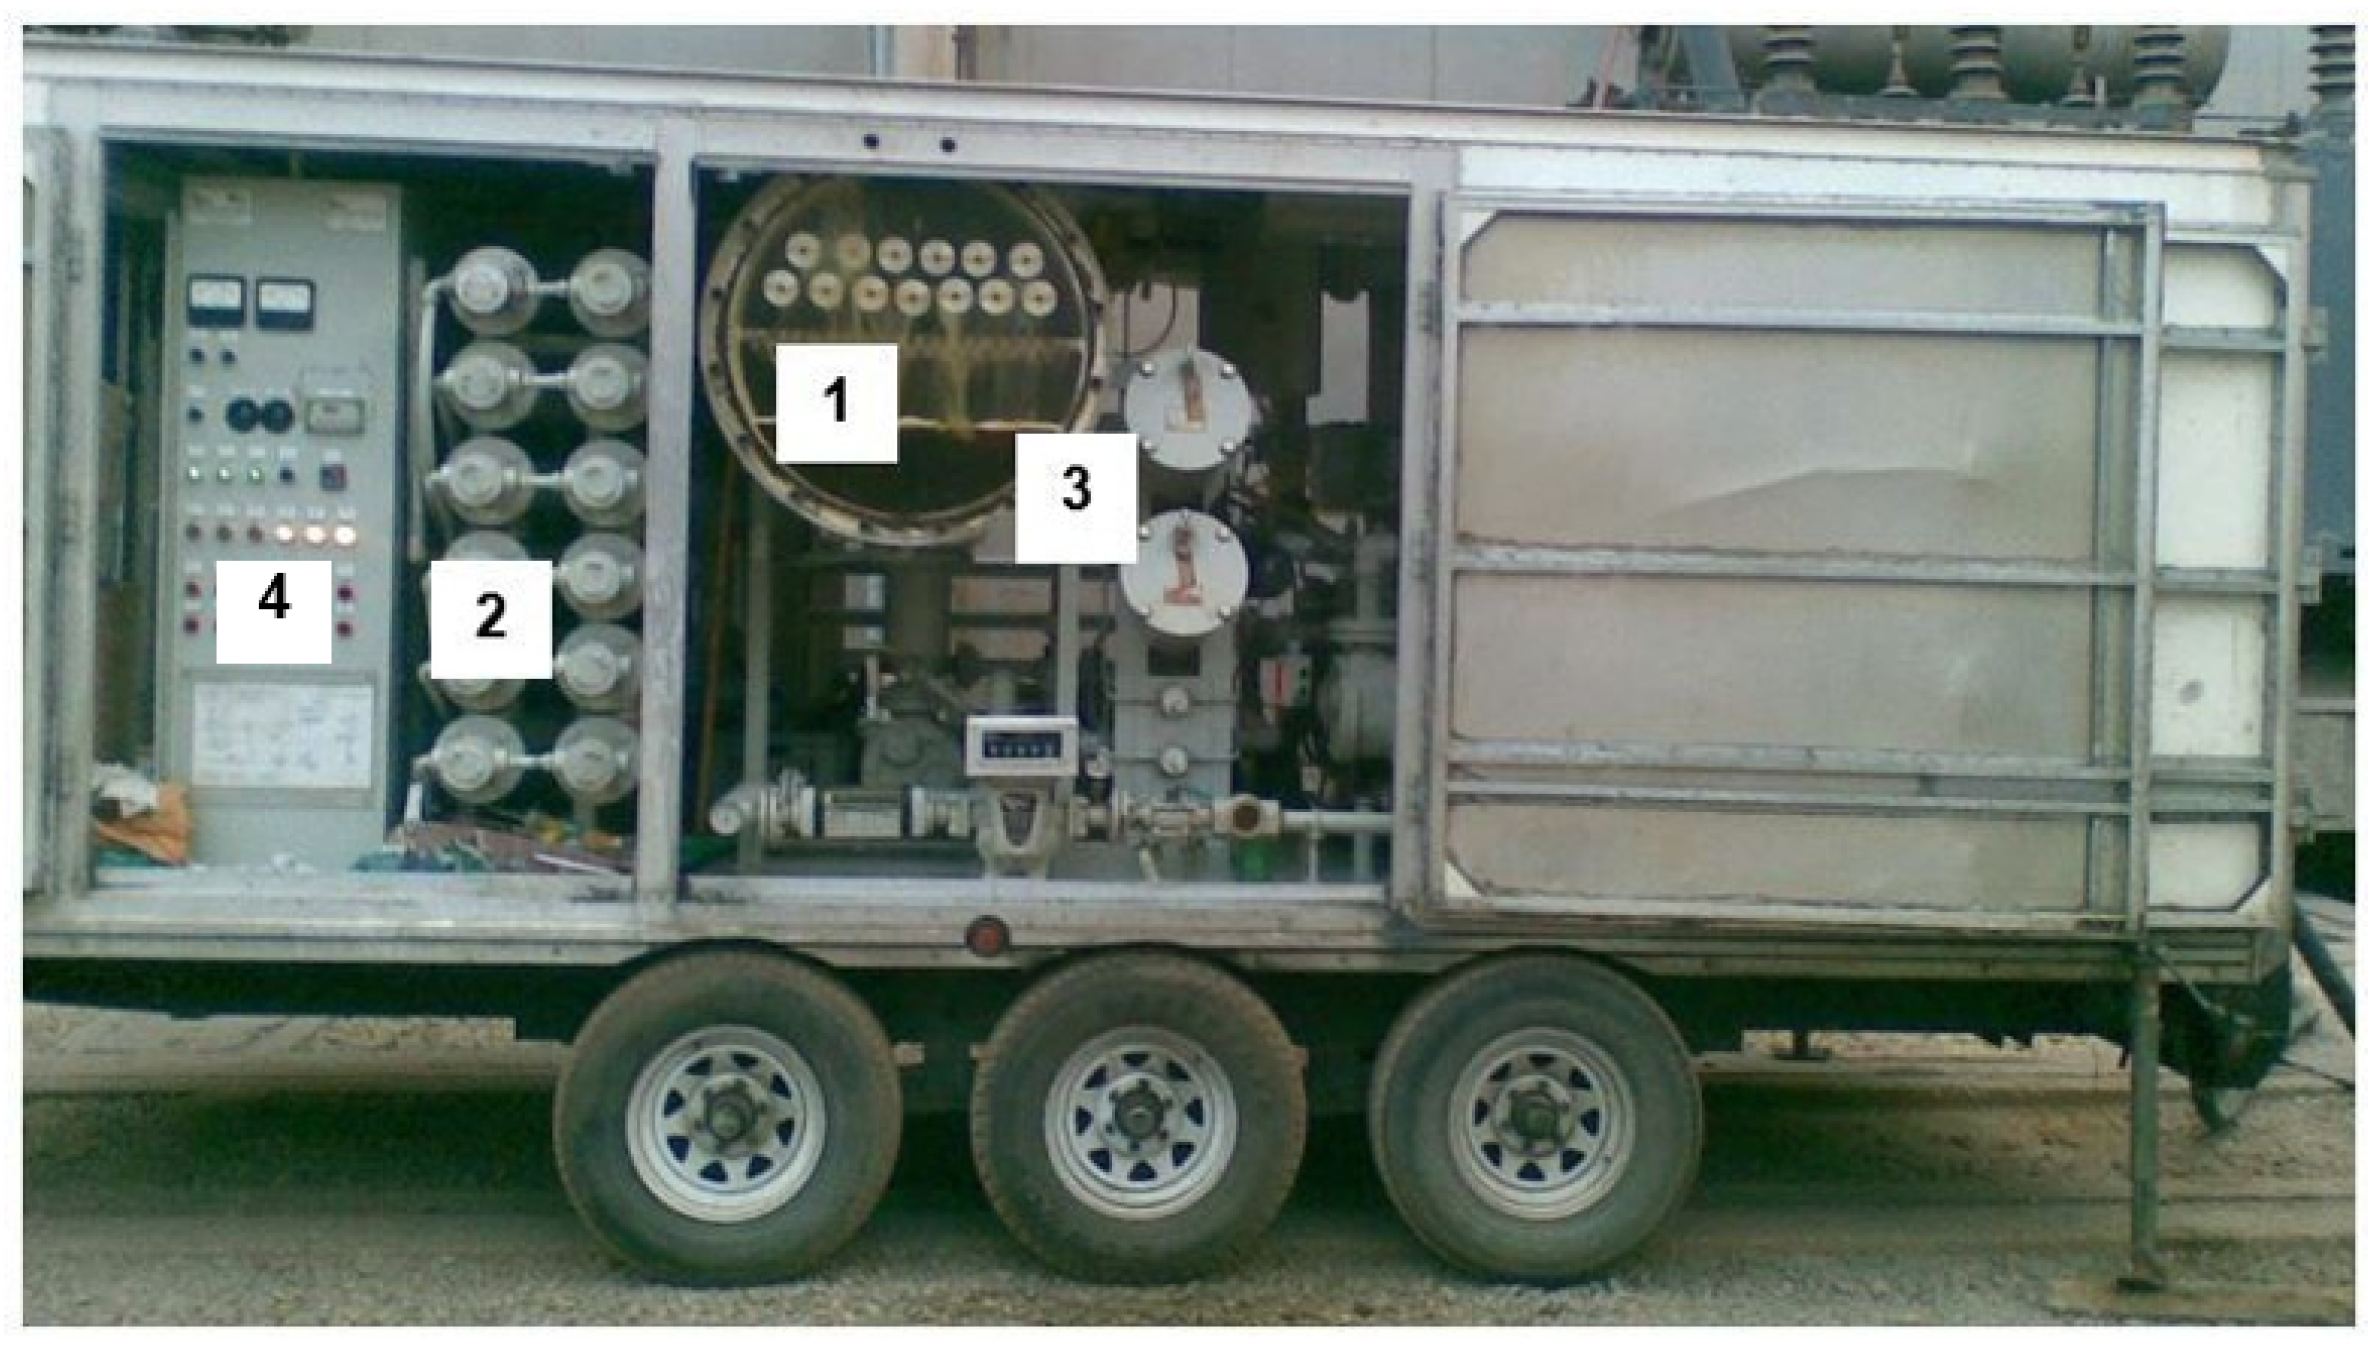
A SESCO mobile station based on physical treatment process was used for the transformer oil samples to decrease the amount of water in them, the mobile station is located in an electrical utility’s dielectric laboratory. This treatment consists of the purification, vacuum distillation and drying of the oil, that is an essential process before the oil is injected into the transformer and during regular maintenance [27]. The steps of the treatment presented in Figure 4 starts with filtration of water and impurities from the oil sample. The second step is the dehydration of the oil sample in a degassing chamber using an electric heater system. By spraying mineral insulating oil into a vacuum chamber and heating it to 80 C and vacuuming it down to 0.5 mmHg, this step efficiently reduces the gas and water content of the oil. At the exit of the degassing chamber, the oil sample is filtered again in order to remove fine particles and residual water.
Throughout the treatment process, the oil samples electrical characteristics were measured. According to the IEC 60814 standard [30], the reduced water content was assessed using an automatic coulometric Karl Fischer titration. The measurements of breakdown voltage, resistivity and dielectric dissipation factor were conducted as specified in the relevant standards [31,32]. The breakdown voltage was measured by a Megger Spintermeter Oil Test Sets OTS 100 AF/2 using a test cell with two spherical electrodes of 12.5 mm diameter and a gap between electodes of 2.5 mm. The resistivity and the dielectric dissipation factor were measured by an Automatic Test Equipment Dieltest DTL system. The dielectric dissipation factor measurement is based on Schering bridge at a temperature of 90 C and 2 kV ac voltage. For the resistivity measurement, a dc voltage of 500 V is applied to the test cell at a temperature of 90 C.
3. Correlation and Regression Analysis
The regression analysis approach is useful to explore and highlight the significance type and the connection between measured values of tested samples and random variables statistical samples [5]. If linear dependence exists between the tested random variables, the correlation analysis can help identify the key interaction [6,33]. This correlation becomes stronger when the obtained random variables values are closer to the experimental values.
The functional relationship between random variables can be examined using regression analysis. Furthermore, similar relationship between variables and experiment parameters can be investigated. A mathematical procedure can then be utilized to solve such two diverse problems. For this type of analysis, the variables are graphically presented using the regression approach. In this work, the interest is focused on establishing whether or not nonlinear dependence between random variables and experimental values is present.
Considering the distribution of the random variables is nonlinear, the values are normally correlated by a nonlinear equation. The mathematical expression is determined from the graphical representation displayed by the sample of pairs of experimental values. The obtained results are then dispersed on the nonlinear regression. Moreover, if the appropriate correlation factor or the coefficient of determination is small, it follows that the nonlinear dependence between random variables is weak. In contrast, the dependence is strong when the test results are concentrated around given coordinates [6].
In our investigation, an exponential regression model is developed to estimate breakdown voltage, resistivity and dielectric dissipation factor of transformer oil as a result of water content in oil. The adopted generic form of exponential regression models is given in Equation (1):
where x is the water content, and y is the concerned electrical property. a, b, c, and d are the parameters of the regression method.
The random variables obtained by regression analysis are given by the Y vector given in Equation (2), it represents the values of the three studied characteristics: the breakdown voltage, the resistivity, and the dielectric dissipation factor.
The X vector represents the values of oil water content after applying a physical treatment.
The variation is defined as the difference between each individual value and the mean. The sum of variation square defines the sum of squares SS. It is calculated by squaring and then summing up the distance between each data point and the best trend line. The best trend line minimizes this value and is calculated using Equation (4),
where:
- b(i) is the vector containing the regression model parameters a and b;
- x(i) are the water content values;
- y(i) are the experimental values of each electrical property; and
- f(b(i),x(i)) is the exponential given in Equation (1).
The correlation coefficient or the residual sum of squares named R-squared or R, is the square of the correlation between the predicted values by regression model and the experimental values. An R of 0 means that the experimental values cannot be predicted by the regression model. An R of 1 means that the experimental values can be predicted by the regression model without error. An R between 0 and 1 means that only a percentage of the experimental values can be predicted by the regression model [34,35]. This coefficient is calculated with Equation (5).
where:
- y are the experimental values of each electrical property,
- are the correlated values obtained by the regression analysis for each electrical property,
- and
- are the mean of the six test values for each point.
4. Results and Discussion
4.1. Breakdown Voltage
The results of the breakdown voltage variation with the reduced water content for the three oil samples: new, regenerated, and used are shown in Figure 5, Figure 6 and Figure 7, respectively.
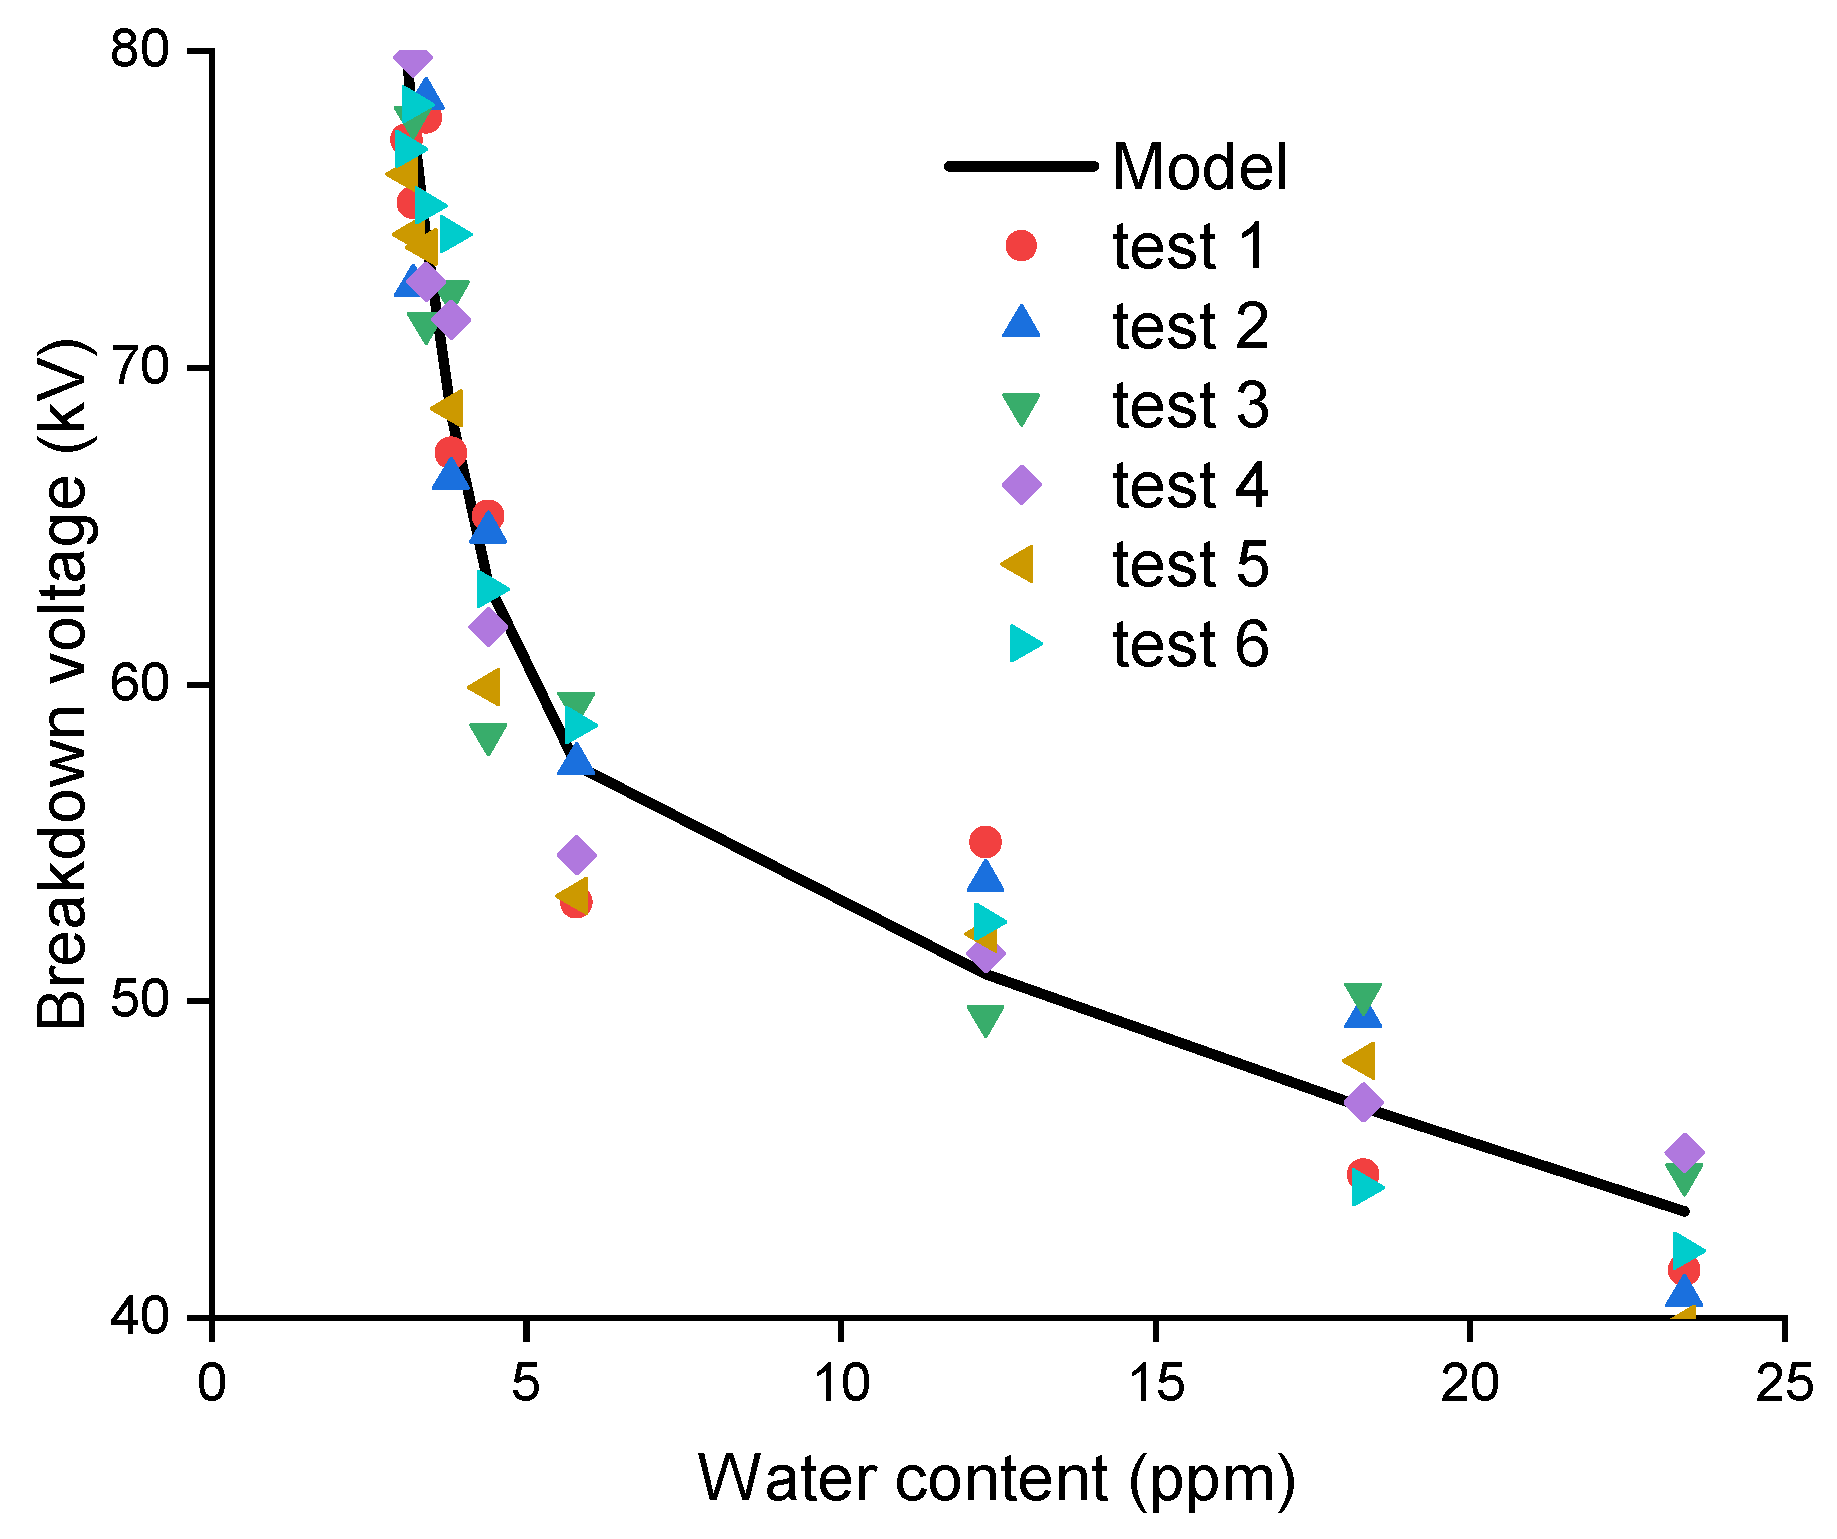
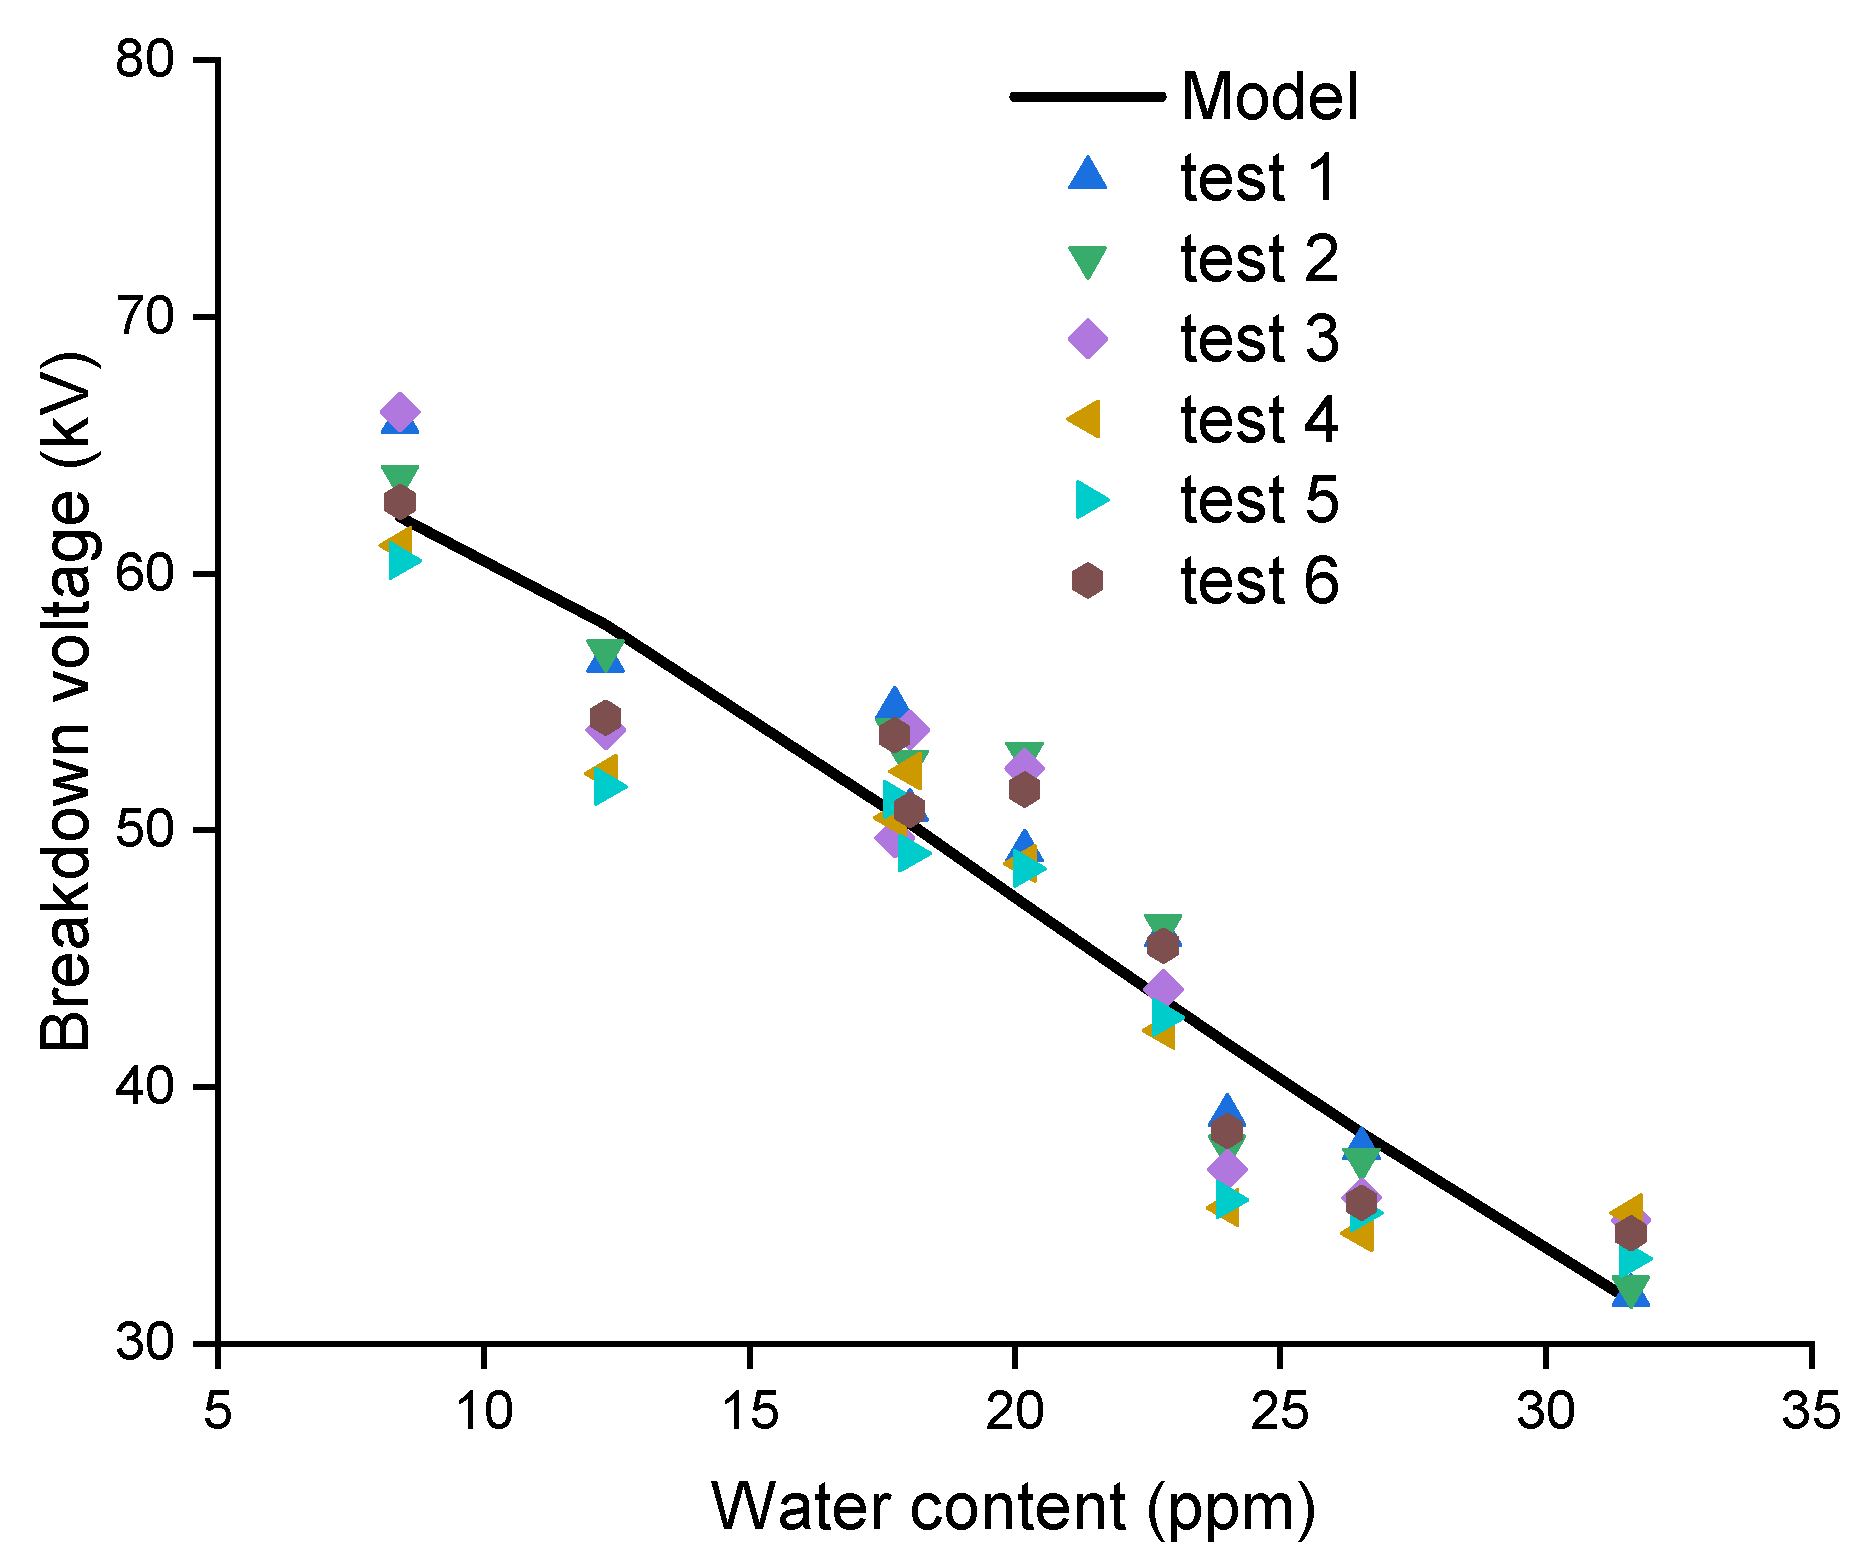
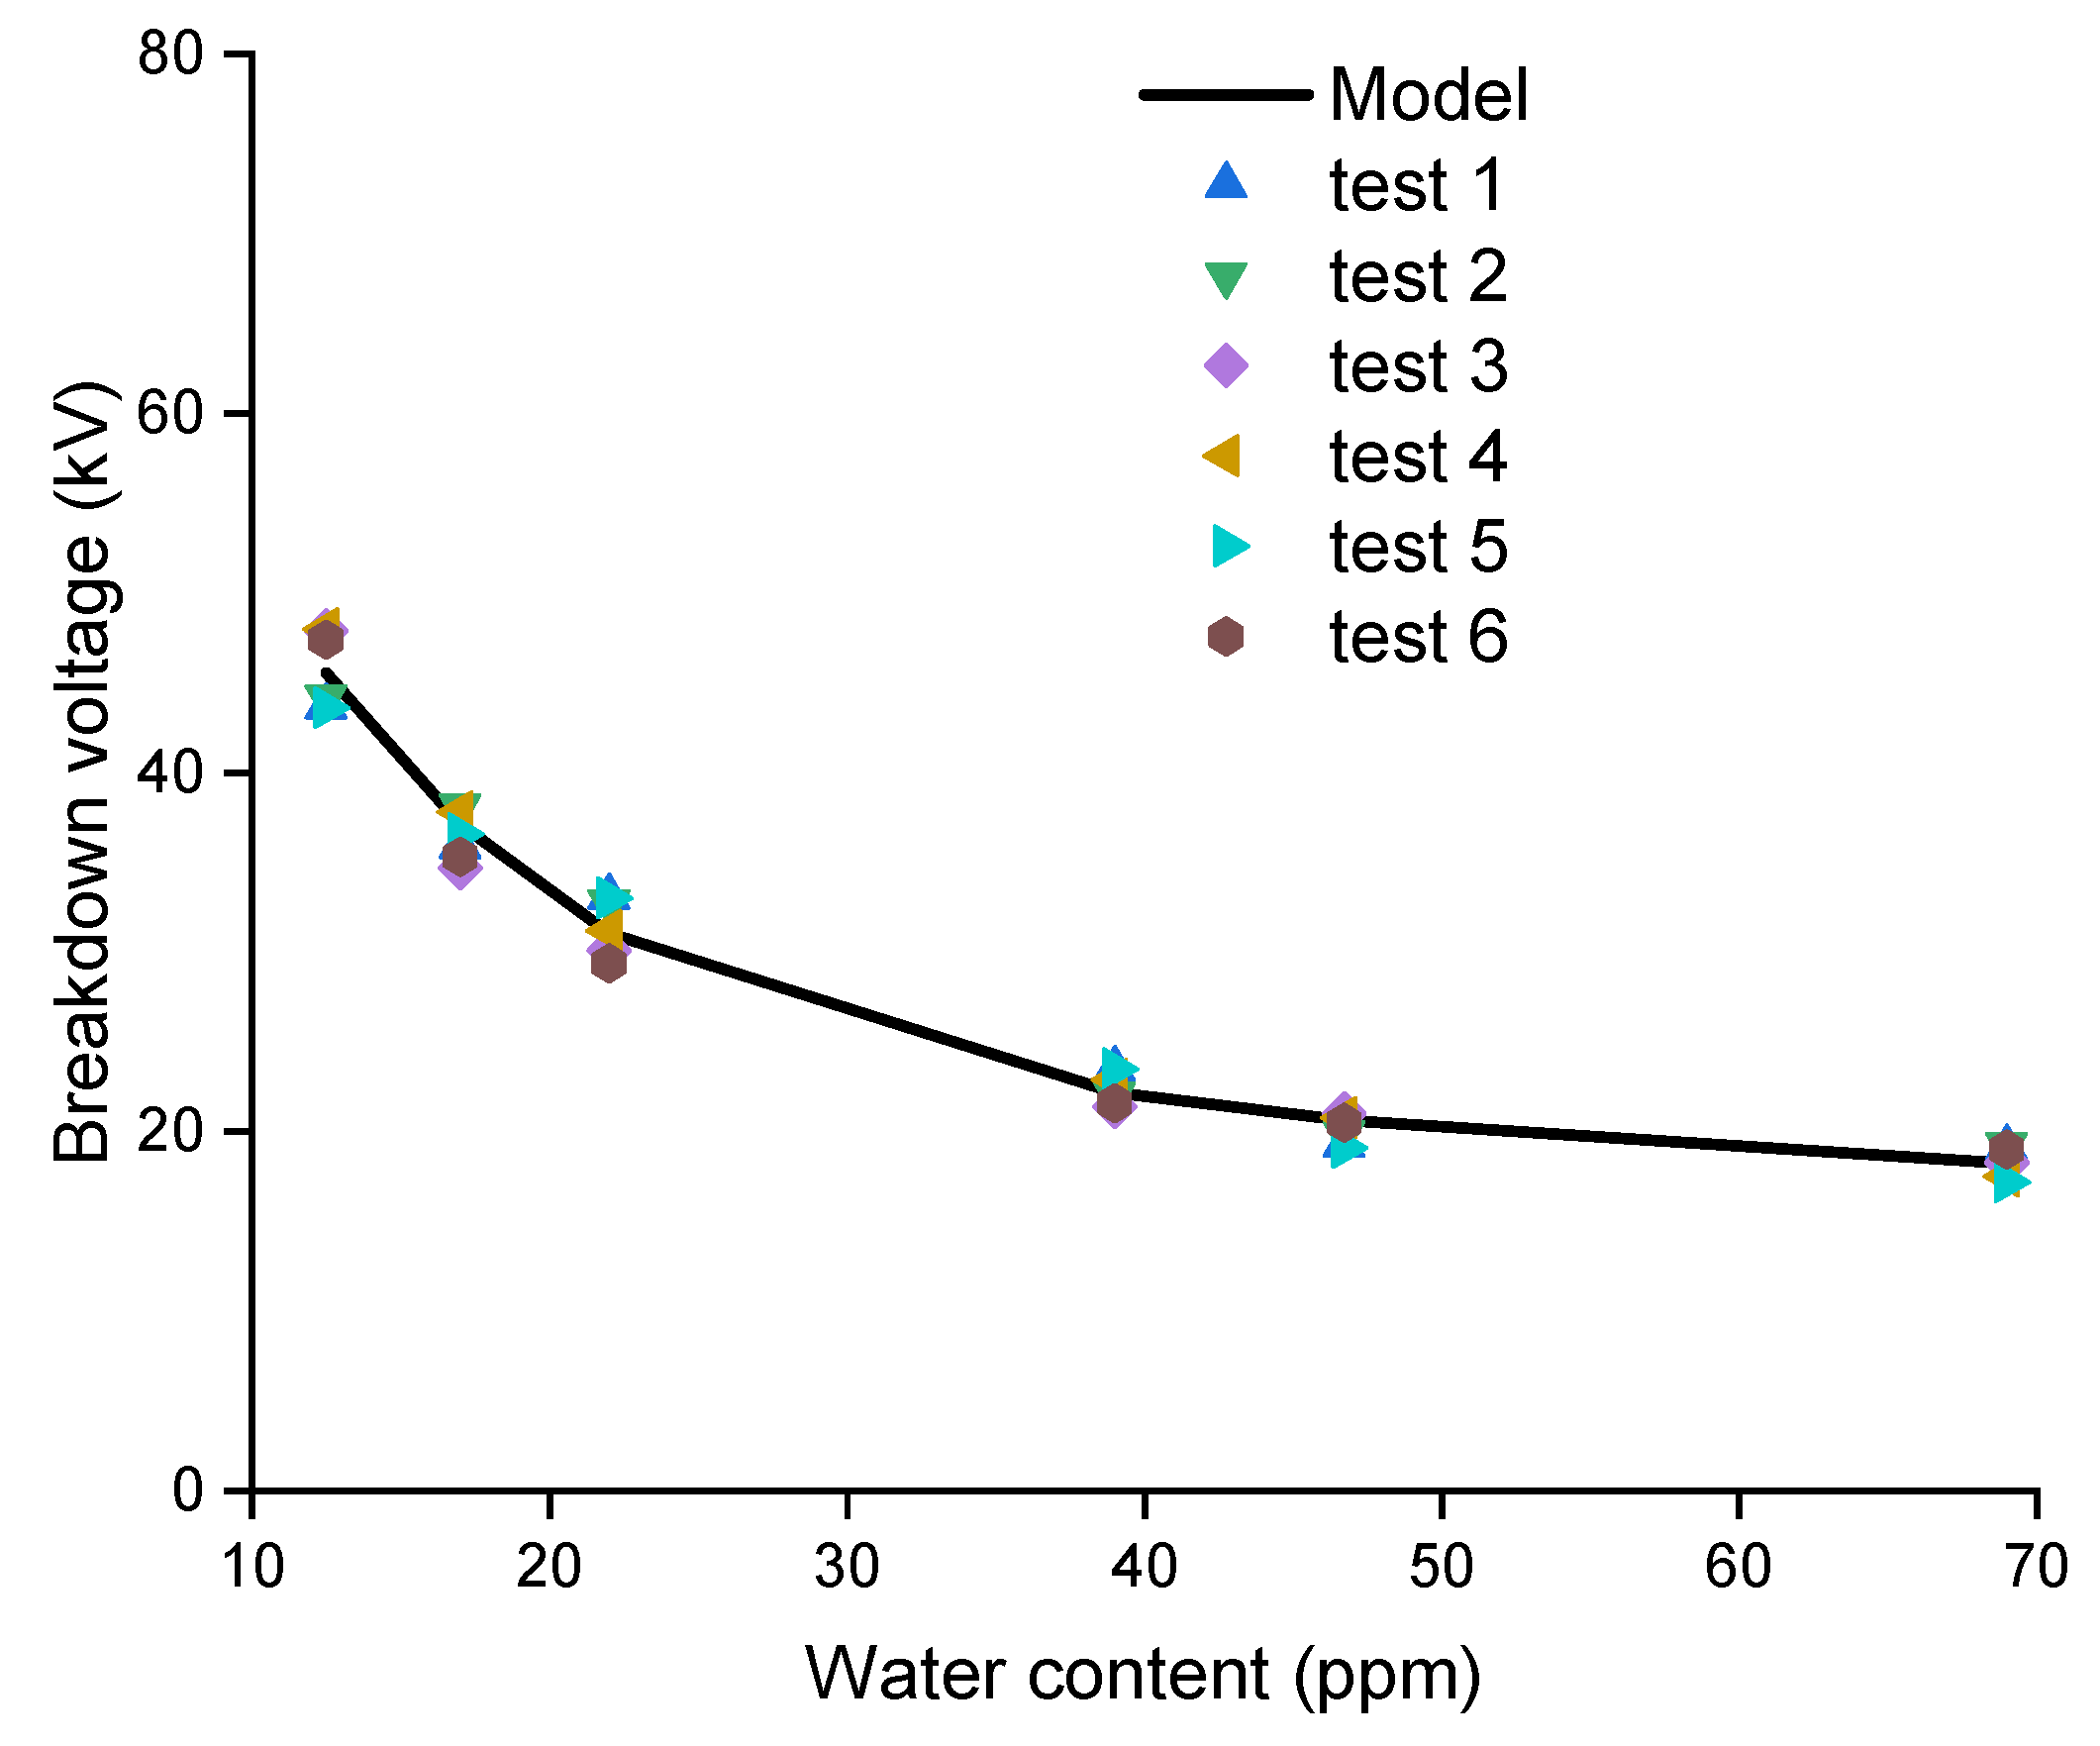
Figure 5 shows that, when the water content in oil decreases as a result of the dehydration process, the breakdown voltage of the new oil sample increases. It rises from 42.3 kV for a water content of 23.4 ppm to 80 kV when the water content is decreased to 3.1 ppm, which means that its value increases by 89% when the water content decreases by 68%. This trend is similar to those observed for the regenerated and used oil samples; however, the variations in breakdown voltage are less significant compared with that measured for the new oil sample. It can be observed on Figure 6 that the breakdown voltage for the regenerated oil sample increases from 33.6 kV to 63.4 kV, when the water content is reduced from 31.6 ppm to 8.4 ppm, which means that the value of breakdown voltage increases by 88% when the water content decreases by 73%. In Figure 7, as a result of decreasing water content from 69 ppm to 12.5 ppm for the used sample, the value of breakdown voltage increases from 18.4 kV to reach 45.8 kV, which means it increases by 148% when the water content decreases by 81%.
After applying multiple physical treatment process, the reduction of new oil sample water content is more significant (3.1 ppm for the new oil sample, 8.4 ppm for the regenerated oil sample, and 12.5 ppm for the used sample). As a result, the improvement of breakdown voltage is more important for the new oil than it is for the regenerated oil. The high values of breakdown voltage for these two oil samples indicate higher dielectric strength of the oil. Nevertheless, the clear improvement in the breakdown voltage level for the used oil sample is not as significant as it is for new and regenerated samples. This is attributed to the contaminated state of the used oil, which has a severe acidity level.
It is common knowledge that, when the oil water content value is very small, the partial discharge activity decreases and the dielectric strength of the oil increases. Consequently, the breakdown voltage is high [20,36,37,38]. However, when the oil sample is highly contaminated and contains a large amount of water, the reduction in water content is relatively small, despite applying several cycles of dehydration operation, in comparison with the oil sample containing only a small amount of contamination.
The breakdown voltage regression analysis for the three studied samples exhibits a non-linear relationship with water content. Table 2 summarizes the regression analysis results.
Figure 5, Figure 6 and Figure 7 and Table 2 show that the experimental and regression results are identical for the three oil samples. The proposed exponential model is adequate with correlation coefficients of 99.24%, 92.05%, and 99.77% for the new, regenerated, and used oil samples, respectively. This correlation coefficient is less smaller for the regenerated oil sample compared from those of the new and used oil samples because of the model is close to linear trend rather than exponential trend. A high value of R indicates that the model is highly significant.
In Table 2, the a, b, c, and d regression parameters of new and used oil samples are relatively close to each other, this is clearly related to the high correlation coefficients of the exponential model for the new and used samples. However, these regression parameters differ significantly for regenerated oil as a result of the linear trend of the model which explain the smaller correlation coefficient compared from those of new and used samples. For this regenerated oil sample, the regression parameters a and c on one side, and b and d on the other side, are highly similar.
The proposed exponential model for the breakdown voltage for the three oil samples in our case is highly significant.
4.2. Resistivity
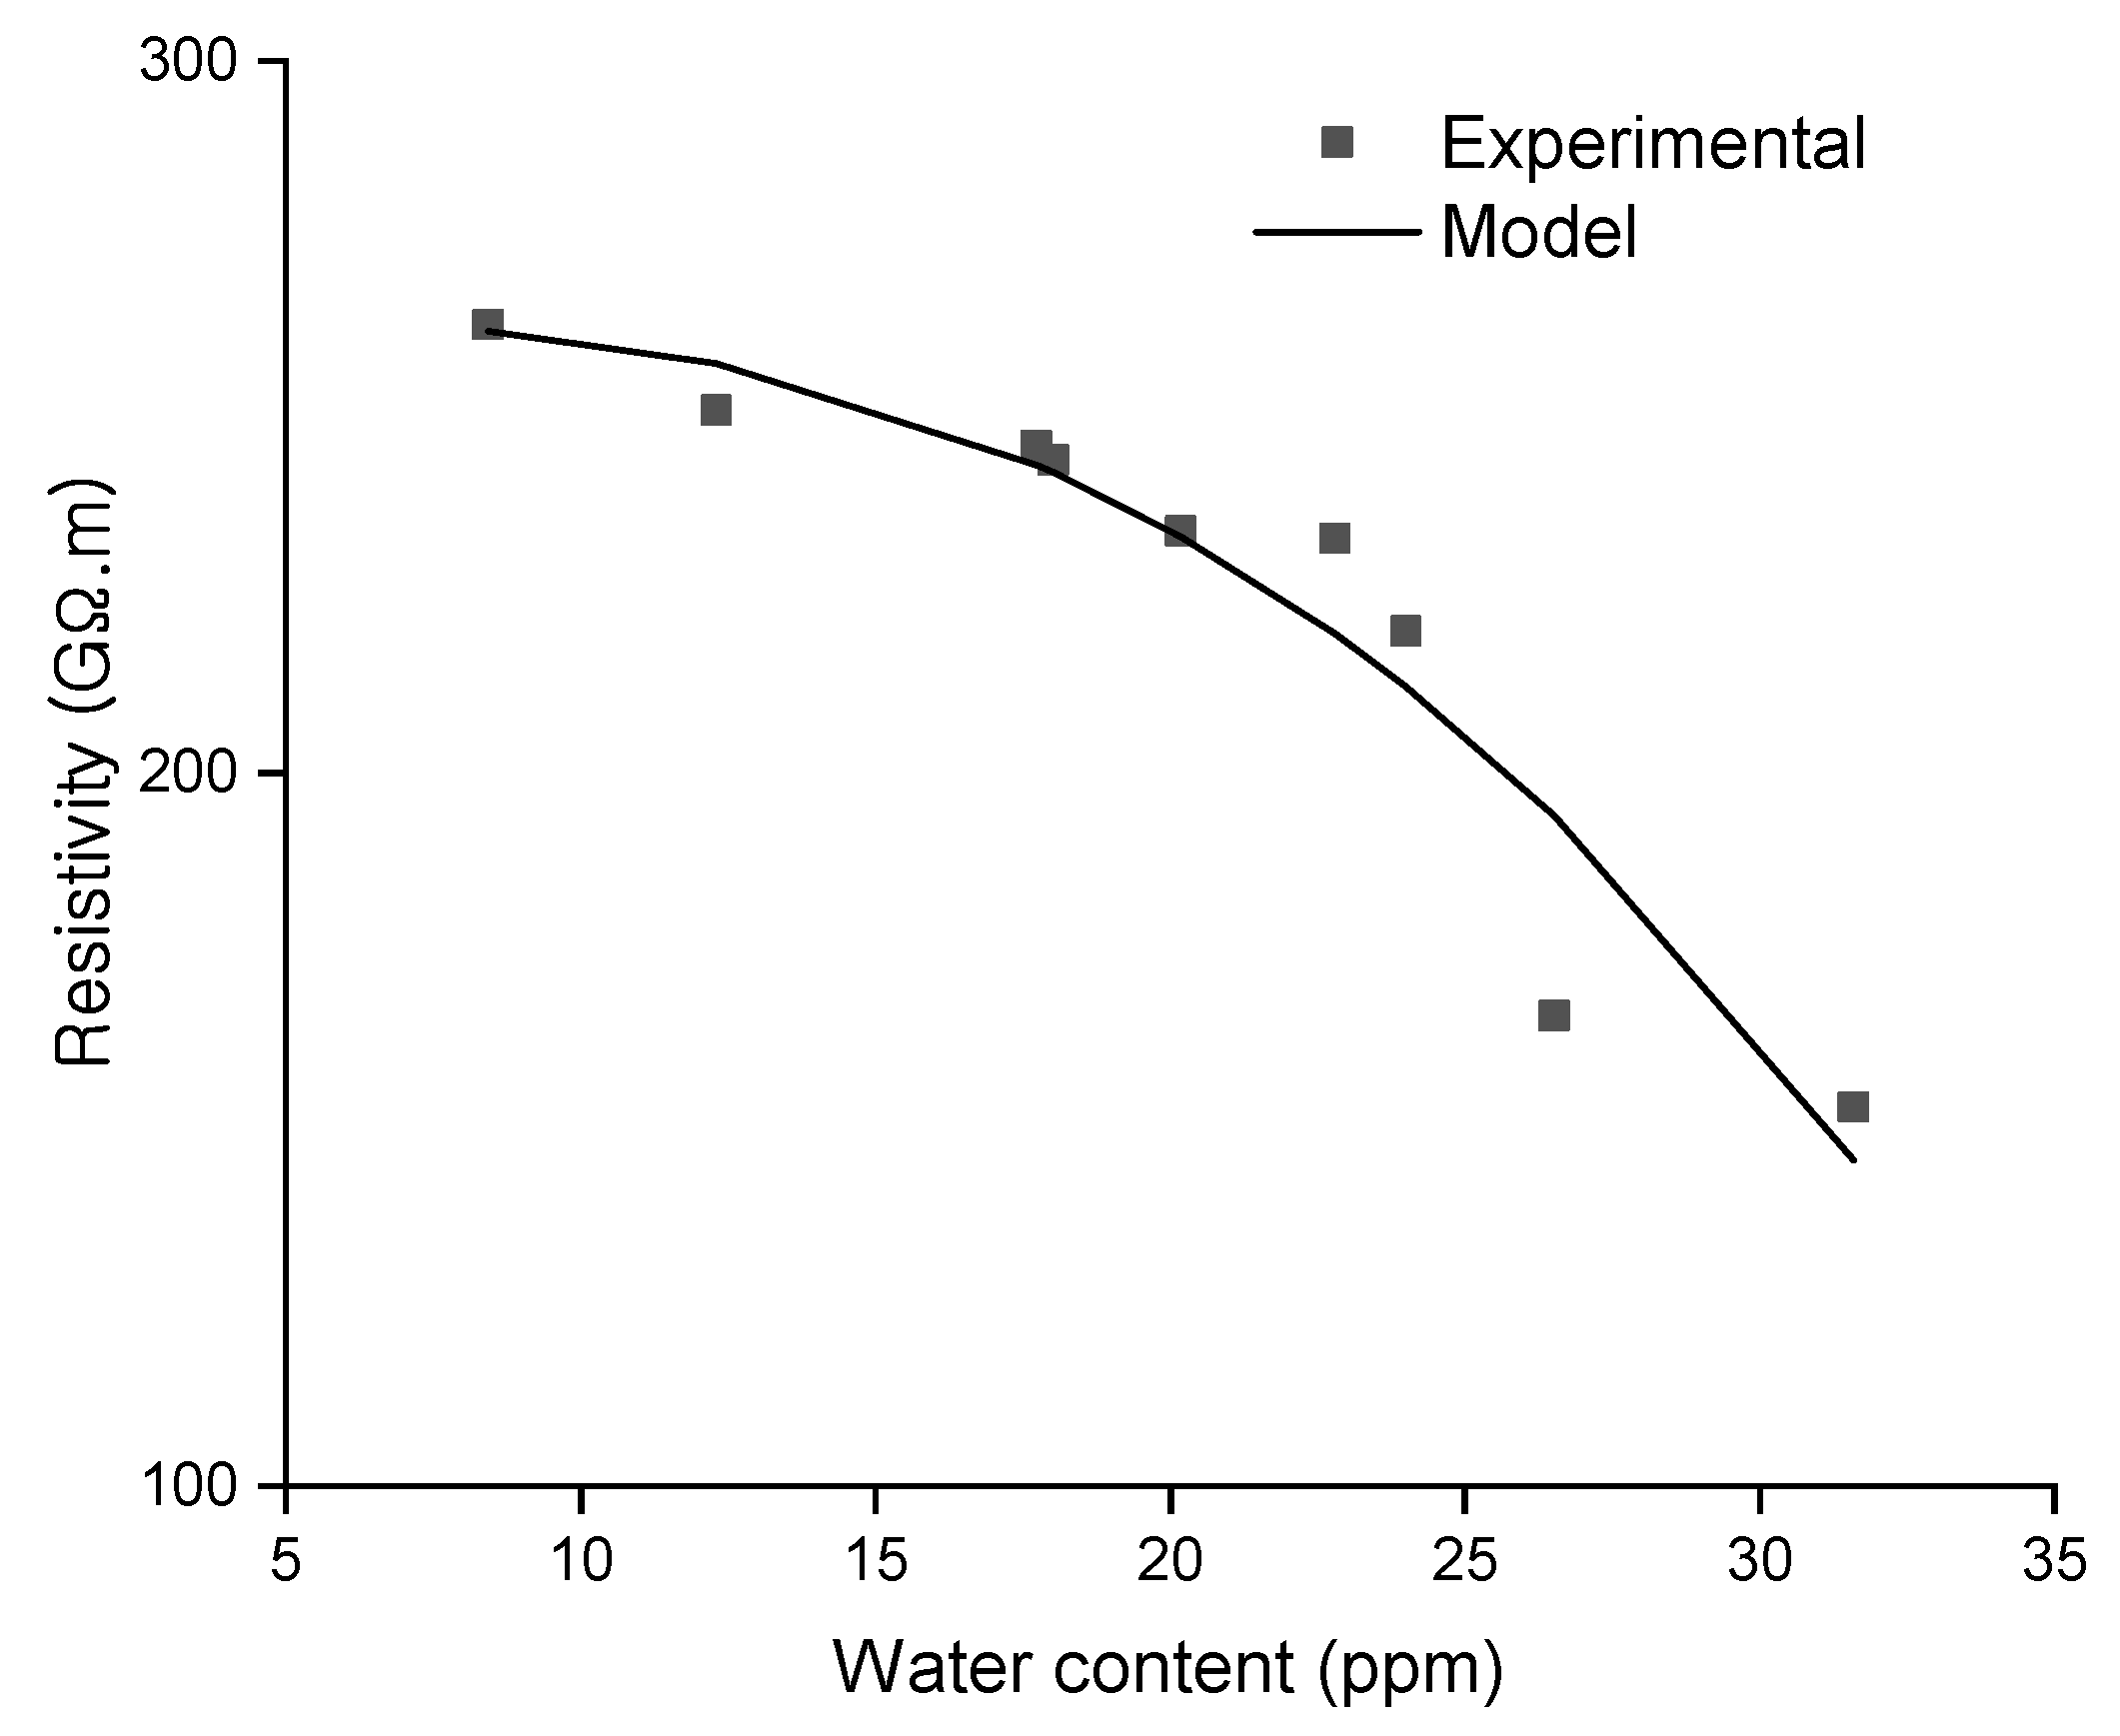
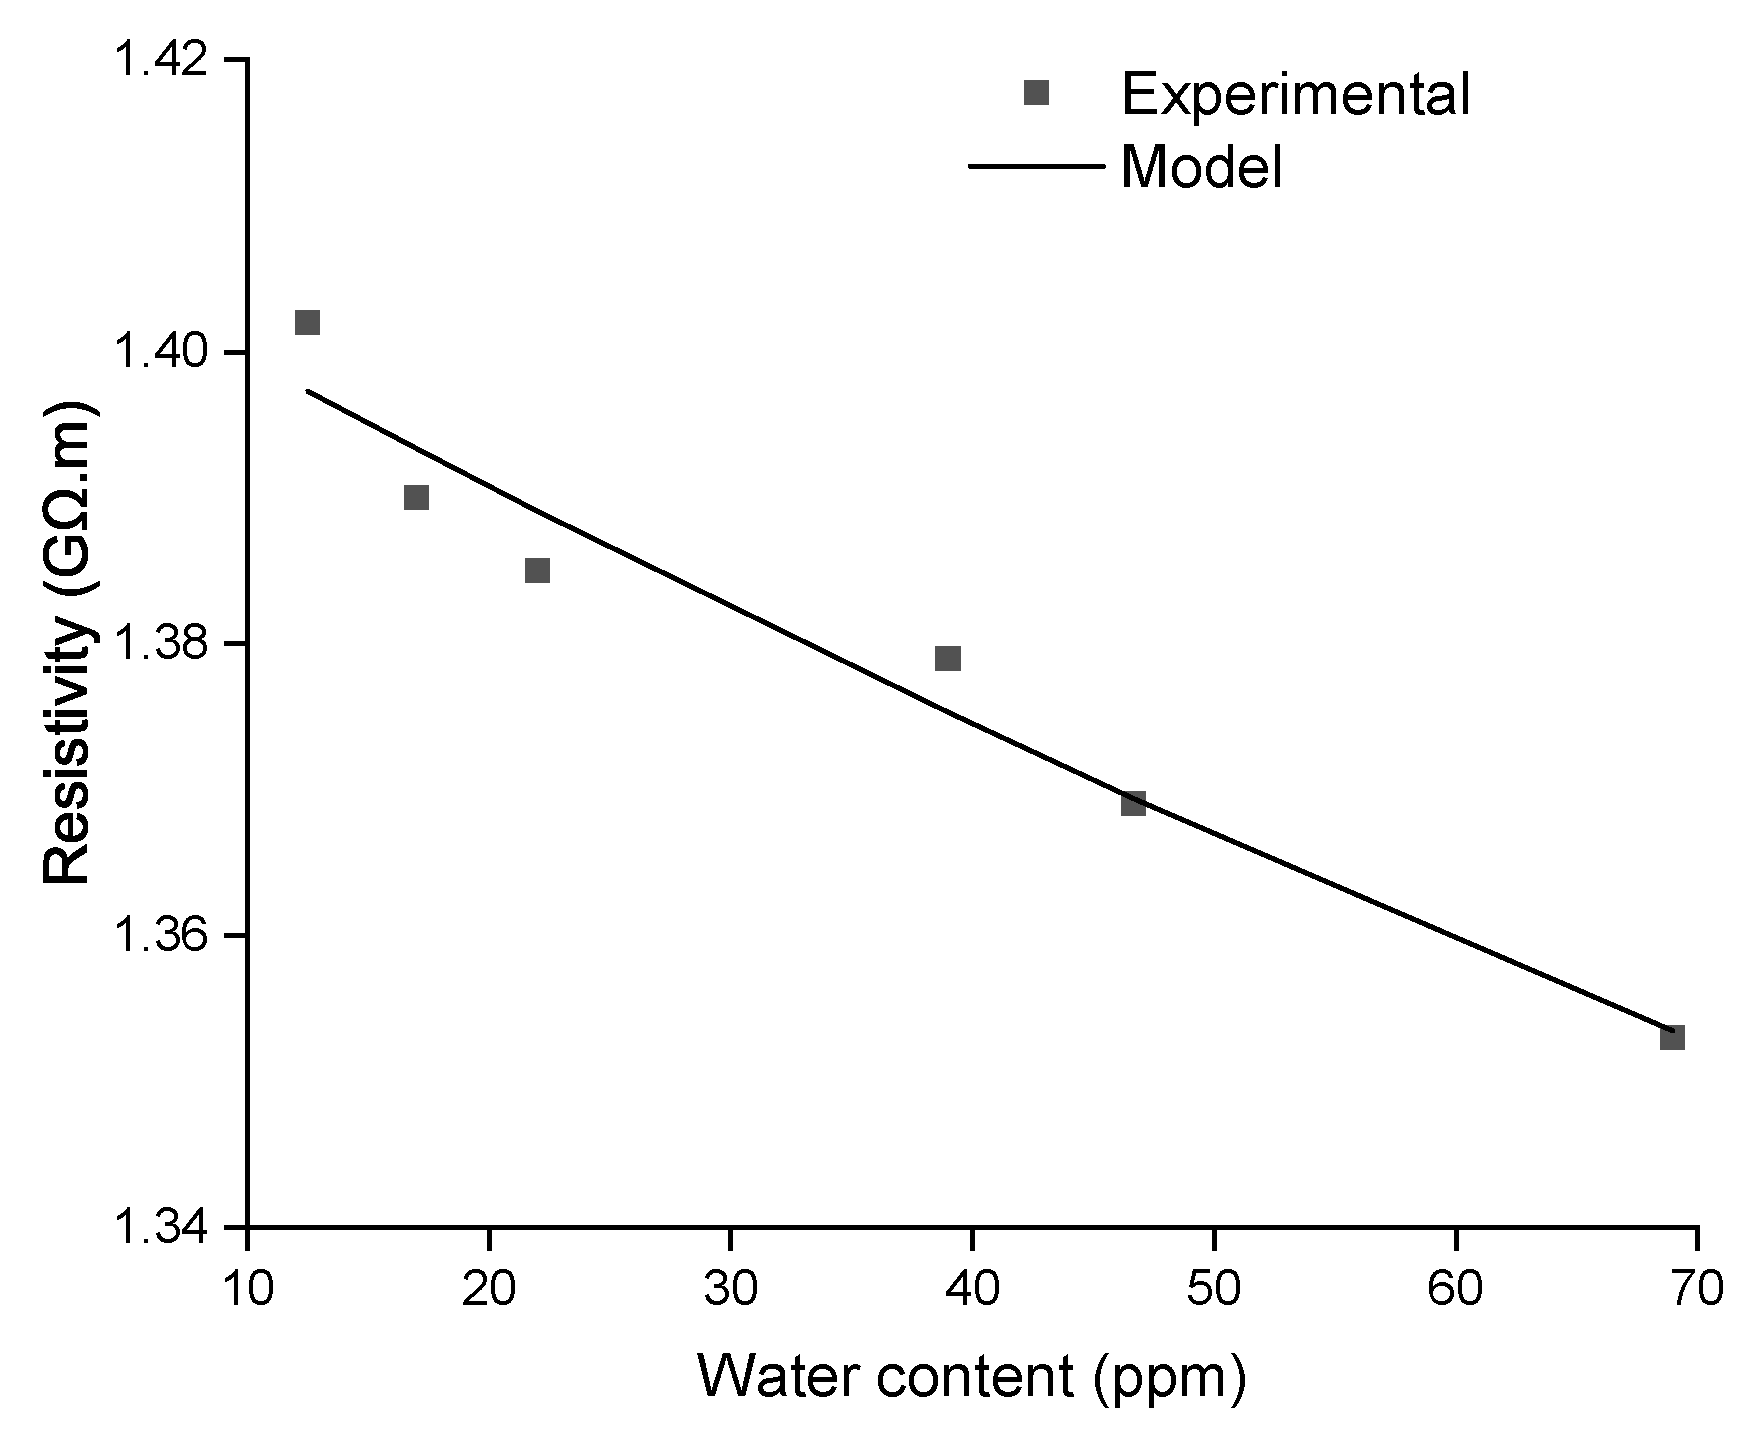
The results of the resistivity variation with the reduced quantity of water for the three oil samples, new, regenerated, and used, are shown in Figure 8, Figure 9 and Figure 10, respectively.
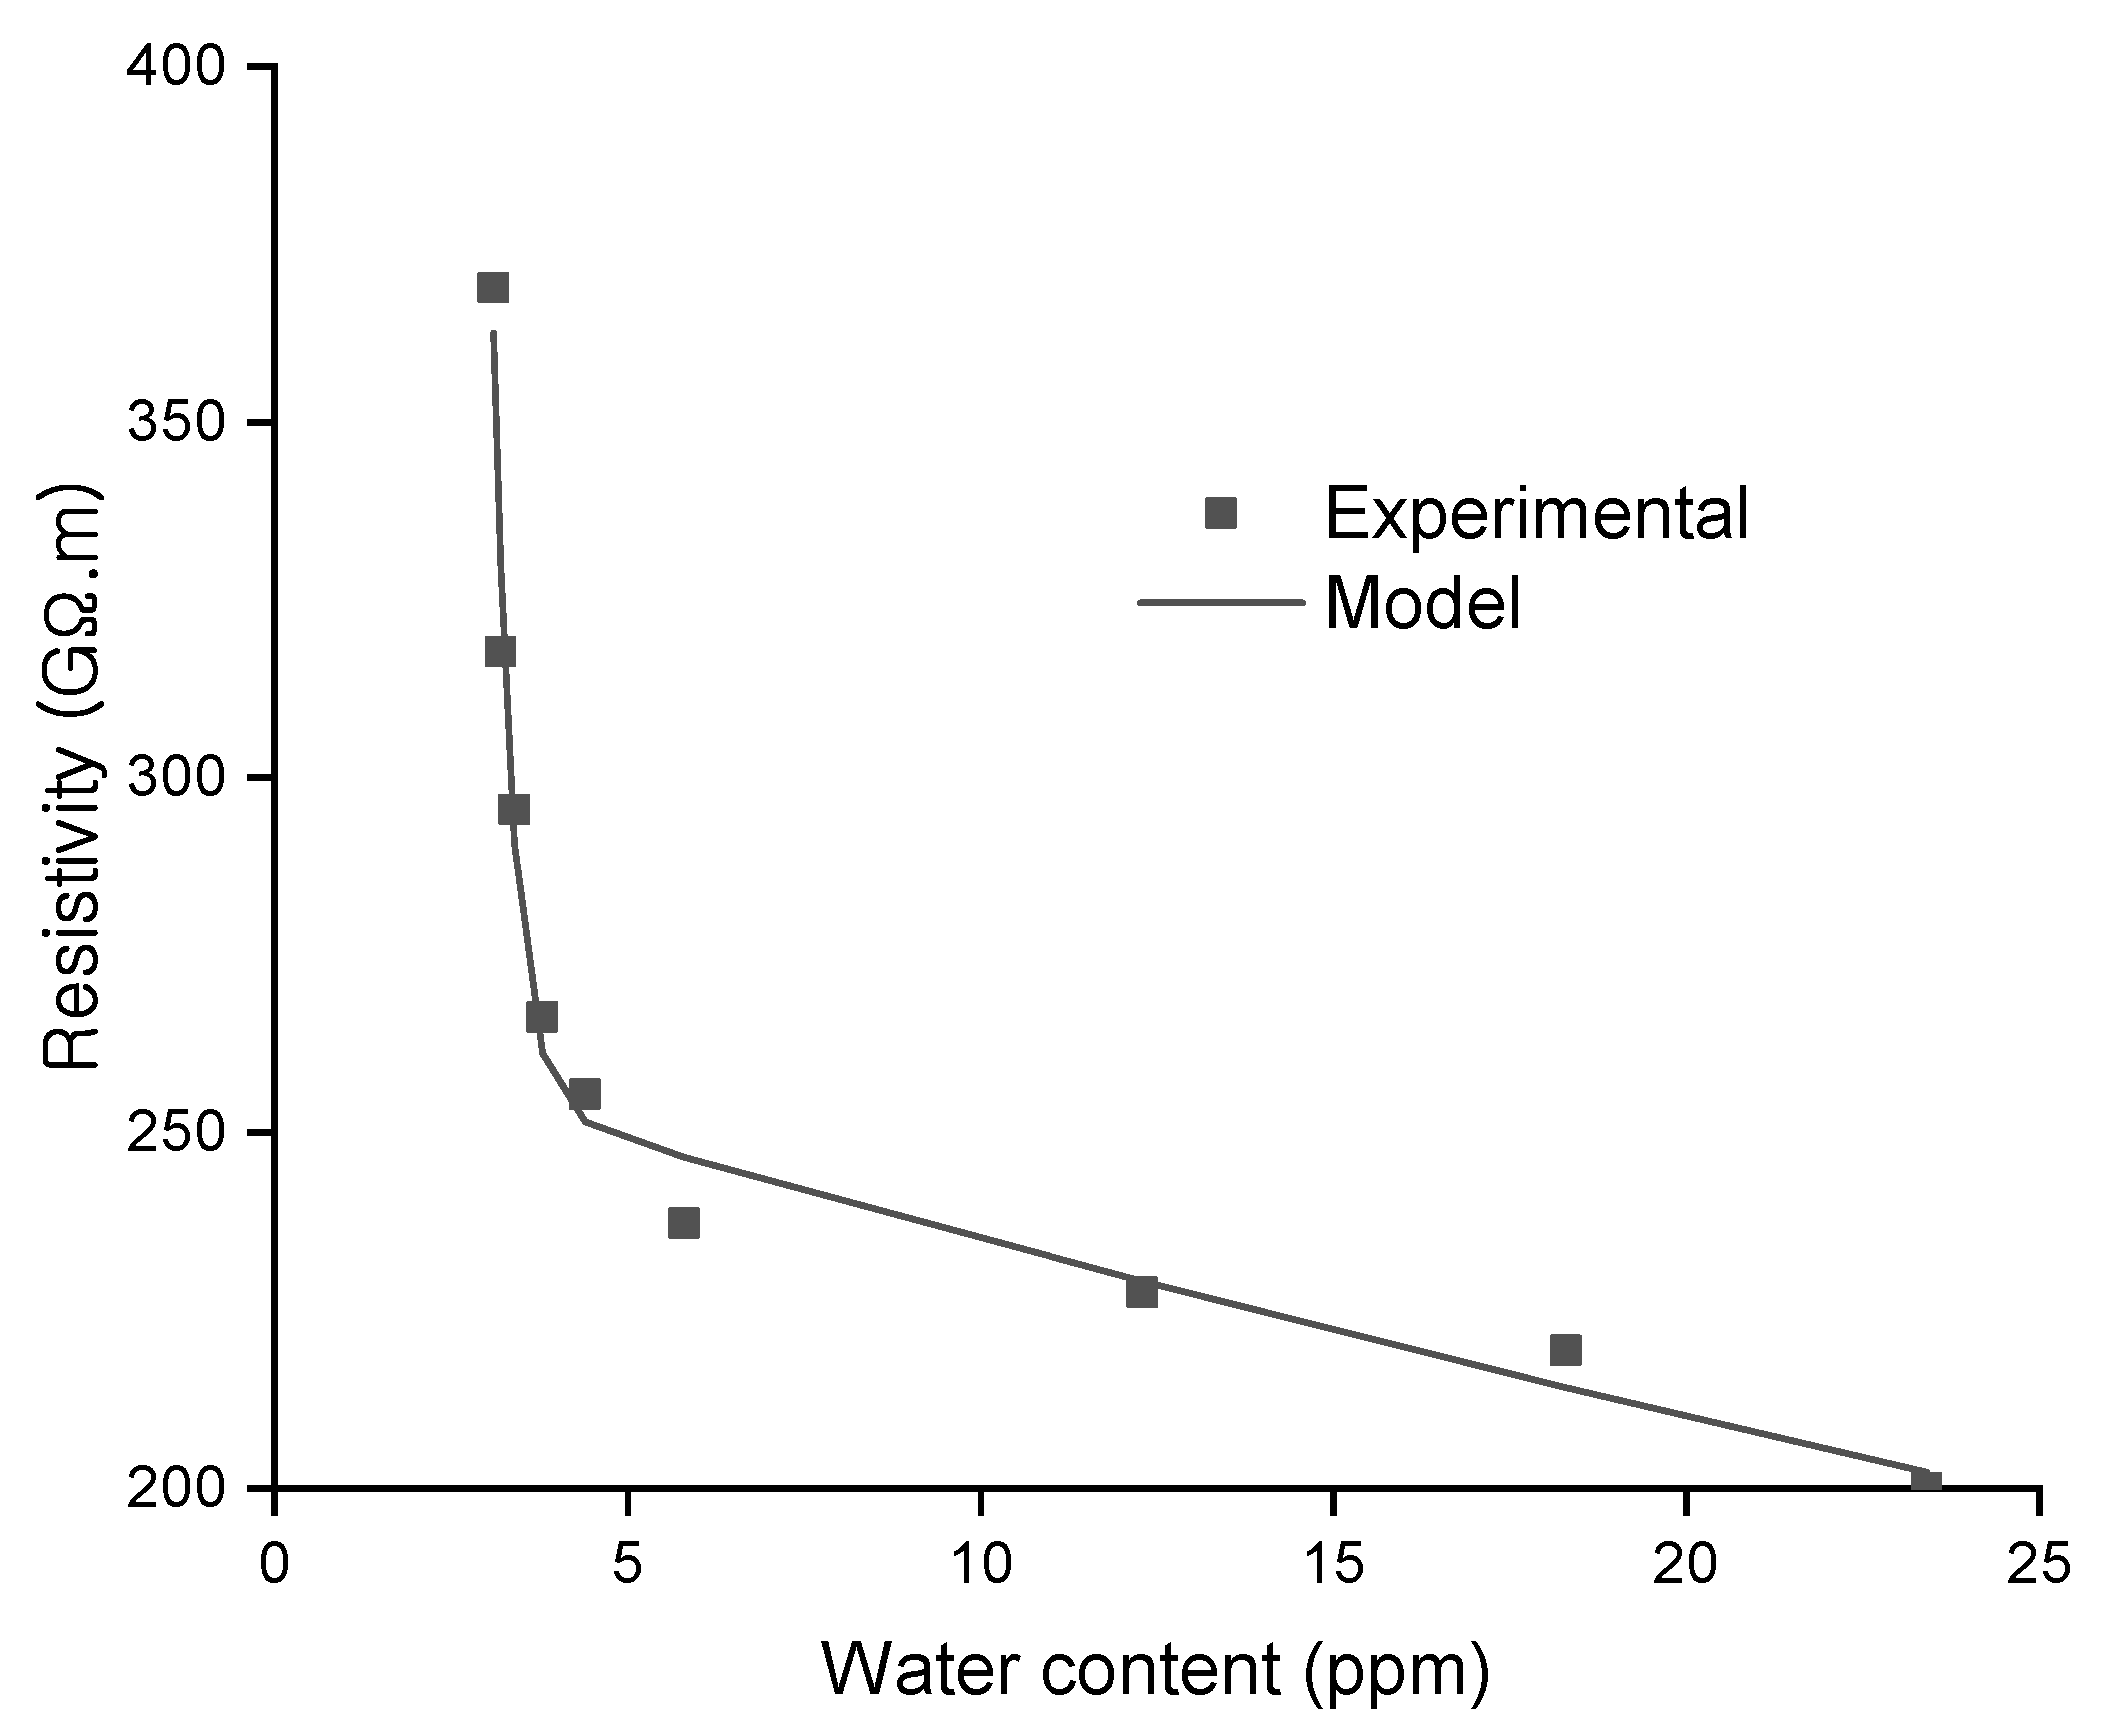
As shown in the figures, and as expected, whatever the nature of the oil sample: new, regenerated, and used, the decrease in water content causes the increase of the resistivity. The new oil sample resistivity increases from 200 G.m to 368.8 G.m when the value of water content is reduced from 23.4 ppm to 3.1 ppm, which means that the resistivity increases by 84% when the quantity of water decreases by 86%. The resistivity of the regenerated oil increases from 153.2 G.m to reach 263 G.m after dehydration operation which reduces the water content from 31.6 ppm to 8.4 ppm, which means it increases by 71% with a water content decrease of 73%. The values of the new and regenerated samples resistivity by the end of the dehydration operation achieve appropriate levels according to IEC 60247 Standard [32]. Finally, the used oil sample resistivity rises from 1.3 G.m to reach 1.4 G.m at when the water content reduces from 69 ppm to 12.5 ppm, which means that its value increases by 7% when the water content decreases by 81%. This value of resistivity is far too low compared to the appropriate values in accordance to the standard [32].
Compared to the resistivity value obtained with the used oil sample, the new and regenerated oil samples show a noticeable improvement. This is explained by the dehydrating and degassing processes of the new and regenerated oil samples before their first use. However, the used oil sample contains a large amount of water and contaminants. Despite the application of several physical treatments, the improvement of the water content is lower than for the new and regenerated samples.
Figure 8, Figure 9 and Figure 10 show that the resistivity results of the regression model are very close to the experimental results. The coefficients of regression are presented in Table 3.
The regression analysis shows that the correlation coefficients for the three oil sample are very high. For the new and used oil samples, the correlation coefficient reaches values of 98.38% and 95.59%, respectively, which presents close values between experimental and regression results. For the regenerated oil, the correlation coefficient is less smaller than those for the other samples and presents a value of 90.25%. Hence, the proposed exponential model for the resistivity is very significant for the three oil samples.
4.3. Dielectric Dissipation Factor
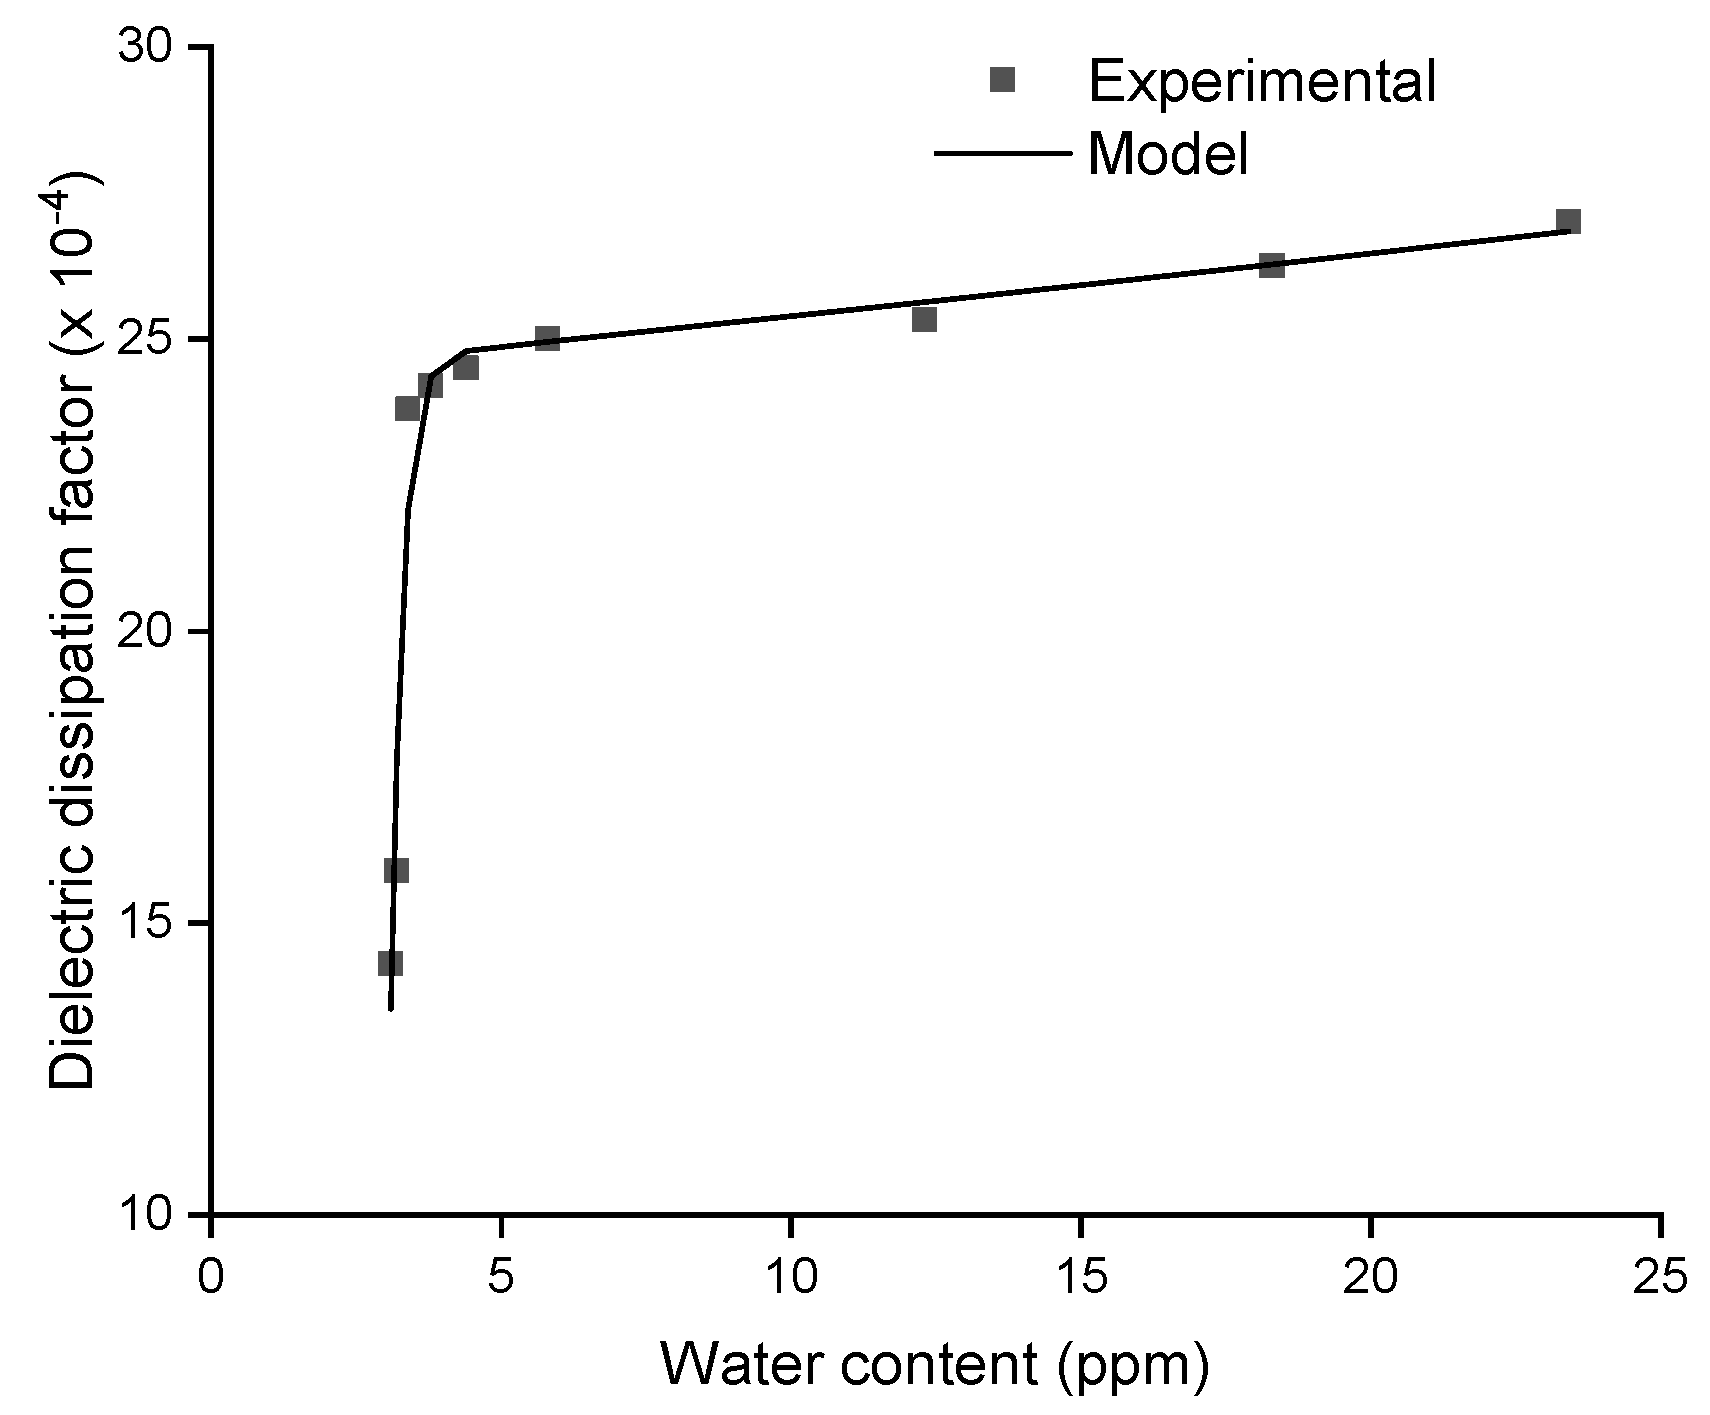
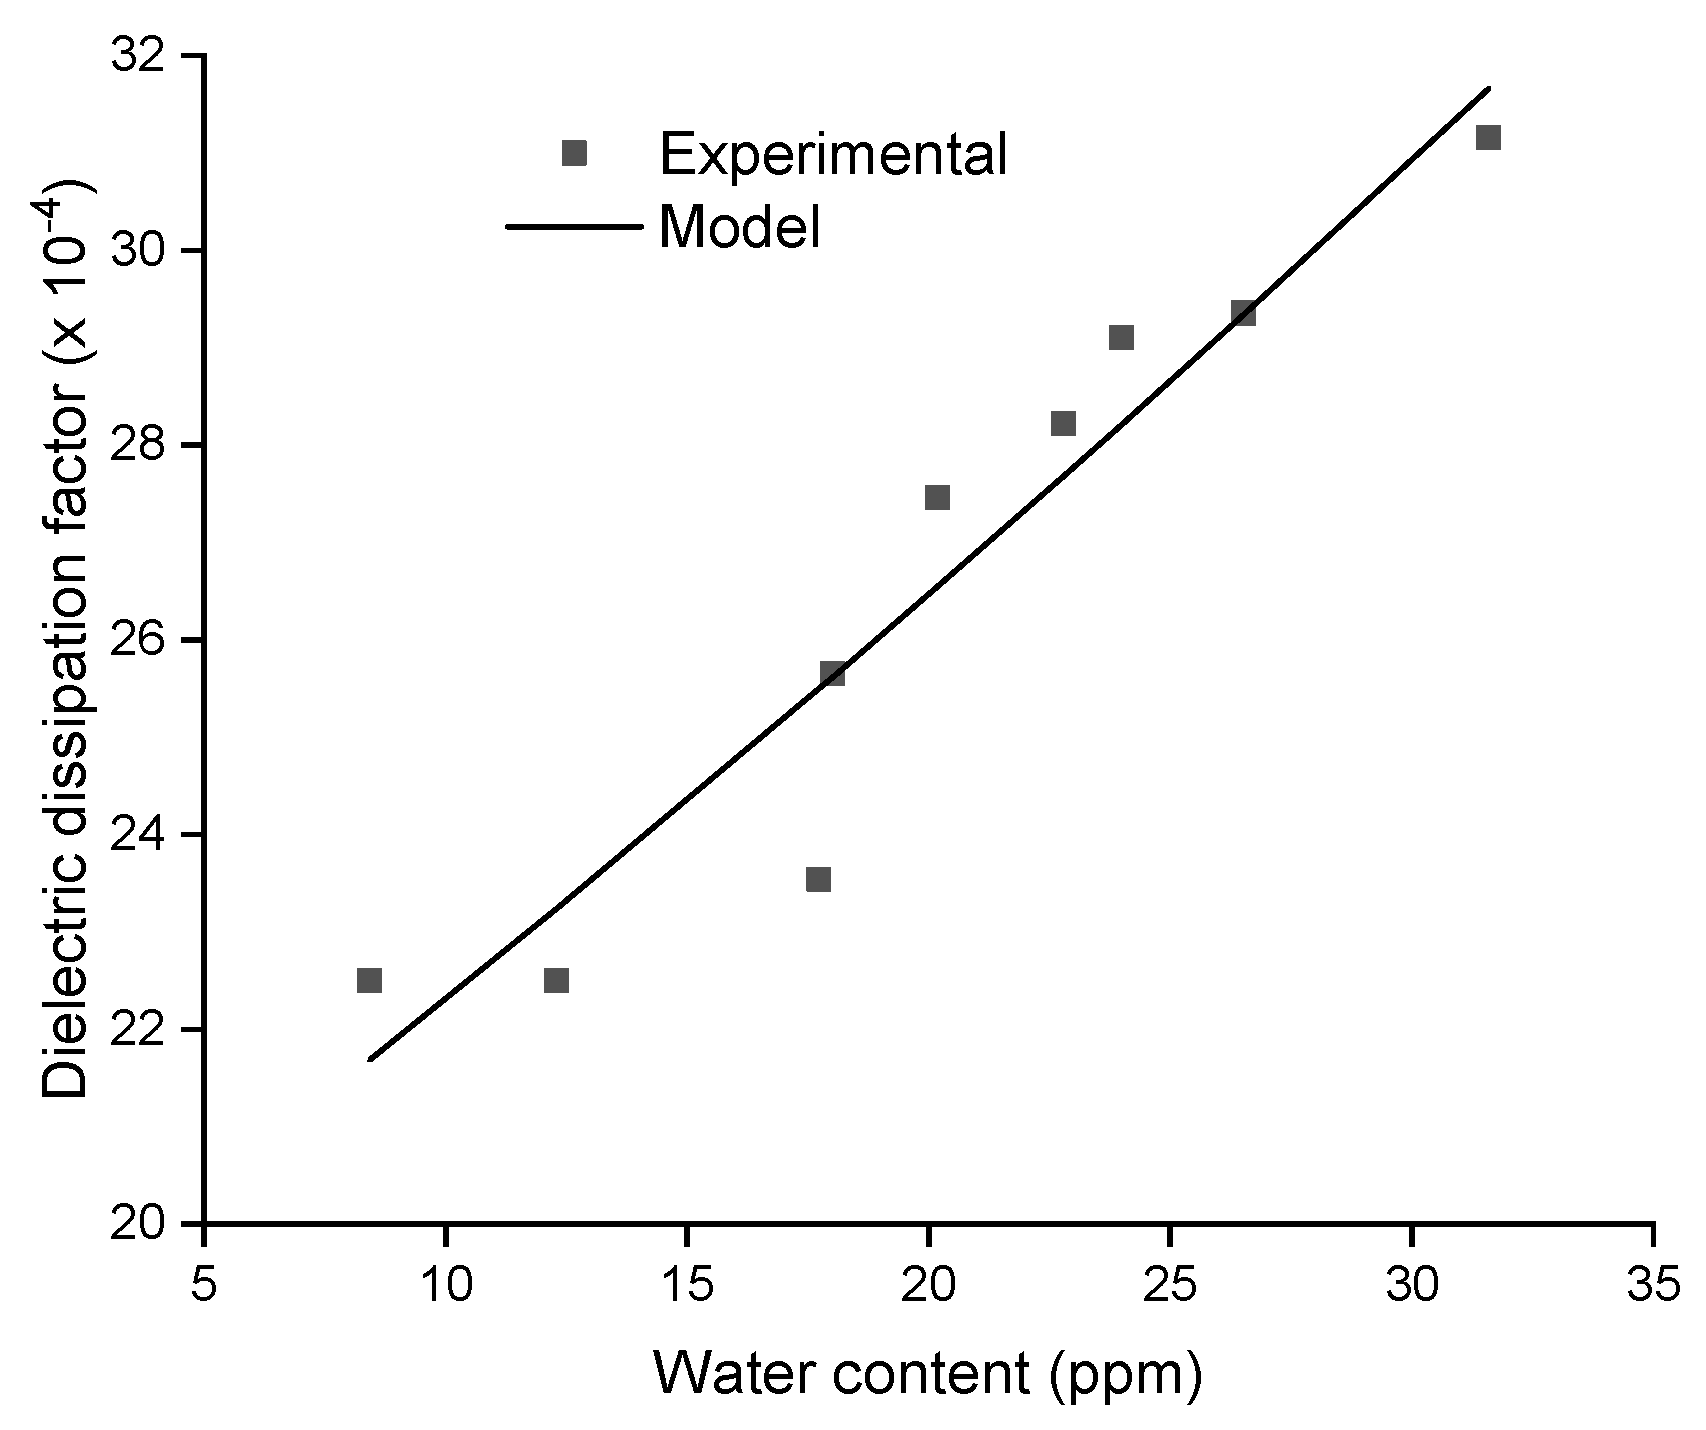
Figure 11, Figure 12 and Figure 13 present the dielectric dissipation factor variations for the new, regenerated, and used oil samples when reducing water content using a treatment process.
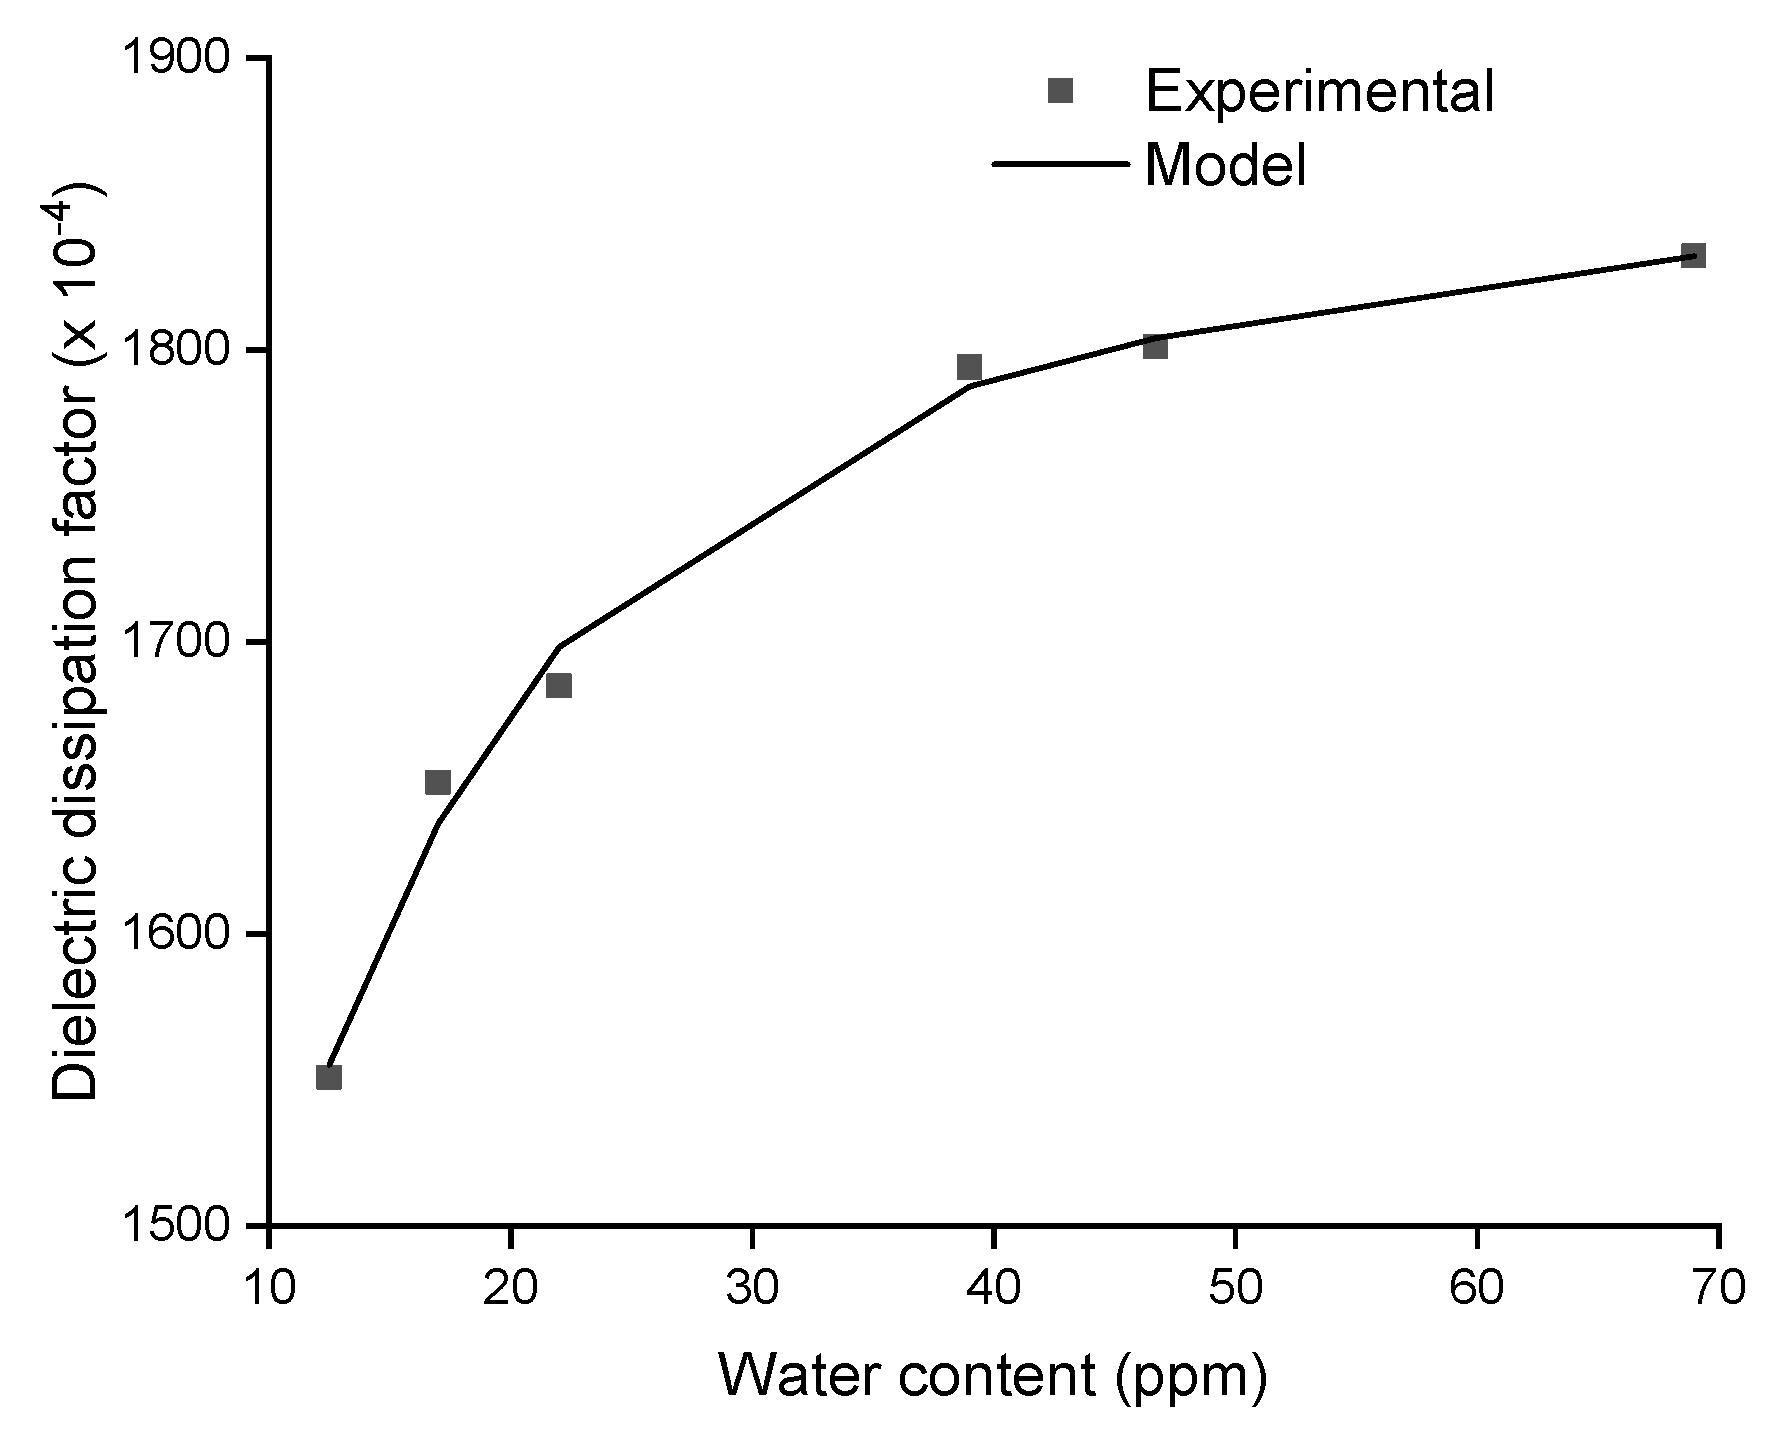
Figure 11 and Figure 12 show that, when reducing the quantity of water in oil, the dielectric dissipation factor of new and regenerated oil samples decreases. The dielectric dissipation factor decreases from 0.0027 for a water content of 23.4 ppm to reach 0.0014 when the value of new oil water content is decreased to 3.1 ppm, which means that it is reduced by 48% when the amount of water in oil decreases by 86%. The regenerated sample dielectric dissipation factor decreases from 0.0031 to 0.0022 when the water content is reduced from 31.6, ppm to 8.4 ppm after the dehydration operation, it decreases by 29% when the value of water content decreases by 73%. This trend is similar for the used oil sample, but the improvement of the dielectric dissipation factor is not significant compared with the previous samples. When decreasing the used oil water content from 69 ppm to 12.5 ppm, the dielectric dissipation factor decreases from 0.1832 to reach 0.1551, which is considered as an excessive value compared to that recommended by the relevant standard [32]. It is reduced by 15% when the amount of water decreases by 81%. This can be explained by the fact that the used sample contains much more contaminating products compared with the new and regenerated samples. Consequently, the improvement of its dielectric dissipation factor is not significant.
The dielectric dissipation factor reflects the oil resistive and capacitive natures. Because the dissolution of water in oil influences both parameters at the same time, it is difficult to interpret the obtained results. Nevertheless, it has been found that transformer oil has a resistive character if it contains impurities and a capacitive property if it is ultra-pure [38].
The dielectric dissipation factor results of the regression model are similar to the experimental results, as shown in Figure 11, Figure 12 and Figure 13. The coefficients of regression are presented in Table 4.
The correlation coefficients for the proposed exponential model for dielectric dissipation factor, presented in Table 4, show high values for all studied oil samples. For the two oil samples, new and used, the correlation coefficients present, respectively, 95.55% and 99.25%, and this value is less smaller for the regenerated oil sample and reaches a value of 91.16%. These acceptable factors mean that the model is very significant. The dielectric dissipation factor is strongly related to the acidity factor variation rather than the water content variation [20,38]. Consequently, the proposed regression model for the dielectric dissipation factor is not only related with the water content, but it can be related with other factors, such as the acidity.
The dielectric dissipation factor regression parameters a, b, c, and d of the three oil samples present different values. However, the only similarity is that, for the regenerated oil sample, where the parameters a and c on a side and b and d on the other sides, are closely similar.
5. Conclusions
In this work, correlation analysis was used to establish the relationship between electrical characteristics of transformer oil and its water content, namely breakdown voltage, resistivity and the dielectric dissipation factor. This was achieved by conducting experiments on new, regenerated, and used oil samples, the quantity of water was reduced by applying a step-wise dehydration process. A regression approach using exponential model was conducted for the purpose of correlate the experimental and numerical results.
When the water content is decreased, the breakdown voltage and resistivity increase. However, the dielectric dissipation factor is found to decrease for all studied samples in the experiments. The improvement in electrical properties for the new and the regenerated samples is clearly observed. The results showed that, for the used oil sample, the improvement is not significant compared with the values specified in the standards. For the new oil, the breakdown voltage and the resistivity increase by 89% and 84%, respectively, the dielectric dissipation factor decreases by 48%. Similar, for the regenerated oil, the breakdown voltage and the resistivity increase by 88% and 71%, respectively, the dielectric dissipation factor decreases by 29%. In contrast, the trend is different for the used oil, the breakdown voltage and the resistivity increase by 148% and 7%, respectively, the dielectric dissipation factor decreases by 15%.
The regression analysis results of the electrical properties for the three transformer oil samples show that the proposed exponential model is very significant. It presents for the new oil sample high correlation coefficients for breakdown voltage, resistivity, and dielectric dissipation factor, respectively (R = 99.24%, R = 98.38%, and R = 95.55%). Furthermore, for the used oil, the correlation coefficients are very high. Their values for breakdown voltage, resistivity and dielectric dissipation factor, respectively, are: R = 99.77%, R = 95.59%, and R = 99.25%. However, for the regenerated oil, the correlations coefficients are high and acceptable, but they are less smaller than those from the new and used oil. These correlation coefficients reach, respectively, for breakdown voltage, resistivity and dielectric dissipation factor: R = 92.05%, R = 90.25%, and R = 91.16%.
The proposed exponential model is highly significant because it gives close agreement with the experimental results with high correlation coefficients (>90% ) on one side, and, on the other side, it is valid for all the studied characteristics, such as:the breakdown voltage, the resistivity, and the dielectric dissipation factor and all the studied oil samples.
Combining the thermal aging and the water content together in order to explore the electrical and physico-chemical properties of transformer oil, and to correlate these between the oil’s parameters and water content using regression approach that factors in the effect of temperature will be considered for future work.
Author Contributions
Conceptualization, S.A. and A.H.; methodology, S.A.; software, S.A.; validation, S.A., L.S. and N.H.; formal analysis, S.A.; investigation, S.A. and L.S.; resources, L.S.; data curation, S.A.; writing-original draft preparation, S.A.; writing-review and editing, N.H., A.B. and A.H.; visualization, S.A.; supervision, S.A.; project administration, S.A. All authors have read and agreed to the published version of the manuscript.
Funding
This research received no external funding.
Institutional Review Board Statement
Not applicable.
Informed Consent Statement
Not applicable.
Data Availability Statement
Not applicable.
Conflicts of Interest
The authors declare no conflict of interest.
References
- Saha, T.K. Review of modern diagnostic techniques for assessing insulation condition in aged transformers. IEEE Trans. Dielectr. Electr. Insul. 2003, 10, 903–917. [Google Scholar] [CrossRef] [Green Version]
- Abdi, S.; Boubakeur, A.; Haddad, A.; Harid, N. The Voltage and Current Characteristics of Breakdown in Transformer Oil under Impulse Voltage. In Proceedings of the 19th International Symposium on High Voltage Engineering, Pilsen, Czech Republic, 23–28 August 2015. [Google Scholar]
- Du, Y.; Lv, Y.; Li, C.; Chen, M.; Zhong, Y.; Zhou, J.; Li, X.; Zhou, Y. Effect of semiconductive nanoparticles on insulating performances of transformer oil. IEEE Trans. Dielectr. Electr. Insul. 2012, 19, 770–776. [Google Scholar] [CrossRef]
- Ma, H.; Saha, T.K.; Ekanayake, C. Statistical learning techniques and their applications for condition assessment of power transformer. IEEE Trans. Dielectr. Electr. Insul. 2012, 19, 481–489. [Google Scholar] [CrossRef] [Green Version]
- Cui, Y.; Ma, H.; Saha, T.; Ekanayake, C.; Martin, D. Moisture-Dependent Thermal Modelling of Power Transformer. IEEE Trans. Power Deliv. 2016, 31, 2140–2150. [Google Scholar] [CrossRef]
- Martin, D.; Perkasa, C.; Lelekakis, N. Measuring Paper Water Content of Transformers: A New Approach Using Cellulose Isotherms in Nonequilibrium Conditions. IEEE Trans. Power Deliv. 2013, 28, 1433–1439. [Google Scholar] [CrossRef]
- Wang, D.; Zhou, L.; Wang, A.; Li, H.; Liao, W.; Guo, L.; Cui, Y. Effects of thermal aging on moisture diffusion in insulation paper immersed with mineral oil. IEEE Trans. Dielectr. Electr. Insul. 2018, 25, 1888–1896. [Google Scholar] [CrossRef]
- Garcia, B.; Burgos, J.C.; Alonso, A.M.; Sanz, J. A moisture-in-oil model for power transformer monitoring—Part I: Theoretical foundation. IEEE Trans. Power Deliv. 2005, 20, 1417–1422. [Google Scholar] [CrossRef]
- Garcia, B.; Burgos, J.C.; Alonso, A.M.; Sanz, J. A moisture-in-oil model for power transformer monitoring—Part II: Experimental verification. IEEE Trans. Power Deliv. 2005, 20, 1423–1429. [Google Scholar] [CrossRef]
- Du, Y.; Zahn, M.; Lesieutre, B.C.; Mamishev, A.V.; Lindgren, S.R. Moisture equilibrium in transformer paper-oil systems. IEEE Electr. Insul. Mag. 1999, 15, 11–20. [Google Scholar] [CrossRef] [Green Version]
- Arakelian, V.G.; Fofana, I. Water in oil-filled high-voltage equipment part II: Water content as physicochemical tools for insulation condition diagnostic. IEEE Electr. Insul. Mag. 2007, 23, 15–24. [Google Scholar] [CrossRef]
- Arakelian, V.G.; Fofana, I. Water in Oil-Filled, High-Voltage Equipment, Part I: States, Solubility, and Equilibrium in Insulating Materials. IEEE Electr. Insul. Mag. 2007, 23, 15–27. [Google Scholar] [CrossRef]
- Liu, L.; Wu, H.; Liu, T.; Feng, H.; Tian, H.; Peng, Z. Influence of moisture and temperature on the frequency domain spectroscopy characteristics of transformer oil. In Proceedings of the 2016 IEEE International Conference on Dielectrics (ICD), Montpellier, France, 3–7 July 2016; Volume 1, pp. 565–568. [Google Scholar] [CrossRef]
- Wasserberg, V.; Borsi, H.; Gockenbach, E. A novel system for the prolongation of the lifetime of power transformers by reduced oxidation and aging. In Proceedings of the Conference Record of the 2004 IEEE International Symposium on Electrical Insulation, Indianapolis, IN, USA, 19–22 September 2004; pp. 233–236. [Google Scholar] [CrossRef]
- Martins, M. Study of moisture equilibrium in oil-paper system with temperature variation. In Proceedings of the 7th International Conference on Properties and Applications of Dielectric Materials (Cat. No.03CH37417), Nagoya, Japan, 1–5 June 2003; Volume 3, pp. 1124–1129. [Google Scholar] [CrossRef]
- Cheng, L.; Jiang, Y.; Dan, M.; Wen, H.; Li, Y.; Qin, W.; Hao, J. Effects of Fiber and Copper Particles on Conductivity and Breakdown Characteristics of Natural Ester and Mineral Oil under DC Voltage. Energies 2020, 13, 1818. [Google Scholar] [CrossRef] [Green Version]
- Zhang, X.; Ren, L.; Yu, H.; Xu, Y.; Lei, Q.; Li, X.; Han, B. Dual-Temperature Evaluation of a High-Temperature Insulation System for Liquid-Immersed Transformer. Energies 2018, 11, 1957. [Google Scholar] [CrossRef] [Green Version]
- Rao, U.M.; Fofana, I.; Betie, A.; Senoussaoui, M.L.; Brahami, M.; Briosso, E. Condition monitoring of in-service oil-filled transformers: Case studies and experience. IEEE Electr. Insul. Mag. 2019, 35, 33–42. [Google Scholar] [CrossRef]
- Martin, D.; Saha, T.; Dee, R.; Buckley, G.; Chinnarajan, S.; Caldwell, G.; Zhou, J.B.; Russell, G. Determining water in transformer paper insulation: Analyzing aging transformers. IEEE Electr. Insul. Mag. 2015, 31, 23–32. [Google Scholar] [CrossRef]
- Abdi, S.; Boubakeur, A.; Haddad, A.; Harid, N. Influence of Artificial Thermal Aging on Transformer Oil Properties. Electr. Power Compon. Syst. 2011, 39, 1701–1711. [Google Scholar] [CrossRef]
- Suwarno. The Influence of arc on Dissolved Gases in Transformer Oils. In Proceedings of the 2006 IEEE 8th International Conference on Properties Applications of Dielectric Materials, Denpasar, Bali, Indonesia, 26–30 June 2006; pp. 498–501. [Google Scholar] [CrossRef]
- Singha, S.; Asano, R.; Frimpong, G.; Claiborne, C.C.; Cherry, D. Comparative aging characteristics between a high oleic natural ester dielectric liquid and mineral oil. IEEE Trans. Dielectr. Electr. Insul. 2014, 21, 149–158. [Google Scholar] [CrossRef]
- Liao, R.; Hao, J.; Chen, G.; Ma, Z.; Yang, L. A comparative study of physicochemical, dielectric and thermal properties of pressboard insulation impregnated with natural ester and mineral oil. IEEE Trans. Dielectr. Electr. Insul. 2011, 18, 1626–1637. [Google Scholar] [CrossRef] [Green Version]
- Koreh, O.; Torkos, K.; Bashir Mahara, M.; Boressay, J.; Izvekov, V. Study of water clusters in insulating oils by Fourier transform infrared spectroscopy. IEEE Trans. Dielectr. Electr. Insul. 1998, 5, 896–902. [Google Scholar] [CrossRef]
- Farooq, K. The effect of particulate and water contamination on the dielectric strength of insulating oils. In Proceedings of the Conference Record of the 1996 IEEE International Symposium on Electrical Insulation, Montreal, QC, Canada, 16–19 June 1996; Volume 2, pp. 728–732. [Google Scholar] [CrossRef]
- ASTM D1500. Standard Test Method for ASTM Color of Petroleum Products (ASTM Color Scale); ASTM: West Conshohocken, PA, USA, 2002. [Google Scholar]
- Safiddine, L.; Hadj-Ziane Zafour, A.; Fofana, I.; Skender, A.; Guerbas, F.; Boucherit, A. Transformer oil reclamation by combining several strategies enhanced by the use of four adsorbents. IET Gener. Transm. Distrib. 2017, 11, 2912–2920. [Google Scholar] [CrossRef]
- Safiddine, L.; Zafour, H.Z.; Rao, U.M.; Fofana, I. Regeneration of Transformer Insulating Fluids Using Membrane Separation Technology. Energies 2019, 12, 368. [Google Scholar] [CrossRef] [Green Version]
- IEC 60422. Mineral Insulating Oils in Electrical Equipment–Supervision and Maintenance Guidance. 2005. Available online: https://webstore.iec.ch/publication/16120 (accessed on 8 March 2021).
- IEC 60814. Insulating liquids–Oil-impregnated paper and pressboard, Determination of water by automatic coulometric Karl Ficher titration. IEC 1997, 60814, 1997. [Google Scholar]
- IEC 60156. Insulating Liquids-Determination of the Breakdown Voltage at Power Frequency-Test Method. 1995. Available online: https://webstore.iec.ch/publication/913 (accessed on 8 March 2021).
- IEC 60247. Insulating Liquids-Measurement of Relative Permittivity, Dielectric Dissipation Factor (tan) and d.c. Resistivity. 2004. Available online: https://webstore.iec.ch/publication/1150 (accessed on 8 March 2021).
- Ádám Tamus, Z. Regression analysis to evaluate the reliability of insulation diagnostic methods. J. Electrost. 2013, 71, 564–567. [Google Scholar] [CrossRef]
- Kovacević, U.; Vujisić, M.; Iričanin, B.; Osmokrović, P.; Milosavljević, S. The correlation and regression between the pre-breakdown current and breakdown voltage of the vacuum switchgear in dependence of switching operation. In Proceedings of the 2014 IEEE International Power Modulator and High Voltage Conference (IPMHVC), Santa Fe, NM, USA, 1–5 June 2014; pp. 384–387. [Google Scholar] [CrossRef]
- Jakšić, U.G.; Arsić, N.B.; Fetahović, I.S.; Stanković, K.Đ. Analysis of correlation and regression between particle ionizing radiation parameters and the stability characteristics of irradiated monocrystalline Si film. Nucl. Technol. Radiat. Prot. 2014, 29, 123–127. [Google Scholar] [CrossRef]
- Sha, Y.; Zhou, Y.; Nie, D.; Wu, Z.; Deng, J. A study on electric conduction of transformer oil. IEEE Trans. Dielectr. Electr. Insul. 2014, 21, 1061–1069. [Google Scholar] [CrossRef]
- Rouse, T.O. Mineral insulating oil in transformers. IEEE Electr. Insul. Mag. 1998, 14, 6–16. [Google Scholar] [CrossRef]
- Toudja, T.; Moulai, H.; Nacer, A.; Beldjilali, A.; Khelfane, I.; Debche, A. Moisture and electrical discharges effect on naphthenic mineral oil properties. IET Sci. Meas. Technol. 2014, 8, 588–594. [Google Scholar] [CrossRef]
Figure 1.
Transformer oil samples: (a) new sample; (b) regenerated sample; (c) used sample.

Figure 2.
The color scale representation of mineral oil.

Figure 3.
Adsorption processes of the oil regeneration.

Figure 4.
SESCO physical treatment mobile station (1, Degassing chamber, 2, Electric heater bloc, 3, Filtration oil system, 4, Control unit).
Figure 4.
SESCO physical treatment mobile station (1, Degassing chamber, 2, Electric heater bloc, 3, Filtration oil system, 4, Control unit).

Figure 5.
Variation of the new oil breakdown voltage with water content.

Figure 6.
Variation of the regenerated oil breakdown voltage with water content.

Figure 7.
Variation of the used oil breakdown voltage with water content.

Figure 8.
Variation of the new oil resistivity with water content.

Figure 9.
Variation of the new regenerated resistivity with water content.

Figure 10.
Variation of the used oil resistivity with water content.

Figure 11.
Variation of the new oil dielectric dissipation factor with water content.

Figure 12.
Variation of the regenerated oil dielectric dissipation factor with water content.

Figure 13.
Variation of the used oil dielectric dissipation factor with water content.


Table 1.
Transformer oil samples properties.
| Property | Standard | Unit | New Sample | Regenerated Sample | Used Sample |
|---|---|---|---|---|---|
| Acidity | IEC 62021 | mg KOH/g | 0.012 | 0.03 | 0.21 |
| Water content | IEC 60814 | ppm | 23.4 | 31.59 | 69 |
| tan (×10) (90 C) | IEC 60247 | — | 27 | 31.15 | 1832 |
| Permittivity | IEC 60247 | — | 2.11 | 2.12 | 2.19 |
| Resistivity (90 C) | IEC 60247 | G·m | 200 | 153.2 | 1.353 |
| Breakdown voltage | IEC 60156 | k V | 42.3 | 33.6 | 18.4 |
| Viscosity (40 C) | ISO 3104 | mm/s | 6.78 | 6.78 | 9.91 |
| Density (20 C) | ISO 3675 | g/mL | 0.875 | 0.875 | 0.862 |
| Color index | ISO 2049 | — | <0.5 | 0.5 | 5 |
Table 2.
The regression analysis of breakdown voltage.
| The Oil Sample | The Exponential Model BDV = a·exp + c·exp | R | SS |
|---|---|---|---|
| New | BDV = 437·exp + 60.71·exp | 99.24% | 11.43 |
| Regenerated | BDV = −5.85 × 10·exp + 5.851 × 10·exp | 92.05% | 62.94 |
| Used | BDV = 75.56·exp + 23.44·exp | 99.77% | 1.33 |
BDV: breakdown voltage (kV), WC: water content (ppm), R: residual sum of squares or correlation coefficient, SS: sum of squares.
Table 3.
The regression analysis of resistivity.
| The Oil Sample | The Exponential Model = a·exp + c·exp | R | SS |
|---|---|---|---|
| New | = 6.49 × 10·exp + 263.1·exp | 98.38% | 371.58 |
| Regenerated | = −5.038 × 10·exp + 5.041 × 10·exp | 90.25% | 1.1406 × 10 |
| Used | = 0.2096·exp + 1.199·exp | 95.59% | 6.4305 × 10 |
: resistivity in (G.m), WC: water content (ppm), R: residual sum of squares or correlation coefficient, SS: sum of squares.
Table 4.
The regression analysis of dielectric dissipation factor.
| The Oil Sample | The Exponential Model tang = a·exp + c·exp | R | SS |
|---|---|---|---|
| New | tang = 24.36·exp−3.369 ×·exp | 95.55% | 7.4048 |
| Regenerated | tang = 9.508 × 10·exp−9.506 × 10·exp | 91.16% | 7.2310 |
| Used | tang = 17.71·exp−7.414·exp | 99.25% | 0.0444 |
tang: dielectric dissipation factor, WC: water content (ppm), R: residual sum of squares or correlation coefficient, SS: sum of squares.
Publisher’s Note: MDPI stays neutral with regard to jurisdictional claims in published maps and institutional affiliations. |
© 2021 by the authors. Licensee MDPI, Basel, Switzerland. This article is an open access article distributed under the terms and conditions of the Creative Commons Attribution (CC BY) license (https://creativecommons.org/licenses/by/4.0/).
Share and Cite
MDPI and ACS Style
Abdi, S.; Harid, N.; Safiddine, L.; Boubakeur, A.; Haddad, A. The Correlation of Transformer Oil Electrical Properties with Water Content Using a Regression Approach. Energies 2021, 14, 2089. https://doi.org/10.3390/en14082089
AMA Style
Abdi S, Harid N, Safiddine L, Boubakeur A, Haddad A. The Correlation of Transformer Oil Electrical Properties with Water Content Using a Regression Approach. Energies. 2021; 14(8):2089. https://doi.org/10.3390/en14082089
Chicago/Turabian StyleAbdi, Sifeddine, Noureddine Harid, Leila Safiddine, Ahmed Boubakeur, and Abderrahmane (Manu) Haddad. 2021. "The Correlation of Transformer Oil Electrical Properties with Water Content Using a Regression Approach" Energies 14, no. 8: 2089. https://doi.org/10.3390/en14082089
Note that from the first issue of 2016, this journal uses article numbers instead of page numbers. See further details here.