Article

It Is Still Possible to Achieve the Paris Climate Agreement: Regional, Sectoral, and Land-Use Pathways

1
Institute for Sustainable Futures, University of Technology Sydney (UTS), 235 Jones Street, Sydney, NSW 2007, Australia
2
Department of Energy Systems Analysis, Institute of Engineering Thermodynamics, German Aerospace Center (DLR), Pfaffenwaldring 38–40, 70569 Stuttgart, Germany
3
Institute of Vehicle Concepts, German Aerospace Center (DLR), Pfaffenwaldring 38–40, 70569 Stuttgart, Germany
4
Australian–German Climate and Energy College, Level 1, 187 Grattan Street, University of Melbourne, Parkville, VIC 3010, Australia
*
Author to whom correspondence should be addressed.
Energies 2021, 14(8), 2103; https://doi.org/10.3390/en14082103
Submission received: 25 February 2021 / Revised: 25 March 2021 / Accepted: 6 April 2021 / Published: 9 April 2021
(This article belongs to the Special Issue Energy Planning)

Abstract

:
It is still possible to comply with the Paris Climate Agreement to maintain a global temperature ‘well below +2.0 °C’ above pre-industrial levels. We present two global non-overshoot pathways (+2.0 °C and +1.5 °C) with regional decarbonization targets for the four primary energy sectors—power, heating, transportation, and industry—in 5-year steps to 2050. We use normative scenarios to illustrate the effects of efficiency measures and renewable energy use, describe the roles of increased electrification of the final energy demand and synthetic fuels, and quantify the resulting electricity load increases for 72 sub-regions. Non-energy scenarios include a phase-out of net emissions from agriculture, forestry, and other land uses, reductions in non-carbon greenhouse gases, and land restoration to scale up atmospheric CO2 removal, estimated at −377 Gt CO2 to 2100. An estimate of the COVID-19 effects on the global energy demand is included and a sensitivity analysis describes the impacts if implementation is delayed by 5, 7, or 10 years, which would significantly reduce the likelihood of achieving the 1.5 °C goal. The analysis applies a model network consisting of energy system, power system, transport, land-use, and climate models.

1. Introduction

Given the challenge that climate change poses for the global community, our research is dedicated to solutions for a low-emission society. To reach a net zero emission society in 2050, we develop normative emission pathways for a temperature rise well below 2 °C. Across various research disciplines, this scenario analysis combines climate, energy, transport, and land use models for a comprehensive picture of the tasks at hand, linking fossil energy emissions to non-energy-related GHG sources and sinks. We depict transition strategies for 100% renewable energy system in all 10 world regions, providing information of the necessary infrastructure, new capacity and investment, which would enable efforts by governments and society to keep climate change well below 2 °C and therefore in line with the Paris Climate Agreement. Earlier results of this research have been presented at Long-term-Scenarios for the Energy Transition (LTES) events [1].
Many scenarios have already been constructed and analysed to guide both policy and investment in limiting climate change ‘by keeping global temperature rise this century well below 2 degrees Celsius above pre-industrial levels’, according to the 2015 Paris Climate Agreement [2]. These published long-term scenarios [3,4,5,6] agree that the rapid decarbonization of energy production is required, together with significant negative emissions, throughout the 21st century. Many scenarios rely heavily upon nuclear power and natural-gas- or coal-fired power with carbon capture and storage (CCS) to decarbonize energy production, and negative emissions achieved with bio-energy with carbon capture and storage (BECCS). The 5th Assessment Report (5 AR) and the Special Report on Global warming of 1.5 °C (SR 1.5) of the Intergovernmental Panel on Climate Change (IPCC) also include a large number of representative concentration pathways (RCPs) illustrating a wide range of mitigation strategies [7,8].
Quantitative scenarios are usually constructed with modelling approaches, but always follow explicit or implicit ‘if–then’ narratives, which should never be understood as future predictions. In the global energy and emission pathways developed and discussed here, we use a storyline-and-modelling approach to make consistent assumptions about the implementation of technologies and to accommodate the multidimensional and multi-perspective character of the decision-making processes. Our intention is to increase the plausibility of the scenarios, rather than to identify supposedly cost-optimal solutions based on uncertain cost assumptions. With this approach, we develop narratives that target a society with net-zero CO2 emissions by 2050 and construct exemplary normative scenarios that focus on the mitigation of CO2 in the energy, agriculture, and land-use sectors.
These narratives represent a complementary basis for the difficult political and social decision-making processes required for the comprehensive decarbonization of energy systems. In contrast to previous studies, we have identified the technology paths that are suitable and necessary to achieve the decarbonization of the global energy system, with improvements in efficiency and 100% renewable energies only, by 2050. Limiting possible technologies and avoiding technical carbon dioxide removal (CDR) techniques are justified by the high potential utility of renewable energies and their low specific costs compared with those of nuclear and fossil power plants coupled to CCS and BECCS [9]. Moreover, the environmental effects and social acceptance of the latter options are highly contentious [10]: specifically, the unresolved disposal of radioactive waste in the case of nuclear power [11], and the unresolved doubts about the long-term effectiveness of underground storage of CO2 in the case of CCS [12].
Therefore, the 2 °C and 1.5 °C scenarios presented here are ‘non-overshoot’ scenarios that use only widespread and publicly accepted technologies to generate renewable energies or produce green synthetic fuels. The scenarios also fulfil society’s obligation to reduce its current energy-related emissions and limit the future energy demand. They meet the overall energy-related CO2 emission budget of only 590 and 450 gigatonnes of CO2 (Gt CO2) respectively between 2015 and 2050, and also consider the non-CO2 emissions and natural carbon sinks when estimating the overall greenhouse gas (GHG) emissions and related temperature increases. Most of the published 1.5 °C (low) overshoot pathways [13] include negative emission technologies, which buffer the heavy burden of energy transition in some way.
The pathways presented in this paper build upon a recently published scenario study [14]. The detailed assumptions, including technology and cost data, and the results tables can be found in the Supplementary Materials. Both pathways are considered to achieve targets ‘well below 2.0 °C’, with one representing the upper limit (2.0 °C Scenario) and one the lower limit (1.5 °C Scenario). The ‘reference’ (REF) scenario (5.0 °C Scenario) is based on the Current Policies Scenario published by the International Energy Agency (IEA) [15]. Using a comprehensive emissions accounting system, the pathways for the four major energy sectors—power, heat, transport, and industry—are based on GHG-mitigation strategies for 10 world regions, and focus on the distribution and consumption of energy and related emissions are the main driver of climate change [16]. The increased electrification of transport and heating systems, in order to replace fossil fuels with renewable electricity, plays an important role in those scenarios. The underlying solar and wind potentials were derived from a Geographic Information System (GIS)-based analysis of the required land area to avoid conflicts with other land uses, such as for natural carbon sinks (forests). To further investigate the use of installed capacities in the power systems, the system was modelled at high regional and temporal resolutions. Therefore, the 10 world regions were subdivided into 72 sub-regions to analyse their load developments and storage demands. Atmospheric GHG concentrations and radiative forcing, and their implications for global mean temperature and sea-level rises, were also analysed. To define a sustainable pathway for land-use change and the agricultural sector, we combined the investigation of future energy systems with measures for negative emissions provided by well-established natural land restoration methods. We used reduced-complexity carbon cycle and climate modelling to assess the climatic effects of the calculated emissions pathways. The analysis thus applies an integrated model network consisting of energy systems, power systems, transport, land use, and climate models.

2. Results and Discussion

2.1. Development of Energy Demand Intensities

Starting from the REF scenario, narratives for the demand side of the normative scenarios were developed. The main drivers of the final energy demand in the scenarios are population growth and economic development. The world’s population is expected to grow from 7.4 billion in 2015 to 9.8 billion by 2050 [17]. It is assumed that the world’s gross domestic product (GDP) will increase, on average, by 3.2% per year in the next three decades [15]. Therefore, our scenarios are based on improvements in efficiency and resulting reductions in demand (Table 1). The implementation of technical efficiency measures plays a significant role in the 1.5 °C Scenario, particularly before 2030. However, both the 1.5 °C and 2.0 °C Scenarios differ only slightly in their final annual energy demands in 2050. In both cases, efficiency measures are required to decouple economic growth and final energy consumption. Conversion losses are reduced, particularly by replacing thermal power generation with renewable technologies. This further reduces the primary energy intensity. The REF Scenario provides the lower benchmarks for efficiency potentials derived from the Current Policies Scenario of the IEA World Energy Outlook [15]. The upper benchmarks for the efficiency potentials for each world region are taken from the literature [18,19], including the low-energy-demand (LED) scenario [20,21]. In the transport sector, a combination of technical measures and modal shifts reduce annual passenger kilometres for private vehicles by 25% in OECD countries under the 1.5 °C scenario. The shift towards electric mobility might be driven by vehicle emission standards and economic incentives to phase out internal combustion engines. It is expected that the acquisition costs for electric cars will be similar to those for cars with combustion engines during the next decade and that maintenance costs will become increasingly competitive.

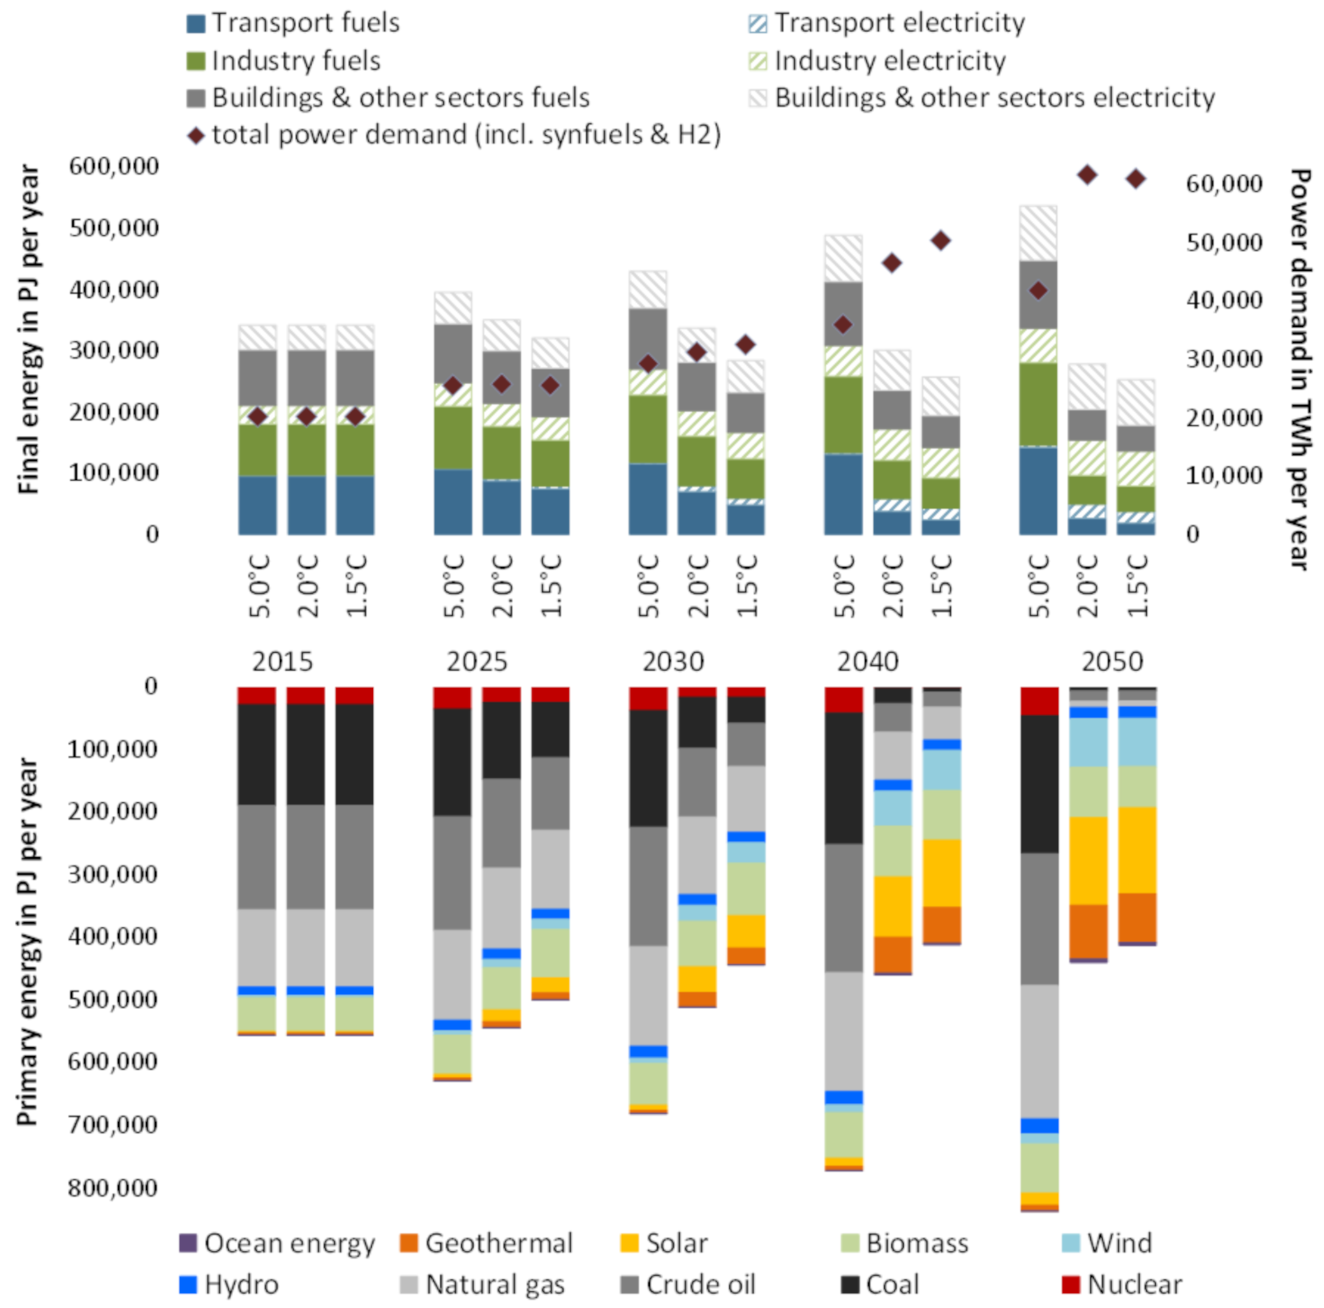
2.2. Demand and Supply Pathways towards +2 °C and +1.5 °C Targets

The role of energy efficiency in decarbonization scenarios is widely documented. The IPCC [8] concluded that ‘at the global level, scenarios reaching about 450 ppm CO2eq are (also) characterized by more rapid improvements in energy efficiency’ and Lovins [22] identified energy efficiency among the most cost-effective ways to reduce carbon emissions. As well as reducing the energy demand by improving energy efficiency, the two energy decarbonization pathways are based on expanding renewable energy supply technologies [21]. Figure 1 shows the resulting final energy demands by sector and scenario, and the primary energy by energy carrier. The measures documented in Table 1 will reduce the total final energy demand to below 280 EJ in 2050 compared with around 540 EJ in the 5 °C (REF) case. Accordingly, annual global primary energy use decreases from 556 EJ in 2015 to about 440 EJ by 2050 under the 2.0 °C Scenario and to 412 EJ under the 1.5 °C Scenario. Both scenarios are non-overshoot scenarios with no CDR technologies, so a rapid reduction in fossil fuels and a significant deployment of renewable energies would already be necessary by 2025. Solar and wind power are the backbones of such an energy system, with complementary contributions from hydro, biomass, and geothermal energy (Figure 1). Compared with today, the installation of renewables-based power and heat generation technologies accelerates significantly.

Transformation of the Transport Sector

An increase in the efficiency of vehicles with internal combustion engines and a direct electrification rate of 50% by 2050 on world average (Table 2) would be necessary to decrease the final energy consumption of the transport sector by more than 60%, as required for the 2 °C Scenario.
An even steeper reduction in the transport demand and more-drastic efficiency-improvement measures (electrification, modal shifts) are required under the 1.5 °C Scenario. In this scenario, the energy demand of the global transport sector is 74% lower in 2050 than under the 5 °C Scenario. Electrification of the vehicle stock and altering transport modes to reduce energy-intensive transport activities will have a high decarbonization effect. However, measures such as the expansion of public transport and the vehicle-sharing infrastructure are equally important. The direct electrification of air and ship transport is particularly limited, so under the 2.0 °C and 1.5 °C Scenarios, electricity-based synthetic fuels increasingly replace fossil fuels in these sectors.

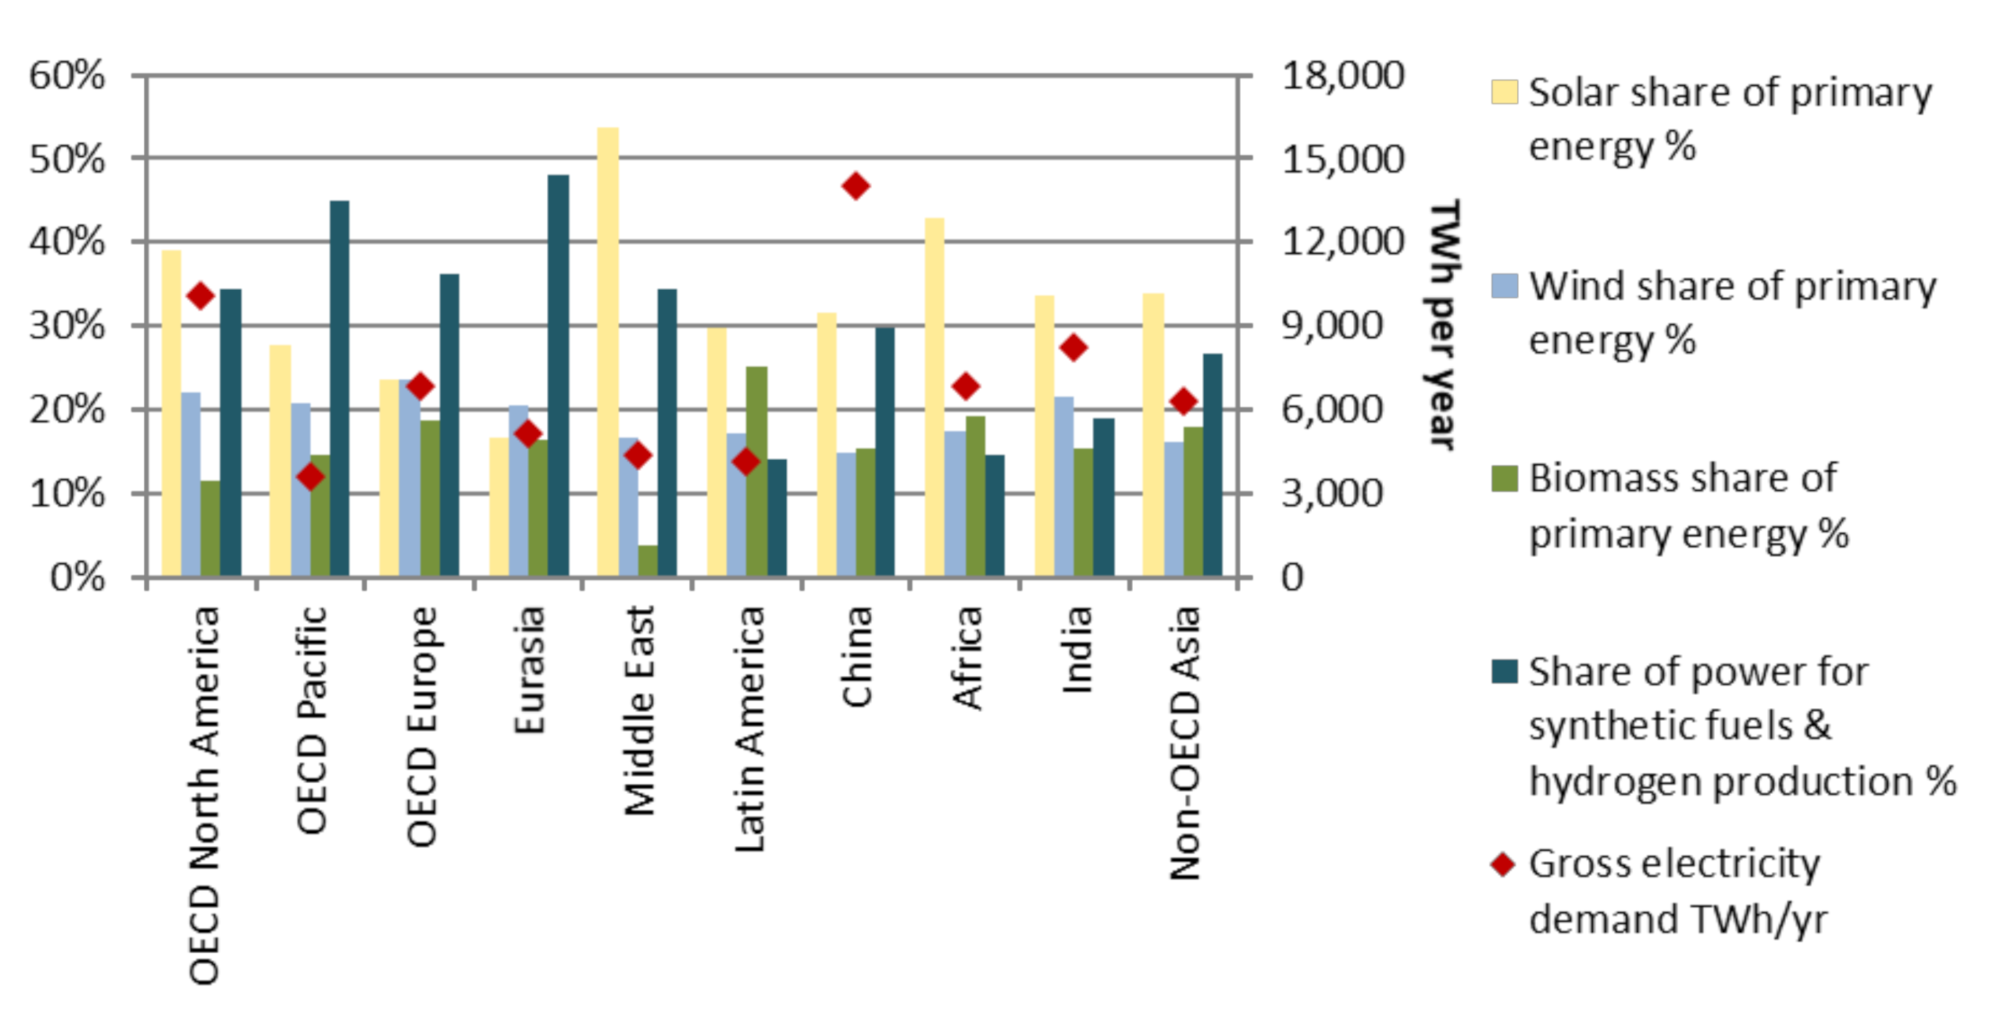
2.3. Regional Differences

How much each renewable energy source supplies to the total demand depends on regional opportunities for and constraints upon deploying renewable energies [21,23]. In the 1.5 °C Scenario, solar heat and power technologies provide over 50% of the total primary energy demand in the global sun belt, because solar is readily available and comparatively inexpensive (see Figure 2). The Middle East exemplifies the solar region model. With low biomass and hydro resources, the Middle East will rely on the development of dispatchable technologies, such as hydrogen production or concentrated solar power, which will help to store the abundance of solar energy. In contrast, in Europe and Eurasia, with their long cold winters, solar contribute only ~20%. Latin America represents a ‘bioenergy and hydro region’, where biomass provides easily accessible heat and hydro provides dispatchable (balancing) power. A previous detailed analysis for Brazil [24] supports this approach.
Synthetic fuels, including hydrogen, will become increasingly relevant under the carbon constraint when the share of renewables exceeds 80% (Figure 2). The option to store and distribute energy carriers (hydrogen or synthetic fuels) will be important in this case, especially in regions in which both solar and biomass resources are limited. Eurasia would dedicate almost 50% of its power production for this purpose in the 1.5 °C Scenario. China has the highest power production of all regions in our 1.5 °C Scenario, and would require around 4000 TWh per year in 2050 to generate synthetic gases and fuels to balance the variable renewables, to provide off-season power, and to indirectly electrify the process heat and transport sectors. This large power demand is a special challenge. Recent studies have shown that the regionally integrated deployment of renewable technologies can technically manage this transition, even for the eastern demand centres [25,26]. Because of its industrial lifestyle, North America already has a high proportion of electrification and a large power demand. Therefore, it will also require large amounts of synthetic fuels in our 1.5 °C Scenario. India is another key region for global development and will rely strongly on solar energy for its transformation. In contrast to the various regional requirements for solar, biomass, and synthetic fuels, wind would provide a stable share of 15%–20% in all regions, even under quite different regional assumptions for the synthetic fuel demand.

2.4. Sector Coupling—Electrification Replaces Thermal Processes

Electrification is a key to replacing fossil fuels in thermal processes and combustion engines in all sectors under both high-renewables scenarios. Electrification shares of over 50% of final energy by 2050 (Table 2) will rely on a rapid increase from 21% in 2015 to 38% by 2030, significantly increasing the interactions and interdependencies between power production and power consumption and storage in the transport, industry, and building sectors (Figure 3). As a consequence, the global annual electricity demand increases by 13,600 TWh between 2015 and 2035 and by 7890 TWh between 2035 and 2050 under the 1.5 °C Scenario. Therefore, fossil-fuel-based power generation would be replaced by renewables-based generation, increasing the latter by a factor of 7 between 2015 and 2035. By 2050, ~62,300 TWh per year would be generated from renewables under the 1.5 °C Scenario. This is also required to substantially supply the transport sector. The proportion of electricity in the total final energy used by the transport sector in 2015 was less than 1%, although the proportion was markedly higher in China at 4%, nearly half of which was attributable to the rail system and half to 2- and 3-wheeler vehicles and buses. Under the 1.5 °C Scenario, 38% of the final global transport energy demand needs to be electrified by 2035, although this varies greatly between regions. The industry and building sectors need to double their electrification rates, for both space and process heat, to meet the scenario targets.
The pace of electrification will differ significantly between the regions. In our scenarios, China, Europe, and OECD Pacific are expected to take the lead in transport-sector electrification because environmental policy incentives are already emerging. In the building sector, electrification will be easiest for regions with low space-heat demands, in warmer climates. In areas with cold winters, such as Eurasia and Europe, investments in heat pumps are required to make electrification possible. Heat grids that integrate biomass, waste heat, and solar collectors are an efficient alternative, but both options require huge improvements in insulation to curb the energy demand. In sub-Saharan Africa, electrification of the building and transport sectors are particular challenging because the rates of electrification and urbanisation are low. However, recent observations indicate that there have been significant improvements in electrification in both rural and urban areas since 2014 [27].

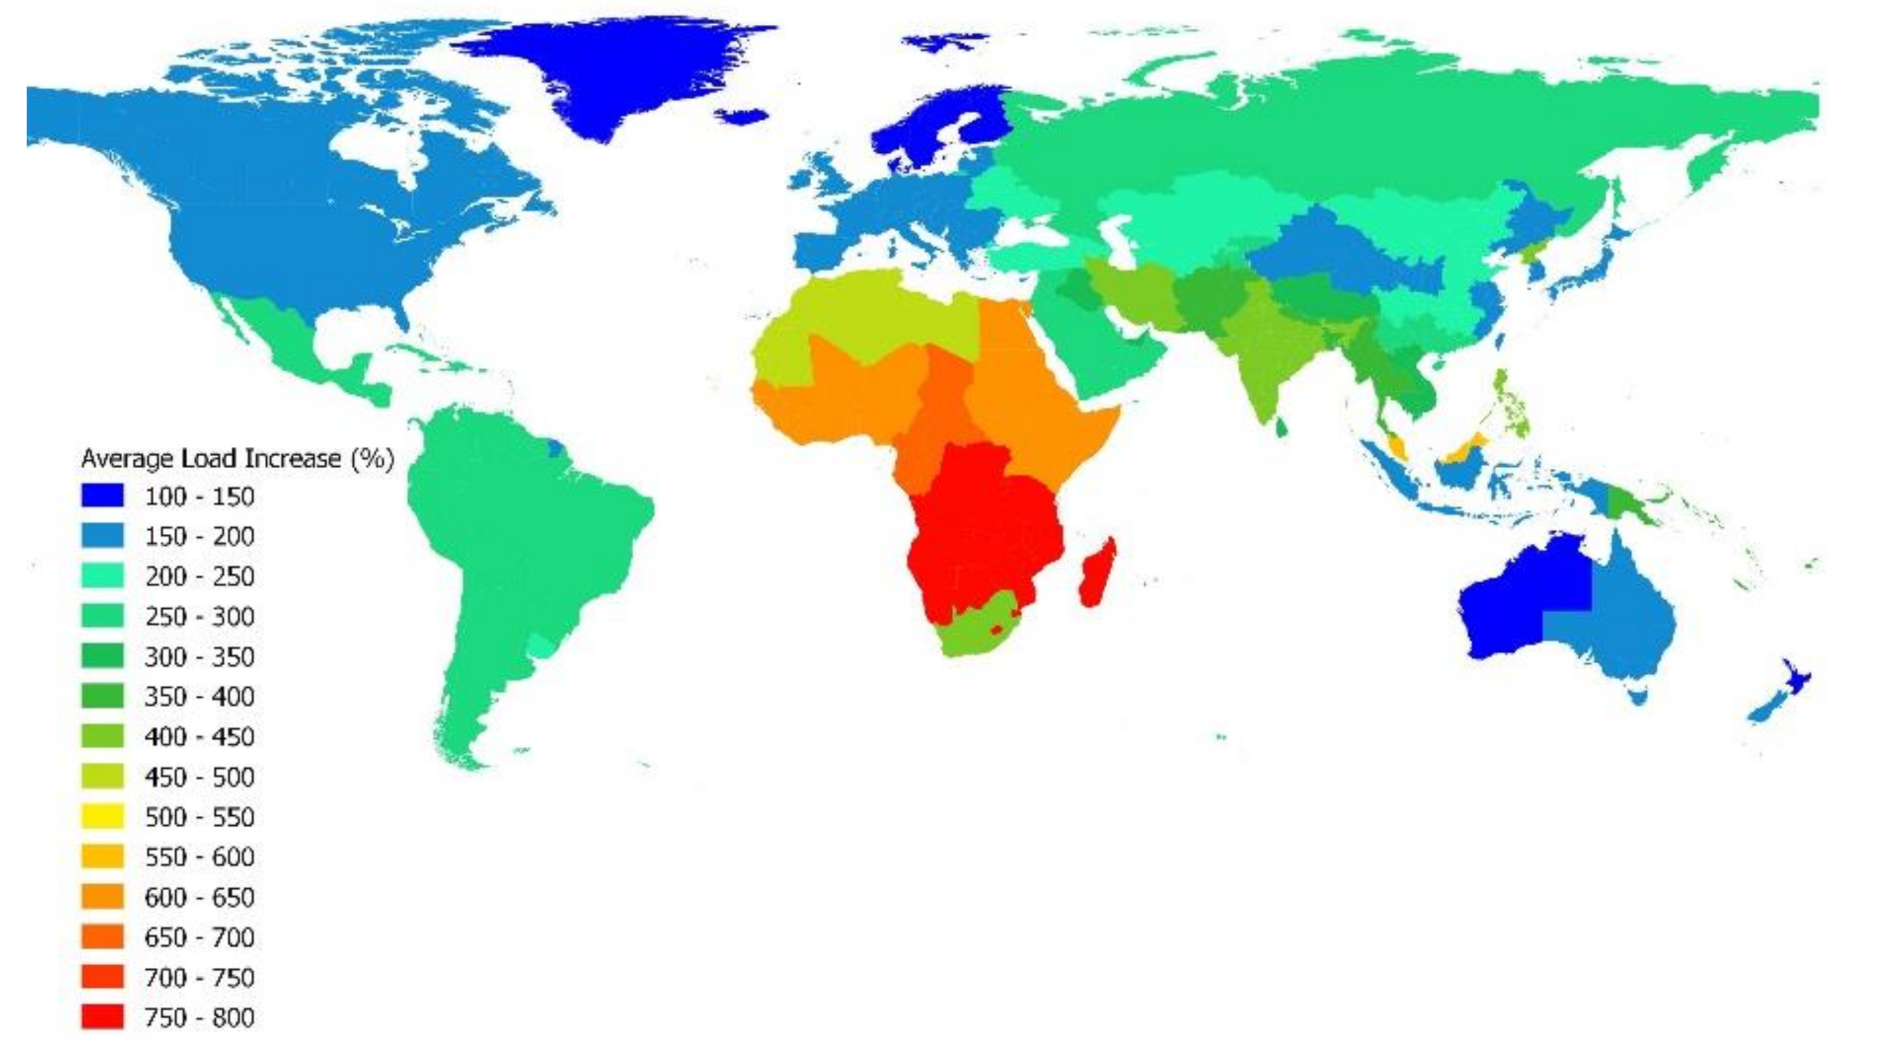
2.5. Power Sector Analysis: Development of Electric Load and Storage Demand

Because electrification is a key transition strategy and wind and photovoltaic sources are highly volatile, we specifically focused on balancing the power systems with historic regional solar and wind data [28,29]. The modelling results show that the average loads increase in all 72 regions under both scenario alternatives. Under the 1.5 °C Scenario, the most significant increases and largest regional differences occur in Africa, where the average load increase between 480% in the northern regions and 750% in the southern regions, reflecting the significant regional differences in access to electricity and the electrification of the transport sector (Figure 4). In OECD Pacific, efficiency measures reduce the average load by 87% in 2030 compared to 2015. By 2050 however, load increases to 116%, as electric mobility and electric process heat in industry are added as new consumers. In most regions, the electrification and thus the load is expected to increase more under the stronger limitations of the 1.5 °C Scenario than in the 2.0 °C Scenario. Only if Middle East, India, and Non-OECD Asia leapfrog on efficiency measures, demand at the end of the modelling period can be leveled out. Flexibility measures, such as fast-reacting dispatch generation capacities and demand-side management, are used in our scenarios to reduce the need for additional transmission and storage capacities, but will not replace them entirely. Under the 2.0 °C Scenario, the global pumped hydro storage capacities increase by 6 GW and battery capacities by 0.8 GW annually between 2015 and 2030, to 244 GW and 12 GW, respectively. By 2050, pumped hydro will increase to 267 GW and batteries to 347 GW of the total installed capacity. By 2050, 197 GW of gas power plants and combined heat and power generation (CHP) capacity will either consume synthetic methane or be retrofitted for hydrogen use. In parallel, the average capacity factor for gas and hydrogen plants will decrease from 29% (around 2600 h/yr) in 2030 to 11% (just under 1000 h/yr) by 2050, providing dispatch power and ancillary services.

2.6. Investment Required and Fuel Cost Savings

By 2050, electricity and synthetic fuels (including hydrogen) will supply 70% of the global final energy required in the 1.5 °C pathway. The overall cumulative investment in power generation required up to 2050 in our scenario is USD 51.1 trillion (USD 1.42 trillion annually on average), which is USD 30.7 trillion more than under the REF scenario, under which an investment of USD 20.4 trillion (USD 0.58 trillion annually) will be required. The overall fuel cost savings in the same scenario will add up to USD 28.8 trillion over the same period, or USD 0.8 trillion per year. Total fuel cost savings in the 1.5 °C pathway alone will cover 90% of the additionally necessary investments in renewable power generation in the 1.5 °C pathway.
The levelized costs of electricity (LCOE) of the global power sector under the REF Scenario (without including the costs of CO2 emissions) are calculated to increase from USD 60 per MWh in 2015 to USD 79 per MWh in 2050. In comparison, the 2.0 °C Scenario will increase the generation costs to USD 77 per MWh by 2030, with a following reduction to USD 70 per MWh by 2050. Under the 1.5 °C Scenario, electricity generation costs will peak at USD 81 per MWh and decrease to USD 70 per MWh—equal to that in the 2.0 °C Scenario.
According to a recent market survey [9], the current LCOE is USD 192 per MWh for nuclear generation, USD 152 per MWh for coal-fired power generation, and USD 68 for gas-fired power (excluding CCS costs). As of 2019, there are two CCS facilities combined with power generation—the 115 MW coal-fired Boundary Dam plant in Canada [30] and the 240 MW gas-fired Petra Nova plant in the USA [31], at which CO2 capture per tonne costs approximately USD 100 and USD 65, respectively, [32] although only a portion of all fugitive CO2 emissions is captured. These are significantly higher than the cost of power generation from carbon-neutral renewables—USD 42 per MWh for utility-scale solar photovoltaic and USD 54 per MWh for onshore wind. The cost for sequestration with BECCS is approximately USD 100–200 per tonne CO2 [33], and it has a limited mitigation potential of 1 Gt CO2 per year [34]. In comparison, the cost of natural land restoration is <USD 100 per tonne CO2, with an average potential of 7 Gt CO2 per year [35,36].

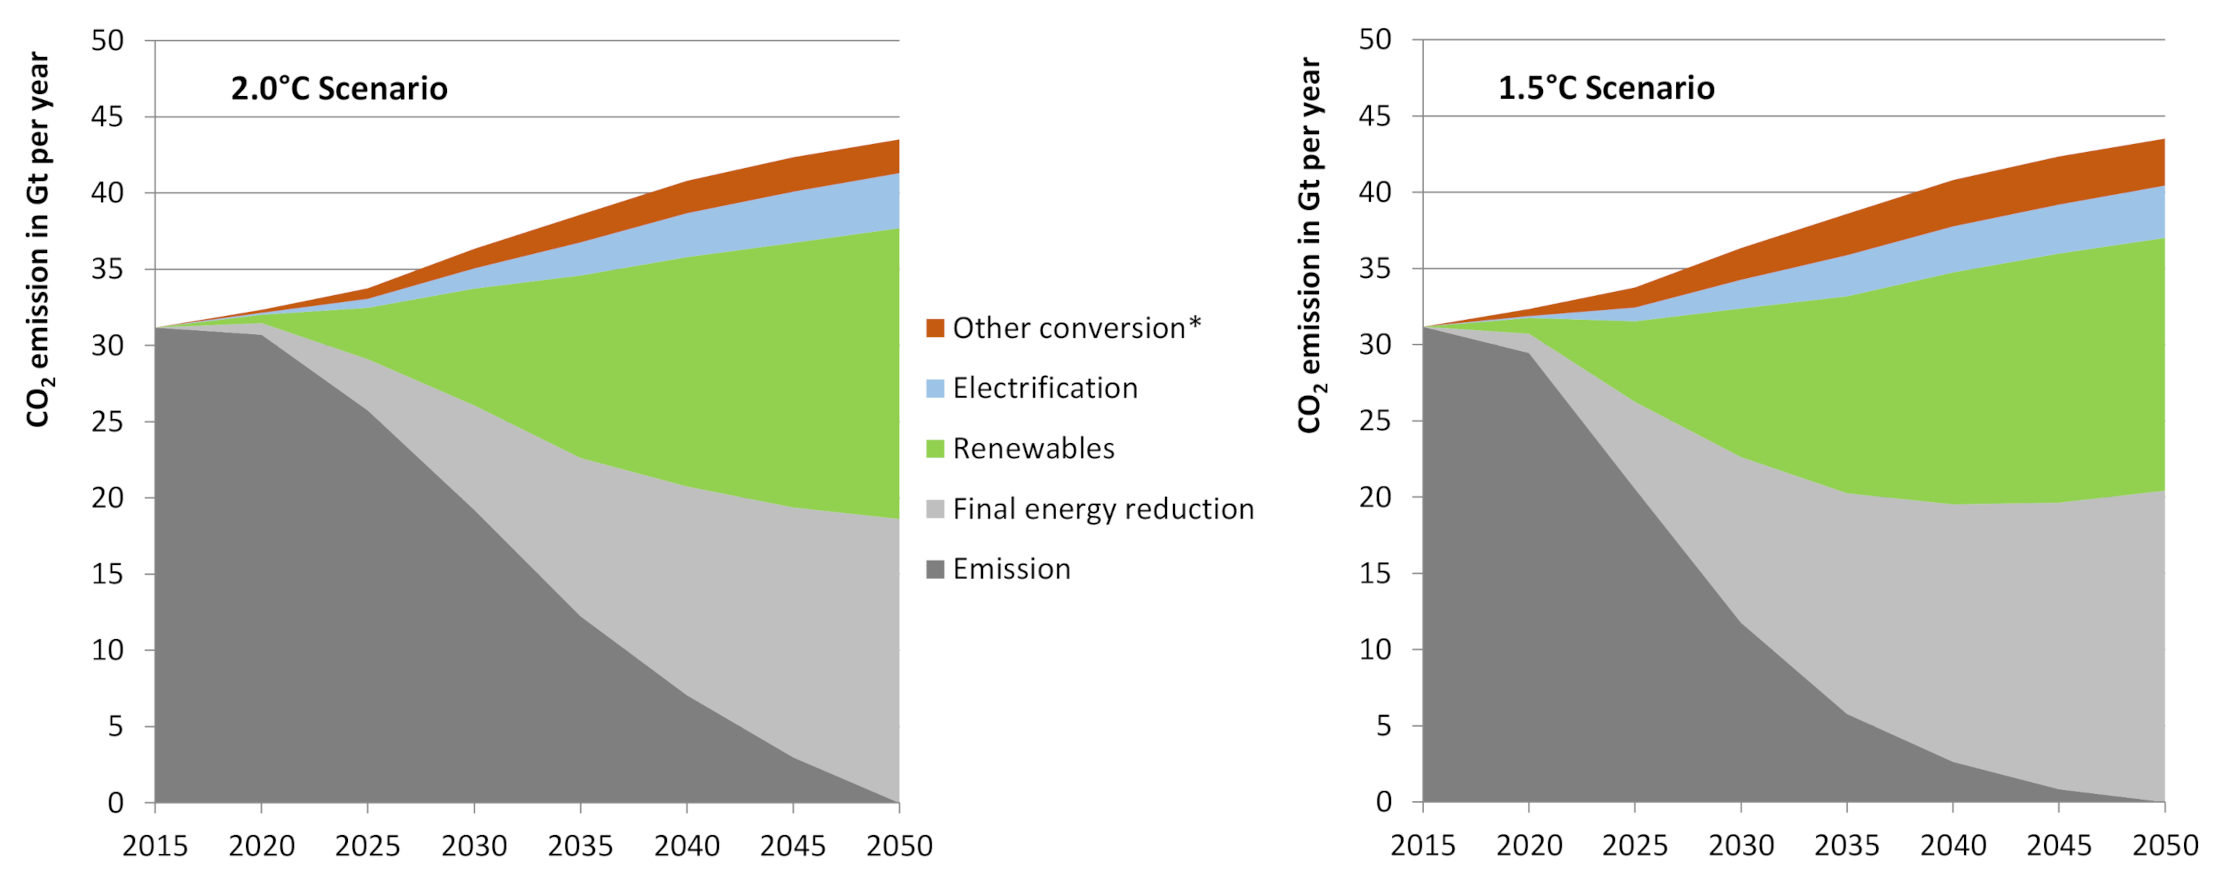
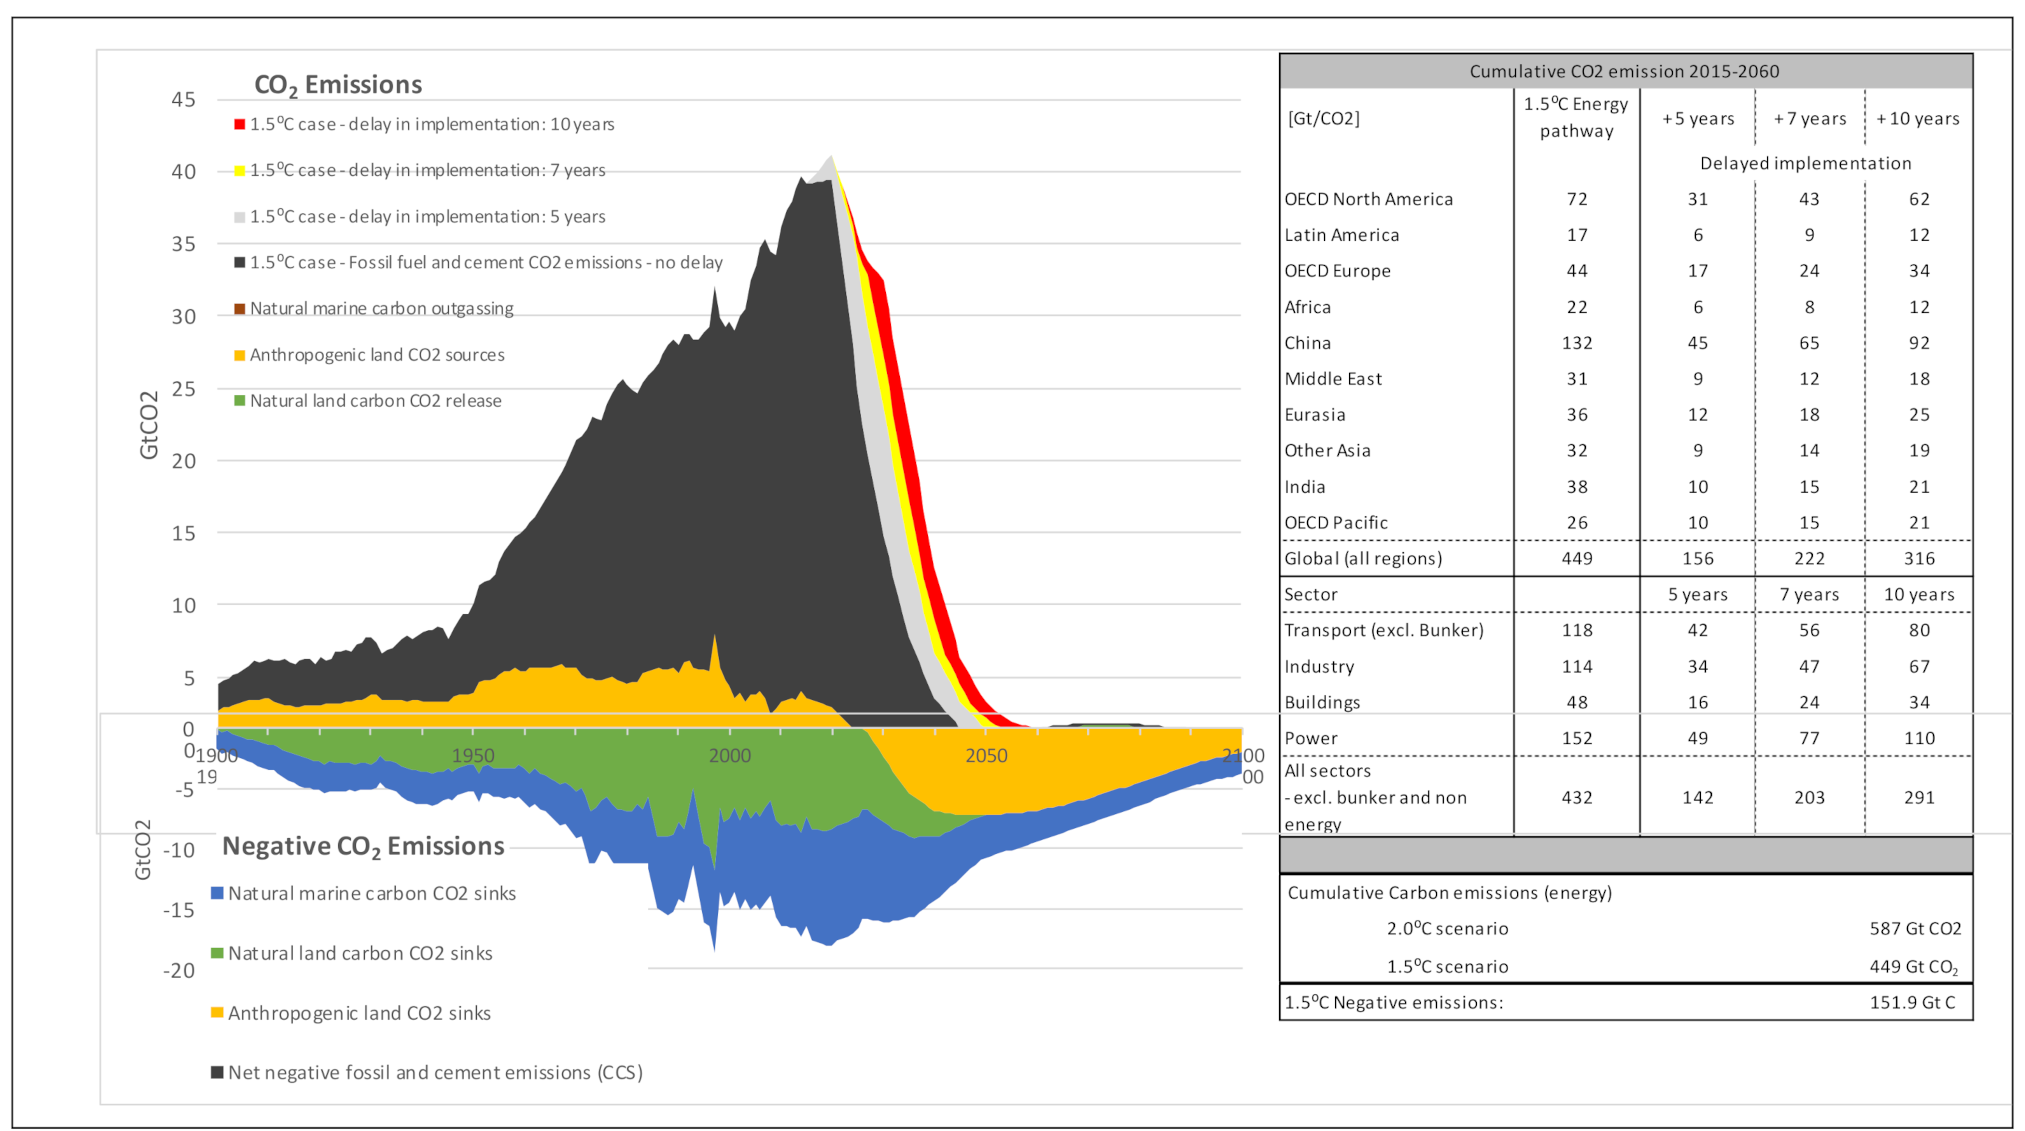
2.7. Distribution of Carbon Emissions

We performed an ex-post analysis of the distribution of CO2 emissions in the scenarios based on the technical transitions in the energy system. Compared with the IPCC RCPs, the pathways fall within the P1 category (IPCC SR1.5—P1 scenarios are defined as scenarios with lower energy demand up to 2050, due to innovations in social life, business, and technology. At the same time living standards increase and levelize. A leaner energy system facilitates rapid decarbonization of energy supply. Afforestation is the only CDR option considered; neither fossil fuels with CCS nor BECCS are used. OECD Pacific: Japan, South Korea, Australia, and New Zealand. The calculation of inter-regional exchange capacity requirements in MW is also possible, but beyond the scope of this article). Efficiency and electrification strategies strictly limit CO2 emissions in both low temperature rise scenarios. The cumulative energy-related CO2 emissions under the 5.0 °C Scenario between 2015 and 2050 are 1341 Gt CO2, about three times higher than those under the 1.5 °C Scenario (449 Gt CO2). The OECD regions, China, and India account for over 60% of all emissions under all scenarios, and the cumulative emissions of the combined OECD countries equal those of China. In the low-emission scenarios, the power sector dominates, accounting for one third of all cumulative energy-related carbon emissions, predominantly arising from the necessary phase-out times required for recently built fossil/coal-fired power plants. The industry and transport sectors follow, accounting for 20–25% each. The building/other sectors contribute 10% of carbon emissions under our scenarios. The carbon intensities for all sectors are shown in Table 3. The proportions of renewable electricity generated increase, leading to significant reductions in carbon intensity on the supply side, a prerequisite for low carbon intensities in all other sectors. Carbon emissions then plateau by 2025 and decrease thereafter in the 1.5 °C pathway.

2.8. Land-Use and Non-CO2 Emission Mitigation Scenarios

2.8.1. Land-Sector Emissions

The land-sector emissions presented here are derived from a new probabilistic scenario based on four different land restoration pathways: reforestation, forest ecosystem restoration, sustainable use of forests, and agroforestry [37]. These pathways are based on the premise that the better management of terrestrial ecosystems, including the restoration of degraded natural ecosystems, will allow previously lost carbon stocks to be restored [38,39,40]. The global aggregated sequestration potential was calculated from the median values for an ensemble of draws for each sequestration pathway and climatic domain (temperate/boreal or tropical/sub-tropical), resulting in a theoretical potential of 151.9 Gt of carbon (C) by 2150 and a maximum carbon density cap of 377 Gt CO2 to 2100 [41]. The four sequestration pathways were aggregated from country-level data for the five Representative Concentration Pathway (RCP) regions (Table 4), and can be considered to approximate biome-average sequestration rates if they are supported by specific land-use policies.
Under the 1.5 °C pathway analysis [37], the effects of these different land-use options will sequester up to 32 Gt C by mid-century. The full extent of the net mitigation shown in Table 4 is required to achieve the 1.5 °C Scenario, whereas for the 2.0 °C Scenario, only a third of the sequestration potential is required. The 1.5 °C pathway is consistent with comparable scenarios in the literature [41], which showed mitigation rates of up to −2 Gt C per year from 2040 to 2050. The land-use-related emission and sequestration rates of the 2.0 °C and 1.5 °C pathways in the present study are within the range of currently published scenario distributions (CMIP6 CEDS and IPCC SR1.5 database [13]).

2.8.2. Non-CO2 Emissions

Non-CO2 emissions were modelled based on the other main GHGs (CH4 and N2O), fluorinated gases, and aerosols. The pathways for CH4 and N2O emissions were derived with a quantile regression method [37], resulting in long-term emission levels that track towards the lower end of the distributions of published scenarios (see above CMIP6 CEDS and IPCC SR1.5 database). They show a decline and plateau in CH4 emissions and a slight increase in N2O emissions over the course of the century, associated with agricultural activities [41]. Our quantile regression method assumes a phase out of halocarbon and fluorinated gases over the next 10–20 years, although it does not include the residual levels of background emissions [41]. In our 1.5 °C scenario, sulphate aerosol emissions are set below the SSP1 1.9 scenario, whereas NOx emissions are between the levels in the SSP 1 2.6 and SSP 1 1.9 scenarios [41]. Emissions of black and organic carbon are not as low as those in the lower SSP scenarios because these emission sources correlate less strongly with fossil-fuel burning, and a reduction in both black and organic carbon emissions will offset the warming and cooling effects of each [41].

2.9. Sensitivity Analysis: The Risk of Delay and the Possible Impact of COVID-19

At the time of writing (June 2020), the COVID-19 pandemic had reduced the global energy demand in an unprecedented way. Initial projections for 2020 [43] estimate a drop in the global primary energy demand of 5%. The oil and coal demands are projected to decline by 8% each, in response to reduced transport services and industrial activities, respectively. Global gas consumption is anticipated to decrease by 4%. Overall energy-related CO2 emissions are expected to fall by around 8% in 2020. If these forecasts come true, the global energy sector would be almost exactly on the 1.5 °C pathway in terms of the energy demand and overall fossil fuel consumption. Compared with the 1.5 °C Scenario assumptions for 2020, the actual use of coal in 2020 would be 3% lower and that of oil 2% lower, whereas the gas demand would still be 2% higher. However, the energy-related CO2 emissions would still be 1.1 Gt above those required in the 1.5 °C pathway for 2020. In terms of the electricity-generating capacities from renewable energies, both solar photovoltaic and wind power are consistent with the 1.5 °C trajectory if the market volume for new installations of both technologies in 2019 (115 GW for photovoltaic and 60 GW for wind [44]) are maintained in 2020. However, these developments are being affected by the COVID 19 pandemic, and a short-term decline in technology expansion might be possible. The extent to which the pandemic and the subsequent efforts to revive the global economy can support long-term changes in policy or a restructuring of the global economy remains to be seen. Various socio-economic storylines assume that a rapid return to “business as usual” will prevail in many areas [45].
The delayed implementation of permanent measures that tend us towards the 1.5 °C pathway will lead to additional energy-related carbon emissions. In this analysis, we assume that the calculated CO2 reduction pathways (2.0 °C and 1.5 °C) will begin 5, 7, or 10 years later than anticipated, and that emissions during that time will remain at the level of the year 2019. In this section, we quantify the additional cumulative carbon emissions that will result from these delays. The energy sector itself will be unable to compensate for those emissions, but will have to rely on society’s willingness to pay for net emission reduction technologies, such as BECCS and DACCS, and their inherent additional energy demands. Figure 5 shows the results (in billion metric tonnes) for the 10 world regions. If China delays the implementation of the 1.5 °C pathway by 5 years, an additional 45 billion tonnes of CO2 will be released, more than the total annual global CO2 emissions (33 billion tons) in 2019 [46]. The global CO2 budget under the 1.5 °C Scenario (66% probability) will be surpassed by 13% if all OECD countries delay their decarbonization pathways by 5 years. The cumulative CO2 emissions of China will equal those of all OECD countries, whereas those of India will equal those of OECD Pacific (OECD Pacific: Japan, South Korea, Australia, and New Zealand) (2015–2050, 1.5 °C scenario). Figure 5 shows the impact on global CO2 emissions if a whole sector delays the implementation of the 1.5 °C decarbonization pathway. A 5-year delay by the power sector will result in 50 billion tonnes of additional CO2 emissions.

3. Conclusions

To comply with the Paris Climate Agreement and maintain the global temperature ‘well below +2.0 °C’, the rapid decarbonization of the energy sector with currently available technologies is necessary, and also possible. The normative scenarios developed here avoid an emissions overshoot by combining the transformation to a fully renewable energy supply with the utilization of the available efficiency potentials in all energy sectors to reduce the total demand. Significant electrification of the transport and heating sectors before 2030 is essential to meet the Paris goals in both scenarios presented here. Increased electrification will require sector coupling, demand-side management, and multiple forms of storage (heat and power), including synthetic fuels. Accelerating the implementation of renewable heat technologies is equally important, because half the global energy supply may still derive from thermal processes by 2050. The fundamental transition of the global energy sector shown in our pathways will only be possible with significant policy changes and energy market reforms. The COVID-19 pandemic is both an opportunity for and a threat to this transition. The International Renewable Energy Agency (IRENA), the International Energy Agency (IEA), and the International Monetary Fund (IMF), as well as various government and non-governmental organisations, are demanding stimulation packages for a sustainable economic recovery in order to create new employment in the renewable energy and energy efficiency industries. Despite the expectation of a rapid economic recovery and existing emergencies, new frameworks for fundamental changes in energy use and supply would be required, so that a quick return to business as usual would be avoided.
However, our scenario analysis demonstrates that maintaining the global temperature ‘well below +2.0 °C’ cannot be achieved by the decarbonization of the energy sector alone, but will also require significant changes in land use, including the rapid phase-out of deforestation and significant reforestation. These measures are not alternative options to the decarbonization of the energy sector, but shall be implemented in parallel. If governments fail to act and mitigation is delayed, we face a serious risk of exceeding the carbon budget. Under the 1.5 °C Scenario, the additional emissions arising from delayed action (Figure 5) can be compensated if we rely more strongly on atmospheric CO2 removal via biospheric sequestration—in land and forests.
Without additional delay, only one-third of the total estimated CO2 removal potential will be required in the 2 °C-compatible pathway—leaving space to increase the amount of removal and still meet the 2 °C objective, albeit with the greater risk that a reliance on biospheric removal entails. However, our 1.5 °C pathway already requires all this biospheric sequestration potential—so a delay in mitigation action will put the 1.5 °C pathway out of reach. The idea of compensating emission overshoots in the long term by additional tree planting is unrealistic because the potential for terrestrial carbon sequestration and storage is limited by the amount of carbon previously lost from the biosphere through land conversion [38,47]. Our 1.5 °C pathway tends towards the upper end of this terrestrial carbon sink capacity. Therefore, significant extension of this already covered land sequestration potential is not possible without options that could be described as “geo-engineering”, such as establishing large tree plantations beyond ecosystem boundaries—a solution more vulnerable to the reversal of stored carbon [39]; or geological storage, such as via BECCS—an option likely to transgress planetary boundaries at the gigaton scale required for the 1.5 °C pathways [48]. Delayed mitigation action that is justified by sequestration, and which thus shifts the burden to the land sector, brings a higher risk of mitigation failure and temperature overshoot [49]. In our scenarios, the land-use sequestration pathways complement very ambitious energy-mitigation pathways. Sequestration of CO2 is therefore regarded as necessary to compensate for past emissions and not for current or future emissions

4. Reflections on Ways of Implementation

Achieving a 2.0 °C or 1.5 °C target requires substantial and long-lasting policy changes in order to unlock the necessary investments in the energy sector. A refocused investment strategy towards emerging and green technologies could also support the recovery of the global economy after the pandemic. Solar photovoltaic and onshore wind energy, in particular, are not only cost competitive with conventionally generated energy, but are increasingly least cost options [9]. The volume of global investment in renewables decreased from USD 328 billion in 2017 to USD 289 billion in 2018 [50] and increased to USD 301.7 billion in 2019 [44], which is still 9% below the 2017 levels, even though total installed capacity increased in the same time [51].
The barriers to the deployment of renewable energies are diverse and country-specific. Therefore, the implementation targets vary significantly across the world regions.
The scenario studies show very clearly that the biggest challenge for North America, Europe and the Pacific region will be to rapidly reduce the high energy intensities, i.e., in particular to significantly reduce energy waste inherent in the industrialized lifestyle. Incentives to avoid rebound effects and to save energy in private consumption are not yet visible anywhere. Europe has above all variable renewable resources and must optimize their integration into the energy system through extensive flexibility measures [24,52,53]. However, Europe also has the promising option of sourcing energy imports from resource-rich regions in North Africa and the Middle East, which has long been under discussion [54,55,56]. In the OECD Pacific region, imports and exports of synthetic fuels (e.g., between Japan and Australia) could be a likely strategy to support 100% renewable energy systems [57]. In Latin America, an important strategy is to improve the sustainability of renewable resource use by redirecting traditional biomass to efficient and low-emission uses. In addition, it may be important to limit the expansion of large hydropower to minimize negative social and environmental impacts. Both narratives are reflected in our alternative goal-oriented paths.
Particularly in the Earth’s sunbelt, the development of hydrogen and synthetic fuel technologies could not only cover domestic demand for chemical energy sources at moderate costs, but also open up future export markets [58,59]. In many countries, however, greater political stability would be a prerequisite for large investment in renewable energy and fuel production. The scenario development has clearly demonstrated that developments in China and India also have a major impact on global energy change. While China is already taking a leading position in several transformation processes, but the speed of its actions is not yet sufficient to achieve long-term goals [60].
The results of our scenarios show that the regional targets for the energy and land-use sectors can provide high-level mid- and long-term policy objectives and therefore investment security. In the energy sector, a combination of regional targets for electrification in all demand sectors (see Table 2) and targets for the maximum carbon intensity for each sector (see Table 3) provide a framework for the medium- and long-term measures required to convert the energy supply, including the energy infrastructure. Binding targets for land use will regulate the areas required for the future protection and restoration of carbon sinks and stocks (e.g., forests) and could also define the expansion of areas for renewable energy generation.

5. Similarities to Published Analysis, Research Limitations and Further Research Requirements

Our results in the energy sector are supported by results of other high renewable energy penetration scenarios [61,62]. However, the role of storage technologies. renewable fuels–such as hydrogen and synthetic fuels–and the extend of electrification of industrial process heat varies significantly. Furthermore, the presented 1.5 °C mitigation pathways do not relay on CCS and/or BECCS and used nature-based carbon sinks instead. The global scale of our energy pathways represents a research limitation as regional differences needed to be simplified. Future load curves are speculative as load management as well as utilization of storage technologies requires more research. The industry sector—with a focus on renewable energy supply options for high temperature process heat—requires more research as well. Decarbonisation pathways for specific industry sectors are required. Finally, the integration of non-energy GHG pathways, land-use change emission pathways and energy scenarios of high resolution need to be improved as current models—especially those used in the IPCC assessment reports are still simplistic.

6. Methodology

In our analysis, we considered the complete energy sector in detail, including electricity, heating and cooling, and transport. We also included a perspective on the non-energy use of fuels and the emission reductions arising from land-use changes, and provided a complete picture of all GHG emissions, extending the focus far beyond CO2 and the energy sector. This was achieved by integrating a set of assessment models for both the energy and non-energy GHG sectors. The results of the various emission modelling tasks are embedded within the reduced-complexity model MAGICC7 (see e.g., [63]), which allowed the derivation of probabilistic temperature projections with which to assess the likelihood of maintaining the global temperature below 2.0 °C or 1.5 °C. The following section summarizes the applied models and their interactions (Figure 6).

6.1. Non-Energy GHG Emissions Scenarios

We complemented the CO2 emission pathways from the energy system modeling with non-energy-related GHG emissions. To model the non-energy sector, we used different approaches, first to derive the land-use CO2 emissions and then to derive the emissions of other GHGs and aerosols. In the first approach, we used a (probabilistic) scenario of land-use emissions based on four narrative land-use pathways, and in the second, we used a newly extended statistical regression method. The following two paragraphs describe, in more detail, the methods used in these approaches.

6.1.1. Generalized Equal Quantile Walk (GQW)

A statistical analysis of 811 multi-gas emission pathways published by the Intergovernmental Panel on Climate Change (IPCC) [7,49] was carried out in order to complete the energy-related CO2 emission paths with scenarios of other relevant greenhouse gases. The method is an extension of the Equal Quantile Walk method [64] which calculates the median value of greenhouse gases (excluding CO2) as a function of CO2 paths in 5-year steps. Further details on this methodology are published in [14].

6.1.2. Land-Based Sequestration Pathways

CO2 sequestration can be achieved through improved land use such as “restoration of the forest ecosystem”, “reforestation”, “sustainable forest use” and “agroforestry”. Under the assumption that declassified carbon stocks can be restored through sustainable forest use, protected area management and improved land use with the aim of restoring carbon stocks, significant amounts of atmospheric CO2 can be removed [38,65,66].
Four different sequestration pathways were defined based on literature research and available data from FAO statistics. Assuming that after several years of sustainable land management, a defined amount of carbon is bound annually and thus become carbon sinks. Ultimately, an equilibrium of atmospheric CO2 is reached. When this equilibrium is reached depends on the type of ecosystem [67]. The phase of transition from a carbon sink to equilibrium is defined as the “phase-out” period.
A maximum of the mean carbon density was assumed based on bio-averaged values for the carbon density of undisturbed forest ecosystems per hectare [68], rather than on average global biome values [69]. The land use sequestration scenarios were calculated up to the year 2300, while the energy scenarios were only calculated until 2050 and the non-energy-related GHGs until 2100. The longer scenario period was necessary to apply the upper limit for the additional carbon density and to quantify the potential for CO2 sequestration on land. Further details on the methodology are documented in [14].

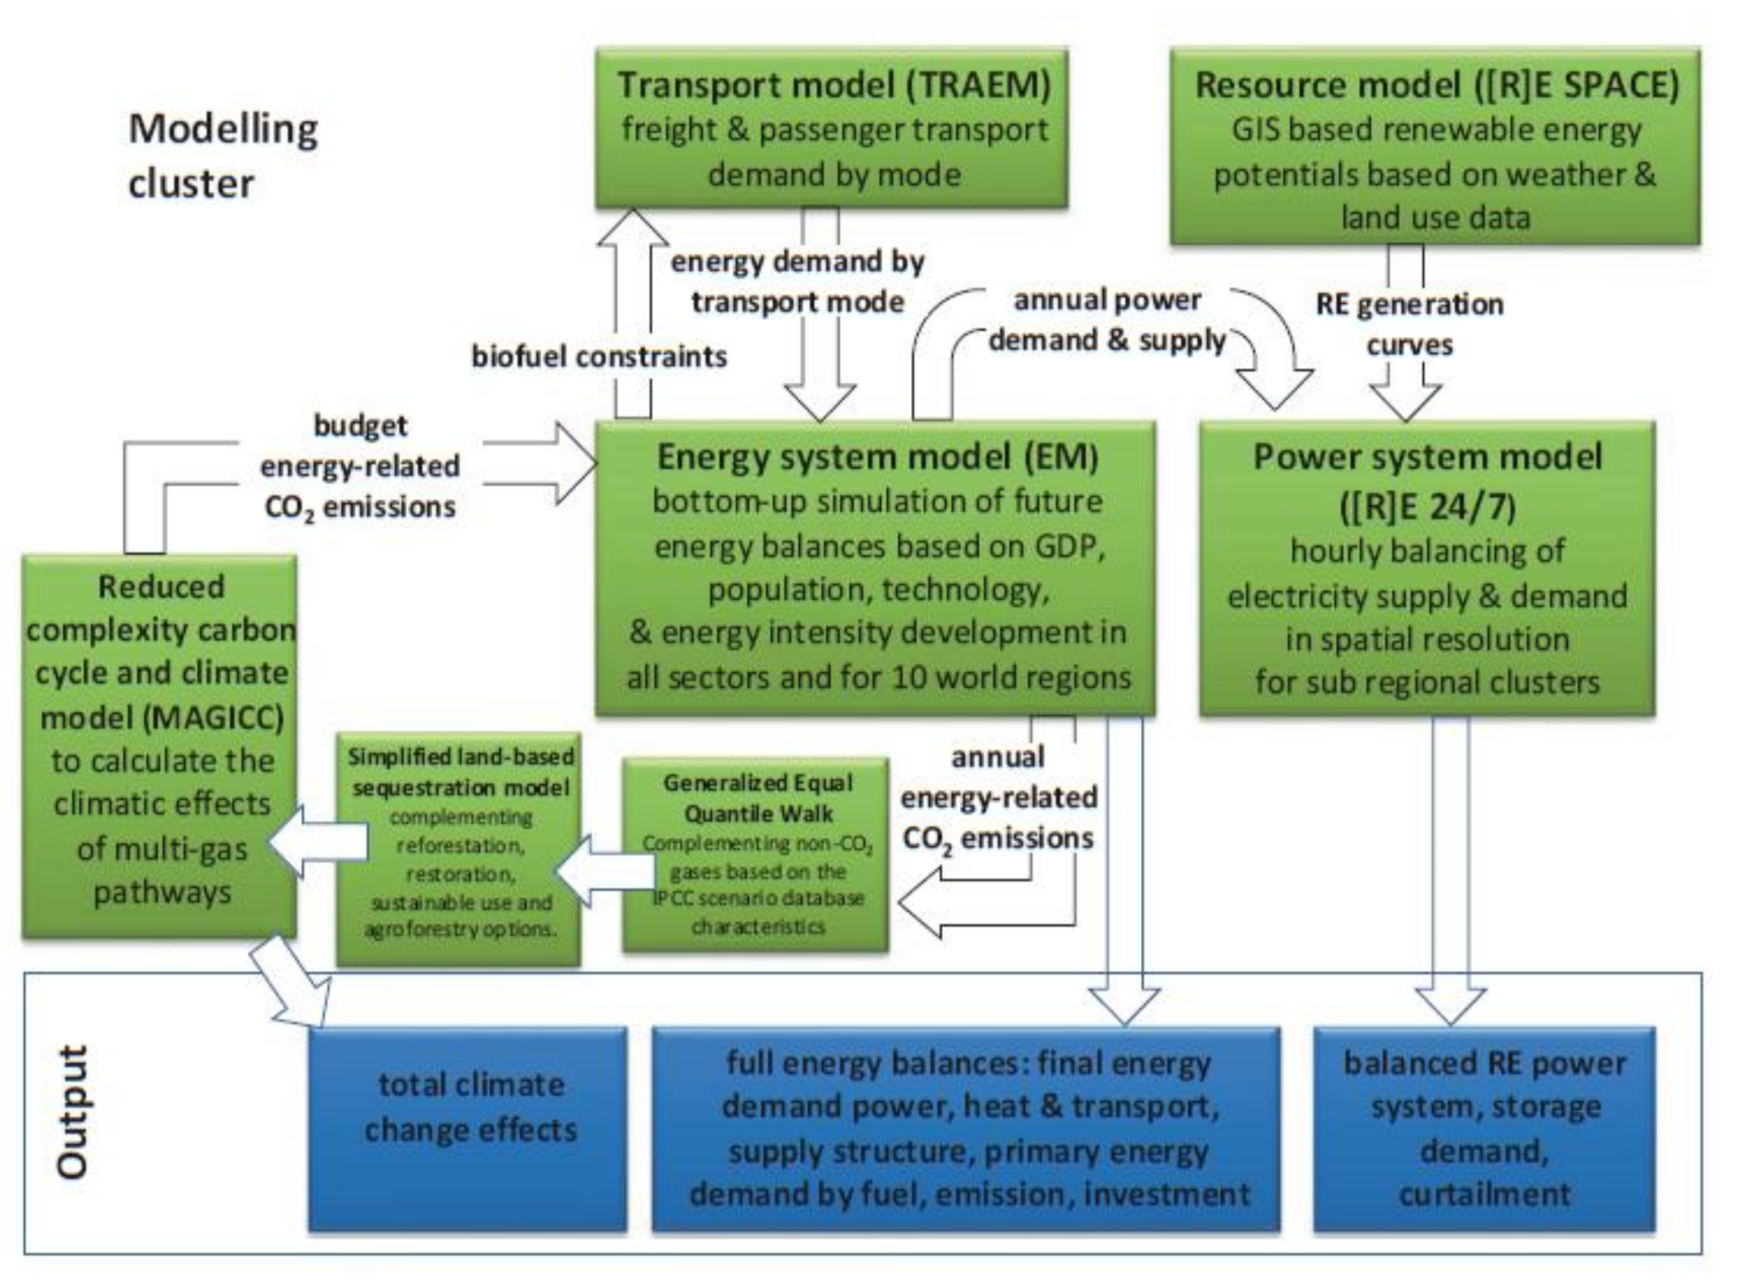
6.2. Modelling the Energy Sector

To model the energy sector, we combined two complementary approaches: highly spatially and geographically resolved power system modelling and long-term pathway development on an annual basis. The Energy System Model (EM) provides annual energy balances for the complete energy system. The model includes the energy demands for the industry, transport, residential, and others sectors, based on the external inputs of population, GDP, and energy intensity. The industry, residential, and other sectors are each represented by a set of heat, power, and co-generation technologies for all relevant fuel types. The transport sector is supplemented with a detailed transport model (TRAEM), including mobility demand and supply, based on transport technologies (e.g., vehicle types) and mobility services. The IEA World Energy Balances 2017 are the basis for calibrating the 2015 energy demand by region and sector in the model [70]. The conversion-and-power sector in the EM is complemented with a detailed power analysis. EM provides the power demand according to application type as an input parameter for the power system modelling. Based on this input, [R]E 24/7 calculates the necessary infrastructure for the power supply system. This suite of models was used to develop normative, target-oriented long-term scenarios. Starting from the base year and the identified desirable future in 2050 of net zero CO2 emissions, narratives for suitable transformation pathways were developed. Climate targets in terms of the cumulative CO2 emissions were set for both the 2.0 °C and a 1.5 °C scenario. To meet these, we constructed bottom-up scenarios covering a switch in the supply technologies. The scenarios are based on detailed input datasets that consider defined CO2 mitigation and technology expansion targets and limits, potentials and costs for renewables and fossil energy sources, and specific technical parameters for electricity, heat, and fuel generation in the energy systems. We applied a technology transition to all the energy sectors using a gradual approach. We identified the largest remaining emitters based on an ex-post analysis of CO2 emissions and the gap to reaching the overall CO2 budget. We then applied additional measures for an accelerated transition towards renewable energy technology. This iterative process was repeated until the carbon budget limitation was achieved.

6.2.1. Transport Model (TRAEM)

The TRAnsport Energy Model (TRAEM) calculates energy demand pathways, broken down into 10 world regions. Based on a passenger–km (pkm) and tonne–km (tkm) activity-based approach, these energy demands were integrated into a global model. The model calculates the final energy demand as the product of specific transport demand of each transport mode with the powertrain-specific energy demand. The model determines the transport energy demand for electricity and various fuels per year in 5-year intervals from 2015 to 2050, with no system or ownership cost-optimization. Total energy demand in the REF Scenario (5.0 °C) follows the IEA World Energy Outlook 2017 Current Policies Scenario [15] up to 2040. Based on the 2035–2040 change rates energy demand was extrapolated linearly to 2050 on reginal level. The was alternative scenarios were adjusted from 2020 to 2050 according to the respective carbon budgets. We attributed biofuels a GHG emission factor of zero because we assume that CO2 is fixed in the upstream process at the same level as the downstream CO2 emission. The same applies for CO2 emissions from synthetic fuel use. The model distinguishes different road passenger transport modes (light-duty vehicles are separated into small, medium, and large cars, 2- and 3-wheelers, and buses), rail passenger transport (urban, regional, and high-speed trains), and aviation (domestic and international passenger flights). Road freight (light-, medium-, and heavy-duty trucks), rail freight, and navigation freight transport were also considered.
Energy intensities per activity varies between the regions, based on the occupancy/load rates of the passenger transport modes or freight vehicles. Total energy demand is then the sum of all demand in all transport modes. The transport data were derived from historical and current transport activity data from statistics, complemented by region specific literature (for example, data on vehicle stock or occupancy rates in selected world regions). The German Aerospace Center (DLR) vehicle databases served as source for for energy intensity per transport. More information on this database and more details and the key assumptions can be found in [71].

6.2.2. Energy System Model (EM)

The scenarios are developed within a mathematical accounting system, specifically developed for the energy sector. It models development ways for energy demand and supply, considering development pathways of potentials, specific fuel consumption, technology and fuel costs, emissions, and limitations by physical flows between a set of technology processes. The data availability and the objectives of the analysis significantly influence the model architecture and approach.
The scenarios are implemented in Mesap/PlaNet, an energy simulation platform, which hosts the global energy system model developed by the DLR [72,73]. The accounting framework calculates detailed and consistent energy system balances, starting from demand and working all the way back to primary energy supply. It consists of two independent modules:
  • the flow calculation module with a physical balance of energy supply and demand on annual basis;
  • the cost calculation module, for corresponding investment, generation and supply costs.
The model integrates and combines a whole range of different technical options for the transformation of energy systems. The ex-post evaluation of power cost calculation is implemented via the Mesap platform’s standard tool and applied to all scenarios. The Model features a database for managing the input parameters and the output for the different scenarios after simulation. The graphical interface serves for structuring the modelled system and defining the quantitative interdependences between individual elements at different structural depths. Details of the structure and relevant model equations are given in the literature [21,74]. The energy flows of the energy system are balanced in the model on an annual basis. These flows connect technologies in each sector to process chains and includes all relevant energy carriers, using linear equations. The model then balances demand and supply by sequentially solving this equation system. The scenario period is disaggregated to 5-year steps until 2050. Further details about the methodology of the Energy System Model (EM) are published in [14]. The main outputs of the model are:
  • primary and final energy demands, disaggregated by fuel, technology, and energy sector, according to the classification by the International Energy Agency (IEA);
  • required energy required, applied technology and the financial investment for electricity, heating, and mobility (transport)t;
  • total cost of energy for the power system;
  • energy-related CO2 emissions over the scenario period.

6.3. Modelling the Power Sector

The power system analysis [R]E 24/7 is a mathematical accounting system that assess the requirements for electricity storage (the calculation of inter-regional exchange capacity requirements in MW is also possible, but beyond the scope of this article). It simulates the electricity system on an hourly basis and at geographic resolution. The methodology of the [R]E 24/7 model has been developed by UTS/ISF [75,76,77,78]. It specifically implements the hourly distribution (load curves and storage) and the geographic distribution of power demand and supply.
Hourly load curves for the residential, industry, and transport sectors were synthetically produced on the basis of the annual electricity demands for 2020, 2030, 2040, and 2050 (EM results), technology- and sector-specific energy intensity factors, regional GDP [79], and population data. Load curves for households were determined using nine different household categories, with various degrees of electrification and equipment. To calculate the load curves for business and industry, eight statistical industrial-sector categories were used: agriculture (1), manufacturing (2), mining (3), iron and steel production (4), cement industry (5), construction industry (6), chemical industry (7), and service and trade (8). Each sector had a defined energy intensity, expressed in energy per dollar GDP (MJ/USDGDP), which was converted to electrical units (kW/USDGDP) based on an estimated fuel efficiency factor, the electricity share, and operational hours per year. The load curve for the transport sector was calculated from the energy intensities for all electricity-consuming transport modes and hydrogen and synthetic fuel production, divided by the average annual utilization according to the technology (in h/yr). All three sectorial load curves were standardized: the load curves for the household and transport sectors in kilowatts per person (kW/capita) and the industry load curves in kilowatts per dollar GDP (kW/USD GDP). These standard curves were multiplied by the GDP data for each regional population. The standardized sectorial load curves for households and transport were multiplied by the population numbers derived with GIS mapping of each cluster. The standardized load curves for each of the eight industry sectors were multiplied by the corresponding shares of the total GDP values accorded these sectors by region. Because some data for each cluster were unavailable, the eight regional industry load curves were distributed per capita. In the last step, all sectorial load curves (households, transport, and industry) were summed. The spatial distribution of the projected GDP by industry sector remained unchanged in the 72 sub-regions over the years modelled (2020–2050).
The calculated load curves were compared with a cascade of power-generation technologies. The dispatch orders of the power-plant technologies can be changed. If demand and generation are congruent, no subsequent power-plant technologies are required, and the production for these hours will be zero. For variable solar and wind power generation, meteorological data with hourly resolution are required for each cluster (see [80,81]). Further details about the methodology are documented in [14].

Supplementary Materials

The following are available online at https://www.mdpi.com/article/10.3390/en14082103/s1.

Author Contributions

Conceptualization, S.T. and T.P.; methodology, T.P., S.S., J.P., K.D., M.M.; software, T.N., S.T.; validation, S.S., J.P., K.D.; formal analysis, T.P.; investigation, T.P., S.S., T.N., J.P., Ö.D., B.v.d.A., K.D. and M.M.; resources, S.T.; data curation, T.P., S.S., J.P., M.M.; writing—original draft preparation, S.T. and T.P.; writing—review and editing, S.T. and T.P.; visualization, S.T. and T.P.; supervision, S.T.; project administration, S.T.; funding acquisition, S.T. All authors have read and agreed to the published version of the manuscript.

Funding

This research was funded by the Leonardo DiCaprio Foundation, Sustainable Markets Foundation, 45 West 36th Street, 6th Floor, New York, N.Y.

Institutional Review Board Statement

Not applicable.

Informed Consent Statement

Not applicable.

Data Availability Statement

Data available from the Supplementary Materials.

Conflicts of Interest

The authors declare no conflict of interest.

References

  1. IRENA. Scenarios for the Energy Transition: Global Experiences and Best Practices; International Renewable Energy Agency: Abu Dhabi, United Arab Emirates, 2020; ISBN 978-92-9260-267-3. [Google Scholar]
  2. United Nations Framework Convention on Climate Change (UNFCCC). The Paris Agreement. Available online: http://unfccc.int/paris_agreement/items/9485.php (accessed on 12 March 2018).
  3. Rogelj, J.; Popp, A.; Calvin, K.V.; Luderer, G.; Emmerling, J.; Gernaat, D.; Fujimori, S.; Strefler, J.; Hasegawa, T.; Marangoni, G.; et al. Scenarios towards limiting global mean temperature increase below 1.5 °C. Nat. Clim. Chang. 2018, 8, 325–332. [Google Scholar] [CrossRef]
  4. Kriegler, E.; Riahi, K.; Bauer, N.; Schwanitz, V.J.; Petermann, N.; Bosetti, V.; Marcucci, A.; Otto, S.; Paroussos, L.; Rao, S.; et al. Making or breaking climate targets: The AMPERE study on staged accession scenarios for climate policy. Technol. Forecast. Soc. Chang. 2015, 90, 24–44. [Google Scholar] [CrossRef]
  5. International Energy Agency (IEA). World Energy Outlook 2018; OECD Publishing: Paris, France, 2018. [Google Scholar] [CrossRef]
  6. Rogelj, J.; Elzen, M.D.; Höhne, N.; Fransen, T.; Fekete, H.; Winkler, H.; Schaeffer, R.; Sha, F.; Riahi, K.; Meinshausen, M. Paris Agreement climate proposals need a boost to keep warming well below 2°C. Nature 2016, 534, 631–639. [Google Scholar] [CrossRef] [PubMed] [Green Version]
  7. Intergovernmental Panel on Climate Change (IPCC). AR5 Synthesis Report: Climate Change 2014; IPCC: Geneva, Switzerland, 2014; Available online: https://www.ipcc.ch/report/ar5/syr/ (accessed on 24 March 2021).
  8. Intergovernmental Panel on Climate Change (IPCC). Global Warming of 1.5 °C; IPCC: Geneva, Switzerland, 2014; Available online: https://www.ipcc.ch/site/assets/uploads/sites/2/2019/06/SR15_Full_Report_High_Res.pdf (accessed on 24 March 2021).
  9. Lazard. Lazard’s Levelized Costs of Energy Analysis—Version 13.0. Available online: https://www.lazard.com/media/451086/lazards-levelized-cost-of-energy-version-130-vf.pdf (accessed on 24 November 2019).
  10. Fridahlab, M.; Lehtveerac, M. Bioenergy with carbon capture and storage (BECCS): Global potential, investment preferences, and deployment barriers. Energy Res. Soc. Sci. 2018, 42, 155–165. [Google Scholar] [CrossRef]
  11. Ramana, M.V. Technical and social problems of nuclear waste. Wiley Interdiscip. Rev. Energy Environ. 2018, 7, e298. [Google Scholar] [CrossRef]
  12. Shaffer, G. Long-term effectiveness and consequences of carbon dioxide sequestration. Nat. Geosci. 2010, 3, 464–467. [Google Scholar] [CrossRef]
  13. Intergovernmental Panel on Climate Change (IPCC). Global Warming of 1.5 °C; (See above), SR1.5 p.132, Table 2.6.; IPCC: Geneva, Switzerland, 2019; Available online: https://www.ipcc.ch/site/assets/uploads/sites/2/2019/06/SR15_Full_Report_High_Res.pdf (accessed on 24 March 2021).
  14. Teske, S. (Ed.) Achieving the Paris Climate Agreement Goals—Global and Regional 100% Renewable Energy Scenarios with Non-Energy GHG Pathways for +1.5 °C and +2 °C; Springer eBook: New York, NY, USA, 2019. [Google Scholar] [CrossRef] [Green Version]
  15. International Energy Agency (IEA). World Energy Outlook 2017; OECD Publishing: Paris, France, 2017. [Google Scholar] [CrossRef]
  16. Intergovernmental Panel on Climate Change (IPCC). AR5 Climate Change 2014: Mitigation of Climate Change; IPCC: Geneva, Switzerland, 2014; Available online: https://www.ipcc.ch/report/ar5/wg3/ (accessed on 24 March 2021).
  17. United Nations, Department of Economic and Social Affairs, Population Division. World Population Prospects: The 2017 Revision; United Nations: New York, NY, USA, 2017; Available online: https://population.un.org/wpp/ (accessed on 30 April 2018).
  18. Graus, W.J.; Blomen, E.; Worrell, E. Global energy efficiency improvement in the long term: A demand- and supply-side perspective. Energy Effic. 2011, 4, 435–463. [Google Scholar] [CrossRef] [Green Version]
  19. Kermeli, K.; Graus, W.J.; Worrell, E. Energy efficiency improvement potentials and a low energy demand scenario for the global industrial sector. Energy Effic. 2014, 7, 987–1011. [Google Scholar] [CrossRef]
  20. Grubler, A.; Wilson, C.; Bento, N.; Boza-Kiss, B.; Krey, V.; Mccollum, D.L.; Rao, N.D.; Riahi, K.; Rogelj, J.; De Stercke, S.; et al. A low energy demand scenario for meeting the 1.5 °C target and sustainable development goals without negative emission technologies. Nat. Energy 2018, 3, 515–527. [Google Scholar] [CrossRef]
  21. Pregger, T.; Simon, S.; Naegler, T.; Teske, S. Main Assumptions for Energy Pathways. In Achieving the Paris Climate Agreement Goals: Global and Regional 100% Renewable Energy Scenarios with Non-Energy GHG Pathways for +1.5 °C and +2 °C; Teske, S., Ed.; Springer International Publishing: New York, NY, USA, 2019; pp. 93–130. [Google Scholar]
  22. Lovins, A.B. How big is the energy efficiency resource? Environ. Res. Lett. 2018, 13, 09041. [Google Scholar] [CrossRef] [Green Version]
  23. Teske, S.; Pregger, T.; Naegler, T.; Simon, S.; Pagenkopf, J.; van den Adel, B.; Deniz, Ö. Energy Scenario Results. In Achieving the Paris Climate Agreement Goals: Global and Regional 100% Renewable Energy Scenarios with Non-Energy GHG Pathways for +1.5 °C and +2 °C; Teske, S., Ed.; Springer International Publishing: New York, NY, USA, 2019; pp. 175–401. [Google Scholar]
  24. Gils, H.C.; Simon, S.; Soria, R. 100% renewable energy supply for Brazil—The role of sector coupling and regional development. Energies 2017, 10, 1859. [Google Scholar] [CrossRef] [Green Version]
  25. Xiao, M.; Simon, S.; Pregger, T. Scenario analysis of energy system transition—A case study of two coastal metropolitan regions, eastern China. Energy Strategy Rev. 2019, 26, 100423. [Google Scholar] [CrossRef]
  26. Xiao, M.; Wetzel, M.; Pregger, T.; Simon, S.; Scholz, Y. Modeling the supply of renewable electricity to metropolitan regions in China. Energies 2020, 13, 3042. [Google Scholar] [CrossRef]
  27. Falchetti, G.; Pachauri, S.; Byers, E.; Danylo, O.; Parkinson, S.C. Satellite observations reveal inequalities in the progress and effectiveness of recent electrification in sub-Saharan Africa. One Earth 2020, 2, 364–379. [Google Scholar] [CrossRef]
  28. Müller, R.; Pfeifroth, U.; Träger-Chatterjee, C.; Trentmann, J.; Cremer, R. Digging the METEOSAT Treasure—3 decades of solar surface radiation. Remote Sens. 2015, 7, 8067–8101. [Google Scholar] [CrossRef] [Green Version]
  29. The Renewables.ninja. RE-N DB 2018, online database for hourly time series for solar and wind data for a specific geographical position. Available online: https://www.renewables.ninja/ (accessed on 7 July 2018).
  30. Sask Power. Boundary Dam Carbon Capture Project. Available online: https://www.saskpower.com/Our-Power-Future/Infrastructure-Projects/Carbon-Capture-and-Storage/Boundary-Dam-Carbon-Capture-Project (accessed on 20 March 2020).
  31. Armpriester, A.W.A. Parish Post Combustion CO2 Capture and Sequestration Project; Final Public Design Report for the U.S. Department of Energy, Office of Scientific and Technical Information, 17 February 2017. Available online: https://www.osti.gov/biblio/1344080 (accessed on 20 March 2020).
  32. Global CCS Institute. Global Status of CCS 2019—Targeting Climate Change. (p. 24, Figure 8). Available online: https://www.globalccsinstitute.com/wp-content/uploads/2019/12/GCC_GLOBAL_STATUS_REPORT_2019.pdf (accessed on 20 March 2020).
  33. Fuss, S.; Lamb, W.F.; Callaghan, M.W.; Hilaire, J.; Creutzig, F.; Amann, T.; Beringer, T.; Garcia, W.D.O.; Hartmann, J.; Khanna, T.; et al. Negative emissions—Part 2: Costs, potentials and side effects. Environ. Res. Lett. 2018, 13, 063002. [Google Scholar] [CrossRef] [Green Version]
  34. Turner, P.A.; Mach, K.J.; Lobell, D.B.; Benson, S.M.; Baik, E.; Sanchez, D.L.; Field, C.B. The global overlap of bioenergy and carbon sequestration potential. Clim. Chang. 2018, 148, 1–10. [Google Scholar] [CrossRef] [Green Version]
  35. Griscom, B.W.; Adams, J.; Ellis, P.W.; Houghton, R.A.; Lomax, G.; Miteva, D.A.; Schlesinger, W.H.; Shoch, D.; Siikamäki, J.V.; Smith, P.; et al. Natural climate solutions. Proc. Natl. Acad. Sci. USA 2017, 114, 11645–11650. [Google Scholar] [CrossRef] [Green Version]
  36. Roe, S.; Streck, C.; Obersteiner, M.; Frank, S.; Griscom, B.; Drouet, L.; Fricko, O.; Gusti, M.; Harris, N.; Hasegawa, T.; et al. Contribution of the land sector to a 1.5 °C world. Nat. Clim. Chang. 2019, 9, 817–828. [Google Scholar] [CrossRef]
  37. Teske, S.; Pregger, T.; Simon, S.; Naegler, T.; Pagenkopf, J.; van den Adel, B.; Meinshausen, M.; Dooley, K.; Briggs, C.; Dominish, E.; et al. Methodology. In Achieving the Paris Climate Agreement Goals: Global and Regional 100% Renewable Energy Scenarios with Non-Energy GHG Pathways for +1.5 °C and +2 °C; Teske, S., Ed.; Springer International Publishing: New York, NY, USA, 2019; pp. 25–78. [Google Scholar]
  38. Mackey, B.; Prentice, I.C.; Steffen, W.; House, J.I.; Lindenmayer, D.; Keith, H.; Berry, S. Untangling the confusion around land carbon science and climate change mitigation policy. Nat. Clim. Chang. 2013, 3, 552–557. [Google Scholar] [CrossRef]
  39. Seddon, N.; Turner, B.; Berry, P.; Chausson, A.; Giradin, C. Grounding nature-based climate solutions in sound biodiversity science. Nat. Clim. Chang. 2019, 9, 84–87. [Google Scholar] [CrossRef]
  40. Lewis, S.L.; Wheeler, C.E.; Mitchard, E.T.A.; Koch, A. Regenerate natural forests to store carbon. Nature 2019, 568, 25–28. [Google Scholar] [CrossRef]
  41. Meinshausen, M.; Dooley, K. Mitigation Scenarios for Non-energy GHG. In Achieving the Paris Climate Agreement Goals: Global and Regional 100% Renewable Energy Scenarios with Non-Energy GHG Pathways for +1.5 °C and +2 °C; Teske, S., Ed.; Springer International Publishing: New York, NY, USA, 2019; pp. 79–91. [Google Scholar]
  42. Global Energy Assessment 2012. Annex II, Technical Guidelines: Common Terms, Definitions and Units Used in GEA; Cambridge University Press: Cambridge, UK; New York, NY, USA; International Institute for Applied Systems Analysis: Laxenburg, Austria; p. 1816. Available online: https://www.iiasa.ac.at/web/home/research/Flagship-Projects/Global-Energy-Assessment/GEA_Annex_II.pdf (accessed on 24 March 2021).
  43. International Energy Agency (IEA). Sustainable Recovery—World Energy Outlook Special Report. In Collaboration with the International Monetary Fund; OECD Publishing: Paris, France, 2020; Available online: https://www.iea.org/reports/sustainable-recovery (accessed on 24 March 2021).
  44. Renewable Energy Policy Network for the 21st Century (REN21). Renewables 2020 Global Status Report; REN21 Secretariat: Paris, France, 2020; Available online: https://www.ren21.net/gsr-2020/ (accessed on 24 March 2021).
  45. Wells, C.R.; Sah, P.; Moghadas, S.M.; Pandey, A.; Shoukat, A.; Wang, Y.; Wang, Z.; Meyers, L.A.; Singer, B.H.; Galvani, A.P. Impact of international travel and border control measures on the global spread of the novel 2019 coronavirus outbreak. PNAS 2020, 117, 7504–7509. [Google Scholar] [CrossRef] [Green Version]
  46. International Energy Agency (IEA). Global CO2 Emissions in 2019. Available online: https://www.iea.org/articles/global-co2-emissions-in-2019 (accessed on 11 February 2020).
  47. Arneth, A.; Sitch, S.; Pongratz, J.; Stocker, B.D.; Ciais, P.; Poulter, B.; Bayer, A.D.; Bondeau, A.; Calle, B.P.L.; Chini, L.P.; et al. Historical carbon dioxide emissions caused by land-use changes are possibly larger than assumed. Nat. Geosci. 2017, 10, 79–84. [Google Scholar] [CrossRef]
  48. Heck, V.; Gerten, D.; Lucht, W.; Popp, A. Biomass-based negative emissions difficult to reconcile with planetary boundaries. Nat. Clim. Chang. 2018, 8, 151–155. [Google Scholar] [CrossRef]
  49. Intergovernmental Panel on Climate Change (IPCC). Climate Change and Land; IPCC: Geneva, Switzerland, 2019; Available online: https://www.ipcc.ch/srccl/ (accessed on 24 March 2021).
  50. Renewable Energy Policy Network for the 21st Century (REN21). Renewables 2019 Global Status Report; REN21 Secretariat: Paris, France, 2019; Available online: https://www.ren21.net/gsr-2019/ (accessed on 30 March 2020).
  51. International Renewable Energy Agency. Renewable Energy Statistics 2020. Available online: https://www.irena.org/Statistics/ (accessed on 24 March 2021).
  52. Brown, T.; Schlachtberger, D.; Kies, A.; Schramm, S.; Greiner, M. Synergies of sector coupling and transmission reinforcement in a cost-optimised, highly renewable European energy system. Energy 2018, 160, 720–739. [Google Scholar] [CrossRef] [Green Version]
  53. Borowski, P.F. Zonal and Nodal Models of Energy Market in European Union. Energies 2020, 13, 4182. [Google Scholar] [CrossRef]
  54. Trieb, F.; Schillings, C.; Pregger, T.; O’Sullivan, M. Solar electricity imports from the Middle East and North Africa to Europe. Energy Policy 2012, 42, 341–353. [Google Scholar] [CrossRef]
  55. Pregger, T.; Lavagno, E.; Labriet, M.; Seljom, P.; Biberacher, M.; Blesl, M.; Trieb, F.; O’Sullivan, M.; Gerboni, R.; Schranz, L.; et al. Resources, capacities and corridors for energy imports to Europe. Int. J. Energy Sector Manag. 2011, 5, 125–156. [Google Scholar] [CrossRef]
  56. Dii Desert Energy. A North Africa—Europe Hydrogen Manifesto. 2019. Available online: https://dii-desertenergy.org/wp-content/uploads/2019/12/Dii-hydrogen-study-November-2019.pdf (accessed on 1 October 2020).
  57. PV Magazine. Australia and Japan Agree to Hydrogen Future. 24 January 2020 Blake Matich. Available online: https://www.pv-magazine-australia.com/2020/01/24/australia-and-japan-agree-to-hydrogen-future/ (accessed on 10 October 2020).
  58. European Commission. A Hydrogen Strategy for a Climate-neutral Europe. Brussels, 8.7.2020 COM(2020) 301 final. Available online: https://ec.europa.eu/energy/sites/ener/files/hydrogen_strategy.pdf (accessed on 12 October 2020).
  59. Timmerberg, S.; Kaltschmitt, M. Hydrogen from renewables: Supply from North Africa to Central Europe as blend in existing pipelines—Potentials and costs. Appl. Energy 2019, 237, 795–809. [Google Scholar] [CrossRef]
  60. Xiao, M.; Simon, S.; Pregger, T. Energy System Transitions in the Eastern Coastal Metropolitan Regions of China—The Role of Regional Policy Plans. Energies 2019, 12, 389. [Google Scholar] [CrossRef] [Green Version]
  61. Jacobson, M.Z.; Delucchi, M.A.; Bauer, Z.A.; Goodman, S.C.; Chapman, W.E.; Cameron, M.A.; Bozonnat, C.; Chobadi, L.; Clonts, H.A.; Enevoldsen, P.; et al. 100% Clean and Renewable Wind, Water, and Sunlight All-Sector Energy Roadmaps for 139 Countries of the World. Joule 2017, 1, 108–121. [Google Scholar] [CrossRef] [Green Version]
  62. Breyer, C.; Bogdanov, D.; Aghahosseini, A.; Gulagi, A.; Child, M.; Oyewo, A.S.; Farfan, J.; Sadovskaia, K.; Vainikka, P. Solar photovoltaics demand for the global energy transition in the power sector. Prog. Photovolt. 2018, 26, 505–523. [Google Scholar] [CrossRef]
  63. Meinshausen, M.; Raper, S.C.B.; Wigley, T.M.L. Emulating coupled atmosphere-ocean and carbon cycle models with a simpler model, MAGICC6—Part 1: Model description and calibration. Atmos. Chem. Phys. 2011, 11, 1417–1456. [Google Scholar] [CrossRef] [Green Version]
  64. Meinshausen, M.; Hare, B.; Wigley, T.M.L.; van Vuuren, D.; den Elzen, M.G.J.; Swart, R. Multi-gas emission pathways to meet climate targets. Clim. Chang. 2006, 75, 151–194. [Google Scholar] [CrossRef] [Green Version]
  65. DeCicco, J.M.; Schlesinger, W.H. Reconsidering bioenergy given the urgency of climate protection. Proc. Natl Acad. Sci. USA 2018, 115, 9642–9645. [Google Scholar] [CrossRef] [PubMed] [Green Version]
  66. Luyssaert, S.; Schulze, E.-D.; Börner, A.; Knohl, A.; Hessenmöller, D.; Law, B.E.; Ciais, P.; Grace, J. Old-growth forests as global carbon sinks. Nature 2008, 455, 213–215. [Google Scholar] [CrossRef]
  67. Houghton, R.A.; Nassikas, A.A. Negative emissions from stopping deforestation and forest degradation, globally. Glob. Chang. Biol. 2018, 24, 350–359. [Google Scholar] [CrossRef]
  68. Keith, H.; Mackey, B.G.; Lindenmayer, D.B. Re-evaluation of forest biomass carbon stocks and lessons from the world’s most carbon-dense forests. Proc. Natl Acad. Sci. USA 2009, 106, 11635–11640. [Google Scholar] [CrossRef] [Green Version]
  69. Liu, Y.Y.; Van Dijk, A.I.J.M.; De Jeu, R.A.M.; Canadell, J.G.; McCabe, M.F.; Evans, J.P.; Wang, G. Recent reversal in loss of global terrestrial biomass. Nat. Clim. Chang. 2015, 5, 470–474. [Google Scholar] [CrossRef]
  70. International Energy Agency (IEA). World Energy Balances 2017; OECD Publishing: Paris, France, 2017. [Google Scholar] [CrossRef]
  71. Pagenkopf, J.; van den Adel, B.; Deniz, Ö.; Schmid, S. Transport Transition Concepts. In Achieving the Paris Climate Agreement Goals: Global and Regional 100% Renewable Energy Scenarios with Non-Energy GHG Pathways for +1.5 °C and +2 °C; Teske, S., Ed.; Springer International Publishing: New York, NY, USA, 2019; pp. 131–159. [Google Scholar]
  72. Schlenzig, C. Energy planning and environmental management with the information and decision support system MESAP. Int. J. Glob. Energy Issues 1998, 12, 81–91. [Google Scholar] [CrossRef]
  73. Seven2one. Mesap/PlaNet Software Framework; Seven2one Modelling, Mesap4, Release 4.14.1.9; Seven2one Informationssysteme GmbH: Karlsruhe, Germany, 2012. [Google Scholar]
  74. Simon, S.; Naegler, T.; Gils, H.C. Transformation towards a renewable energy system in Brazil and Mexico—Technological and structural options for Latin America. Energies 2018, 11, 907. [Google Scholar] [CrossRef] [Green Version]
  75. Dunstan, C.; Fattal, A.; James, G.; Teske, S. Towards 100% renewable energy for Kangaroo Island; UTS-ISF: Sydney, Australia, 2016; Prepared by the Institute for Sustainable Futures, University of Technology Sydney (with assistance from AECOM); Final report prepared for ARENA, Renewables SA, and Kangaroo Island Council. [Google Scholar]
  76. Teske, S. Bridging the Gap between Energy and Grid Models, Developing an Integrated Infrastructural Planning Model for 100% Renewable Energy Systems in order to Optimize the Interaction of Flexible Power Generation, Smart Grids and Storage Technologies. Ph.D. Thesis, University of Flensburg, Frensburg, Germany, 2015. [Google Scholar]
  77. James, G.; Rutovitz, J.; Teske, S. Storage Requirements for Reliable Electricity in Australia; University of Technology Sydney, UTS-ISF: Sydney, Australia, 2017; Report prepared by the Institute for Sustainable Futures for the Australian Council of Learned Academies. [Google Scholar]
  78. Teske, S.; Morris, T.; Nagrath, K. 100% Renewable Energy for Tanzania—Access to Renewable Energy for all Within one Generation; University of Technology Sydney, UTS-ISF: Sydney, Australia, 2017; Report prepared by ISF for Bread for the World. [Google Scholar]
  79. Central Intelligence Agency Library. World Factbook, Online Database. Available online: https://www.cia.gov/library/publications/the-world-factbook/fields/2195.html (accessed on 7 July 2018).
  80. Pfenninger, S.; Staffell, I. Long-term patterns of European PV output using 30 years of validated hourly reanalysis and satellite data. Energy 2016, 114, 1251–1265. [Google Scholar] [CrossRef] [Green Version]
  81. Staffell, I.; Pfenninger, S. Using bias-corrected reanalysis to simulate current and future wind power output. Energy 2016, 114, 1224–1239. [Google Scholar] [CrossRef] [Green Version]
Figure 1. Final energy demand per sector, gross power demand (upper panel), and primary energy supply, including non-energy use (bottom panel), in the scenarios.
Energies 14 02103 g001
Figure 2. Selected regional characteristics of energy demand and supply in the 1.5 °C Scenario in 2050.
Energies 14 02103 g002
Figure 3. Annual CO2 emissions reductions in the 2.0 °C (left) and 1.5 °C Scenarios (right) in relation to the 5 °C (REF) Scenario according to the measures implemented. Renewable energies and efficiency measures (including efficiency improvements through electrification) are roughly equally important in all the scenarios. Reduced consumption has an even greater role in the 1.5 °C Scenario. Other conversions (*) include changes in district heating, refineries, coal transformation, and gas transport.
Energies 14 02103 g003
Figure 4. Increases in the average calculated load by 2050 in 72 regions under the 1.5 °C Scenario, in percentages relative to 2020. The average load was calculated across 8760 h per year. The regional ratios between the maximum and minimum loads vary significantly. ‘Residual load’ in this analysis is the load remaining after the generation of variable renewable power. Negative values indicate that the power generated from solar and wind exceeds the actual load and are exported to other regions, stored, or curtailed. The residual load varies significantly with increased variable generation because maximum load and maximum generation do not occur simultaneously.
Energies 14 02103 g004
Figure 5. Annual and cumulative CO2 emissions under the 1.5 °C Scenario by region and sector; additional cumulative CO2 emissions if implementation is delayed (5, 7, or 10 years); and carbon sinks from land, oceans, and additional land restoration. Additional cumulative CO2 emissions by region and sector were calculated on the assumption that CO2 emissions will remain flat for this region and/or sector for the corresponding time period. Annual emissions are compared between the 1.5 °C pathway and the delayed implementation pathway, and the difference is summed over the entire period (2015–2060).
Energies 14 02103 g005
Figure 6. Interaction of the models used in this study.
Energies 14 02103 g006
Table 1. Main strategies and narratives for all regions in each sector of the energy system for the 2.0 °C and 1.5 °C Scenarios compared with the Reference Scenario.
SectorMain Strategies and Narratives with Different Regional Emphases and CharacteristicsGlobal Average sectoral Demand Intensity
Industry
electricity
Implementation of more-efficient appliances, especially electric drives for compressed air, pumps, fans, and other cross-sectional technologies.kWh/USD1000 GDP
2015: 55
2050 REF: 36
2050 2.0 °C: 24
2050 1.5 °C: 23
Industry
heating
Electrification of industrial heat will increase from 6% to 34% in 2050 in the 2.0 °C Scenario and to 37% in the 1.5 °C Scenario. Technological improvements, process substitutions, and innovations will be encouraged by favourable conditions and regulative frameworks, allowing rapid technological changes. Integration of waste heat into processes will reduce losses.MJ/USD1000 GDP
2015: 690
2050 REF: 366
2050 2.0 °C: 185
2050 1.5 °C: 172
Other sectors (*) electricityElectricity demand intensities in households, for commercial purposes, and in the service and trade sectors, fisheries, and agriculture will be reduced by the use of most-efficient technologies for lighting, information, communication, cooking, cooling, and hot water. Compared with the REF case, a reduction in specific consumption (depending on region, a slower increase resp.) is assumed for the 1.5 °C pathway over the medium term, as long as fossil power generation dominates.kWh/USD1000 GDP
2015: 78
2050 REF: 60
2050 2.0 °C: 38
2050 1.5 °C: 37
kWh/capita
2015: 1350
2050 REF: 2370
2050 2.0 °C: 1500
2050 1.5 °C: 1460
Other sectors (*) heatingShare of electric heating will rise from 5% in 2015 to 30% in 2050 in the 2.0 °C Scenario and to 37% in the 1.5 °C Scenario. Final energy use for heating will be reduced and switching heating to low-temperature technologies, such as heat pumps and floor heating. These measures are supplemented with responsible consumption behavior by the consumer, especially in the 1.5 °C Scenario.MJ/USD1000 GDP
2015: 700
2050 REF: 300
2050 2.0 °C: 180
2050 1.5 °C: 170
MJ/head
2015: 12,600
2050 REF: 11,700
2050 2.0 °C: 7300
2050 1.5 °C: 6700
TransportMain strategies include electrification and synthetic fuels (hydrogen and synthetic liquid hydrocarbons), depending on the transportation mode. Mode shifts from road and air to more-efficient rail and bus will reduce the share of energy-intensive motorized private transport. Efficiency gains for engines and a moderate use of biofuels will also help to achieve rapid and strong emissions reductions.MJ/USD1000 GDP
2015: 760
2050 REF: 380
2050 2.0 °C: 130
2050 1.5 °C: 100
MJ/head
2015: 13,000
2050 REF: 15,000
2050 2.0 °C: 5100
2050 1.5 °C: 3900
Narratives are similar in all regions, whereas the demand intensities differ significantly—for both the base year 2015 and the end of the modelling period in 2050. (*) Other Sectors include buildings (residential, commercial, and public services) and the agricultural, forestry, and fishing sectors.
Table 2. Proportions of the final sectoral energy demands met by electricity under the 1.5 °C Scenario. Colors indicate the different electrification shares where red is lower and green is higher.
20152020202520302035204020452050
DEMAND
Transport Electricity Share [%]
OECD North America0%0%5%18%35%45%51%54%
Latin America0%0%2%9%36%48%53%53%
OECD Europe0%0%6%35%57%67%65%65%
Africa0%0%1%3%12%19%25%31%
Middle East0%0%1%4%21%32%38%41%
Eurasia0%1%3%13%39%44%47%46%
Non-OECD Asia0%0%3%10%29%35%37%37%
India0%1%5%22%47%58%57%57%
China4%4%10%29%52%62%60%60%
OECD Pacific0%0%8%33%58%61%62%63%
Global average1%1%5%17%38%46%49%50%
DEMAND
Industry Electricity Share [%]
OECD North America29%28%28%32%40%49%51%55%
Latin America23%23%25%29%33%40%47%56%
OECD Europe35%35%36%39%43%46%48%51%
Africa26%25%26%30%36%42%47%52%
Middle East9%10%12%16%22%30%36%44%
Eurasia23%24%23%30%35%40%43%45%
Non-OECD Asia24%25%25%31%37%40%45%49%
India18%20%21%29%38%48%54%56%
China26%29%32%38%47%55%58%61%
OECD Pacific35%36%36%41%46%50%53%56%
Global average26%27%28%33%40%47%51%54%
DEMAND
Buildings Electricity Share [%]
OECD North America50%49%50%55%57%58%60%61%
Latin America38%40%44%48%55%62%69%76%
OECD Europe31%33%34%38%47%49%51%53%
Africa8%8%11%15%22%32%40%49%
Middle East43%46%48%51%54%59%68%75%
Eurasia18%19%20%23%26%28%31%35%
Non-OECD Asia22%24%25%31%40%48%56%61%
India17%19%26%34%43%55%61%69%
China24%27%32%41%53%58%63%66%
OECD Pacific52%53%54%55%56%62%63%64%
Global average30%31%33%38%45%50%55%60%
GENERATION
Renewable Electricity Share [%]
OECD North America10%12%35%65%86%96%99%100%
Latin America33%39%53%67%84%96%100%100%
OECD Europe17%20%34%56%71%87%95%100%
Africa58%57%62%68%79%90%99%100%
Middle East1%4%13%27%54%79%99%100%
Eurasia6%9%21%41%62%79%91%100%
Non-OECD Asia32%31%43%62%77%86%95%100%
India36%33%46%65%82%91%97%100%
China12%16%29%49%70%83%93%100%
OECD Pacific6%11%25%49%71%85%94%100%
Global average18%21%35%56%74%88%96%100%
Table 3. Carbon intensity by sector under the 1.5 °C Scenario. Carbon intensities for the industry, building, and transport sectors exclude the electricity consumed in these sectors. The prerequisites for reduced carbon intensity in the industry sector include infrastructural changes, such as renewables-based process heat generation technologies and co-generation. For the transport sector, infrastructural changes are required, such as charging networks for electric vehicles and the expansion of electricity-based public transport. The colour indicates the different carbon intensities by sector and region where red is high, yellow more average values and green low carbon intensity.
t CO2/PJ20152020202520302035204020452050
OECD North AmericaTRANSPORT30,56729,23919,312913429947122220
Latin America24,08622,26017,31712,460468231950
OECD Europe21,35320,01815,026535215631800
Africa14,02313,80013,21912,615896952744010
Middle East24,55624,67021,16417,1438102235360
Eurasia12,57112,69511,301830028611160
Other Non-OECD Asia19,30519,67316,56011,1174322126900
India11,29712,30010,5875288176551300
China11,91413,71110,3076964250833420
OECD Pacific22,47520,66213,4326623200744500
Global average19,64819,33114,482887836411057750
OECD North AmericaINDUSTRY42,07243,61135,09421,50411,57842478530
Latin America36,94532,81322,41413,092632821771250
OECD Europe40,39338,71632,52623,71316,86110,11537960
Africa37,22835,76528,76717,58210,53733841910
Middle East55,43251,50946,87638,93030,22317,3739070
Eurasia44,48242,27429,36019,19814,782987750000
Non-OECD Asia51,42251,06939,17024,97313,618897939350
India52,44351,84040,14724,76911,766621427820
China83,73481,91068,45051,48030,65518,20377270
OECD Pacific47,58746,81037,40626,34916,443835637020
Global average58,94156,88246,11632,11718,83710,48538700
OECD North AmericaBUILDINGS28,81328,15819,28710,3533829930420
Latin America24,86919,53914,0389339531313711670
OECD Europe32,81030,84023,20013,9979554500219710
Africa81127962626544992819779770
Middle East32,69031,17127,76323,07017,40384893130
Eurasia13,24113,02081393469281218918780
Non-OECD Asia19,64819,33114,482887836411057750
India16,92614,36391115303167212356400
China35,07830,32120,0076094474512422690
OECD Pacific29,44228,00423,32617,9438146479915090
Global average25,90723,92516,9469702574224626310
OECD North AmericaPOWER139,196125,78650,18714,120575115771190
Latin America78,28254,04626,63310,8384470156300
OECD Europe97,36773,32340,25422,91216,018705626080
Africa204,093173,995109,77352,02016,70629781560
Middle East213,418203,593144,46786,34222,91757182430
Eurasia208,031157,983109,22556,85836,44823,75311,0150
Non-OECD Asia177,243168,41592,10033,04922,21314,11354170
India279,508234,522116,94552,29921,537389414730
China142,179115,01677,62634,7668703472622160
OECD Pacific155,566116,40769,03233,20116,62811,49853440
Global average150,579127,40174,48534,76314,788642323530
Table 4. Net carbon mitigation from land-use management pathways for 1.5 °C: 2020–2100.
Region [42]Gt C/year202020302040205020602070208020902100
AsiaLAND-USE0.300.05−0.32−0.36−0.35−0.30−0.25−0.16−0.10
Eastern Europe and
Former Soviet Union (REF)
0.00−0.13−0.27−0.28−0.27−0.26−0.25−0.22−0.19
Middle East
and Africa (MAF)
0.33−0.19−0.55−0.57−0.53−0.42−0.29−0.14−0.06
OECD 1990 Countries
(OECD 90)
0.00−0.18−0.34−0.34−0.32−0.28−0.23−0.18−0.14
Latin America and
Caribbean (LAM)
0.17−0.27−0.62−0.62-−0.55−0.42−0.27-−0.14−0.06
Annual global total0.79−0.81−2.11−2.17−2.01−1.68−1.28−0.84−0.56
Cumulative global total0.790.63−15.35−37.17−58.20−76.65−91.18−101.48−108.25
Publisher’s Note: MDPI stays neutral with regard to jurisdictional claims in published maps and institutional affiliations.

