Article

Implementing Smart City Technologies to Inspire Change in Consumer Energy Behaviour

1
Institute of Physical Energetics, Krivu Street 11, LV-1006 Riga, Latvia
2
Department of Informatics, State University of Maringá, Maringá 87020-900, PR, Brazil
3
INESC P&D Brasil, Santos 11055-300, SP, Brazil
4
Programa de Investigación Radio Digital, Universidad Tecnológica Metropolitana, Jose Pedro Alessandri, 1242, Santiago 7750000, Chile
5
Departamento de Ingeniería Informática y Cs. de la Computación, Universidad de Atacama, Av. Copayapu 485, Copiapó 1530000, Chile
6
Departamento de Ingeniería Eléctrica, Universidad de Concepción, Victor Lamas 1290, Concepción 4089100, Chile
7
Electrical Engineering Faculty, University Politehnica of Bucharest, 313 Splaiul Independentei, RO060042 Bucharest, Romania
8
Department of Electrical Engineering, Federal University of Santa Catarina, Florian ó polis 88040-380, SC, Brazil
9
Department of Electrical Engineering, Federal University of Ceara, Fortaleza 60455-760, CE, Brazil
*
Author to whom correspondence should be addressed.
Energies 2021, 14(14), 4310; https://doi.org/10.3390/en14144310
Submission received: 17 June 2021 / Revised: 11 July 2021 / Accepted: 14 July 2021 / Published: 17 July 2021
(This article belongs to the Special Issue Energy Efficiency and Behavioral Change through ICT)

Abstract

:
One of the main challenges in smart city models is consumer behaviour, namely guiding the efforts to promote optimal use of energy in the dynamics of the developing cities, through lower energy consumption without impact on the comfort level. This relates to all energy vectors and can be done through different means. The uptake stage of smart metering and information and communication technologies (ICT) varies in different countries, creating the need for tailored innovative approaches in motivating behavioural change. This paper presents the work carried out within the joint research project ITCity (an ICT platform for sustainable energy ecosystem in smart cities) between the European Union and Latin American Countries. Cooperation of energy researchers and experts in ICT and application developers facilitates adoption of a multipurpose interdisciplinary approach. This work aims at providing the smart city and energy research and innovation community broader understanding of factors influencing adoption of energy efficiency technologies. Different ways of guiding optimal energy use are addressed elaborating on the building blocks for a smart city which consider load patterns based on high resolution, high reporting rate measurements, extensive consumer surveys, available communication solution analysis and end-user interaction with the ICT tool based on gamification principles.

1. Introduction

The development of cities increasingly in tune with technological modernity and aiming to improve the quality of life of their inhabitants is a central issue of national and local public policies of demographic settlements. Strategic principles cities adopt in efforts to become smarter are very dependent on the local context [1]. For this, it is necessary to know how countries are creating and implementing a regulatory framework and establishing promotion policies and how cities are using available infrastructures, mainly smart meters and information communications technologies (ICTs), to involve their inhabitants in related initiatives. While technology plays an important role, smart city development is not limited to harnessing technological base, it is rather about using technology to make better decisions and improve the quality of life [2]. Hence, the methodology used to implement the work presented here includes elaborating on the following building blocks:
  • Social and environmental policies’ political commitment to develop smart cities supports connection of technological tools, especially ICT, with social, economic and environmental benefits to achieve “smartness” and deliver a better quality of life for citizens.
  • Technological base, including sensors and actuators: widespread sensors enable cities to collect accurate measurement data about different cities’ systems (e.g., energy grid or transportation, in real time).
  • The capacity of communication channels: telecommunication networks, whether wired, optical or wireless, were designed for human or person-to-person communications, in order to be able to follow a business model and an operational-functional capacity of the network and always thinking of covering cities of a few square kilometres per thousand inhabitants and bandwidth in Megabits per seconds. If an intelligent city with Internet of Things (IoT) or Machine-to-Machine (M2M) is imagined, the number of new users could be so high that it could quickly saturate the communication network. Therefore, a design and an adequate administration of the resources of the communication network becomes important and necessary to consider while planning a smart city.
  • Broad adoption and the user experience: users at different levels of activity can become active participants, both using the information provided on the different platforms and adopting technologies and uploading information to the network or intelligent platforms of the city.
The work presented in this paper describes a collaborative research project on an ICT platform for sustainable energy ecosystem in smart cities (ITCity) that specifically aims at exploring the ways of engaging consumers in increasing energy efficiency [3]. The evidence received from the energy efficiency projects confirms that well designed gamification tools can inspire end users to change their energy behaviour in longer periods [4]. Furthermore, frequently provided feedback on energy consumption has proven to be effective in attempts to encourage energy savings [5]. At the same time, literature confirms that even when resources do not allow for collection of primary behavioural data, existing survey projects and insights from behavioural science can still help in empirical assumption consumption pattens [6]. These observations together with understanding of deviations in the situation in the state of the art of smart cities in different countries emerged into the unique idea of the project—to design a mechanism of raising consumer awareness, promoting more efficient energy use and increasing predictability of electricity consumption mainly at end-user level in situations when extensive metering infrastructure is not sufficiently developed. This was implemented by establishing a small-scale smart-metering pilot allowing in-depth analysis of electricity consumption profiles based on collected high resolution data in conjunction with extensive consumer surveys [7] and then elaborating on design of gamification tool. In parallel, analysis and simulation of communication solutions as the integral building block of the smart city uncovering important characteristics that might be considered was performed.
The cooperation between the European Union (EU) and Latin American, Caribbean (LAC) countries has a potential to provide valuable knowledge and experience exchange for all parties involved. The ITCity project brought together researchers and experts from different areas relevant to urban development to cooperatively investigate the energy related aspects of smart city solutions with a focus on the well-being of cities’ inhabitants. Partners from the EU (Latvia and Romania) represented energy experts but partners from LAC (Brazil, Chile and Barbados) served as experts in ICT Small and Medium Enterprise (SME) and applications developers. While intermediary results of the work are well explained in respective publications [7,8,9], this paper aims to present outcomes of successful intercontinental collaboration and provide the research community insights into tailored approaches in advancing energy efficiency.
The paper is structured as follows: Section 2 addresses relevant political and legislative trends in EU and LAC. Section 3 outlines an implementation and results of smart metering pilot in Romania. Section 4 describes the proposed user behaviour assessment tool and Section 5 presents analysis and simulation of communication solutions. Finally, Section 6 presents the conclusions and proposes directions for the future research.

2. EU and LAC Policy and Legal Context for Smart Cities

European smart city policies are linked with ambitious energy and climate targets for 2030 [10] and long-term objective to reach climate-neutrality by 2050 [11,12]. Specifically, the legislative framework “Clean energy for all Europeans package” (CEP) builds on the principles of “energy efficiency first” and a consumer in the centre of energy transition [11], both highly relevant to the smart city concept. Furthermore, it is obvious that advanced, interoperable ICT solutions are in the core of a smart city. Thus, smart city policies are also clearly linked with digital transformation in Europe [13].
The principle “Energy efficiency first” is embedded in multiple CEP’s legislative acts [14,15,16,17,18]. It is clearly stated as one of the five pillars of Energy Union and is acknowledged as an energy source, representing the value of energy saved [19].
With the introduction of CEP, consumers have been put in the centre of energy system for the first time. By unlocking both technological and social innovation, the new rules aim at utilising all aspects of human potential to drive the energy transition [11]. Engaging consumers is not a simple task as consumer behaviours for energy efficiency solutions are highly complex with broad diversity in perceptions, attitudes and preferences [20]. Smart city solutions incentivise citizens to adopt smarter ways of living and transform them from users into city service providers [21]. Meanwhile, smart meters and in-home displays have a strong potential to raise consumer awareness on energy consumption patterns, energy management services cannot be enabled just by simply installing these devices. It appears that smart meters have not been as effective as originally intended mostly because consumer attitudes and opinions were not considered [22]. Hence, innovative software products and education programs are required to fully exploit smart metering potential contribution to energy efficiency and energy savings.
As for large-scale roll-out of smart meters in Europe, Member States were required to ensure the implementation of smart metering under EU the Third Energy Package [23]: in cases where the cost-benefit analysis is positive, there was a roll-out target of 80% market penetration for electricity by 2020. The new electricity market directive [15] updates and complements those provisions. Now European countries are at different stages of deployment of smart meters for residential electricity customers. In EU, in 2018, 35% of all household electricity metering points were equipped with a smart meter [24]. By 2030, it is expected that almost 92% of European small-scale consumers (households and SMEs) will have a smart meter for electricity [24]. As for European countries involved in the ITCity project, the defined national target is 100% smart meters nation-wide in 2022 for Latvia and in 2024 for Romania [24] with the process being ongoing in both countries and with good results in large, developed cities.
Specifically in Romania, the deployment of smart meters for billing purposes is ongoing. While the process is not as fast as first envisioned, since the market liberalisation the end users have been highly motivated to support it. In parallel, an increased number of households are being independently equipped with smart plugs, smart home applications and other IoT devices. This illustrates that even with the current flat rate for electric energy, the end users are aware of the significance of their consumption behaviour. Hence, there is a potential for implementation of energy efficiency programs and then, in the next stage, accelerating smart city initiatives.
There is a broad range of established collaborations on smart cities in Europe. Major initiatives are Smart Cities Marketplace, The Covenant of Mayors for Climate and Energy—Europe and The European Energy Award (EEA). Research and innovation activities focused on accelerating the development and deployment of low-carbon technologies in Europe are guided by the European Strategic Energy Technology Plan (SET Plan) [25]. Therefore, it has brought together detailed implementation plans in key priorities, described briefly under the headlines: renewable energy sources (solar, geothermal, ocean and offshore wind) and storage, efficient energy systems for buildings and industry, renewable fuels and bioenergy, carbon capture, utilisation and storage, nuclear safety and positive energy districts. The implementation plan of the SET plan action devoted to smart cities intends to support the planning, deployment and replication of 100 Positive Energy Districts (PEDs) by 2025 for sustainable urbanisation [26]. It is supported by European Energy Research Alliance (EERA) Joint Programme on Smart Cities. PEDs projects are developed and funded through Horizon 2020 Lighthouse Projects and in projects where Member States cooperate through the Urban Europe Joint Programming Initiative (JPI) on PEDs. Besides, the goal of the new Horizon Europe Mission on “Climate-Neutral and Smart Cities” is to maintain, develop and give evident cases of 100 European cities in their transformation towards climate mitigation by 2030 and make these cities into experimentation and innovation hubs.s [27].
Cities play a leading role in economic and demographic development of LAC, where two-thirds of the gross domestic product of the countries is generated in urban centres and eight out of every ten people reside in urban areas [28]. LAC countries and cities are among the most unequal in the world [28,29]. Therefore, the process of national urban policy development in LAC is characterized by innovative and committed efforts towards addressing social inequalities [30]. LAC countries have shown political commitment towards the 2030 Agenda and its 17 Sustainable Development Goals (SDGs) developed by United Nations [29,31]. While SDG 11 explicitly addresses sustainable cities and communities, smart cities address many other SDGs, including SGD 13 on climate action and SGD on affordable and clean energy.
It is expected that by 2040, the primary energy demand of the entire LAC region will be at least 80% higher than it is today [32]. As regards electricity needs, they are expected to increase by more than 91% [32]. The region’s growing material intensity and carbon intensity is rooted in its very low technological base [29,32]. Cities in Latin America are lagging particularly in installing the sensor layer, which is considered as the most capital-intensive aspect of smart city development [2].
Despite multiple benefits offered by the deployment and use of smart meters, most developing countries in LAC, e.g., Brazil, still hold on to standalone energy meters. In Brazil, so far, the development and application of smart metering—and related smart grids—has been mostly restricted to research [33] and relatively isolated groups of consumer units (cities) [34]. In Chile, the electrical regulation in distribution published in December 2017 made it mandatory for the electrical distribution companies to change all the measuring equipment by smart meters gradually increasing until 100% in the year 2024. However, making the installation voluntary and paid by the customer has lowered rates of smart-meter adaptation. The changes in the energy matrix, with large participation of wind and photovoltaic energy, were not translated into the changes in consumption culture. Thus, improving energy efficiency and changing consumption patterns is the key priority in decoupling economic growth from resource use. In the situation of insufficiently developed smart metering systems, elaborating on alternative solutions allowing participants to make more informed decisions is the top priority. The ITCity project’s proposed solution is an end-user energy consumption habit assessment based on gamification—usage of game mechanics and game thinking in serious contexts [35,36,37].

3. Smart Meter Implementation in Bucharest Pilot

A smart meter pilot was developed on the part of the campus of University Politehnica of Bucharest (UPB). At the beginning of the project there was no smart electricity metering infrastructure available on site. The baseline situation was that the energy bill was being issued based on total electricity consumption in the campus, with identification of energy consumption limited to commercial customers (e.g., restaurants, clubs, shops, etc.).
As it was not possible to install a smart meter per every user (room) due to legacy infrastructure, the solution was based on Smart Low-Cost Advanced Meters (SLAM), single phase meters that were developed within the NobelGrid project [38] and Unbundled Smart Meters (USM), three phase meters which contain a single Smart Meter extension (SMX) connected to a LandisGyr three phase meter. To cover the energy supply of five student buildings, 39 SLAMS and 12 USMs were installed. In every dorm there are three SLAMs or one USM deployed per floor, monitoring a total of almost 2000 students in an aggregated, anonymized way, thus demonstrating the strategy which can be replicated for situations were various technical and financial limitations exist.
The concept behind the development of the pilot site is based on demonstrating the new patterns of residential consumption, very different from the classical, predefined load curves that are based only on statistical assumptions. These new patterns of consumption can be used in a variety of applications ranging from consumer clustering to demand response algorithms and from load forecasting to contractually binding consumption patterns between energy communities and utilities [39]. In the context of the envisioned solution the information can be used as benchmarking data for the gamification tool and for defining the scenarios behind the serios game algorithms.
Going beyond the possible application of these patterns and trying to identify why they are highly different from the classical and theoretical ones, at least two main possible causes can be identified:
  • The types of appliances that are currently in use in households are very different from those present not only a couple of decades ago but even a year or two ago. Mostly resistive loads are replaced with electronics and static converter interfaced loads.
  • The new generation of household owners represented by technical university students [40] have other behavioural patterns than their parents and grandparents (e.g., they have jobs with flexible hours, they cook less at home, play more online games, etc.). It is to be mentioned that the presented results do not consider the work from home phenomena more and more present starting in 2020.
As part of the project, data from the meters in the pilot site were measured continuously from July 2018 until the COVID-19 lockdown in the spring of 2020 that implied the forced move of the students’ off-campus.
Studied applications for these specific meter data included, but were not limited to, evaluation of dorms carbon footprint, monitoring power quality, utilising data as input for control algorithms for hybrid microgrids in local energy communities [41] and developing unique indicators of energy usage [9].

4. User Consumption Habit Assessment Tool

4.1. Gamification Tool

Despite the widespread introduction of smart meters, some countries still deliberately put on hold a mass roll out due to different reasons, for example, data protection. Such decisions do not only complicate the collection of information for decision-making in energy management but also trigger the development of other approaches that could positively influence consumer habits. Studies confirmed that user behaviour has a significant impact on energy consumption and efficiency in residential and commercial buildings and the provided feedback can motivate consumers to use less energy [5,42]. One of the possible solutions to change user behaviour is creating a mobile ICT tool based on gamification principles. Here, inspired by one of the first examples of gamification usage, i.e., the toy Tamagotchi, and modern approaches [43,44,45], we proposed a tool based on a game to collect data that support improvements of the consumption behaviour of users and the prediction of energy demand.
Multiple aspects shall be considered while developing the mobile gamification tool:
  • Interaction with the tool—represented by application user and its manager. It incorporates initialization, login and game, groups and social interaction.
  • Interaction with the game—represents the main mechanics for user interaction with the game tool.
  • Mobile user interface—it is composed of sign in/social login, device setup, localization, chat, challenges, ranking, etc.
  • Web-based user interface—utility used by the tool manager to analyse aggregated information.
  • Tool database—details the structure and contents of the elements within the database, specifying data field, data type, description, details and data cross-interaction.
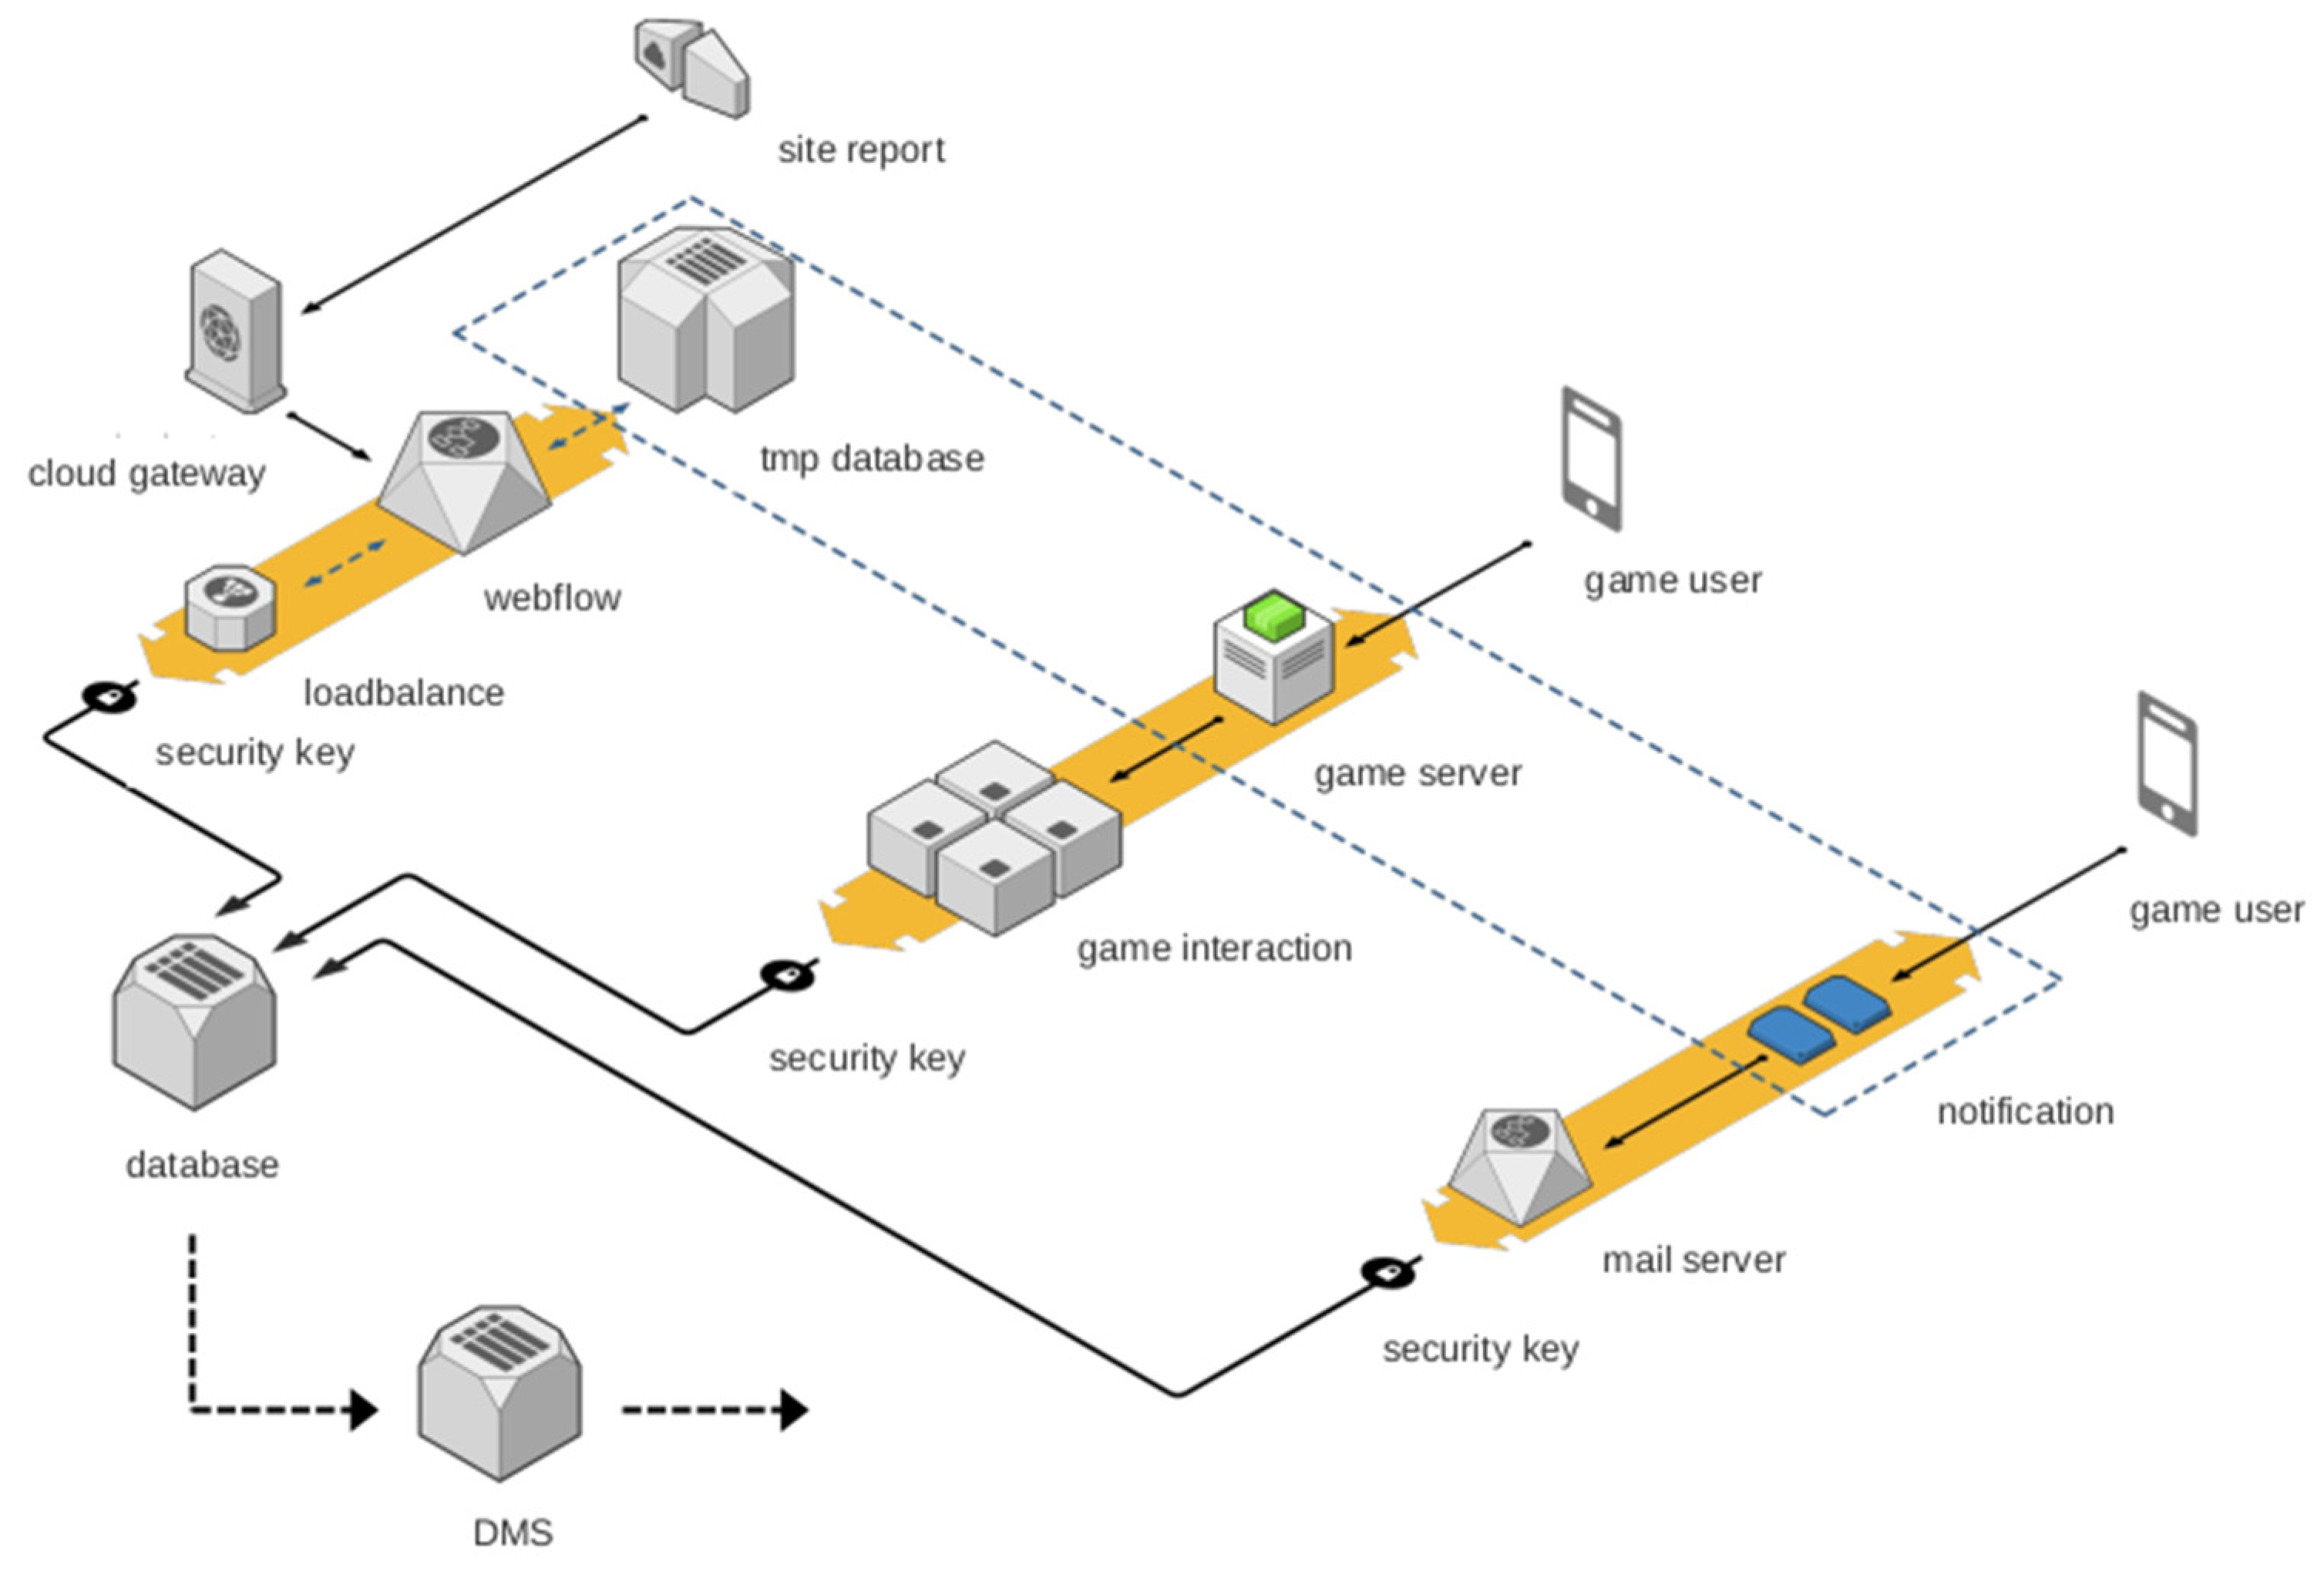
  • System architecture—architecture for the server that hosts the game tool is given in Figure 1. The architecture is mainly divided into three output branches—web dashboard/reporting, mobile game and notifications.
Figure 1 shows an overview of the tool server architecture. This structure is divided mainly into three branches:
  • First branch represents the internal structure of the web dashboard/reporting that uses SpagioBI [46] to keep a secure connection to access the data, a load balance mechanism, and all requests are processed in a web flow, which uses a temporary database to create the reports.
  • Second branch, the data of game interaction service structure, where through a game server structure of Unity [47], the data are distributed to the users through the mobile game.
  • Last branch, notification system that operates using mail server system, sending the notifications to the user by a queuing system like RabbitMQ with a direct type [48].

4.2. Tool Performance

The mobile tool concept developed within the ITCity project was made to operate as a two-way information source. It intends to provide valuable energy usage information for the end user and parties of interest (generation, transmission and distribution).
The tool acquires the information of the end-user energy usage based on the utilization of pop-up notifications. These notifications are generated time by time through the mobile tool and contain challenges/questions regarding energy usage. For example, the pop-up question could be “Is your air-conditioning on?”. This question contributes towards energy consumption assessment of an air-conditioning unit, which in time creates a database of a certain device and through consumption assessment algorithm attempts to predict its energy consumption. Similar operations are carried out for every electrical appliance in the household to assess their energy consumption. Moreover, the generated pop-up notifications also provide challenges to reduce certain device energy consumption and provide energy usage tips, increasing energy use awareness thereby potentially impacting the energy usage. These notifications request human interaction in the form of an answer and based on the answer provided, the answer is valued providing in-game points. Additionally, end user is awarded bonus points, based on how soon from the initial notification pop up the user provides an answer. These points are then collected and represent the in-game environment evolution (see Figure 2).
The end user or group of user energy usage habits are depicted using the mobile tool environment. Two scenarios are proposed—a fish in an aquarium or trees in a forest; each scenario is visually impacted by the answers given by the end user. The negative habit impact is shown as a negative influence on the environment in the according scenario; Figure 2 depicts the escalated degradation of the fish in an aquarium. This visual depiction provides an energy usage habit representation for the end user, giving indication of change necessity in the case of game environment degradation. Furthermore, positive game environment progression is rewarded with in game achievements, thus increasing user involvement.
On the other hand, the manager in charge of aggregated data analysis through the collected initial electrical device setup information (power, habits, etc.) and the real-time notification updates regarding the devices, can provide necessary energy usage information for parties of interest (generation, transmission and distribution) as well as to the end user. The aggregated information through an algorithm can provide a simulated estimate of end-user consumption in a certain period (e.g., a month), the expected electricity bill for a certain period, consumption reduction in a set of appliances and its impact on the electricity bill, impact of installation of alternative technologies, such as renewable energy sources and their potential impact on consumption and electricity bill, a set of recommendations to reduce electricity bill, etc.
The data analysis prepared by the data manager could be automatically generated, providing this information for the end user and increasing the motivation of smarter energy usage based on the monthly electricity cost. Furthermore, the aggregated load information can be useful for utilities in improving grid control functions in cities without or with insufficiently developed smart meter infrastructure. Future work could include demonstration activities, i.e., the tool development in some cities to measure its impact on estimating energy usage.

5. Communication Solutions for Energy Services in Smart City

5.1. Description of Communication Solutions

The current electrical systems have deployed many sensors and actuators throughout the network, both in the generation and the transmission and distribution of energy. These devices are necessary for the control centres to measure, monitor and execute planning processes, protection and prevention of incidents that put the electricity supply system at risk, which directly affects its users. For these control and monitoring systems to increase the efficiency and security of the network, a reliable and fault-tolerant communication infrastructure is required, combining different technologies for transmission, communication and data storage, which allows the system to be sustainable over time. The global communication layer of the intelligent network is considered to consist of three types of networks, as defined in [49]:
  • Wide area networks (WAN) provide communication between the electricity company and the substations. WANs are high-bandwidth trunk communication networks that handle long-distance data transmission.
  • Field area networks (FAN), neighbourhood area networks (NAN) and advanced measurement infrastructure (AMI) provide communication for the energy distribution areas. The FAN/NAN/AMI interconnect WAN and the home/building/industrial area networks (HAN/BAN/IAN) of the end users.
  • Home area networks (HANs), building area networks (BANs) and industrial area networks (IANs) provide communication between electrical devices and smart meters within the home, building or industrial complex.
The intelligent network is represented as follows: core (backbone), intermediate mile (backhaul) and last mile (access, distribution).
The core incorporates the connection of the power station, substation and public services. This requires the use of high capacity and bandwidth availability technology, operating with extensive amount of data from different parts of the system. This network is generally composed of fibre optics, allowing high speed data transfer and immunity to interference [50].
The intermediate mile is represented by AMI, allowing automation of substations and distribution systems as well as data concentrators of Supervisory Control and Data Acquisition (SCADA) system and Smart Power Management System (SPMS) in the control centres [51]. This network is required to provide high bandwidth means and is necessary to have a flexible and uninterrupted data flow, to ensure data transfer reliability to the core network. This network contains a mixture of wired and wireless communication technologies; these can be WiMAX, 3G, 4G- LTE, fibre optic, among others.
The last mile incorporates the areas that are generally connected in the distribution of the electric power system, which consider the FAN/NAN areas and smart meters with an AMI infrastructure. The appropriate communication technology is based on the complexity of the area, but in general the technology focuses on data transfer speed and security. The application of HAN, BAN and IAN provides the information related to the management of energy in building but will occupy compatible technologies for the automation of home and building [52,53]. The smart meters communication operating through AMI uses mixed wire (Power Line Communication (PLC), Broadband Power Line (BPL) and wireless (Cellular, WiMAX, ZigBee, etc.) communication technologies [54]. These smart meter networks work as a set of bridges between the AMI and the customers’ gateways in HAN network.
The implemented Wireless Sensor Networks (WSN) in the electrical system requires the use of multiple different networks, considering individual latency and coverage as well as the reliability between the communication methods. In this intelligent network the most critical condition is found in the WAN (backbone) network, which is used for the control and monitoring of generating plans and substations through an AMI and connects other sectors of the network and interested parties. This network requires high level of service, very low latency (less than 10 ms) and stable high-speed data communication (10 Mbps–1 Gbps or more). Therefore, fibre optics, cellular networks and satellite networks are preferred. The used FAN/NAN (backhaul) networks have the same network necessities as WAN but with less coverage. These network protocols use cellular networks and fibre optic communication and connect the public services with the electrical distribution system. The HAN/BAN/IAN (access, distribution) networks have undergone many technological improvements and functionality, such as Wi-Fi and Bluetooth used in these types of networks.

5.2. Results of Simulation of Communication Solutions

Simulation of communication solutions aims at determining the necessary infrastructure (number of antennas) that minimizes the investment costs for wireless sensor networks (SM) of IoT-M2M in an energy dimension of smart cities.
The functionalities of a network simulation tool are used to carry out a simulation of WAN type wireless communication using two appropriate technologies (3G and WiMAX 802.16x) for cities involved in the ITCity project (Riga, Bucharest, Florianopolis, Santiago, Concepción and Copiapó). The radioelectric coverage parameters (power spectral density, 24 dbm) used to determine the square kilometres, are equivalent in 3G and LTE (4G). Therefore, for simulation purposes they are similar. In Appendix A, technical parameters of 3G and WiMAX technologies are presented. The utilized network simulation tool determines the number and location of network antennas, number of users for respective technology and the square kilometres of wireless propagation coverage for each city. This tool is called “Radio Mobile”, program for evaluation of radio propagation, designed by Dr. Ing. Roger Coudé [55].
The Radio Mobile program (ver. 3.8.18) uses digital terrain elevation models to automatically calculate the path profile between the transmitter and the receiver [56] and uses Irregular Terrain Model (ITM) for radio propagation. The Longley-Rice ITM model [57] is a general-purpose model based on electromagnetic theory and statistical analysis of terrain characteristics. This ITM model is valid in a range of 200 MHz to 20 GHz and can be used to predict the attenuation of radio signals in WAN systems. The program outputs calculation for radio link budgets, produces virtual maps and 3D views and provides the information to align the antennas both horizontally and vertically.
To utilize the program, various parameters must be specified—system, environmental, set and statistical (see Appendix B).
Table 1 shows results of network simulation carried out for each of the involved ITCity cities. These results consider the number of inhabitants and square kilometres. These factors impact the network deployment, because a certain network antenna can cover a certain area as well as provide a service to a limited number of users in the area.
The summarized results show a large diversity between the cities of which climate and terrain plays a great role. Regarding climate, with greater amount of rain or snow, the signal power will be impacted, presenting greater problems of attenuation and dispersion. This is the situation of Riga, Romania, Santiago and Concepción. However, in Florianópolis the climate shows less attenuation, but the most favourable climate is in Copiapó, because the desert climate does not present any type of attenuation of radio signal. Another signal limitation is created by the terrain itself; due to its impact, the network of 3G antennas requires more deployments than WiMAX because of the lower sensitivity of the 3G (−60 dbm).
As regards the number of users, the WiMAX advantage is greater, since 3G supports a maximum of 150 user per minute, per cell-antenna, while WiMAX supports up to 600 users. Furthermore, having in mind a large quantity of user simultaneous connections, especially for machine communication, smart house communication and automated systems, the advantage of WiMAX can be seen by its 75 Mbps data transfer speed, in comparison 3G only offers 20 Mbps.
Comparison of the two network technologies has shown the advantage of WiMAX utilization with greater area of coverage with least amount of antenna deployment. This solution does provide the most optimal outcome for most of the cities simulated; however, in Florianópolis the number of antennas for each solution is very similar with minor deviation in minimum coverage. This means that there are situations where 3G network utilization can provide a better result even with its slight disadvantages in comparison to WiMAX.

6. Discussion and Conclusions

Smart city development in Europe is driven by EU ambition to become climate neutral continent by 2050, supported by digital transformation agenda and captured directly or indirectly in various policy and legislative acts. Meanwhile, in LAC countries it is strongly linked to the existence of governmental commitment to reach United Nations Sustainable Development Goals. In either case political will and incentives play a pivotal role in triggering investments in smart city technologies.
Improving consumer behaviour is critical to further energy transition and efficiency gains. However, a number of countries, for objective reasons, do not have precise consumption measurements, real-time meter data access and anti-fraud detection, which would allow the value chain (real estate developers, building management companies, grid operators, utilities and end users) to avoid unnecessary technical losses, to optimize the balancing process between generation and consumption, to increase reliability of the forecasting and enable other applications. Moreover, accurate and constant data availability can raise user awareness, support positive changes in consumer behaviour and uncover potential of increasing energy savings, thus leading to reduced environmental impact.
Thus, the multipurpose interdisciplinary approach described in this paper and developed within the framework of the project allows, in rather limited conditions, for the collection, analysis and modelling of customer behaviour. The development was performed considering user privacy, combining the multiple modern information sources—user consumption surveys (as a gamification tool) and measurements from the installed smart meter.
Through the proposed building block methodology, there is scope to explore options for behaviour change, supporting social, technological, ICT and adoption layers.
As for the pilot, a full coverage of the electricity use in UPB is planned in the future, for example, with the support from European Structural Funds, aiming to transform UPB campus into a (Smart City) Living Lab. This lab could support future research and demonstration activities on balancing issues, power quality indices (voltage changes, harmonic content etc.), other informative parameters (e.g., carbon footprint) and in testing energy efficiency initiatives like demand response, contractual binding load curves, etc.
User engagement using gamification approach is one of possible solutions for situations when smart metering data are not available or are insufficient. The end-user energy consumption habit assessment based on gamification allows estimating consumption and accordingly electricity bill in a certain period, possibilities of energy savings that can be reached by changing user behaviour, and the impact of possible installation of renewable energy sources. Furthermore, if aggregated load information can be provided to the utility control system and special contracts can be established to allow load reduction or even load curtailments in abnormal operation states of the system, traditional control functions, such as those related to outage management, can be considerably improved. Other solutions related to a microgrid and multi-microgrid framework might also benefit from aggregated load information.
As for communication solutions, several conclusions derived from the analysis performed within the project are described below. First, the networks that connect to the public service with the electrical distribution system with the last mile applying smart metering technology do not require a high level of service; however, they do require sufficient reliability and privacy in order to correctly monitor customer consumption, utilise demand response strategies and improve system performance. Second, the implementation of Wireless Sensor Networks (WSN) technologies for electrical power systems and energy supply measurement depends on both geographical distances and application and binary transmission speed. The envisaged type of network (WAN, NAN and HAN) and the consideration of the dedicated protocols in each scenario, require different levels of quality of service, latency, coverage and all these elements must be considered. Third, an important signal or level indicator of a smart city is its telecommunications network capacity, expressed both in number of simultaneous users (channel capacity) as well as transmission rate in Megabits per seconds (speed). All this could be verified in the current COVID-19 pandemic, where the relevant role of telecommunications in aspects such as the maintenance of human relations in periods of home confinement and the growth of traffic as a result of intense information management that can be done with Big Data and Artificial Intelligence, must be recognized.
To conclude, the joint effort with multipurpose interdisciplinary approach could provide important insights into innovative methodological tools to inspire change in consumer energy behaviour. Future research should aim at mobile tool validation in real-life or close to real-life conditions and explore replication and scale-up opportunities in various circumstances and regions, taking into account inventory development and impact assessment. Additionally, this shall be supported by promotion of energy efficiency through technological education in order to maximise effects.

Author Contributions

Conceptualization, A.M.; methodology, A.M.; software, M.D.; validation, A.-M.D. and D.I.; formal analysis, A.M., L.M. and D.I.; investigation, A.-M.D., M.D., F.U.-V., D.C. and L.G.-S.; resources, A.-M.D., M.D., F.U.-V., D.C. and L.G.-S.; data curation, A.-M.D., F.U.-V., D.C. and L.G.-S.; writing—original draft preparation, A.M.; writing—review and editing, A.M., A.-M.D., M.D., L.M., D.I., F.U.-V., D.C. and L.G.-S.; visualization, A.M., A.-M.D. and M.D.; supervision, A.M..; project administration, A.M. All authors have read and agreed to the published version of the manuscript.

Funding

This research was funded by the ERA-NET-Lac grant under the ERANet-LAC 2nd Joint Call on Research and Innovation for Latin America, Caribbean and European Union Countries, Project ID: ELAC2015/T10-0643. This work has been supported also in part by the Brazilian National Council for Scientific and Technological Development (CNPq), Project ID: 443199/2016-7.

Institutional Review Board Statement

Not applicable.

Informed Consent Statement

Not applicable.

Data Availability Statement

The data presented in this study are available on request. The data are not publicly available due to restrictions imposed by the ongoing research and innovation projects.

Conflicts of Interest

The authors declare no conflict of interest.

Appendix A. Technical Parameters of 3G and WiMAX

Technology3GWiMAX
Channel bandwidth850 MHz/900 MHz/1900 MHz/AWS (1700–2100 MHz)1.25 MHz/1.75 MHz/3.5 MHz/5 MHz/7 MHz/8.75 MHz/10 MHz/14 MHz/15 MHz
Data transmission speed384 kbtps−2 Mbps1 Mbps–75 Mbps
Receiver sensitivity−60 dbm−90 dbm
Spectral efficiency<1.25 bps/Hz<3.7 bps/Hz
ModulationQPSK/BPSKQPSK, 16QAM, 64 QAM
Frequency band5 MHz2 GHz–11 GHz
DuplexingCMDT/TDDTDD, FDD
Multiple accessTDMA/CDMASOFDMA
Standard3GPPIEEE 802.16
Transmitter powerClass 1—33 dbm
Class 2—27 dbm
Class 3—24 dbm
Class 4—21 dbm
23 dbm
Chip rate1.22 Mcps7–14 ksps
Number of users50–150200–600

Appendix B. Model Input Parameters

CategoryParameterValues
System parametersFrequency200 MHz–20 GHz
Distance1 km–2000 km
Antenna height0.5 m–3000 m
PolarizationHorizontal/vertical
Environmental parametersIrregular terrain variableAverage roughness (m)
Electrical constants of the terrainPermittivity and conductivity
Surface refractivity250–400 N-units
Climate7 types
Parameter setPositioning criteriaRandom, careful, very careful
Statistical parameterReliability variable—time, location and space0.1–99.9%

References

  1. Csukás, M.S.; Szabó, R.Z. The many faces of the smart city: Differing value propositions in the activity portfolios of nine cities. Cities 2021, 2021, 103116. [Google Scholar] [CrossRef]
  2. Woetzel, J.; Remes, J.; Boland, B.; Lv, K.; Sinha, S.; Strube, G.; Means, J.; Law, J.; Cadena, A.; von der Tann, V. Smart Cities: Digital Solutions for a More Livable Future. 2018. Available online: https://www.mckinsey.com/industries/capital-projects-and-infrastructure/our-insights/smart-cities-digital-solutions-for-a-more-livable-future (accessed on 4 March 2021).
  3. IT City. Available online: http://fei-web.lv/en/itcity (accessed on 14 January 2021).
  4. Grossberg, F.; Wolfson, M.; Mazur-Stommen, S.; Farley, K.; Nadel, S. Gamified Energy Efficiency Programs. 2015. Available online: https://www.aceee.org/sites/default/files/publications/researchreports/b1501.pdf (accessed on 2 August 2020).
  5. Abrahamse, W.; Steg, L.; Vlek, C.; Rothengatter, T. A review of intervention studies aimed at household energy conservation. J. Environ. Psychol. 2005, 2, 273–291. [Google Scholar] [CrossRef]
  6. Polizzi di Sorrentino, E.; Woelbert, E.; Sala, S. Consumers and their behavior: State of the art in behavioral science supporting use phase modeling in LCA and ecodesign. Int. J. Life Cycle Assess 2016, 21, 237–251. [Google Scholar] [CrossRef] [Green Version]
  7. Mutule, A.; Teremranova, I. Introduction of Energy Saving Principles: Technologies and Awareness, Latvian Experience. Latv. J. Phys. Tech. Sci. 2018, 55, 52–62. [Google Scholar] [CrossRef] [Green Version]
  8. Mutule, A.; Teremranova, J.; Antoskovs, N. Smart City Through a Flexible Approach to Smart Energy. Latv. J. Phys. Tech. Sci. 2018, 55, 3–14. [Google Scholar] [CrossRef] [Green Version]
  9. Mutule, A.; Zikmanis, I.; Dumitrescu, A. Electric Consumption Assessment using Smart Meter Data and KPI Methodology. Latv. J. Phys. Tech. Sci. 2020, 3, 3–19. [Google Scholar] [CrossRef]
  10. European Commission. Stepping up Europe’s 2030 Climate Ambition Investing in a Climate-Neutral Future for the Benefit of our People. COM/2020/562. Available online: https://eur-lex.europa.eu/legal-content/EN/TXT/?uri=CELEX:52020DC0562 (accessed on 4 March 2021).
  11. European Commission. Clean Energy for all Europeans, Publications Office of the European Union. Luxembourg, 2019. Available online: https://doi.org/10.2833/9937 (accessed on 7 January 2021).
  12. European Commission. Proposal for a Regulation of the European Parliament and of the Council Establishing the Framework for Achieving Climate Neutrality and Amending Regulation (EU) 2018/1999 (European Climate Law). COM/2020/80. Available online: https://eur-lex.europa.eu/legal-content/EN/TXT/?qid=1588581905912&uri=CELEX:52020PC0080 (accessed on 4 March 2021).
  13. European Commission. Shaping Europe’s Digital Future. Publications Office of the European Union. Luxembourg. 2020. Available online: https://doi.org/10.2759/091014 (accessed on 4 February 2021).
  14. European Commission. Directive (EU) 2018/2002 of the European Parliament and of the Council of 11 December 2018 amending Directive 2012/27/EU on energy efficiency. Off. J. Eur. Union 2018, L328, 210–230. Available online: http://data.europa.eu/eli/dir/2018/2002/oj (accessed on 4 March 2021).
  15. European Commission. Directive (EU) 2019/944 of the European Parliament and of the Council of 5 June 2019 on common rules for the internal market for electricity and amending Directive 2012/27/EU. Off. J. Eur. Union 2019, L158, 125–199. Available online: http://data.europa.eu/eli/dir/2019/944/oj (accessed on 4 March 2021).
  16. European Commission. Regulation (EU) 2019/943 of the European Parliament and of the Council of 5 June 2019 on the internal market for electricity. Off. J. Eur. Union 2019, L158, 54–124. Available online: http://data.europa.eu/eli/reg/2019/943/oj (accessed on 4 March 2021).
  17. European Commission. Directive (EU) 2018/844 of the European Parliament and of the Council of 30 May 2018 amending Directive 2010/31/EU on the energy performance of buildings and Directive 2012/27/EU on energy efficiency. Off. J. Eur. Union 2018, L156, 75–91. Available online: http://data.europa.eu/eli/dir/2018/844/oj (accessed on 4 March 2021).
  18. European Commission. Regulation (EU) 2018/1999 of the European Parliament and of the Council of 11 December 2018 on the Governance of the Energy Union and Climate Action, amending Regulations (EC) No 663/2009 and (EC) No 715/2009 of the European Parliament and of the Council, Directives 94/22/EC, 98/70/EC, 2009/31/EC, 2009/73/EC, 2010/31/EU, 2012/27/EU and 2013/30/EU of the European Parliament and of the Council, Council Directives 2009/119/EC and (EU) 2015/652 and repealing Regulation (EU) No 525/2013 of the European Parliament and of the Council. Off. J. Eur. Union 2018, L328, 1–77. Available online: http://data.europa.eu/eli/reg/2018/1999/oj (accessed on 4 March 2021).
  19. European Commission. A Framework Strategy for a Resilient Energy Union with a Forward-Looking Climate Change Policy. COM/2015/080 Final. Available online: https://eur-lex.europa.eu/legal-content/EN/TXT/?uri=CELEX:52015DC0080 (accessed on 16 February 2021).
  20. Accenture. Understanding Consumer Preferences in Energy Efficiency. Accenture End-Consumer Observatory on Electricity Management. 2010. Available online: https://www.accenture.com/t20160811T002327__w__/us-en/_acnmedia/Accenture/next-gen/insight-unlocking-value-of-digital-consumer/PDF/Accenture-Understanding-Consumer-Preferences-Energy-Efficiency-10-0229-Mar-11.pdf (accessed on 4 March 2021).
  21. International Electrotechnical Commission (IEC). Orchestrating Infrastructure for Sustainable Smart Cities. 2014. Available online: http://pubweb2.iec.ch/whitepaper/smartcities/#:~:text=Orchestrating%20infrastructure%20for%20sustainable%20smart%20cities%20is%20the%20sixth%20in,Standards%20and%20Conformity%20Assessment%20services (accessed on 4 March 2021).
  22. Adams, J.N.; Bélafi, Z.D.; Horváth, M.; Kocsis, J.B.; Csoknyai, T. How Smart Meter Data Analysis Can Support Understanding the Impact of Occupant Behavior on Building Energy Performance: A Comprehensive Review. Energies 2021, 14, 2502. [Google Scholar] [CrossRef]
  23. European Commission. Directive 2009/72/EC of the European Parliament and of the Council of 13 July 2009 concerning common rules for the internal market in electricity and repealing Directive 2003/54/EC. Off. J. Eur. Union 2009, L211, 55–93. Available online: http://data.europa.eu/eli/dir/2009/72/oj (accessed on 4 March 2021).
  24. Tounquet, F.; Alaton, C. Benchmarking Smart Metering Deployment in EU-28. Publications Office of the European Union. 2020. Available online: https://doi.org/10.2833/492070 (accessed on 16 February 2021).
  25. European Commission. The Strategic Energy Technology (SET) Plan. At the Heart of Energy Research and Innovation in Europe Publications Office of the European Union. 2017. Available online: https://doi.org/10.2777/476339 (accessed on 7 January 2021).
  26. Strategic Energy Technology Plan. Europe to become a Global Role Model in Integrated, Innovative Solutions for the Planning, Deployment, and Replication of Positive Energy Districts. Strategic Energy Technologis Information Sustem (SETIS). 2018. Available online: https://setis.ec.europa.eu/system/files/setplan_smartcities_implementationplan.pdf (accessed on 4 March 2021).
  27. European Commission. 100 Climate-Neutral Cities by 2030—by and for the Citizens Interim Report of the Mission Board for Climate-Neutral and Smart Cities. Publications Office of the European Union. 2020. Available online: https://doi.org/10.2777/62649 (accessed on 11 January 2021).
  28. United Nations. Regional Action Plan for the Implementation of the New Urban Agenda in Latin America and the Caribbean 2016–2036. United Nations. 2018. Available online: https://www.cepal.org/en/publications/42146-regional-action-plan-implementation-new-urban-agenda-latin-america-and-caribbean (accessed on 4 March 2021).
  29. United Nations. Quadrennial Report on Regional Progress and Challenges in Relation to the 2030 Agenda for Sustainable Development in Latin America and the Caribbean. United Nations. 2019. Available online: https://www.cepal.org/en/publications/44552-quadrennial-report-regional-progress-and-challenges-relation-2030-agenda (accessed on 4 March 2021).
  30. United Nations Human Settlements Programme. National Urban Policy: Latin America and the Caribbean Report. United Nations Office at Nairobi Publishing Services Section. 2017. Available online: https://unhabitat.org/national-urban-policy-latin-america-and-the-caribbean-report (accessed on 4 March 2021).
  31. United Nations. The Sustainable Development Agenda. Available online: https://www.un.org/sustainabledevelopment/development-agenda/ (accessed on 4 March 2021).
  32. United Nations. Second Annual Report on Regional Progress and Challenges in Relation to the 2030 Agenda for Sustainable Development in Latin America and the Caribbean. United Nations. 2018. Available online: https://www.cepal.org/en/publications/43439-second-annual-report-regional-progress-and-challenges-relation-2030-agenda (accessed on 4 March 2021).
  33. Centro de Gestão e Estudos Estratégicos. Redes Elétricas Inteligentes: Contexto Nacional. Série Documentos Téchnicos N16 (December). 2012. Available online: https://www.cgee.org.br/documents/10195/734063/Redes_Eletricas_Inteligentes_22mar13_9539.pdf/36f87ff1-43ed-4f33-9b53-5c869ace9023?version=1.5 (accessed on 4 March 2021).
  34. Redes Intelegentes Brasil. Brazil’s Smart Grid Pilot Projects. Available online: http://redesinteligentesbrasil.org.br/projetos-piloto-brasil.html (accessed on 4 March 2021).
  35. Domingues, M.; Alves, L.; Salvini, R.; Carrizo, D.; Issicaba, D.; Venturini, L.; Rosa, M. Collecting Energy Consumption Habits Data in Developing Countries: A Game Platform Proposal. In Proceedings of the 11th International Symposium on Advanced Topics in Electrical Engineering (ATEE), Bucharest, Romania, 28–30 March 2019; pp. 1–4. [Google Scholar] [CrossRef]
  36. Robso, K.; Plangger, K.; Kietzmann, J.; McCarthy, I.; Pitt, L. Is it all a game? Understanding the principles of gamification. Bus. Horiz. 2015, 58, 411–420. [Google Scholar] [CrossRef]
  37. Deterding, S.; Dixon, D.; Khaled, R.; Nacke, L. From game design elements to gamefulness: Defining gamification. In Proceedings of the 15th International Academic MindTrek Conference: Envisioning Future Media Environments, ACM, Tampere, Finland, 28 September 2011; pp. 9–15. [Google Scholar] [CrossRef]
  38. NobelGrid. The Advanced Smart Meter (SLAM). Available online: https://nobelgrid.eu/products-tools/ (accessed on 4 March 2021).
  39. Arif, A.; Wang, Z.; Wang, J.; Mather, B.; Bashualdo, H.; Zhao, D. Load Modeling—A Review. IEEE Trans. Smart Grid 2018, 9, 5986–5999. [Google Scholar] [CrossRef]
  40. Toma, A.R.; Olteanu, V.M.; Gheorghe, C.M.; Dumitrescu, A. Electric Energy Consumption Behaviour of University Students. In Proceedings of the 11th International Symposium on Advanced Topics in Electrical Engineering (ATEE), Bucharest, Romania, 28–30 March 2019; pp. 1–6. [Google Scholar] [CrossRef]
  41. Boicea, V.A.; Sidea, D.O.; Plamanescu, R.; Dumitrescu, A.; Oancea, C.D.; Petre, V. DFACTS Devices in Asymmetrical Power Grids: A Case Study. In Proceedings of the 11th International Symposium on Advanced Topics in Electrical Engineering (ATEE), Bucharest, Romania, 28–30 March 2019; pp. 1–6. [Google Scholar] [CrossRef]
  42. Paone, A.; Bacher, J.-P. The Impact of Building Occupant Behavior on Energy Efficiency and Methods to Influence It: A Review of the State of the Art. Energies 2018, 11, 953. [Google Scholar] [CrossRef] [Green Version]
  43. AlSkaif, T.; Lampropoulos, I.; van den Broek, M.; van Sark, W. Gamification-based Framework for Engagement of Residential Customers in Energy Applications. Energy Res. Soc. Sci. 2018, 4, 187–195. [Google Scholar] [CrossRef]
  44. Iria, J.; Fonseca, N.; Cassola, F.; Barbosa, A.; Soares, F.; Coelho, A.; Ozdemir, A.A. Gamification Platform to Foster Energy Efficiency in Office Buildings. Energy Build 2020, 2020, 110101. [Google Scholar] [CrossRef]
  45. Johnson, D.; Horton, E.; Mulcahy, R.; Foth, M. Gamification and Serious Games Within the Domain of Domestic Energy Consumption: A Systematic Review. Renew. Sustain. Energy Rev. 2017, 249–264. [Google Scholar] [CrossRef] [Green Version]
  46. SpagoBI. Available online: https://www.spagobi.org/ (accessed on 4 March 2021).
  47. Unity. Available online: https://unity.com/ (accessed on 4 March 2021).
  48. RabbitMQ. Available online: https://www.rabbitmq.com// (accessed on 4 March 2021).
  49. Mets, K.; Ojea, J.A.; Develder, C. Combining power and communication network simulation for cost-effective smart grid analysis. IEEE Commun. Surv. Tutor. 2014, 16, 1771–1796. [Google Scholar] [CrossRef]
  50. Lo, C.; Ansari, N. The Progressive Smart Grid System from Both Power and Communications Aspects. IEEE Commun. Surv. Tutor. 2012, 14, 799–821. [Google Scholar] [CrossRef] [Green Version]
  51. Sheng, Z.; Yang, S.; Yu, Y.; Vasilakos, A.; Mccann, J.; Leung, K. A survey on the ietf protocol suite for the internet of things: Standards, challenges, and opportunities. IEEE Wirel. Commun. 2013, 20, 91–98. [Google Scholar] [CrossRef]
  52. Mengi, A.; Ponzelar, S.; Koch, M. The ITU-T G.9960 broadband PLC Communication Concept for Smartgrid Applications. In Proceedings of the IEEE International Conference on Smart Grid Communications (SmartGridComm), Dresden, Germany, 23–27 October 2017; pp. 492–496. [Google Scholar] [CrossRef]
  53. Bayindir, R.; Colak, I.; Demirtas, K. Smart grid technologies and applications. Renew. Sustain. Energy Rev. 2016, 66, 499–516. [Google Scholar] [CrossRef]
  54. Medina, C.A.; Pérez, M.R.; Trujillo, L.C. IoT Paradigm into the Smart City Vision: A Survey. In Proceedings of the IEEE International Conference on Internet of Things (iThings) and IEEE Green Computing and Communications (GreenCom) and IEEE Cyber, Physical and Social Computing (CPSCom) and IEEE Smart Data (SmartData), Exeter, UK, 21–23 June 2017; pp. 695–704. [Google Scholar] [CrossRef]
  55. Coudé, R. Radio Mobile. VE2DBE. Available online: http://www.ve2dbe.com/rme.html (accessed on 4 March 2021).
  56. Hufford, G.A.; Longley, A.G.; Kissick, W.A. A Guide to the Use of the Its Irregular Terrain Model in the Area Prediction Mode; National Telecommunications and Information Administration (NTIA) Report; U.S. Department of Commerce: Washington, DC, USA, 1982; pp. 82–100.
  57. Calderón, M.; López, G.; Marín, G. Smartness and Technical Readiness of Latin American Cities: A Critical Assessment. IEEE Access 2018, 56839–56850. [Google Scholar] [CrossRef]
Figure 1. Architecture for the server that hosts the game tool.
Energies 14 04310 g001
Figure 2. Application environment degradation.
Energies 14 04310 g002
Table 1. Summary of involved project cities.
CityArea, km2Number of People in ThousandsWeatherNumber of Antennas 3GNumber of Antennas WiMAXNumber of Users 3G/minNumber of Users WiMAX/minPropagation Coverage 3GPropagation Coverage WiMAX
Riga307679Humid
Continental
48187.210.888–90%90–92%
Bucharest3261883Humid
Continental
30124.57.294–96%96–98%
Florianópolis443477Temperate
Maritime
38305.718.078–81%80–81%
Santiago8376257Mediterranean Continental744011.124.092–94%82–90%
Concepción221217Oceanic
Maritime
26133.97.876–78%84–86%
Copiapó175151Desert2673.94.250–60%70–80%
Publisher’s Note: MDPI stays neutral with regard to jurisdictional claims in published maps and institutional affiliations.

