
Valuation of Distributed Wind in an Isolated System


1
Pacific Northwest National Laboratory (PNNL), Richland, WA 99352, USA
2
Pacific Northwest National Laboratory (PNNL), Portland, OR 97204, USA
3
Sandia National Laboratories (SNL), Albuquerque, NM 87123, USA
*
Author to whom correspondence should be addressed.
Energies 2021, 14(21), 6956; https://doi.org/10.3390/en14216956
Submission received: 9 September 2021
/
Revised: 15 October 2021
/
Accepted: 19 October 2021
/
Published: 22 October 2021
(This article belongs to the Special Issue Policy and Economics Analysis of Renewable Energy Sources and Bioenergy)
Abstract
:Remote communities are increasingly adopting renewable energy, such as wind, as they transition away from diesel energy generation. It is important to understand the benefits and costs of wind energy to isolated systems so that decision-makers can optimize their choices in these communities. There are few examples of valuation of wind energy as a distributed resource and numerous differences in valuation approaches, especially in the inclusion of environmental and economic impacts. We apply a distributed wind valuation framework to calculate the benefits and costs of wind in St. Mary’s, Alaska, to the local electric cooperative and to society, finding that the project does not have a favorable benefit-to-cost ratio unless societal benefits are included, in which case the benefit-to-cost ratio is nearly double. Government funding is important to reducing the initial capital expenditures of this wind project and will likely be the case for projects with similar characteristics. Additional fuel savings benefits are potentially possible for this project through technological additions such as energy storage and advanced controls.
1. Introduction
Many remote communities rely on diesel generators for their energy generation, which means they often have higher than average electricity prices due to the high cost of supplying fuel to remote locations. They can also experience compounded impacts to energy security when weather or other hazards affect fuel delivery schedules [1]. Isolated communities are increasingly turning to renewable energy generation to reduce their reliance on diesel fuel, as seen in the adoption of wind energy generation in the Arctic, Australia, and some island communities [2,3,4,5,6,7,8].
As more communities explore wind in isolated systems, it is increasingly important to be able to value distributed wind systems in isolated settings [9,10,11]. The process for the valuation of distributed wind is not yet routine [12], with a wide variety of approaches being used. Several studies have investigated the value of small-scale wind projects using real options analysis [13,14,15], techno-economic analysis [3,5,16,17,18,19], and even contingent valuation [20]. Most of these studies only investigate the feasibility of a potential system in an area. They vary in the value elements being considered, and the valuation perspective is usually of the project owner/customers exclusively. This means that societal benefits, such as environmental and regional economic impacts, are often not included in the economic analysis of remote renewable energy generation systems, nor are qualitative value elements typically included. This is similar to the results from [21], which concluded that few distributed energy resource (DER) valuation studies focus on the environmental and social impacts of DERs. However, in the valuation of remote systems, the inclusion of societal benefits is considered relevant, given the societal subsidization of many of the projects [22].
To provide more structure to the process, several valuation frameworks have been developed in the literature to determine the benefits and costs of DERs from a bottom-up approach [23,24,25,26]. While these valuation frameworks could theoretically be applied to distributed wind, currently, there are no applied studies that do so [27]. Rather, most applied studies are focused on solar photovoltaic systems [28,29], which are much more common as DERs than wind [12,30,31]. There exists a need, therefore, to demonstrate the application of a comprehensive and consistent valuation framework for distributed wind systems.
A recent valuation framework was proposed in Mongird and Barrows [12] to comprehensively value distributed wind projects to various stakeholders, including quantitative and qualitative value elements faced by project owners, utilities, customers, and society. This paper uses the framework provided in [12] to conduct a case study of a wind project in a remote Alaskan village, identifying benefits and costs to both the electric cooperative and society. This case study is intended to provide context for the valuation framework provided in [12]. As distributed wind valuation is still rare, this study offers a practical example that others can use as they conduct their own valuation studies of distributed wind.
St. Mary’s, Alaska, a village of under 1000 residents, installed a 900 kW wind turbine in 2019 to provide additional local energy generation to their community, receiving substantial governmental assistance to fund the project. It is important that the economics of this project are well understood so that other communities can weigh the major benefits and costs of such a wind project in an isolated community, including the role of these subsidies. This is especially true given that the Alaska Village Electric Cooperative (AVEC), the entity that provides energy to the community and owns and operates the wind turbine in St. Mary’s, is considering the installation of similar projects in other remote Alaskan communities. While wind-diesel power system configurations have been studied at St. Mary’s in order to further reduce reliance on diesel generation, a valuation of the system has not been investigated by the relevant stakeholders at this point.
In this study, we explore the value of the St. Mary’s system using a bottom-up, comprehensive distributed wind valuation framework. This valuation demonstrates how benefits accrue to the relevant stakeholders, including the environmental and economic impacts of the project. We also discuss the qualitative value elements that may be impactful to the project, such as the resilience benefits of the turbine. Costs, both quantitative and qualitative, are similarly examined across perspectives. Following the analysis, we conclude that the total cost of the project to the cooperative, including that which was covered through grants and funding, in comparison to the benefits to the electric cooperative alone, provides a benefit–cost ratio (BCR) of 0.68, which is clearly unfavorable. It is only when additionally considering the societal benefits of economic and environmental benefits that the BCR is greater than one and reaches 1.79. The low BCR when only considering benefits to the electric cooperative suggests that public funding for similar projects may be important to their adoption and that such funding or incentives also have societal return-on-investment that should be considered.
2. Materials and Methods
2.1. System Characteristics
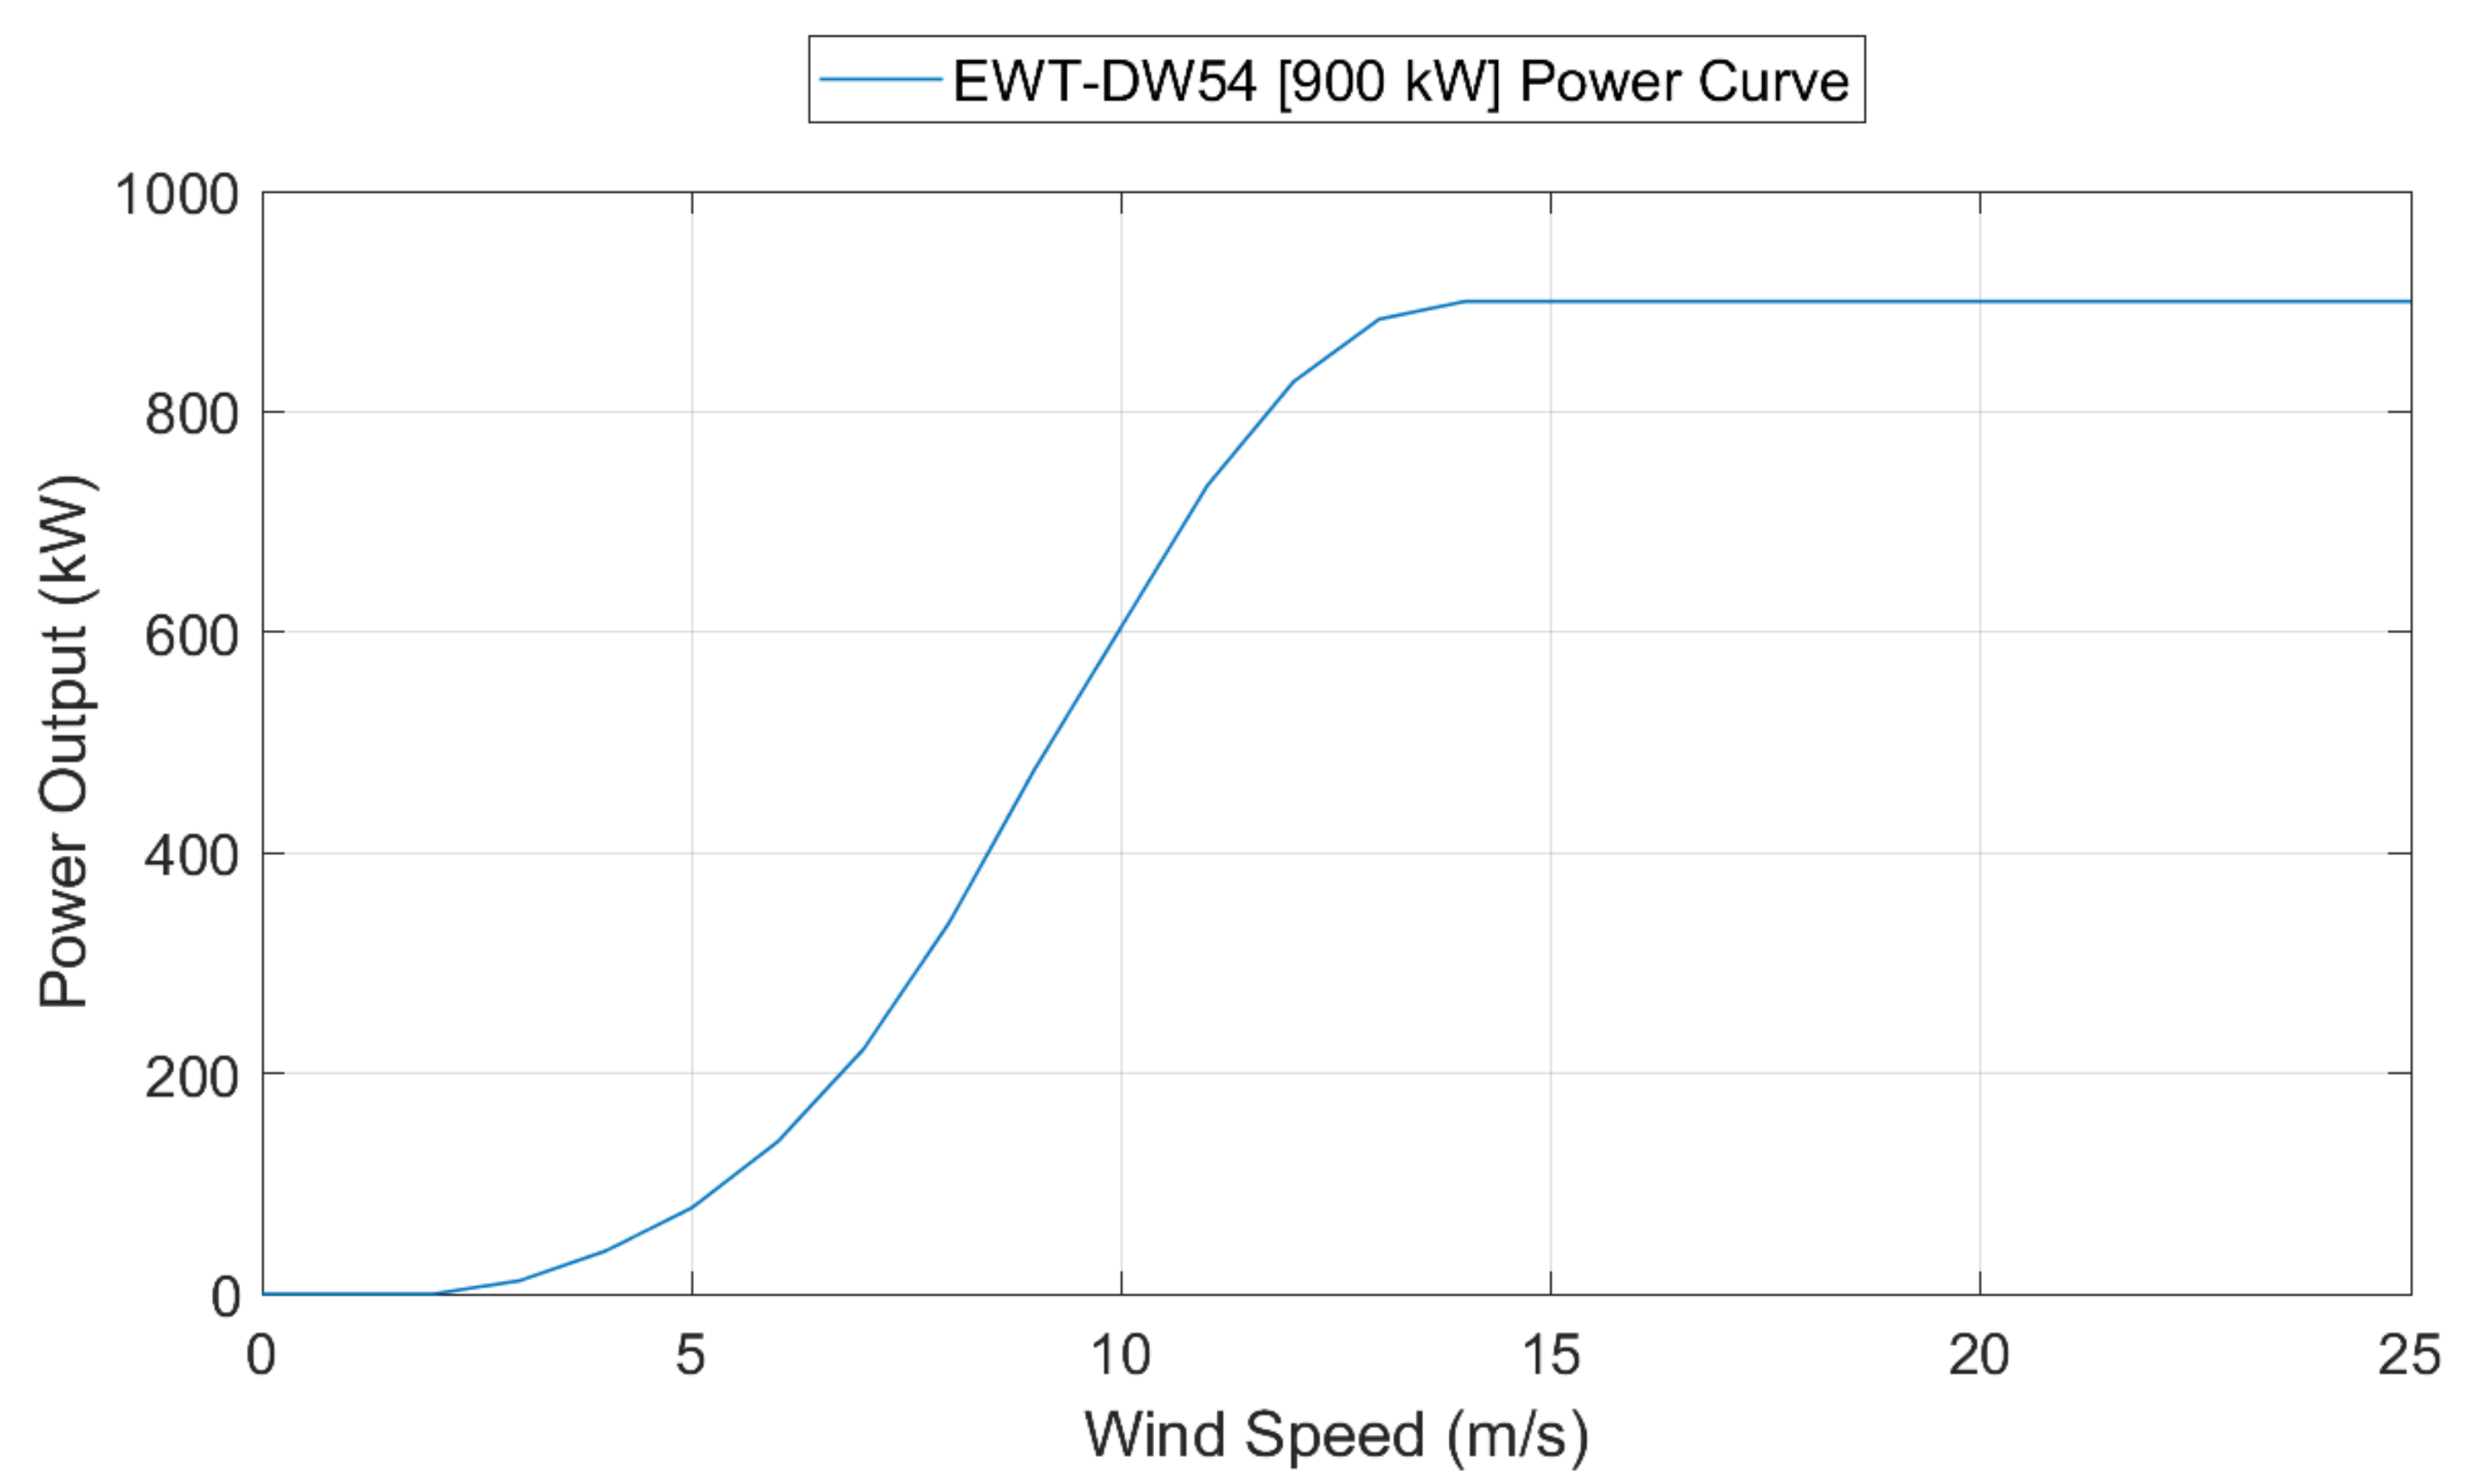
The village of St. Mary’s, Alaska (pop. 683) is located in western Alaska along the Andreafsky River near the junction with the Yukon River. It is connected by electrical intertie with two other remote villages: Pitka’s Point (pop. 117) and Mountain Village (pop. 860). The diesel power plant in St. Mary’s and the wind turbine near Pitka’s Point serve as the local electric grid for all three communities and are serviced by AVEC, a member-owned rural electric cooperative. The three remote villages, while jointly connected, are isolated from any outside transmission system. In May 2019, a single Type IV 900 kW EWT wind turbine (DW54-900HH50), manufactured by Emergya Wind Technologies B.V., a company in Amersfoort, The Netherlands, was installed at Pitka’s Point and connected to the St. Mary’s distribution system [32]. This turbine is oversized for both the average and peak loads at St. Mary’s, which means that until a new distribution tie line interconnected Mountain Village with St. Mary’s in November 2020, the turbine was frequently curtailed [33]. Figure 1 illustrates the power curve for the St. Mary’s system, and the technical parameters for the wind turbine are presented in Table 1.
In addition to the wind turbine, the St. Mary’s powerhouse contains three diesel generators, described in Table 2. The diesel generators are operated to ensure there is sufficient backup generation ready to ramp up should one of the other diesel generators trip or the wind turbine ramps down due to low wind or a fault. The relationship of these generators’ fuel consumption to power is assumed to be linear.
St. Mary’s power system also includes a secondary load control system comprised of a 327 kW electric water heater and related controls and switching relays. The water heater system can absorb excess electrical energy from the wind turbine, transferring it to a glycol-based heat recovery loop in the AVEC power plant, which then goes to a heat recovery loop serving St. Mary’s municipal facilities [33]. This system was originally installed to potentially integrate older wind turbine technology that had much less controllability compared to the new EWT turbine.
The wind resource was characterized from data collected from a meteorological tower deployment at Pitka’s Point, which lasted 16 months between 2007 and 2009, and summarized in a feasibility study [35]. The high-level statistics included in Table 3, along with monthly averages of wind speed and temperature, were incorporated into the power system modeling framework to generate a synthetic hourly time series of wind speeds for the simulations.
Diurnal and seasonal wind resource variability was captured in the hourly time series of wind speed, as described. Interannual variability (IAV) was not directly assessed because long-term (~10 years) meteorological data at hub height is necessary to develop those statistics. However, based on global observations and models, IAV can be reasonably approximated at about 6% [36]. Using the 6% value, two additional simulations were conducted at wind speeds of 7.23 (−6%) and 8.15 m/s (+6%) to capture the sensitivity of the results to the IAV; the impacts are shown in the sensitivity analysis in the section St. Mary’s Valuation Sensitivity Analyses.
2.2. Valuation Framework
Distributed wind and other DERs can often offer more than a single value element over their usable life. These benefit streams can include energy generation, ancillary services, environmental benefits, and renewable energy credits, as well as other benefits [37,38,39]. In addition to benefits accruing in various forms, they can also be attributed to various parties and be calculated using different methodologies. To appropriately account for each of the available elements, they must be assessed in a manner that takes these factors into account. The valuation framework provided in Mongird and Barrows [12] considers various points of view when considering values and costs associated with a distributed wind project. Examples of perspectives include the electric utility, utility customers, or even society at large. Different values will accrue to different perspectives, and allocating them to individual “value stacks” provides a comprehensive way of assessing the overall return of a project without attributing value to the wrong party. Many renewable projects will estimate a project’s levelized cost of energy (LCOE) as an investment planning metric and to compare different investment options on an equitable basis. While the LCOE determines what the USD/kWh or USD/MWh generation value must be to cover total project costs, it does not tell us whether the project is estimated to meet or surpass that value based on the benefits it can provide over its lifetime. Rather than only focusing on the cost of the energy generated, this analysis additionally focuses on the comparison of those costs to the estimated returns of the investment in the form of BCRs, broken down by the various benefit streams and stakeholders involved. Both BCRs and the LCOE for the St. Mary’s project are provided in the results of this analysis.
The distributed wind valuation framework provided in [12], which is applied to the St. Mary’s project in this report, outlines a step-by-step process to ensure that: (1) all appropriate stakeholder perspectives are being included, (2) the locational aspects and any potential constraints on revenue opportunities are being considered for the project, and (3) difficult-to-quantify benefits are still included in a qualitative manner at minimum.
The framework begins by defining benefits and costs applicable to all connection statuses (isolated or grid-connected), perspectives (utility, transmission-level authority, customer, society), and scenarios (front-of-the-meter (FTM) or behind-the-meter (BTM)), which is then reduced to match the characteristics of the specific project scenario. This procedure provides a systematic approach to identifying applicable benefit and cost elements.
The steps involved in the framework process were applied to the St. Mary’s reference case as follows:
- Define reference case details for St. Mary’s to account for its isolated (non-grid connected), FTM, cooperative-owned wind project status.
- Refine the full framework valuation chart from [12], outlining all available value streams and applicable cost elements for all project types to sections that apply to St. Mary’s, given the identified characteristics.
- Define project-specific factors (e.g., technology type, lack of energy market availability, co-located technologies, controls capabilities) to further refine value stream availability and applicable costs from the framework table.
- Define benefit and cost perspectives for St. Mary’s. These were ultimately determined to be the electric cooperative that owns and operates the distributed wind asset (AVEC) and the local (St. Mary’s) and regional (Alaska) society at large.
- Define and apply methodologies for value streams identified as applicable and achievable, given the project characteristics and cost elements for each perspective, as appropriate.
- Estimate present value benefits and costs over the course of the asset’s useable life to determine the estimated return on investment and BCR.
The outcome of the various steps in this process is described in greater detail in the sections that follow.
2.3. St. Mary’s Benefits
In the analysis of the St. Mary’s distributed wind project, the valuation framework from [12] was used to identify the various benefits applicable to the remote Alaskan village and the electric co-op that serves it. After identifying the value streams that are applicable to isolated FTM systems, a sub-selection of benefits was further identified as being specifically applicable to the St. Mary’s project, given the characteristics of the cooperative and the wind turbine, described in prior studies and reports [33,35,40,41].
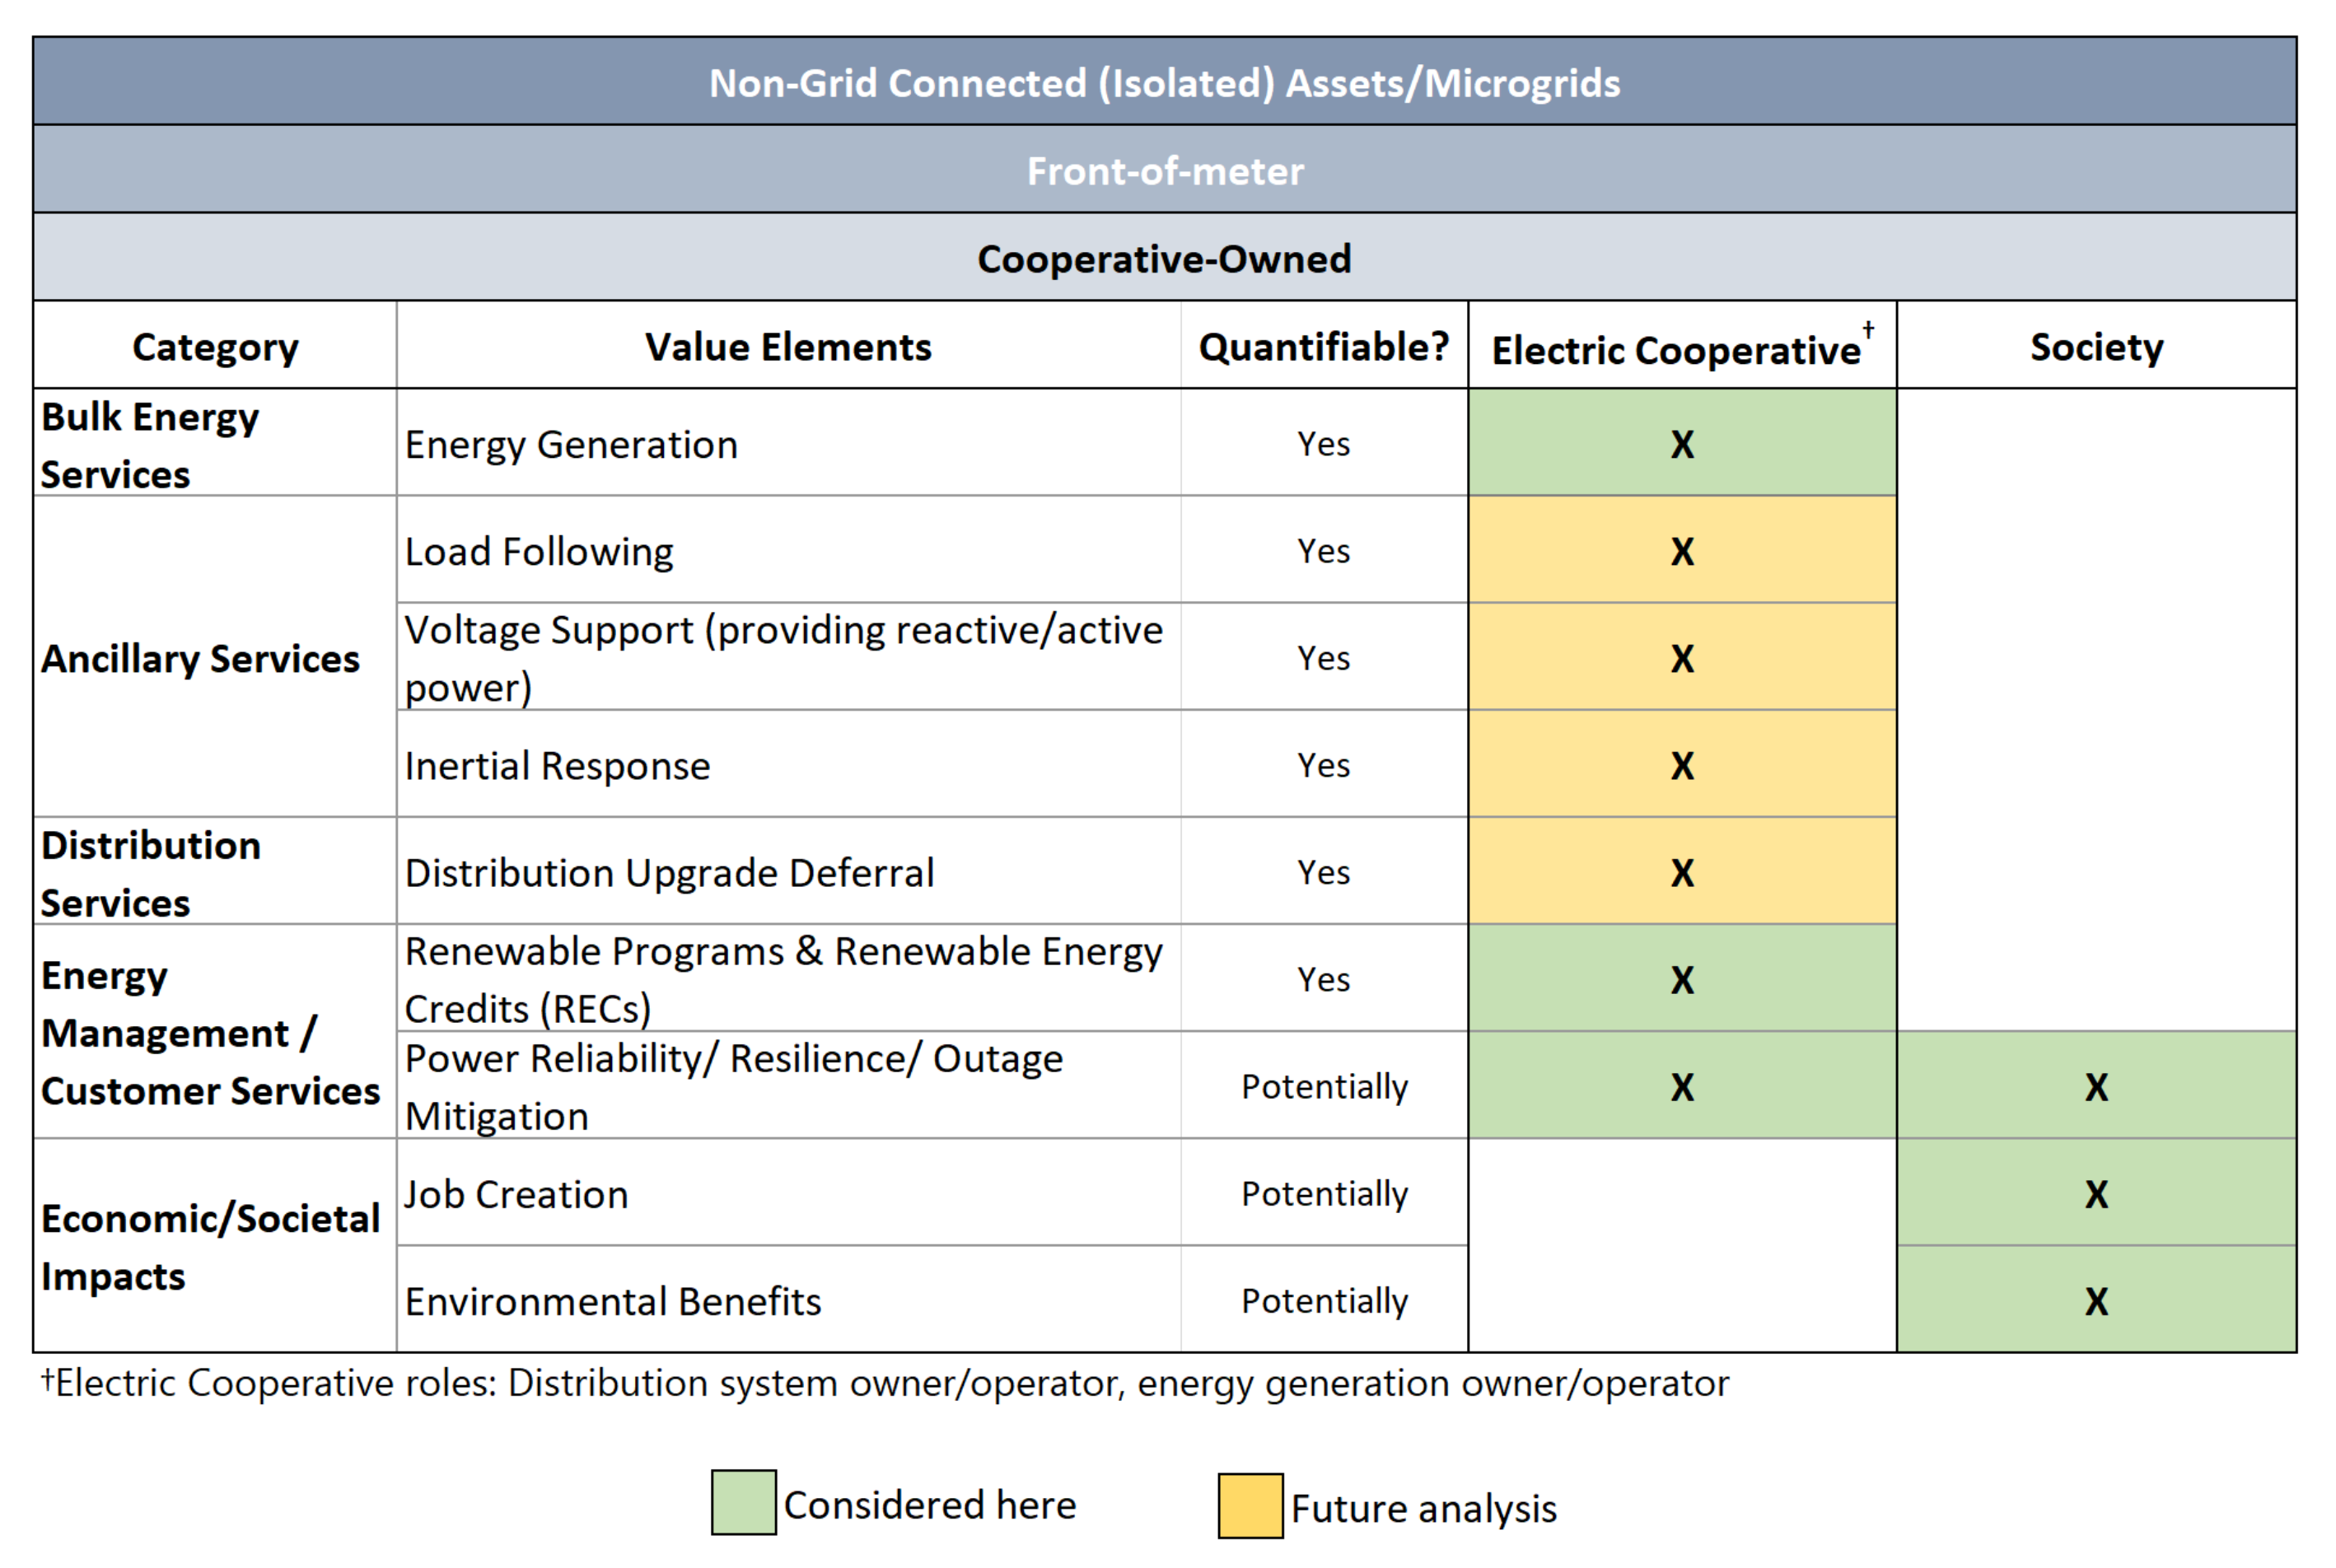
The reduced list of potentially applicable benefits and the subset identified for St. Mary’s are shown in Figure 2. In this scenario, the co-op is the operator of both the distributed wind asset and the distribution system for the community. Under different distributed wind use cases or projects, these responsibilities could fall to a larger utility, a balancing authority, a larger cooperative, or other entity. The applicability of value elements overall was determined through discussions with researchers who have previously covered the project, as well as through AVEC reports [33,35,41]. In most cases, for the St. Mary’s project, the cooperative is at the receiving end of the benefits. Some potential benefits from [12] were not applicable to the given project. For example, given the isolated nature of the system, transmission-level benefits were not available. Green cells in the table indicate that that benefit is considered in this report, whereas yellow indicates benefits set aside for future analysis as more data becomes available.
For St. Mary’s, given that the town is disconnected from a larger grid and all generation occurs on-site, the opportunities for value are primarily limited to local value. This includes benefits from energy generation in the form of avoided fuel cost savings that would otherwise be required to operate on-site diesel generators, renewable energy certificates (RECs), ancillary services, distribution upgrade deferrals, and resiliency benefits. In addition to benefits that accrue to the cooperative, there are additional benefits in the form of resilience, job creation, and environmental quality improvements that society receives. By considering both the values that accrue to the cooperative and those that accrue to the locality and society at large, a more accurate picture of project benefits can be achieved.
A number of benefits highlighted as potentially applicable to St. Mary’s in Figure 2 are not currently considered in this phase of the analysis (indicated by yellow shading), including ancillary services and any distribution upgrade deferral value. These benefits can be evaluated in future research due to current data availability restrictions.
2.4. St. Mary’s Costs
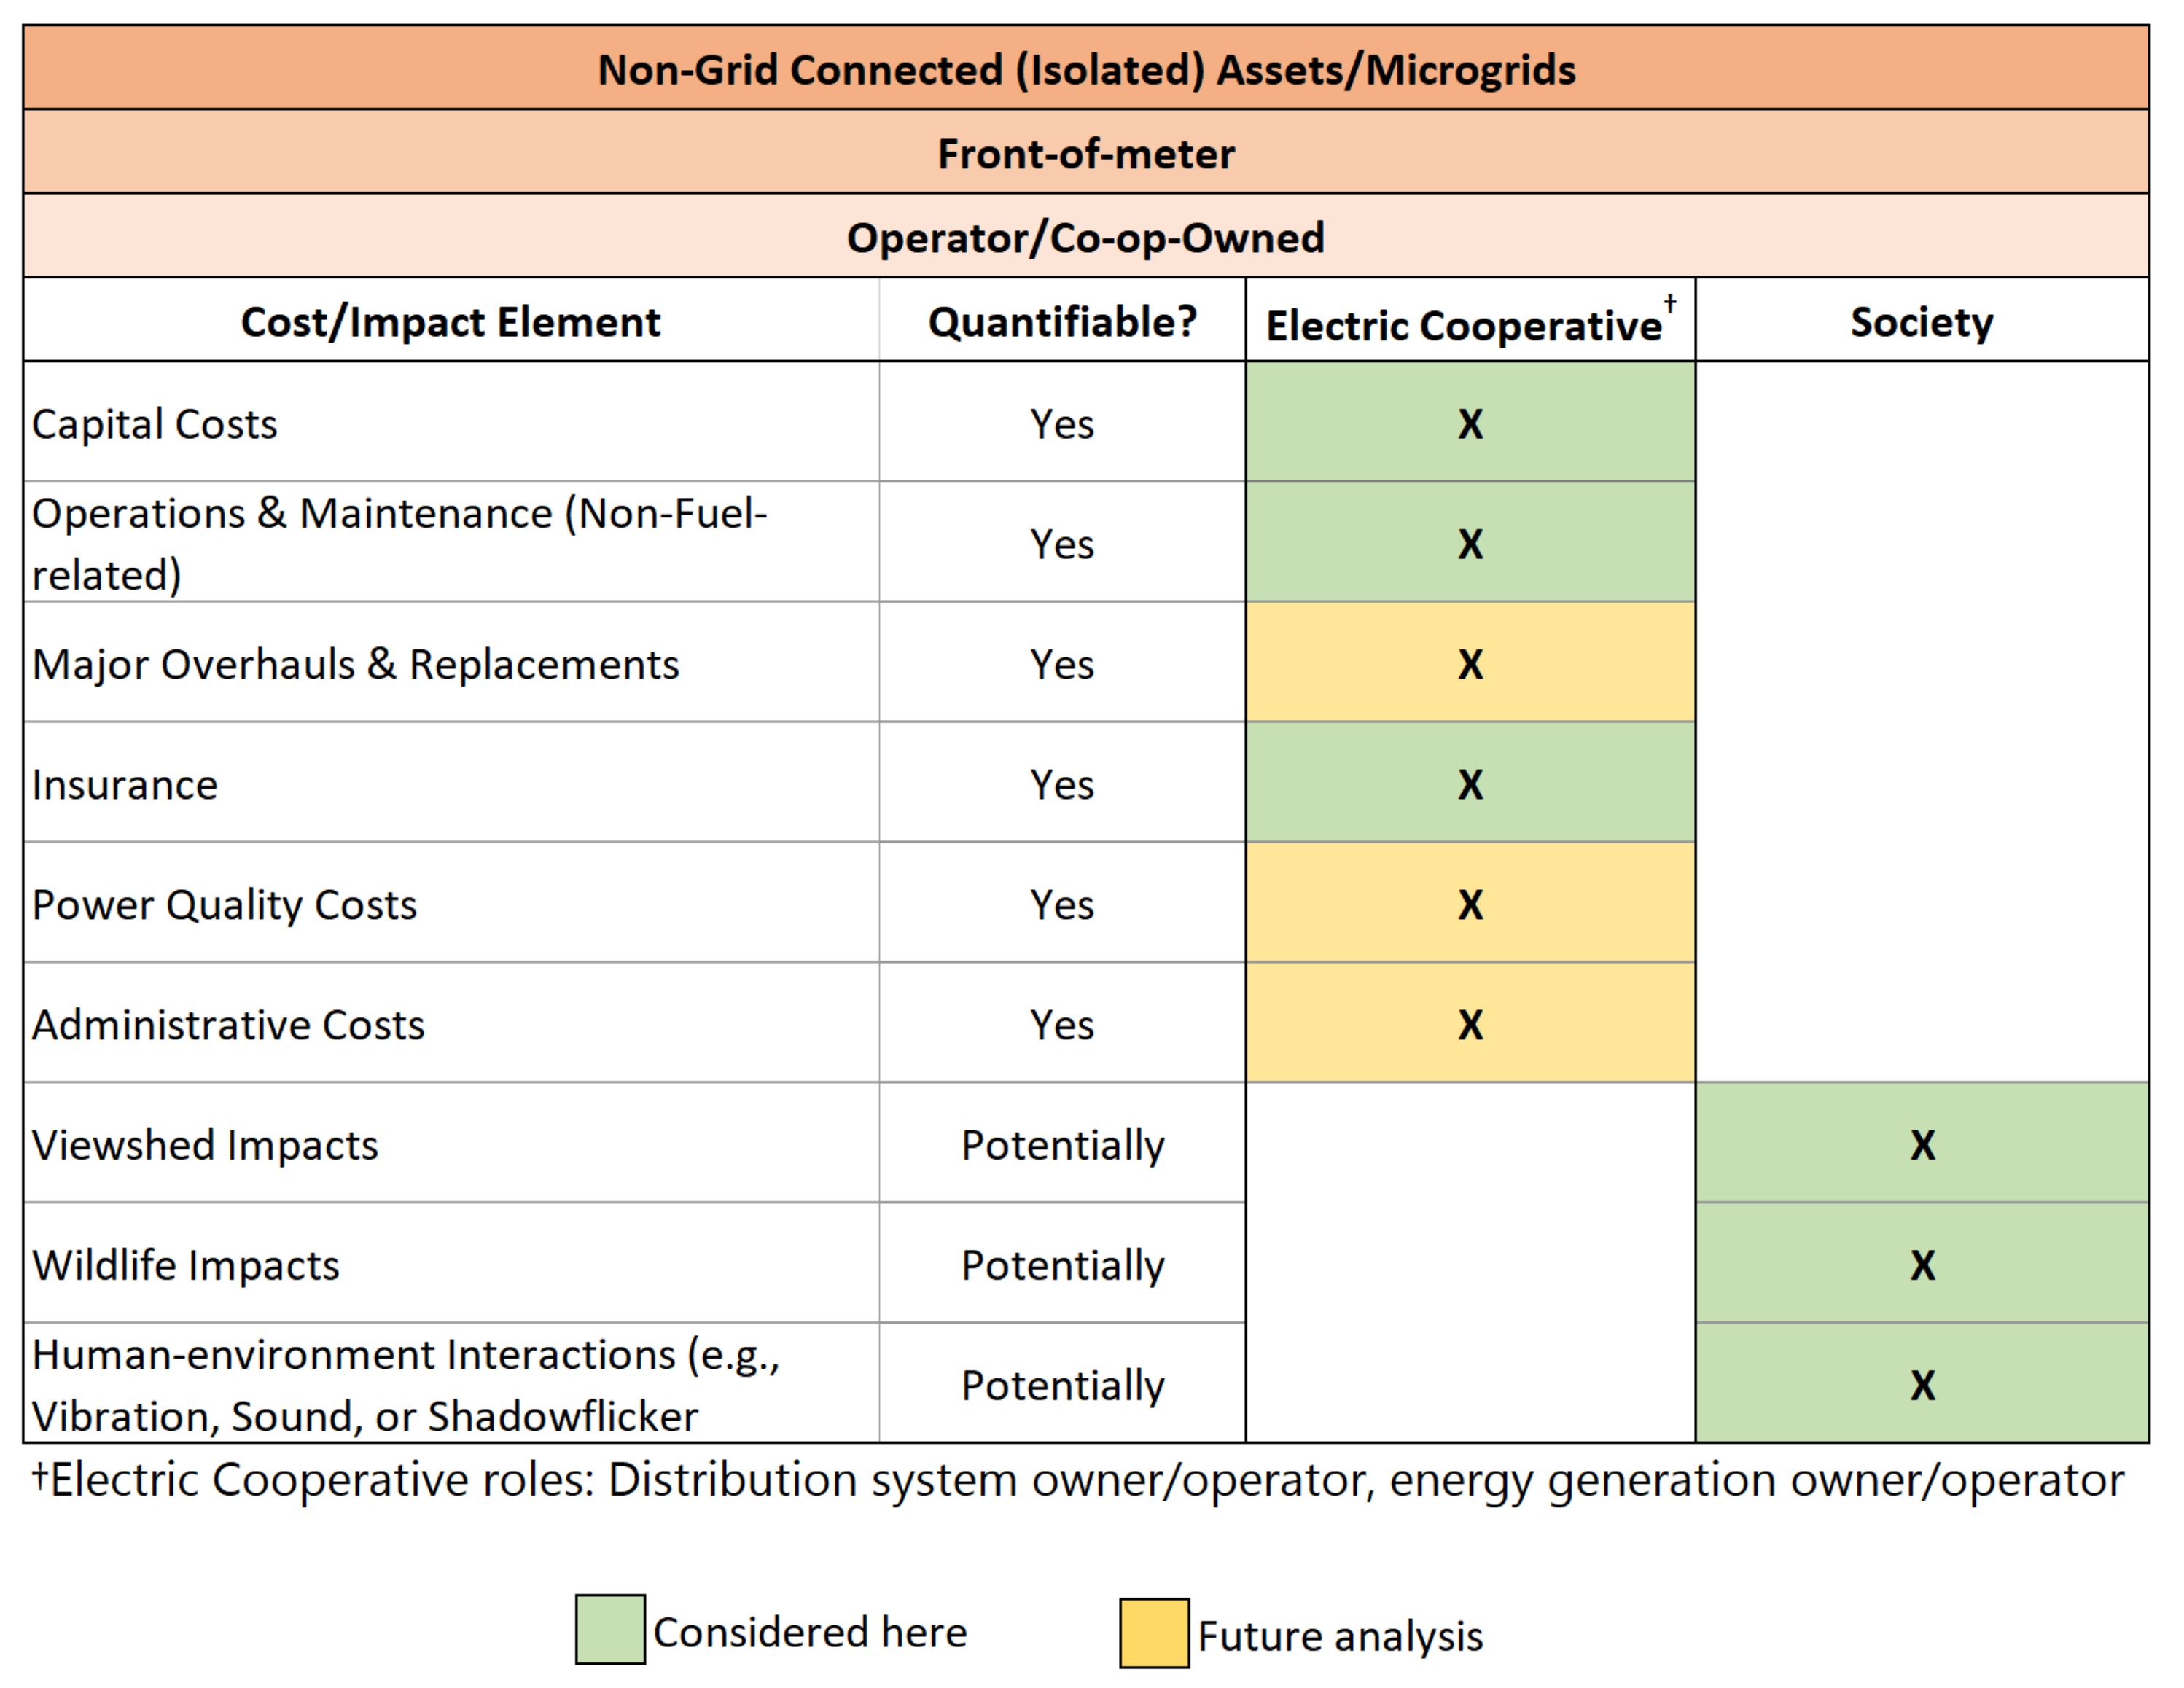
In addition to benefits, costs, both quantitative (e.g., capital cost, operations, and maintenance (O&M) costs) and qualitative (e.g., viewshed impacts, wildlife impacts) must also be considered across various perspectives. Figure 3 below shows the costs that are applicable to the St. Mary’s distributed wind project following the valuation framework process. Since detailed system data were not available, these costs were identified through project reports and annual reports from the cooperative [33,35,41]. While costs such as power quality costs and major overhaul and replacement costs may be significant costs to a remote system like St. Mary’s, there was inadequate information about the system and potential impacts to extrapolate these costs. Additional costs may be included in future analyses if more information becomes available.
Given the use case attributes of the project, various costs and impacts are considered. The majority of these elements are directly attributed to the electric cooperative in the form of capital expenditures as well as O&M costs. Other cost items that may apply to similar projects were evaluated and found to be not applicable based on the project configuration for St. Mary’s. For example, given its status as a cooperative, there is no tax liability for the project, nor is there property tax in St. Mary’s. In a non-isolated system, additional impacts and costs, potentially taken on by a third perspective in the form of a larger cooperative that is both a generation and transmission provider, would be expected.
2.5. Methodology and Equations
This section will cover the individual methodologies for each quantitatively assessed benefit and cost considered in this phase of the analysis. Qualitatively assessed elements will be discussed in the next section. Table 5 documents the assumptions leveraged while conducting an evaluation of costs and benefits.
2.5.1. Benefit Methodology
Descriptions of each of the benefits calculated quantitatively in the analysis and their methodologies are described below. Benefits are calculated across a 20-year project lifetime.
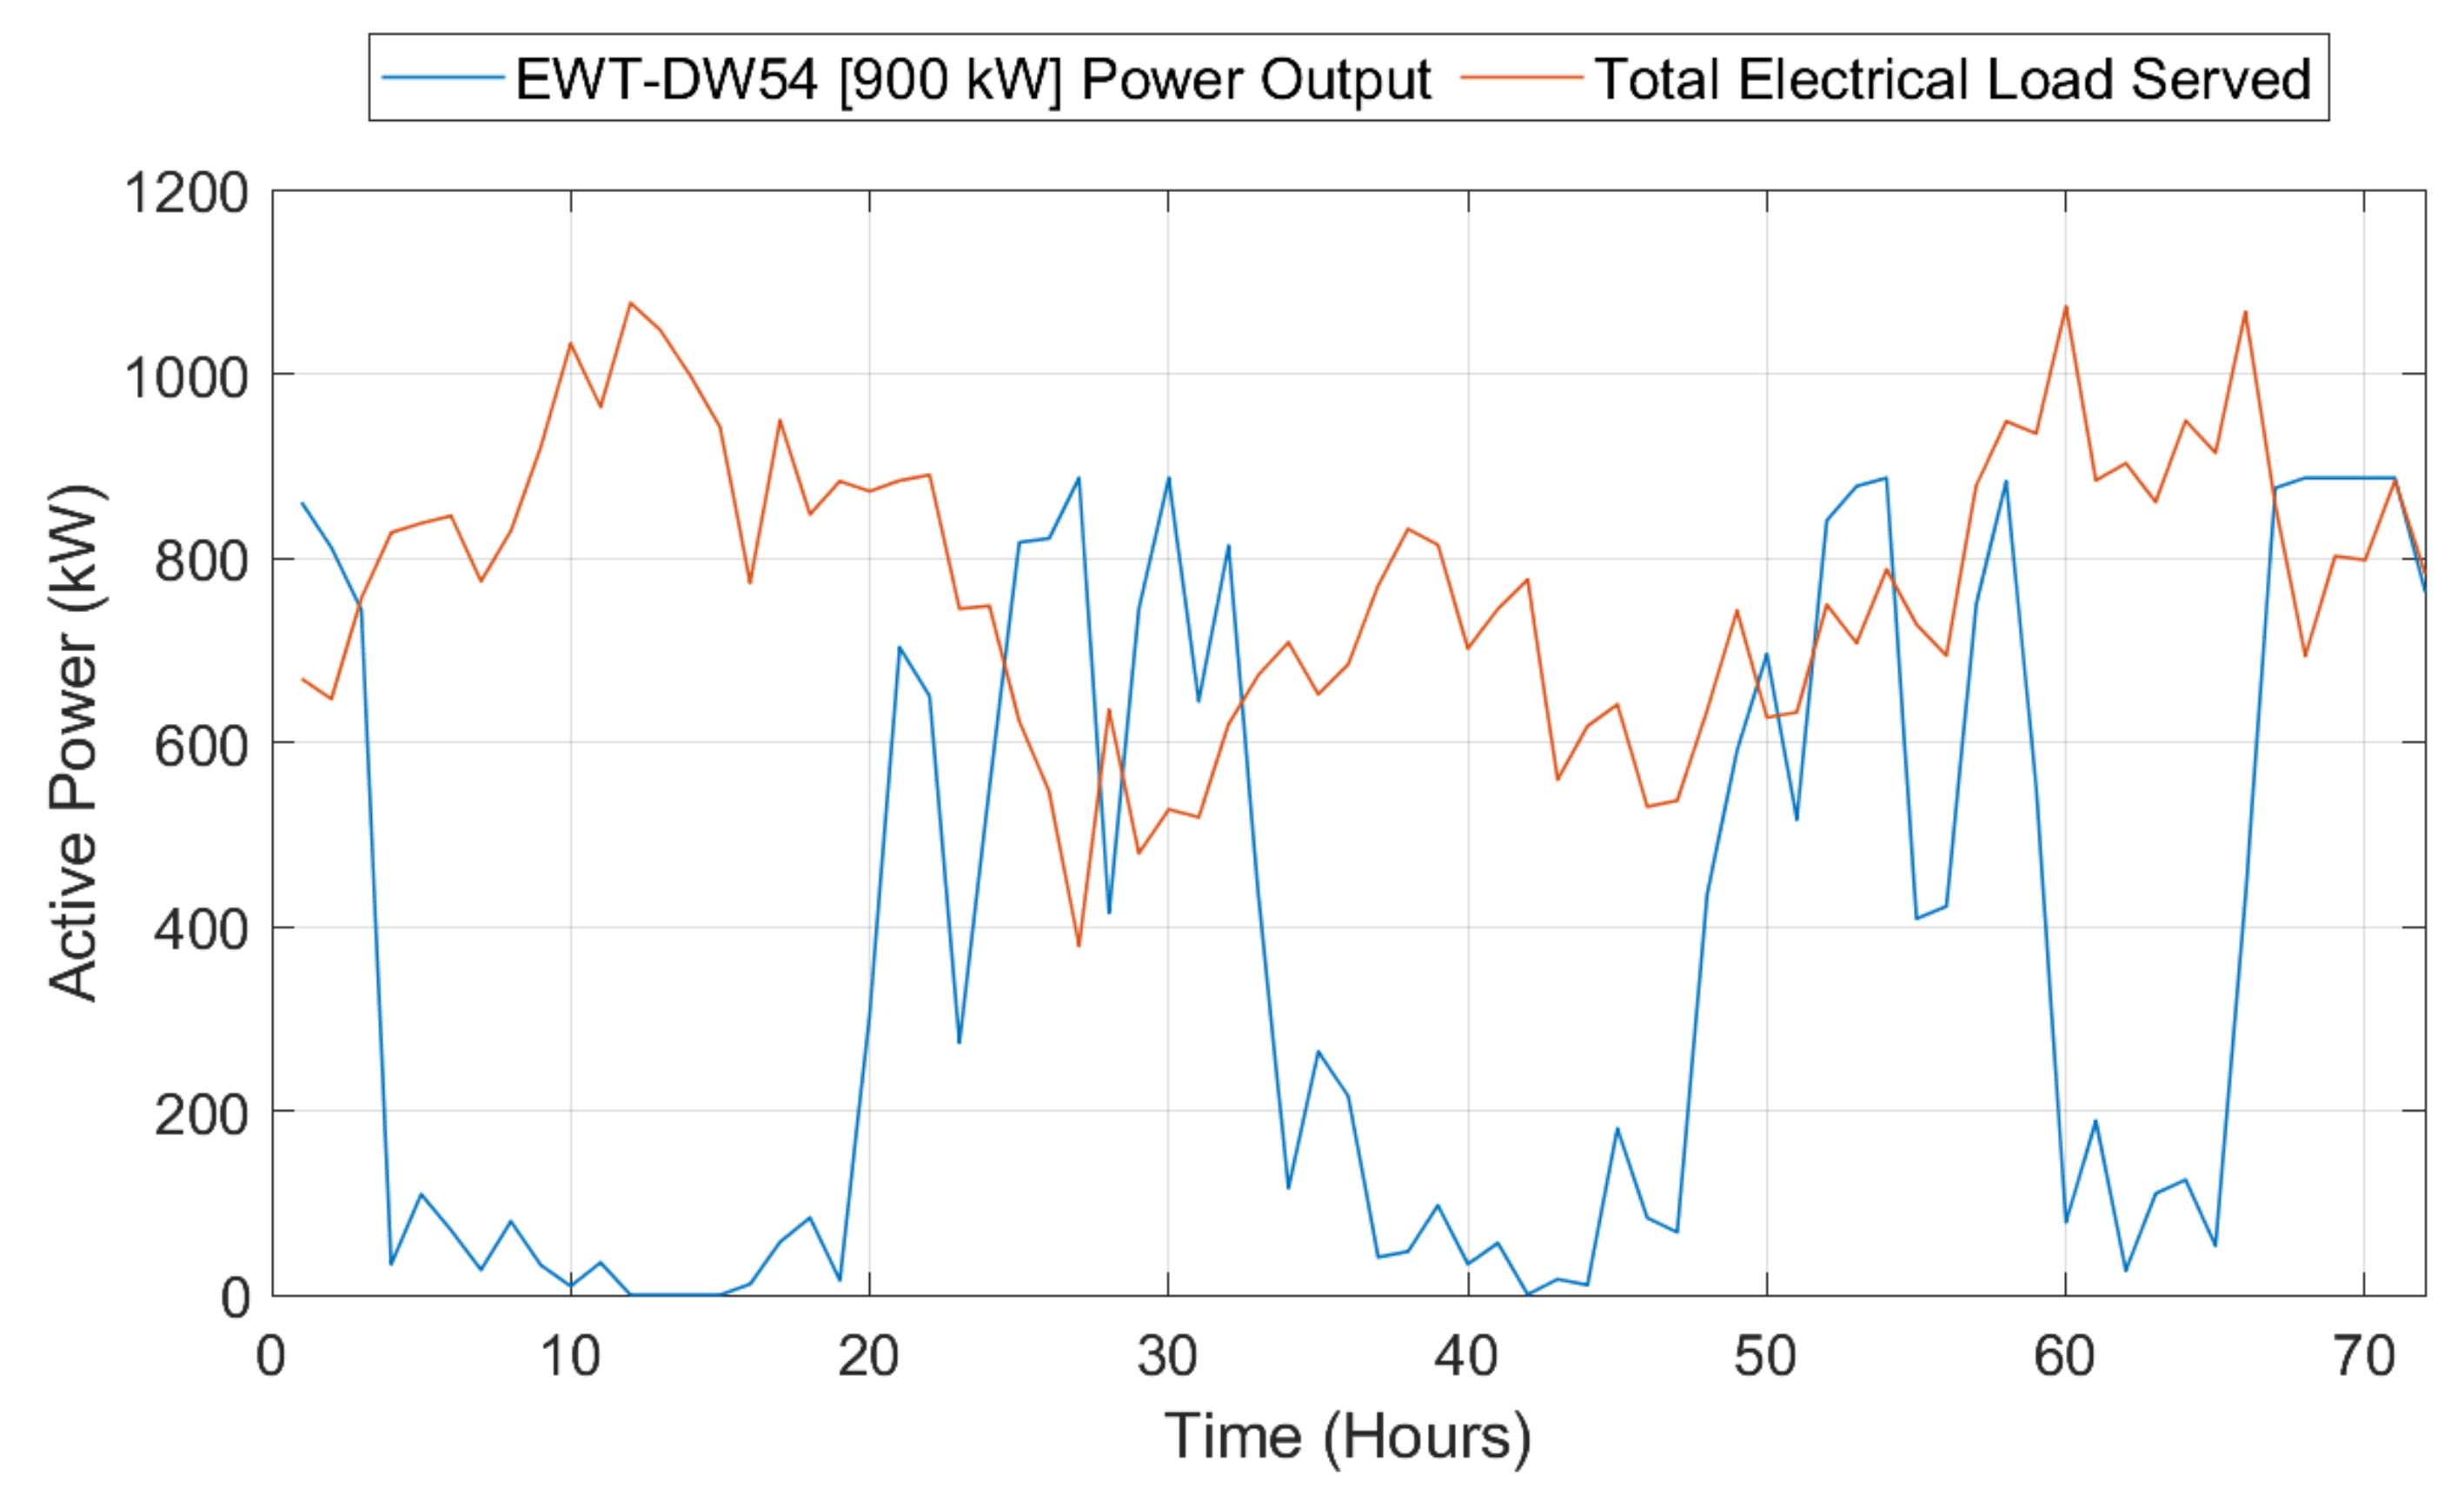
- Energy Generation—Without the wind turbine, St. Mary’s and the other communities receive their energy generation from three on-site diesel generators. The value of wind energy generation, therefore, is determined by the avoided cost of using the diesel generators and the associated cost of fuel consumption. Fuel consumption was compared between two scenarios: a system with no wind turbine generation present and a system with both the wind turbine and the diesel generators present. The difference in fuel usage between the two scenarios allows us to determine the overall avoided cost. It should be noted that in the latter case, the diesel generators provide 100% spinning reserves for the wind turbine. This reflects the actual operational schedule that the cooperative enforces in St. Mary’s while they gain operational experience with the new wind turbine. It is also worth noting that the operational schedule followed in St. Mary’s will not necessarily be the longer-term case at St. Mary’s or in other projects and that different values could be observed. The two scenarios were estimated using simulated production data for the generators and wind turbine using HOMER [45], a power system simulation software, and synthetic load data based on average load data along with efficiency curves for the generators and the production curve of the turbine. Hourly simulated data were created for one year, summing to an annual load of 5,507,850 kWh and an annual turbine generation of 2,269,084 kWh. The simulated turbine production and electrical load for three days (1–3 January) are shown as an example in Figure 4.
It can be observed that there are points in time where the available wind power output exceeds the total electrical demand. This excess wind power would be curtailed in an operating system that lacks storage and is tabulated in HOMER as excess electricity. For this scenario, the total excess electricity is almost 25% of the total wind power output. This reduces the wind turbine capacity factor from a potential of 38% to just below 29%. HOMER simulates the power system by making energy balance calculations for each time step of the year, which is a good balance of computational resources and modeling accuracy for year-long analyses. However, it is important to be aware that HOMER is not capturing the power flow dynamics of the system, such as frequency and voltage, that could impact the actual fuel consumption and wind curtailment of the operating system. With the 100% spinning reserves used in this analysis, those dynamics are unlikely to have much of an impact, but with very low spinning reserves, the simplifications may be insufficient.
In the diesel generators-only scenario, fuel consumption was estimated at 375,643 gal/yr. For the scenario in which the wind turbine is added to the diesel generators, fuel consumption drops to 241,109 gal/yr, leading to an annual fuel savings of 134,534 gal. The 2019 annual report from AVEC states that St. Mary’s 2019 delivered fuel cost was USD2.8519/gal [41]. It is unclear from the available information whether or not this cost is a result of subsidies or other financial assistance. For the current analysis conducted here, this static fuel price is considered for the first year. It is recognized that fuel price variability or the potential loss of subsidies have the potential to have a high impact on results as fuel costs in the past have contributed between USD0.0955 and USD0.3245 of the total USD/kWh cost [46]. Future analysis can explore the sensitivity of this component and find tipping points where fuel cost determines a negative or positive return when all else is held equal. To forecast future fuel prices through the project’s lifetime, we used energy price forecasts from the U.S. Energy Information Administration (EIA) Annual Energy Outlook 2020 to grow the cost of fuel from the provided value year [47].
Given the estimated fuel price for each year of the project lifetime (2019–2039), we can estimate the benefit from the avoided fuel cost for each year of the project’s usable life and the net present value. The net present value (NPV) of each year’s fuel savings calculation is shown in Equation (1).
where is the difference in fuel consumption with wind and without wind, is the year, is the fuel price in USD/gal for year , and is the discount rate.
- Job Creation/Economic Impacts—Job creation and regional economic impacts for the St. Mary’s distributed wind project were calculated using the National Renewable Energy Laboratory’s (NREL) Jobs and Economic Development Impact (JEDI) model [48]. JEDI economic impacts are divided into three different categories: on-site earnings, supply chain impacts, and induced impacts. All three of these categories were considered for the St. Mary’s project, and their sum determined the total economic impact to society from the St. Mary’s distributed wind project.
To implement the JEDI model, St. Mary’s total project cost data were used in combination with JEDI default inputs where itemized project data were not available. For example, total project capital costs for the wind project were USD5,512,024 [33], and default proportions and coefficients in JEDI were used to determine the proportion of this capital expenditure that went to each cost subcategory (e.g., turbine, tower, foundational materials). Ongoing operational costs for the model were assumed to be USD0.05/kWh based on estimates provided in [35], which was then multiplied by the annual estimated generation output in kWh.
The region within the model was defined as the state of Alaska, meaning that economic impacts are calculated across the state’s industries and workers. A more local analysis was not pursued due to data limitations for such a small and remote community. Percentages of sales purchased in Alaska and manufactured in Alaska were estimated for each material/labor type from JEDI default percentages.
Based on the various cost components as well as operational costs across the usable life of the wind system, JEDI was able to estimate the broader economic impact of the project in the dollar value of services, materials, and labor, which is presented in the Results section later in this report.
- Environmental Benefits—The environmental benefits of a renewable generation project, such as the wind turbine in St. Mary’s, stem from the avoided pollution that would have been emitted by alternative non-renewable generation. The assumption for St. Mary’s, given the existing presence of three diesel generators, is that new generation would also come in the form of diesel generators. For the purposes of this valuation, the scope was limited to only include avoided carbon dioxide (CO2); that is, it is assumed that all the carbon in the diesel is converted to CO2. It is worth noting that other non-CO2 pollutants will also be avoided through decreased fuel use, which will create a positive benefit that is not accounted for in this phase of the analysis. Future iterations on this research project may investigate the benefit of other avoided pollutants.
The assumed CO2 emitted per gallon of diesel was taken from the U.S. Environmental Protection Agency’s Greenhouse Gases Equivalencies and is estimated at metric tons of CO2 per gallon of diesel [49]. The social cost of carbon, which allows us to monetize the avoided CO2 generated, is taken from the Whitehouse Interagency Working Group estimates on the social cost of greenhouse gases and is assumed to be USD76/metric ton of CO2 [50]. Using these two components together, in combination with the avoided annual fuel use from wind previously documented in the energy generation benefit section, the net present value benefit calculation is shown in Equation (2). The discount rate used in the environmental benefit analysis is a societal discount rate of 2% [43].
where is the CO2 emitted per gallon of fuel and is the social cost of carbon.
- RECs—Renewable energy certificates, or RECs, are tradable certificates of proof of 1 megawatt-hour (MWh) of electricity generated through renewable energy or energy efficiency. These RECs are often bought by utilities, which use them in their overall efforts to meet state renewable portfolio standards. RECs can also be used for voluntary purposes, though this voluntary market tends to have lower prices since buyers can draw from a larger national supply of RECs. Since Alaska does not have a renewable portfolio standard, RECs can be sold across state boundaries in the voluntary market. Due to lack of detailed data, we do not know if AVEC is selling RECs from this project, but we include them here since they appear to be possible benefits. According to a report from NREL, voluntary national REC prices were about USD0.70/MWh in 2018 [51]. We adjusted this value to 2019 dollars and multiplied it by the annual MWh produced (as estimated in the HOMER analysis), then grew it at an annual rate of 2% over the life of the project. We then took the total net present value of REC value to the cooperative over the life of the project in a manner consistent with the previously described benefit equations.
Each of the annual benefits was evaluated as described over the usable life of the project and discounted back to calculate the total present value. Within each perspective (electric cooperative or society in the case of St. Mary’s), the benefits estimated are “stacked” to obtain a total value. This is ultimately compared against the stacked costs for each perspective in the Results section and discussed in greater detail later in this report.
2.5.2. Cost Methodology
Costs, including capital expenditures, insurance, and O&M, were calculated across a 20-year project life, as was done for the benefits. Quantifiable costs for the St. Mary’s system were estimated from the project closeout report conducted by AVEC for the U.S. Department of Energy (DOE) in 2020 [33]. Initial capital expenditures for the wind turbine totaled USD5,512,024 (2019 dollars). AVEC was only responsible for a fraction of the capital expenditure, with the state of Alaska providing award funding of over USD4.3 million, the U.S. DOE providing just over USD779,000, and the Alaska Energy Authority providing just over USD275,000 for the project. We assume that the remaining USD108,929 was funded by AVEC through debt. We calculate the 2019 cost of debt as 3.37% by dividing interest payments by long-term debts from the 2019 AVEC annual report [41]. Over the 20 years of the project’s lifetime, total debt service payments were calculated as annualized payments of USD7574 (the sum of interest and principal payments). The net present value of this is USD102,788 in 2019 dollars, which is lower than the initial capital expenditure because the cooperative’s weighted cost of capital is higher than its cost of debt.
No insurance costs were independently provided for the project. In order to include this component, the insurance cost as a percent of capital was assumed to be the same as that of an alternative DER project owned and operated by an electric cooperative [44]. Using this rate of 0.271% of the initial cost of the project and growing insurance costs at an assumed 2% annually, we found the net present value of insurance costs to be USD235,249 in 2019 dollars. As AVEC is an electric cooperative, it does not face federal or state income tax. Additionally, St. Mary’s does not have property tax, so no taxes were included in costs.
Annual O&M costs were assumed to be USD0.05/kWh, as taken from a report prepared for AVEC by V3 Energy, LLC, which uses an O&M calculation prepared by the Alaska Energy Authority (AEA) [35,52]. This O&M rate, which is used in AEA grant and loan applications, is only given on a variable (USD/kWh) basis. While it is ideal to split fixed versus variable O&M rates, this single O&M rate was the most applicable number found for this project as it was used in previous analyses for this project [35]. It is unclear, based on the information available, whether any of the annual fixed O&M costs, which are typically represented in USD/kW/year, have been converted to a variable USD/kWh cost based on an expected output value and included in the variable O&M estimate provided [35]. It is assumed for this analysis that this value encompasses all O&M costs for the project, and no additional fixed O&M costs were included. An annual O&M escalation rate of 2.5% was assumed, given that no escalation rate was provided in the report, based on changes in the producer price index for machinery repair between 2019 to 2020 [53]. The O&M cost was multiplied by the annual estimated output of the wind turbine. The same generation output was assumed for each subsequent year of the project’s 20-year usable life. The net present value of these expenditures was found using the electric cooperative’s discount rate. Equation (3) shows the formula used to calculate the NPV O&M cost to the cooperative.
where is the annual energy generated by the turbine in kWh, and is USD0.05 at and at , its value is found by multiplying the previous year’s cost by 1.025.
2.6. Qualitative Benefits and Costs
In addition to the benefits and costs that are more easily quantifiable, there are value elements that are difficult to quantify. This is typically the case for more subjective costs such as viewshed impacts or noise impacts, which, oftentimes, must rely on a willingness to pay estimations and benefits such as resilience and other value elements that can have various definitions or ways of being measured. The subsections below discuss several applicable benefits and costs that are relevant to the St. Mary’s project but are limited to a qualitative discussion as the form of assessment.
2.6.1. Resiliency
Distributed wind projects can provide resiliency in multiple ways to multiple parties, both locally and more broadly. One of the more common ways of looking at resiliency is in power outage avoidance. Power outages have three main types of economic impacts: (1) damage to electricity systems (2) energy loss impacts to customers, such as the cost of lost production for commercial and industrial facilities, and (3) regional economic impacts, which include the indirect impacts on suppliers and buyers of the impacted businesses and households [54].
The resilience benefits of the St. Mary’s distributed wind project are characterized as the added ability (provided by the distributed wind system) to adapt to disruptive events and recover to an acceptable state of operation. From a valuation perspective, these benefits can be described as the avoided costs of these disruptive events—costs that do not occur when the wind system is present. An outage in the case of St. Mary’s would likely be prompted either by a disruption to the fuel supply for the diesel generators or through equipment failure. In the event that the annual fuel supply to the village was unable to be delivered, outages could occur up until the point that additional fuel could be flown in or delivered through alternative methods. With appropriate data and modeling, both scenarios can be explored in future analysis for this project, and the expected avoided costs can be explored through outage mitigation for each. The associated probabilities of each event occurring would additionally have to be investigated for a more realistic analysis of avoided costs. In addition, a scenario in which new costs are brought on by the presence of the wind turbine, such as a communications outage between the turbine and AVEC, is another area worth exploring to ensure new vulnerabilities are also being considered.
Methods have been developed and adopted for investigating the direct or avoided costs of momentary or short-term interruptions through customer surveys [55]; however, there are no standardized methods for finding the impacts of long-duration outages. The impacts of long-duration outages can be very different from short-duration outages, especially when considering the regional economy. The outcomes of an outage lasting a few hours compared to one lasting multiple days will be substantially different and difficult to accurately quantify with a high degree of accuracy. The latter of these two event types grows in complication as various compounding effects can begin to occur over time and health and safety are added in as vulnerabilities. For example, a lack of heating in a major winter storm event can quickly cascade into a much more costly outcome overall in terms of emergency responses and, in some cases, loss of life. Impacts from these major events can be much higher in remote communities that are more difficult to access, troublesome to provide emergency services to, and more likely to face harsh weather. While regional economic models have been developed to estimate the losses associated with long-duration outages, these models are location- and event-specific and do not generally yield standardized measures that can be used by utilities [56]. They also require extensive economic data, which, in the case of St. Mary’s, would be difficult to acquire because of business confidentiality concerns.
2.6.2. Viewshed Impacts, Wildlife Impacts, and Human–Environment Interactions
Just as with benefits, there are costs and impacts to society that can be difficult to monetize or quantify. For the St. Mary’s project, this includes viewshed impacts, wildlife impacts, and human–environment interactions, each of which are described in greater detail in this section. It should be noted that given that distributed wind projects are inherently more dispersed and smaller in size and/or turbine quantity than large, centralized wind farm installations, the implied impacts to the environment, viewsheds, and wildlife are suspected to be smaller overall.
- Viewshed Impacts—These impacts are the costs associated with the “visual intrusion” of a distributed wind asset. Viewshed impacts are typically included in the environmental impact assessment for a wind project to see if there are any disruptions to scenic resources nearby. Visibility analyses are conducted to ensure that the wind projects are not overly disruptive or located close to landmark sites by evaluating the visibility of the wind turbine from various perspectives while accounting for atmospheric refraction and the earth’s curvature [57]. While there are accepted methods for calculating the area that is within the viewshed of the wind turbine, it is difficult to put a cost on the disruption to those who can see it. Willingness-to-accept is a method used in various studies in the literature [58,59]; however, these generally require very site-specific surveys and interviews with impacted stakeholders—information that is currently unavailable for St. Mary’s. Given that the wind turbine is within sight of the town, it stands to reason that there could be some viewshed impact costs associated with the project. A more detailed analysis would have to be conducted to determine what that impact might be.
- Wildlife Impacts—Wind turbine effects on nearby wildlife are also typically included in an environmental assessment for a generation project. This cost is associated with any degradation in habitat for the surrounding environment and, depending on the location, can affect wildlife and fish as well as plants. There is ongoing research in this area that is attempting to evaluate both the depth and breadth of the environmental and wildlife impacts from wind projects, specifically. These impacts can come in the form of collisions with the turbines, overall deterrence from the area, wildlife fatalities, as well as other impacts [60,61]. Overall, just as with viewshed impacts, even if impacts are capable of being quantified, they remain difficult to monetize as a cost and would typically rely on willingness-to-pay methodologies for the preservation of wildlife and ecosystems by those in St. Mary’s and any associated value they have for the wildlife and ecosystems in and around their village. Due to limited data, this cost is only included qualitatively.
- Human–Environment Interactions—Other costs that are considered qualitatively in this analysis include those under the category of human–environment interactions. This category covers costs and disruptions other than viewshed that are associated with stakeholders residing within closer proximity to the turbine, which may be affected by noise, shadow flicker, or other outcomes from the wind turbine. Much like viewshed impacts, which can impact stakeholders much farther away, this cost can be evaluated with willingness-to-accept analysis. Given the distance from the village residential and commercial residents, it is not expected that these costs are substantial for this project, but a more detailed analysis would need to be conducted to determine whether this estimate holds true.
3. Results
Given the assumptions and analysis listed in the previous sections, we are able to present the valuation results in Figure 5 for the St. Mary’s distributed wind system. These benefits and costs are informed estimations, though they give an idea of the likely magnitude and range of values. Additionally, we note that while net present values were originally found for 2019, the first year of the project, we adjusted those to 2021 dollars using the U.S. Bureau of Labor Statistics Consumer Price Index for All Urban Consumers [62].
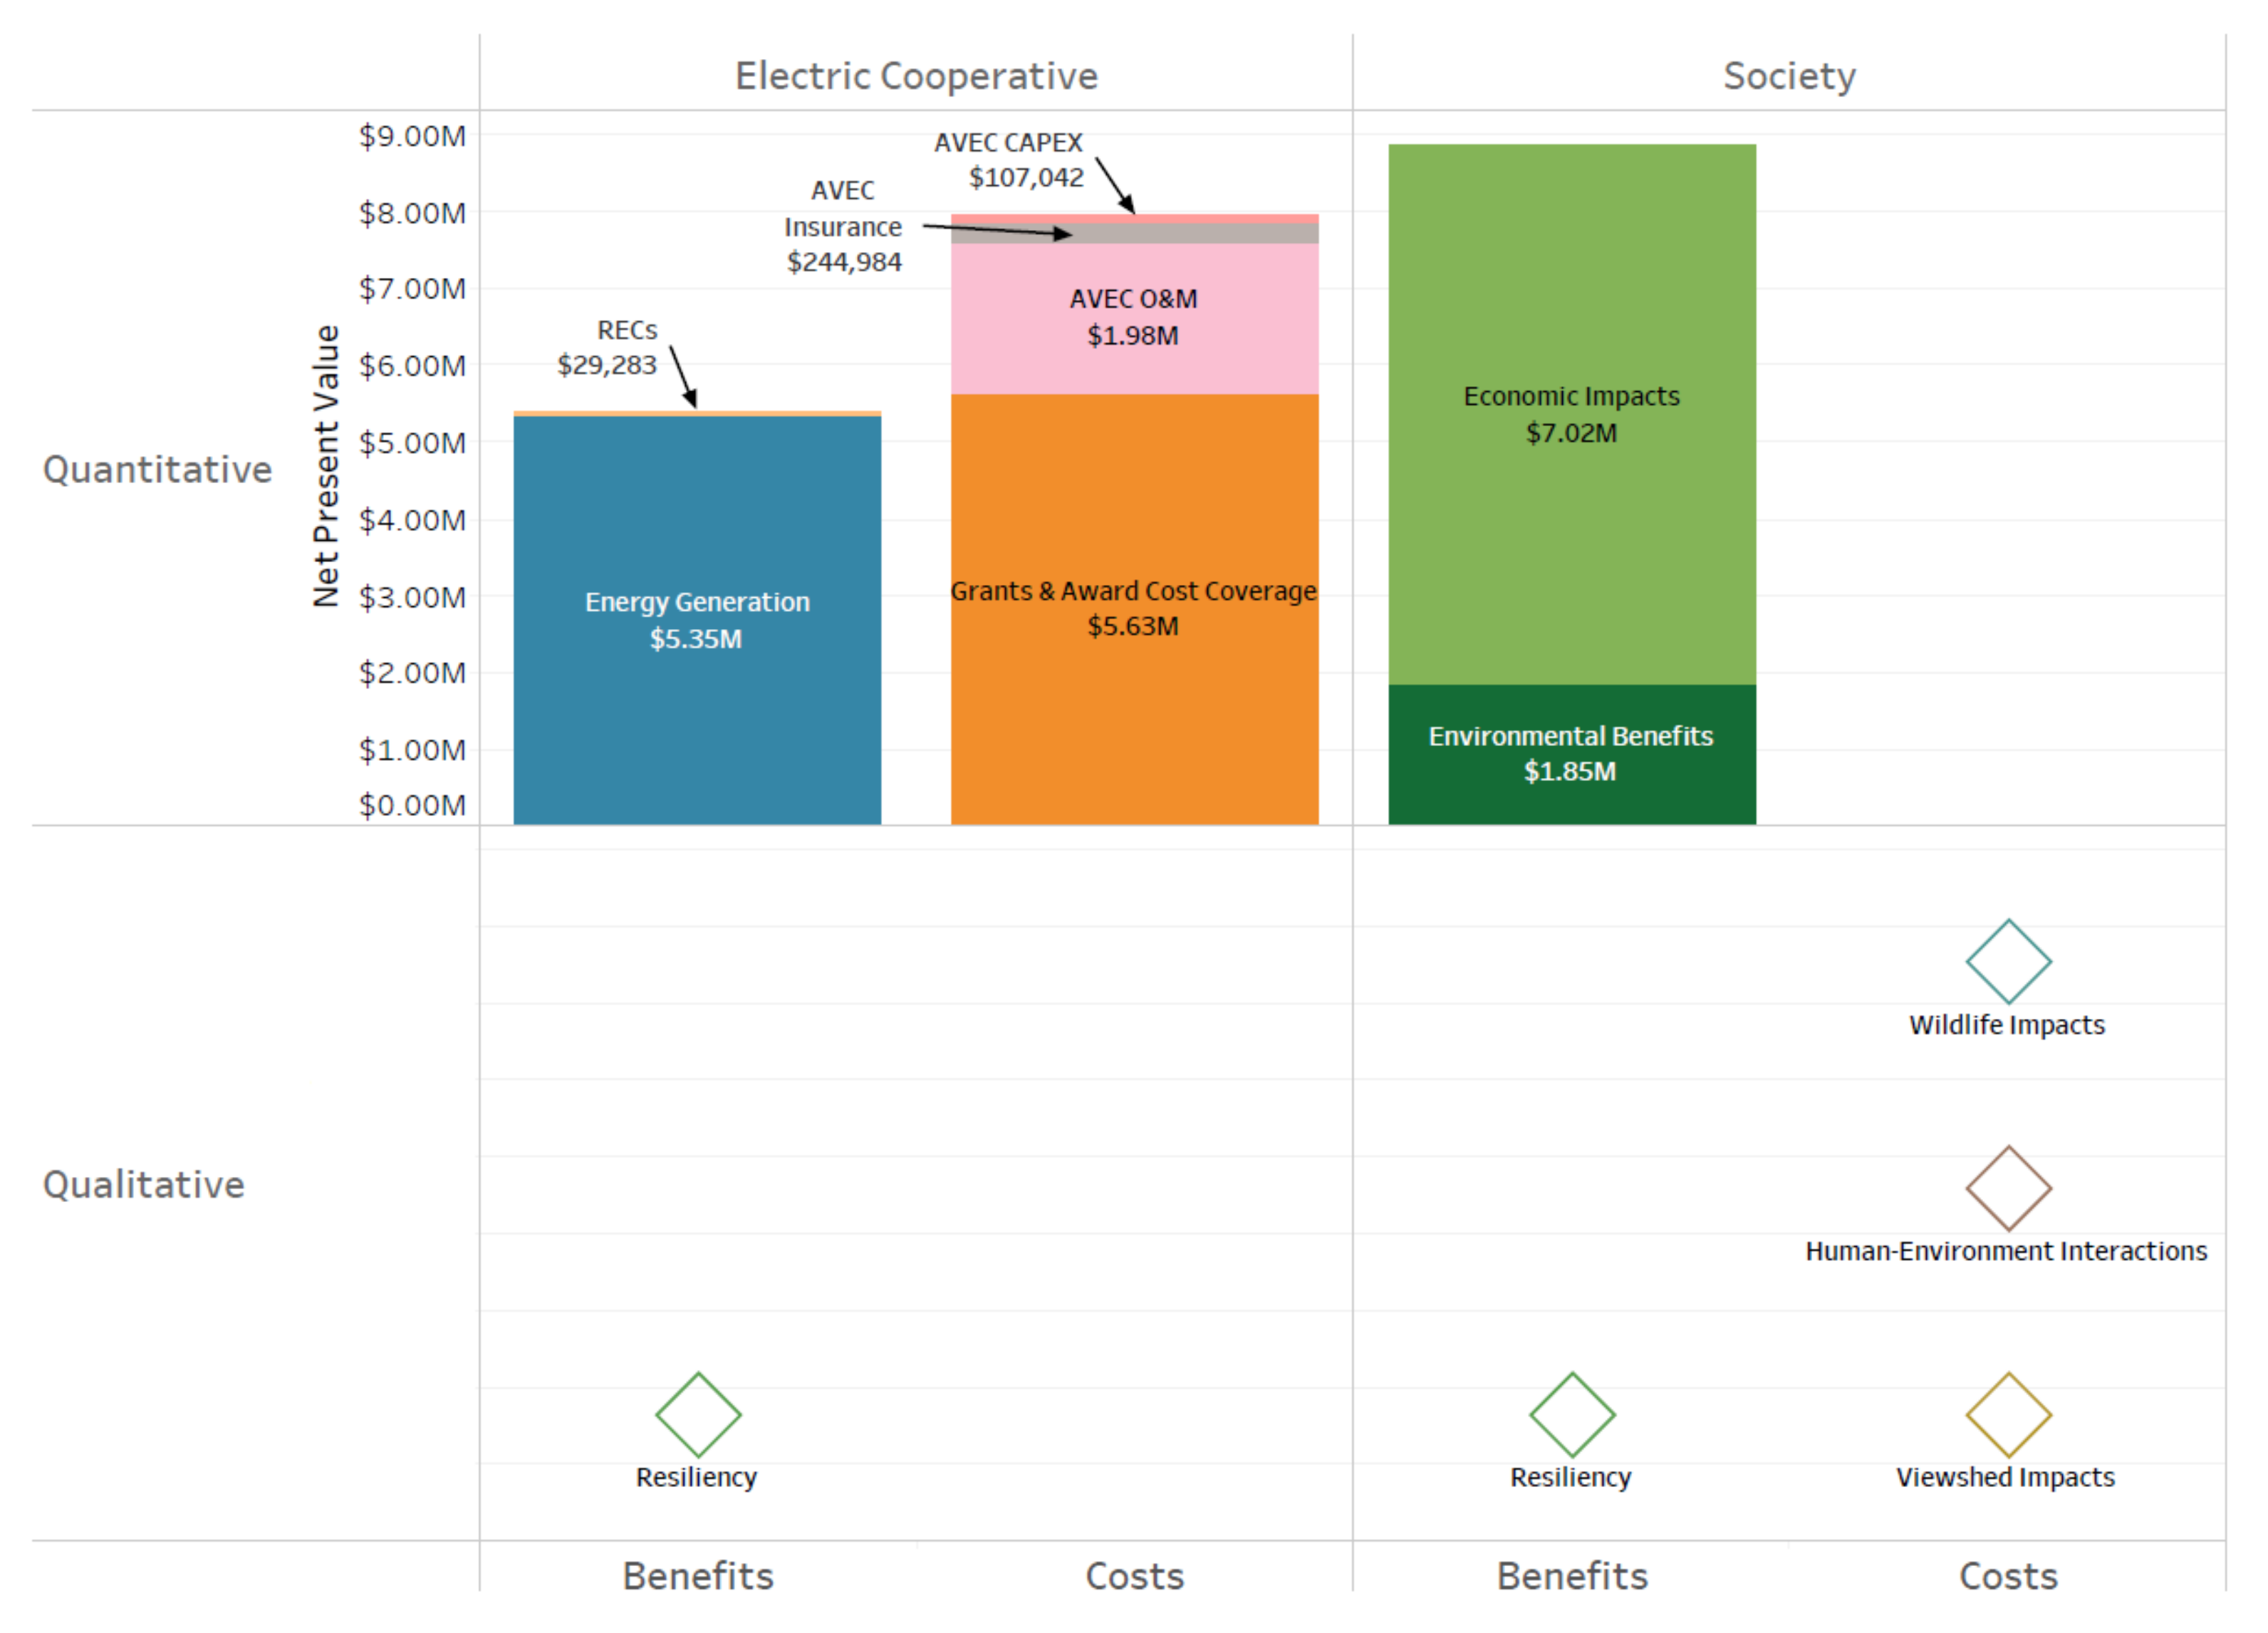
For the electric cooperative, the net present value of energy generation was estimated to be USD5,347,444, and RECs were estimated to be USD29,283, summing to total electric cooperative benefits of USD5,376,727. Total system costs were estimated to be USD7,961,659, though a large portion of this was funded through grants and awards. In fact, total costs to the electric cooperative summed to only USD2,558,564, most of which was for O&M. We chose to represent the almost USD6 million in grants and awards under electric cooperative costs rather than societal costs because, if there was no external funding, these capital costs would be faced by the electric cooperative.
There are several societal benefits that have a large value. The environmental benefits of the system, such as the avoided CO2 from diesel generators, totaled USD1,848,556 over the lifetime of the project. The economic impacts to Alaska through wages, supply chain impacts, and induced effects were estimated to be USD7,020,571, just over half of which came from the one-time costs of project construction. Overall, when observing the project from the electric cooperative’s perspective, the BCR is only 0.68 when grants and funding are included. When societal benefits of economic and environmental impacts are also considered, however, the BCR increases to 1.79. While the all-inclusive BCR is clearly more favorable and demonstrates how a broader perspective of benefits can lead to more agreeable project results, it is worth noting that multiple societal costs have not been quantified and are only included qualitatively due to data availability. It stands to reason, therefore, that the higher BCR after including societal benefits may be lower, though potentially still positive, if the additional societal costs are considered. This marks an area for further exploration in the St. Mary’s project as additional data becomes available and societal impacts are more understood.
While the focus of this analysis is on the economic returns of the project to the various stakeholders involved, it can be useful to additionally calculate the LCOE of the project. The LCOE allows for easy comparison of alternative technology options on a cost basis. The LCOE for the St. Mary’s project is estimated to be USD0.226/kWh when all costs are included. This value is based on the assumed financial parameters previously discussed, in addition to an assumed construction period of one year, 80% leverage during construction, and a 20-year cost recovery period. In comparison to the base case, we calculated an LCOE based on the total capital cost to AVEC after awards and grants. The LCOE after these incentives came out to USD0.053/kWh, which is significantly lower than the base case and in line with LCOE estimates after incentives for large (>100 kW) distributed wind systems in the literature [30].
St. Mary’s Valuation Sensitivity Analyses
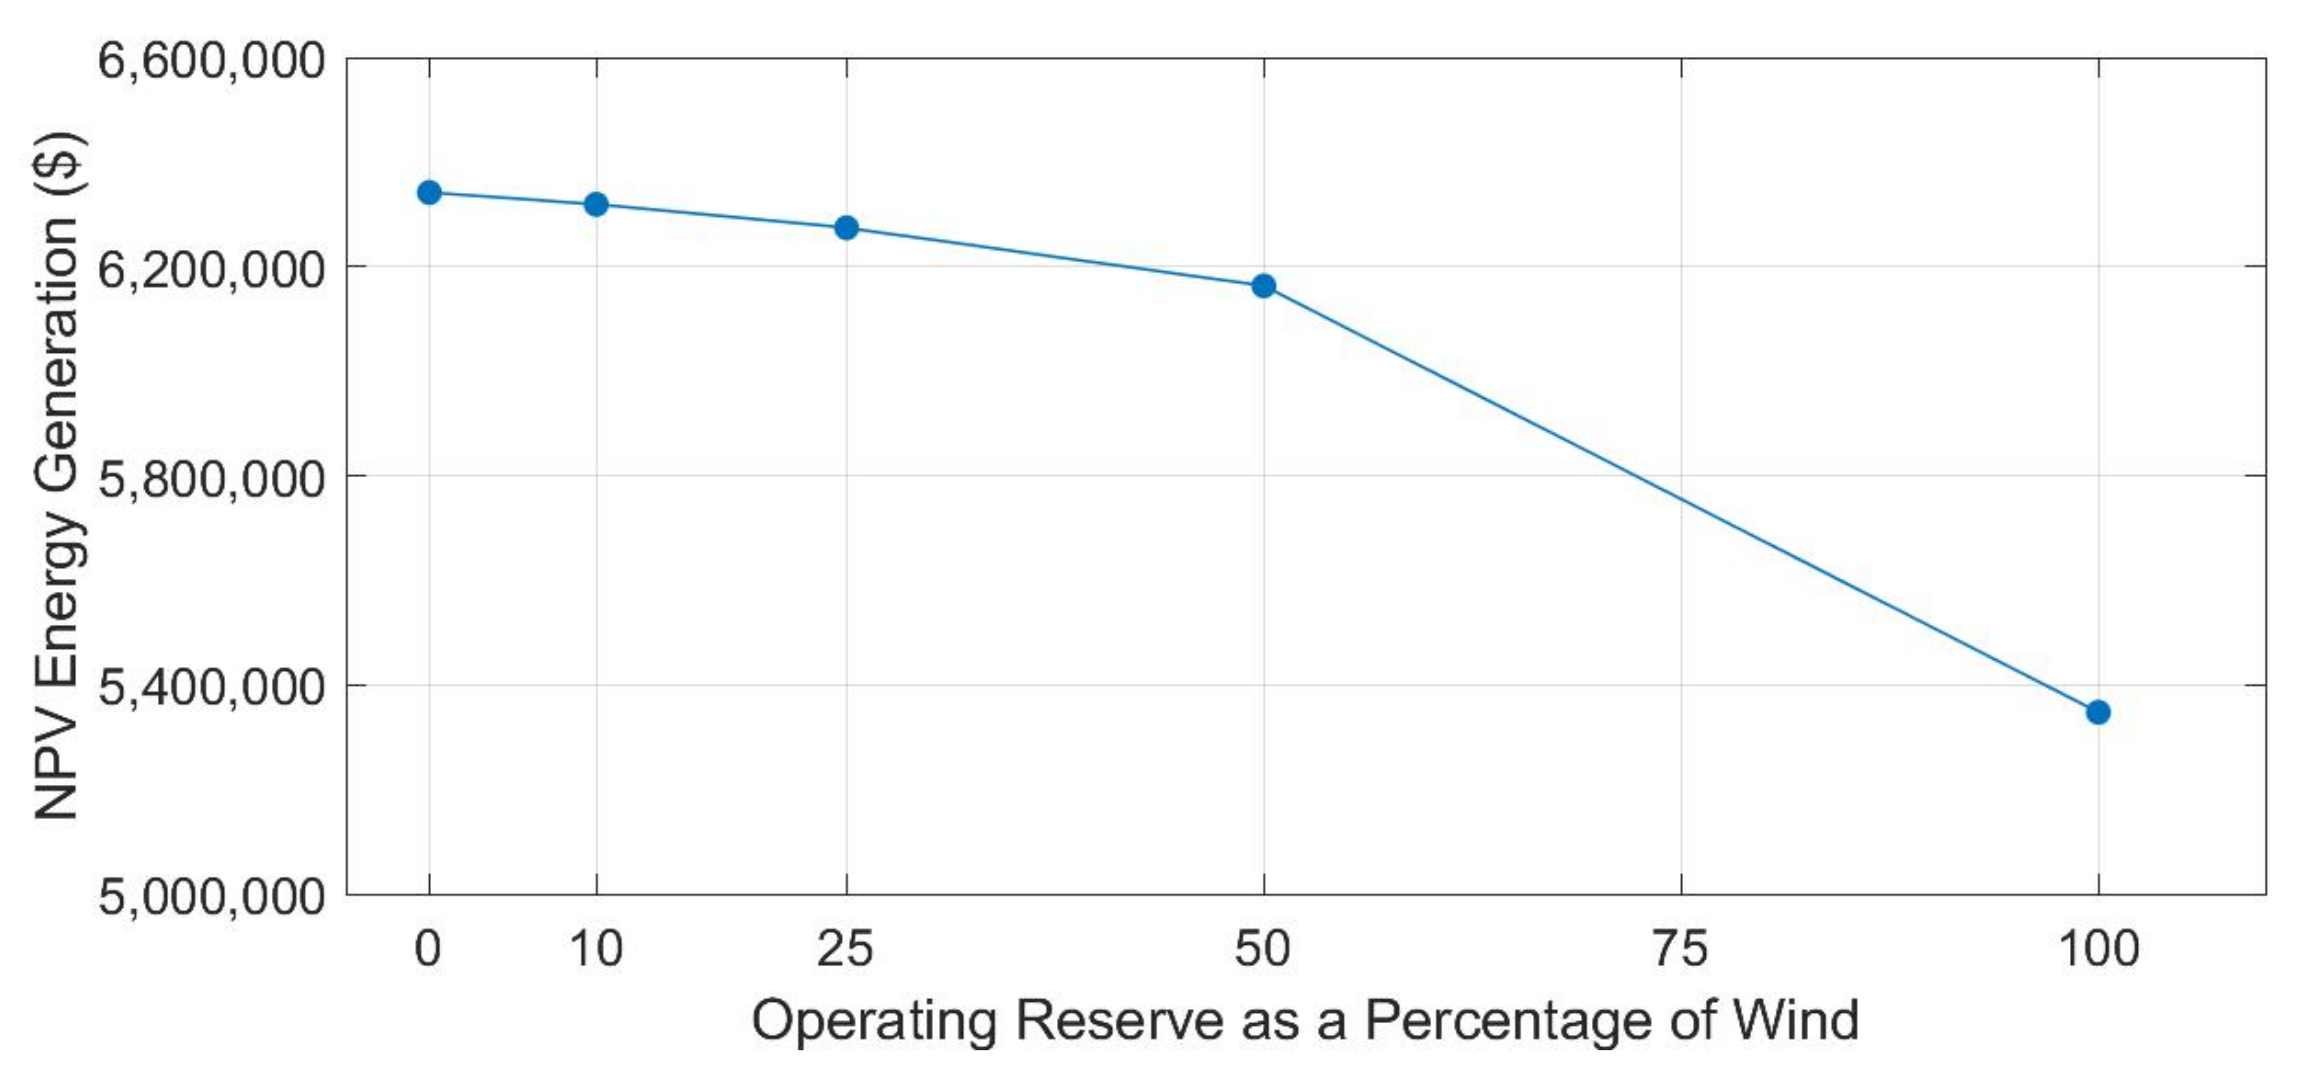
Under the current operational schedule in St. Mary’s, the on-site diesel generators are providing 100% of the spinning reserves. This schedule is in place while AVEC gains operational experience with the new wind turbine, but this is leading to greater than necessary contingency preparedness and an opportunity for additional avoided cost. Greater energy generation benefits could be possible if the diesel generators were not always providing these reserves and could reserve their fuel supply. One way to shift away from 100% spinning reserves would be through improved wind forecasting. With 5 to 10 min of forecasting, the electric cooperative could gain a sense of the “firm wind” available and might be able to operate their diesel generators more efficiently or even shut units off occasionally, saving on fuel costs in addition to any wear and tear on the assets from operation.
Reduced spinning reserves scenarios were modeled in HOMER by changing reserve requirements as a percentage of the wind generation. Modeling revealed the fuel consumption from a year of operation at various levels of required operating reserve. Gallons of fuel saved were then multiplied by the fuel price for each year to determine the NPV. We found that if a fifty percent operating reserve schedule was applied, the NPV of energy generation grows to USD6,163,099, a 15.3% increase over the 100% spinning reserve scenario. This scenario brings the project BCR up to 1.89 when societal benefits are included. Other scenarios show that the value of energy generation begins to level out as operating reserves as the percent of wind generation falls further under the 50% mark, as shown in Figure 6, but still marginally increases overall value.
An additional sensitivity analysis conducted around the valuation results revolves around the assumed cost of O&M. The O&M costs taken from [35] are considered to be quite high at USD0.05/kWh. While the O&M costs came from the Alaska Energy Authority [52] and likely account for the high cost of labor and shipped materials for repairs in extreme and remote environments common in Alaska, we also conducted an analysis using an alternate assumption that O&M costs are USD40/kW-yr (equivalent to USD0.016/kWh, here), taken from [30]. We find that lifetime O&M costs are reduced to USD648,533 rather than USD2 million. This lowers the overall costs of the project to USD6.6 million rather than USD8 million, but the costs of the project are still greater than the total benefits to the electric cooperative, which only sum to USD5.4 million, giving an updated BCR of 0.81.
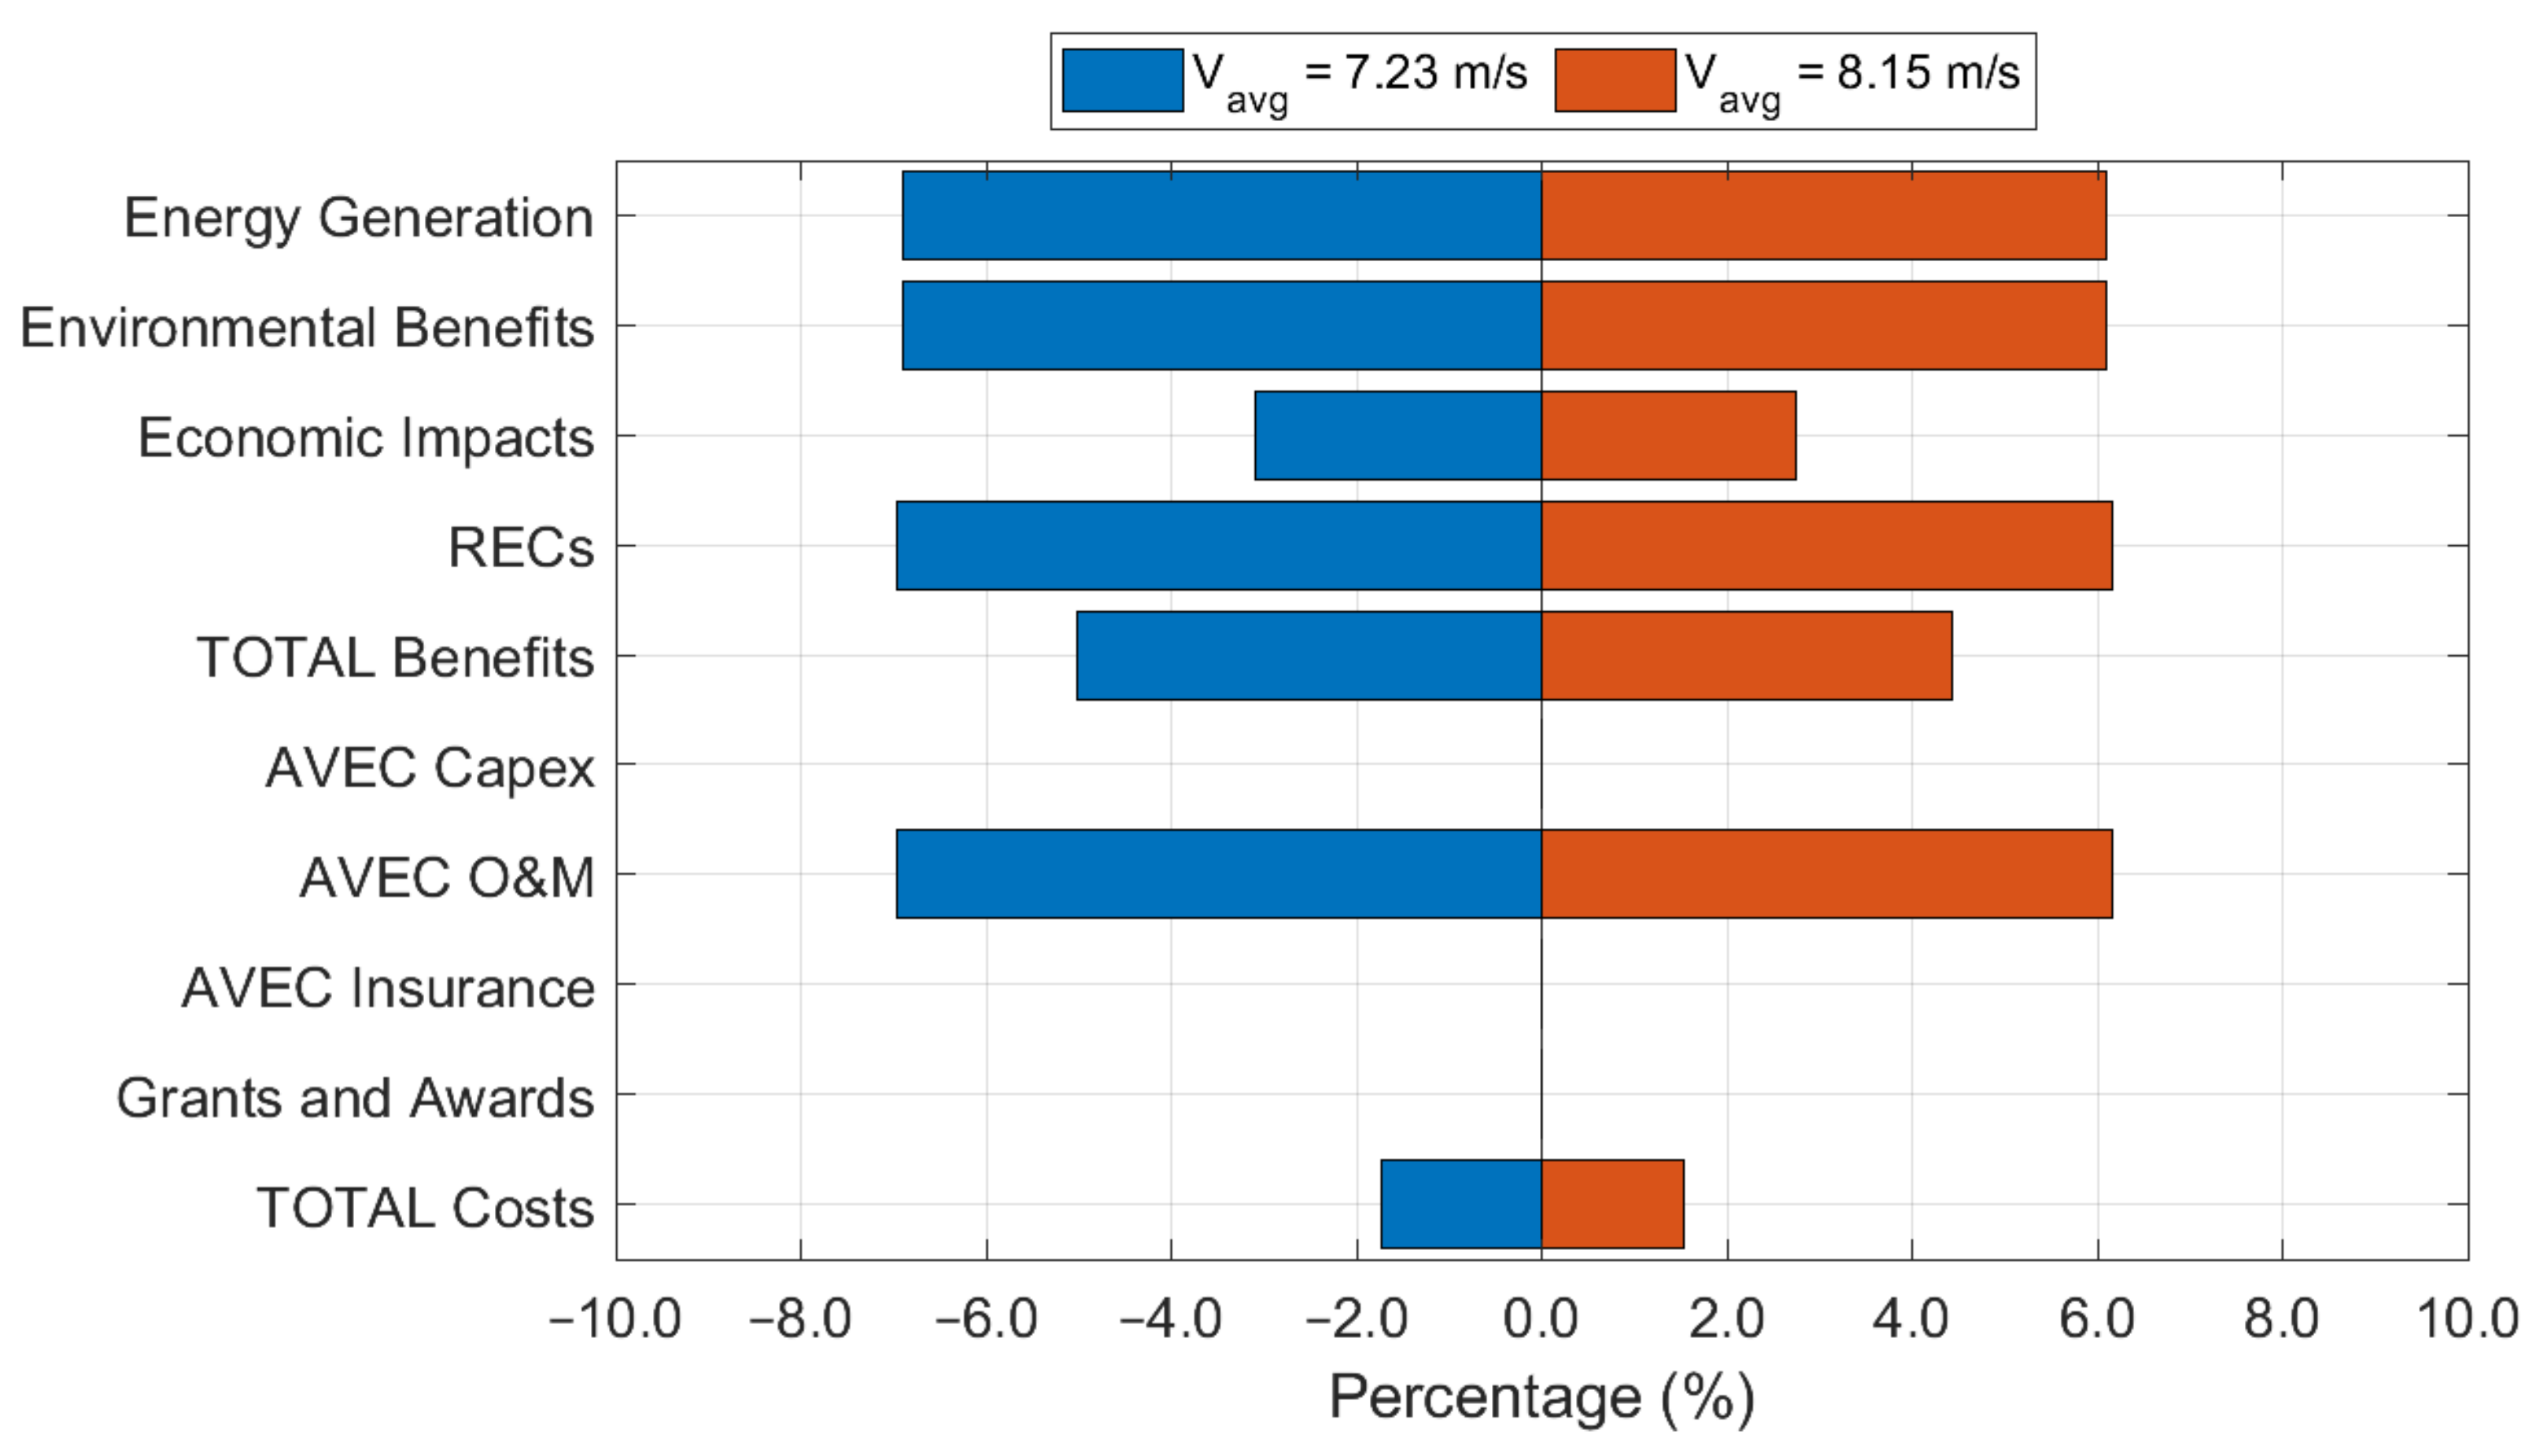
As wind variability between years was not captured in the synthetic data, a sensitivity analysis was conducted to demonstrate how a 6% difference in IAV (as estimated from [36]) would impact the results. We found that for value elements affected by fuel consumption, the benefits change by about ±2–7% (Figure 7). The overall trends in BCR would not change with normal IAV in the wind resource, with the BCR varying by about ±5% and overall project BCR varying by approximately ±3%.
4. Discussion
While the benefits to the cooperative are greater than the electric cooperative’s financial outlays throughout the project’s lifetime, the majority of the project was funded through awards from the U.S. DOE and the State of Alaska. When considering the total cost of the project in comparison to the benefits to the cooperative, the project’s BCR is 0.63, which is clearly unfavorable. It is only when considering societal benefits that the BCR is greater than one, at 1.77. The wind turbine’s overall benefits to Alaska and to society at large are estimated to be significant, which strengthens the argument that public incentives for such projects are worth the investment.
The largest value stream to the electric cooperative is the avoided cost of diesel fuel, providing USD5.3 million in savings over the lifetime of the project. As the diesel generators are providing 100% spinning reserves for the wind, it was also found that there are additional benefits to be gained from reducing the usage of those diesel generators should they switch to a schedule with lower spinning reserves. With a reduction of the spinning reserve requirement to 50% of wind energy generation, energy generation benefits increase by about 15%, which is important if electric cooperative benefits are lower than total project costs.
The largest value stream of the project overall is the economic impacts to Alaska from the construction and O&M spending on the project, at USD8 million over the project’s lifetime. Without the wind project in St. Mary’s, continued operations with diesel generators would likely not have made a large impact on economic activity in Alaska. While the wages paid to laborers and the money spent on materials for the wind project are costs to the project owners, those costs lead to significant economic growth in the state of Alaska through the direct spending of the project and the indirect spending caused throughout supply chains, which includes the induced impacts of household expenditures. This USD8 million economic impact value may be an approximation, given the large number of assumptions used in the calculation of this number; however, even if future research reveals this projected benefit to be smaller, the economic impact value would likely still be quite large. Similar projects in remote communities in Alaska are also likely to add to Alaska’s economic growth.
The next largest societal benefit is the environmental benefit provided through avoided CO2 emissions. At almost USD2 million dollars, the value of this renewable energy project is quite high. However, even at USD70/ton, the White House social cost of carbon is considered a conservative value compared to other estimates, which can put it as high as USD120/ton [63]. Additionally, the value of other avoided pollutants is not included in this phase of the analysis, indicating that additional unaccounted-for value is being generated. This result can show that there can be broader societal returns from funding renewable energy through grants and government incentives. This is likely to be an important consideration in similar distributed wind projects deployed in remote regions, which might offset diesel fuel usage for energy generation.
St. Mary’s distributed wind project has high capital and operating costs, at a total of USD8.6 million dollars over the lifetime of the project. While different O&M cost assumptions may reduce this value to USD6.6 million dollars, the overall capital and O&M costs are still larger than the estimated benefits to the electric cooperative. These high costs are likely due to the large size of the project, as the turbine was sized to serve several communities. However, smaller size turbine projects still have relatively high costs but do not generate as much energy over their usable life [30]. Larger projects can usually provide cheaper electricity as a function of their installed capacity, even with their high initial capital costs and higher overall O&M costs. In order to provide a low LCOE and a higher percent of renewable energy to remote communities, it is clear that incentives, awards, and subsidies are important to reduce the high upfront costs that these electric cooperatives may not otherwise be able to overcome. Public funding appears to be warranted in this case study, with societal benefits summing to USD9.8 million compared to the USD5.4 million in federal and state awards that helped fund the project.
For other similar communities, the BCRs of such projects are also likely to be unfavorable without subsidies. Fully renewable energy generation in these remote locations may require the use of several technology types, potentially in hybrid systems with wind. The value of avoided fuel costs may not be enough alone to justify such a project, though the overall societal benefits may be large. If more projects are to be of public importance in remote areas, it appears that incentives and awards to reduce upfront capital costs are likely to be needed.
Our research shows that the inclusion of societal benefits such as environmental benefits and economic impacts in distributed wind valuation can have a large impact on the overall value of the project. Future work is possible with additional data and more robust methodologies to estimate quantitative values for the qualitative value elements considered here, such as resilience and human–environment interactions with turbines. Additionally, since other DER technology types can complement and compete with wind energy generation, future work can be done to apply this framework to compare the economics of potential hybrid power systems with wind, solar, energy storage, and other technology types.
In distributed wind valuation, it is important to clearly identify the scope of the valuation and the value elements that will be included, as the inclusion or exclusion of these elements can greatly impact results, as shown in our analysis. Following a comprehensive valuation framework can help identify value elements that may have potential significance as well as attribute them to the appropriate stakeholders. This will aid in enabling more comprehensive decision-making for distributed wind stakeholders.
Note: After the paper was submitted for review, the authors were given new information from AVEC, stating that the wind turbine installed at Pitka’s Point is a DW52 model rather than a DW54. The only difference in the turbines is the diameter of the rotor, with the DW52 having a 51.5 m rotor diameter and the DW54 having a 54 m rotor. The impact of this discrepancy is estimated at about 4–5% more electricity production for the DW54 compared to the DW52 in the wind resource studied, but otherwise, the general analysis trends are the same.
Author Contributions
Conceptualization, S.B. and K.M.; methodology, S.B. and K.M.; validation, S.B.; formal analysis, S.B. and K.M.; investigation, S.B. and K.M.; data curation, B.N. and S.B.; writing—original draft preparation, S.B. and K.M.; writing—review and editing, S.B., K.M., B.N. and R.D.-Z.; visualization, S.B., R.D.-Z. and K.M.; supervision, S.B.; project administration, S.B. All authors have read and agreed to the published version of the manuscript.
Funding
This work was supported by the U.S. Department of Energy’s Wind Energy Technologies Office. The views and opinions of the authors expressed herein do not necessarily state or reflect those of the United States Government or any agency thereof. The Pacific Northwest National Laboratory is operated for the U.S. Department of Energy by Battelle under contract DE-AC05-76RL01830. Sandia National Laboratories is a multi-mission laboratory managed and operated by National Technology and Engineering Solutions of Sandia, LLC., a wholly owned subsidiary of Honeywell International, Inc., for the U.S. Department of Energy’s National Nuclear Security Administration under contract DE-NA-0003525.
Data Availability Statement
The data presented in this study are openly available in Zenodo at DOI 10.5281/zenodo.5587957.
Acknowledgments
We would like to thank our colleagues and peer reviewers, Daniel Boff and Alice Orrell, for their time and effort in providing feedback to us. We would also like to thank James Reilly from National Renewable Energy Laboratory for his work coordinating the Microgrids, Infrastructure Resilience, and Advanced Controls Launchpad project, of which this paper is a part.
Conflicts of Interest
The authors declare no conflict of interest. The funders had no role in the design of the study; in the collection, analyses, or interpretation of data; in the writing of the manuscript, or in the decision to publish the results.
Nomenclature
| Acronyms and Abbreviations | |
| BTM | Behind-the-Meter |
| CO2 | Carbon Dioxide |
| DER | Distributed Energy Resource |
| DOE | U.S. Department of Energy |
| EIA | Energy Information Administration |
| FTM | Front-of-the-Meter |
| IAV | Interannual Variability |
| JEDI | Jobs and Economic Development Impact |
| kWh | Kilowatt-Hour |
| LCOE | Levelized Cost of Energy |
| MWh | Megawatt-Hour |
| NPV | Net Present Value |
| NREL | National Renewable Energy Laboratory |
| O&M | Operations and Maintenance |
| REC | Renewable Energy Certificate |
| Variables | |
| EMM | CO2 Emitted Per Gallon of Fuel |
| GEN | Annual Energy Generated by Turbine in kWh |
| i | Discount Rate |
| pt | Fuel Price ($/gal) in Year t |
| SCC | Social Cost of Carbon |
| t | Year |
| vavg | Average Wind Velocity |
References
- D’Oro, R. Ultra-Harsh Winter Prompts Critical Fuel Shortages in Alaska; The Associated Press: New York, NY, USA, 2012. [Google Scholar]
- Chang, C.A.; Wu, Y.K.; Chen, B.K. Determination of maximum wind power penetration in an isolated island system by considering spinning reserve. Energies 2016, 9, 688. [Google Scholar] [CrossRef] [Green Version]
- Ma, T.; Yang, J.; Lu, L. Study on stand-alone power supply options for an isolated community. Int. J. Electr. Power Energy Syst. 2015, 65, 1–11. [Google Scholar] [CrossRef]
- Karanasios, K.; Parker, P. Recent developments in renewable energy in remote aboriginal communities, Quebec, Canada. Pap. Can. Econ. Dev. 2016, 16, 98–108. [Google Scholar]
- Ali, L.; Shahnia, F.; Arefi, A.; Iu, H.; Fernando, T. Feasibility Analysis of a Sustainable System for an Australian Remote Town. In Proceedings of the 2017 IEEE 3rd International Conference on Power Generation Systems and Renewable Energy Technologies (PGSRET), Johor Bahru, Malaysia, 4–6 April 2017. [Google Scholar]
- Hessami, M.-A.; Campbell, H.; Sanguinetti, C. A feasibility study of hybrid wind power systems for remote communities. Energy Policy 2011, 39, 877–886. [Google Scholar] [CrossRef]
- Hamilton, J.; Negnevitsky, M.; Wang, X.; Lyden, S. High penetration renewable generation within Australian isolated and remote power systems. Energy 2019, 168, 684–692. [Google Scholar] [CrossRef]
- López-González, A.; Ranaboldo, M.; Domenech, B.; Ferrer-Martí, L. Evaluation of small wind turbines for rural electrification: Case studies from extreme climatic conditions in Venezuela. Energy 2020, 209, 118450. [Google Scholar] [CrossRef]
- Reiman, A.P.; Homer, J.S.; Bhattarai, B.; Orrell, A.C. Quantifying technical diversity benefits of wind as a distributed energy resource. In Proceedings of the 2020 IEEE PES Innovative Smart Grid Technologies Conference NA (ISGT NA), Washington, DC, USA, 17–20 February 2020. [Google Scholar]
- Denholm, P.; Sun, Y.; Mai, T. An Introduction to Grid Services: Concepts, Technical Requirements, and Provision from Wind; National Renewable Energy Laboratory: Golden, CO, USA, 2019.
- Baring-Gould, I.; Lundsager, P. Isolated Systems with Wind Power. In Wind Power in Power Systems, 2nd ed.; John Wiley & Sons, Ltd.: Chichester, UK, 2012; pp. 707–737. [Google Scholar]
- Mongird, K.; Barrows, S. The Value of Distributed Wind: A Valuation Framework; PNNL-31127; Pacific Northwest National Laboratory: Richland, WA, USA, 2021.
- Olatayo, K.I.; Wichers, J.H.; Stoker, P.W. Energy and economic performance of small wind energy systems under different climatic conditions of South Africa. Renew. Sustain. Energy Rev. 2018, 98, 376–392. [Google Scholar] [CrossRef]
- Kozlova, M. Real option valuation in renewable energy literature: Research focus, trends and design. Renew. Sustain. Energy Rev. 2017, 80, 180–196. [Google Scholar] [CrossRef]
- Loncar, D.; Milovanovic, I.; Rakic, B.; Radjenovic, T. Compound real options valuation of renewable energy projects: The case of a wind farm in Serbia. Renew. Sustain. Energy Rev. 2017, 75, 354–367. [Google Scholar] [CrossRef]
- Javed, M.S.; Ma, T.; Jurasz, J.; Canales, F.A.; Lin, S.; Ahmed, S.; Zhang, Y. Economic analysis and optimization of a renewable energy based power supply system with different energy storages for a remote island. Renew. Energy 2021, 164, 1376–1394. [Google Scholar] [CrossRef]
- Bilal, B.; Adjallah, K.H.; Yetilmezsoy, K.; Bahramian, M. Determination of wind potential characteristics and techno-economic feasibility analysis of wind turbines for Northwest Africa. Energy 2021, 218, 119558. [Google Scholar] [CrossRef]
- Judge, F.; McAuliffe, F.D.; Sperstad, I.B.; Chester, R.; Flannery, B.; Lynch, K.; Murphy, J. A lifecycle financial analysis model for offshore wind farms. Renew. Sustain. Energy Rev. 2019, 103, 370–383. [Google Scholar] [CrossRef]
- Kaldellis, J.K. Feasibility evaluation of Greek State 1990–2001 wind energy program. Energy 2003, 28, 1375–1394. [Google Scholar] [CrossRef]
- Georgiou, I.; Areal, F.J. Economic valuation of an offshore wind farm in Greece: The role of individual׳s base-state influences and beliefs in the value formation process. Renew. Sustain. Energy Rev. 2015, 52, 717–724. [Google Scholar] [CrossRef] [Green Version]
- Allan, G.; Eromenko, I.; Gilmartin, M.; Kockar, I.; McGregor, P. The economics of distributed energy generation: A literature review. Renew. Sustain. Energy Rev. 2015, 42, 543–556. [Google Scholar] [CrossRef] [Green Version]
- Weis, T.; Ilinca, A. Assessing the potential for a wind power incentive for remote villages in Canada. Energy Policy 2010, 38, 5504–5511. [Google Scholar] [CrossRef]
- Frick, N.M.; Schwartz, L.C.; Taylor-Anyikire, A. A Framework for Integrated Analysis of Distributed Energy Resources: Guide for States; Laurence Berkeley National Laboratory: Berkeley, CA, USA, 2018.
- Larsen, J.; Jerndon, W. What Is It Worth? The State of the Art in Valuing Distributed Energy Resources; Rhodium Group: New York, NY, USA, 2017. [Google Scholar]
- NESP. National Standard Practice Manual for Benefit-Cost Analysis of Distributed Energy Resources; National Energy Screening Project: 2020. Available online: https://www.nationalenergyscreeningproject.org/wp-content/uploads/2020/08/NSPM-DERs_08-24-2020.pdf (accessed on 20 August 2021).
- Woolf, T.; Whited, M.; Vitolo, T.; Hornby, R. Benefit-Cost Analysis for Distributed Energy Resources: A Framework for Accounting for All Relevant Costs and Benefits; Advanced Energy Economy Institute: Washington, DC, USA, 2014. [Google Scholar]
- Barrows, S.E.; Homer, J.S.; Orrell, A.C. Valuing wind as a distributed energy resource: A literature review. Renew. Sustain. Energy Rev. 2021, 152, 111678. [Google Scholar] [CrossRef]
- SEIA Solar Cost-Benefit Studies. Available online: https://www.seia.org/initiatives/solar-cost-benefit-studies (accessed on 20 August 2021).
- Dsouza, K.; Halbe, S.; Thomas, M.; Baran, M.; Chowdhury, B.; Schwarz, P.; Proudlove, A. The challenges of valuing distributed generation. In Proceedings of the 2020 IEEE PES Innovative Smart Grid Technologies Conference NA (ISGT NA), Washington, DC, USA, 17–20 February 2020. [Google Scholar]
- Orrell, A.; Preziuso, D.; Foster, N.; Morris, S.; Homer, J. 2018 Distributed Wind Market Report; U.S. Department of Energy, Office of Energy Efficiency and Renewable Energy: Washington, DC, USA, 2018.
- U.S. Energy Information Association. Electric Power Annual 2019; U.S. Department of Energy: Washington, DC, USA, 2021.
- EWT. Turbines installed in Bethel and St. Mary’s, Alaska. Community wind in Alaska. 2019. Available online: https://ewtdirectwind.com/news/turbines-installed-in-bethel-and-st-marys-alaska/ (accessed on 20 August 2021).
- Alaska Village Electric Cooperative, Inc. Closeout Report for USDOE Office of Indian Energy Award DE-IE0000035; AVEC: Anchorage, AK, USA, 2020. [Google Scholar]
- DW61 900kW Specification Sheet; Emergya Wind Technologies B.V.: Amersfoort, The Netherlands, 2020.
- Vaught, D. Saint Mary’s, Alaska REF 8 Wind-Diesel Project Analysis; V3 Energy, LLC: Eagle River, AK, USA, 2014. [Google Scholar]
- Brower, M.C.; Barton, M.S.; Lledó, L.; Dubois, J. A Study of Wind Speed Variability Using Global Reanalysis Data; AWS Truepower: Albany, NY, USA, 2013. [Google Scholar]
- Frick, N.M.; Price, S.; Schwartz, L.; Hanus, N.; Shapiro, B. Locational Value of Distributed Energy Resources; Lawrence Berkeley National Laboratory: Berkeley, CA, USA, 2021.
- Wind Explained: Wind energy and the Environment. Available online: https://www.eia.gov/energyexplained/wind/wind-energy-and-the-environment.php (accessed on 19 August 2021).
- Akhil, A.A.; Huff, G.; Currier, A.B.; Hernandez, J.; Bender, D.A.; Kaun, B.C.; Rastler, D.M.; Chen, S.B.; Cotter, A.L.; Bradshaw, D.T.; et al. DOE/EPRI Electricity Storage Handbook in Collaboration with NRECA; SAND2016-9180; Sandia National Lab. (SNL): Albuquerque, NM, USA, 2016.
- Flicker, J.; Hernandez-Alvidrez, J.; Shirazi, M.; Vandermeer, J.; Thomson, W. Grid Forming Inverters for Spinning Reserve in Hybrid Diesel Microgrids; IEEE: New York, NY, USA, 2020. [Google Scholar]
- Alaska Village Electric Cooperative. Annual Report 2019; AVEC: Anchorage, AK, USA, 2019. [Google Scholar]
- FRED. 30-Year Treasury Constant Maturity Rate, Percent, Annual, Not Seasonally Adjusted; Federal Reserve Economic Data: St. Louis, MO, USA, 2021. [Google Scholar]
- Drupp, M.A.; Freeman, M.C.; Groom, B.; Nesje, F. Discounting Disentangled. Am. Econ. J. Econ. Policy 2018, 10, 109–134. [Google Scholar] [CrossRef] [Green Version]
- Mongird, K.; Balducci, P.; Alam, J.; Yuan, Y.; Wu, D.; Hardy, T.; Mietzner, J.; Neal, T.; Guerry, R.; Kimball, J. Decatur Island Community Solar and Energy Storage Project—Preliminary Economic Assessment; Pacific Northwest National Laboratory: Richland, WA, USA, 2018.
- HOMER. Available online: https://www.homerenergy.com/products/pro/index.html (accessed on 19 July 2021).
- Button, F. Bethel Wind Energy Construction Project; Alaska Village Electric Cooperative, Inc.: Denver, CO, USA, 2018. [Google Scholar]
- U.S. Energy Information Association. Table 3: Energy Prices by Sector and Source: Residential: Propane, Region: Pacific. In Annual Energy Outlook 2020; U.S. Department of Energy: Washington, DC, USA, 2020. [Google Scholar]
- JEDI Wind Models. Available online: https://www.nrel.gov/analysis/jedi/wind.html (accessed on 15 June 2021).
- Greenhouse Gases Equivalencies Calculator—Calculations and References. Available online: https://www.epa.gov/energy/greenhouse-gases-equivalencies-calculator-calculations-and-references (accessed on 19 June 2021).
- United States Government. Technical Support Document: Social Cost of Carbon, Methane, and Nitrous Oxide Interim Estimates under Executive Order 13990; Interagency Working Group on Social Cost of Greenhouse Gases, United States Government: Washington, DC, USA, 2021.
- O’Shaughnessy, E.; Heeter, J.; Sauer, J. Status and Trends in the U.S. Voluntary Green Power Market (2017 Data); National Renewable Energy Laboratory: Golden, CO, USA, 2018.
- AEA. REFRound7EvaluationModel.xls. In 2014 REF Recommendations; Alaska Energy Authority: Anchorage, Alaska, 2014. [Google Scholar]
- U.S. Bureau of Labor Statstics. PPI Detailed Report: Data for January 2020; U.S. Department of Labor: Washington, DC, USA, 2020.
- Sanstad, A.; Zhu, Q.; Leibowicz, B.; Larsen, P.; Eto, J. Case Studies of the Economic Impacts of Power Interruptions and Damage to Electricity System Infrastructure from Extreme Events; Ernest Orlando Lawrence Berkeley National Laboratory: Berkeley, CA, USA, 2020.
- Sullivan, M.; Schellenberg, J.; Blundell, M. Updated Value of Service Reliability Estimates for Electric Utility Customers in the United States; Lawrence Berkeley National Laboratory: Berkeley, CA, USA; Nexant, Inc.: San Francisco, CA, USA, 2015.
- Zamuda, C.D.; Larsen, P.H.; Collins, M.T.; Bieler, S.; Schellenberg, J.; Hees, S. Monetization methods for evaluating investments in electricity system resilience to extreme weather and climate change. Electr. J. 2019, 32, 106641. [Google Scholar] [CrossRef]
- Buckley, A. I Can See for Miles and Miles. Available online: https://learn.arcgis.com/en/projects/i-can-see-for-miles-and-miles/ (accessed on 5 August 2021).
- Chiang, A.C.; Keoleian, G.A.; Moore, M.R.; Kelly, J.C. Investment cost and view damage cost of siting an offshore wind farm: A spatial analysis of Lake Michigan. Renew. Energy 2016, 96, 966–976. [Google Scholar] [CrossRef] [Green Version]
- Groothuis, P.A.; Groothuis, J.D.; Whitehead, J.C. Green vs. green: Measuring the compensation required to site electrical generation windmills in a viewshed. Energy Policy 2008, 36, 1545–1550. [Google Scholar] [CrossRef] [Green Version]
- Environmental Impacts and Siting of Wind Projects. Available online: https://www.energy.gov/eere/wind/environmental-impacts-and-siting-wind-projects (accessed on 5 August 2021).
- Wind Turbine Interactions with Wildlife in their Habitatss. Available online: https://www.energy.gov/sites/default/files/2015/03/f20/AWWI-Wind-Wildlife-Interactions-Factsheet.pdf (accessed on 5 August 2021).
- U.S. Bureau of Labor Statistics. Historical Consumer Price Index for All Urban Consumers (CPI-U): U.S. city average, all items, by month. In Consumer Price Index for June 2021; U.S. Department of Labor: Washington, DC, USA, 2021. [Google Scholar]
- Hänsel, M.C.; Drupp, M.A.; Johansson, D.J.A.; Nesje, F.; Azar, C.; Freeman, M.C.; Groom, B.; Sterner , T. Climate economics support for the UN climate targets. Nat. Clim. Chang. 2020, 10, 781–789. [Google Scholar] [CrossRef]
Figure 1.
Power curve for the EWT DW54-900 wind turbine [34].
Figure 1.
Power curve for the EWT DW54-900 wind turbine [34].

Figure 2.
Benefit table for St. Mary’s distributed wind project.

Figure 3.
Cost element table for St. Mary’s.

Figure 4.
Synthesized wind generation and electrical load for 1–3 January.

Figure 5.
Valuation results for St. Mary’s 900 kW wind turbine.

Figure 6.
NPV of energy generation with diesel operating reserves as a percent of wind energy generation.
Figure 6.
NPV of energy generation with diesel operating reserves as a percent of wind energy generation.

Figure 7.
Percent change in valuation results with ±6% interannual variability (IAV) in average wind velocity (vavg).
Figure 7.
Percent change in valuation results with ±6% interannual variability (IAV) in average wind velocity (vavg).


Table 1.
Wind turbine technical parameters.
| Parameters | Value |
|---|---|
| Model | EWT-DW54 |
| Power Capacity | 900 kW |
| Cut-in Wind Speed | 3 m/s |
| Cut-out Wind Speed | 25 m/s |
| Hub Height | 50 m |
| Rotor Diameter | 54 m |
| Cold Climate Package Rating | −40 °C |
Table 2.
Diesel generator technical parameters.
| Parameters | Cummins QSX15 | Caterpillar 3512 | Caterpillar 3508 |
|---|---|---|---|
| Power (kW) | 499 | 611 | 908 |
| Intercept Coeff. (L/hr/kW) for Fuel Consumption Curve | 0.0222 | 0.0233 | 0.0203 |
| Slope (L/hr/kW output) for Fuel Consumption Curve | 0.215 | 0.238 | 0.233 |
| Minimum Electric Load (%) | 15 | 15 | 15 |
Table 3.
Pitka’s Point meteorological evaluation tower data synopsis [35].
Table 3.
Pitka’s Point meteorological evaluation tower data synopsis [35].
| Parameter | Value |
|---|---|
| Wind power class | Class 6 (excellent) |
| Wind power density mean, 38 m | 558 W/m2 |
| Wind speed mean, 38 m | 7.62 m/s (17.0 mph) |
| Max. 10-min wind speed | 29.5 m/s |
| Maximum 2-sec. wind gust | 26.3 m/s (81.2 mph), January 2008 |
| Weibull distribution parameters | k = 1.94, c = 8.64 m/s |
| Wind shear power law exponent | 0.176 (low) |
| Roughness class | 2.09 (description: few trees) |
| IEC 61400-1, 3rd ed. classification | Class II-c (at 38 m) |
| Turbulence intensity, mean (at 38 m) | 0.076 (at 15 m/s) |
| Calm wind frequency (at 38 m) | 20% (<4 m/s) |
Table 4.
Combined average and peak loads for St. Mary’s and Mountain Village estimated from prior analysis [35].
Table 4.
Combined average and peak loads for St. Mary’s and Mountain Village estimated from prior analysis [35].
| Month | Average Load (kW) | Peak Load (kW) |
|---|---|---|
| January | 727 | 1136 |
| February | 700 | 1228 |
| March | 731 | 1151 |
| April | 651 | 1030 |
| May | 571 | 896 |
| June | 530 | 892 |
| July | 530 | 800 |
| August | 580 | 943 |
| September | 567 | 945 |
| October | 630 | 979 |
| November | 657 | 1031 |
| December | 701 | 1212 |
| Annual | 597 | 1228 |
Table 5.
Parameters and assumptions for benefit and cost analysis.
| Parameter | Value |
|---|---|
| Electric Cooperative Discount Rate 1 | 4.02% |
| Societal Discount Rate 2 | 2.00% |
| Inflation Rate | 2.00% |
| Federal and State Income Tax | 0% |
| Property Tax | 0% |
| Insurance Rate 3 | 0.27% |
| Cost of Debt 4 | 3.37% |
Publisher’s Note: MDPI stays neutral with regard to jurisdictional claims in published maps and institutional affiliations. |
© 2021 by the authors. Licensee MDPI, Basel, Switzerland. This article is an open access article distributed under the terms and conditions of the Creative Commons Attribution (CC BY) license (https://creativecommons.org/licenses/by/4.0/).
Share and Cite
MDPI and ACS Style
Barrows, S.; Mongird, K.; Naughton, B.; Darbali-Zamora, R. Valuation of Distributed Wind in an Isolated System. Energies 2021, 14, 6956. https://doi.org/10.3390/en14216956
AMA Style
Barrows S, Mongird K, Naughton B, Darbali-Zamora R. Valuation of Distributed Wind in an Isolated System. Energies. 2021; 14(21):6956. https://doi.org/10.3390/en14216956
Chicago/Turabian StyleBarrows, Sarah, Kendall Mongird, Brian Naughton, and Rachid Darbali-Zamora. 2021. "Valuation of Distributed Wind in an Isolated System" Energies 14, no. 21: 6956. https://doi.org/10.3390/en14216956
Note that from the first issue of 2016, this journal uses article numbers instead of page numbers. See further details here.