
Experimental Study of the Behavior of Phase Change Materials during Interrupted Phase Change Processes †


1
School of Mechanical Aerospace and Materials Engineering, Southern Illinois University Carbondale, Carbondale, IL 62901, USA
2
Gas Technology Institute, 123 C Street, Davis, CA 95616, USA
3
Oak Ridge National Laboratory, One Bethel Valley Road, Oak Ridge, TN 37831, USA
*
Author to whom correspondence should be addressed.
†
The publisher acknowledges the US government license to provide public access under the Department of Energy Public Access Plan.
Energies 2021, 14(23), 8021; https://doi.org/10.3390/en14238021
Submission received: 26 September 2021
/
Revised: 12 November 2021
/
Accepted: 20 November 2021
/
Published: 1 December 2021
(This article belongs to the Special Issue Innovative Energy Efficiency Technologies for High Performance Buildings)
Abstract
:This research article explores the behavior of a phase change material (PCM) when it undergoes interrupted melting and freezing, through experimental investigations using a heat flow meter apparatus. A fatty acid-based organic PCM, encapsulated within polyethylene and thin aluminum foil layers, was experimentally tested in this study. Experiments were designed to represent multiple interrupted phase change scenarios that could occur within PCMs applied in buildings. The experimental results were analyzed and compared with previously reported assumptions in numerical models dealing with PCM hysteresis and interrupted phase change processes. These comparisons indicated that the assumptions used in the different numerical models considered can capture the interrupted phase change phenomena with varying degrees of accuracy. The findings also highlighted the need for additional experimental research on different phase change processes that can occur in building applications of PCMs.
1. Introduction
An upsurge in energy consumption around the world seems to correlate with increasing population [1]. The building sector accounts for 40% of the global energy consumption and is anticipated to see a rise of 28% by 2035 [2,3,4]. This problem has motivated researchers to develop new energy-efficient technologies to curb the increasing energy consumption of buildings, including phase change materials (PCMs). The use of PCMs as thermal storage devices has been investigated for applications like building envelope materials [5,6,7], batteries [8], integrated collector storage solar water heaters [9], and heat exchangers [10].
Khudhair and Farid [11] reviewed the use of PCMs in building envelopes and concluded that the high thermal mass due to latent heat of PCMs can help in reducing impact of fluctuations in outdoor temperature on the indoor environment. Qureshi et al. [12] showed that walls retrofitted with PCMs can enable peak load shifting during winter and an overall decrease in electricity consumption. Biswas et al. [6,13,14] showed the ability of PCMs to reduce wall-generated heating and cooling loads via experimental and numerical studies.
Numerous studies have been reported on numerical simulations of PCM-based systems in buildings. The phase change phenomenon of PCMs is often incorporated in simulations and analytical tools using their enthalpy as a function of temperature, for melting and freezing. PCMs typically exhibit a hysteresis effect, which is manifested as a “delay” in phase change while freezing, i.e., the freezing begins at a lower temperature than the end of the melting process [15]. Kuznik and Virgone [16] showed the need to model thermophysical property curves of both melting and freezing to account for hysteresis. Biswas et al. [6] showed that including the hysteresis effect in the simulations discernibly impacted the calculated heat transfer through walls containing a PCM and the associated energy savings when compared to walls without the PCM; for example, in one scenario, ignoring hysteresis resulted in a 32% reduction in cooling energy required, while including it resulted in a 29% reduction, as predicted by the model. Chandrasekharan et al. [17] observed that an increase in the degree of hysteresis decreased the peak heating load by 5.5% but had no significant impact on the peak cooling load. Zastawna-Rumin and Nowak [18] noted that neglecting hysteresis yielded more favorable results in terms of the benefits of PCMs in a building; once hysteresis was considered, the results showed 19–22% higher incidence of the building operating temperature exceeding a threshold value compared to the cases where hysteresis was neglected.
PCM hysteresis has been incorporated in a limited number of numerical models, using different assumptions for interrupted melting and freezing. Assumptions to treat interrupted phase change include horizontal transitions between the enthalpy functions of melting and freezing [19], the intercept method [15], a non-transition or one curve model [17] and a same curve model until either of the end points is reached [6]. Rose et al. [19] assumed a horizontal transition between the enthalpy functions during melting and freezing. In other words, during interrupted melting, the state of the PCM shifted horizontally to the freezing curve, and vice-versa for interrupted freezing. Zastawna-Rumin et al. [20] noted that the shape and slope of transition curves are unknown and also cited the lack of experimental data. Furthermore, heating and cooling curves are not usually parallel to each other, so any decision regarding the transition curve slope would always be approximate. Since the horizontal transition assumption results in a simpler algorithm, Zastawna-Rumin et al. [20] also used the same assumption as Rose et al. [19].
Bony and Citherlet [15] treated interrupted melting by assuming a transition from the melting to the freezing curve along a line with a slope equal to the average slope of the bottom, fully frozen portion of the melting curve (i.e., portion of the melting curve before melting starts). For interrupted freezing, the transition from freezing to melting curve followed a line with the slope of the upper, fully melted portion of the curve. Biswas et al. [6] assumed that during interrupted melting or freezing, the PCM state followed the same curve back and forth. When the PCM was fully melted, its state would transition to the freezing curve and stay on it until the PCM was fully frozen, at which point it would revert to the melting curve.
While many studies acknowledge the hysteresis phenomenon in PCMs, data on how the hysteresis effect is manifested during interrupted melting and freezing are lacking. In real building applications of PCMs, it is likely that such interrupted melting and freezing cycles will be encountered. Goia et al. [21] implemented a hysteresis algorithm in EnergyPlusTM and found that their proposed model produced results that had better agreement with experimental data compared to other models that neglected hysteresis. However, the different numerical models were not fully able to replicate the behavior of PCM layers during incomplete melting and solidification. Goia et al. [21] hypothesized that the discrepancy between simulations and experimental data for incomplete PCM melting is due to unsuitable data for the thermophysical behavior of the PCM. Data obtained through conventional characterization procedures like differential scanning calorimetry can be far from the physics of the PCM layer when used in real building structures.
Therefore, understanding the behavior of PCMs during interrupted melting or freezing is important. Delcroix et al. [22] presented some experimental data that indicated that interrupted phase change processes agree with the intercept method of Bony and Citherlet [15]. However, further work by the same group, Delcroix et al. [23], found that the intercept method [15] failed during interrupted heating scenarios involving rapid solidification.
The current work was motivated by the lack of systematic investigations into the interrupted phase change behavior of PCMs. An extensive literature review found the study by Delcroix et al. [23] to be the only experimental evaluation of PCMs during interrupted melting and freezing. Here, multiple full and interrupted phase change tests of an organic PCM are presented. The tests were done in a heat flow meter apparatus (HFMA) that is used to evaluate large PCM samples. Six experiments were designed to evaluate multiple possible interrupted phase change processes of the PCM. The results presented here provide important insights into interrupted phase changes in a PCM and how they could be incorporated into numerical models.
2. Materials and Methods
2.1. Description of HFMA
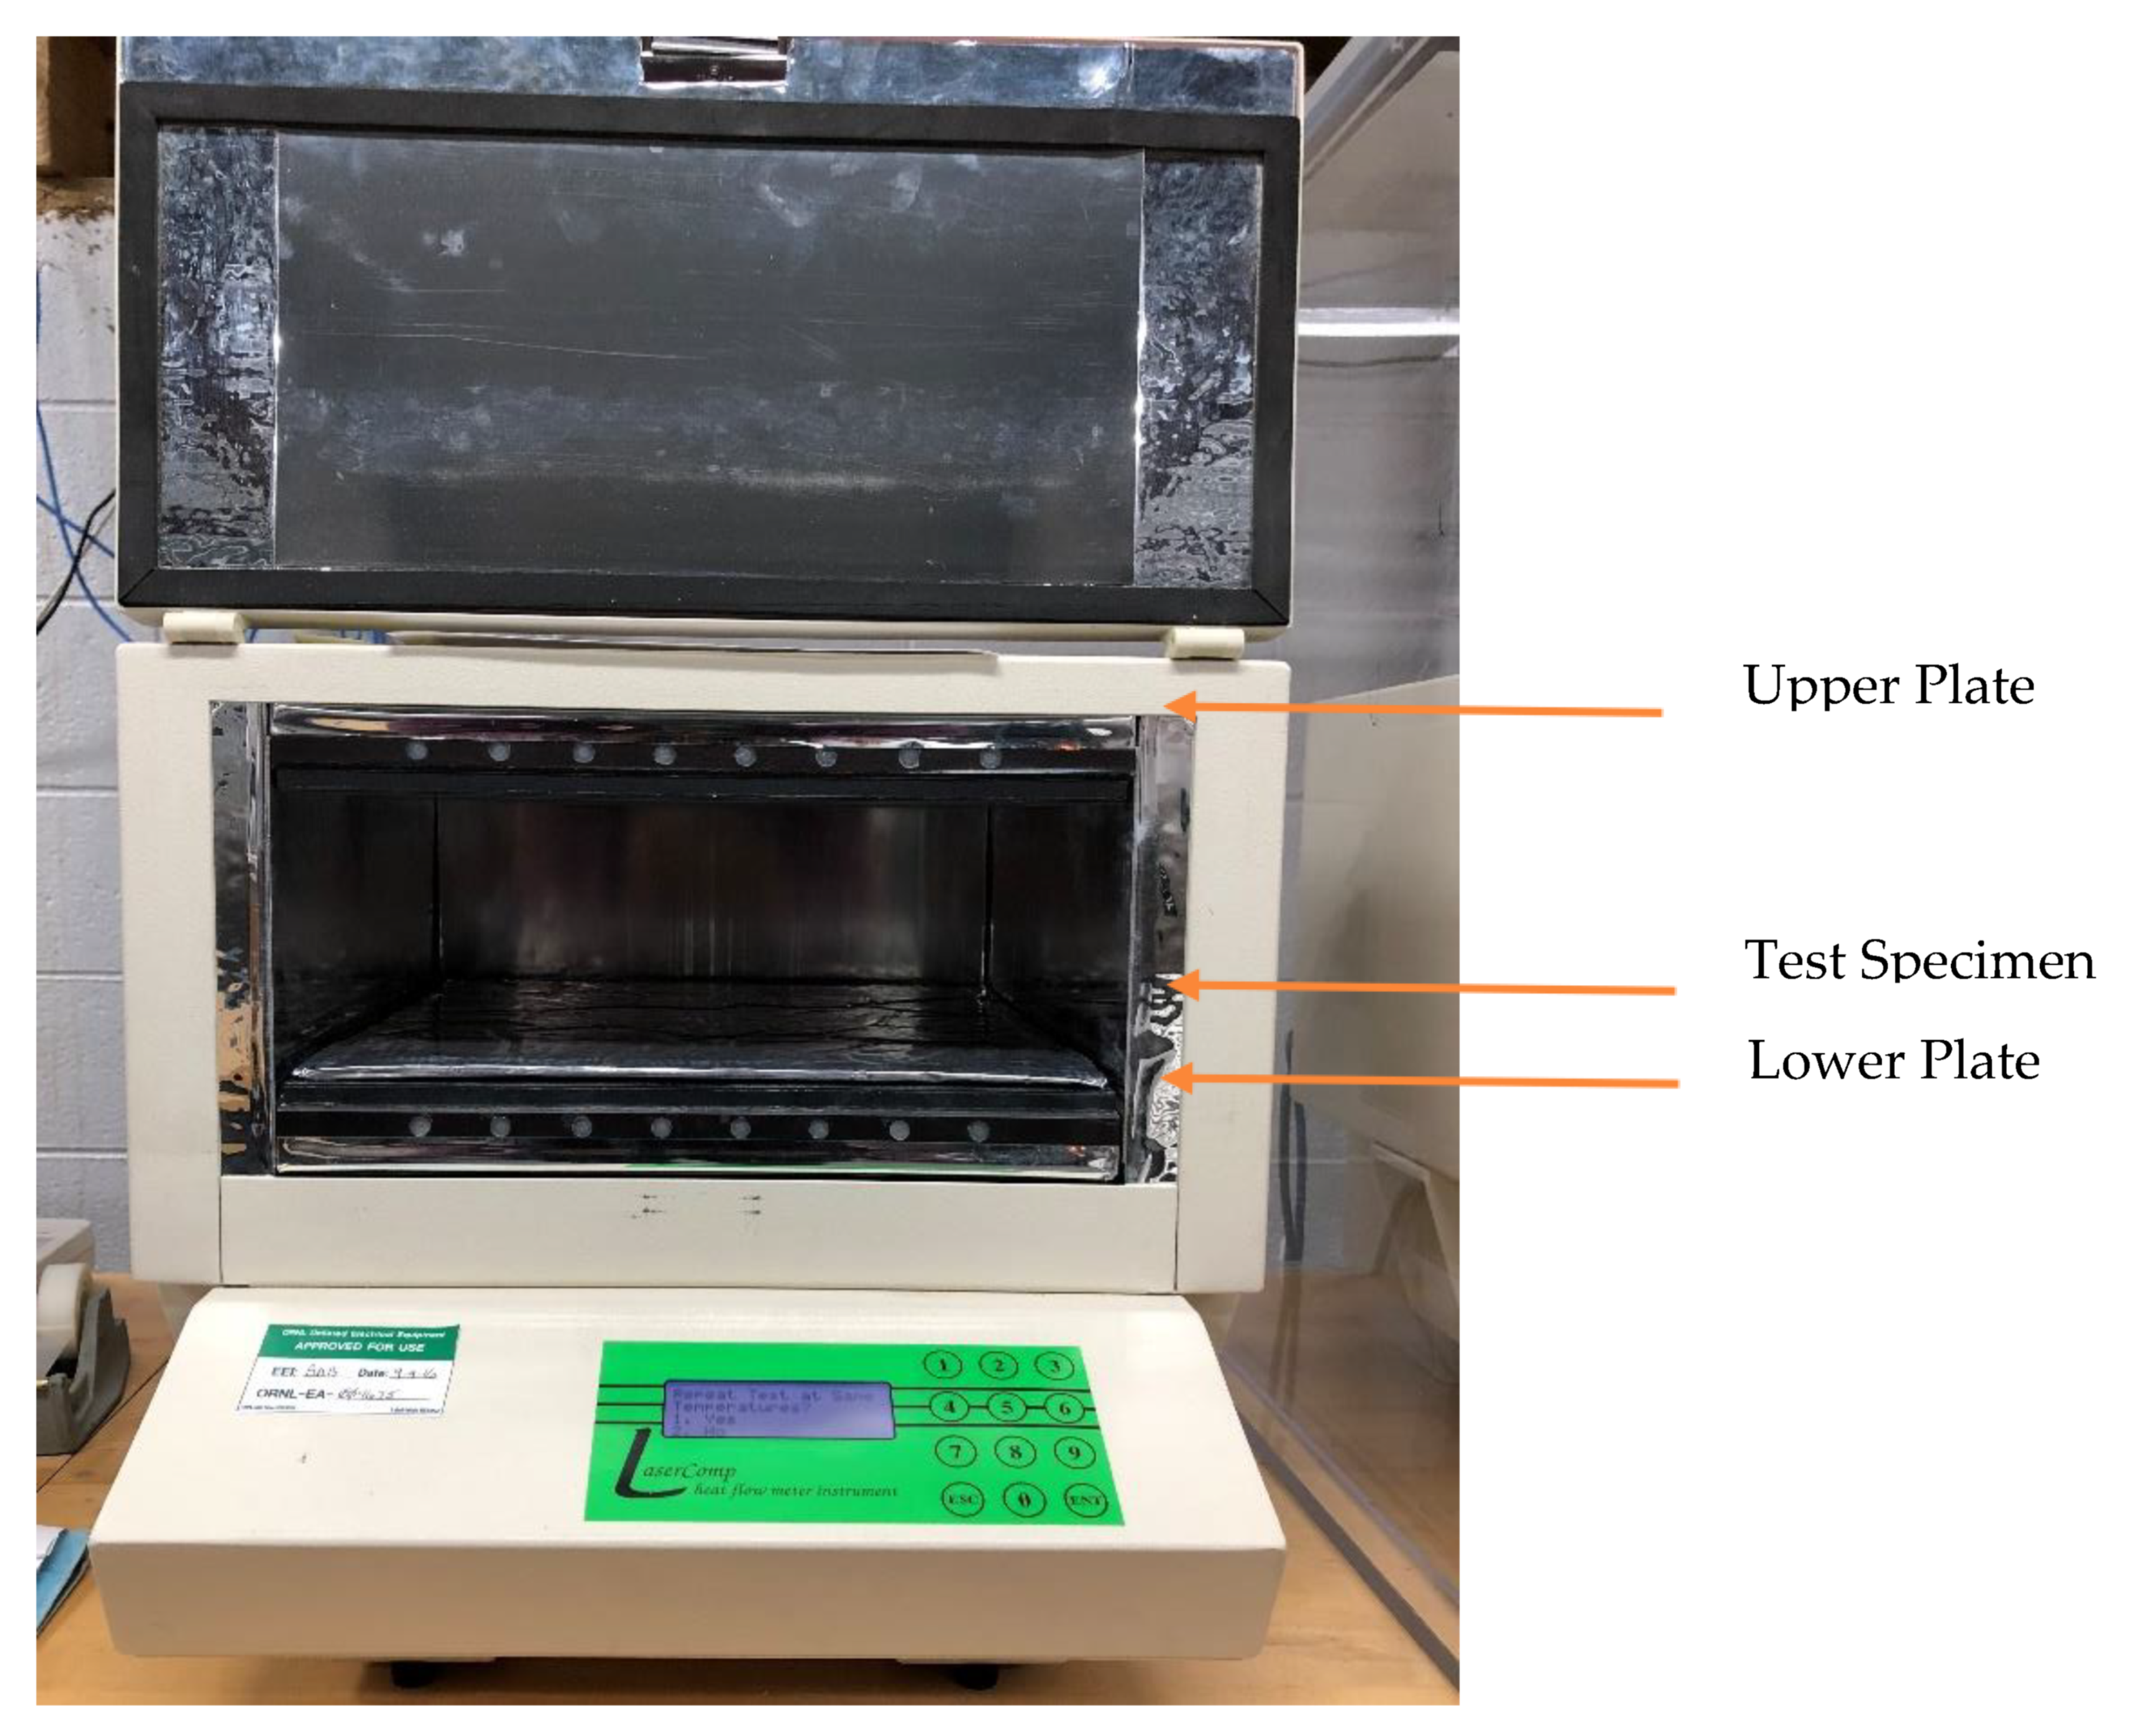
The HFMA used in this study was the Fox 304, which is shown in Figure 1. The Fox 304 is similar to the Fox 314 model built by TA Instruments [24]. This HFMA is equipped with two individually temperature-controlled plates, which sandwich the test specimen. Each plate is outfitted with a solid-state heating and cooling system, and the plate temperatures can be independently controlled to induce a heat flow in either upward or downward direction through the specimen. Thin-film heat flux transducers (HFTs), of dimensions 7.6 × 7.6 cm and thickness 1.78 mm, are permanently bonded to the upper and lower plate surfaces. Each plate contains one HFT installed at the center of the plate. In the center of each transducer, a Type E thermocouple is bonded near its surface, close to the test specimen. These thermocouples accurately measure the specimen surface temperatures and are also used to control the plate temperatures. Based on the manufacturer’s specifications [24], the measurement accuracy is ±1%, with a reproducibility of ±0.5%. The temperature control accuracy is ±0.01 °C.
The PCM characterization was performed according to the ASTM C1784 standard test procedure to evaluate thermal storage characteristics of PCMs [25]. This test method makes a series of measurements to determine the thermal energy storage of PCMs over a temperature range. First, both HFMA plates are held at the same constant temperature set point until steady state is achieved. Steady state is defined by the reduction in the amount of energy entering the specimen from both plates, measured as voltage signals, to a very small and nearly constant value. Next, both plate temperatures are changed by identical amounts and held at a new temperature set point until steady state is again achieved. The energy absorbed or released by the specimen during the temperature step change is recorded. Using a series of temperature step changes, the cumulative enthalpy stored or released over a certain temperature range is determined.
The heat released or absorbed by the PCM sample at each temperature set point is calculated as:
In the above equations, ‘Q’ (J/m2) is overall heat absorbed or released during a set point, while ‘Qcorr.’ (J/m2) is the heat released or absorbed by the PCM sample alone. ‘N’ is the number of blocks during each set point, ‘V’ is the block-averaged voltage signal (mV) from the HFTs, ‘S’ is the plate calibration factor ((W/m2)/mV) to convert the voltage signal of the HFTs to heat flux, ‘τ’ is the time period for each data point (typically 1.3 s), ‘ΔT’ is the temperature step change imposed on the HFMA plates and the PCM between set points, ‘Cp′ ρ′2δx′’ is the plate correction factor (J/m2/K), ‘δx′’ is the plate thickness (m), and ‘x’ is the sample thickness (m). The subscripts ‘U’ and ‘L’ represent the upper and lower plates of the HFMA, and ‘equi.’ represents the residual signals at the final equilibrium condition. The heat released/absorbed is converted to enthalpy change by multiplying with the mass of the PCM per unit area. Complete details of the testing and analysis methods are described in Biswas et al. [6].
Data from the HFMA are logged at a rate of 0.7 Hz, with 512 data points making up 1 block of data, representing 731 s or about 12 min. The 512 data points are averaged to provide the mean heat fluxes and plate temperatures for each block. Each set point is considered complete after the following thermal equilibrium criteria are met:
- The block average temperature of each plate is within 0.2 K of the previous block.
- The block average voltage is within a certain absolute value (typically 50 mV) and within 2% of the previous block’s average voltage.
- There is no discernible monotonic trend in the sequential block averages after the initial high values due to the temperature step change and any phase change of the PCM.
After a given number of consecutive blocks satisfy the above criterion, the test is considered complete. The user can specify the number of blocks for which each set point will run once the equilibrium criteria are met. The number of blocks for the current PCM ranged from about 20 to 75, with higher number of blocks being specified for the set points lying within the melting and freezing temperature range.
2.2. PCM Characterization
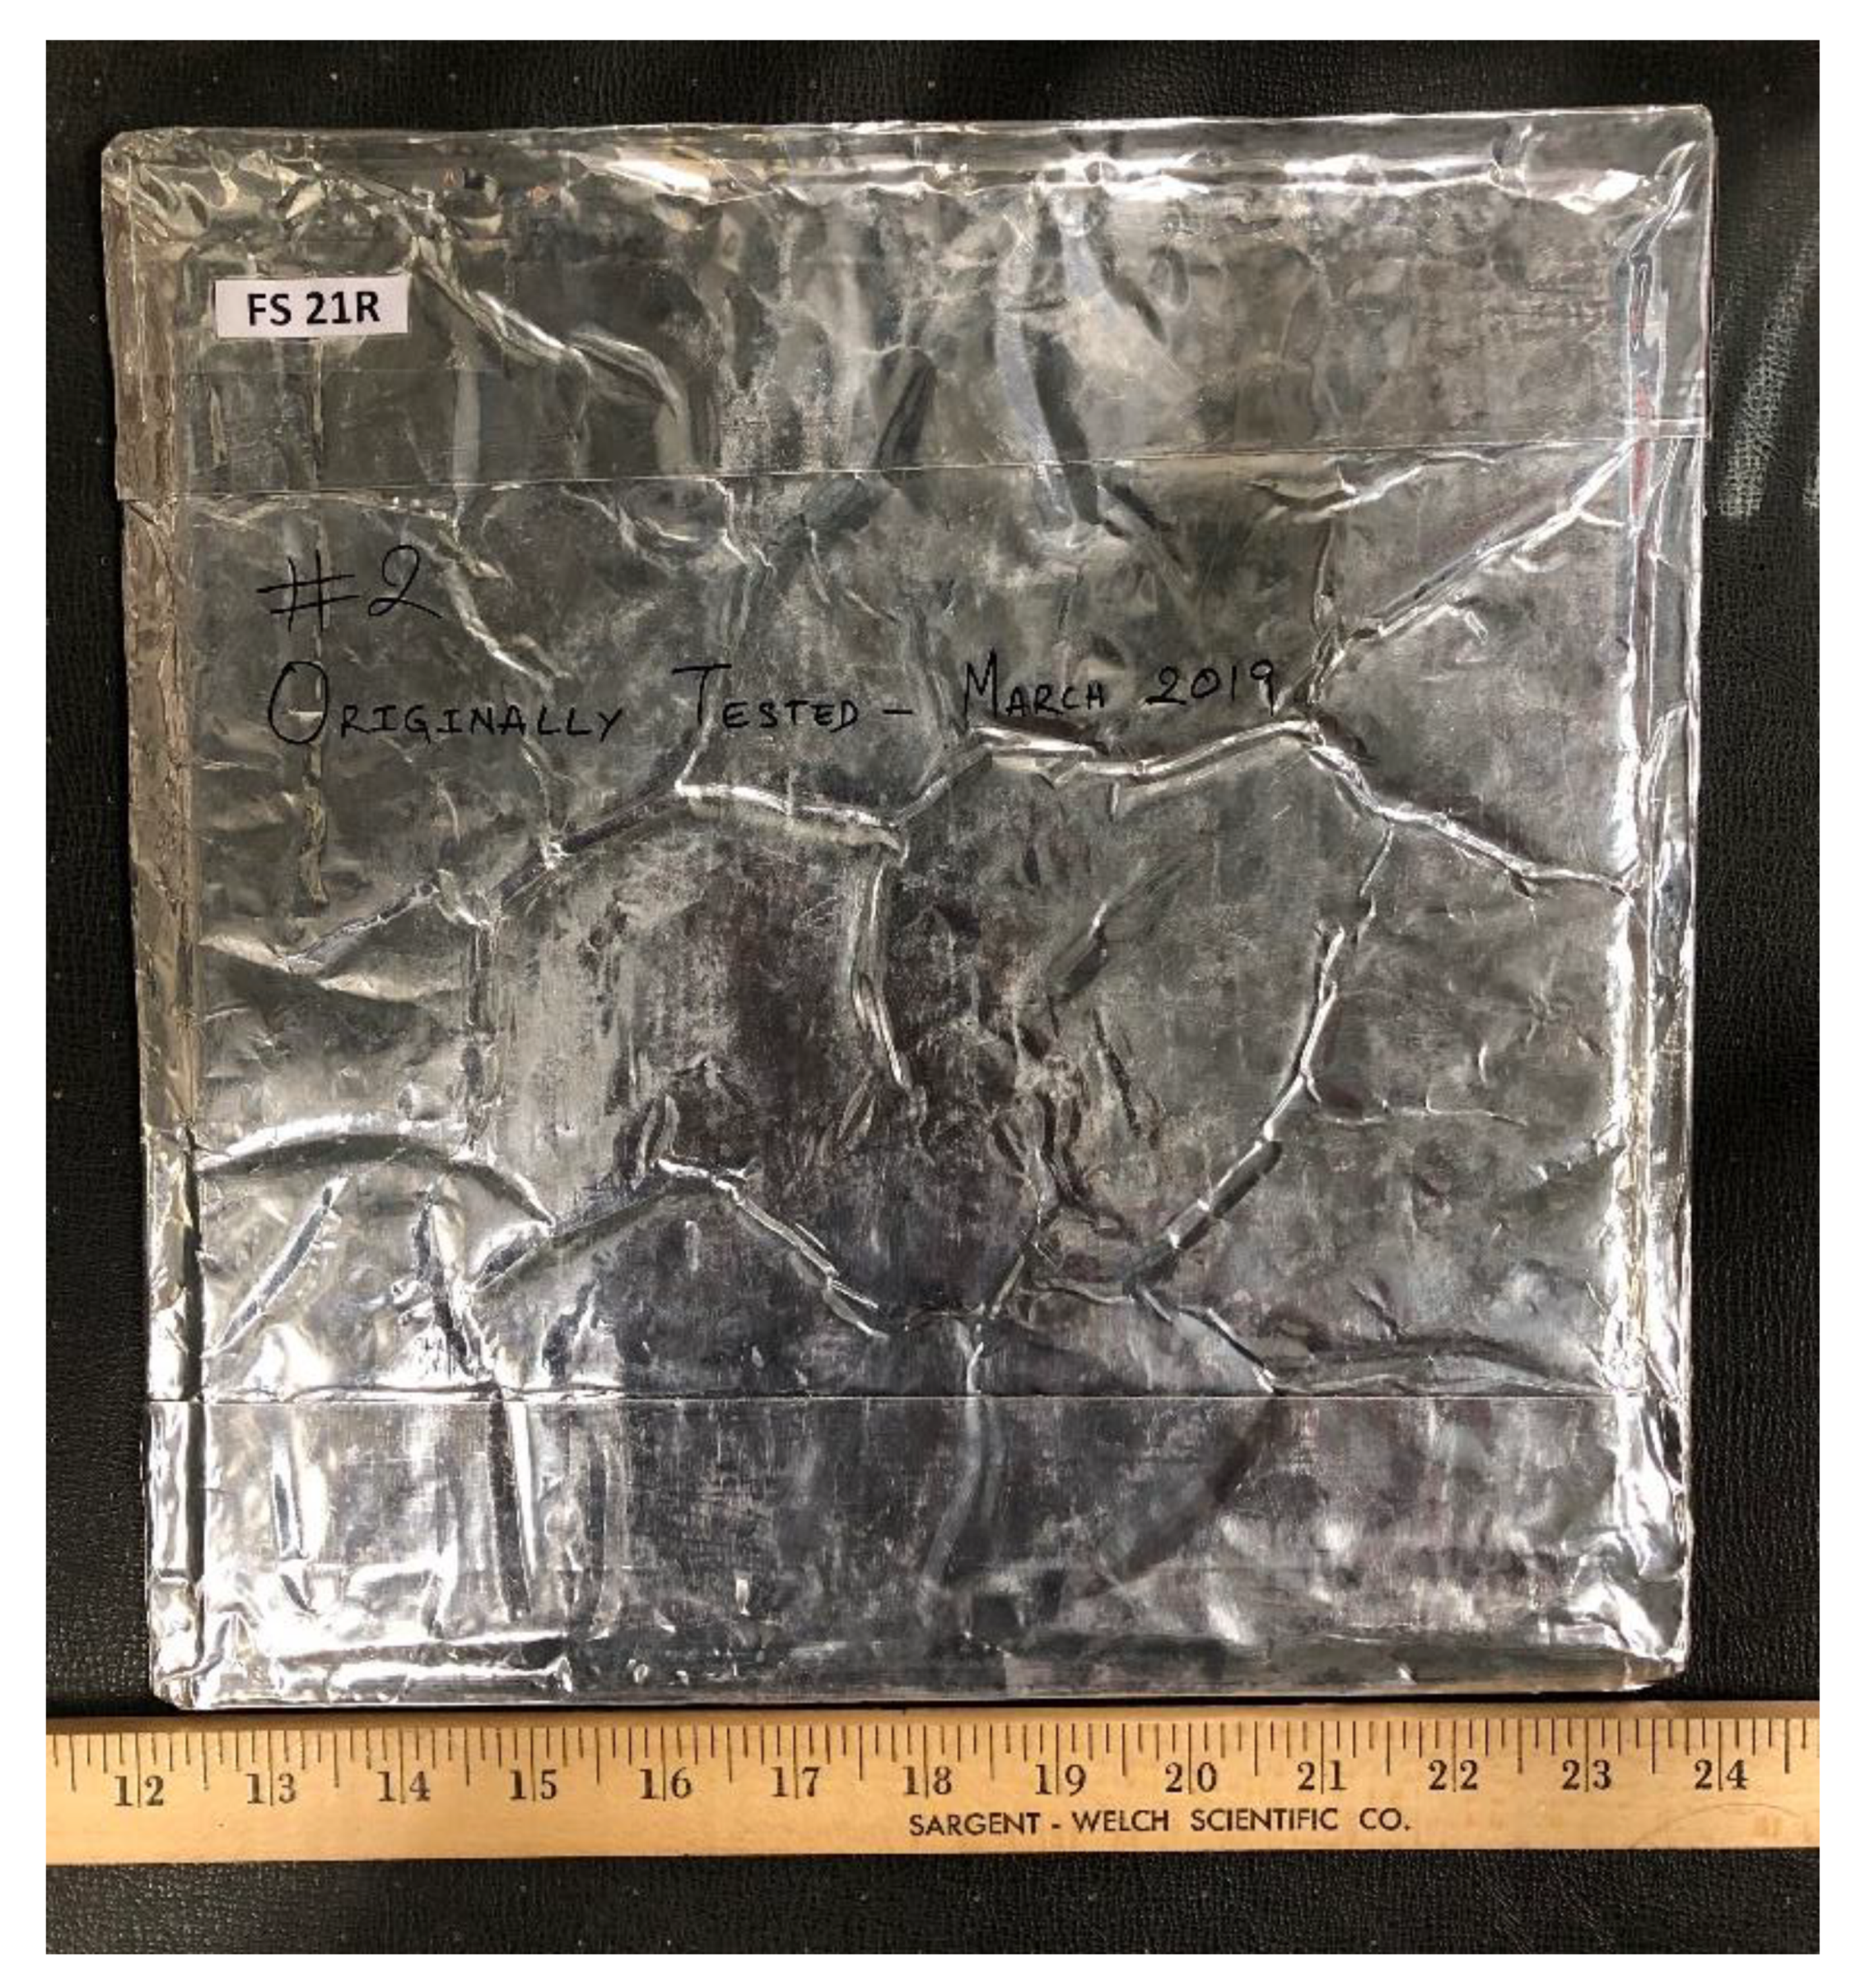
A SaveE® FS21R PCM sample with a nominal melting temperature of 20.7 °C and a latent heat capacity of 183 J/g was used for this study. This PCM sample, shown in Figure 2, consisted of fatty acid-based organic materials encapsulated within a polyethylene layer and a thin, <0.5 µm aluminum foil. The PCM sample was about 30.5 cm × 30.5 cm × 8 mm in dimensions and weighed about 0.6 kg. Biswas et al. [6] previously characterized this PCM through complete melting and freezing cycles. This study extends the PCM characterization by first repeating the complete melting and freezing tests, and then performing additional interrupted melting and freezing tests.
2.3. Test Parameters
To understand the phase change behavior of the selected PCM, a total of eight (8) scenarios or test cycles were designed and tested. These 8 test cycles are named as follows for further discussions:
- Complete Melting Curve (CMC)
- Complete Freezing Curve (CFC)
- Interrupted Curve 1 (IC1)
- Interrupted Curve 2 (IC2)
- Interrupted Melt-Curve 1 (IMC1)
- Interrupted Melt-Curve 2 (IMC2)
- Interrupted Freeze-Curve 1 (IFC1)
- Interrupted Freeze-Curve 2 (IFC2)
The melting of the PCM starts at about 17 °C and is completed at about 23 °C. During freezing, the phase change started at 22 °C and completed at 17 °C. Table 1 gives the temperature setpoints used for each test cycle based on the overall phase change range of the PCM. Different text styles have been used in Table 1 to depict the heating and cooling processes as well as phase transformation regimes. Bold text depicts heating and melting, regular text depicts cooling and freezing, and italicized text depicts phase change interruption, i.e., transition from melting to freezing or vice-versa. The HFMA used in this study was limited to 18 set points for any given test, and hence that was the upper limit of the number of set points used in these tests.
Each set point typically lasts for several hours; up to 16 h for set points during the freezing of the current PCM. The duration of each set point is not explicitly set by the user. The equilibrium criteria determine how long each set point will last before moving on to the next set point. Essentially, the set points last as long as it takes to reach thermal equilibrium following a temperature step change. A complete set of melting and freezing cycles typically takes over a week to finish. It should be noted that the duration of each set point is not as critical as ensuring that thermal equilibrium was attained at each set point.
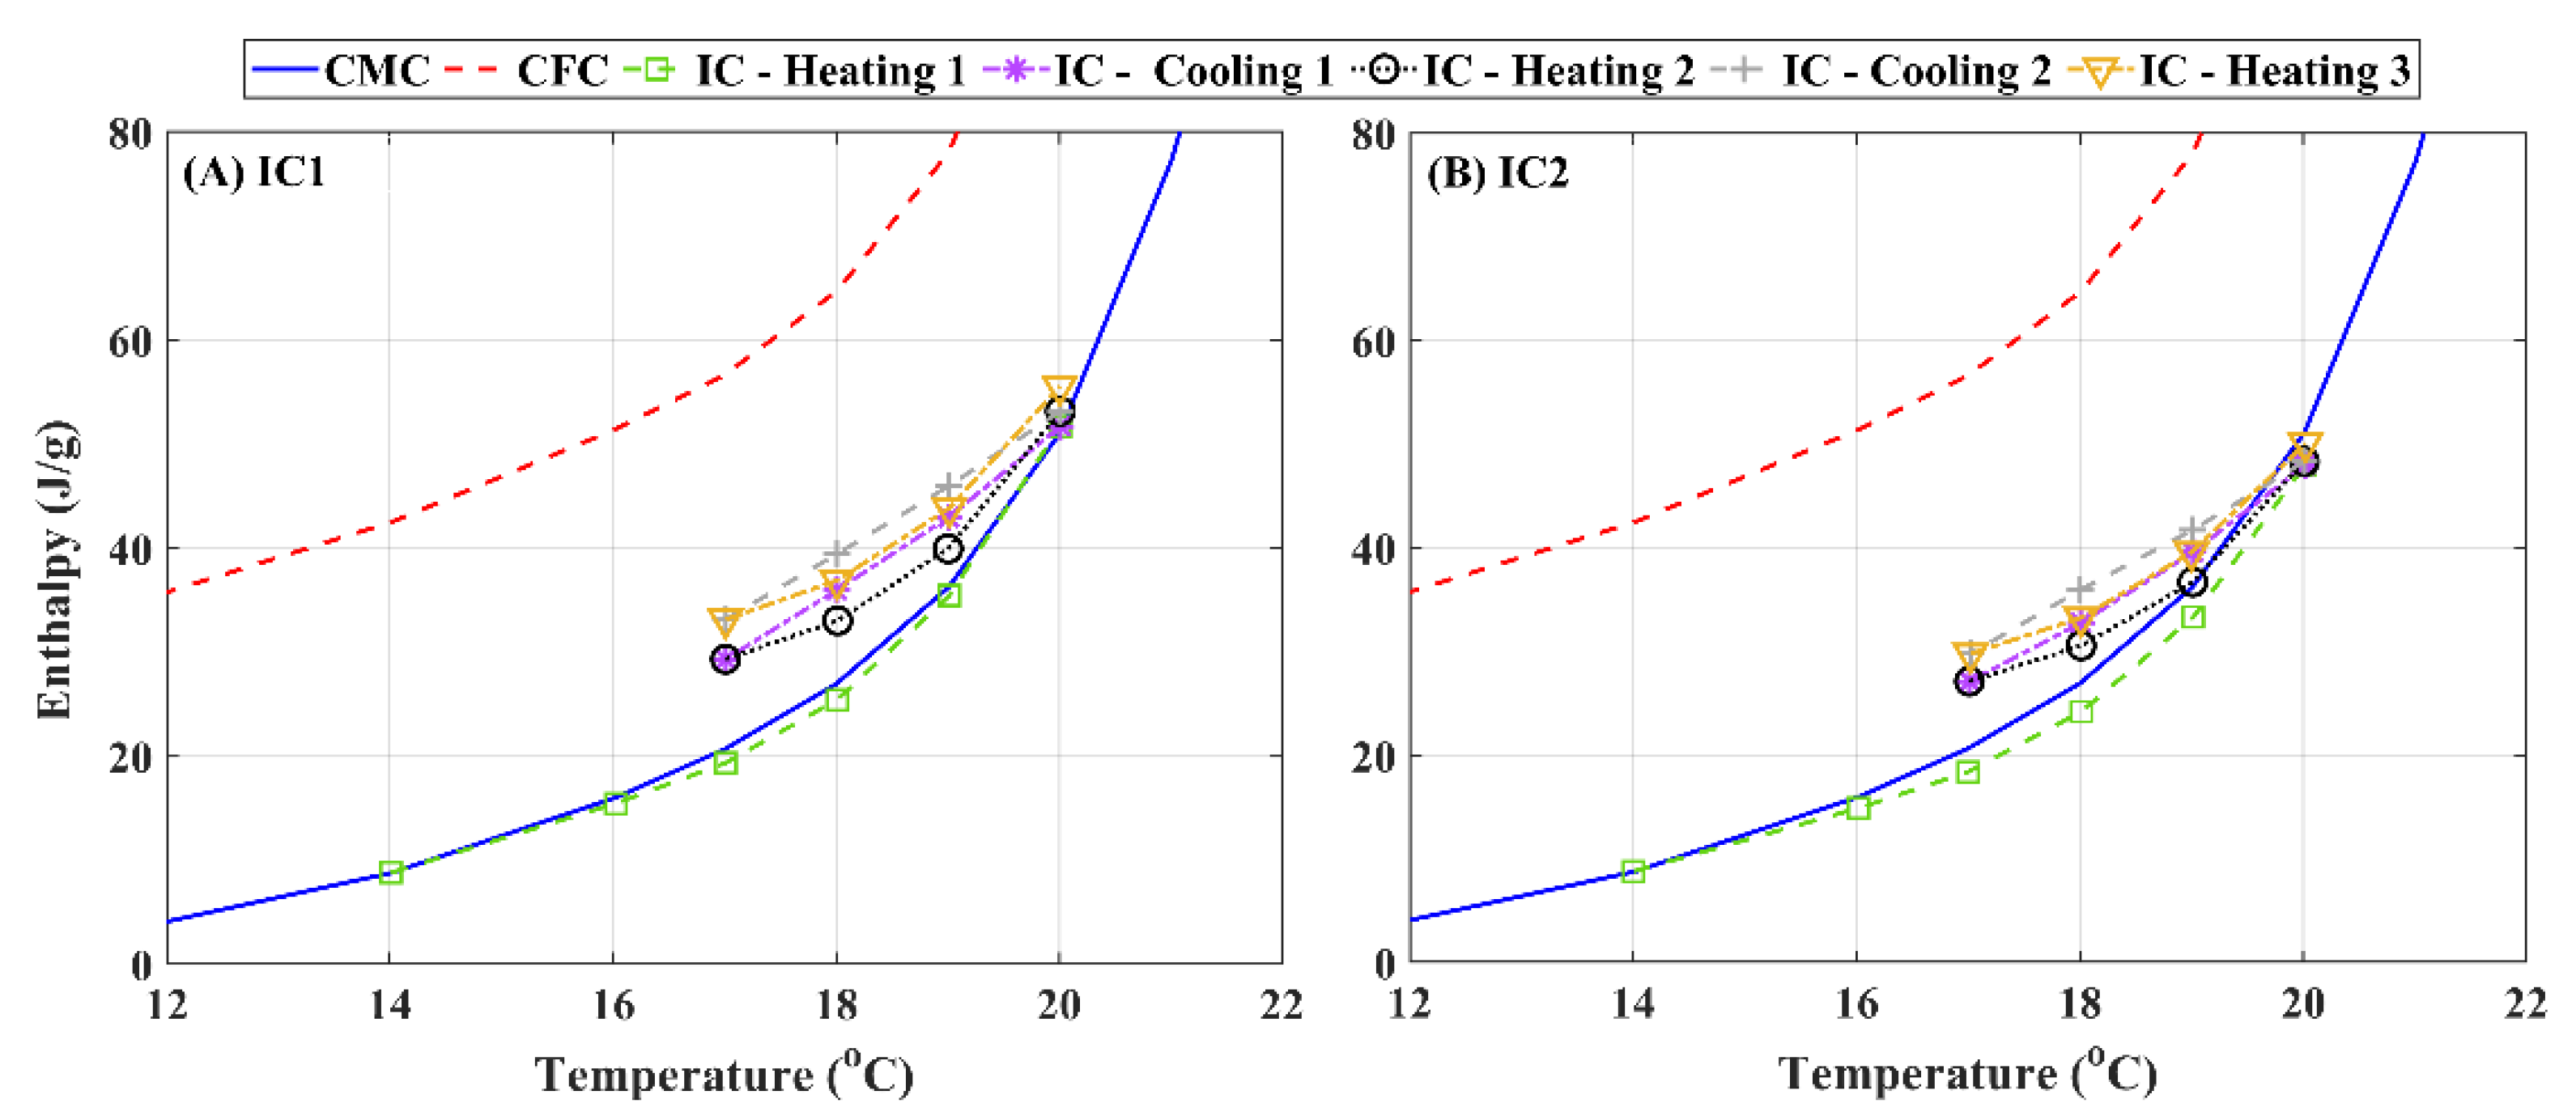
The CMC and CFC data define the complete heating and cooling behavior of the PCM between 10 °C and 28 °C, including the hysteresis effect of the PCM. The remaining six tests focused on the interrupted phase change behavior of the PCM. IC1 and IC2 data represent partial melting of the PCM sample followed by repeated partial freezing and melting between 17 °C and 20 °C. The set points for these two tests were identical and were used to verify the repeatability of the interrupted phase change tests.
IMC1 represents the behavior of the PCM when it is subjected to partial melting or heating followed by partial freezing (cooling) and then complete melting (heating). IFC1 represents the reverse behavior: partial freezing → partial melting → complete freezing. Finally, IMC2 and IFC2 represent ‘partial melting → complete freezing’ and ‘partial freezing → complete melting’, respectively.
3. Results
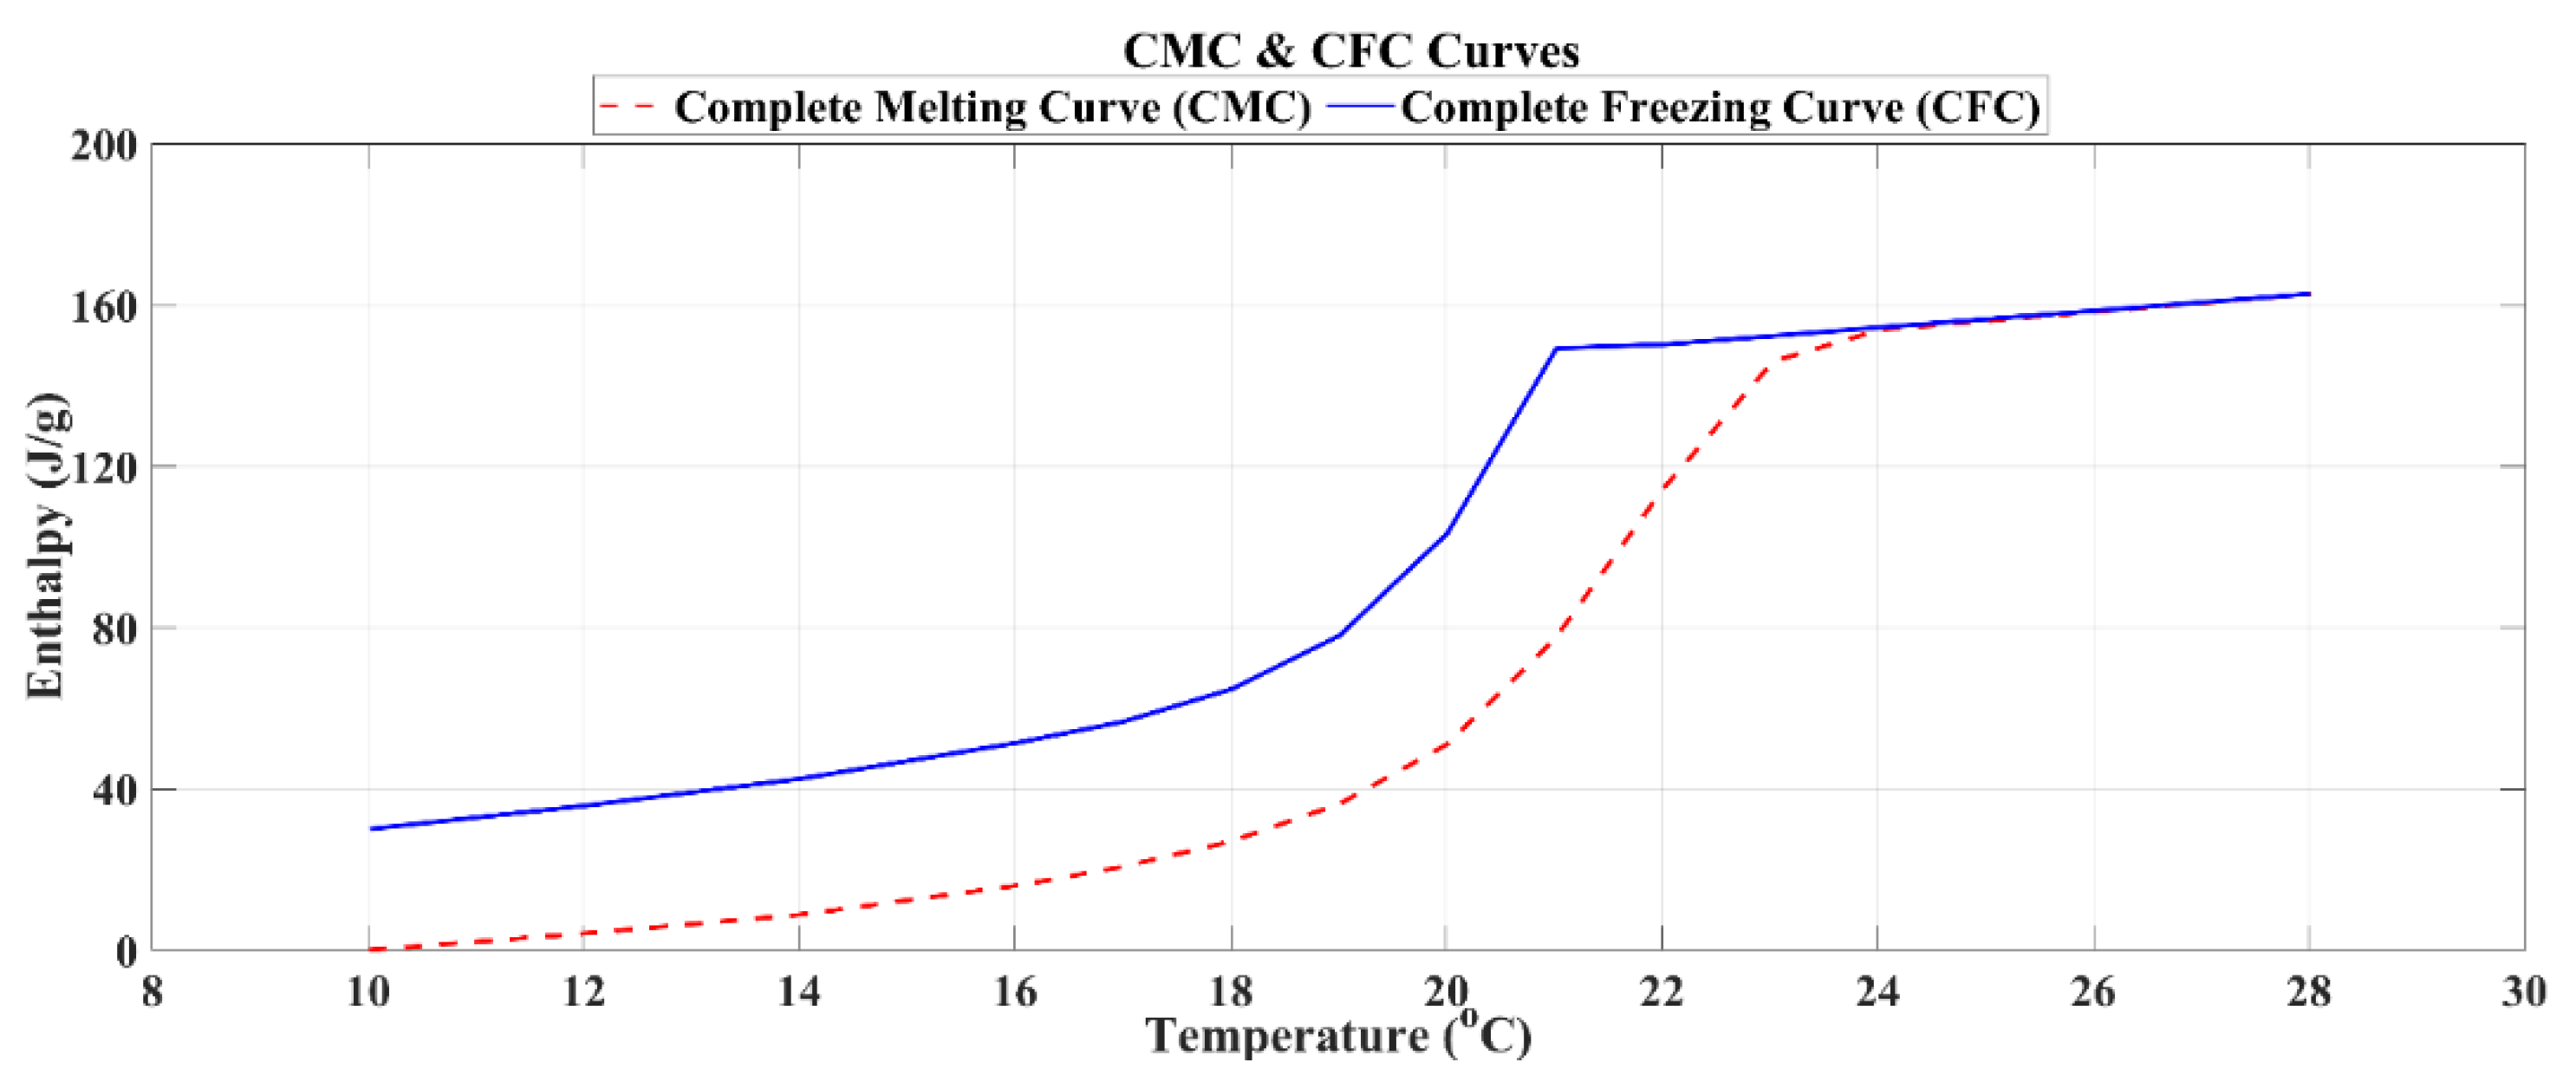
This section presents the major findings of the tests conducted to study the interrupted phase change behavior of the selected PCM. The results are presented as the change in enthalpy as a function of temperature and, for simplicity, will be referred to as temperature–enthalpy curves in the remainder of this section. Figure 3 presents the temperature–enthalpy curves of the CMC and CFC tests, respectively. Based on the analysis method described by Biswas et al. [6], the CMC test data indicate that the PCM starts to melt at about 17 °C and completely melts at about 23 °C. It is noted that in the previous work [6], the PCM was observed to fully melt at 22 °C, so there is some discrepancy between the past and present measurements. Based on the CFC test data, the PCM starts to freeze at about 22 °C and is completely frozen at about 17 °C. The temperature–enthalpy curves from the CMC and CFC tests served as the baseline to evaluate the interrupted phase change behavior of the PCM.
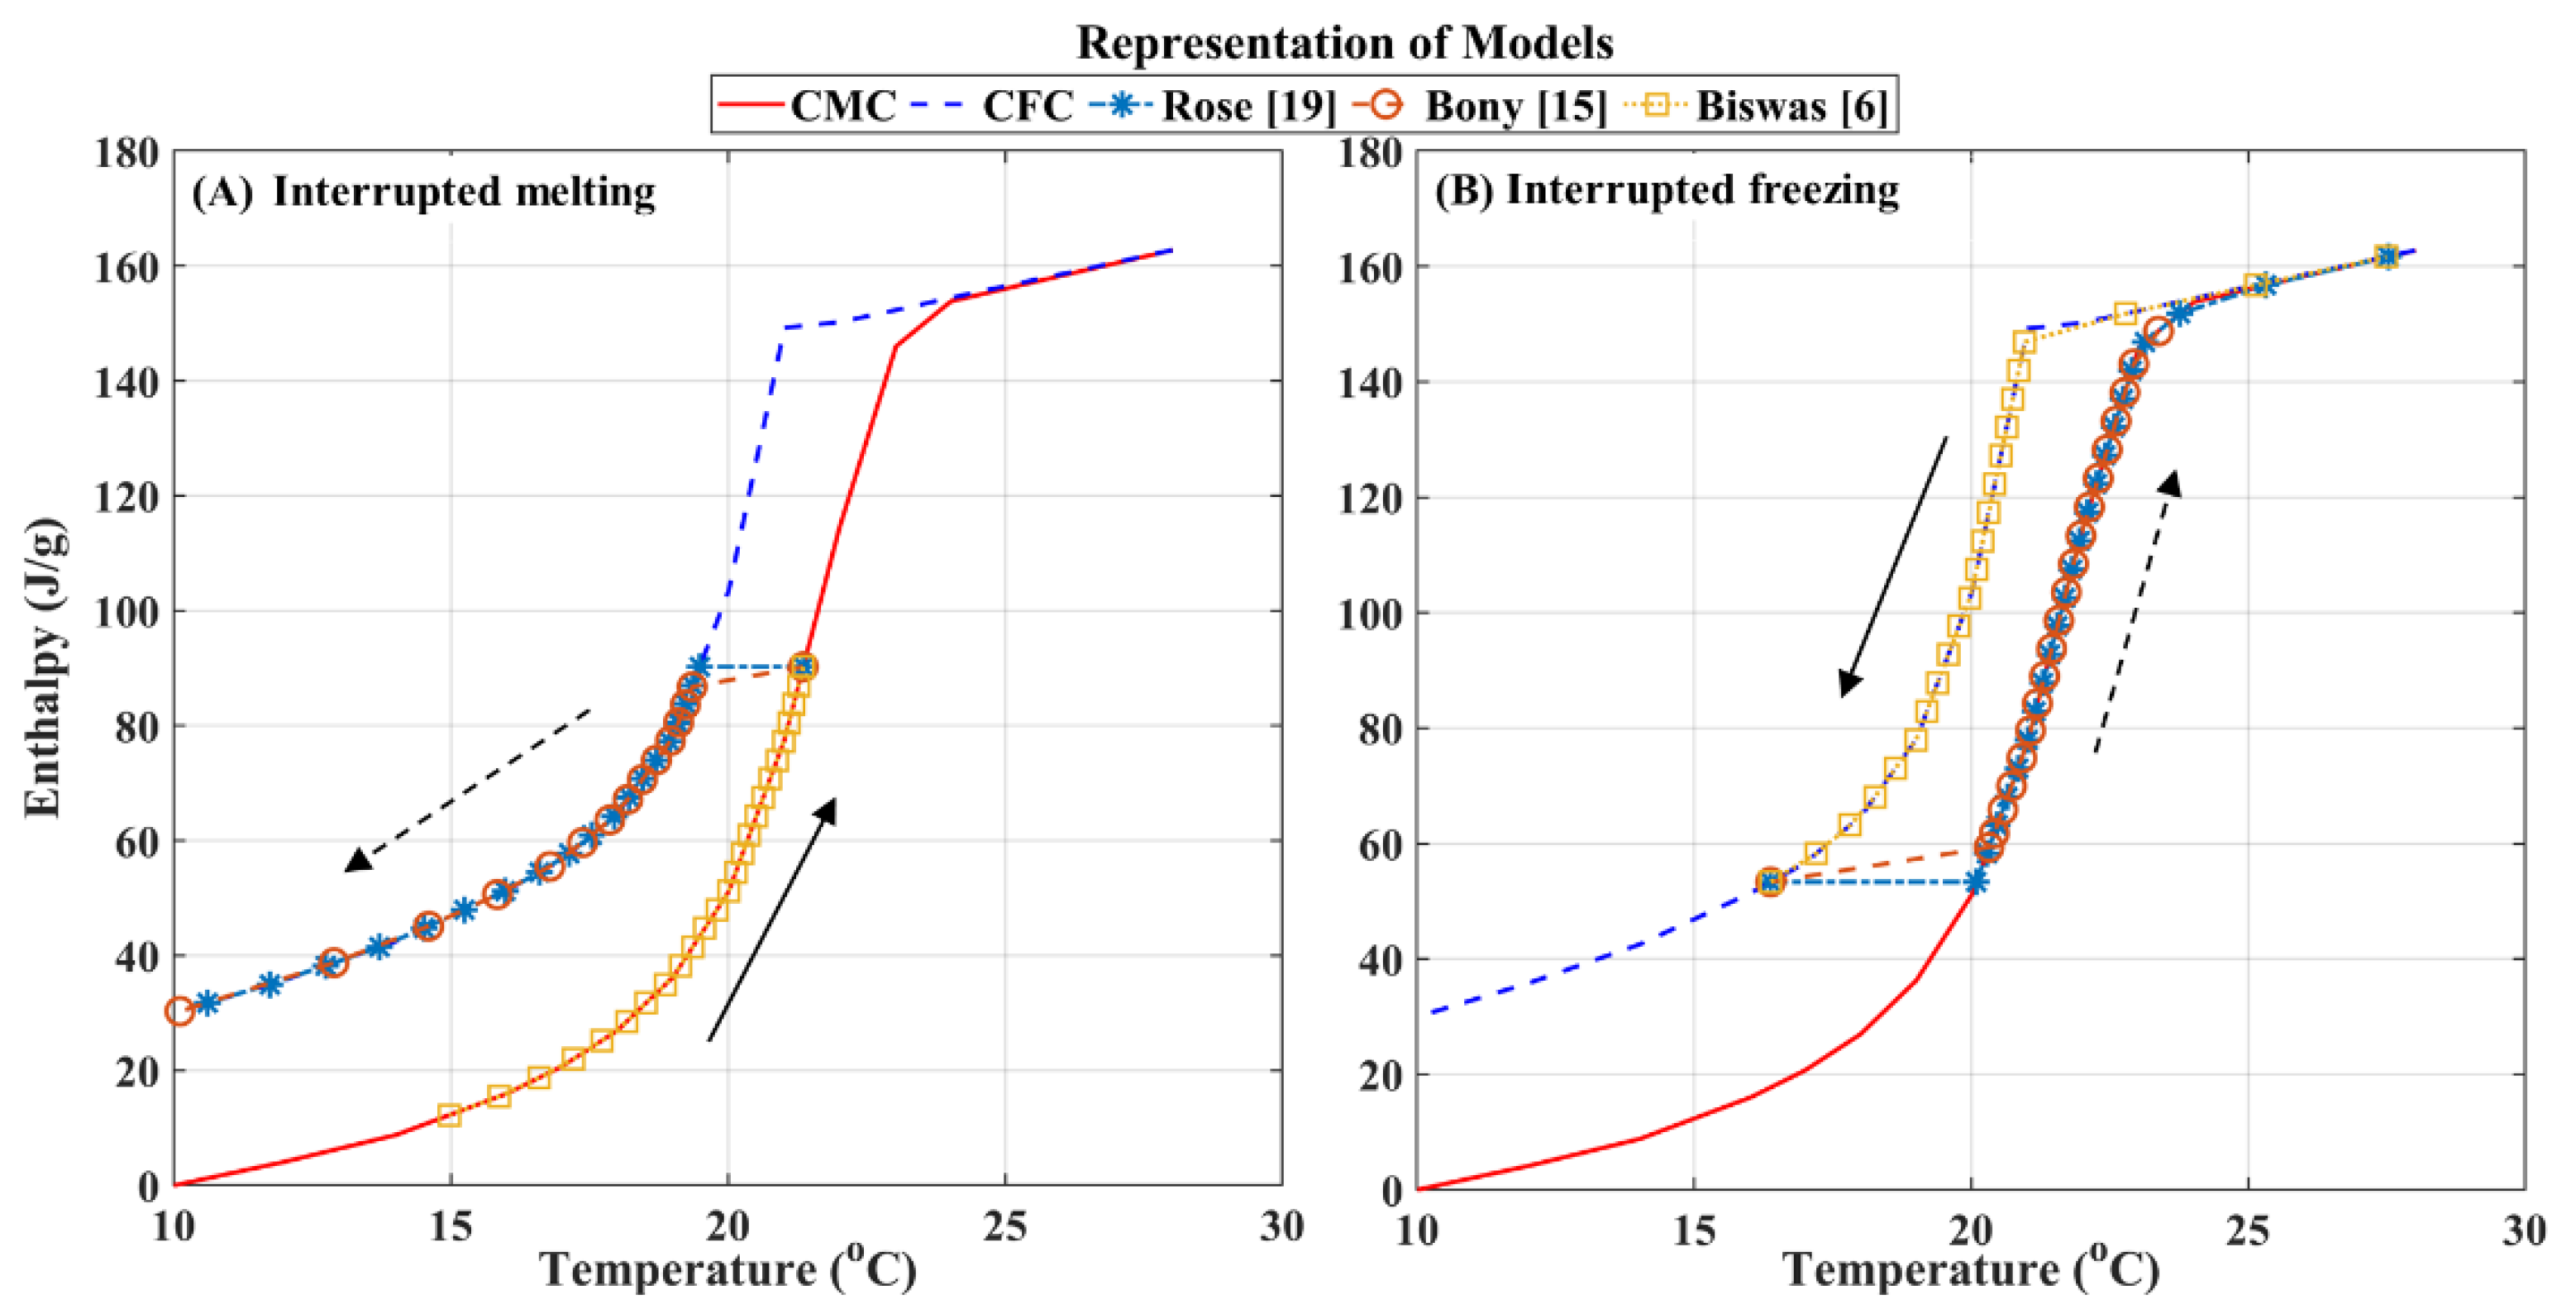
Figure 4 provides a graphical representation of how different simulation models would treat the interrupted phase changes using the CMC and CFC temperature–enthalpy curves of the current PCM. The graph on the left describes how the different models would treat a melting process that is interrupted after partial melting and is following by complete freezing. The graph on the right describes a phase change process involving interrupted freezing following by complete melting. Following Rose et al. [19], the state of the PCM would assume a horizontal shift from the melting to freezing enthalpy function in the case of interrupted melting and the reverse for interrupted freezing; this horizontal transition is represented by the ‘asterisk’ symbols and dash-dot blue lines in Figure 4. According to Bony and Citherlet [15], in the case of interrupted melting, the state of the PCM would shift from the melting curve to freezing curve along a line with a slope equal to the slope of the enthalpy function in the fully frozen state; in case of interrupted freezing, the PCM state would shift from the freezing to melting curve along a ling with the slope of the enthalpy function in the fully molten state. These “sloped” shifts are represented by the ‘circle’ symbols and dashed red lines in Figure 4. In Figure 4, the solid black arrows indicate the direction of the initial melting or freezing process. The dashed black arrows show the direction of the freezing or melting process following the interruption according to Rose et al. [19] and Bony and Citherlet [15]. Finally, Biswas et al. [6] assumed that there is no shift between the melting and freezing enthalpy functions in case of interruptions. During interrupted phase changes, the PCM state is assumed to stay on the original enthalpy curve until the PCM is fully melted or fully frozen before shifting to the other enthalpy curve.
Figure 5 shows the measured temperature–enthalpy curves of the IC1 and IC2 tests superimposed on the CMC and CFC temperature–enthalpy curves. In both IC1 and IC2, the PCM started from a fully frozen state and was heated up to 20 °C so it would start melting. Next, the PCM was cooled down to 17 °C, followed by re-heating to 20 °C, re-cooling to 17 °C and finally re-heating to 20 °C. These tests were performed to evaluate the repeatability of the measured enthalpy values under repeated interruptions in the melting and freezing processes. It is noted that the slopes of the interrupted melting and freezing curves are discernibly different.
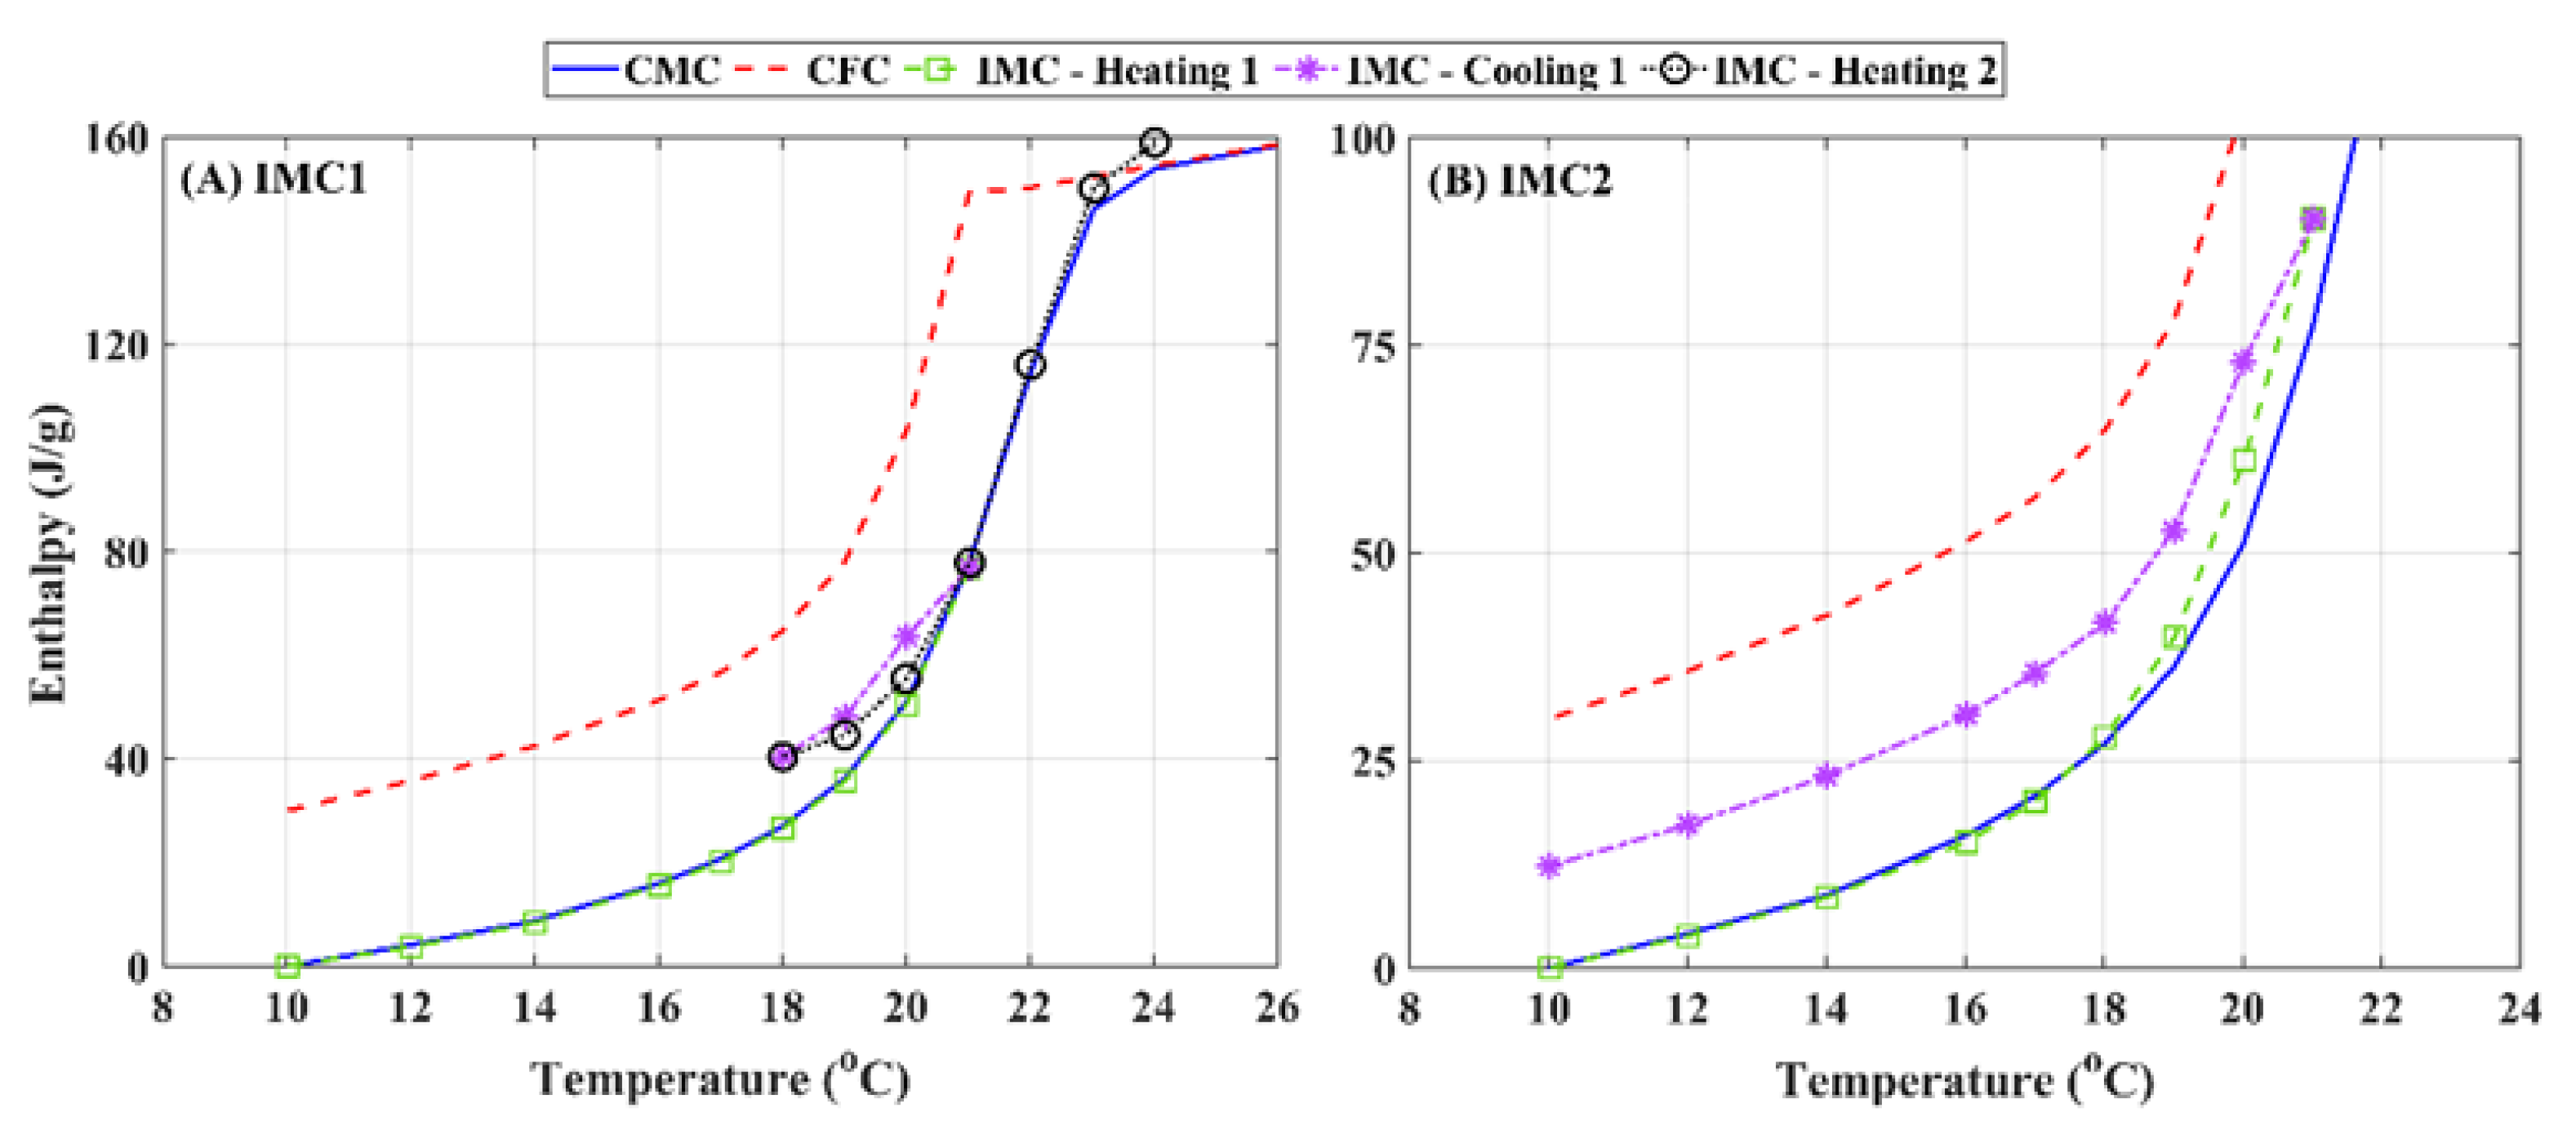
Figure 6 shows the IMC1 and IMC2 curves compared to the CMC and CFC curves. In the IMC1 test, the PCM starts in the fully frozen state and is subjected to heating until it reaches 21 °C, following by cooling to 18 °C, and finally re-heating to 24 °C, where it was completely melted. In the IMC2 test, the PCM started in the fully frozen state, was heated to 21 °C and then cooled down to 10 °C, where it was fully frozen again.
Again, the slopes of the melting and freezing curves are discernibly different. In the IMC1 test, the melting curve during the first heating followed the CMC curve. During the second heating process, initially, there was a difference in the slope between the ‘Heating 2’ curve and the CMC curve, but at 21 °C, the melting curves become coincident. With IMC2, some deviation between the ‘Heating 1’ and CMC curves are observed, possibly due to experimental uncertainties.
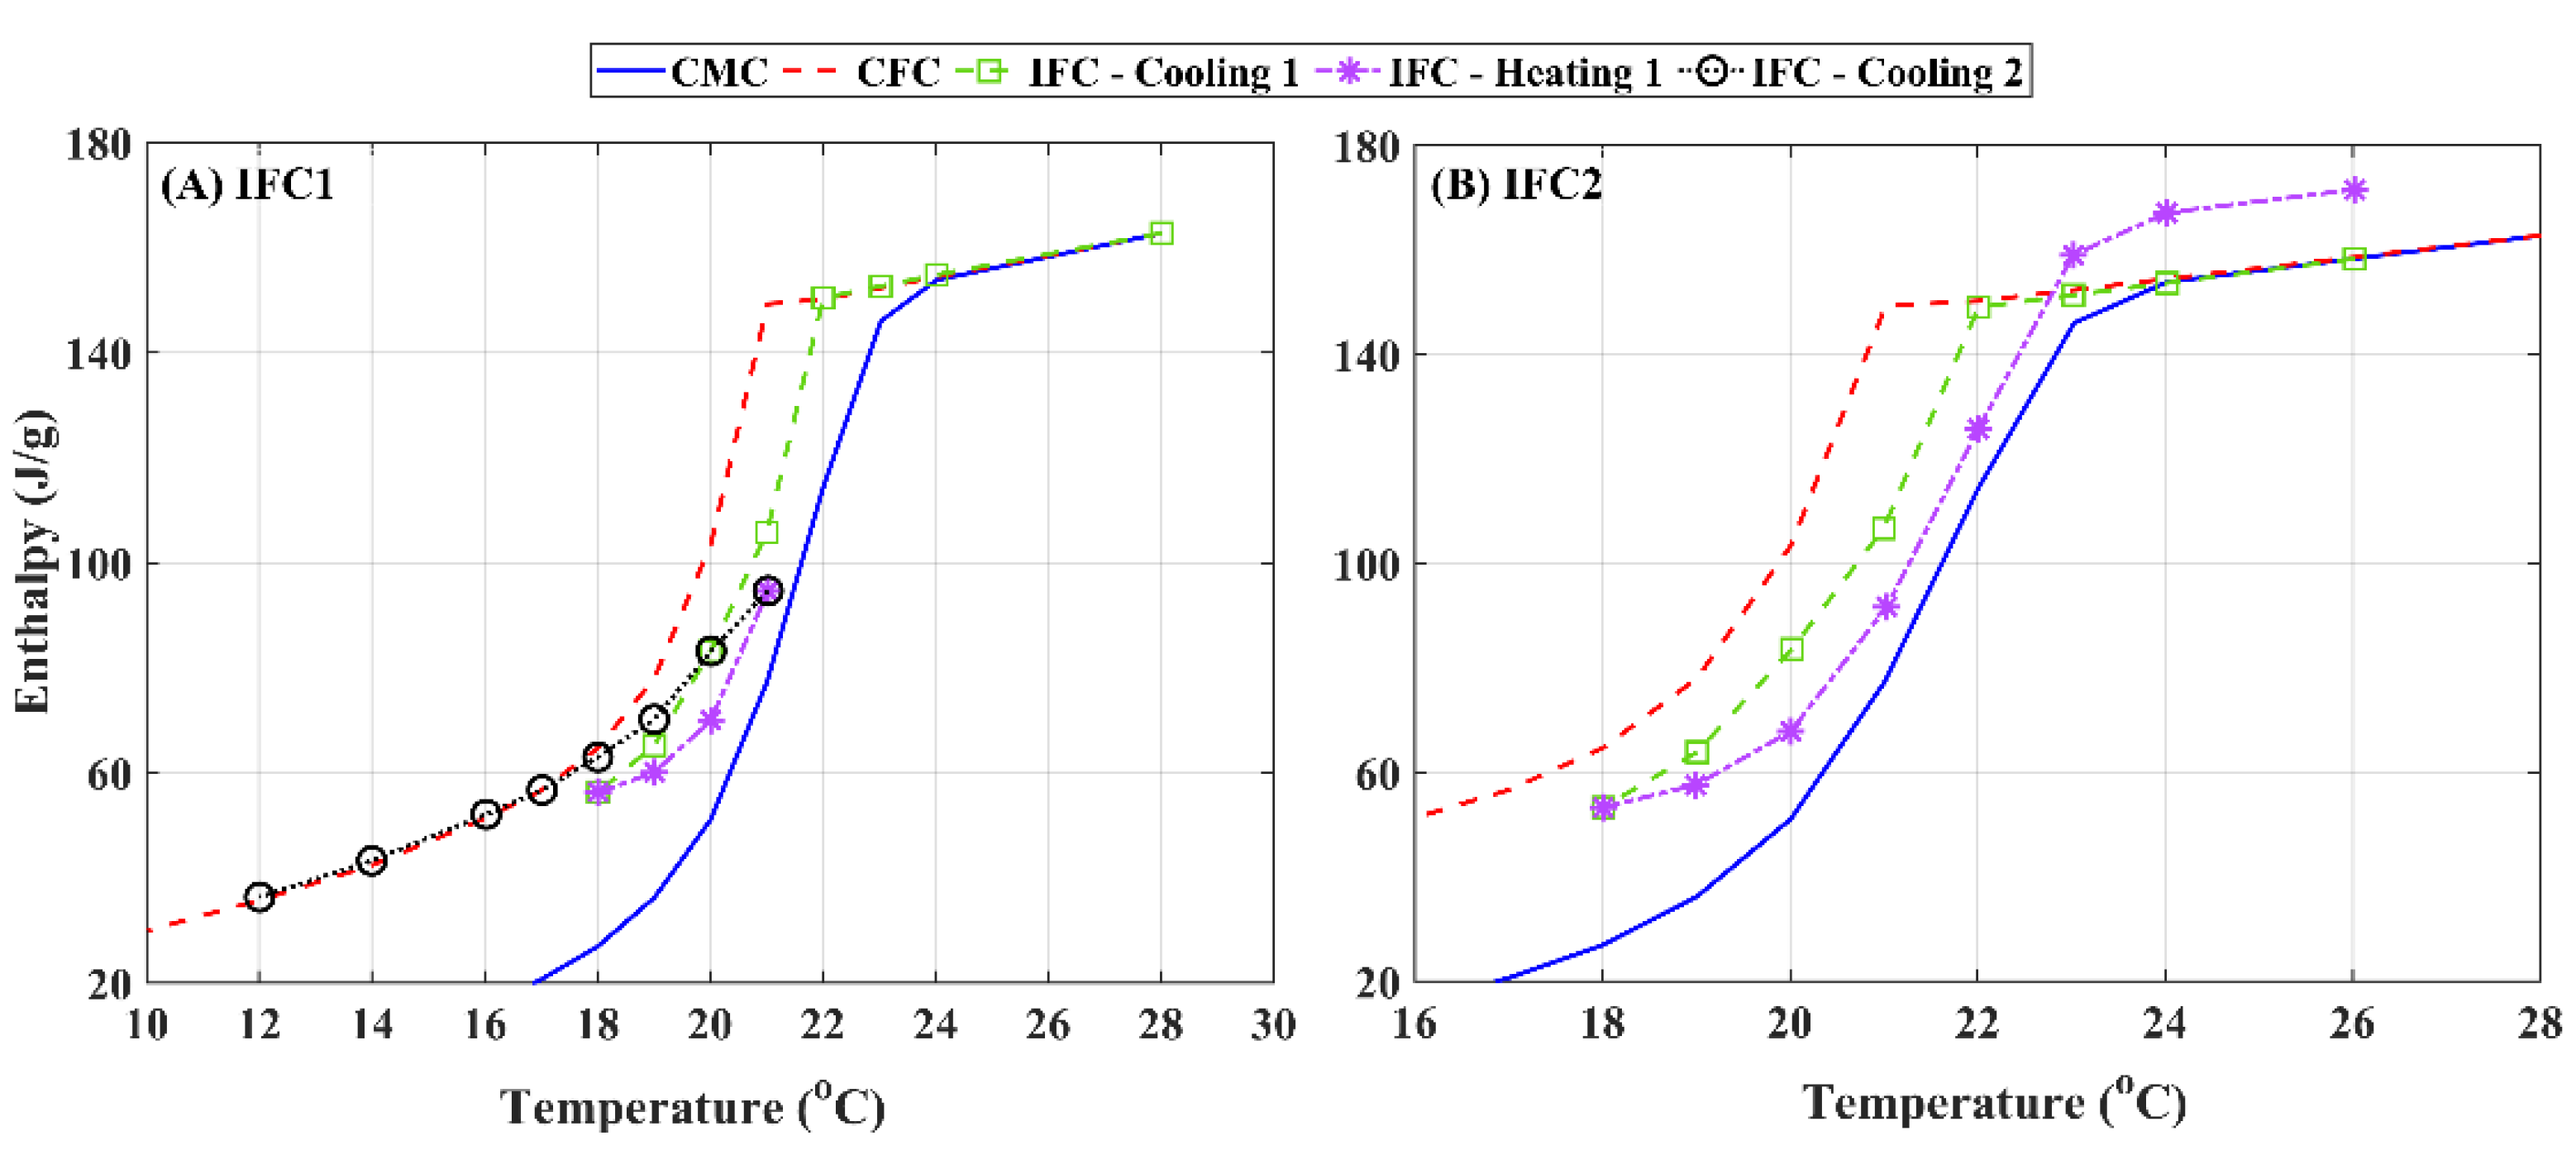
Figure 7 compares the IFC1 and IFC2 curves with CMC and CFC curves. In IFC1, the PCM started from a fully molten state, was cooled to 18 °C, heated to 21 °C and finally cooled to 12 °C, where it was fully frozen. In IFC2, the PCM started as fully molten, was cooled to 18 °C and then heated to 26 °C, where it was fully molten again.
It should be noted that the differences in the slopes of the different interrupted temperature–enthalpy curves in Figure 5, Figure 6 and Figure 7 are due to the inherently different slopes of the melting and freezing curves as well as the different starting points of the different interrupted heating and cooling curves.
Next, the experimentally measured temperature–enthalpy curves of the PCM under different interrupted phase change process were analyzed to examine how they would compare to the assumptions made in different numerical models. For numerical modeling of PCMs, the main property of interest is the temperature-dependent specific heat of the PCM, i.e., the shape and slope of the enthalpy curves. The actual enthalpy values are not of primary interest. Thus, in the current analysis, “translated” melting and freezing curves were generated for comparison between the current experimental results and numerical model assumptions. A curve translation method was used so that the initial points of the temperature–enthalpy curves for all the cases being compared were the same and their respective slopes can be more easily distinguished. The curve “translation” essentially entailed shifting the numerical model-assumed curves on the temperature–enthalpy plots so that their starting points coincided with the respective experimental curve.
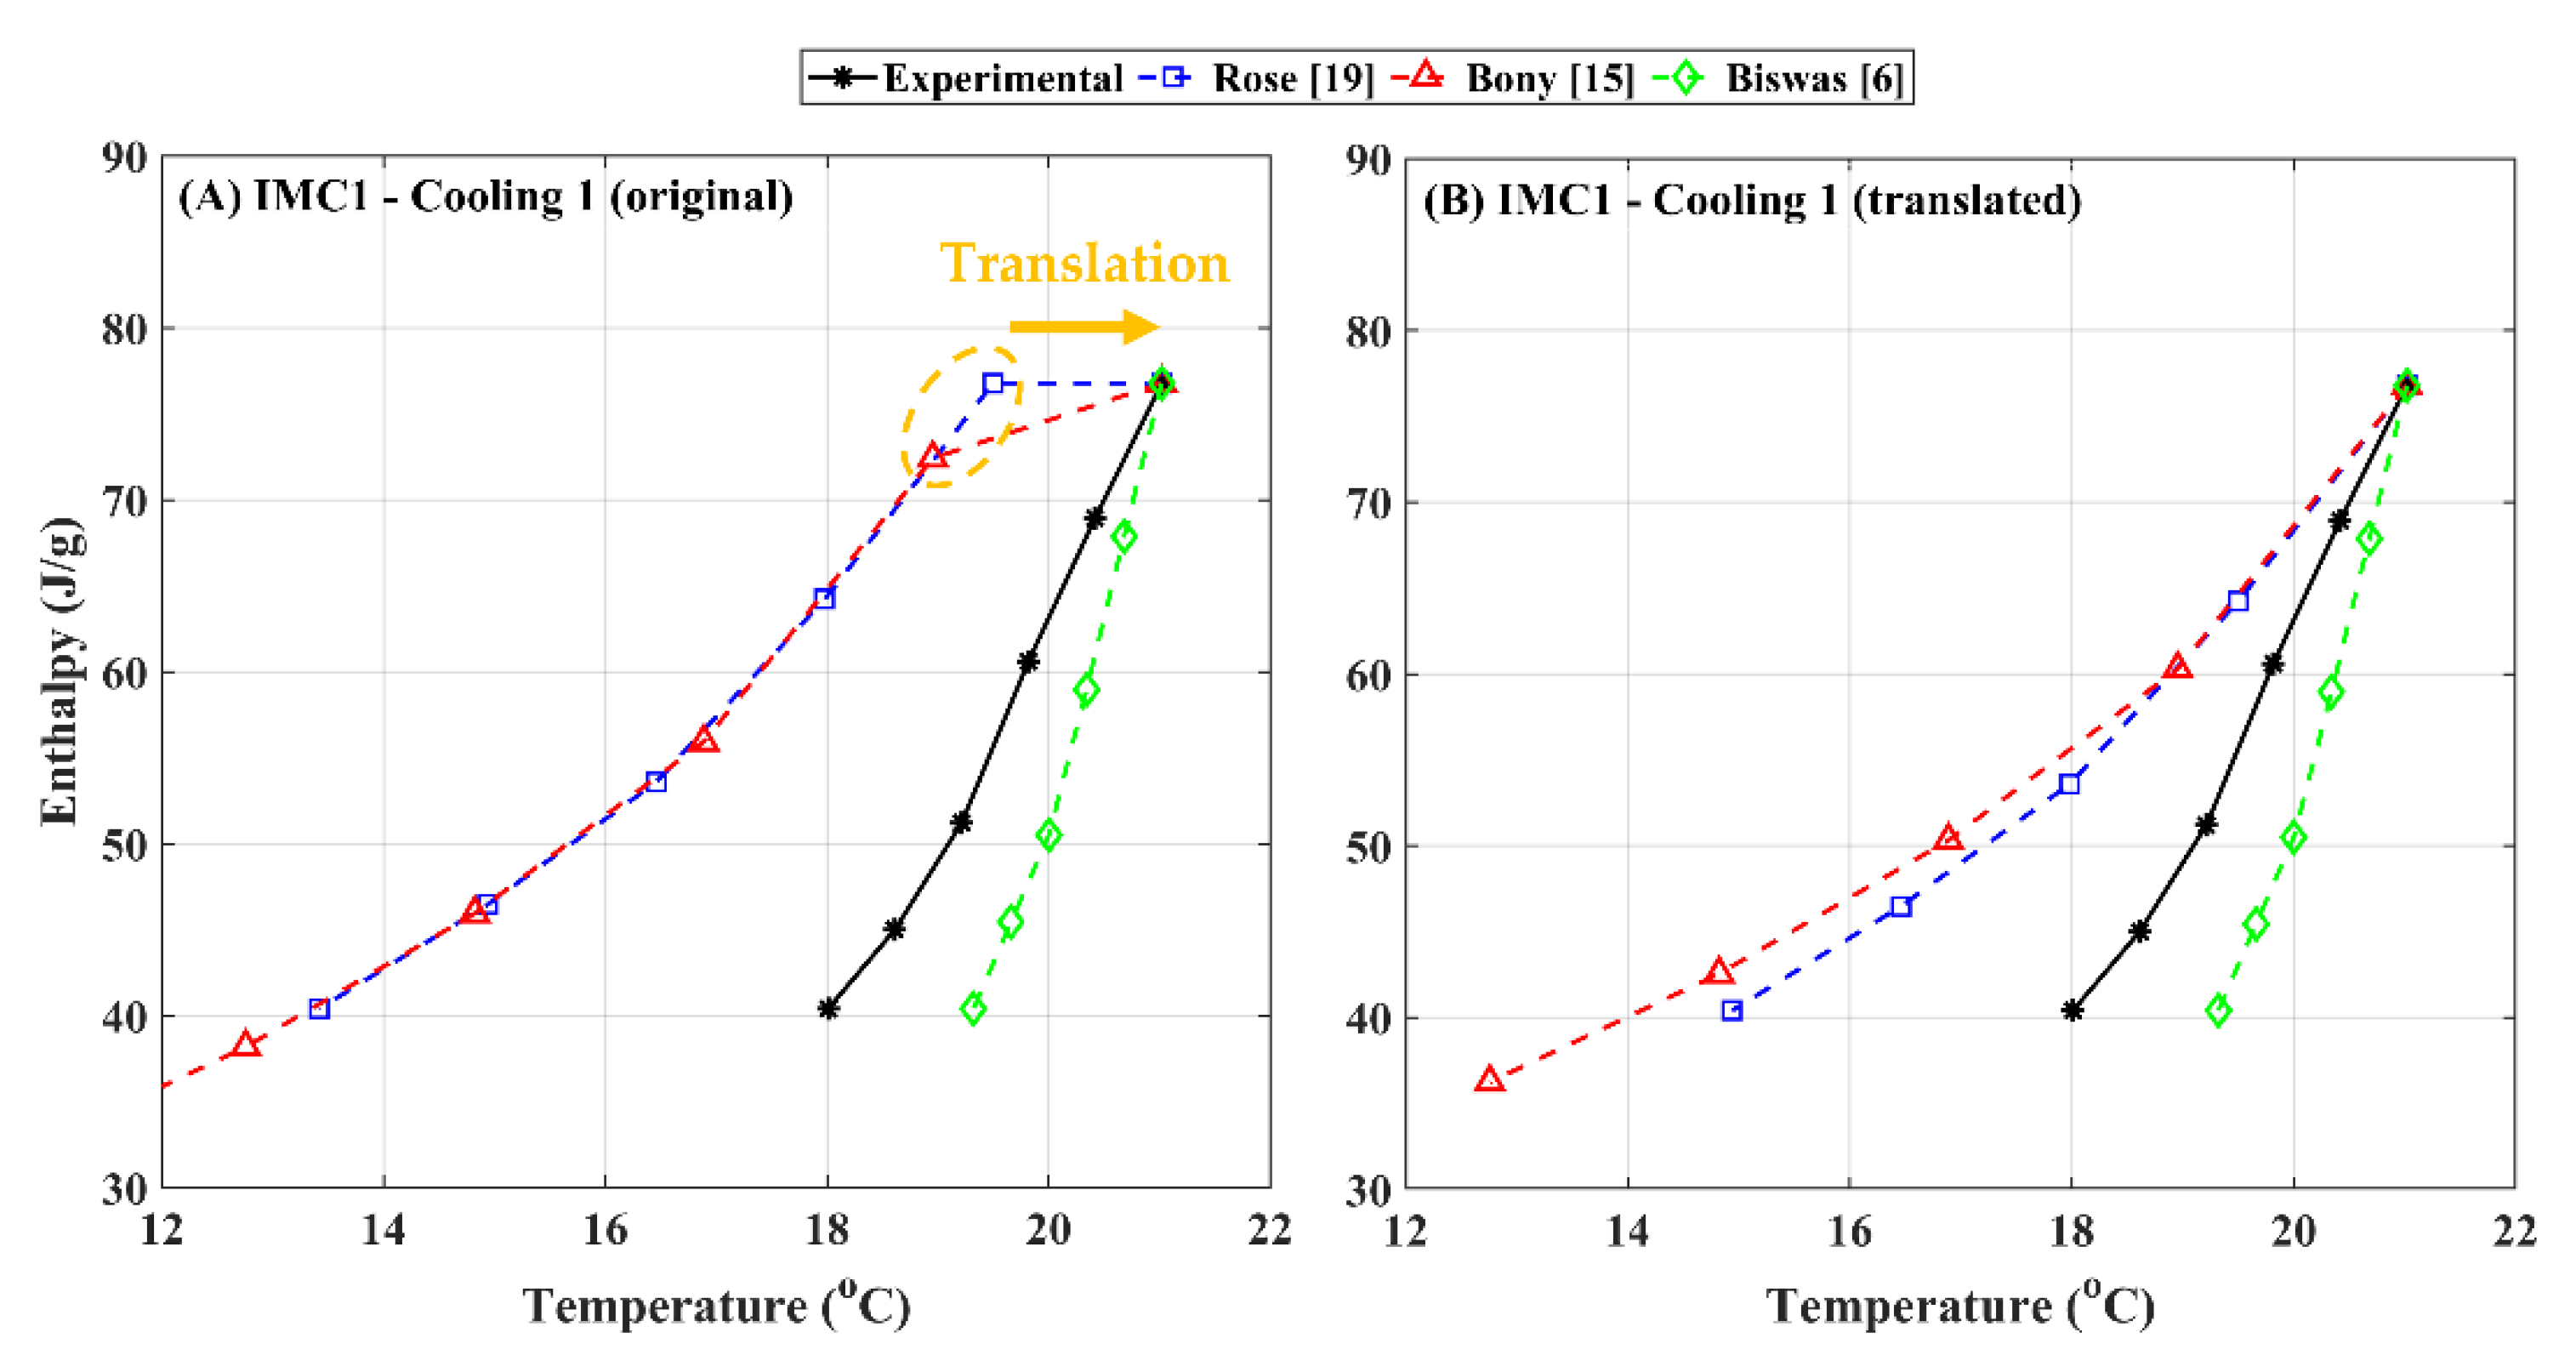
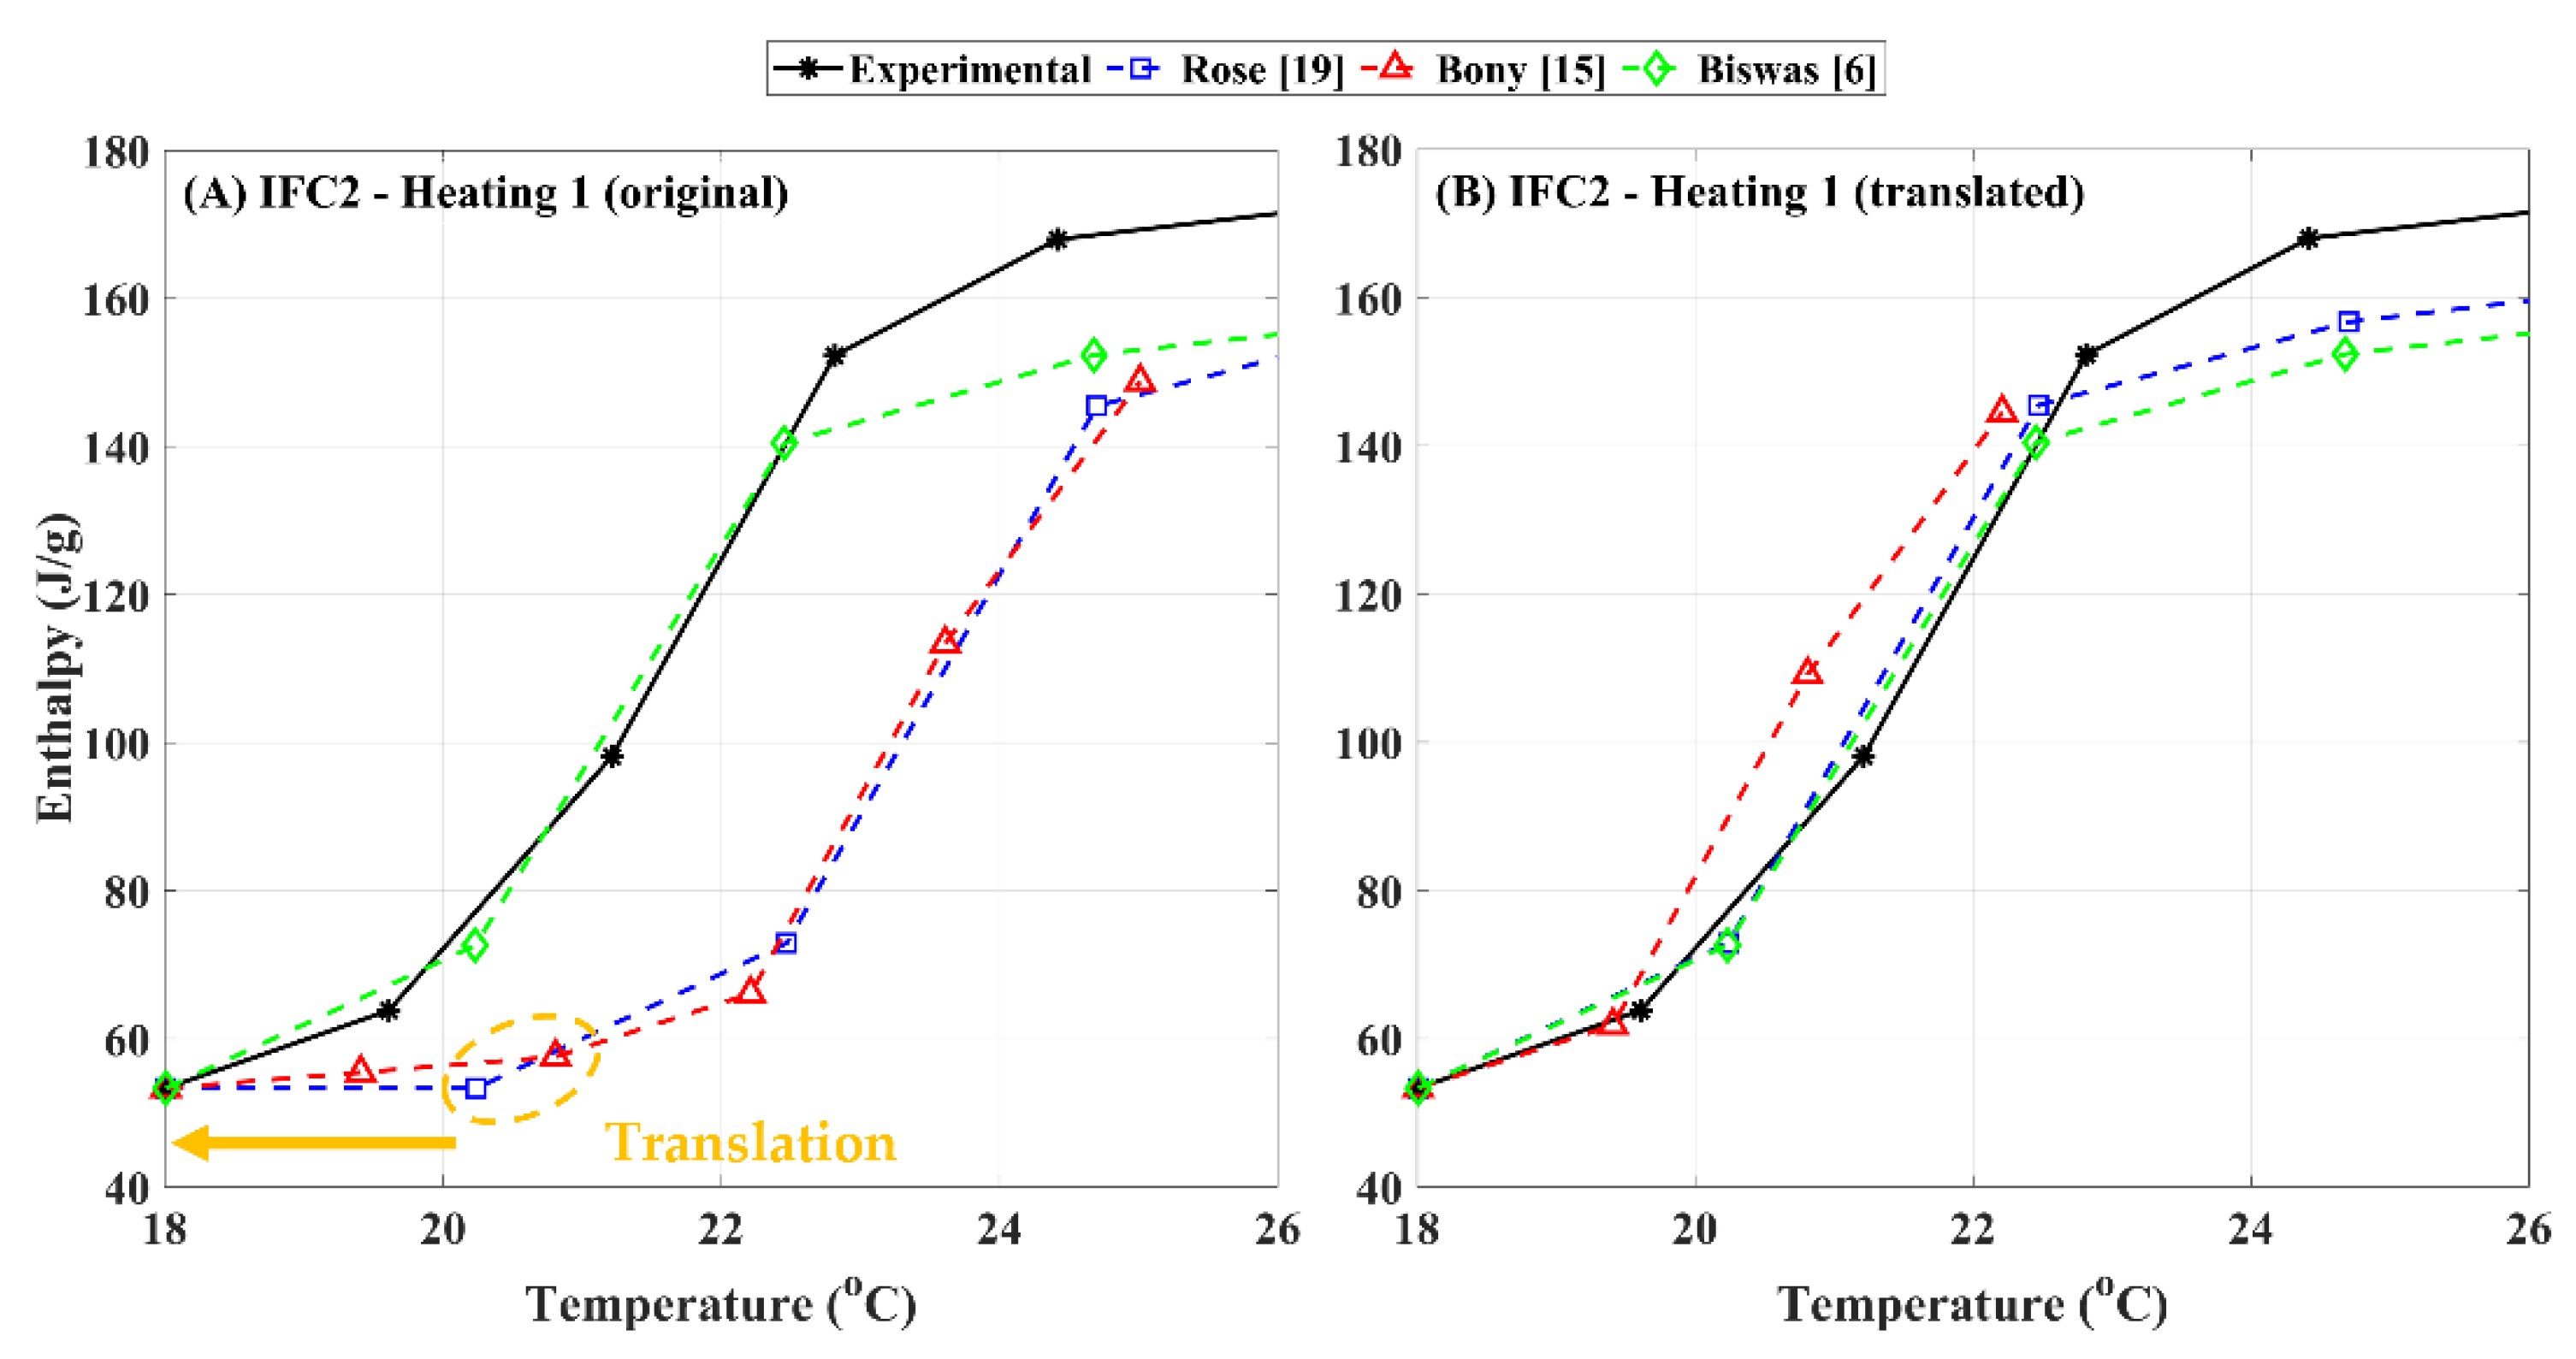
Figure 8 illustrates the “translation” of a cooling curve (Cooling 1) following an interrupted heating process (Heating 1) in the test IMC1 (Figure 6). The translation entails shifting the initial points of the cooling curves assumed by the different models—Rose et al. [19] and Bony and Citherlet [15]—to match the initial point of the experimental cooling curve. In this case, the initial point of the experimental cooling curve corresponded to a temperature of 21 °C and an enthalpy of 76.8 J/g. Since Biswas et al. [6] assumed no shift between the heating and cooling curves, the initial point for this model is the same as the experimental cooling curve.
Figure 8A visually illustrates the translation of the initial points of the assumed cooling curves by Rose et al. [19] and Bony and Citherlet [15] to the initial point of the experimental cooling curve. The initial points of the Rose et al. [19] and Bony and Citherlet [15] were estimated by the method illustrated in Figure 4. In the Rose et al. [19] model, the state of the PCM would assume a horizontal shift from the melting to freezing curve. Thus, in the case of Rose et al. [19], the translation was a horizontal shift of the freezing temperature–enthalpy curve.
In the Bony and Citherlet [15] model, the state of the PCM would shift from the melting curve to freezing curve along a line with a slope equal to the slope of the enthalpy function in the fully frozen state. Therefore, in this case, the freezing temperature–enthalpy curve was shifted to the right and upwards so its starting point coincided with the initial point of the experimental freezing curve.
Figure 8B compares the slopes of the cooling curves following an interrupted heating between the experimental results and the different model assumptions. In this instance, the actual behavior, in terms of the slope of the temperature–enthalpy curve, of a PCM during interrupted heating followed by cooling appeared to lie in between the assumed freezing or cooling curves by Biswas et al. [6] vs. Rose et al. [19] and Bony and Citherlet [15]. The slopes of the curves assumed by Rose et al. [19] and Bony and Citherlet [15] are very similar.
Figure 9 shows the original and translated heating curves (Heating 1) following an interrupted cooling process (Cooling 1) in the test IFC2 (Figure 7). Figure 9A illustrates the translation of the initial points of the heating curves assumed by Rose et al. [19] and Bony and Citherlet [15] to match the initial point of the experimental heating curve; in this case, temperature of 18 °C and enthalpy of 53.3 J/g. The initial point of the Rose et al. [19] model was estimated by a horizontal shift from the freezing to the melting curve. The initial point of the Bony and Citherlet [15] model was assumed to shift from the freezing to the melting curve along a ling with the slope of the enthalpy function in the fully molten state.
Figure 9B compares the slopes of the heating curves following an interrupted cooling process between the experimental results and the different model assumptions. Again, the temperature–enthalpy curves following Rose et al. [19] and Bony and Citherlet [15] were translated so their initial points coincided with the initial point of the experimental heating curve. In this instance, the behavior of the PCM closely matched the assumed melting curves by Biswas et al. [6] and Rose et al. [19], and is different from the assumption by Bony and Citherlet [15].
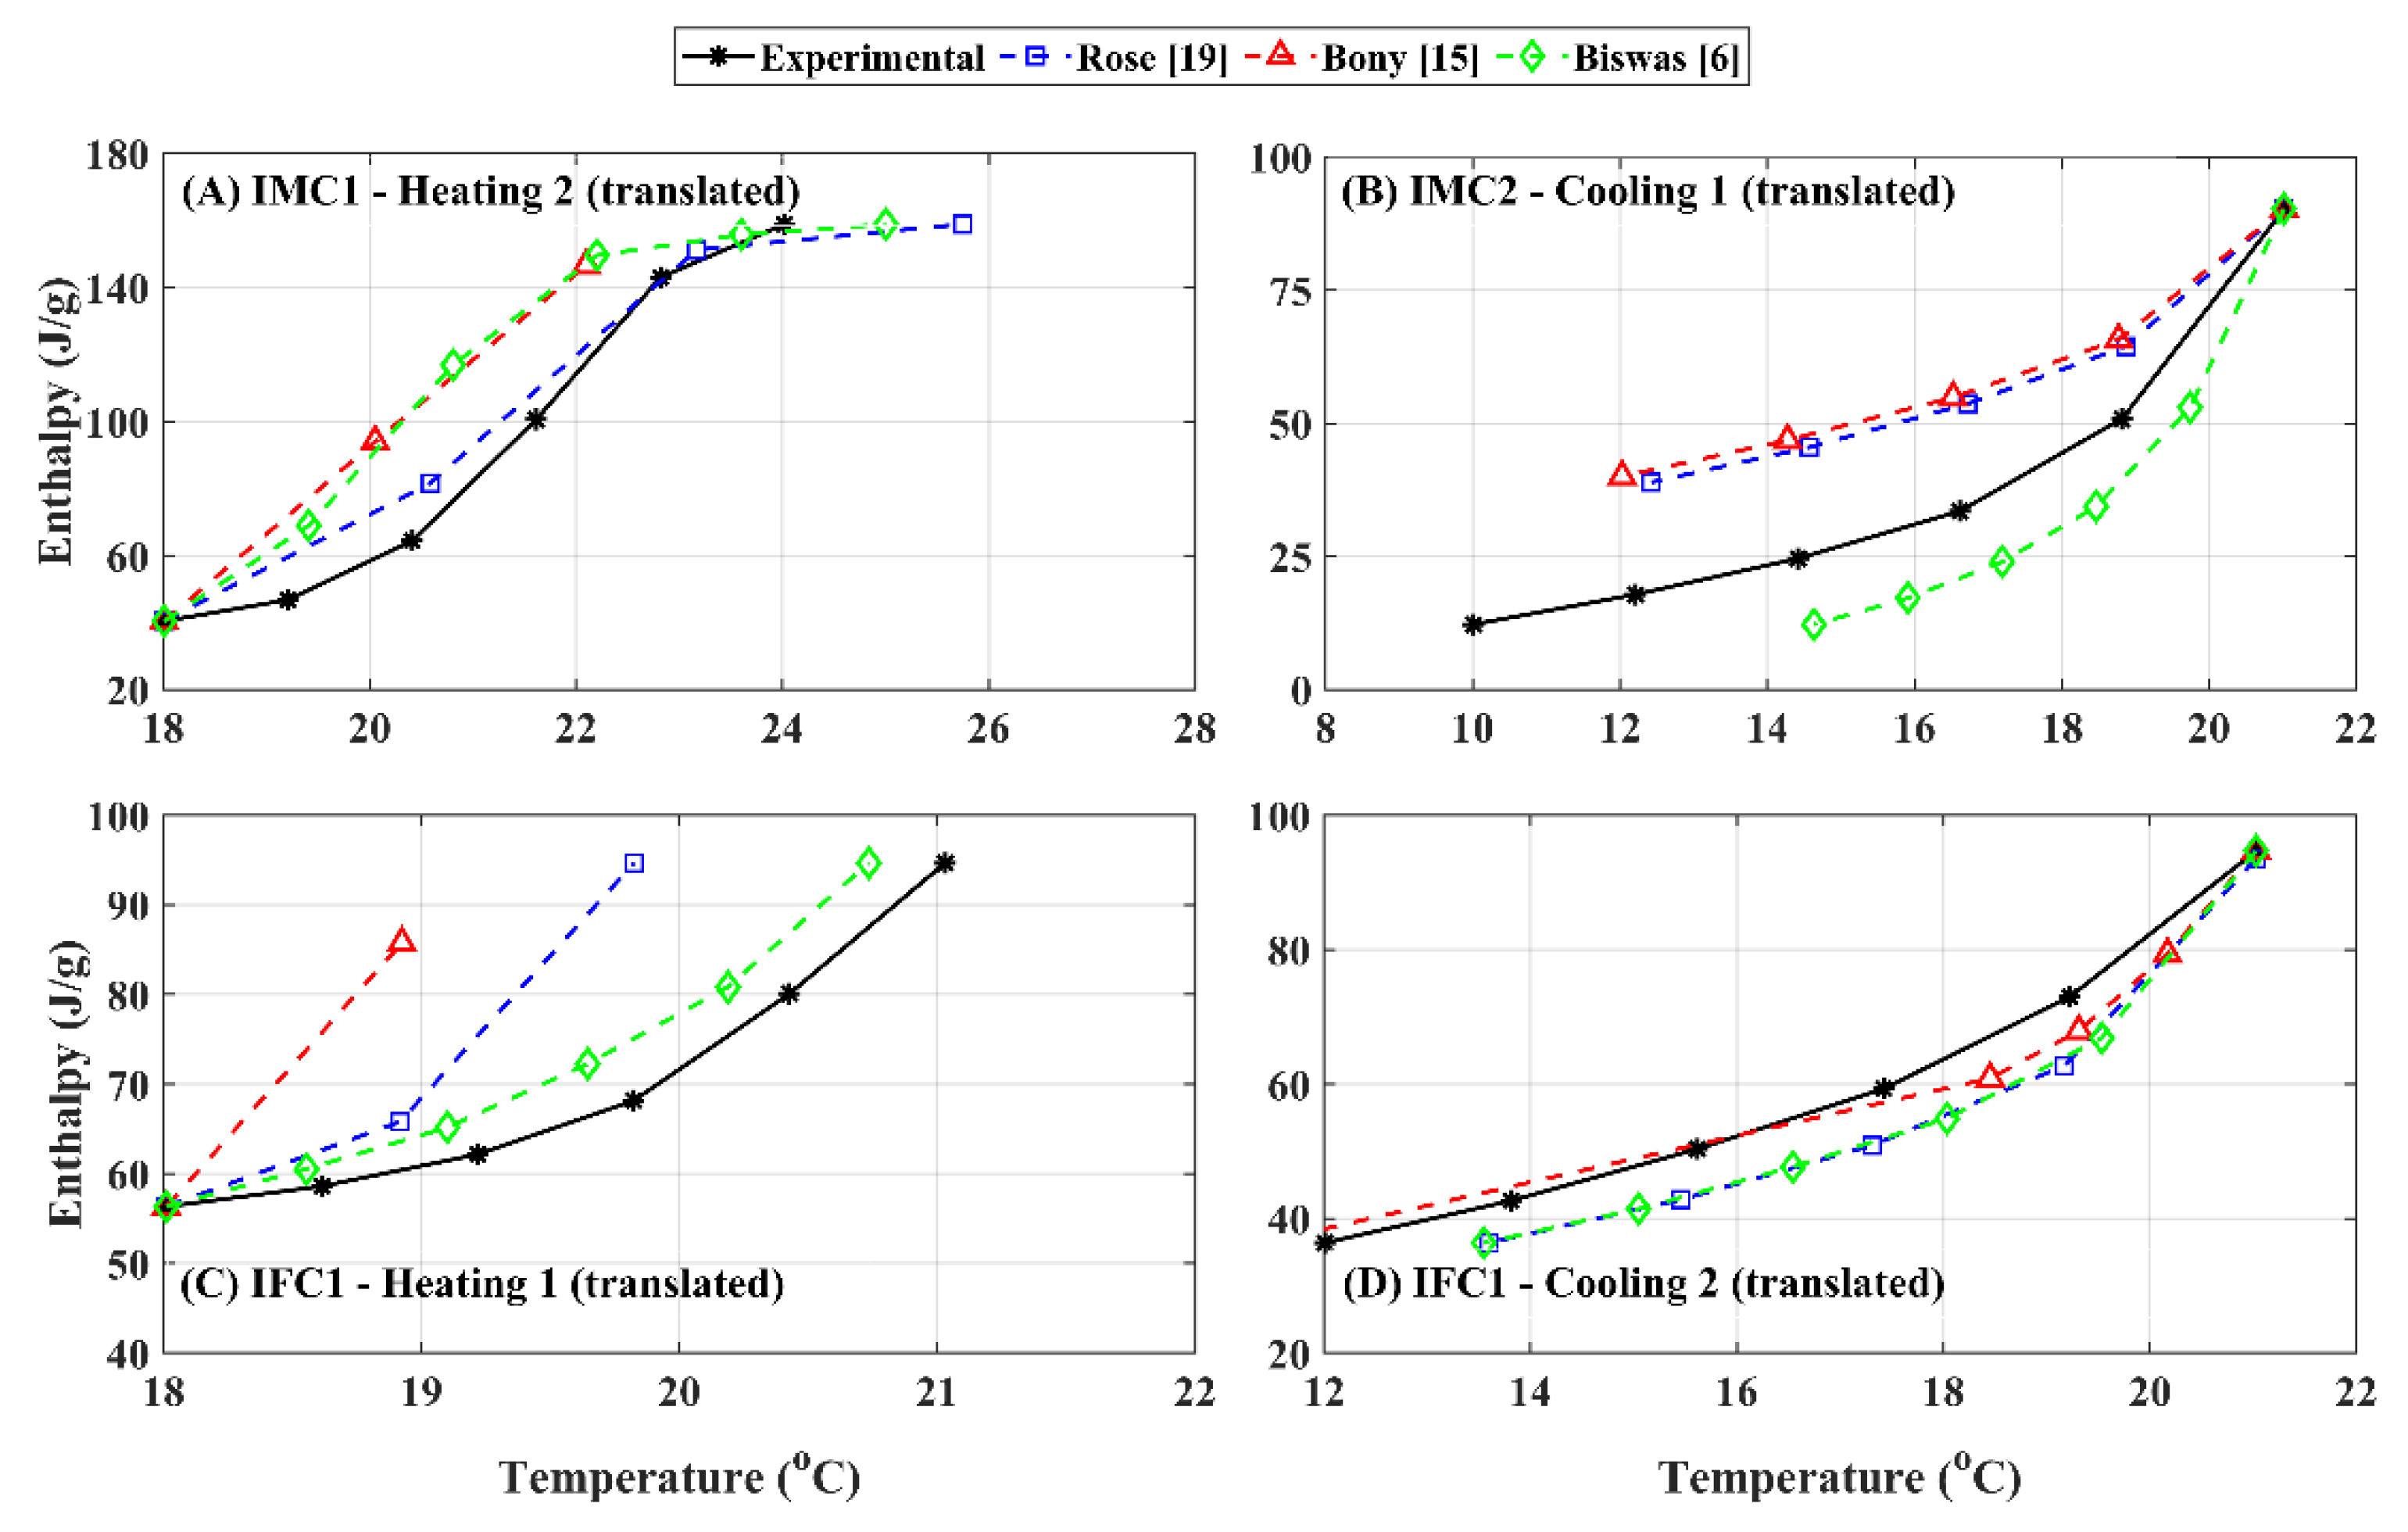
Finally, Figure 10 compares the remaining translated cooling curves following interrupted heating and heating curves following interrupted cooling processes from the remaining tests IMC1, IMC2 and IFC1. Different degrees of agreement between the experimental curves and model assumptions are observed. For example, the ‘IMC1–Heating 2’ curve matches Rose et al. [19] relatively closely, while the ‘IFC1–Cooling 2’ curve matches Bony and Citherlet [15]. The ‘IMC2–Cooling 1’ and ‘IFC1–Heating 1’ curves do not overlap any of the model assumptions, but appear to be closest to Biswas et al. [6].
In summary, the comparison between the experimental data and assumptions regarding interrupted phase change processes in PCMs highlighted the difficulty in accurately capturing all different processes using any single assumption. This work also highlights the need for more systematic evaluations of interrupted phase change in a variety of PCMs of different compositions, organic vs. salt hydrates, as well as different phase change temperature ranges.
4. Conclusions
This article presents systematic experimental evaluations of interrupted phase change processes in PCMs. PCM hysteresis has been incorporated in several numerical models and assumptions were made to treat interrupted phase change processes, including horizontal and sloped transitions between the enthalpy functions of melting and freezing and a non-transition or same curve model, until either of the end points are reached. In this study, experiments were designed to emulate multiple interrupted phase change scenarios that could be experienced by PCMs used in building applications. A total of six experiments were performed to evaluate scenarios involving interrupted heating followed by cooling or sequential cooling and heating, and vice-versa, for comparison with different assumptions used in numerical models.
The experimental data were compared to three model assumptions that address cooling and heating following interruptions. A curve “translation” method was used to match the initial points of the heating and cooling enthalpy curves following interruptions. The intent was to compare the slopes of these modified enthalpy curves, i.e., the temperature-dependent specific heat, with real experimental data. The comparison between experimental data and model assumptions highlighted the difficulty in accurately capturing the interrupted phase change phenomenon in PCMs. This work also highlighted the need for more systematic evaluations of interrupted phase change in a variety of PCMs for generating a wider database that can be used to further evaluate and validate PCM models. In addition, there is a need to understand what phase change processes occur in real building applications of the PCM products and their impact on the energy performance of PCMs via experimental and numerical investigations.
Author Contributions
Conceptualization, K.B.; methodology, K.B., S.S. and R.J.; formal analysis, R.J. and K.B.; experimental investigation, R.J.; data curation, R.J.; writing—original draft preparation, R.J.; writing—review and editing, K.B.; visualization, K.B. and R.J.; supervision, K.B. and S.S.; project administration, K.B.; funding acquisition, K.B. and S.S. All authors have read and agreed to the published version of the manuscript.
Funding
This work was partially supported by the Building Technologies Office of the United States Department of Energy under Contract No. DE-AC05-00OR22725 with UT-Battelle, LLC.
Institutional Review Board Statement
Not applicable.
Informed Consent Statement
Not applicable.
Data Availability Statement
Not applicable.
Acknowledgments
The authors would like to thank Gas Technology Institute and Southern Illinois University for the support in developing this manuscript. The experimental work and portions of the analytical work described in this manuscript were performed at Oak Ridge National Laboratory (ORNL), which is managed by UT-Battelle, LLC, under Contract No. DE-AC05-00OR22725 with the U.S. Department of Energy. The authors would like to thank Jerald Atchley of ORNL for his support of the experimental testing reported here.
Conflicts of Interest
The authors declare no conflict of interest.
References
- Harish, V.; Kumar, A. A review on modeling and simulation of building energy systems. Renew. Sustain. Energy Rev. 2016, 56, 1272–1292. [Google Scholar] [CrossRef]
- Khadiran, T.; Hussein, M.Z.; Zainal, Z.; Rusli, R. Advanced energy storage materials for building applications and their thermal performance characterization: A review. Renew. Sustain. Energy Rev. 2016, 57, 916–928. [Google Scholar] [CrossRef]
- Yang, L.; Yan, H.; Lam, J.C. Thermal comfort and building energy consumption implicationsΓÇôa review. Appl. Energy 2014, 115, 164–173. [Google Scholar] [CrossRef]
- Bland, A.; Khzouz, M.; Statheros, T.; Gkanas, E.I. PCMs for residential building applications: A short review focused on disadvantages and proposals for future development. Buildings 2017, 7, 78. [Google Scholar] [CrossRef] [Green Version]
- Mandilaras, I.; Stamatiadou, M.; Katsourinis, D.; Zannis, G.; Founti, M. Experimental thermal characterization of a Mediterranean residential building with PCM gypsum board walls. Build. Environ. 2013, 61, 93–103. [Google Scholar] [CrossRef]
- Biswas, K.; Shukla, Y.; Desjarlais, A.; Rawal, R. Thermal characterization of full-scale PCM products and numerical simulations, including hysteresis, to evaluate energy impacts in an envelope application. Appl. Therm. Eng. 2018, 138, 501–512. [Google Scholar] [CrossRef]
- Konuklu, Y.; Paksoy, H.Ö. Phase change material sandwich panels for managing solar gain in buildings. J. Sol. Energy Eng. 2009, 131, 041012. [Google Scholar] [CrossRef]
- Rao, Z.; Wang, S.; Zhang, G. Simulation and experiment of thermal energy management with phase change material for ageing LiFePO4 power battery. Energy Convers. Manag. 2011, 52, 3408–3414. [Google Scholar] [CrossRef]
- Chaabane, M.; Mhiri, H.; Bournot, P. Thermal performance of an integrated collector storage solar water heater (ICSSWH) with a storage tank equipped with radial fins of rectangular profile. Heat Mass Transf. 2013, 49, 107–115. [Google Scholar] [CrossRef]
- Dolado, P.; Lazaro, A.; Marin, J.M.; Zalba, B. Characterization of melting and solidification in a real-scale PCMΓÇôair heat exchanger: Experimental results and empirical model. Renew. Energy 2011, 36, 2906–2917. [Google Scholar] [CrossRef]
- Khudhair, A.M.; Farid, M.M. A review on energy conservation in building applications with thermal storage by latent heat using phase change materials. Energy Convers. Manag. 2004, 45, 263–275. [Google Scholar] [CrossRef]
- Qureshi, W.A.; Nair, N.-K.C.; Farid, M.M. Impact of energy storage in buildings on electricity demand side management. Energy Convers. Manag. 2011, 52, 2110–2120. [Google Scholar] [CrossRef]
- Biswas, K.; Abhari, R. Low-cost phase change material as an energy storage medium in building envelopes: Experimental and numerical analyses. Energy Convers. Manag. 2014, 88, 1020–1031. [Google Scholar] [CrossRef] [Green Version]
- Biswas, K.; Lu, J.; Soroushian, P.; Shrestha, S. Combined experimental and numerical evaluation of a prototype nano-PCM enhanced wallboard. Appl. Energy 2014, 131, 517–529. [Google Scholar] [CrossRef]
- Bony, J.; Citherlet, S. Numerical model and experimental validation of heat storage with phase change materials. Energy Build. 2007, 39, 1065–1072. [Google Scholar] [CrossRef]
- Kuznik, F.; Virgone, J. Experimental investigation of wallboard containing phase change material: Data for validation of numerical modeling. Energy Build. 2009, 41, 561–570. [Google Scholar] [CrossRef]
- Chandrasekharan, R.; Lee, E.S.; Fisher, D.E.; Deoka, P.S. An enhanced simulation model for building envelopes with phase change materials. ASHRAE Trans. 2013, 119. [Google Scholar]
- Zastawna-Rumin, A.; Nowak, K. Effects of Neglecting PCM Hysteresis While Making Simulation Calculations of a Building Located in Polish Climatic Conditions. Appl. Sci. 2021, 11, 9166. [Google Scholar] [CrossRef]
- Rose, J.; Lahme, A.; Christensen, N.U.; Heiselberg, P.; Hansen, M.; Grau, K. Numerical method for calculating latent heat storage in constructions containing phase change material. In Proceedings of the Eleventh International IBPSA Conference, Glasgow, Scotland, 27–30 July 2009; pp. 400–407. [Google Scholar]
- Zastawna-Rumin, A.; Kisilewicz, T.; Berardi, U. Novel simulation algorithm for modeling the hysteresis of phase change materials. Energies 2020, 13, 1200. [Google Scholar] [CrossRef] [Green Version]
- Goia, F.; Chaudhary, G.; Fantucci, S. Modelling and experimental validation of an algorithm for simulation of hysteresis effects in phase change materials for building components. Energy Build. 2018, 174, 54–67. [Google Scholar] [CrossRef]
- Delcroix, B.; Kummert, M.; Daoud, A. Thermal behavior mapping of a phase change material between the heating and cooling enthalpy-temperature curves. Energy Procedia 2015, 78, 225–230. [Google Scholar] [CrossRef] [Green Version]
- Delcroix, B.; Kummert, M.; Daoud, A. Development and numerical validation of a new model for walls with phase change materials implemented in TRNSYS. J. Build. Perform. Simul. 2017, 10, 422–437. [Google Scholar] [CrossRef]
- Instruments, T. FOX 314. Available online: https://www.tainstruments.com/fox-series-314/ (accessed on 11 November 2021).
- ASTM. Standard Test Method for Using a Heat Flow Meter Apparatus for Measuring Thermal Storage Properties of Phase Change Materials and Products; ASTM International: West Conshohocken, PA, USA, 2020. [Google Scholar] [CrossRef]
Figure 1.
Heat flow meter apparatus used for PCM characterization.

Figure 2.
PCM FS21R.

Figure 3.
CMC and CFC temperature–enthalpy curves.

Figure 4.
Graphical representation of the shift between the melting and freezing curves during interrupted phase change processes as assumed by different models. The solid black arrows indicate the direction of the initial melting/freezing process, and the dashed black arrows show the freezing/melting process following the interruption.

Figure 5.
Temperature–enthalpy curves of (A) IC1 and (B) IC2 tests superimposed on CMC and CFC curves.
Figure 5.
Temperature–enthalpy curves of (A) IC1 and (B) IC2 tests superimposed on CMC and CFC curves.

Figure 6.
Temperature–enthalpy curves of (A) IMC1 and (B) IMC2 tests superimposed on CMC and CFC curves.
Figure 6.
Temperature–enthalpy curves of (A) IMC1 and (B) IMC2 tests superimposed on CMC and CFC curves.

Figure 7.
Temperature–enthalpy curves of (A) IFC1 and (B) IFC2 tests superimposed on CMC and CFC curves.
Figure 7.
Temperature–enthalpy curves of (A) IFC1 and (B) IFC2 tests superimposed on CMC and CFC curves.

Figure 8.
(A) Original and (B) translated cooling curves during the interrupted heating–cooling–heating test IMC1.
Figure 8.
(A) Original and (B) translated cooling curves during the interrupted heating–cooling–heating test IMC1.

Figure 9.
(A) Original and (B) translated heating curves during the interrupted cooling-heating test IFC2.
Figure 9.
(A) Original and (B) translated heating curves during the interrupted cooling-heating test IFC2.

Figure 10.
Translated cooling and heating curves. (A) Heating 2 during test IMC1; (B) Cooling 1 during test IMC2; (C) Heating 1 during test IFC1; and (D) Cooling 2 during test IFC1.
Figure 10.
Translated cooling and heating curves. (A) Heating 2 during test IMC1; (B) Cooling 1 during test IMC2; (C) Heating 1 during test IFC1; and (D) Cooling 2 during test IFC1.


Table 1.
Temperature setpoints for different test cycles.
| Setpoint Number | Temperature Set Points for the Different Tests, in °C | |||||||
|---|---|---|---|---|---|---|---|---|
| CMC | CFC | IC1 | IC2 | IMC1 | IMC2 | IFC1 | IFC2 | |
| 1 | 10 | 28 | 14 | 14 | 10 | 10 | 28 | 26 |
| 2 | 12 | 26 | 16 | 16 | 12 | 12 | 24 | 24 |
| 3 | 14 | 24 | 17 | 17 | 14 | 14 | 23 | 23 |
| 4 | 16 | 23 | 18 | 18 | 16 | 16 | 22 | 22 |
| 5 | 17 | 22 | 19 | 19 | 17 | 17 | 21 | 21 |
| 6 | 18 | 21 | 20 | 20 | 18 | 18 | 20 | 20 |
| 7 | 19 | 20 | 19 | 19 | 19 | 19 | 19 | 19 |
| 8 | 20 | 19 | 18 | 18 | 20 | 20 | 18 | 18 |
| 9 | 21 | 18 | 17 | 17 | 21 | 21 | 19 | 19 |
| 10 | 22 | 17 | 18 | 18 | 20 | 20 | 20 | 20 |
| 11 | 23 | 16 | 19 | 19 | 19 | 19 | 21 | 21 |
| 12 | 24 | 14 | 20 | 20 | 18 | 18 | 20 | 22 |
| 13 | 26 | 12 | 19 | 19 | 19 | 17 | 19 | 23 |
| 14 | 28 | 10 | 18 | 18 | 20 | 16 | 18 | 24 |
| 15 | 17 | 17 | 21 | 14 | 17 | 26 | ||
| 16 | 18 | 18 | 22 | 12 | 16 | |||
| 17 | 19 | 19 | 23 | 10 | 14 | |||
| 18 | 20 | 20 | 24 | 12 | ||||
Bold text depicts heating and melting, regular text depicts cooling and freezing, and italicized text depicts phase change interruption, i.e., transition from melting to freezing or vice-versa.
Publisher’s Note: MDPI stays neutral with regard to jurisdictional claims in published maps and institutional affiliations. |
© 2021 by the authors. Licensee MDPI, Basel, Switzerland. This article is an open access article distributed under the terms and conditions of the Creative Commons Attribution (CC BY) license (https://creativecommons.org/licenses/by/4.0/).
Share and Cite
MDPI and ACS Style
Jogineedi, R.; Biswas, K.; Shrestha, S. Experimental Study of the Behavior of Phase Change Materials during Interrupted Phase Change Processes. Energies 2021, 14, 8021. https://doi.org/10.3390/en14238021
AMA Style
Jogineedi R, Biswas K, Shrestha S. Experimental Study of the Behavior of Phase Change Materials during Interrupted Phase Change Processes. Energies. 2021; 14(23):8021. https://doi.org/10.3390/en14238021
Chicago/Turabian StyleJogineedi, Rohit, Kaushik Biswas, and Som Shrestha. 2021. "Experimental Study of the Behavior of Phase Change Materials during Interrupted Phase Change Processes" Energies 14, no. 23: 8021. https://doi.org/10.3390/en14238021
Note that from the first issue of 2016, this journal uses article numbers instead of page numbers. See further details here.