Article

Environment Friendly Energy Cooperation in Neighboring Buildings: A Transformed Linearization Approach

by
Habib Ur Rehman
1,†,
Sajjad Ali Haider
1,†,
Syed Rameez Naqvi
1,
Muhammad Naeem
1,
Kyung-Sup Kwak
2,* and
S. M. Riazul Islam
3,*
1
Department of Electrical and Computer Engineering, COMSATS University Islamabad, G.T. Road, Wah Cantonment 47040, Pakistan
2
Department of Information and Communication Engineering, Inha University, Incheon 22212, Korea
3
Department of Computer Science and Engineering, Sejong University, Seoul 05006, Korea
*
Authors to whom correspondence should be addressed.
These authors contributed equally to this work.
Energies 2022, 15(3), 1160; https://doi.org/10.3390/en15031160
Submission received: 23 December 2021 / Revised: 27 January 2022 / Accepted: 2 February 2022 / Published: 4 February 2022
(This article belongs to the Special Issue Renewable Energy Systems in the Design of Energy-Efficient Buildings)

Abstract

:
Energy consumption in residential, commercial and industrial buildings is one of the major contributors to global warming. Due to the increase in the latter, and growing global energy crisis, more attention is being paid to renewable energy resources (RES). The use of innovative concepts in existing buildings is gaining popularity to provide reduction in energy requirements for electricity, heating and cooling. In this paper, an electricity, heating and cooling cooperation mechanism among neighboring buildings with RES is proposed. It relies on adjusting the RES tariff with a mutual agreement between the neighboring buildings, with an aim to minimize the operational costs. For this purpose, a mathematical model is developed for joint energy cooperation, where surplus energy in one of the buildings is shared with others, thereby reducing dependency on the grid. The optimization structure of the environment friendly energy cooperation is nonlinear, which is linearized using the McCormick envelopes. A scenario for the city of Islamabad, Pakistan, is considered by utilizing its environmental data obtained from public domain websites. The simulation results show more than twenty percent energy cost savings with the proposed cooperation model.

1. Introduction

Over the last few decades, energy requirements are incessantly growing due to the increase in population and industries [1]. An energy outlook report [2] indicates the fastest global energy consumption growth rate of 2.3% recorded in 2018, and the same report predicted an increase in the near future. In that report, the energy consumption figures of buildings in Asia indicate that energy demands have increased by 95% during 1990 to 2020. The energy demand of the world is forecast to increase by 27% by the year 2040 [3]. Efforts to improve the lifestyle and comfort have led to the rapid urbanization and construction of multi-story buildings. According to [4], around 31% to 42% of the world’s gross energy is consumed by buildings and accordingly emits up to 35% of greenhouse gases (GHG). The industrial innovation has certainly improved the lifestyle and comfort of mankind, while at the same time resulted in increased dependence on fossil fuels, and an increase in pollution and global warming [5]. The fossil fuels (natural gas, crude oil, and coal) are the main source of electricity generation (up to 80%) for global consumers [6]. The consumption of fossil fuels has increased recently by 38%, 28% and 27%, respectively [7]. To mitigate the utilization of fossil fuels and build an environment friendly generation, the need for the development of efficient energy utilization techniques has become a necessity.
Pakistan enjoys various seasons throughout the year, where the temperature in most of the cities drops to as low as 0 C in winters, and may touch 50 C in the summers. In Pakistan, buildings consume about 55% of the total energy generated, the major part of which is consumed by heating and cooling requirements [8]. Because of these extreme weather conditions, Pakistan is one country that needs an efficient energy management solution. A number of such techniques are available in the literature that have been exploited world-wide for the same purpose. In what follows, we summarize a few—most relevant—of those techniques. In legacy approaches [9,10], most of the emphasis is on building design and architecture. These solutions focus on building architecture, insulation materials used, window types, etc. Although these solutions have shown some improvement in energy conservation, there is still a need for alternative approaches that could make buildings more energy efficient in a broader way. Today, there is an increase in adoption of new trends and practices to efficiently manage energy generation and its utilization in the buildings by using renewable energy sources (RES). Many researchers have presented optimal solutions to minimize energy costs in buildings [11,12,13,14,15,16,17]. One such mechanism—for selection of energy generation sources to ensure continuation of energy supply—is presented in [11], with the aim of minimizing energy cost. In [12], a scenario is presented, in which a building with photo-voltaic (PV) and battery system trades surplus energy with other buildings, and as a result, reduces dependence on the grid. The problem is formulated as a mix integer linear programming (MILP). Most of the power consumed in a building is used for heating and cooling purposes. Among most of the efforts to increase the environmental and economic performance of a building, combined heating and power (CHP) and combined cooling, heating and power (CCHP) systems are broadly recognized to be the defacto technologies. CCHP is said to offer several advantages including fulfilling cooling, heating and electricity needs. In addition to its trigeneration process, the CCHP can be integrated with RES to provide environment friendly energy interaction with the main grid to contribute in case of high demand and use of the RES. An MILP-based CCHP model is developed for energy management of different buildings [13]. PV-assisted CCHP systems are analyzed in [14,15]. Both of these works optimize the system efficiency in terms of economic benefits, emission diminution and energy usage [16]. Energy trading among the buildings has yielded encouraging results. The CHP based electricity and heating cooperation among various buildings is presented in [18]. Another similar CCHP-based framework is presented in [17], and MILP is employed to minimize energy costs.
In energy cooperation techniques, buildings share their surplus energy with one another. The electricity, heating and cooling energy trading presented in the above literature mostly considers buildings with similar types of RES, and each of them has a CCHP system installed. These technologies, especially the CHP/CCHP, are mostly popular in advanced countries; in the developing countries, however, they are rarely used, despite the need to reduce dependence on the fossil fuel and move towards an environment-friendly energy generation. To the best of our knowledge, no work in the context of performing electricity, heating and cooling cooperation for Pakistan’s environment has been carried out by far. The only exception is [19], where operation of a CHP system is optimized, and the energy cooperation among multiple buildings is not considered.
The proposed work presents an electricity, heating and cooling trading scheme for neighboring buildings having RES in Pakistan. The presented scheme is flexible and can be integrated with the legacy systems. The main contributions of this work are:
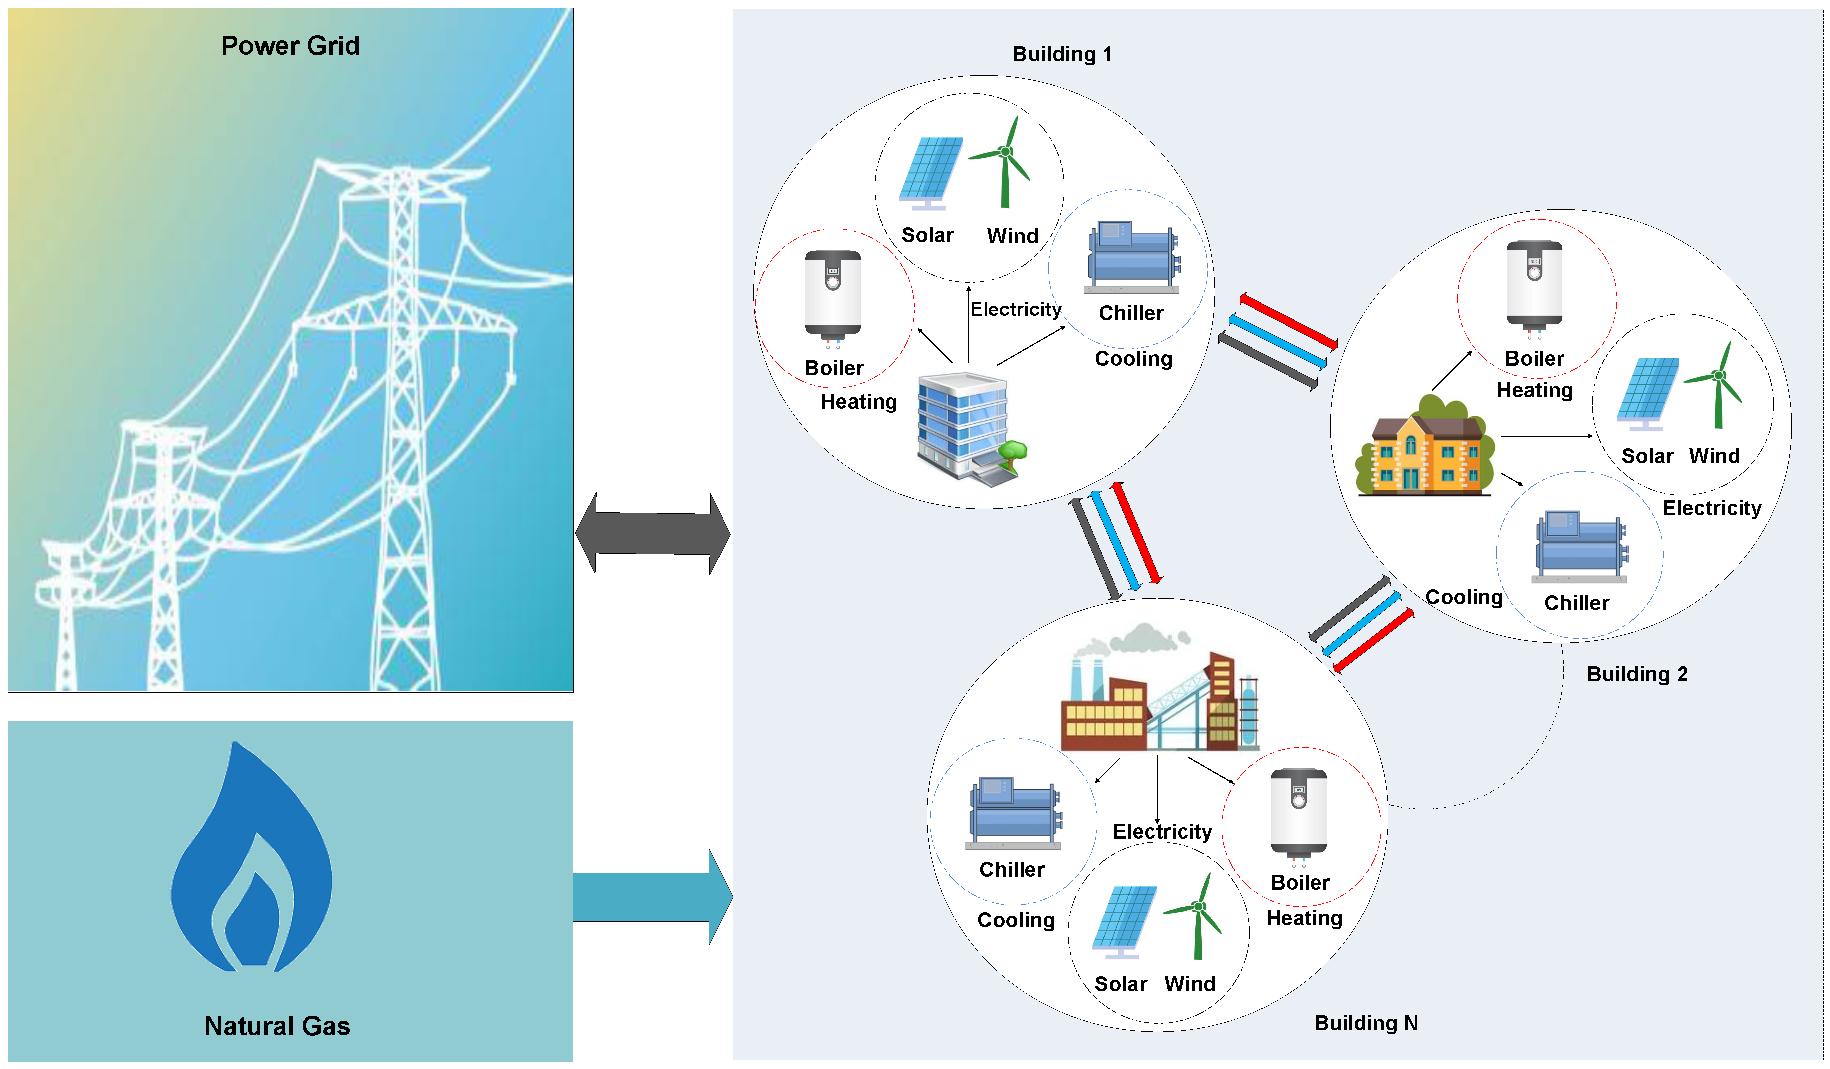
  • A mathematical model for energy cooperation among neighboring buildings equipped with various configurations of RES is developed. The intention is to fulfill the domestic electricity, heating and cooling needs. The framework is flexible, and can be customized with the users’ needs with aim of minimizing operational costs.
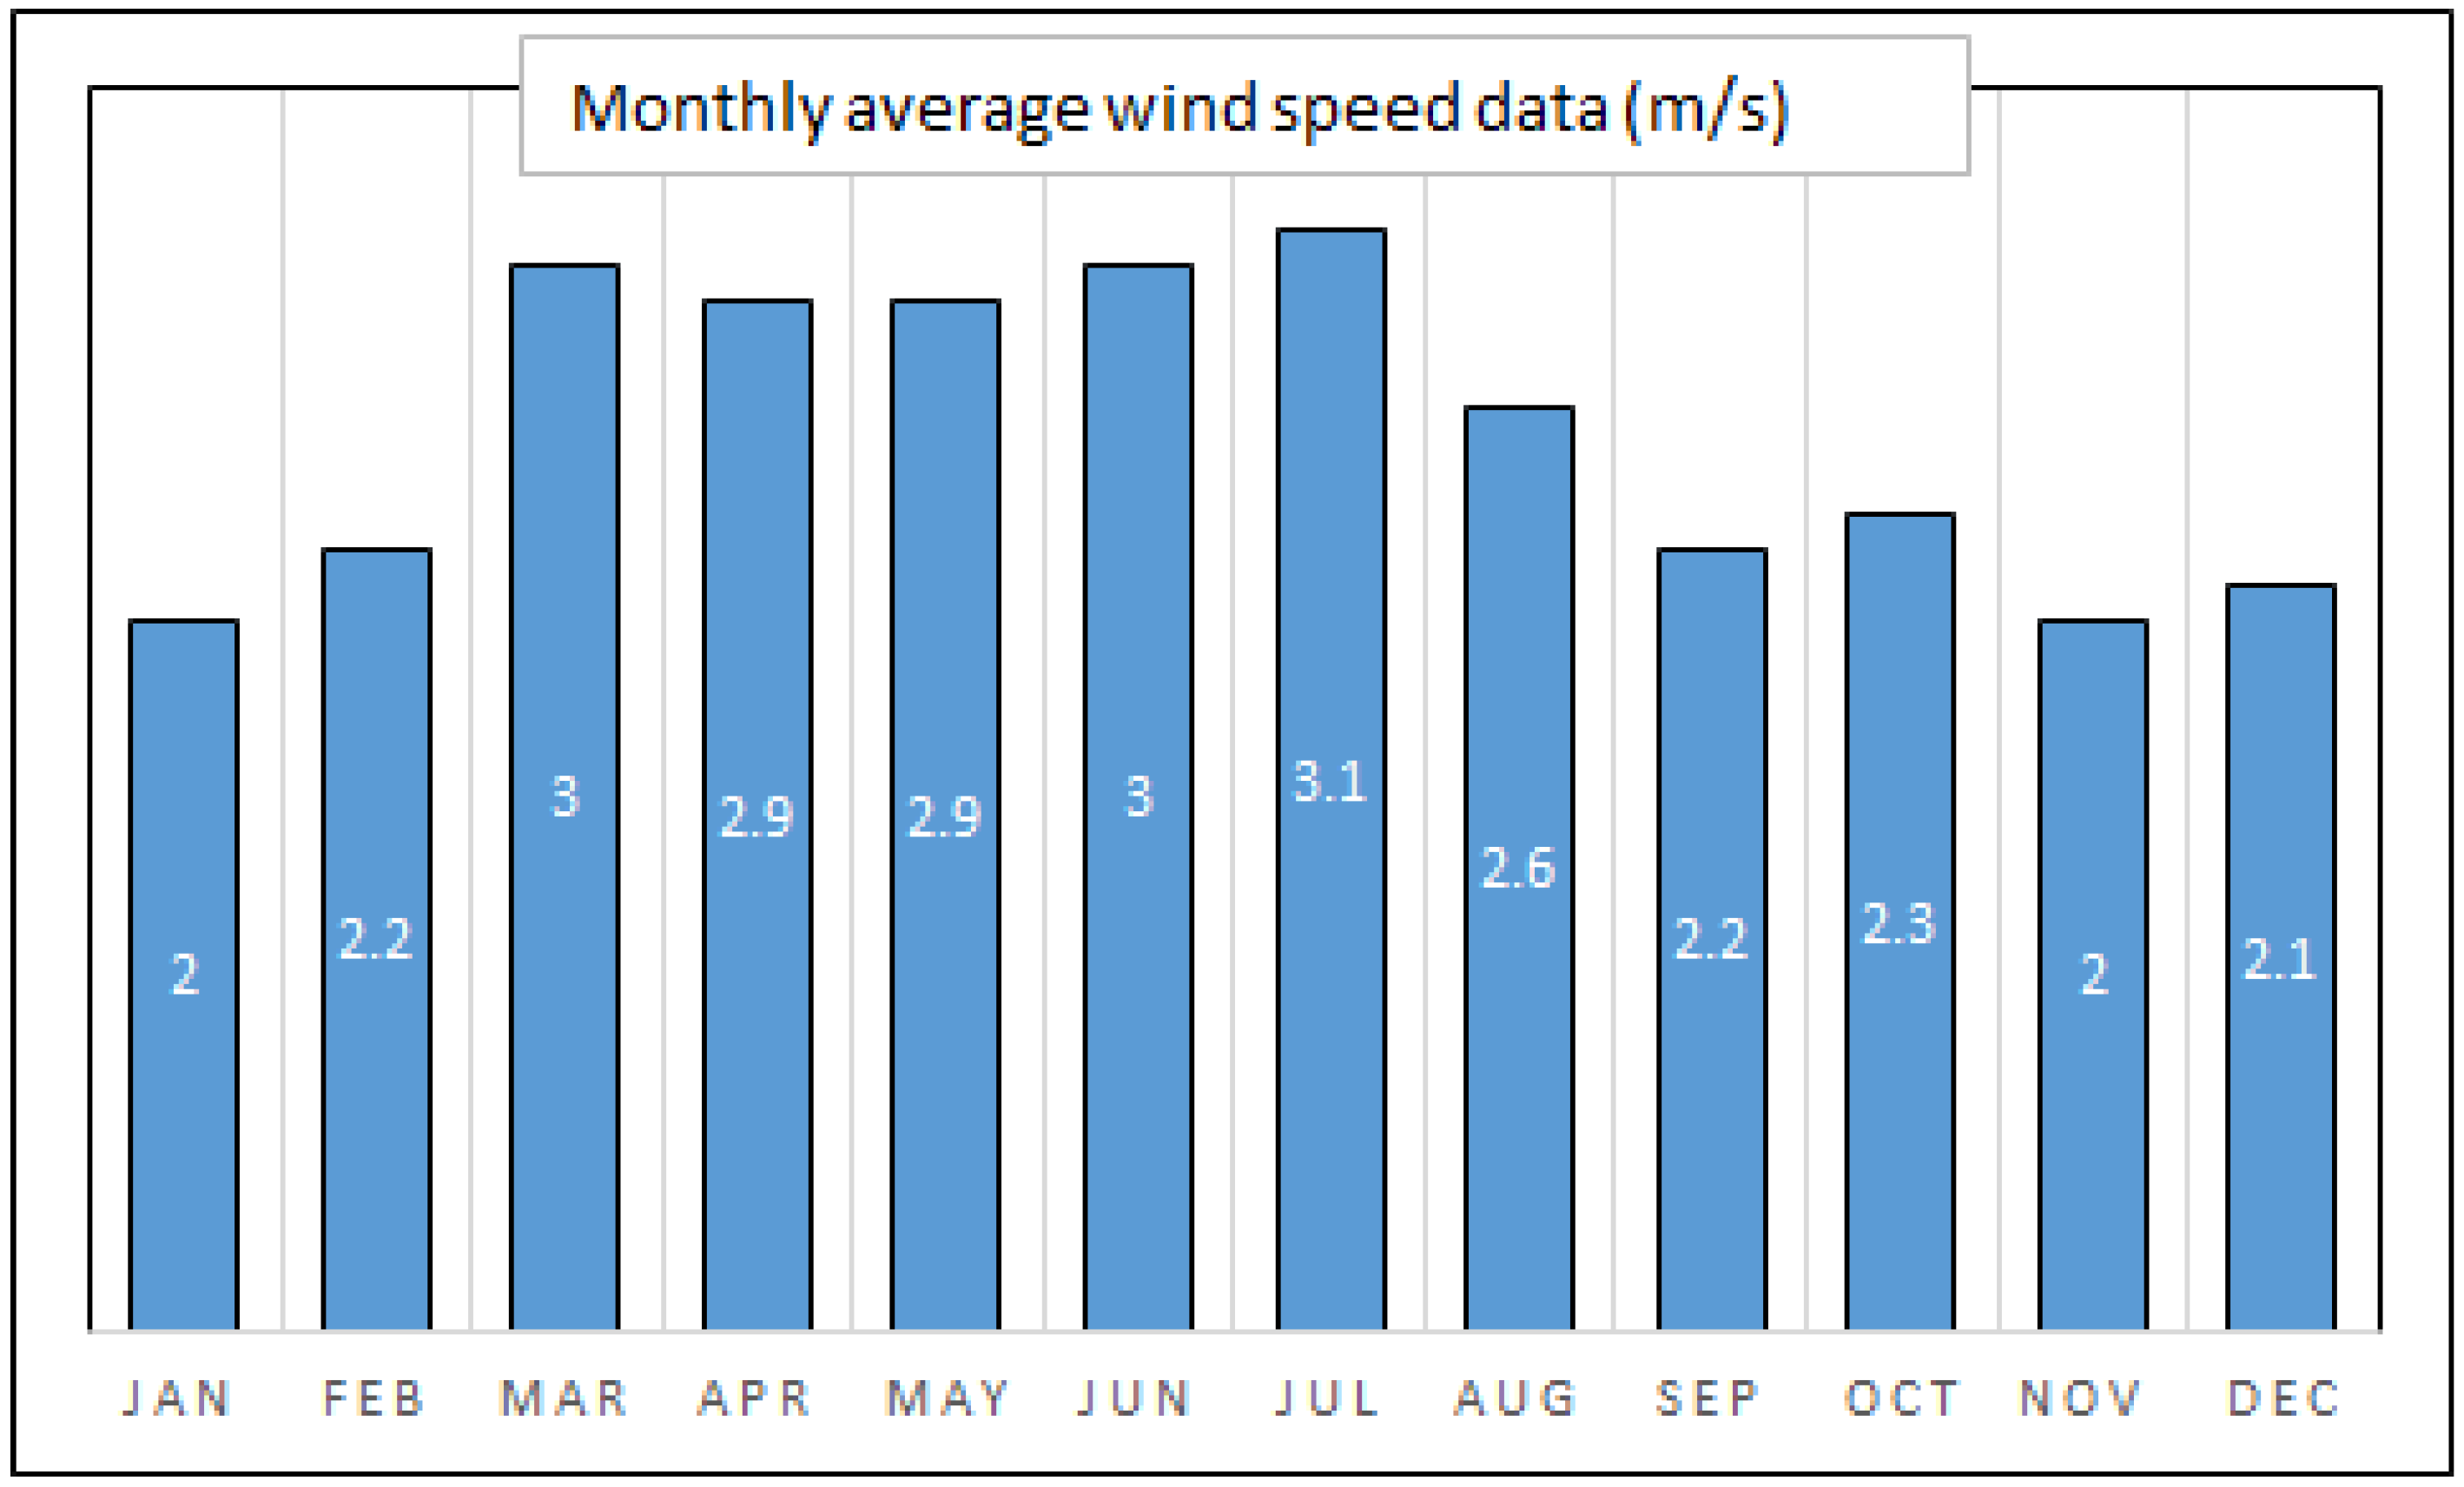
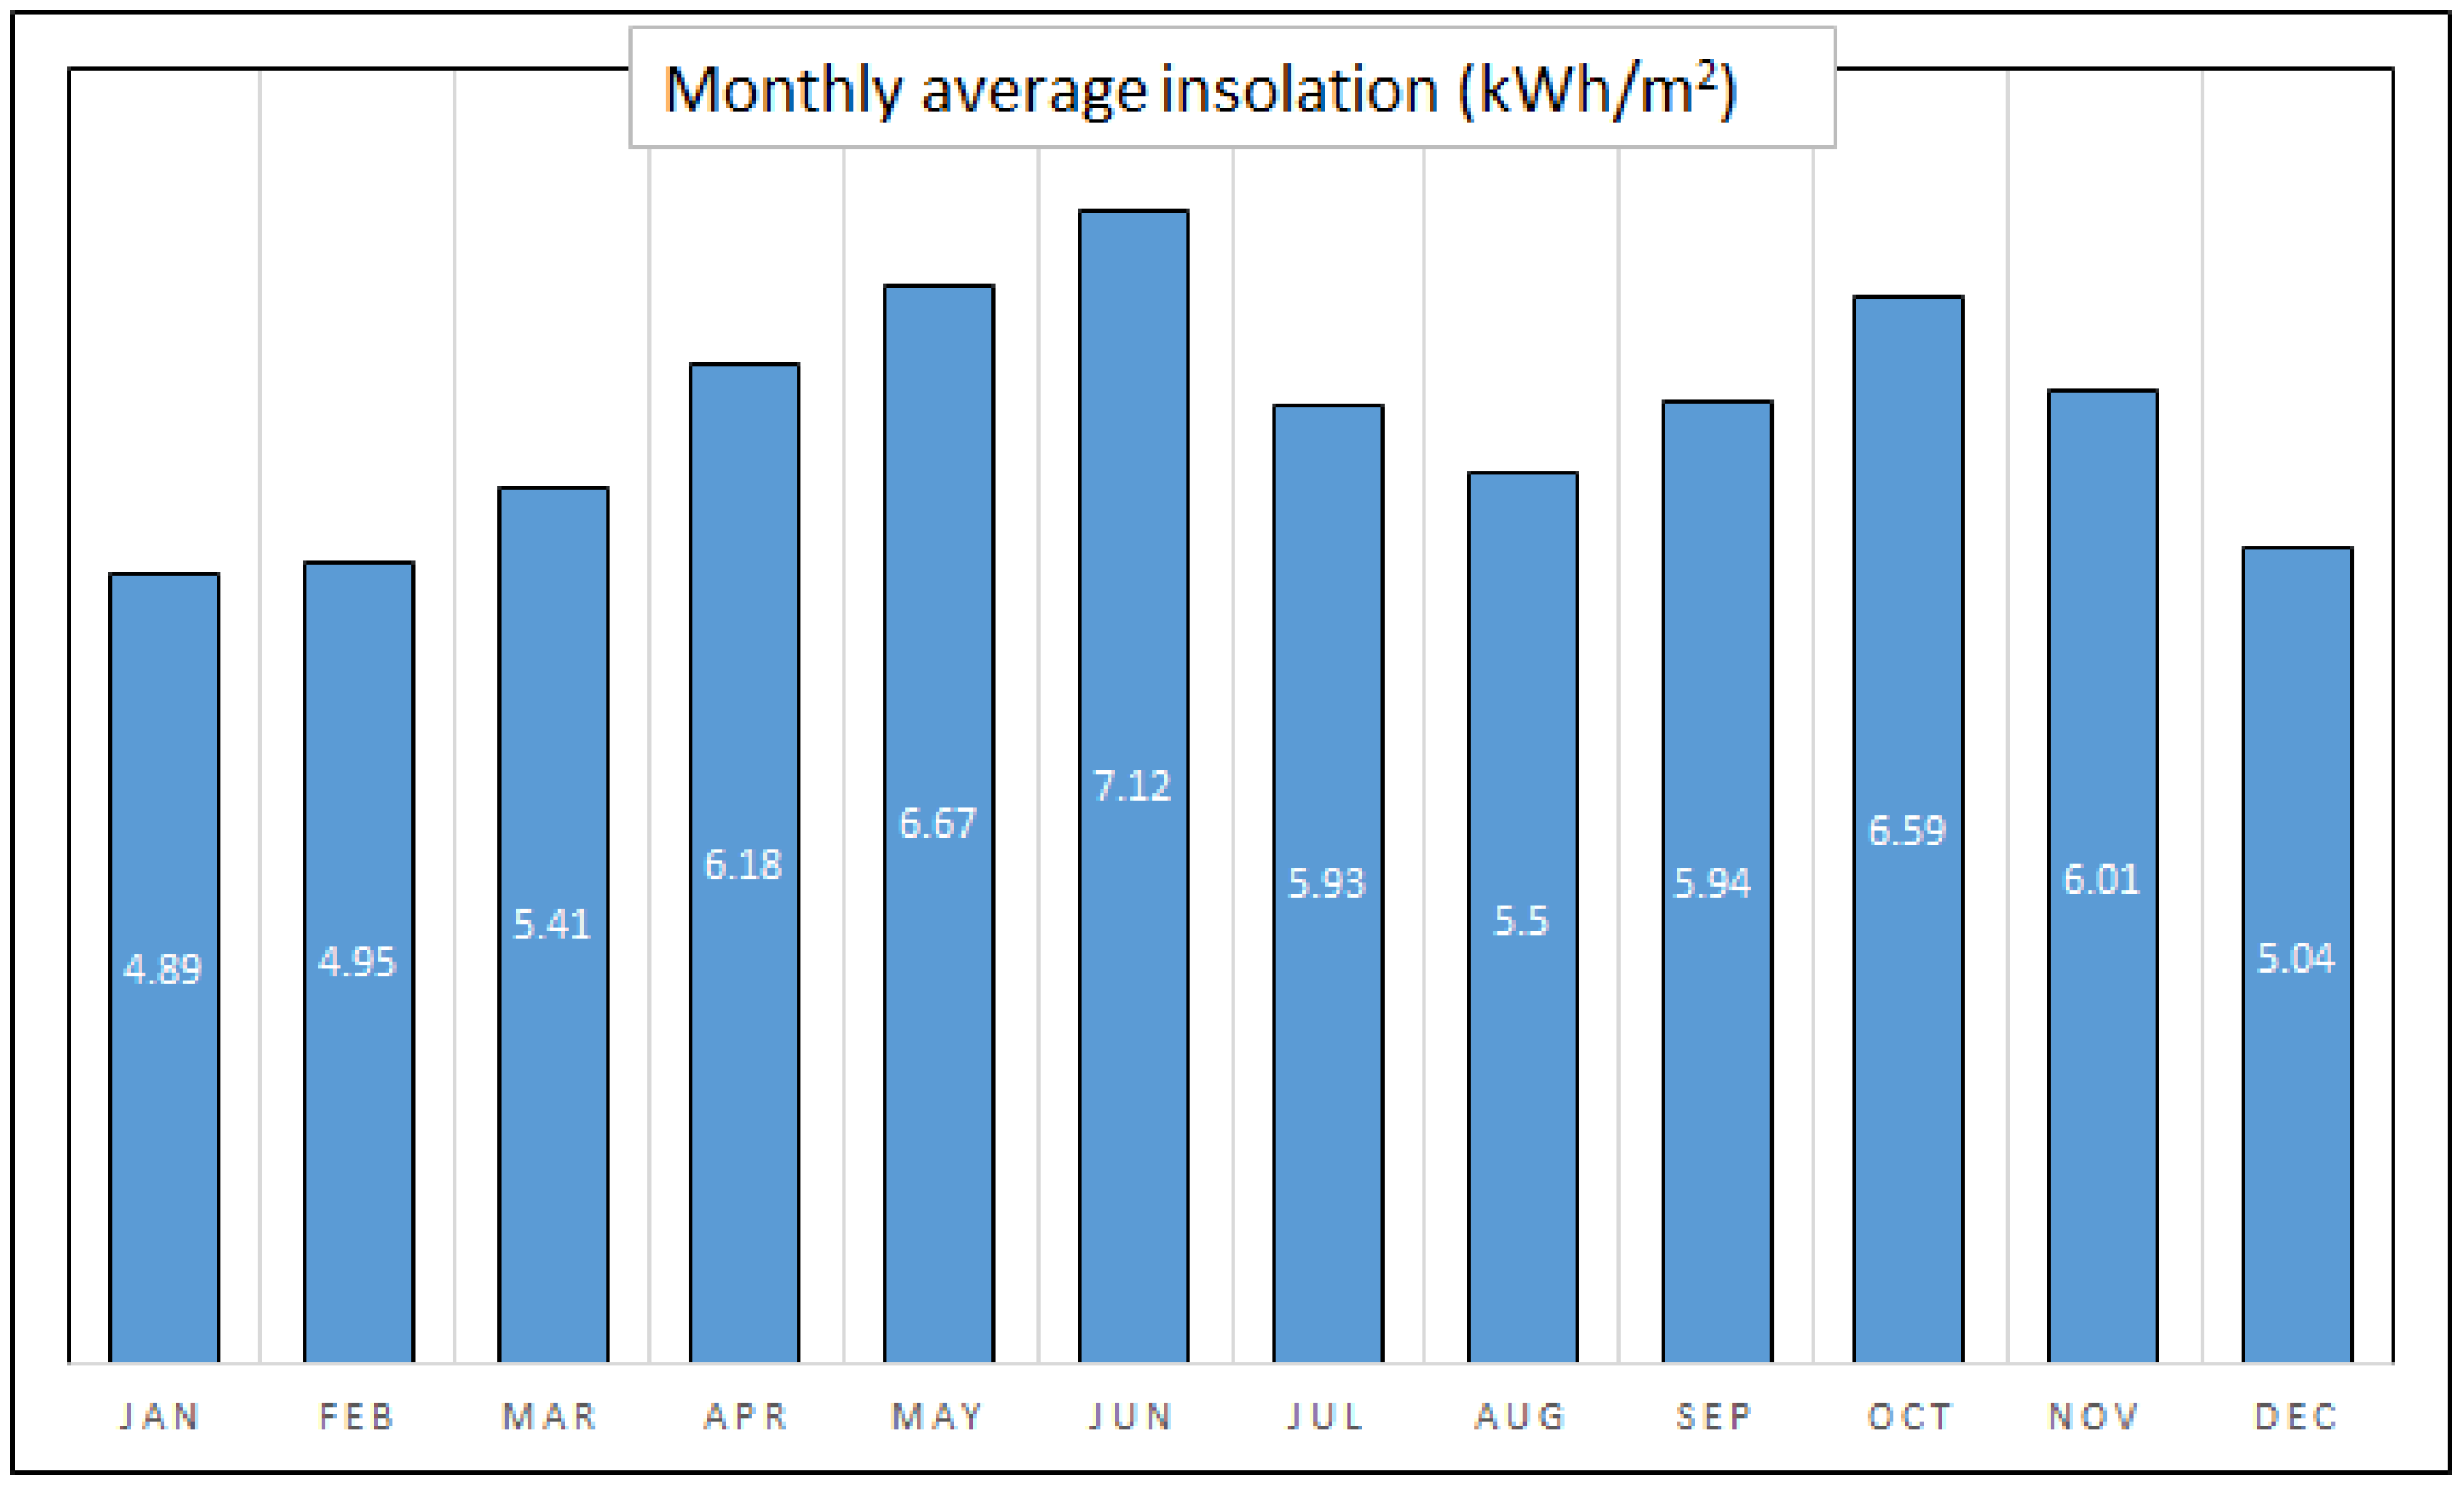
  • Considering solar irradiance and wind speed data of Islamabad, PV arrays and wind turbines (WT) are modeled. The simulation results, based on realistic harvesting models, represents electricity, heating and cooling cooperation among buildings.
  • For energy cooperation, a constrained nonlinear mathematical model is presented. McCormick envelopes are employed to linearize the problem, which is then solved using the interior point method.
The paper is organized as follows. Section 2 describes the system model optimization problem and presents its solution. Section 3 presents the simulation results of the proposed cooperation technique, before the paper is concluded in Section 4, respectively.

2. Methods

There are N neighboring buildings considered in the system model. We assume that neighboring buildings are in close vicinity so that it is possible to have physical connections between them for energy transfer. Each building is connected to the national power grid through a net metering and also has a connection for the natural gas (NG). The buildings have mutual tariff agreements to share energy among themselves. Each building could have various configurations of PV and WT depending upon the available area and budget. The electricity, heating and cooling consumption varies throughout the day. Similarly, power generation from PV panels and WT also varies throughout the day according to the solar radiations and wind’s intensity, respectively. Consequently, these variations in generation and load gives distinctive profiles for each building. Three types of buildings are considered: residential, official and industrial. The presented model provides maximum utilization of RES, and through energy cooperation, it reduces dependence on the grid leading to energy cost savings. The main system is presented in Figure 1. The electricity harvested through PV and WT is considered as the preferred source of electricity. In case the demand is more then the harvested electricity, the latter can be purchased from other buildings. In case the other buildings don’t have surplus electricity, it is purchased through the grid. The heating demands are met through the NG source or from any excess heat generated through a process in an industry. In case of surplus heat generated by a building, it can be shared with other buildings through similar tariff agreements. The cooling requirements are met through the chillers or absorption chillers (in the case of industry). Each building can share its surplus electricity, and can also buy and sell it to the grid using smart metering. However, surplus heating and cooling may only be shared among the buildings.
The electric energy demand for electrical appliances is met directly from electricity sources, i.e., installed RES, using electricity cooperation and utility. To compensate for the heating load of buildings, NG generators and excessive heat from industry buildings are exploited by using the cooperation model. The absorption chillers are used for the cooling purpose. The latter uses the excessive heat from industry, taking steam as input, and subsequently converts it into cool air.

2.1. Modeling of Wind Energy

Wind energy is one of the most popular sources of energy due to its continuous availability, and clean generation process. However, due to the uncertainty in wind speed, the output power of wind energy is cannot be estimated. The energy output of WT can be found using (a) manufacturers assessments (b) power curve technique (c) and swept area technique. WT is characterized by features given on its (i) rated power, which is obtained by rated speed of turbine and wind (ii) peak power (iii) power curve representing output vs wind speed. We have used the power swept area technique in our work. The generated electricity from WT is determined as [20]:
E W T = 1 / 2 × A W T × v 3 × C p × ρ
where, A W T is the area swept by WT blades, v is the wind speed, C p is the efficiency coefficient of WT and ρ is air density. The Weibull Probability Distribution (WPD) is used to produce the wind speed profile for a known wind average speed and shape parameter k. The average monthly wind speed for Islamabad is shown in Figure 2 [21] for the area of Zero Point in Islamabad city, this data was accessed on 1 December 2021 at 1300 h. WPD of wind having k of 1.8 and annual average speed of 2.5 m/s for Islamabad, Pakistan, is considered. When we apply Equation (1) to WT(BWC-Excel-R/48) having a height of 7 m, the daily average output comes out about 20 kWh.

2.2. Modeling of Solar Energy

The electrical energy generated by a PV panel is dependent upon the following parameters: (i) solar yield η m (ii) performance ratio (PR) (iii) PV panel area (A) and (iv) solar insolation (I). The amount of energy generated (kWh) by a PV panel is calculated as [22]:
E P V = A × P R × I × η m
where, η m can be found by dividing PV generated power (in kW) by the panel’s area m 2 . Islamabad’s month-wise average insolation is presented in Figure 3 [23] for the area of Zero Point in Islamabad City with panel angle of 45 degree, this data was accessed on 4 November 2021 at around 1500 h. It can be observed from the graph that its highest value is in the month of June, while the lowest is in December. Considering a standard size PV having 1.63 m 2 area, PR value of 0.75 and 0.26 kW output power, the PV array size for a building that can give 14.4 kWh daily electrical energy yield for the month of November needs to have area of 20 m 2 . This means that it requires a total of 9 panels. Whereas, for the month of June, due to the increase in I, the electrical energy yield increases up to 17.1 kWh per day. In the simulation part, according to the area and load demand of building, the quantity of PV arrays will be selected.

2.3. Problem Statement and Linear Transformation

The main objective of the proposed model is to minimize the energy cost. The buying and selling among the buildings is through tariff agreements. However, one condition must be maintained during the tariff assignment that the tariff of RES, which is to be shared among the buildings, must be less than the tariff of utility, i.e., Cost R E S < Cost u t i l i t y . This condition gives incentive for a building to purchase energy from another building instead of the utility. The generation and load profiles can be generated for any specified time period, i.e., a year, a month, a week or a day. Here, a one-day time slot (24 h) is selected for simplicity. The proposed energy cooperation model for cost minimization optimization problem is given as below:
Given:
  • The total number of neighboring buildings;
  • One day electricity, heating and cooling generation profile of each building;
  • One day electricity, heating and cooling load profile of each building;
  • The total electricity, heating and cooling cost of each building;
Determine at each time interval (t) of a time horizon (T) of 24 h:
  • The electricity, heating and cooling deficiency at each building;
  • The surplus electricity, heating and cooling at each buildings;
  • The amount of electricity, heating and cooling shared between any two buildings;
  • The total cost savings as a result of electricity, heating and cooling cooperation.
The objective, J ( E n t , r g , E u , n t , E n , u t , E m , n t , E n , m t , H n t , x , H m , n t , H n , m t , Q n t , y , Q m , n t , Q n , m t ) for each building is to minimize the electricity, heating and cooling procurement cost and maximize the electricity, heating and cooling sold cost, stated as below:
J ( E n t , r g , E u , n t , E n , u t , E m , n t , E n , m t , H n t , x , H m , n t , H n , m t , Q n t , y , Q m , n t , Q n , m t ) = t = 1 T n = 1 N [ C ( E n t , r g ) + C ( E u , n t ) C ( E n , u t ) + m = 1 , n m N [ C ( E m , n t ) C ( E n , m t ) ] + C ( H n t , x ) + m = 1 , n m N [ C ( H m , n t ) C ( H n , m t ) ] + C ( Q n t , y ) + m = 1 , n m N [ C ( Q m , n t ) C ( Q n , m t ) ] ]
where E n t , r g is the electricity generated through RES. H n t , x is the heat generated through the fossil fuels. Q n t , y is the cooling generated through some cooling process. E u , n t is the electricity purchased from the utility and E n , u t is the electricity sold back to the utility. E m , n t , Q m , n t and H m , n t are the electricity, heating and cooling energy transfer, respectively, from the building m to building n, building m is the seller while building n is the buyer. C ( · ) represents cost of the specific energy term. Equation (4) formulates our optimization problem as follows:
min E n t , r g , E u , n t , E n , u t , E m , n t , E n , m t H n t , x , H m , n t , H n , m t Q n t , y , Q m , n t , Q n , m t , n , m , t J [ E n t , r g , E u , n t , E n , u t , E m , n t , E n , m t , H n t , x , H m , n t , H n , m t , Q n t , y , Q m , n t , Q n , m t ]
subject to:
C 1 : E n t , r g , E u , n t , E n , u t , E m , n t , E n , m t 0 , n , m , t C 2 : E n t , r g + E u , n t + m = 1 N E m , n t = E L n t + E n , u t + m = 1 N E n , m t , n C 3 : E n , u t E u , max , E m , n t E m , n max , n C 4 : E m , n min E m , n t E m , n max , n , t C 5 : E n n t = 0 , n , t C 6 : E m , n t E n , m t = 0 , n , m , t C 7 : H n t , r g , H m , n t , H n , m t 0 , n , m , t C 8 : H n t , x + m = 1 N H m , n t = H L n t + m = 1 N H n , m t + H L , n t , n C 9 : H m , n t H m , n max , n C 10 : H m , n min H m , n t H m , n max , n , t C 11 : H n n t = 0 , n , t C 12 : H m , n t H n , m t = 0 , n , m , t C 13 : Q n t , y , Q m , n t , Q n , m t 0 , n , m , t C 14 : Q n t , y + m = 1 N Q m , n t = Q L n t + m = 1 N Q n , m t + Q L , n t , n C 15 : Q m , n t H m , n max , n C 16 : Q m , n min Q m , n t Q m , n max , n , t C 17 : Q n n t = 0 , n , t C 18 : Q m , n t Q n , m t = 0 , n , m , t
where E L n t , H L n t and Q L n t are the electricity load, heating load and cooling load, respectively, for the nth building. H L , n t and Q L , n t are the heat and cool loss at any time t. The constraints from C1 to C6 are related to electricity transfer, constraints, C7 to C12 are related to heat transfer and constraints, and C13 to C18 are cooling transfer. For the electrical constraints part, C1, C3 and C4 are the box constraints. C2 gives the electricity balance equation for electricity in and electricity out from the nth building at any time t. C5 states that a building cannot sell electricity back to itself. C6 binds a building to either sell or buy electricity at the same time. It is the positive bi-linear function that makes our problem nonconvex bi-linear. The McCormick envelopes are often used for the convex relaxation of bi-linear functions [24]. Therefore, for our problem, using McCormick envelopes, it is reformulated as a linear optimization problem given as f ( E m n t , E n m t ) = E m , n t E n , m t . Therefore, the McCormick envelopes for C6 are given by (6):
f ( E m , n t , E n , m t ) = E m , n t E n , m t h ( E m , n t , E n , m t ) = max { E m , n min E n , m t + E n , m max E m , n t E m , n min E n , m min , E m , n max E n , m t + E n , m max E m , n t E m , n max E n , m max } E m , n min E n , m t + E n , m min E m , n t E m , n min E n , m min C E E m , n max E n , m t + E m , n max E n , m t E m , n max E n , m max C E
where C E is the convex envelope coefficient. E m , n min and E m , n max are minimum and maximum limits of electricity transfer from building m to building n. Similarly, E n , m min and E n , m max are minimum and maximum limits of electricity transfer from building m to building n. Like electrical constraints (C1–C7), heating and cooling constraints are stated from C7 to C12 and C13 to C18, respectively. Moreover, as we are not selling back heating and cooling to the utility, in constraints C8 and C14, there is no selling to utility term. C12 and C18 are positive bi-linear functions, same like C6, and are reformulated as a linear optimization problem. The McCormick Envelopes for C12 are given by (7):
f ( H m , n t , H n , m t ) = H m , n t H n , m t h ( H m , n t , H n , m t ) = max { H m , n min H n , m t + H n , m max H m , n t H m , n min H n , m min , H m , n max H n , m t + H n , m max H m , n t H m , n max H n , m max } H m , n min H n , m t + H n , m min H m , n t H m , n min H n , m min H E H m , n max H n , m t + H m , n max H n , m t H m , n max H n , m max H E
where H E is the convex envelope coefficient. H m , n min and H m , n max are minimum and maximum limits of heat transfer from building m to building n. Similarly, H n , m min and H n , m max are minimum and maximum limits of heat transfer from building m to building n. The McCormick envelopes for C18 are given by (8):
f ( Q m , n t , Q n , m t ) = Q m , n t Q n , m t h ( Q m , n t , Q n , m t ) = max { Q m , n min Q n , m t + Q n , m max Q m , n t Q m , n min Q n , m min , Q m , n max Q n , m t + E n , m max Q m , n t Q m , n max Q n , m max } Q m , n min Q n , m t + Q n , m min Q m , n t Q m , n min Q n , m min Q E Q m , n max Q n , m t + Q m , n max Q n , m t Q m , n max Q n , m max Q E
where Q E is the convex envelope coefficient. Q m , n min and Q m , n max are minimum and maximum limits of cooling transfer from building m to building n. Similarly, Q n , m min and Q n , m max are minimum and maximum limits of cooling transfer from building m to building n. Now using the interior point method [25], the linear optimization problem may be solved.

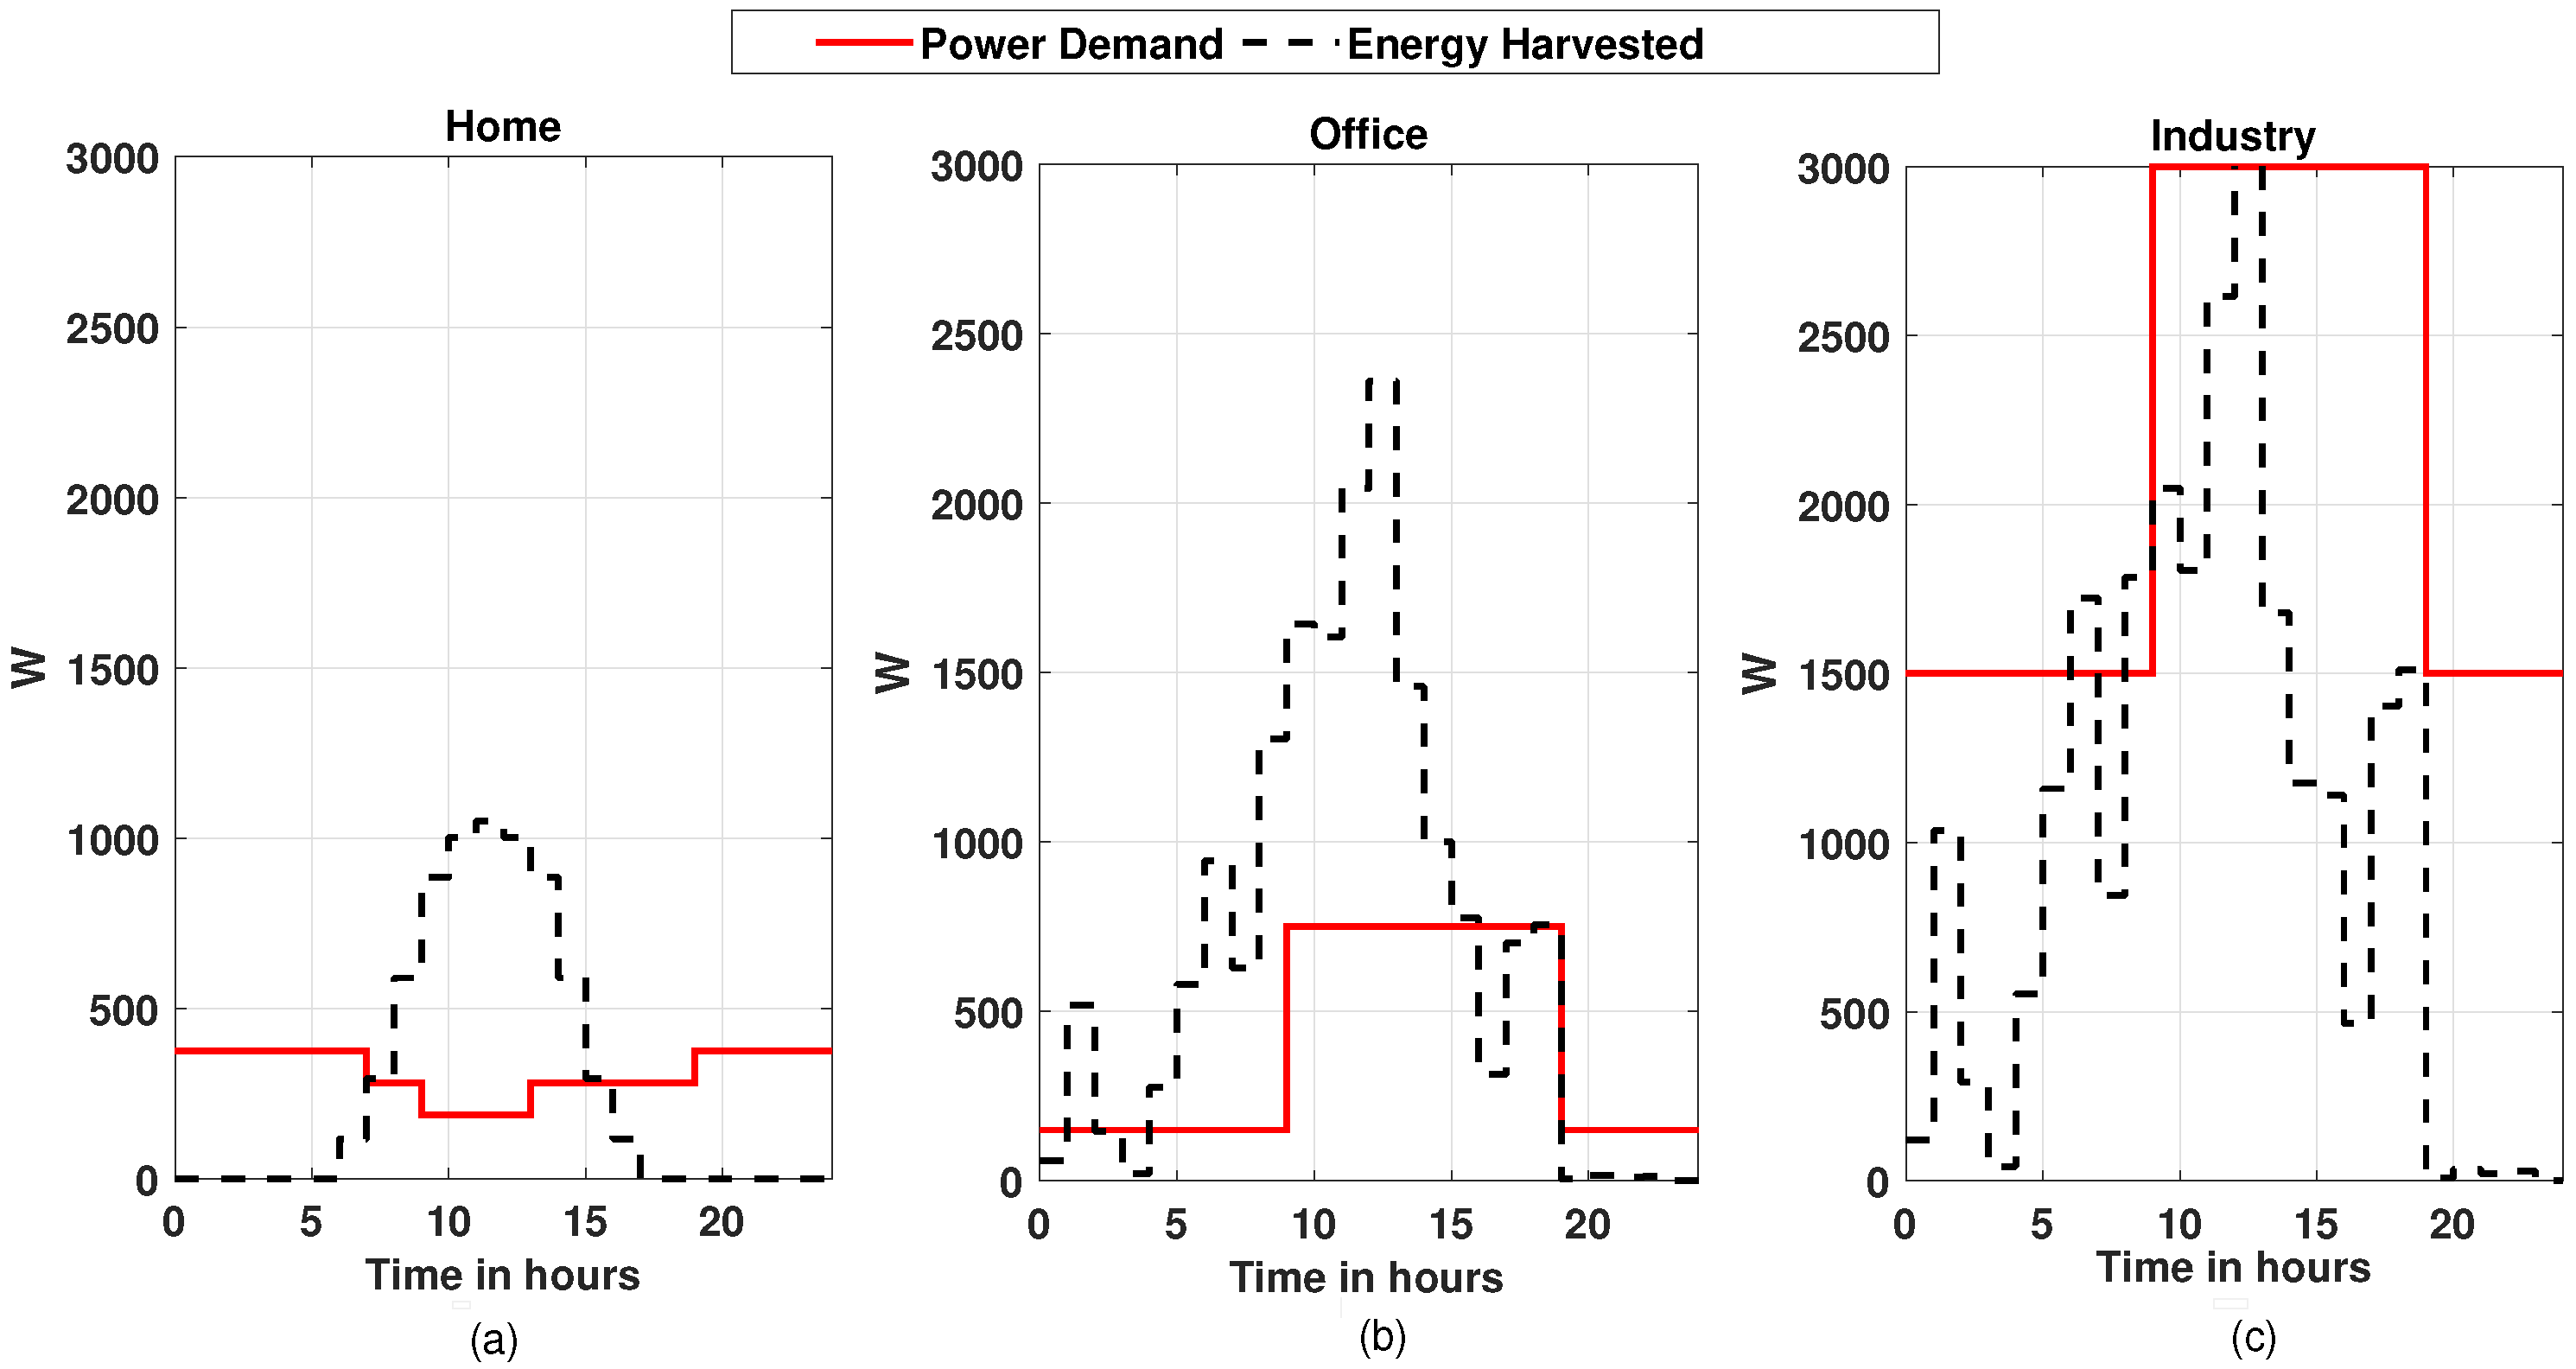
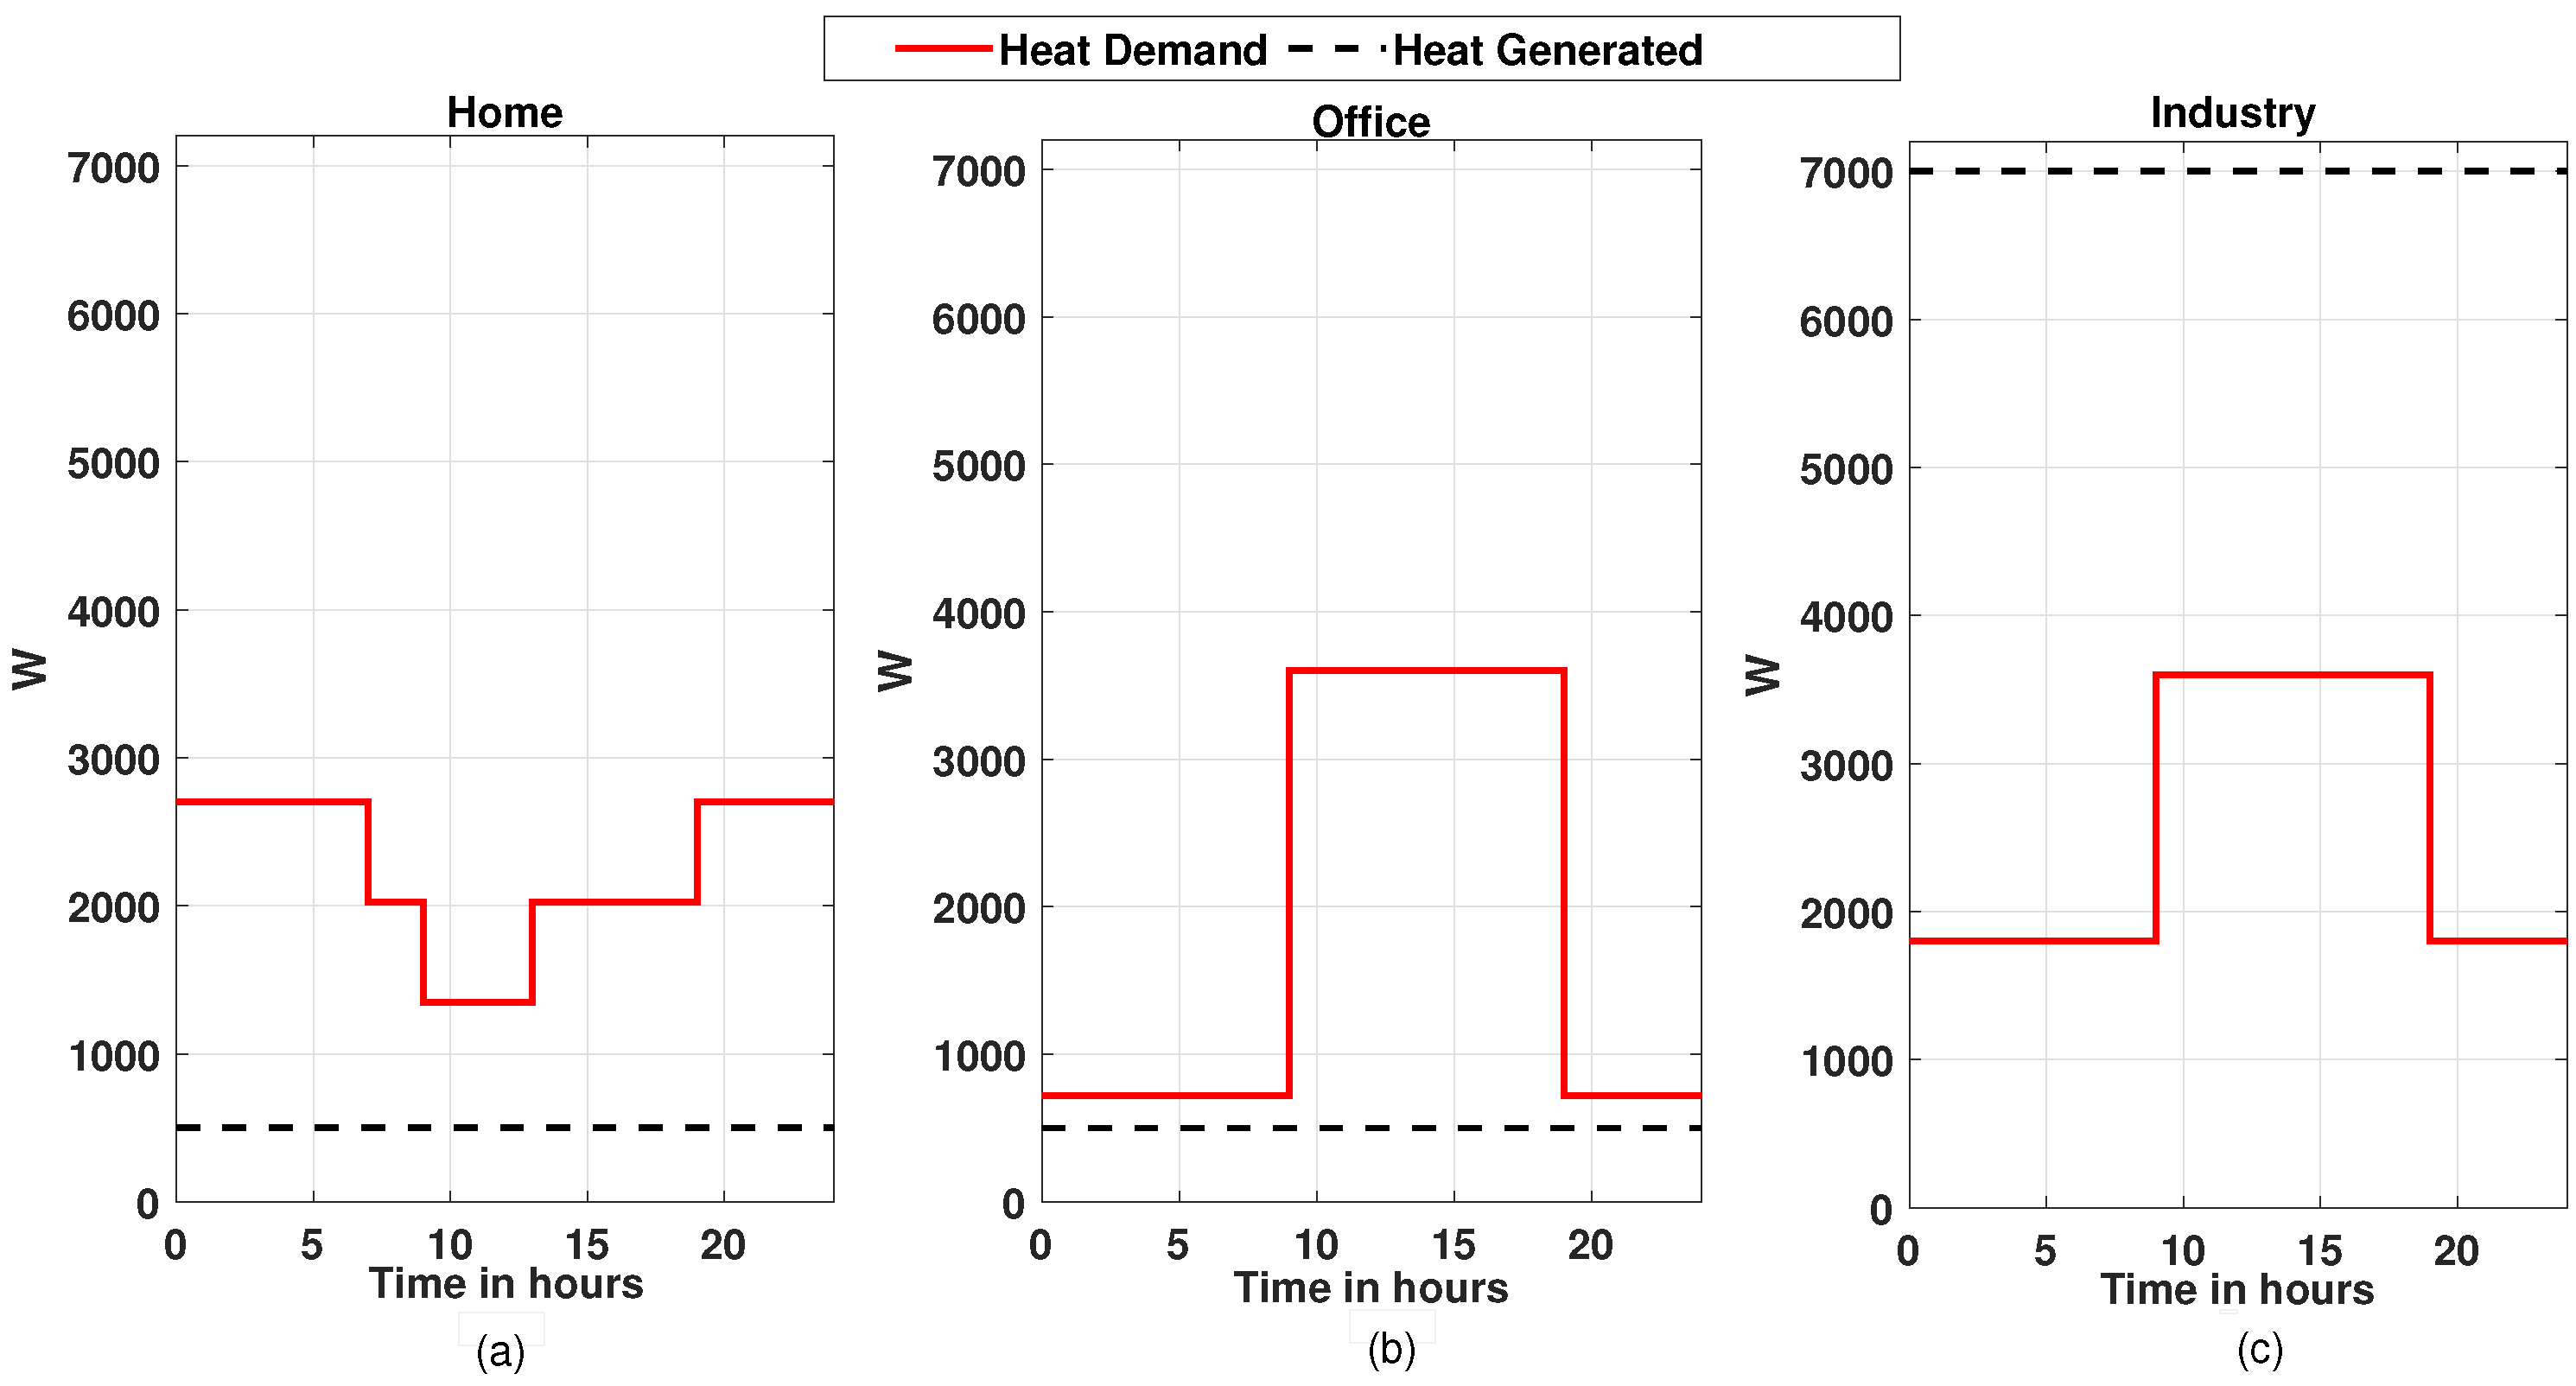
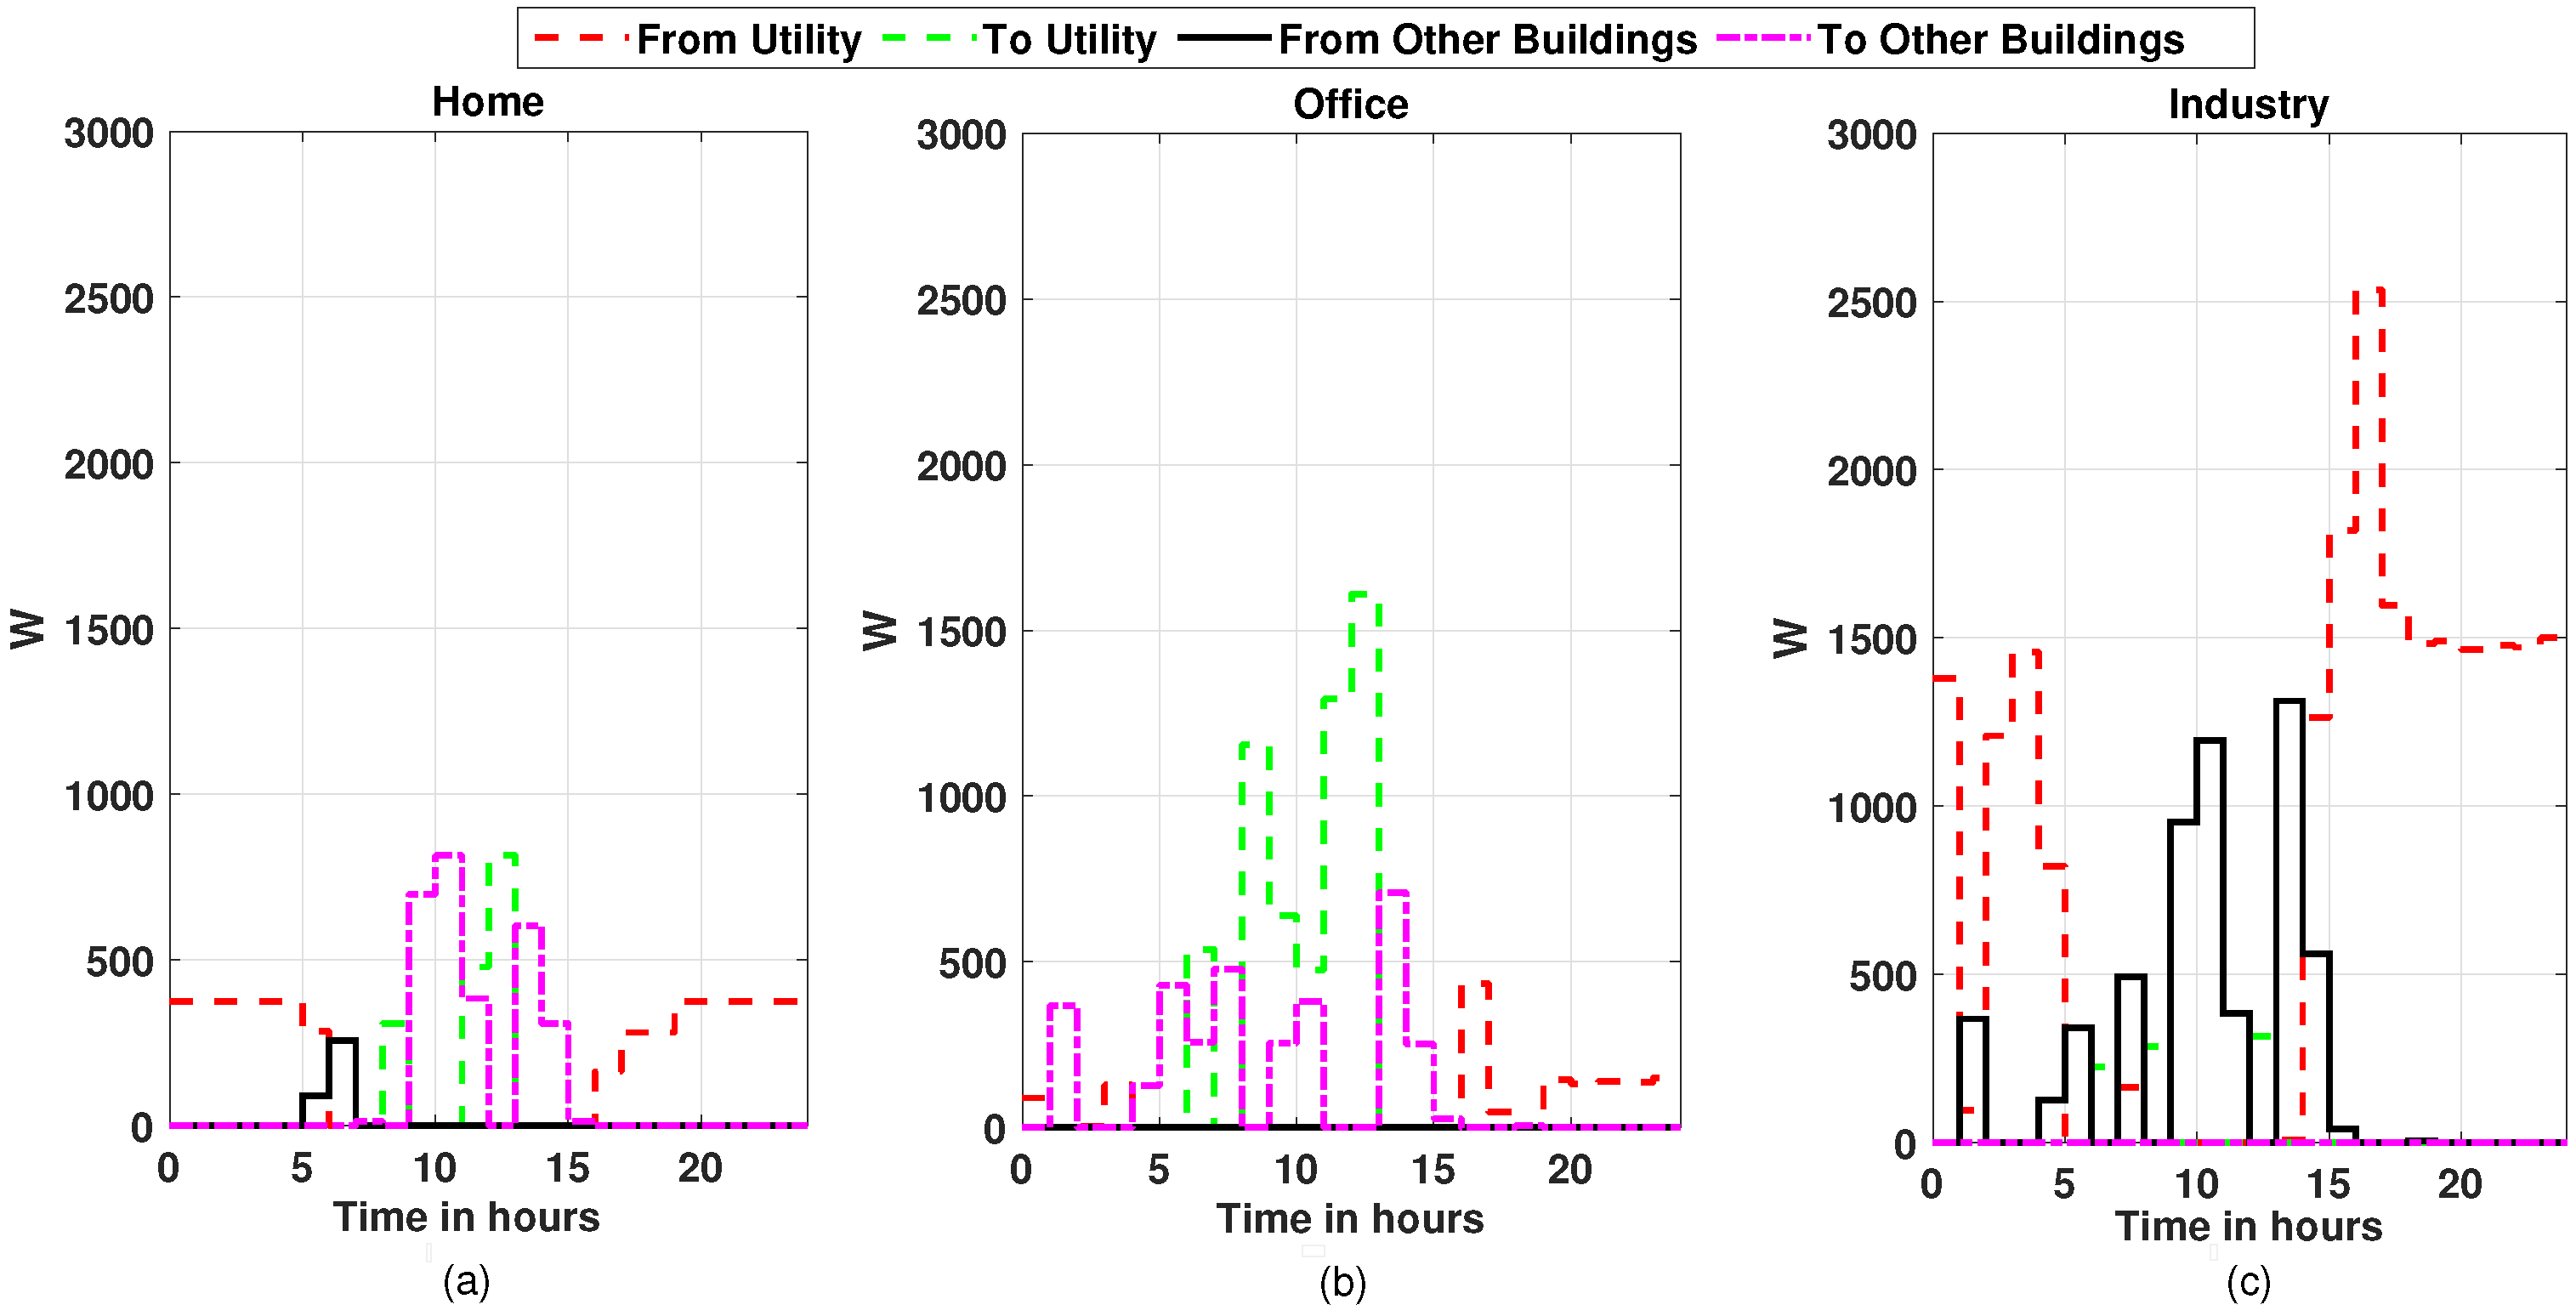
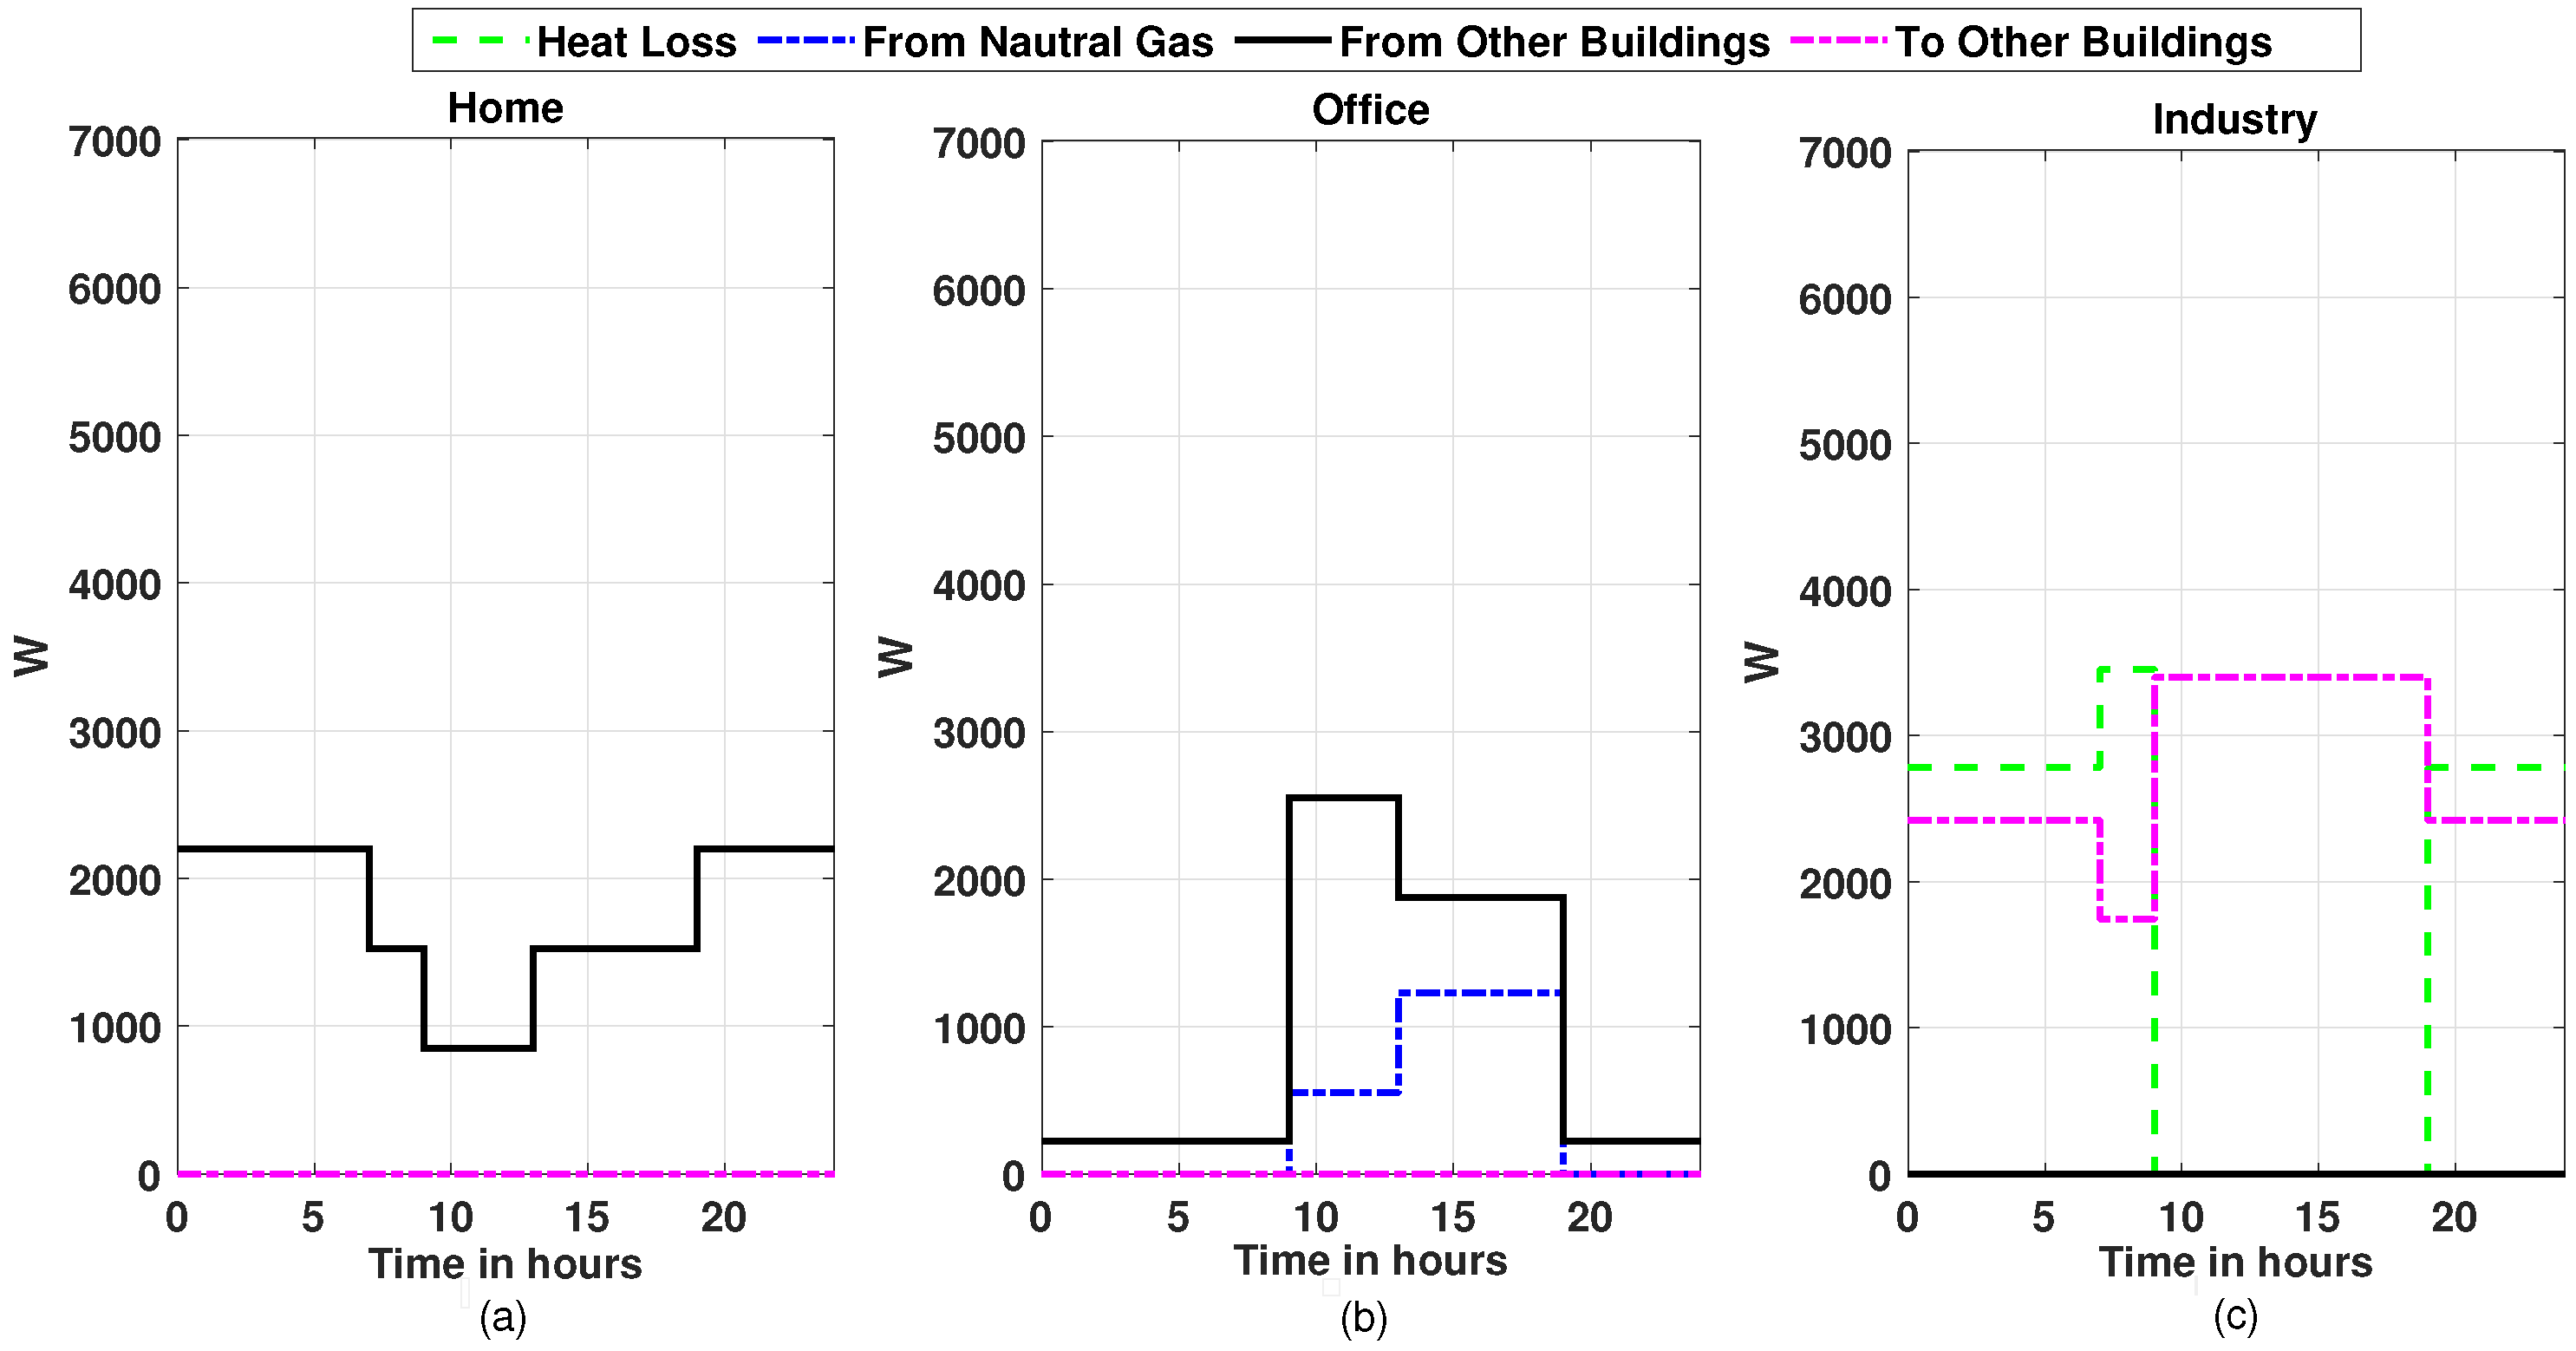
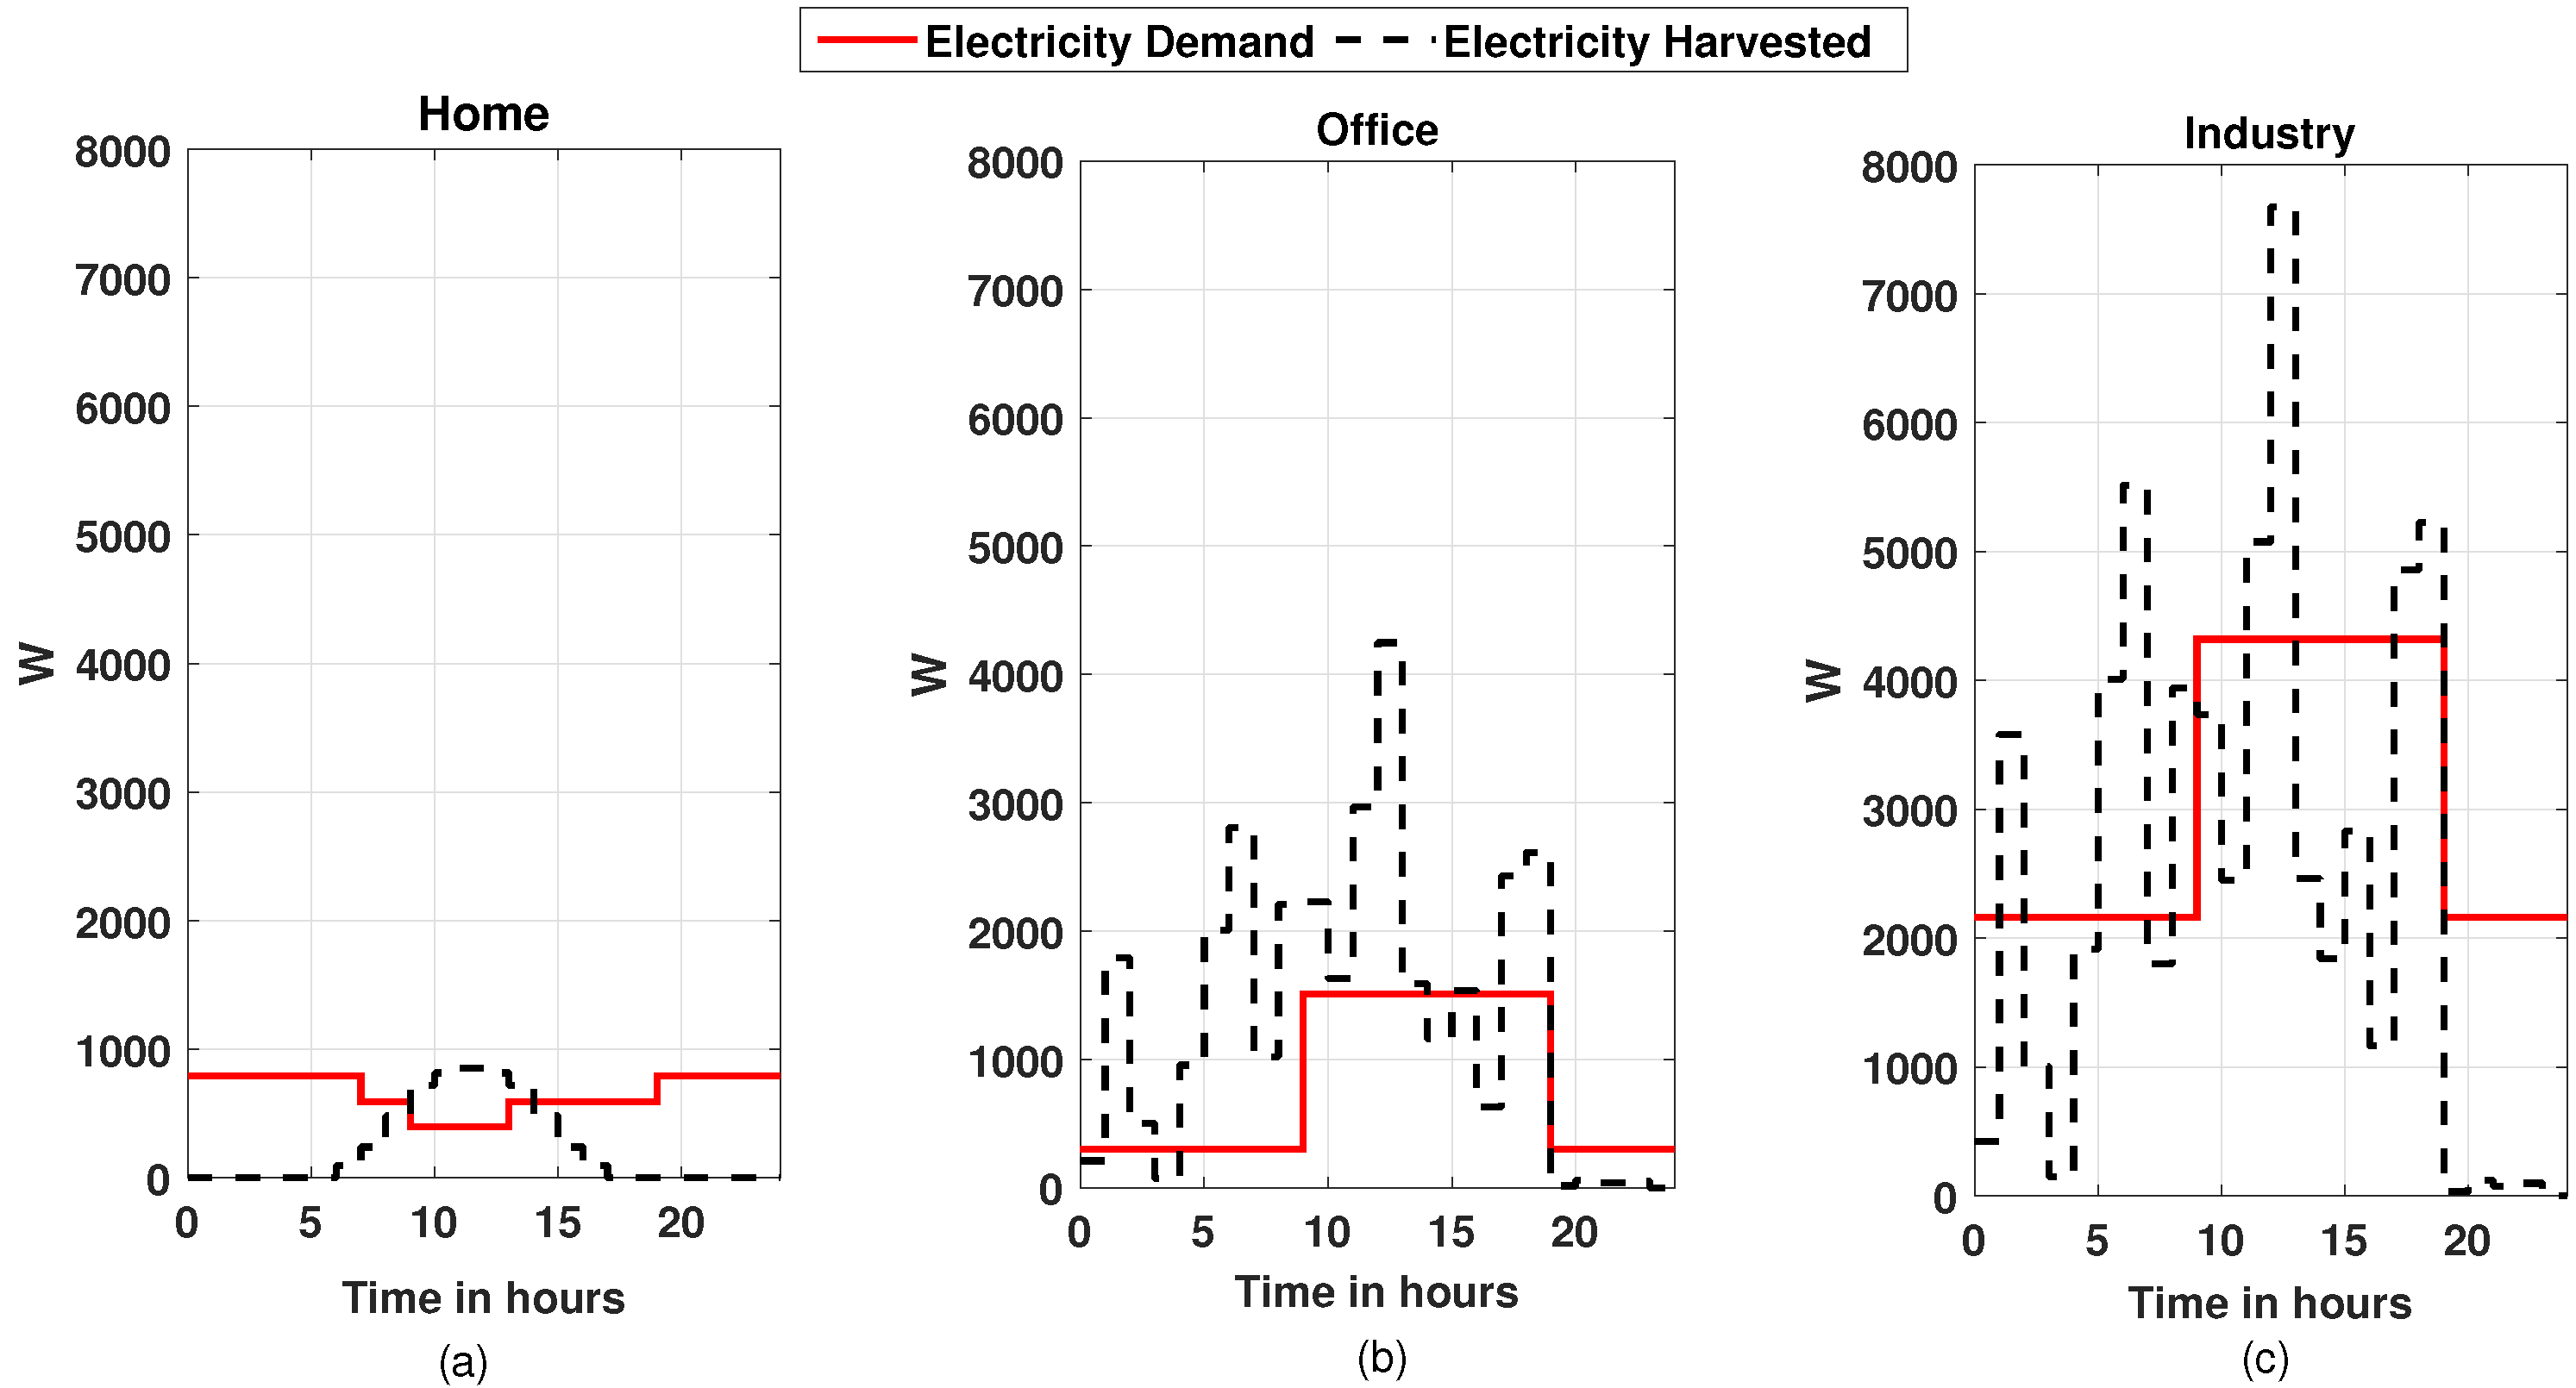
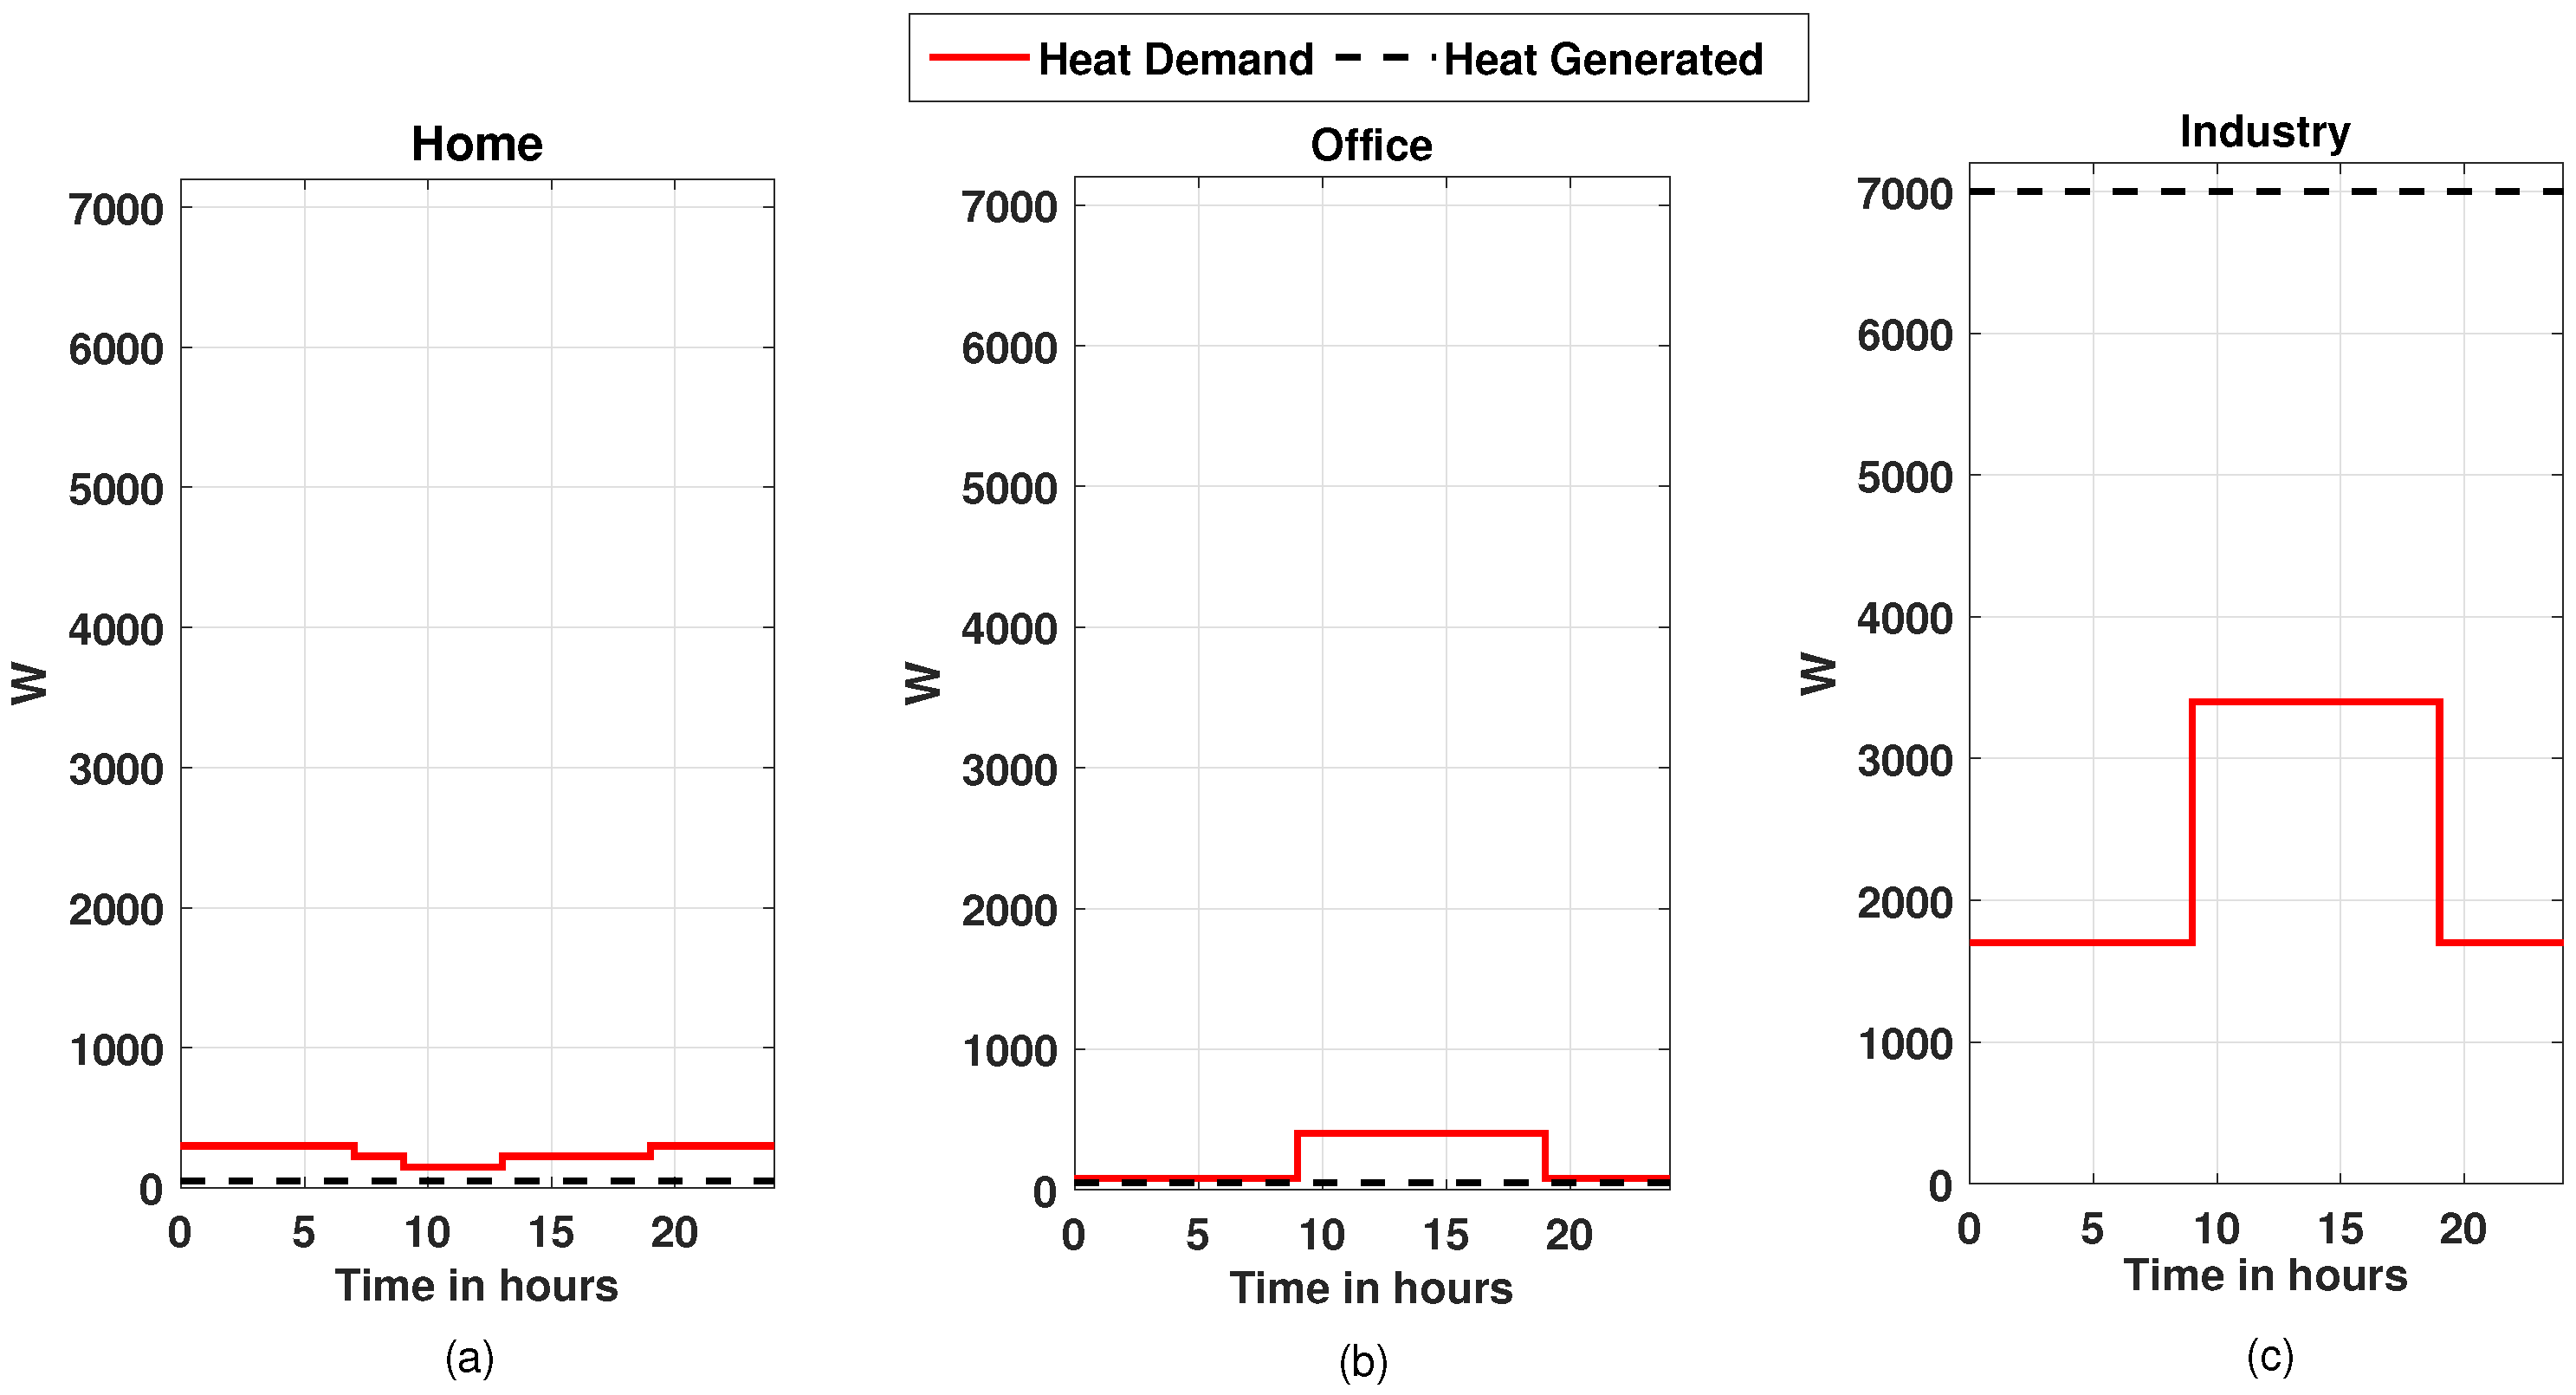
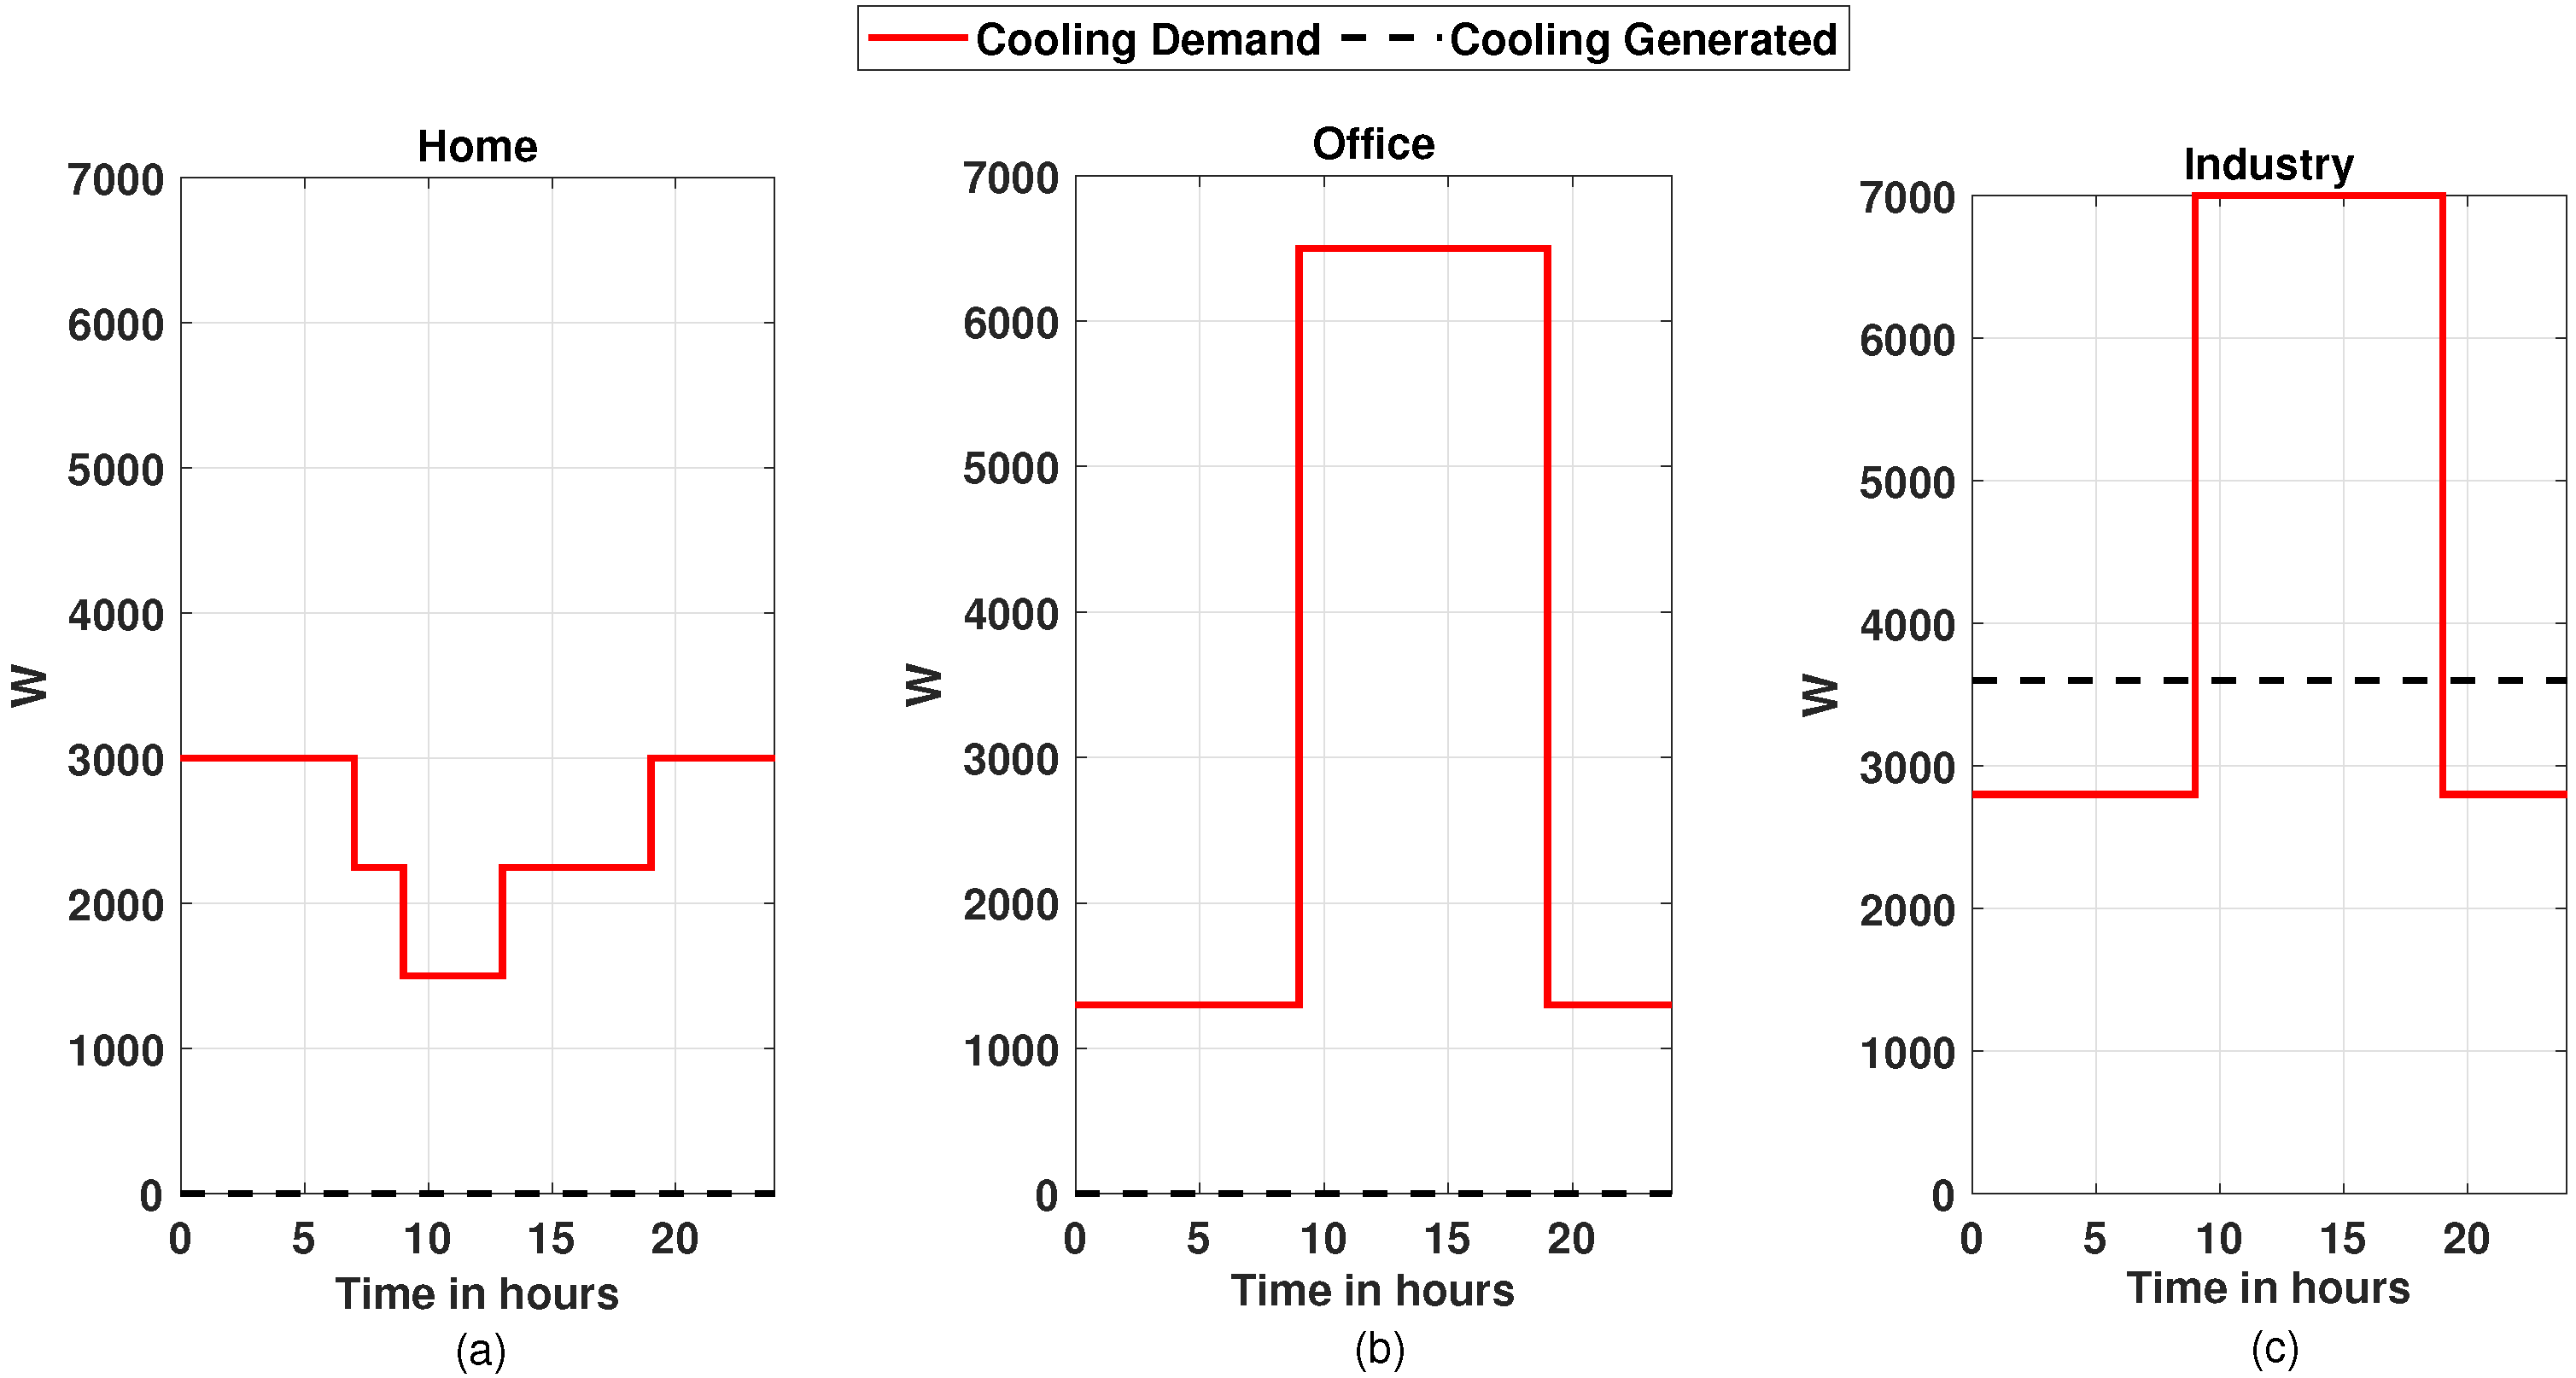
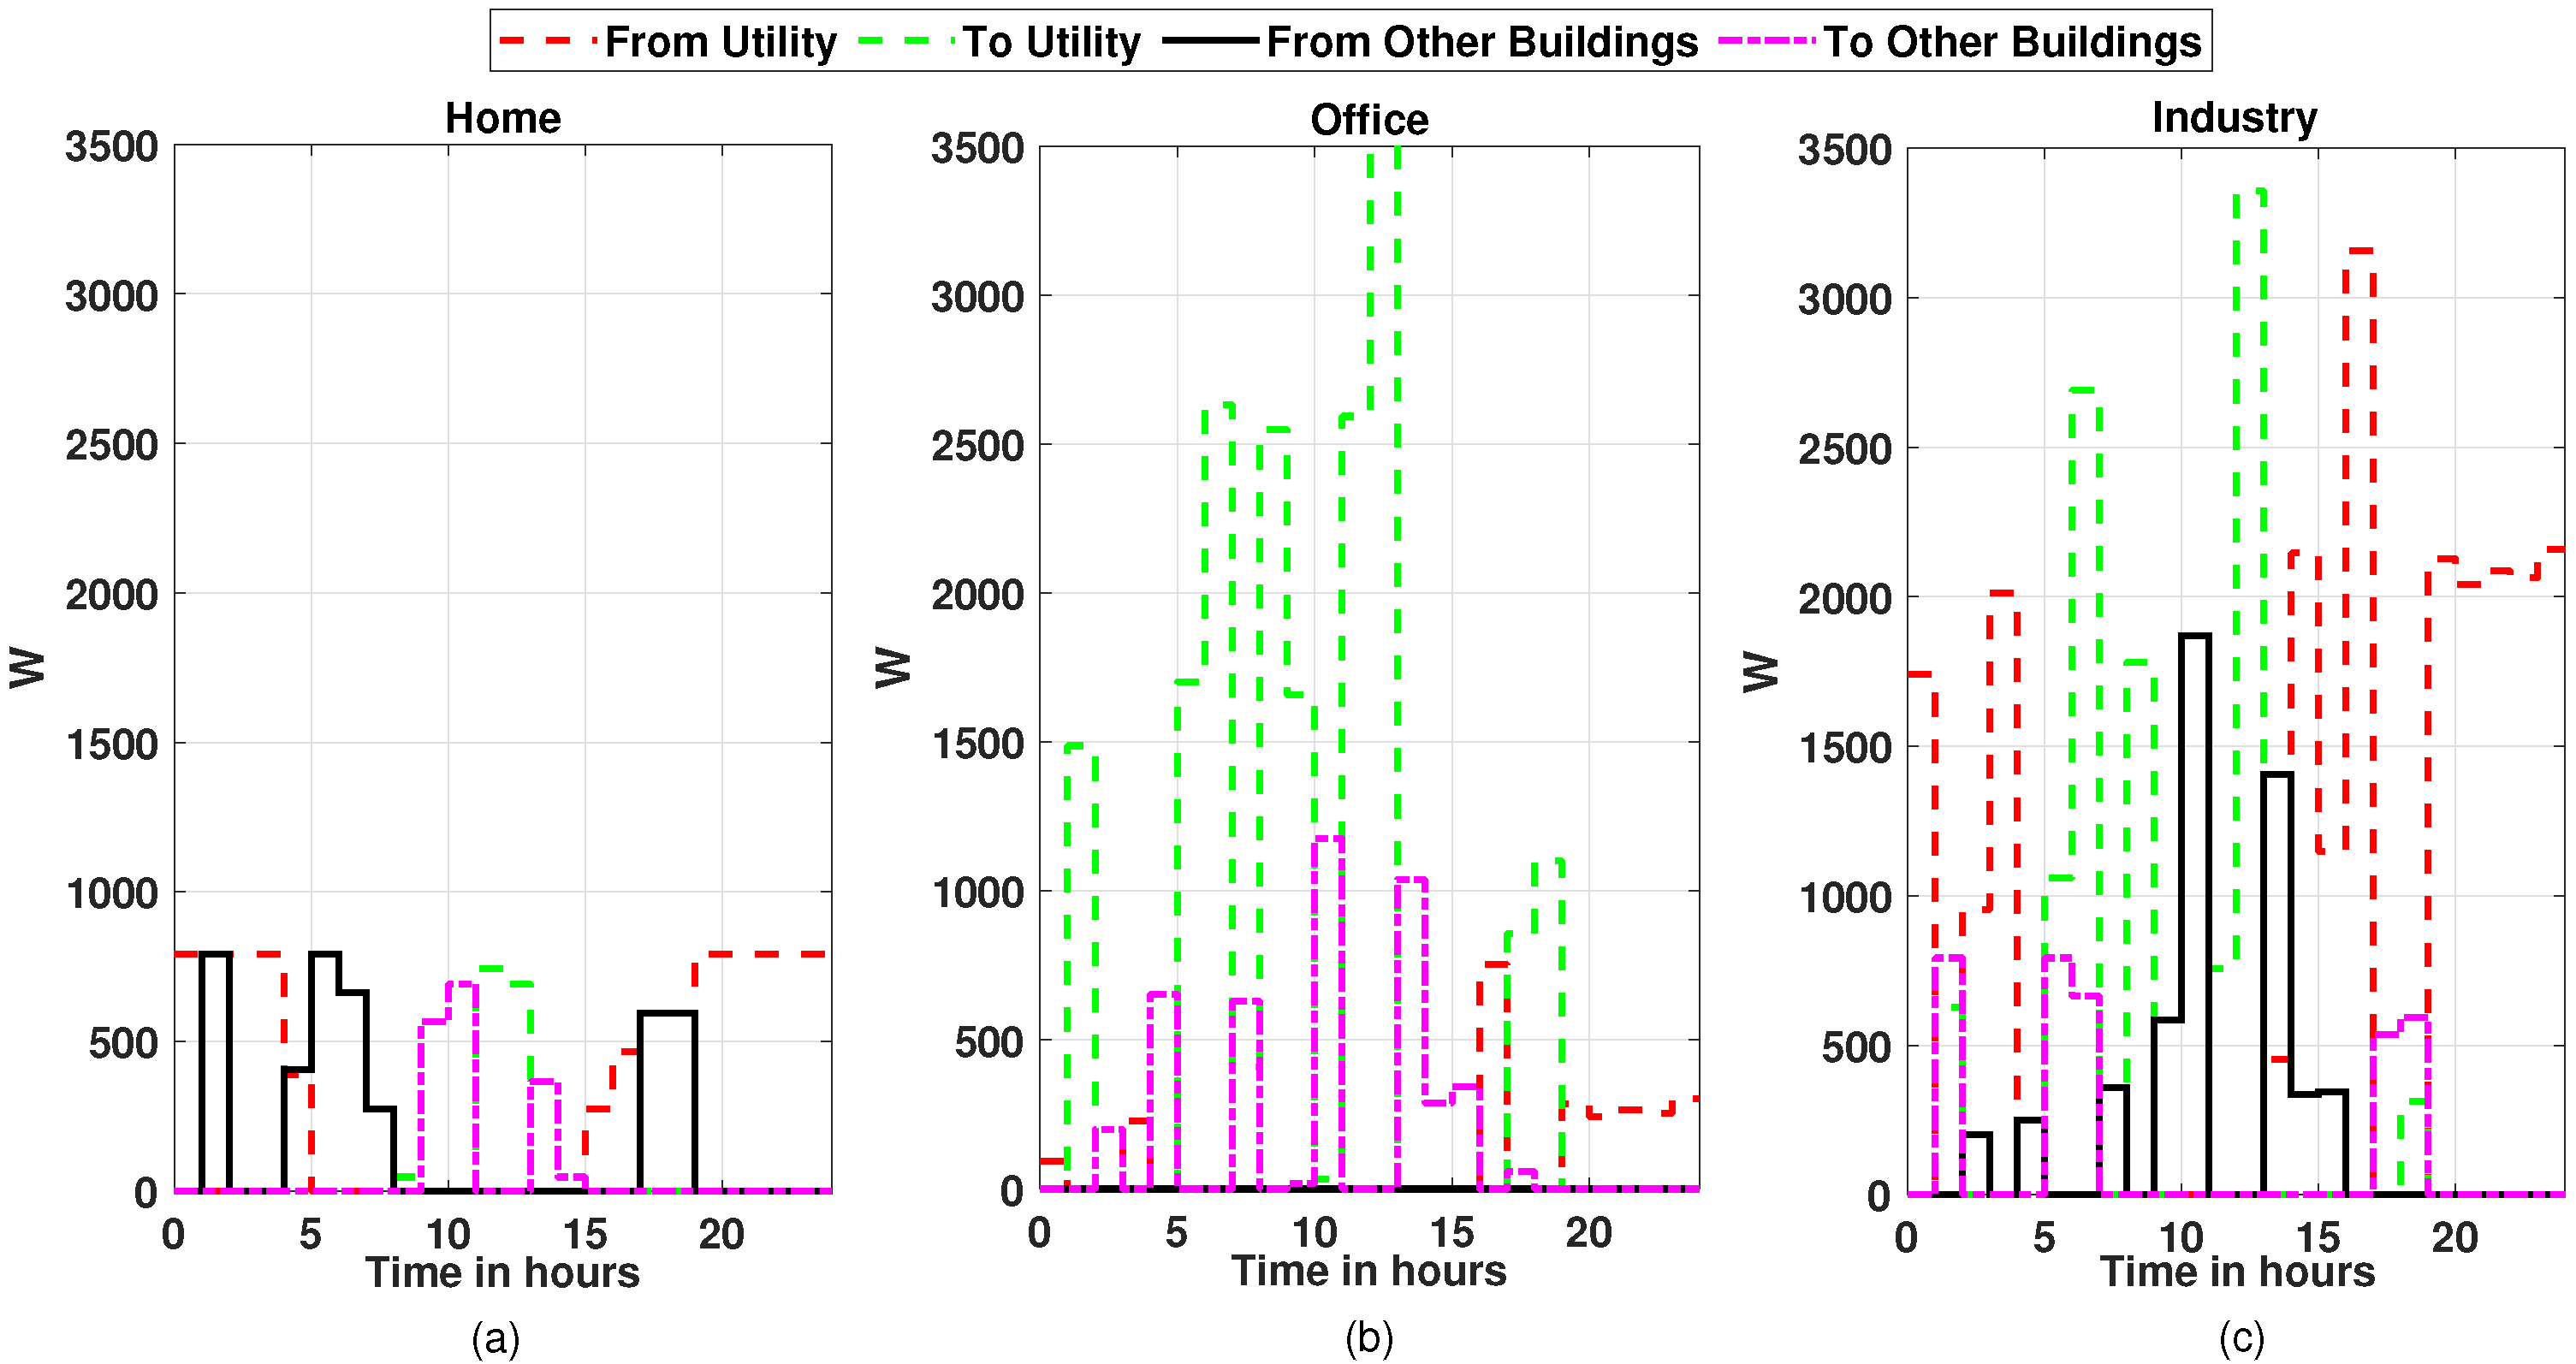
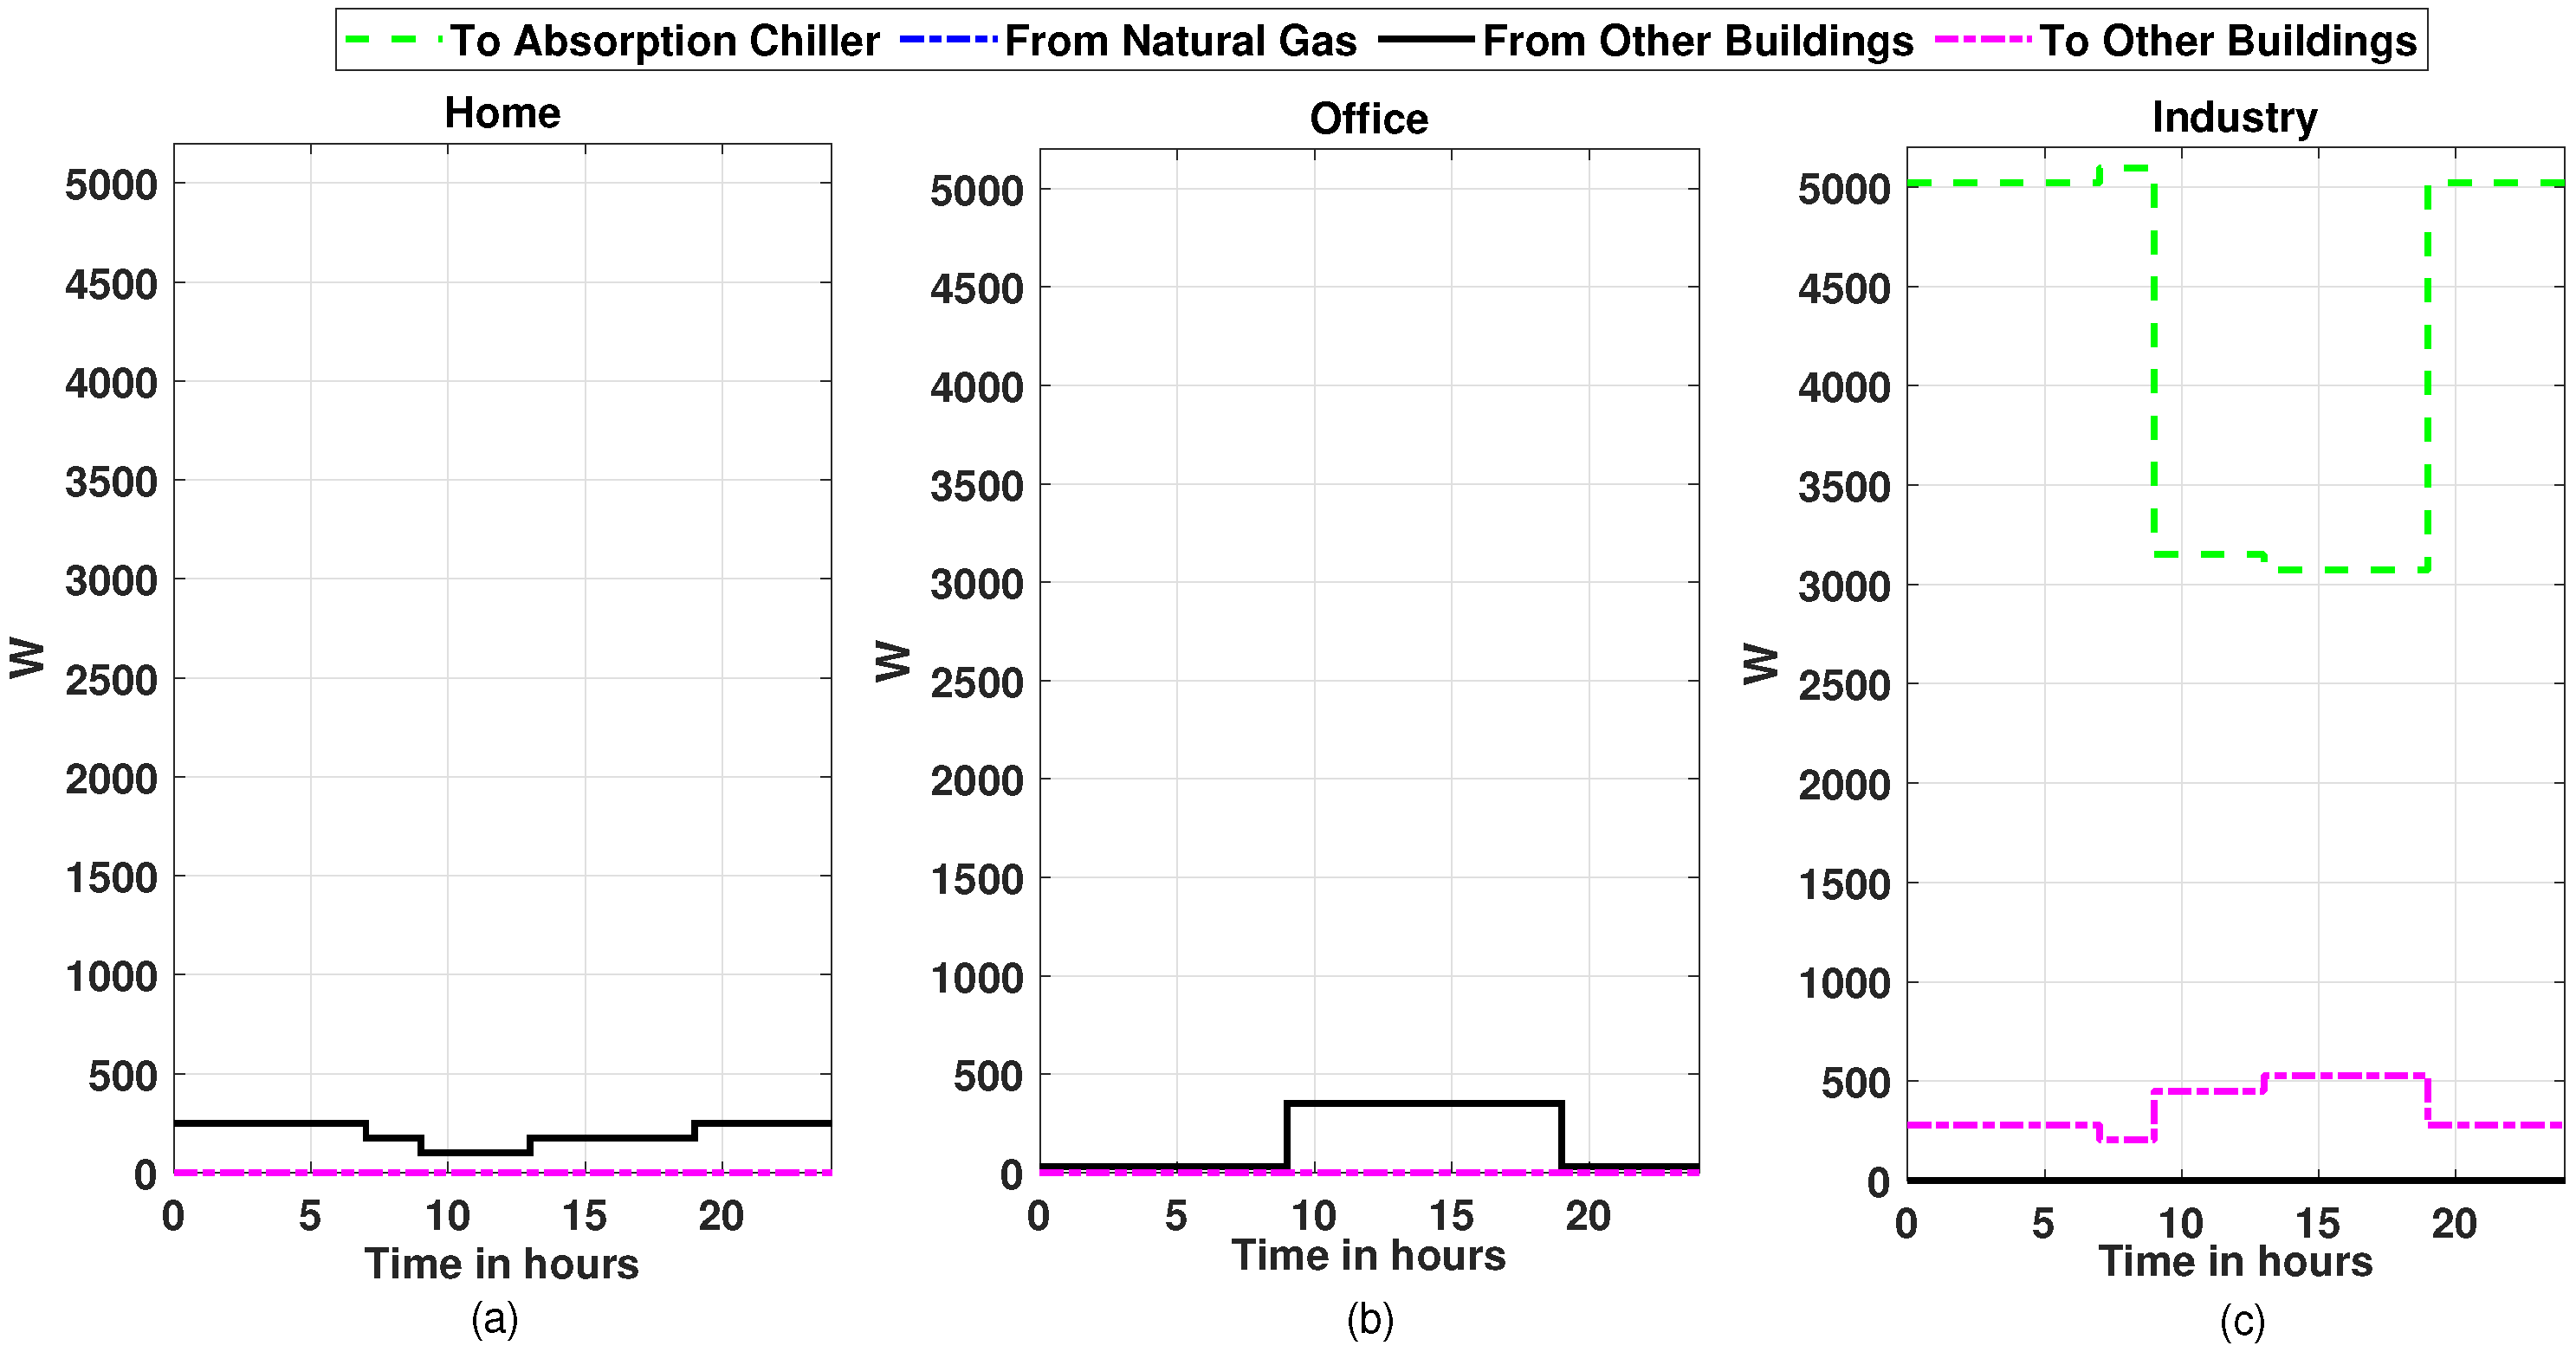
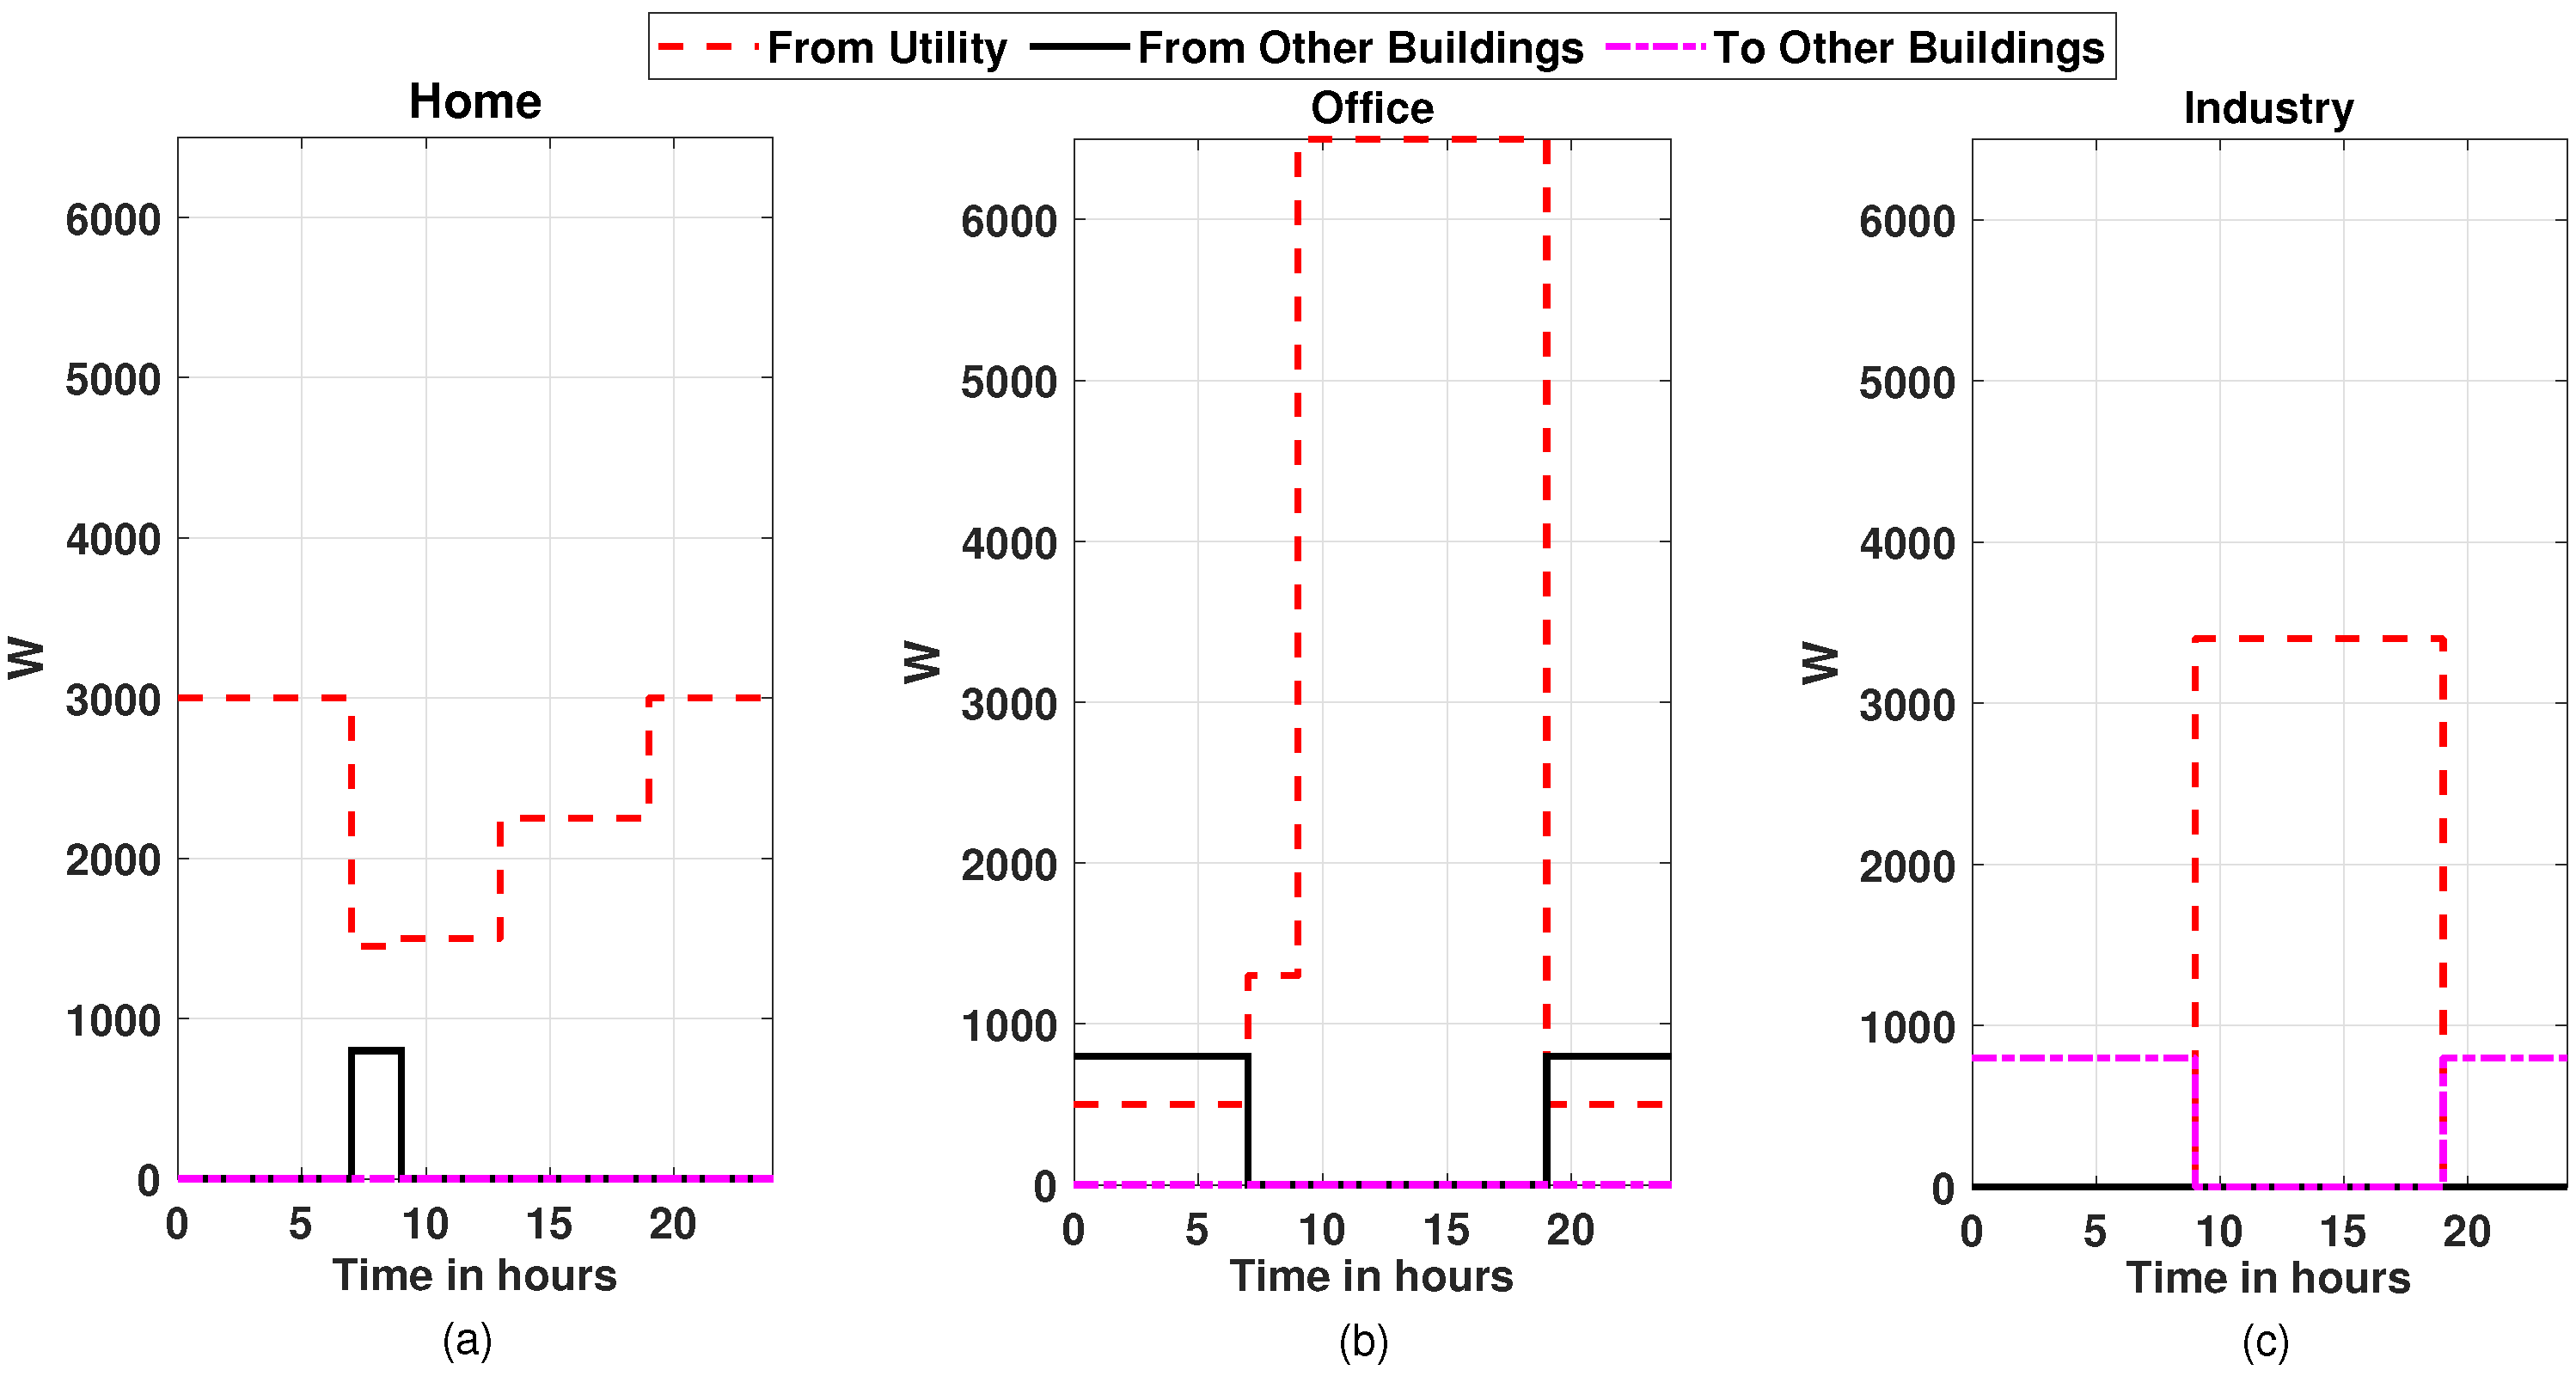
3. Results and Discussion

The results of the presented model are validated by considering a scenario comprising three different buildings: residential, official and glass manufacturing industrial building. These three buildings are assumed to lie in same vicinity in Islamabad, Pakistan. The industry is equipped with PV arrays, WT and also generates residual heat through its industrial process, which could fulfill its heating requirements, and can be shared with other buildings. The office building is equipped with PV arrays and WT, while the residential building has PV as RES. All the buildings are connected to the power grid and also have direct connections of the NG. The heating and cooling amounts are also converted into equivalent watt units for comparison. The home and office buildings have chillers for cooling, while the industrial building has an absorption chiller. The results for the months of November and June are presented here in detail, and their environmental data is considered for electricity generation through RES. The load demands are based on the average load demands of electricity, heating and cooling in the Zero Point region of Islamabad. The home building is of a single floor, having 2 rooms, a washroom and a kitchen. The heating requirements are mainly for cooking and space heating. The home building has four PV panels of generating a max energy of about 1000 watts at peak time. The heater/burner functioning on NG is of 500 watts and air-conditioner of about 12,000 British thermal unit (BTU) for cooling. The office building has two floors and have office space for about 12–15 employees accommodated in 5 rooms. Each floor has an air-conditioner of about 24,000 BTU. The office building is equipped with eight PV panels generating about 1800 watts at peak time, and has WT generating 500 watts at peak time. The heater burner is of 500 watts. The industrial building has ten PV panels generating about 2500 watts at peak time and WT generating 500 watts at peak time. The industrial building is of a single floor and is of hanger type. The industrial process is generating about 7000 watts equivalent heat from its process. The surplus energy generated through RES has a tariff of 2.5 cents/kWh. The surplus heating and cooling at any building has a tariff of 2.1 cents/kWh. The electricity is purchased from the utility at price of 4 cents/kWh. NG has equivalent tariff of 6 cent/kWh.
First, the results are presented for the month of November, which is in the winter season. The electricity load demands and generation through RES for home, office and industrial buildings are shown in Figure 4. It can be observed that for the home, the minimum electricity load is at day time when most of the occupant are at their work place. The maximum load is at night time when all the occupants are at home. The home has only PV as the source of harvested, so in night time, the electricity demands can’t be met through RES alone. In office building, the maximum demand of electricity is at the day time, during the office hours. The electricity generated through RES is surplus in the night time. The industrial building has large electricity requirements as compared to the home and office, its electricity demands are almost constant throughout the day. The heating load demands and generation for home, office and industrial buildings are shown in Figure 5. It can be observed that for the home building, the heating requirements are more in the night and early morning when all the occupants are at home. NG based space heaters are utilized for the heating purpose in all three buildings. The industrial building produces excess heat through process, which could be used for the space heating and fulfill the heating demands of home and office through cooperation. The industrial building is also equipped with an absorption chiller, which can be utilized in summer season to convert the excess heat into cooling.
For a full day of November, the mathematical model of our proposed cooperation scheme is simulated in MATLAB. The results for electricity cooperation are given in Figure 6. The figure shows how our proposed model through energy cooperation has been able to reduce dependence on the grid. The surplus energy generated by a building is shared among the buildings. Our proposed model finds the magnitude and the direction of energy flow among the buildings. When a building is unable to meet its electricity demands from its RES, it purchases electricity from other buildings, if there is any. In case other buildings also don’t posses sufficient energy, it will be purchased from the utility. The heating cooperation among the three buildings is shown in Figure 7. It can be seen from the figure that industrial building generates excess heat through its process, which is purchased by the home and office buildings to fulfill their heating demands. It can be seen that each building is either purchasing or selling according to its needs. This cooperation model minimizes the usage of utility and gives us the net cost saving.
The month of June is considered as the second month for validating our energy cooperation model. June is the hottest month in Islamabad, Pakistan, in which the cooling demand is generally the highest in the year, whereas the demand for heating is minimal. The electricity load demands and generation through RES for home, office and industrial buildings for the month of June are shown in Figure 8. Similarly, Figure 9 and Figure 10 present the heating and cooling load demands and generation for home, office and industrial buildings for June, respectively.
The results for electricity, heating and cooling cooperation for June are given in Figure 11, Figure 12 and Figure 13, respectively. These figures shows how our proposed model has been able to reduce energy cost through energy cooperation. It can be seen from the Figure 12 that industrial building generates excess heat through its process, which is converted into cooling through the absorption chiller and shared with oher buildings when in surplus.

Comparison between of Cooperation and Non Cooperation Model

To see the impact of electricity, heating and cooling cooperation among the three buildings, we generate loads and generation profiles according to the environmental data of Islamabad for each month. To compare the results of our proposed model and estimate the cost saving, a same scenario of three buildings is considered but without any energy cooperation. The cost function of the system without any cooperation is stated as follows:
F ( E n t , r g , E u , n t , E n , u t , H n t , x , Q n t , y ) = t = 1 T n = 1 N [ C ( E n t , r g ) + C ( E u , n t ) C ( E n , u t ) + C ( Q n t , x ) + C ( H n t , y ) ]
It can be observed from the system in (9), that there is no energy cooperation among the buildings in this case. Each building is only dependent upon self generation or through the grid. The non-cooperative mathematical formulation can be written as:
min E n t , r g , E u , n t , E n , u t H n t , x , Q n t , y , n , t F ( E n t , r g , E u , n t , E n , u t , H n t , x , H u , n t , Q n t , y )
Subject to:
C C 1 : E n t , r g , E u , n t , E n , u t 0 , n , m , t C C 2 : H n t , x 0 , n , m , t C C 3 : Q n t , y 0 , n , m , t C C 4 : E n t , r g + E n t , d g + E u , n t = E L n t + E n , u t , n C C 5 : H n t , x = H L n t + H L , n t , n C C 6 : Q n t , y = Q L n t + Q L , n t , n C C 7 : E n , u t E u , max , E m , n t E m , n max , n C C 8 : Q m , n t H m , n max , n C C 9 : Q m , n t H m , n max , n
In non-cooperation case, when the harvested energy is not enough, the utility is the only option to meet the energy demands. The total cost of electricity, heating and cooling for one month with the presented energy cooperation model is USD 219.4. The total cost without cooperation, in contrast, is USD 299.4. This is about 27% cost savings. It can be observed that there is a significant cost savings in our proposed model of energy cooperative model in comparison to the model without energy cooperation.

4. Conclusions and Future Work

Efficiently managing the energy requirements in a building can result in cost saving consumed by a building. Like other countries, in Pakistan, the heating and cooling demands of buildings are the major components of its energy costs. Through electricity, heating and cooling cooperation among the buildings, the dependence on the grid could be decreased, resulting in a less use of fossil fuels. During the off-peaks hours, when a building has surplus electricity, heating or cooling, it can share it with buildings that needs it. Unfortunately, however, no such cooperation model exists in the literature for the case of Pakistan. In this work, an energy cooperation model is presented in which electricity, heating and cooling are shared among neighboring buildings. Our proposed model through energy cooperation helps in reducing dependence upon the grid and energy costs. The environmental data of Islamabad—the capital of Pakistan—is used to validate the proposed scheme. The presented mathematical model is solved by the interior point method. The simulation results show significant cost savings of about 27%. In future, to compensate for the unstable nature of RES, battery and thermal storage for storing electricity and cooling, respectively, will be incorporated.

Author Contributions

Conceptualization, S.A.H. and M.N.; methodology, S.A.H. and S.R.N.; software, H.U.R.; validation, M.N. and K.-S.K.; formal analysis, S.R.N. and K.-S.K.; investigation, H.U.R.; resources, S.A.H. and S.R.N.; data curation, H.U.R. and S.M.R.I.; writing—original draft preparation, H.U.R. and S.A.H.; writing—review and editing, S.M.R.I.; visualization, M.N. and K.-S.K.; supervision, M.N.; project administration, S.R.N.; funding acquisition, S.M.R.I. All authors have read and agreed to the published version of the manuscript.

Funding

This work was supported in part by the National Research Foundation of Korea-Grant funded by the Korean Government (Ministry of Science and ICT) under Grant NRF-2020R1A2B5B02002478, and in part by the Sejong University Research Faculty Program (20212023).

Institutional Review Board Statement

Not applicable.

Informed Consent Statement

Not applicable.

Data Availability Statement

Not applicable.

Conflicts of Interest

The authors declare no conflict of interest.

Nomenclature

Abbreviations & NotationsDescription
Nnumber of neighboring buildings
AWTarea swept by wind turbine blades
vwind speed
Cpefficiency coefficient of wind turbine
ρ air density
kshape parameter
η m solar yield
Aphotovoltaic panel area
Isolar insolation
ttime interval
Ttime horizon
Cost RES cost of energy generated through RES
Cost utility cost of energy generated through utility
E n t , r g electricity generated through RES at interval t
E u , n t electricity purchased from the utility at interval t
E n , u t electricity sold back to the utility at interval t
E m , n t electricity transfer from building m to building n at interval t
E n , m t electricity transfer from building n to building m at interval t
H x , n t heat generated through some fossil fuels at interval t
H m , n t heat transfer from building m to building n at interval t
H n , m t electricity transfer from building n to building m at interval t
Q y , n t cooling generated through some cooling process at interval t
Q m , n t cooling transfer from building m to building n at interval t
Q n , m t cooling transfer from building n to building m at interval t
C ( · ) cost of the specified energy term
E L n t electricity load
H L n t heating load
Q L n t cooling load
E m i n m , n minimum electricity transfer from building m to building n
E m a x m , n maximum electricity transfer from building m to building n
CEelectricity convex envelope coefficient
H m i n m , n minimum heat transfer from building m to building n
H m a x n , m maximum heat transfer from building m to building n
HEheating convex envelope coefficient
Q m i n m , n minimum heat transfer from building m to building n
Q m a x m , n maximum heat transfer from building m to building n
QEcooling convex envelope coefficient
H L , n t heat loss at interval t
Q L , n t cooling loss at interval t
BTUBritish thermal unit
CCHPcombined heating, cooling and power
CHPcombined heating and power
GHGgreenhouse gases
MILPmix integer linear programming
NGnatural gas
PVphotovoltaic
RESrenewable energy sources
WTwind turbine
WPDWeibull probability distribution

References

  1. Moussa, R.R.; Mahmoud, A.H.; Hatem, T.M. A digital tool for integrating renewable energy devices within landscape elements: Energy-scape online application. J. Clean. Prod. 2020, 254, 119932. [Google Scholar] [CrossRef]
  2. International Energy Agency. Global Energy and CO2 Status Report: The Latest Trends in Energy and Emissions in 2018. 2018, pp. 1–29. Available online: https://iea.blob.core.windows.net/assets/23f9eb39-7493-4722-aced-61433cbffe10/Global_Energy_and_CO2_Status_Report_2018.pdf (accessed on 1 December 2021).
  3. International Energy Agency. World Energy Outlook 2020. 2020, pp. 1–464. Available online: https://iea.blob.core.windows.net/assets/a72d8abf-de08-4385-8711-b8a062d6124a/WEO2020.pdf (accessed on 1 December 2021).
  4. Schwarz, M.; Nakhle, C.; Knoeri, C. Innovative designs of building energy codes for building decarbonization and their implementation challenges. J. Clean. Prod. 2020, 248, 119260. [Google Scholar] [CrossRef]
  5. Du, Y.; Blocken, B.; Pirker, S. A novel approach to simulate pollutant dispersion in the built environment: Transport-based recurrence CFD. Build. Environ. 2020, 170, 1–13. [Google Scholar] [CrossRef]
  6. Trust management and evaluation for edge intelligence in the Internet of Things. Eng. Appl. Artif. Intell. 2020, 94, 6. [CrossRef]
  7. Hosking, J.S.; MacLeod, D.; Phillips, T.; Holmes, C.R.; Watson, P.; Shuckburgh, E.F.; Mitchell, D. Changes in European wind energy generation potential within a 1.5 C warmer world. Environ. Res. Lett. 2018, 13, 054032. [Google Scholar]
  8. Amber, K.P.; Aslam, M.W.; Ikram, F.; Kousar, A.; Ali, H.M.; Akram, N.; Afzal, K.; Mushtaq, H. Heating and cooling degree-days maps of Pakistan. Energies 2018, 11, 94. [Google Scholar] [CrossRef] [Green Version]
  9. Diakaki, C.; Grigoroudis, E.; Kabelis, N.; Kolokotsa, D.; Kalaitzakis, K.; Stavrakakis, G. A multi-objective decision model for the improvement of energy efficiency in buildings. Energy 2010, 35, 5483–5496. [Google Scholar] [CrossRef]
  10. Gustavsson, L.; Joelsson, A. Life cycle primary energy analysis of residential buildings. Energy Build. 2010, 42, 210–220. [Google Scholar] [CrossRef]
  11. Andrychowicz, M. The impact of energy storage along with the allocation of RES on the reduction of energy costs using MILP. Energies 2021, 14, 3783. [Google Scholar] [CrossRef]
  12. Ahsan, S.M.; Khan, H.A.; ul Hassan, N.; Arif, S.M.; Lie, T.T. Optimized power dispatch for solar photovoltaic-storage system with multiple buildings in bilateral contracts. Appl. Energy 2020, 273, 273. [Google Scholar] [CrossRef]
  13. Hussain, A.; Bui, V.H.; Kim, H.M.; Im, Y.H.; Lee, J.Y. Optimal energy management of combined cooling, heat and power in different demand type buildings considering seasonal demand variations. Energies 2017, 10, 789. [Google Scholar] [CrossRef] [Green Version]
  14. Analysis of a hybrid solar-assisted trigeneration system. Energies 2016, 9, 705. [CrossRef] [Green Version]
  15. Bellos, E.; Tzivanidis, C. Optimization of a solar-driven trigeneration system with nanofluid-based parabolic trough collectors. Energies 2017, 10, 848. [Google Scholar] [CrossRef] [Green Version]
  16. Acevedo, L.; Uche, J.; Del Almo, A.; Círez, F.; Usón, S.; Martínez, A.; Guedea, I. Dynamic simulation of a trigeneration scheme for domestic purposes based on hybrid techniques. Energies 2016, 9, 12. [Google Scholar] [CrossRef] [Green Version]
  17. Bracco, S.; Dentici, G.; Siri, S. Economic and environmental optimization model for the design and the operation of a combined heat and power distributed generation system in an urban area. Energy 2013, 55, 1014–1024. [Google Scholar] [CrossRef]
  18. Bahmani, R.; Karimi, H.; Jadid, S. Cooperative energy management of multi-energy hub systems considering demand response programs and ice storage. Int. J. Electr. Power Energy Syst. 2021, 130, 106904. [Google Scholar] [CrossRef]
  19. Waqar, A.; Shahbaz Tanveer, M.; Ahmad, J.; Aamir, M.; Yaqoob, M.; Anwar, F. Multi-objective analysis of a CHP plant integrated microgrid in Pakistan. Energies 2017, 10, 1625. [Google Scholar] [CrossRef] [Green Version]
  20. Nema, P.; Rangnekar, S.; Nema, R. Pre-feasibility study of PV-solar/wind hybrid energy system for GSM type mobile telephony base station in central India. In Proceedings of the 2010 The 2nd International Conference on Computer and Automation Engineering (ICCAE), Singapore, 26–28 February 2010; Volume 5, pp. 152–156. [Google Scholar]
  21. World Weather Online. Available online: https://www.worldweatheronline.com/islamabad-weather-averages/islamabad/pk.aspx (accessed on 1 December 2021).
  22. Theo, W.L.; Lim, J.S.; Ho, W.S.; Hashim, H.; Lee, C.T. Review of distributed generation (DG) system planning and optimisation techniques: Comparison of numerical and mathematical modelling methods. Renew. Sustain. Energy Rev. 2017, 67, 531–573. [Google Scholar] [CrossRef]
  23. Solar Electricity Handbook. Available online: www.solarelectricityhandbook.com/solar-irradiance.html (accessed on 4 November 2021).
  24. Mitsos, A.; Chachuat, B.; Barton, P.I. McCormick-based relaxations of algorithms. SIAM J. Optim. 2009, 20, 573–601. [Google Scholar] [CrossRef]
  25. Boyd, S.; Boyd, S.P.; Vandenberghe, L. Convex Optimization; Cambridge University Press: Cambridge, UK, 2004. [Google Scholar] [CrossRef]
Figure 1. A zone of neighboring buildings driven by RES and utility, sharing their electricity, heating and cooling with other buildings.
Energies 15 01160 g001
Figure 2. Monthly average wind speed data for Islamabad.
Energies 15 01160 g002
Figure 3. Average solar insolation data for Islamabad.
Energies 15 01160 g003
Figure 4. Electricity demand and harvested electricity of 24 h for the month of November, (a) for the home building, (b) for office building, and (c) for industry building.
Energies 15 01160 g004
Figure 5. Heating demand and generation of 24 h for the month of November, (a) for the home building, (b) for office building, and (c) for industry building.
Energies 15 01160 g005
Figure 6. Electricity cooperation among the buildings for 24 h in the month of November, (a) for the home building, (b) for office building, and (c) for industry building.
Energies 15 01160 g006
Figure 7. Heating cooperation among the buildings for 24 h in the month of November, (a) for the home building, (b) for office building, and (c) for industry building.
Energies 15 01160 g007
Figure 8. Electricity demand and harvested electricity of 24 h for the month of June, (a) for the home building, (b) for office building, and (c) for industry building.
Energies 15 01160 g008
Figure 9. Heating demand and generation of 24 h for the month of June, (a) for the home building, (b) for office building, and (c) for industry building.
Energies 15 01160 g009
Figure 10. Cooling demand and generation of 24 h for the month of June, (a) for the home building, (b) for office building, and (c) for industry building.
Energies 15 01160 g010
Figure 11. Electricity cooperation among the buildings for 24 h in the month of June, (a) for the home building, (b) for office building, and (c) for industry building.
Energies 15 01160 g011
Figure 12. Heating cooperation among the buildings for 24 h in the month of June, (a) for the home building, (b) for office building, and (c) for industry building.
Energies 15 01160 g012
Figure 13. Cooling cooperation among the buildings for 24 h in the month of June, (a) for the home building, (b) for office building, and (c) for industry building.
Energies 15 01160 g013
Publisher’s Note: MDPI stays neutral with regard to jurisdictional claims in published maps and institutional affiliations.

