
Universal Model to Predict Expected Direction of Products Quality Improvement


1
Department of Humanities and Social Sciences, Faculty of Management, Rzeszow University of Technology, al. Powstancow Warszawy 12, 35-959 Rzeszow, Poland
2
Department of Manufacturing Processes and Production Engineering, Faculty of Mechanical Engineering and Aeronautics, Rzeszow University of Technology, al. Powstancow Warszawy 12, 35-959 Rzeszow, Poland
*
Author to whom correspondence should be addressed.
Energies 2022, 15(5), 1751; https://doi.org/10.3390/en15051751
Submission received: 26 January 2022
/
Revised: 10 February 2022
/
Accepted: 23 February 2022
/
Published: 26 February 2022
(This article belongs to the Special Issue Forecasting and Decision Support Systems for Energy Market Development)
Abstract
:Improving the quality of products remains a challenge. This is due to the turbulent environment and the dynamics of changing customer requirements. Hence, the key action is to predict beneficial changes in products, which will allow one to achieve customer satisfaction and reduce the waste of resources. Therefore, the purpose of this article was to develop a universal model to predict the expected direction of quality improvement. Initially, the purpose of the research was determined by using the SMART(-ER) method. Then, during the brainstorming method (BM), the product criteria and range states of these criteria were determined. Next, a survey with the Likert scale was used to obtain customers’ expectations, i.e., assessing the importance of criteria and customers’ satisfaction with ranges of product criteria states. Based on customer assessments, quality product levels were calculated using the Weighted Sum Model (WSM). Then, the initial customer satisfaction from the product quality level was identified according to the relative state’s scale. Based on this, the direction of product quality improvement was anticipated using the Naïve Bayesian Classifier (NBC). A test of the model was carried out for photovoltaic panels (PV) of a key EU producer. However, the proposed model is universal, because it can be used by any entity to predict the direction of improvement of any kind of product. The originality of this model allows the prediction of the destination of product improvement according to customers’ assessments for weights of criteria and satisfaction from ranges of quality-criterion states.
1. Introduction
Changes in customer expectations and turbulent environments make it difficult to choose a favorable direction for product development [1]. As part of sustainable development, it is important to reduce the waste of resources [2]. It is possible by adequate planned production to allow satisfactory products. However, this is difficult because of products on which demand is increasing, and there are comparatively many offered products [3,4]. This is a global problem, where it is particularly noticeable in the case of photovoltaic panels (PV), which are one of the main tools of renewable energy sources (RESs) [5].
As shown in [6], electricity is the fastest growing energy source in the world. According to [5,7], the energy produced from PV is clean and safe, where the key meaning is in the production of electricity. Therefore, photovoltaic panels are developing at a faster rate than other RESs. Photovoltaic panels are produced on a global scale and their large number is still growing [8]. For example, the energy capacity of solar power in 2010 was equal to about 0.16 GW, while in 2021, it was observed its grow to 40.1 GW [9]. In turn, in the world, the total power from PV amounts to 505 GW [9]. The dynamics of the development of PV results are mainly due to the financial support of that industry in households. For example, it is possible to achieve approximately 70% to 80% of free energy from photovoltaic energy, where the billing period is defined annually [10,11]. Additionally, the development of photovoltaics results from a need to include many different conditions during its design, for example, location, place of installation, distance between panels, or individual customers’ preferences [12]. It is important to mention the climate and energy framework of 2030, according to which it is necessary to achieve an improved energy effectiveness of about a minimum of 32.5%, where it is predicted to have a 32% share in renewable energy [13]. Despite that, the prices of photovoltaics will allow one to produce 31% of energy from this source by 2030 [14], due to the fact that attempts are currently being made to produce energy from renewable and sustainable energy sources. It will allow the reduction in greenhouse gases and increase in efficiency of the energy supply [15]. The aforementioned factors determine that many photovoltaic panels are produced; however, due to the sustainable development of these products, it is important to predict the direction of their development. According to [16], this direction should include the so-called voice of the customer (VoC). However, there is a search for an effective way to predict the adequate direction of PVs. This is a global problem, which covers not only photovoltaic panels but all products produced in medium-series or mass production.
Therefore, the purpose was to develop a universal model to predict the expected direction of product quality improvement. During development of the model, two hypotheses were assumed:
Hypothesis 1.
It is possible to predict the direction of product quality improvement according to customer expectations determined based on the current quality of the product.
Hypothesis 2.
It is possible to predict the direction of product quality improvement according to the quality of products estimated based on assessments referring to weights (importance) of criteria and satisfaction with states of criteria.
A test of the proposed model was carried out for photovoltaic panels (PV) of a key producer from EU countries.
2. Literature Review
The literature review showed that the authors of [17] developed a multicriteria algorithm to optimize the decision to choose the best PV. In turn, in [18], the benefits of photovoltaic energy resulted from costs, consumption, technology, and their orientation (place of installation of photovoltaic energy). Toward this aim, the analysis of optimal costs, including the economic aspects and configuration of these products, was used. Another example is [19], which used the environment of TRNSYS to simulate the annual performance of mixed buildings with an air-to-water heat pump and a photovoltaic system mounted on the roof. The aim was to evaluate the expected energy performance with the installed PV. In turn, the authors of [20] developed a neural network model to predict the annual radiation and the optimal angle of inclination and azimuth in each region of the world. The idea was to allow the installation of a cheap microcontroller. Another model was shown in [21], where the yield of photovoltaic panel energy from commercial and tandem solar cells was calculated. The authors of [22] analyzed the modeling and performance analysis of partially shaded solar modules. The purpose was to integrate shade and opacity attributes in the area of the photovoltaic module. Another approach was shown in [23], where the slope of the PV and the predicted range of the sun’s rays on their surfaces were verified. The next example is [24], in which prototypes of photovoltaics were tested. The efficiency of these systems in MATLAB was analyzed. In turn, in [25], a distributed energy system was built. This consisted of the gasification of superheated steam of solid waste and photovoltaic panels. In turn, in [26], beneficial photovoltaics were predicted according to the criteria of choice, e.g., economic, environmental, and technical. Despite basic methods for prediction, there are existing advanced methods. For example, the authors of [27] developed models to solve the problem of production optimization, in which the aspect of the value of production was included. Toward this aim, the approach based on machine learning with experimental data was combined. In effect, the models predicted the final performance of a battery. The novelty of the article was the efficiency of quantitative research and prediction using the systemic view of the production process. In turn, in article [28], the impact of the component parameters of the mixing stage on a lithium-ion battery produced was analyzed. Classification models were used, mainly machine learning based on RUBoost. The idea was to reduce the problem of class imbalance and to classify quality indicators efficiently. The next example of advanced methods for prediction is [29]. In this work, a structure based on the recursive neural network (RNN) was proposed. The purpose was to effectively predict the capacity of the calendar. In effect, it was shown that it is possible to use effective forecasting in various storage situations. Another modern approach was shown by [30], where a solution was developed based on machine learning using migrated Gaussian regression (GPR). The purpose was to predict a future two-stage trajectory aging battery. The analysis was subjected to three batteries, followed by model validation and efficiency evaluation. An effective solution was also proposed in [31], which developed a classification framework based on random forests from the bag (RF), Gini changes, and the predictive association measure (PMOA). Verifications were performed for the production of lithium-ion batteries.
After the review of the literature, it was shown that the search for a different way to determine the effectiveness of PVs is still ongoing [17,19]. Currently, these works mainly include predicting the, e.g., efficiency and costs of PV installation [18,20,22]. In addition, various advanced machine learning methods have been used, such as RU-Boost [28], transferred recursive neural network (RNN), migrated Gaussian process regression (GPR) [30], or random forest ‘out of bag’ (RF), Gini changes, and predictive association measure (PMOA) [31]. Despite this, there is still a search for a way to determine the direction of improvement of these products. This refers to the need to develop a way to support an entity (expert, broker, or bidder) in choosing the way of improving current products, to focus only on adequate improvement actions. At the same time, these activities will be to the satisfaction of the customer. In comparison to previous works, the originality of the proposed approach is predicting the expected destination of quality improvement of products based on different states (attributes) of the current product and customers’ satisfaction. It is a new proposition because prediction mainly includes historical or experimental data. However, in this approach, the prediction will include the current (current) state of the products. Additionally, it is possible to target product development by involving customers in the entire product quality assessment process. This procedure is favorable for the development of all products (not only photovoltaics). It is in accordance with the rule of reducing the waste of sources and allows for limitations, negative climate change, conditioning, and increased (often unnecessary) production.
3. Model
The universal model to predict the direction of quality improvement of products was developed. The model is presented as follows: Section 3.1. Concept of model, Section 3.2. Assumptions and conditions of the universal model, Section 3.3. Characteristics of the model.
3.1. Concept of Model
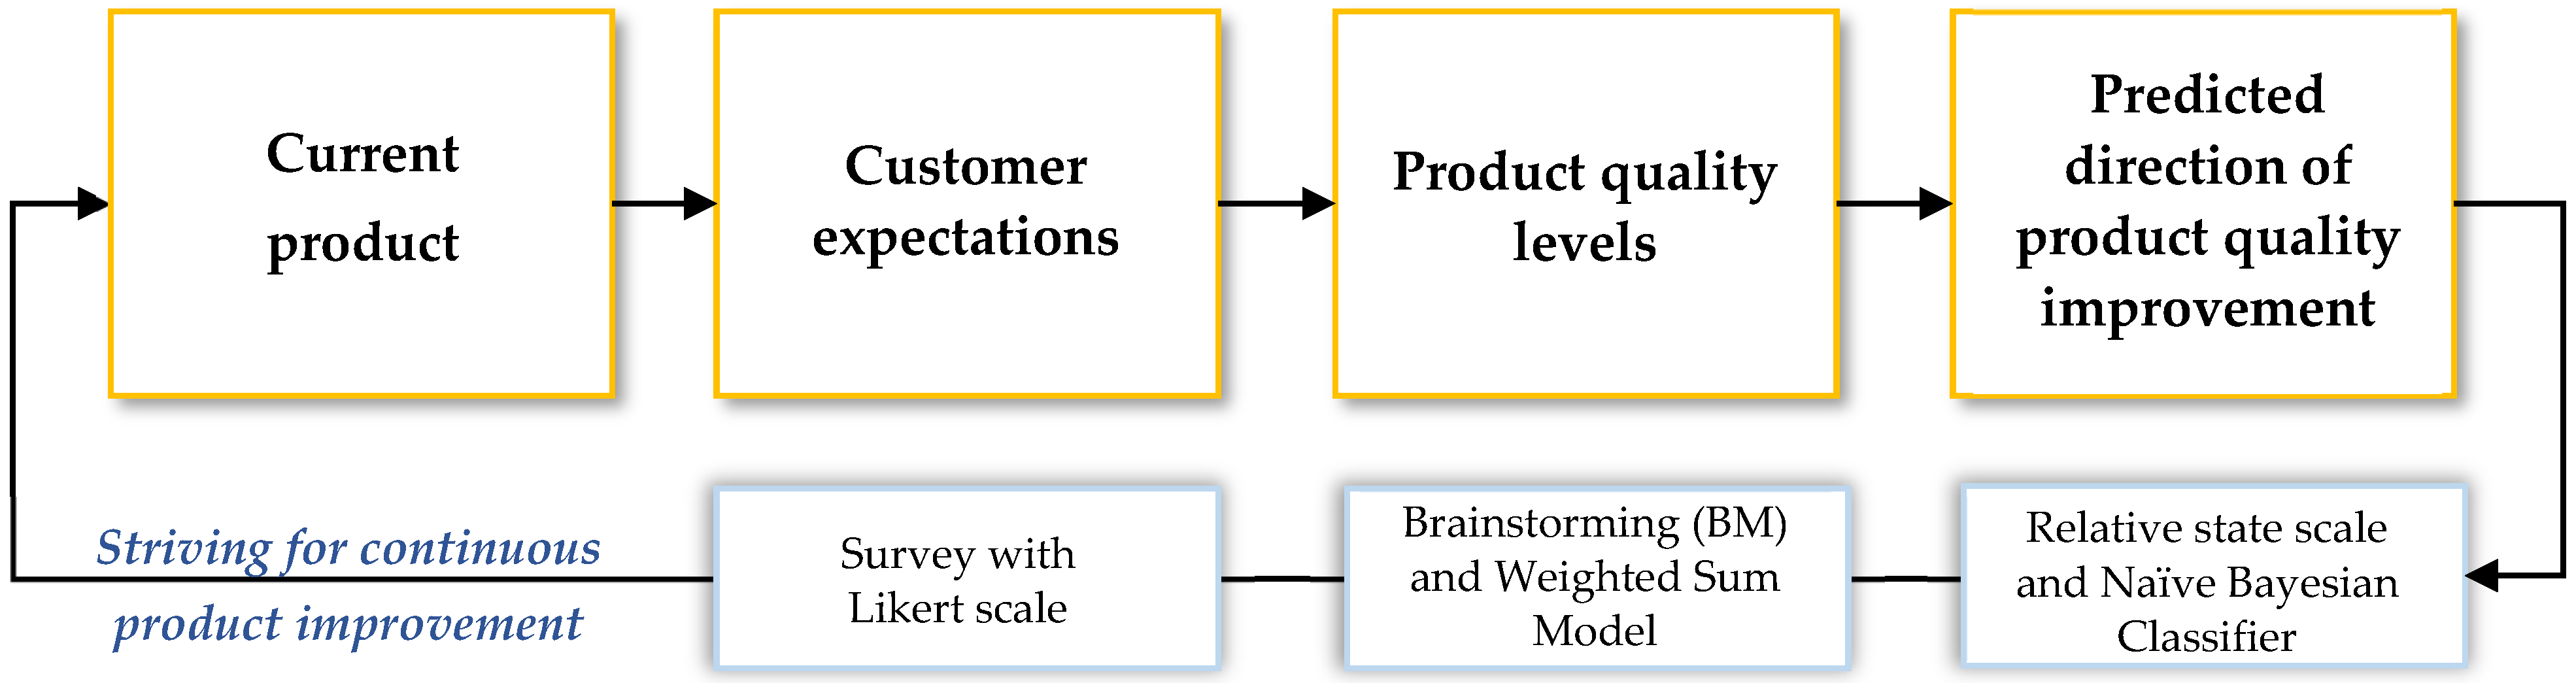
The concept of the model includes predicting the direction of product quality improvement considering customers’ expectations. It refers to determining the preferred quality of a product according to the importance of product criteria and assessment of customers’ satisfaction from states of product criteria. Therefore, the model can be useful for an entity (expert, broker, or bidder) to determine relevant improvement actions to improve currently existing products. The proposed model was developed by combining these instruments: SMART(-ER) method (S—specific, M—measurable, A—achievable, R—relevant, realistic, or reward, T—‘based on timeline’ or timebound, E—exciting or evaluated, R—recorded or reward) [32], brainstorming method (BM) [33], survey with Likert scale [1,34,35,36], Weighted Sum Model (WSM) [3,37,38,39], relative states scale [3,4,40], and Naïve Bayesian Classifier (NBC) [41,42,43,44]. The general concept of the model is shown in Figure 1.
Initially, customers’ expectations were obtained using a survey with the Likert scale, where customers assessed the importance of criteria and satisfaction from a range of criteria states. It was considered that the customer based on the current product would be able to more precisely determine what is expected (needed), i.e., what has a positive impact on the product quality level, and what has to be completely changed. Then, according to customers’ expectations, quality product levels were estimated for a different range of criteria states using the Weighted Sum Model (WSM). Then, according to relative states, the initial classification of customers’ satisfaction from the estimated product quality levels was carried out. Based on this, the expected direction of product quality improvement was anticipated using the Naïve Bayes Classifier.
3.2. Assumptions and Conditions of the Model Ensuring Its Versatility
Assumptions were made during the development of the proposed model. These assumptions resulted from the literature review, the concept of the proposed model, and the conditions of selected methods. These assumptions were:
- The product for verification should be the current existing product [1];
- The type (kind) of products for verification should not be limited;
- The product quality level should be calculated separately according to the assessments from individual customers.
These assumptions were adequately detailed at the stages of the model, which are characterized in the next section.
The universality of the model includes the possibility of its application for any type (kind) of currently existing products. Additionally, the model can be used for any entity, i.e., bidder, expert, or broker. The universality of the model refers to the universal character of the tools, which were implemented and sequentially combined [57]. For example, the WSM method does not include measure values of criteria; therefore, it allows the estimation of product quality for any criteria, which can be qualitative or quantitative [3,37,38,39]. Furthermore, the Naive Bayesian Classifier (NBC) is effective in predicting or classifying any data shown in qualitative and quantitative ways [41,42,43,44]. Despite that, the universality of the model is a possibility of its application as part of the ongoing improvement of products, and to the sustainable development of products considering customers’ expectations.
3.3. Characterization of Model
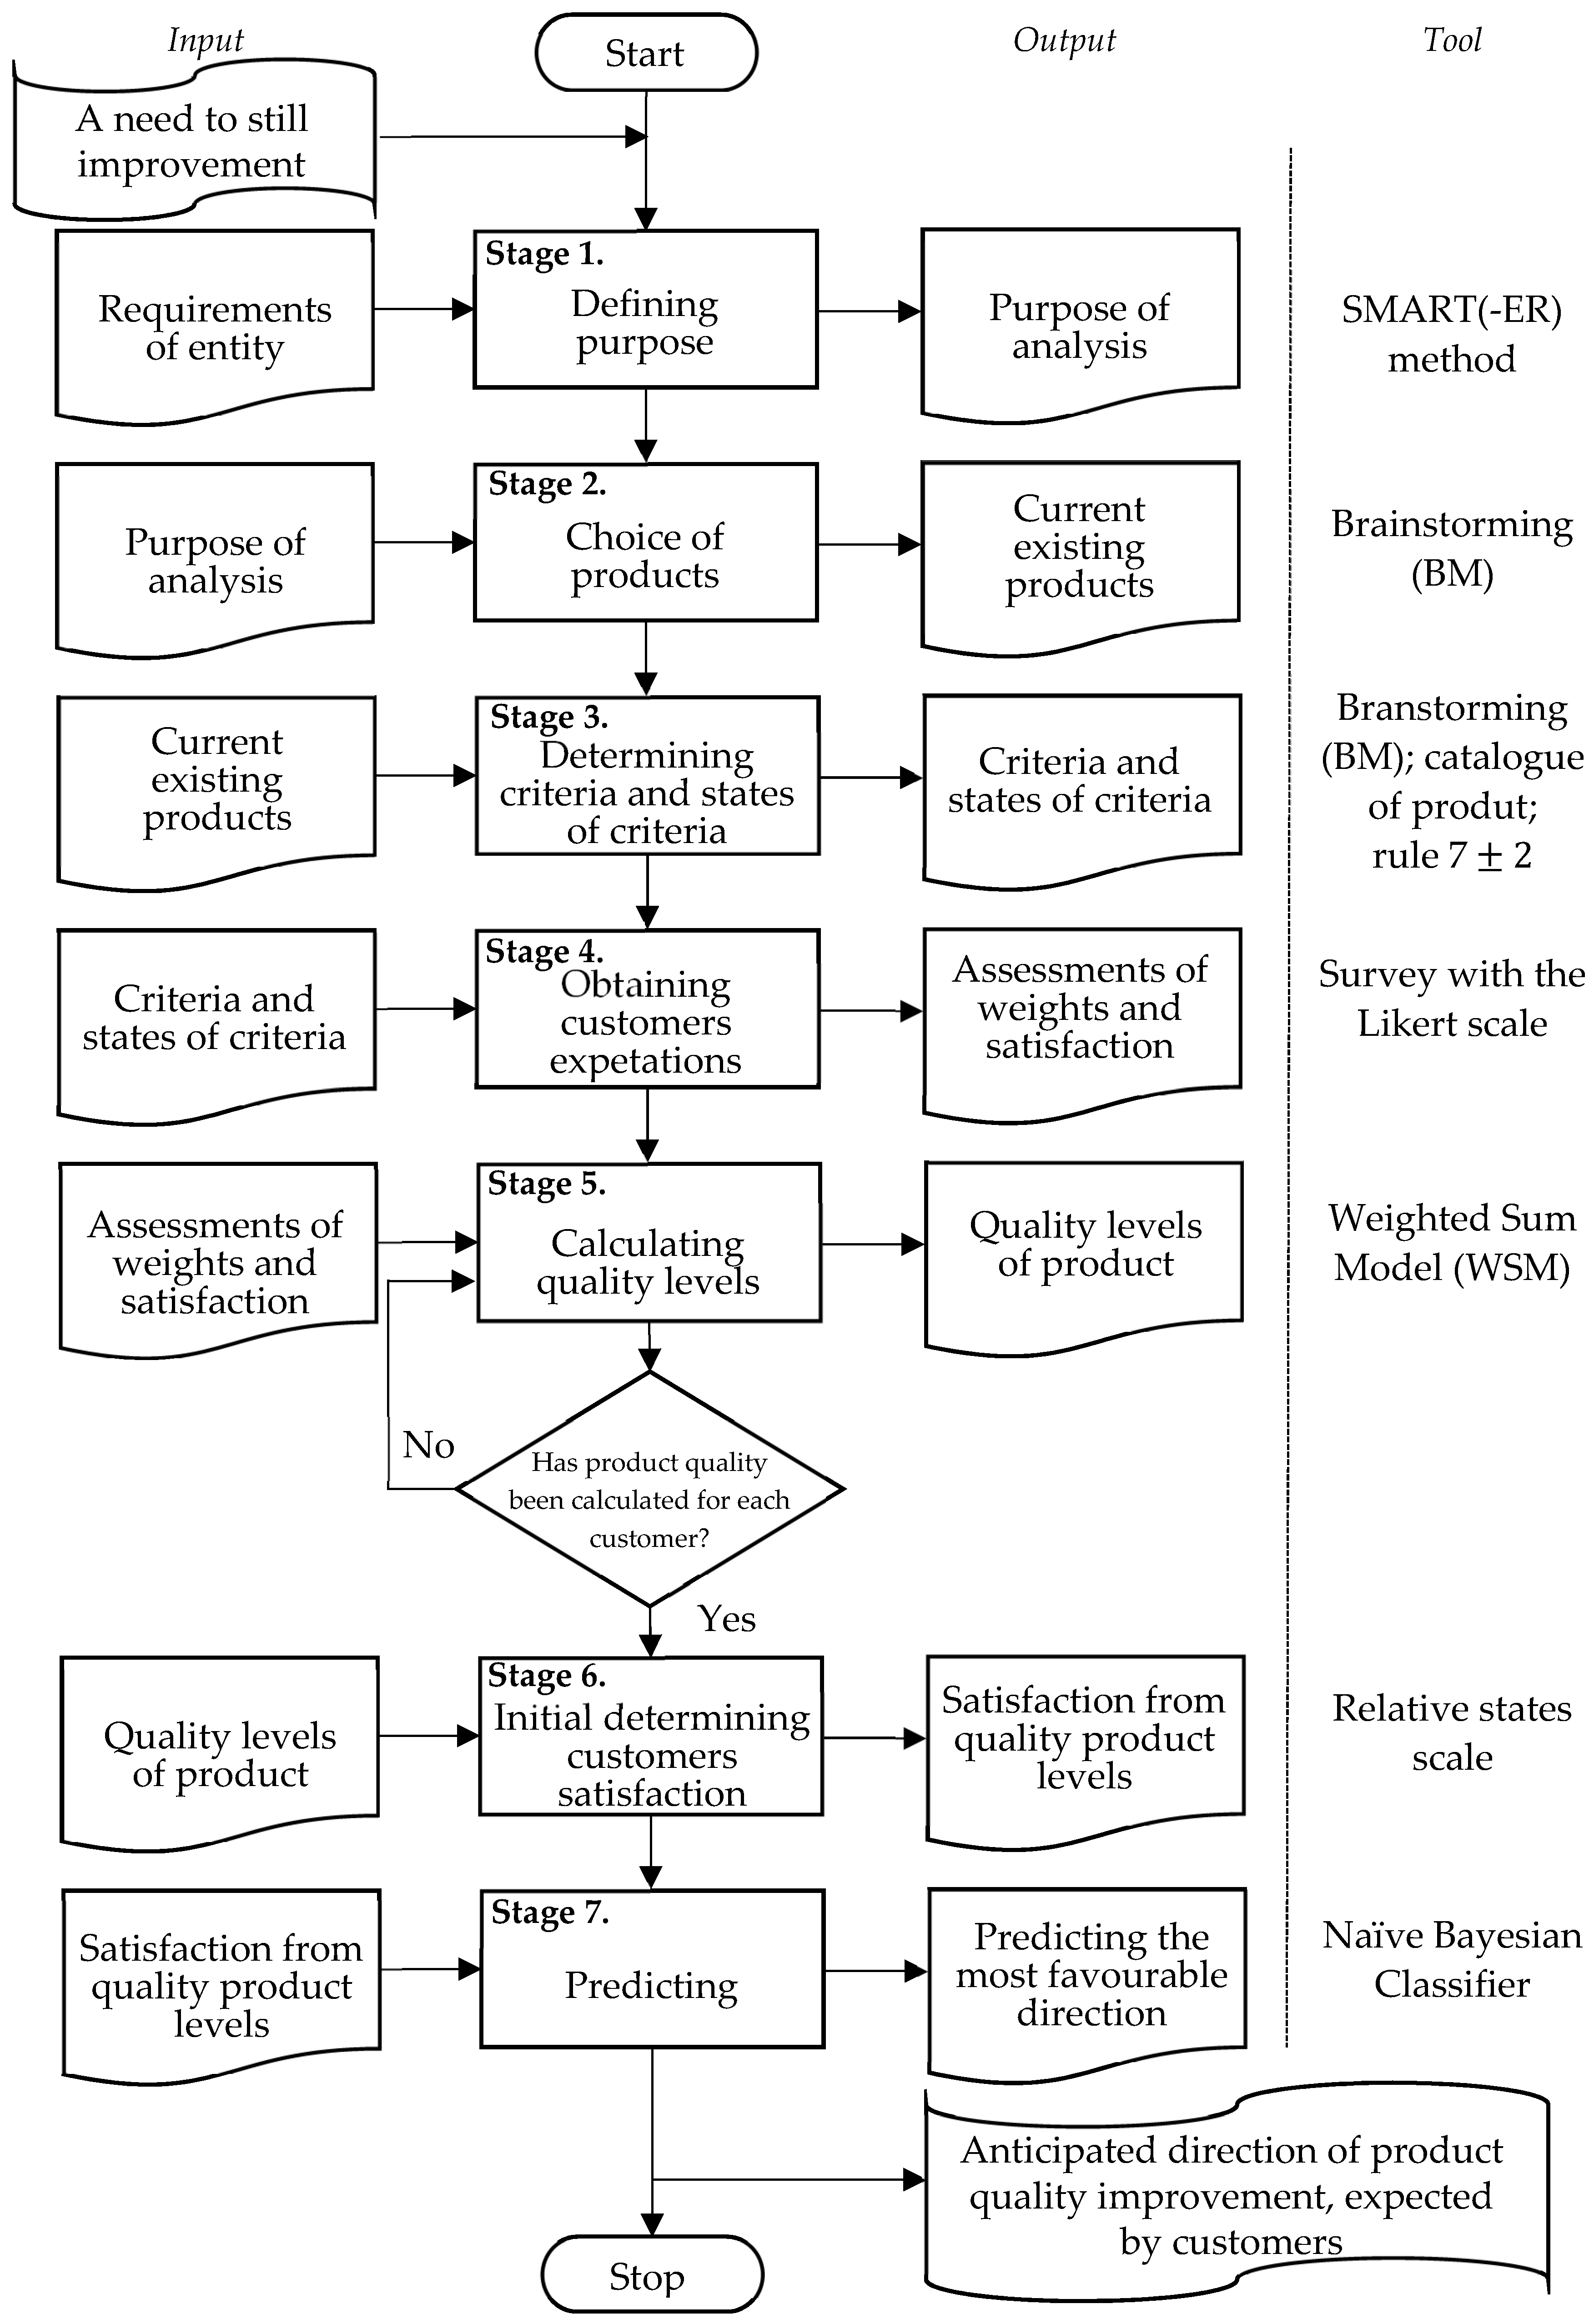
The model was developed in seven main stages: stage 1—defining purpose, stage 2—choice of products, stage 3—determining criteria and criteria states, stage 4—obtaining customer expectations, stage 5—calculating quality level, stage 6—initial determination of customer satisfaction, and stage 7—predicting the expected direction of product quality improvement. The developed model is shown in Figure 2.
A brief description of the characteristics of the model stages is shown the next part of study.
- Stage 1. Definition of purpose
In the proposed approach, the purpose is to predict the direction of product improvement expected by customers according to the criteria states. For precision determination purposes, the SMART(-ER) method is used [55].
- Stage 2. Choice of products
It is assumed that the proposed model is universal, i.e., has applications for any product and can be used by any entity (expert, broker, or bidder). Therefore, the choice of products for analysis is not limited and results from a preference of the entity. It is necessary to choose products of the same type. These can be products (of the same type) of a single entity [1]. The brainstorming method (BM) can be used among a team of experts [33]. The maximum number of all products for verification is 7 , as shown in [3,40,52,53].
- Stage 3. Determining criteria and state of criteria
The criteria are attributes (features) of products. These criteria are determined by brainstorming (BM) [33] realized by a team of experts. Toward this aim, it is necessary to base it on the catalog (specify) of the product. After a review of the literature, it is assumed that it is necessary to determine from 14 to 25 criteria [3,43,45,46]. It is preferred to determine criteria in qualitative and quantitative groups. During the choice of criteria, it is necessary to include the impact of criteria on the quality of the product, i.e., criteria that generate customers’ satisfaction with the utility of the product. These criteria are current criteria for products by the same producer.
After determining the criteria, it is necessary to determine the states of these criteria. These states are determined in the catalog (specification) of the product. The maximum number of all states for verification is 7 , as shown in [3,40,52,53]. This results from the model concept, i.e., defining the direction of product improvement. The states for qualitative criteria are determined as descriptions. The states for quantitative criteria are determined as values. It is possible to perform brainstorming (BM) by including the company’s production capacity, results from prior improvement actions, or historical data.
- Stage 4. Obtaining customer expectations
The obtaining of customers’ expectations refers to their requirements of product criteria. Toward this aim, the popular and most often tool is used, that is, the survey with the Likert scale [1,34,35,36]. In turn, to estimate the required number of customers from which expectations are required, the method for estimating the sample size to predict is used, as shown in [1].
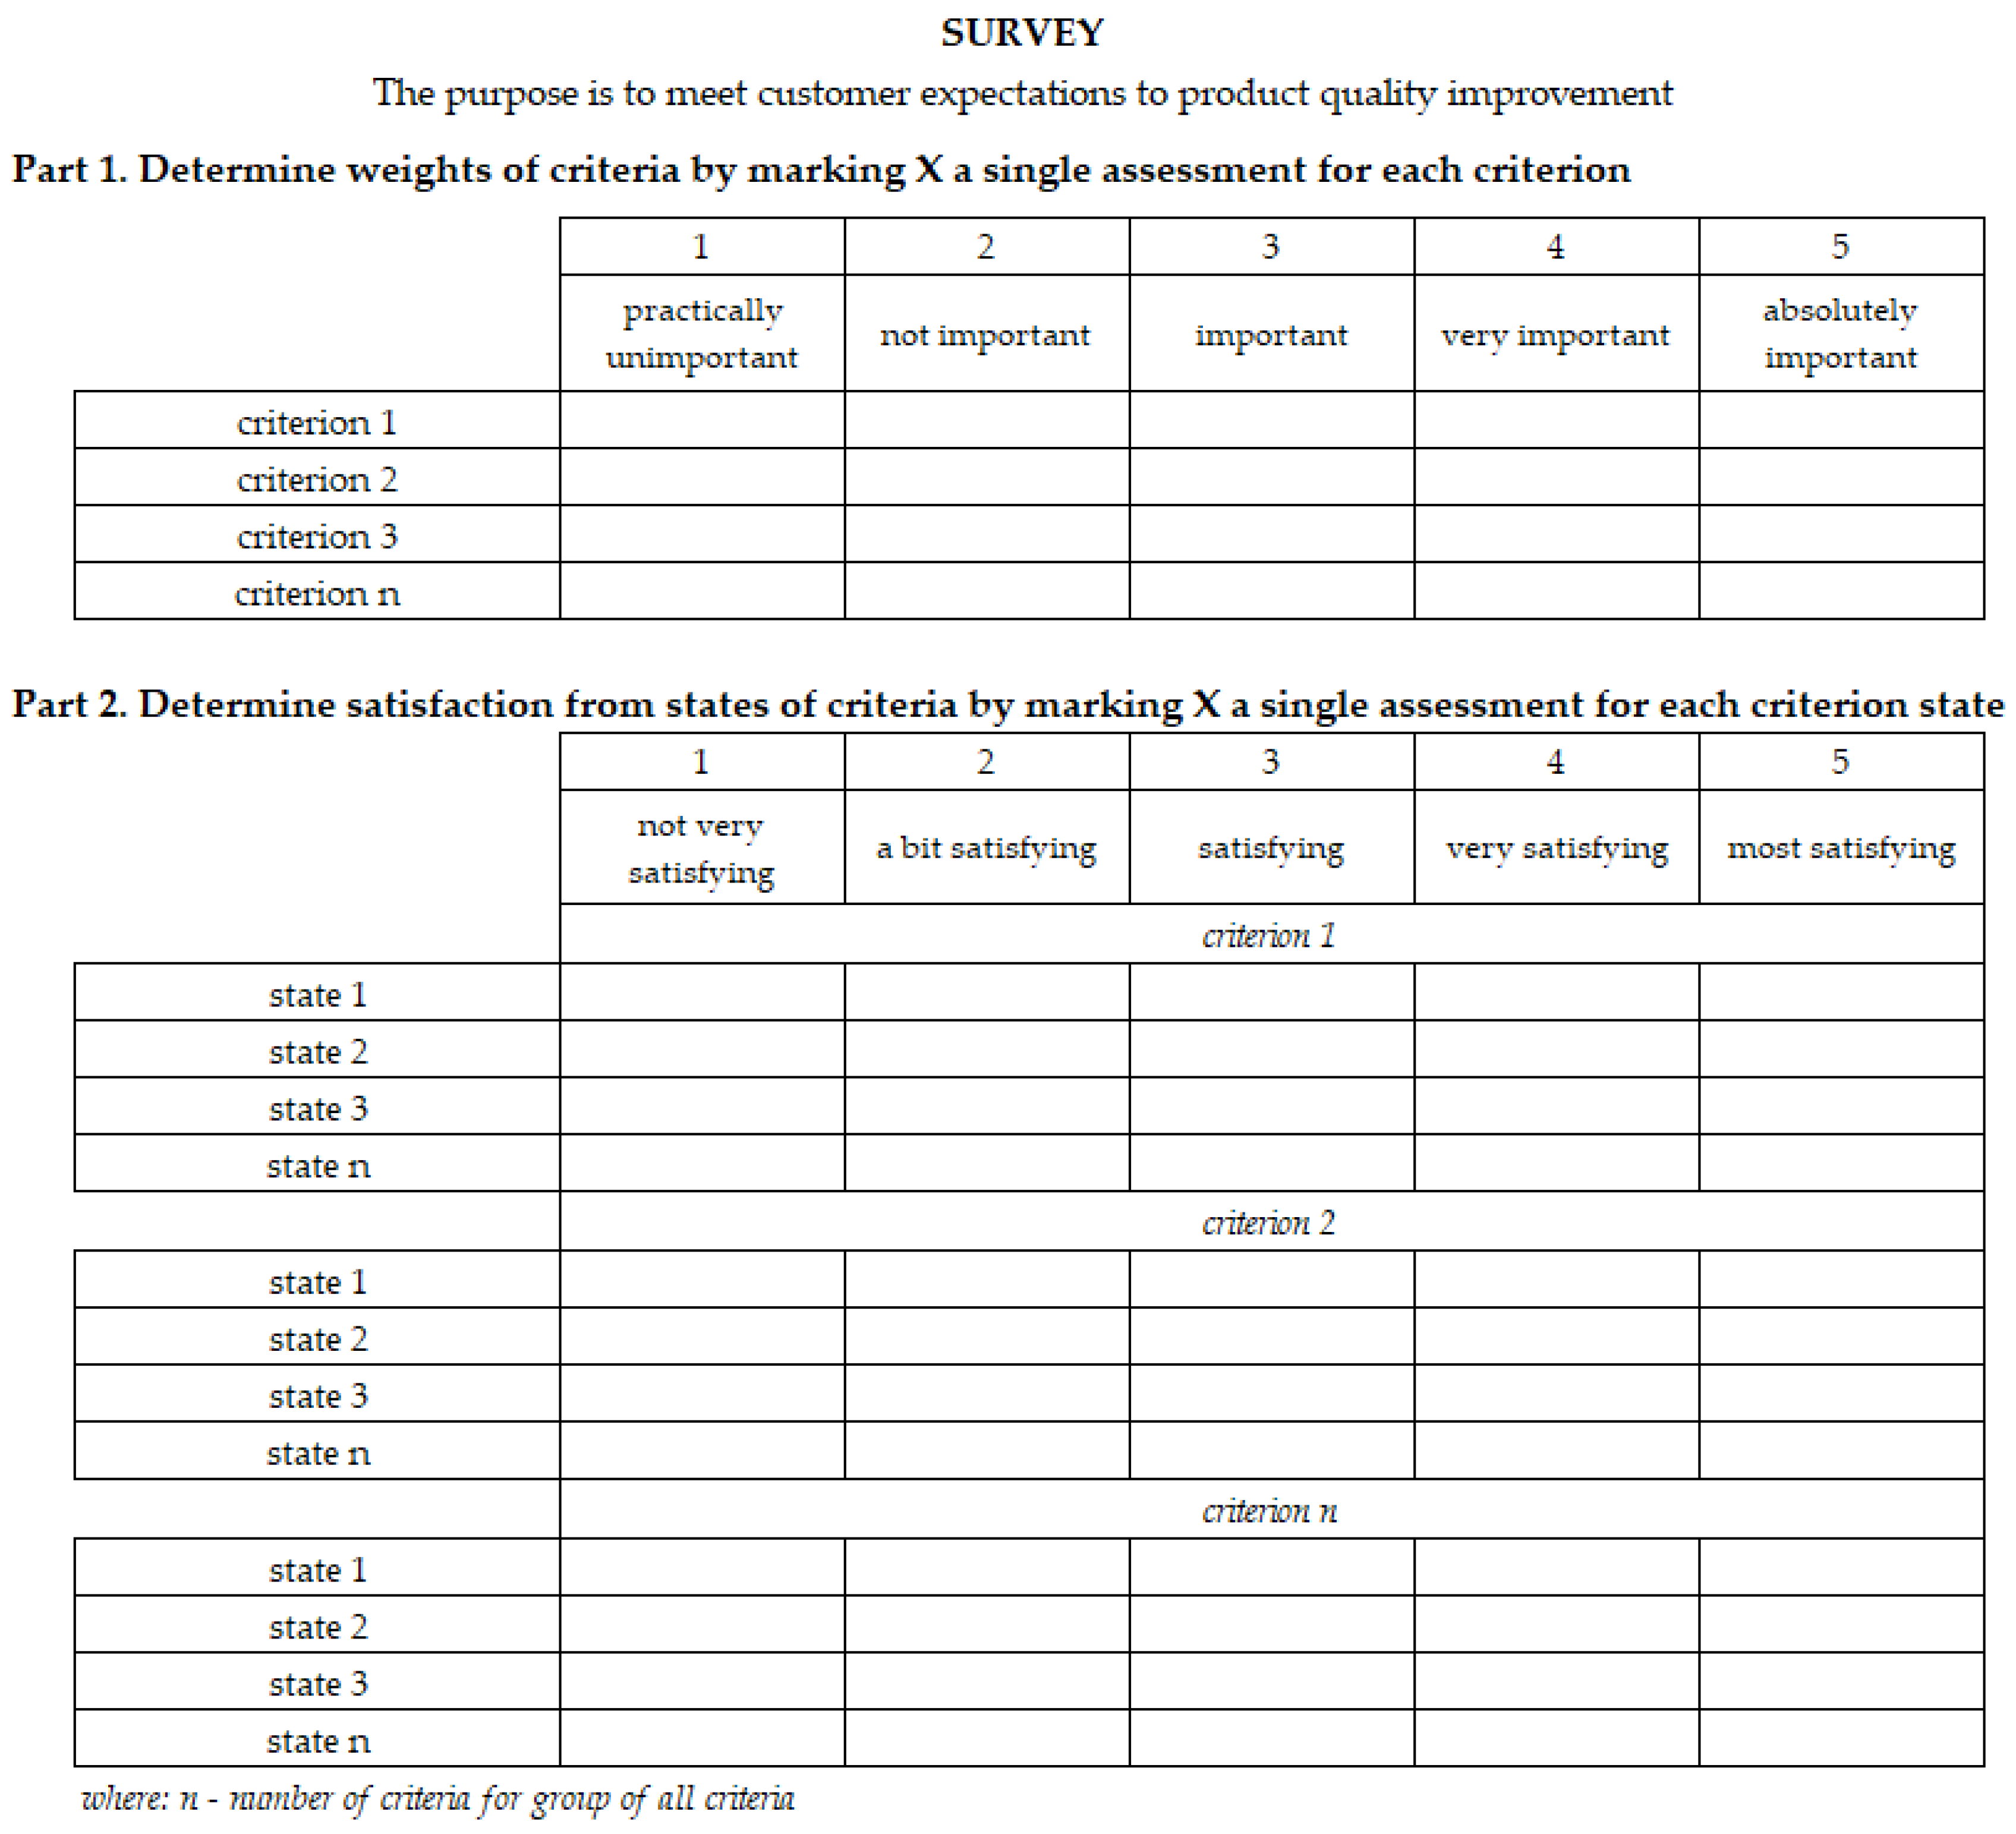
The survey should consist of two parts, i.e., the first part—assessment of the importance of criteria, and the second stage—assessment of the satisfaction of quality of criteria states. It is necessary to assess the importance of all product criteria selected in the third stage of the model, where 1 is a practically relevant criterion and 5 is the most important criterion.
In addition, satisfaction with the quality of all criteria states determined in the third stage of the model is necessary, where 1 is a state that is not very satisfying and 5 is a state with the most satisfaction [34,36]. If the product criteria are not well known by the customer, it is recommended that the entity (expert, bidder, or broker) assists the customer in completing the survey. An example of the survey form is shown in Figure A1.
The customers’ expectations are processed in the next stages of the model, as shown in the next part of the work.
- Stage 5. Calculating the quality level
To calculate the quality level, it is assumed that the WSM method (Weighted Sum Model) is not complicated [3]. The choice of the method results from its usefulness in assessing product quality with respect to the weighting of the criteria and the evaluation of the quality of these criteria [37,38]. Additionally, the method does not take into account the units of measurement of the criteria, so there is no need to normalize the customer ratings [49]. It is necessary to estimate the quantity of product separately for each customer. Quality is estimated separately from the assessment of product states. The formula for calculating the product quality in the WSM method is shown in Equation (1) [3,37,38,39]:
where: w—assessment of the importance of the criterion, x—assessment of satisfaction with the state of the criterion, n—customer, i—criterion, j—state of the criterion, i, j, n = 1, …, m.
It is assumed that the product quality level should be shown as decimal values; therefore, Equation (2) is used:
where the symbols are as in Equation (1).
It is necessary to process all product quality levels () into decimal values (). This results from the need to classify product levels according to the assumptions, which are described in the next stage of the model.
- Stage 6. Initial determination of customer satisfaction
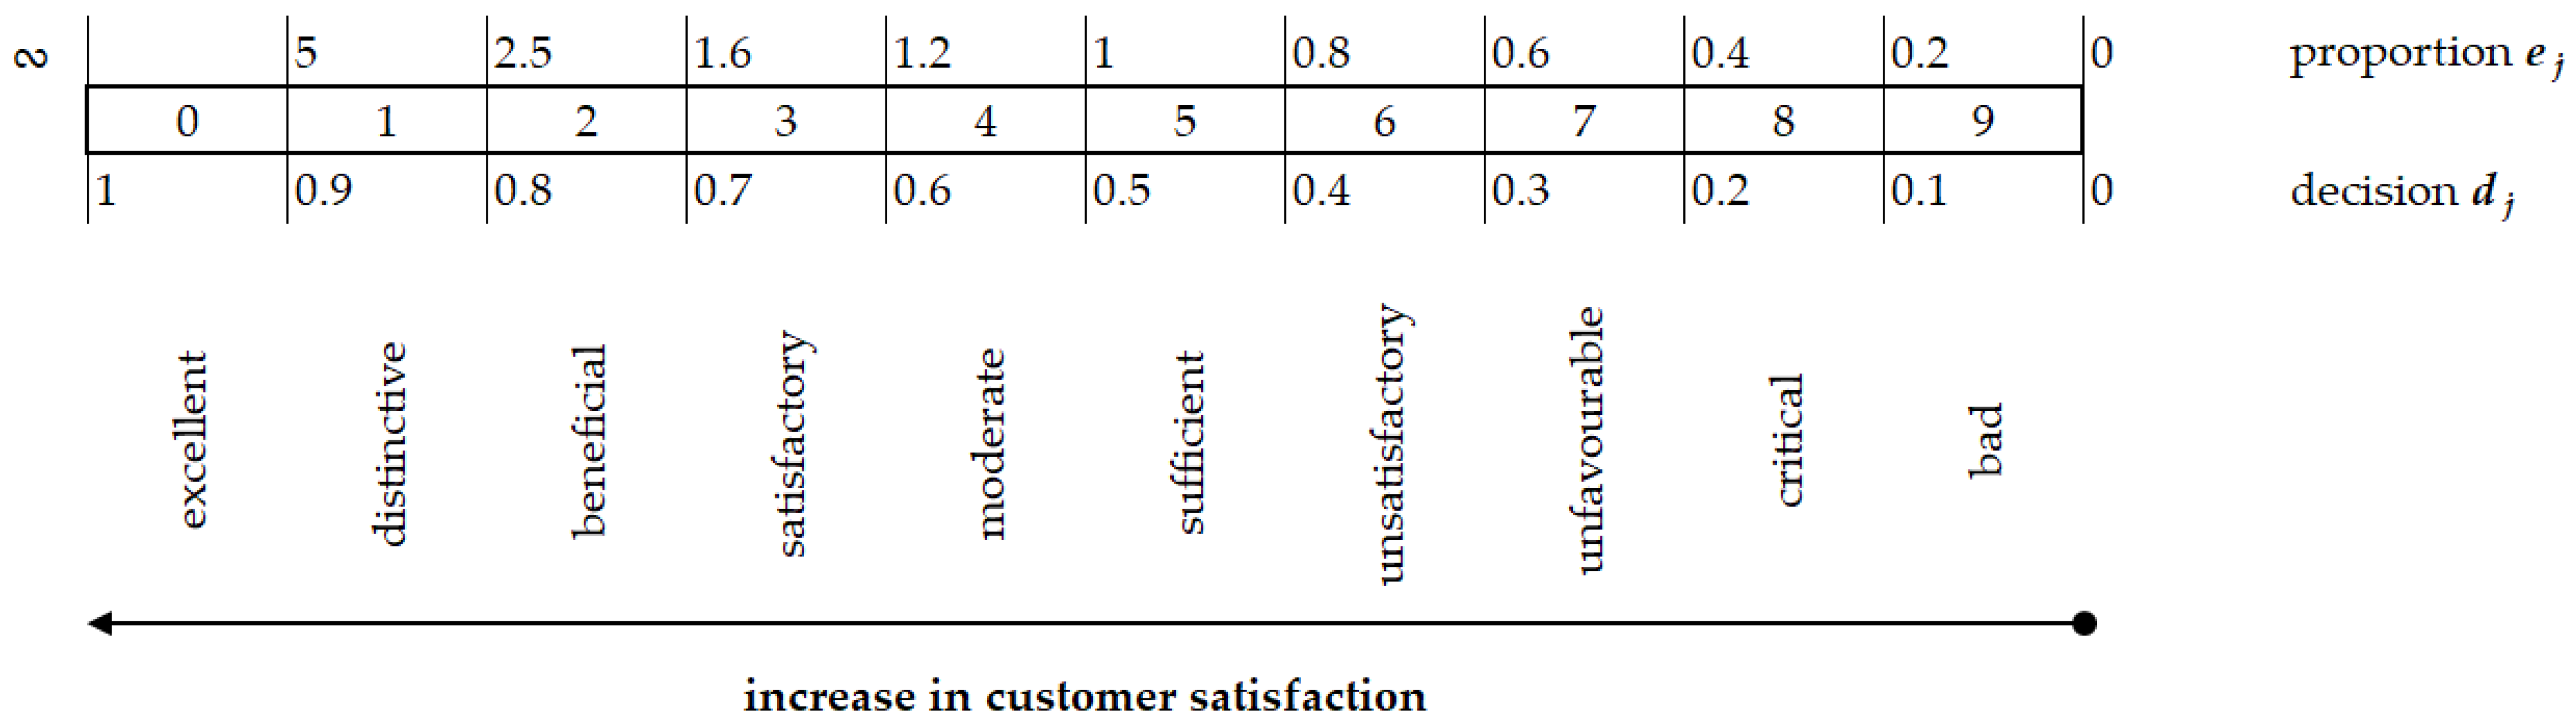
This stage relies on initially determining customers’ satisfaction from quality product levels (). It refers to marking the state of customer satisfaction for each product quality level. Following [3,4,40], it is assumed that satisfaction states are determined according to the relative state scale (Figure 3).
If the sample size is not large enough (e.g., n < 100), the relative state scale is not effective. The alternative way is to determine the initial customers’ satisfaction according to the proportion of values for the estimated product quality levels. It is shown by Equation (3):
where the symbols are as in Equation (1).
Initially determining customers’ satisfaction results from the need to describe each additional value of the product quality level (i.e., in linguistic terms), where it is necessary to realize the next stage of the model.
- Stage 7. Predicting the expected direction of product quality improvement
The last stage of the model is predicting the expected direction of improvement in product quality improvement. It is necessary to base it on product quality levels () and determine initial customers’ satisfactions (i.e., from sixth stage). It refers to predicting which states of criteria included in product quality are most preferred by customers. To predict the expected direction of improvement in product quality improvement, Naïve Bayesian Classifier (NBC) is assumed [41,42,43,44]. The choice of NBC results from its effectiveness in predicting the quality of any data (qualitative and quantitative), and in this case, it refers to results from the initial classification of the quality of the product. Additionally, the NBC is supported in program software, e.g., STATISTICA 13.3. Hence, its application can be effective and not complicated. The use of NCB by making calculations is shown in the next part of the study.
The Naive Bayesian Network is a graphical model that presents conditional dependence between random variables, i.e., directed acyclic graph (DAG). In the Bayesian Network, it is possible to approximate the total distribution of probability, resulting from the possibility of decomposing the distribution into a conditional probability product for each variable. If is set of discrete variables, can take a value from the set . Therefore, for , where has a state k, the combined probability distribution is determined by Equation (4) [41,43]:
where: —set of variables in G. For structure G, is used as a designation of parents. In turn, is the conditional parameter of probability = k when the observed parent instance and , where . The Bayesian Network is the pair .
In this view, the BN structure shows conditional theorems about independence in the probability distribution by d-separation. Initially, the collider is determined as well as its d-separation. According to this, the path is a sequence of nearby variables, where the collider is determined according to these definitions [41,42]:
Definition 1.
Assuming the structureexists, variableon pathif and only if there exist two different edges coming to Z from noncontiguous variables.
Definition 2.
Assuming the structureexists, X, YV, ZV\, and two variables X and Y are d-separable, given Z in G, then and only then q between X and Y meets one of the two conditions, i.e., Z contains noncollider on q, or the collider is Z on q, when Z not includes Z and its descendants.
According to [41], the d-separation between X and Y is determined in the Z structure G as Two variables are d-connected if they are not d-separable. Therefore, if the existing x, Y, Z V, and X and Y are not adjacent to each other, there are three types of connections existing with d-separation: serial connection ( divergent connection ( combination of convergence (). These combinations are correct if the following theorem holds:
Theorem 1.
Assuming the structureexists, X, YV, and ZV\, when existing convergent connection, when:or
If G has a serial connection (X or diverg (X, there are two negations for this theorem.
These theorems are also balanced with Markov’s theory if there are identical d-separations, i.e., [41,42,44]:
Definition 3.
Letandbe two DAGs, thenandare called Markov counterparts, if (5):
Following [41], a theorem for Markov equivalence is assumed:
Theorem 2.
Two DAGs are Markov-equivalent when they have the same combination (without including destination) and have the same combination convergence.
According to where X and Y are conditionally independent and included in Z as a true combined probability distribution , the Naïve Bayes structure (G) is an independent map (I-map) when all d-separations belonging to G are related to conditional independence in i.e., [41,44]:
Definition 4.
Assuming that the true cumulative probability distributionof random variables belongs to V set andstructure, when G is I-map, if equal, (6) is satisfied:
Then, the probability distributions in are combined in P for a large enough sample. Therefore, Naive Bayesian learning is realized for each when it is a set of data consisting of N iterations, and when each of them ( is a vector
The set of variables Z V is determined as when the number of samples Z = j belongs to the set D and is defined as for the number of samples equal to Then, in D. Furthermore, the table of frequency connections is determined and the table of frequency conditions ; therefore, there is a list of for j = 1, …, and for for i = 0, …, n; j = 1, …, , and k = 1, …,
The probability (B) in the Naïve Bayesian for D is determined by Equation (7) [41,43]:
where: is presented as The estimator of the larger credibility () is determined as Equation (8) [41,42]:
The most popular parameter of Naïve Bayes is expected a posteriori (EAP) from Equation (9), which is expected ) for density from Equation (10), which is the assumed a priori density from Equation (11) [41,43,44]:
where: —hyperparameters for distributions .
Depending on the data, the BN structure is created. In turn, to learn the I-map for a minimum number of parameters, it is necessary to maximize results, i.e., [41]:
Definition 5.
For structuresand, the scoring criterion has an asymptotic dimension, if the sample size is large enough, and if:is I-map andis not I-map, thenif the maps areand, and ifincludes fewer parameters thanthen
Hence, the scoring is asymptotically consistent. If the density is as in Equation (1), then ML is determined as Equation (12) [41,42]:
Therefore, NB classification refers to variable class and variables of a function for which c class is created by the maximization probability a priori , as in Equation (13) [41,42,43,44]:
where: if and , where x and ; otherwise, C—set of elements of variable class
A more detailed description of the Naïve Bayesian Classifier is shown in [41]. The NCB should be used separately to predict customers’ satisfaction from quality levels, as a result of ranges of product criteria states. Then, it would be possible to determine the destination of product improvement, i.e., states of criteria expected by customers. Then, it would possible to limit production to unsatisfactory products and thus define the direction of product development and improvement.
4. Test of Model
A test of the model was carried out for photovoltaic panels (PVs) of the key EU producer. The choice of photovoltaics resulted from the fact that, currently, it is one of the most popular instruments of RES [2,58,59]. The dynamical development of photovoltaics puts pressure on companies, which can make hasty production decisions. It was considered that this test would allow the demonstration that even for highly developed products, it is good to verify customer satisfaction on an ongoing basis and determine the appropriate direction of improvement activities. However, this model can be used for any product.
As part of the first and second stages of the model, the purpose of the analysis was determined and also selected. The test of the model was carried out for PVs. Therefore, the purpose was to predict the direction of improvement of photovoltaic panels expected by customers, and the direction of photovoltaic panels improvement according to the states of criteria.
As part of the third stage of the model, the PV criteria and states of these criteria were determined. According to the concept, the fourteen criteria in the qualitative and quantitative groups were determined. These criteria were determined during the brainstorming method (BM), based on the product catalog (specification) of products, and after the literature review [3,60,61,62,63,64,65]. These criteria were as follows:
- Rated power (Wp);
- Short-circuit current (current at maximum load) (A);
- Maximum (output) current (A);
- Open-circuit voltage (no load, open circuit) (V);
- Efficiency (%);
- Front glass (mm);
- Dimensions (mm);
- Number of cells;
- Temperature coefficient of intensity (%/C);
- Visibility;
- Degree of integration;
- Light reflection;
- Fractality;
- Pattern (texture).
The characteristic of these criteria is shown in [3].
Then, states were determined for all selected criteria. These states were determined according to the actual specification of these products and also during brainstorming (BM). The number values were determined for qualitative criteria. For qualitative criteria, states were determined by description. The results are shown in Table 1.
These PV criteria and their states were used in the next stages of the model. The fourth stage of the model were the customers’ expectations about states of the PV criteria. It referred to obtaining customers’ expectations about the weights (importance) of criteria and assessment of customers’ satisfaction with criteria states. The survey with the Likert scale was used for this. As part of the initial research (test of the proposed model), the expectations of the seventh customers were obtained. These expectations were processed in the next stage of the model.
The fifth stage relied on the calculation of the quality level of photovoltaic panels, and the WSM method was used for this. Assessments of the importance of PV criteria and assessments of satisfaction for the PV criteria states were included. According to Equation (1), the quality of PVs was calculated separately from the assessments of each customer. The quality of photovoltaics was calculated for three ranges of states of criteria. Then, according to Equation (2), values of PV quality () were processed into decimal values ().
Then, the initial determination of the satisfaction was made from PV quality level () using Equation (3), about which levels of customer satisfaction from the quality of PV were determined. The following levels of satisfaction were determined, as shown in Equation (14):
The results from the fifth and sixth stages of the model are shown in Table 2.
In the last stage of the model, the expected direction of improving the quality of the photovoltaic panel was predicted. It was based on PV quality levels () and initial customers’ satisfaction, as shown in Table 2. The purpose was to predict which quality level (simultaneously the state of criteria) was most preferred by customers. The Naïve Bayesian Classifier was used to predict the expected direction of PV improvement. NBC was used in STATISTICA 13.3 (in: Data Mining, Other Methods Machine Learning). The NBC was used three times, i.e., for states (1), (2), and (3). As qualitative dependent variables, the initial customers’ satisfaction from PV quality was assumed. Quantitative predictors were PV quality. The NBC results are shown in Table 3.
The quality of the product estimated according to state (1) was predicted to be somewhat satisfactory (0.57). Then, the quality of the product estimated according to state (2) was predicted to be not very satisfying (0.43). In turn, the PV quality for state (3) was predicted to be very satisfying (0.43). Therefore, it was concluded that the most preferred direction for PV improvement was quality level, including states marked as (3). The entity is expected to choose the PV improvement direction according to certain expected states of the PV criteria to achieve states that are satisfactory to customers.
5. Discussion
The turbulent environment and dynamical changes in customer expectations cause organizations to strive to achieve customer satisfaction [3]. It is favorable to predict these expectations in this context [1,40]. As a result of the need to react to changes in customers’ requirements in time, various instruments have been sought to assist organizations (an entity, i.e., an expert, broker, or bidder) in predicting how to change a product to a satisfactory quality level. This problem also refers to RESs, which are mainly dynamically developing photovoltaic panels (PV), which are still growing in number and type with different parameters. According to the sustainable development of products (and including the idea of continuous improvement), it is favorable to produce relatively limited kinds of products [4,40,57]. The most preferred is limited production for only the most satisfactory products. For that, it is good to improve existing products [1]. Then, the customer would be able to determine more precisely what they need (future products). However, this problem does not only affect PVs but other products as well. Although various advanced machine learning methods have been used, such as RUBoost [28], transferred recursive neural network (RNN), migrated Gaussian process regression (GPR) [30], or out of bag random forests (RF), change Gini, and association measure prediction (PMOA) [31], searches are still ongoing for a way to determine the direction of improvement of these products. Furthermore, there has been no work on predicting product quality, in which this prediction would be realized for the current state of product features and, at the same time, for customer satisfaction. Therefore, the purpose was to develop a universal model to predict the expected direction of product quality improvement. The concept of the model was to determine the preferred product quality according to the importance of the product criteria and the status ranges of the customer ratings for the product criteria. A test of the proposed model was carried out for photovoltaic panels (PV) of a key producer from EU countries. It was shown that it is possible to predict the destination of product quality improvement according to customer expectations determined based on the current quality of the product. Moreover, it was confirmed that it is possible to predict the direction of product quality improvement according to the quality of products estimated based on the assessment of weights (importance) of criteria and the satisfaction from states of criteria.
The following are the main benefits of the proposed model:
- Estimating product quality according to assessment of the importance of criteria and assessments of satisfaction with states of these criteria;
- Determining customers’ satisfaction with product quality levels;
- Predicting the direction of eventual changes in the product to meet customers’ satisfaction;
- Reduction in waste sources by determining adequate improvement actions;
- Sustainable development of existing products, which can be in the maturity or decline phase;
- Possibility to predict the direction of products improvement based on a small number of customers;
- Possibility to use the model by any entity;
- Possibility to use the model for any product.
Additionally, the model has business benefits:
- Supporting entity in making the right decision during the process of improving the product;
- Low-cost model, which can also be supported by a software program;
- Choice of the appropriate direction of product improvement;
- Support for planning and design activities;
- Predicting ahead of the competition the direction of product improvement.
In turn, the main limitations of the proposed model are that it is not resistant to changes in customer expectations over time. Additionally, the model does not indicate which criteria should be improved first. Moreover, the measurement and shift noise would greatly affect the prediction performance. Although the proposed model is based on the current (actual) states of product attributes, which will reduce these noises, these aspects are limitations of the model. This was an initial verification. However, future research anticipates more verification for different products. The main goal of this research was to validate the model developed.
Therefore, as part of future research, it is planned to extend the model to the stage of the verification of the order of the criteria change. In addition, research will be performed for a larger group of customers. Additionally, future research will focus on reducing measurement and shift noise.
6. Conclusions
Improving product quality still is a challenge. The main problem is improving products according to sustainable development rules. In this context, it refers to products that are still growing in number and type (e.g., different parameters), and the satisfaction from these products is still not fully recognized. One such product is photovoltaic panels, which are a key tool for renewable energy sources. It is important to mention that the increase in their production and implementation in households has intensified. Photovoltaic panels, apparently having the same parameters, are increasingly and significantly diversifying. However, instruments that show how to direct production to meet customer satisfaction are still being sought.
Therefore, the purpose was to develop a universal model to predict the expected direction of product quality improvement The proposed model was carried out by combined instruments, that is: SMART(-ER) method, brainstorming (BM), survey with the Likert scale, WSM method, relative states scale, and Naïve Bayesian Classifier (NBC). The model was tested on the aforementioned photovoltaic panels of one of the key EU producers. In the analysis, fourteen criteria were included, i.e., rated power (Wp), short-circuit current (current at maximum load) (A), maximum (output), current (A), open-circuit voltage (no load, open circuit) (V), efficiency (%), front glass (mm), dimensions (mm), number of cells, temperature coefficient of intensity (%/C), visibility, degree of integration, light reflection, fractality, and pattern (texture). The state ranges of the criteria were defined for these criteria. Then, the customers’ expectations were obtained. A survey with the Likert scale was used. Customers assessed the importance of PV criteria and satisfaction for the states of these criteria. The quality levels of the photovoltaics were estimated based on customer expectations using the WSM method. Then, the initial satisfaction for individual customers was determined. Based on this, the expected direction of PV improvement was predicted using the Naive Bayesian Classifier. It was predicted that the most preferred direction of PV improvement was the quality level state of criteria marked as (3). It was envisaged that the entity should choose the direction of improvement according to certain expected states of the photovoltaic criteria in order to achieve the states that are satisfactory to the customers.
The test of the model confirmed its efficiency in predicting the direction of improvement in product quality improvement. Hence, the model can be a useful tool to predict the expected direction of any product by any entity.
Author Contributions
Conceptualization, A.P., D.S. and G.O.; methodology, A.P. and D.S.; formal analysis, D.S. and G.O.; writing—original draft preparation, D.S. and G.O.; writing—review and editing, A.P.; visualization, A.P. and D.S.; supervision, A.P.; project administration, A.P., G.O. and D.S. All authors have read and agreed to the published version of the manuscript.
Funding
This research received no external funding.
Institutional Review Board Statement
Not applicable.
Informed Consent Statement
Not applicable.
Data Availability Statement
Not applicable.
Conflicts of Interest
The authors declare no conflict of interest.
Appendix A
Figure A1.
Survey form to obtain customers’ expectations. Own study.

References
- Siwiec, D.; Pacana, A. A Pro-environmental method of sample size determination to predict the quality level of products considering current customers’ expectations. Sustainability 2021, 13, 5542. [Google Scholar] [CrossRef]
- Pacana, A.; Pasternak-Malicka, M.; Zawada, M.; Radon-Cholewa, A. Decision support in the production of packaging films by cost-quality analysis. Przemysl Chem. 2016, 95, 1042–1044. [Google Scholar] [CrossRef]
- Siwiec, D.; Pacana, A. Model of choice photovoltaic panels considering customers’ expectations. Energies 2021, 14, 5977. [Google Scholar] [CrossRef]
- Ulewicz, R.; Siwiec, D.; Pacana, A.; Tutak, M.; Brodny, J. Multi-criteria method for the selection of renewable energy sources in the polish industrial sector. Energies 2021, 14, 2386. [Google Scholar] [CrossRef]
- Tawalbeh, M.; Al-Othman, A.; Kafiah, F.; Abdelsalam, E.; Almomani, F.; Alkasrawi, M. Environmental impacts of solar photovoltaic systems: A critical review of recent progress and future outlook. Sci. Total Environ. 2021, 759, 143528. [Google Scholar] [CrossRef] [PubMed]
- López, G.; Ramírez, D.; Alonso-Montesinos, J.; Sarmiento, J.; Polo, J.; Martín-Chivelet, N.; Marzo, A.; Batlles, F.J.; Ferrada, P. Design of a low-cost multiplexer for the study of the impact of soiling on PV panel performance. Energies 2021, 14, 4186. [Google Scholar] [CrossRef]
- Shaito, A.; Hammoud, M.; Kawtharani, F.; Kawtharani, A.; Reda, H. Power enhancement of a PV module using different types of phase change materials. Energies 2021, 14, 5195. [Google Scholar] [CrossRef]
- Amaral, T.G.; Pires, V.F.; Pires, A.J. Fault detection in PV tracking systems using an image processing algorithm based on PCA. Energies 2021, 14, 7278. [Google Scholar] [CrossRef]
- Pandey, A.; Pandey, P.; Tumuluru, J.S. Solar energy production in India and commonly used technologies—An overview. Energies 2022, 15, 500. [Google Scholar] [CrossRef]
- Trela, M.; Dubel, A. Net-metering vs. net-billing from the investors perspective—Impacts of changes in RES financing in Poland on the profitability of a joint photovoltaic panels and heat pump system. Energies 2022, 15, 227. [Google Scholar] [CrossRef]
- Kshatri, S.S.; Dhillon, J.; Mishra, S.; Tariq, R.; Sharma, N.K.; Bajaj, M.; Rehman, A.U.; Shafiq, M.; Choi, J.-G. Reliability analysis of bifacial PV panel-based inverters considering the effect of geographical location. Energies 2022, 15, 170. [Google Scholar] [CrossRef]
- Kusznier, J.; Wojtkowski, W. IoT solutions for maintenance and evaluation of photovoltaic systems. Energies 2021, 14, 8567. [Google Scholar] [CrossRef]
- Aguilar, F.J.; Ruiz, J.; Lucas, M.; Vicente, P.G. Analiza i optymalizacja wydajności słonecznego klimatyzatora on-grid. Energies 2021, 14, 8054. [Google Scholar] [CrossRef]
- Al Siyabi, I.; Al Mayasi, A.; Al Shukaili, A.; Khanna, S. Effect of soiling on solar photovoltaic performance under desert climatic conditions. Energies 2021, 14, 659. [Google Scholar] [CrossRef]
- Griffin, A.; Hauser, J. The voice of the customer. Mark. Sci. 1991, 12, 1–27. [Google Scholar] [CrossRef]
- Ben Hamad, K.; Luta, D.N.; Raji, A.K. A grid-tied fuel cell multilevel inverter with low harmonic distortions. Energies 2021, 14, 688. [Google Scholar] [CrossRef]
- El-Bayeh, C.Z.; Zellagui, M.; Shirzadi, N.; Eicker, U. A novel optimization algorithm for solar panels selection towards a self-powered EV parking lot and its impact on the distribution system. Energies 2021, 14, 4515. [Google Scholar] [CrossRef]
- Mutani, G.; Todeschi, V. Optimization of costs and self-sufficiency for roof integrated photovoltaic technologies on residential buildings. Energies 2021, 14, 4018. [Google Scholar] [CrossRef]
- Stamatellos, G.; Zogou, O.; Stamatelos, A. Energy performance optimization of a house with grid-connected rooftop PV installation and air source heat pump. Energies 2021, 14, 740. [Google Scholar] [CrossRef]
- Abdallah, R.; Natsheh, E.; Juaidi, A.; Samara, S.; Manzano-Agugliaro, F. A multi-level world comprehensive neural network model for maximum annual solar irradiation on a flat surface. Energies 2020, 13, 6422. [Google Scholar] [CrossRef]
- Nguyen, D.P.N.; Lauwaert, J. Calculating the energy yield of si-based solar cells for belgium and vietnam regions at arbitrary tilt and orientation under actual weather conditions. Energies 2020, 13, 3180. [Google Scholar] [CrossRef]
- Gutiérrez Galeano, A.; Bressan, M.; Jiménez Vargas, F.; Alonso, C. Shading ratio impact on photovoltaic modules and correlation with shading patterns. Energies 2018, 11, 852. [Google Scholar] [CrossRef] [Green Version]
- Mousavi Maleki, S.A.; Hizam, H.; Gomes, C. Estimation of hourly, daily and monthly global solar radiation on inclined surfaces: Models re-visited. Energies 2017, 10, 134. [Google Scholar] [CrossRef] [Green Version]
- Gazda, A.; Pacana, A.; Malindzak, D. Study on improving the quality of stretch film by Taguchi method. Przemysl Chem. 2013, 92, 980–982. [Google Scholar]
- Garcia, A.Q.; Nishiumi, N.; Saito, A.; Matsumura, E.; Senda, J. Economic, environmental and energetic analysis of a distributed generation system composed by waste gasification and photovoltaic panels. Energies 2021, 14, 3889. [Google Scholar] [CrossRef]
- Chatterji, E.; Bazilian, D. Smart meter data to optimize combined roof-top solar and battery systems using a stochastic mixed integer programming model. IEEE Access 2020, 8, 1333843–1333853. [Google Scholar] [CrossRef]
- Niri, M.; Liu, K.; Apachitei, G.; Ramirez, L.; Lain, M.; Widanage, D.; Marco, J. Machine learning for optimised and clean Li-ion battery manufacturing: Revealing the dependency between electrode and cell characteristics. J. Clean. Prod. 2021, 324, 129272. [Google Scholar] [CrossRef]
- Liu, K.; Hu, X.; Meng, J.; Guerrero, J.; Teodorescu, R. RUBoost-based ensemble machine learning for electrode quality classification in Li-ion battery manufacturing. IEEE/ASME Trans. Mechatron. 2021, 10, 1–10. [Google Scholar] [CrossRef]
- Liu, K.; Peng, Q.; Sun, H.; Fei, M.; Ma, H.; Hu, T. A transferred recurrent neural network for battery calendar health prognostics of energy-transportation systems. IEEE Trans. Ind. Inf. 2022. [Google Scholar] [CrossRef]
- Liu, K.; Tang, X.; Teodorescu, R.; Gao, F.; Meng, J. Future ageing trajectory prediction for lithium-ion battery considering the knee point effect. IEEE Trans. Ind. Inf. 2022. [Google Scholar] [CrossRef]
- Liu, K.; Hu, X.; Zhou, H.; Tong, L.; Widanage, W.; Marco, J. Feature analyses and modeling of lithium-ion battery manufacturing based on random forest classification. IEEE/ASME Trans. Mechatron. 2021, 26, 2944–2955. [Google Scholar] [CrossRef]
- Lawlor, K.B.; Hornyak, M.J. Smart goals: How the application of smart goals can contribute to achievement of student learning outcomes. Dev. Bus. Simul. Exp. Learn. 2012, 39, 259–267. [Google Scholar]
- Kohn, N.; Smith, S. Collaborative fixation: Effects of others’ ideas on brainstorming. Appl. Cognit. Psychol. 2011, 25, 359–371. [Google Scholar] [CrossRef]
- Pacana, A.; Siwiec, D.; Bednarova, L. Analysis of the incompatibility of the product with fluorescent method. Metalurgija 2019, 58, 337–340. [Google Scholar]
- Joshi, A.; Kale, S.; Chandel, S.; Pal, D.K. Likert scale: Explored and explained. Curr. J. Appl. Sci. Technol. 2015, 7, 396–403. [Google Scholar] [CrossRef]
- Chmielarz, W.; Zborowski, M. On the assessment of e-banking websites supporting sustainable development goals. Energies 2022, 15, 378. [Google Scholar] [CrossRef]
- Garcia-Ayllon, S.; Hontoria, E.; Munier, N. The contribution of MCDM to SUMP: The case of Spanish cities during 2006–2021. Int. J. Environ. Res. Public Health 2022, 19, 294. [Google Scholar] [CrossRef] [PubMed]
- Tran, N.H.; Yang, S.-H.; Tsai, C.Y.; Yang, N.C.; Chang, C.-M. Developing transportation livability-related indicators for green urban road rating system in Taiwan. Sustainability 2021, 13, 14016. [Google Scholar] [CrossRef]
- Othman, A.A.; Obaid, A.K.; Al-Manmi, D.A.M.; Pirouei, M.; Salar, S.G.; Liesenberg, V.; Al-Maamar, A.F.; Shihab, A.T.; Al-Saady, Y.I.; Al-Attar, Z.T. Insights for landfill site selection using GIS: A case study in the Tanjero River Basin, Kurdistan Region, Iraq. Sustainability 2021, 13, 12602. [Google Scholar] [CrossRef]
- Siwiec, D.; Pacana, A. Model supporting development decisions by considering qualitative–Environmental aspects. Sustainability 2021, 13, 9067. [Google Scholar] [CrossRef]
- Sugahara, S.; Ueno, M. Exact learning augmented naive bayes classifier. Entropy 2021, 23, 1703. [Google Scholar] [CrossRef]
- Chen, H.; Hu, S.; Hua, R.; Zhaon, X. Improved naive Bayes classification algorithm for traffic risk management. EURASIP J. Adv. Signal. Process. 2021, 30, 1–12. [Google Scholar] [CrossRef]
- Zhang, W.; Gao, F. An improvement to naïve bayes for text classification. Procedia Eng. 2011, 15, 2160–2164. [Google Scholar] [CrossRef] [Green Version]
- Liu, S.; Zhu, M.; Yang, Y. A Bayesian classifier learning algorithm based on optimization model. Math. Probl. Eng. 2013, 2013, 975953. [Google Scholar] [CrossRef]
- Hansen, E.; Bush, R.J. Understanding customer quality requirements—Model and application. Ind. Mark. Manag. 1999, 28, 119–130. [Google Scholar] [CrossRef]
- Huang, Y.M. On the general evaluation of customer requirements during conceptual design. J. Mech. Des. 1999, 121, 92–97. [Google Scholar] [CrossRef]
- Roder, B.; Heidl, M.J.; Birkhofer, H. Pre-acquisition clustering of requirements–Helping Customers to realize what they want. Des. Harm. 2013, 7, 407–416. [Google Scholar]
- Stylidis, K.; Rossi, M.; Wickman, C.; Söderberg, R. The communication strategies and customer’s requirements definition at the early design stages: An empirical study on italian luxury automotive brands. Procedia CIRP 2016, 50, 553–558. [Google Scholar] [CrossRef] [Green Version]
- Ostasz, G.; Czerwinska, K.; Pacana, A. Quality management of aluminum pistons with the use of quality control points. Manag. Syst. Prod. Eng. 2020, 28, 29–33. [Google Scholar] [CrossRef] [Green Version]
- Madzik, P.; Chocholakova, A. Structured transfer of customer’s requirements into product quality attributes—A University Case Study. Qual. Access Success 2016, 17, 38–45. [Google Scholar]
- Gupta, M.; Shri, C. Understanding customer requirements of corrugated industry using Kano model. Int. J. Qual. Reliab. Manag. 2018, 35, 1653–1670. [Google Scholar] [CrossRef]
- Pacana, A.; Siwiec, D. Model to predict quality of photovoltaic panels considering customers’ expectations. Energies 2022, 15, 1101. [Google Scholar] [CrossRef]
- Mu, E.; Pereyra-Rojas, M. Practical decision making. In Springer Briefs in Operations Research, Appendix A: Practical Questions Related to AHP Modeling; Springer Nature: Basel, Switzerland, 2017; pp. 105–106. [Google Scholar]
- Chan, F.T.S.; Kumar, N. Global supplier development considering risk factors using fuzzy extended AHP-based approach. Omega 2007, 35, 417–431. [Google Scholar] [CrossRef]
- Wang, L.; Chu, J.; Wu, J. Selection of optimum maintenance strategies based on a fuzzy analytic hierarchy process. Int. J. Prod. Econ. 2007, 107, 151–163. [Google Scholar] [CrossRef]
- Gawilk, R. Stratification of research target group and selection of experts for AHP-based decision making model. Stud. Mater. Misc. Oecon. 2016, 20, 193–200. [Google Scholar]
- Pacana, A.; Siwiec, D. Universal model to support the quality improvement of industrial products. Materials 2021, 14, 7872. [Google Scholar] [CrossRef] [PubMed]
- Jie, Y.; Ji, X.; Yue, A.; Chen, J.; Deng, Y.; Chen, J.; Zhang, Y. Combined multi-layer feature fusion and edge detection method for distributed photovoltaic power station identification. Energies 2020, 13, 6742. [Google Scholar] [CrossRef]
- Guzman Razo, D.E.; Müller, B.; Madsen, H.; Wittwer, C. A genetic algorithm approach as a self-learning and optimization tool for PV power simulation and digital twinning. Energies 2020, 13, 6712. [Google Scholar] [CrossRef]
- Lucchi, E.; Polo Lopez, C.S.; Franco, G. A conceptual framework on the integration of solar energy systems in heritage sites and buildings. IOP Conf. Ser. Mater. Sci. Eng. 2020, 949, 1. [Google Scholar] [CrossRef]
- Sánchez-Pantoja, N.; Vidal, R.; Pastor, M.C. EU-funded projects with actual implementation of renewable energies in cities. Analysis of their concern for aesthetic impact. Energies 2021, 14, 1627. [Google Scholar] [CrossRef]
- Wall, M.; Probst, M.; Roecker, C.; Dubois, M.; Horvat, M.; Jorgensen, O.; Kappel, K. Achieving solar energy in architecture-IEA SHC Task 41. Energy Procedia 2012, 30, 1250–1260. [Google Scholar] [CrossRef] [Green Version]
- Sanchez-Pantoja, N.; Pastor, M.; Vidal, R. Aesthetic impact of solar energy systems. Renew. Sustain. Energy Rev. 2018, 98, 227–238. [Google Scholar] [CrossRef]
- Ferreira, A.C.; Silva, A.; Teixeira, J.C.; Teixeira, S. Multi-objective optimization of solar thermal systems applied to portuguese dwellings. Energies 2020, 13, 6739. [Google Scholar] [CrossRef]
- Yildirim, M.A.; Nowak-Ocłoń, M. Modified maximum power point tracking algorithm under time-varying solar irradiation. Energies 2020, 13, 6722. [Google Scholar] [CrossRef]
Figure 1.
General concept of model. Own study.

Figure 2.
Universal model to predict expected direction of products quality improvement. Own study.

Figure 3.
Relative state scale to determine customers’ satisfaction from product quality level. Own study based on [3,4].


Table 1.
Characteristics of PV criteria states. Own study.
| Criteria of PV | Range of Quality Criteria (1) | Range of Quality Criteria (2) | Range of Quality Criteria (3) |
|---|---|---|---|
| rated power (Wp) | |||
| short-circuit current (A) | |||
| maximum current (A) | |||
| open-circuit voltage (V) | |||
| efficiency (%) | |||
| front glass (mm) | |||
| dimensions (mm) | |||
| number of cells | |||
| temp. coeff. of inten. (%/C) | |||
| visibility | partially visible | visible | practically invisible |
| degree of integration | not integrated | partially integrated | integrated |
| light reflection | small | average | big |
| fractality | small | average | big |
| pattern (texture) | plain | porous | transparent |
Table 2.
Quality levels of PV and initial customers’ satisfaction. Own study.
| Quality Level from Criteria States (1) | Quality Level from Criteria States (2) | Quality Level from Criteria States (3) | |||
|---|---|---|---|---|---|
| 0.11 | very satisfying | 0.09 | a bit satisfying | 0.14 | a bit satisfying |
| 0.11 | very satisfying | 0.13 | very satisfying | 0.13 | very satisfying |
| 0.09 | a bit satisfying | 0.08 | not very satisfying | 0.10 | a bit satisfying |
| 0.11 | very satisfying | 0.09 | a bit satisfying | 0.14 | absolutely satisfying |
| 0.09 | a bit satisfying | 0.08 | not very satisfying | 0.11 | very satisfying |
| 0.10 | a bit satisfying | 0.08 | not very satisfying | 0.13 | very satisfying |
| 0.10 | a bit satisfying | 0.13 | very satisfying | 0.09 | a bit satisfying |
Table 3.
Predicted direction of PV improvement after using the Naive Bayesian Classifier. Own study.
Table 3.
Predicted direction of PV improvement after using the Naive Bayesian Classifier. Own study.
| Quality Level | Customers’ Satisfaction (NBC Class) | A Priori Value | Average Value | Standard Deviation |
|---|---|---|---|---|
| Quality level from criteria states (1) | very satisfying | 0.428571 | 0.108333 | 0.000024 |
| a bit satisfying | 0.571429 | 0.090750 | 0.000024 | |
| Quality level from criteria states (2) | very satisfying | 0.285714 | 0.139500 | 0.000013 |
| not very satisfying | 0.428571 | 0.079667 | 0.000020 | |
| a bit satisfying | 0.285714 | 0.087000 | 0.000002 | |
| Quality level from criteria states (3) | absolutely satisfying | 0.285714 | 0.137000 | 0.000008 |
| very satisfying | 0.428571 | 0.125333 | 0.000176 | |
| a bit satisfying | 0.285714 | 0.093000 | 0.000098 |
Publisher’s Note: MDPI stays neutral with regard to jurisdictional claims in published maps and institutional affiliations. |
© 2022 by the authors. Licensee MDPI, Basel, Switzerland. This article is an open access article distributed under the terms and conditions of the Creative Commons Attribution (CC BY) license (https://creativecommons.org/licenses/by/4.0/).
Share and Cite
MDPI and ACS Style
Ostasz, G.; Siwiec, D.; Pacana, A. Universal Model to Predict Expected Direction of Products Quality Improvement. Energies 2022, 15, 1751. https://doi.org/10.3390/en15051751
AMA Style
Ostasz G, Siwiec D, Pacana A. Universal Model to Predict Expected Direction of Products Quality Improvement. Energies. 2022; 15(5):1751. https://doi.org/10.3390/en15051751
Chicago/Turabian StyleOstasz, Grzegorz, Dominika Siwiec, and Andrzej Pacana. 2022. "Universal Model to Predict Expected Direction of Products Quality Improvement" Energies 15, no. 5: 1751. https://doi.org/10.3390/en15051751
Note that from the first issue of 2016, this journal uses article numbers instead of page numbers. See further details here.