
Modelling of Solar PV under Varying Condition with an Improved Incremental Conductance and Integral Regulator


Department of Electrical Power Engineering, Faculty of Engineering and the Built Environment, Durban University of Technology, Durban 4000, South Africa
*
Author to whom correspondence should be addressed.
Energies 2022, 15(7), 2405; https://doi.org/10.3390/en15072405
Submission received: 24 December 2021
/
Revised: 14 February 2022
/
Accepted: 21 February 2022
/
Published: 25 March 2022
Abstract
:The introduction of solar photovoltaic (PV) systems would provide electricity accessibility to rural areas that are far from or have no access to the grid system. Various countries are planning to reduce their emissions from fossil fuel, due to its negative effects, by substituting with renewable energy resources. The use of solar PV systems is expanding globally because of growing energy demands and depleting fossil fuel reserves. Grid integration of the solar system is expected to increase further in the near future. However, the power output of solar PV systems is inherently intermittent, and depends on the irradiance and the temperature operation of the solar cell, resulting in a wide range of defects. Hence, it is vital to extract peak power from the solar panel in all conditions to provide constant power to the load. This paper presents a tracking control method of the peak output power of a solar PV system connected to a DC-DC boost converter using an improved incremental conductance and integral regulator (IC + IR). The research was carried out because the solar PV output is dependent on environmental parameters, such as solar insolation and temperature. Therefore, it is pertinent to forecast the peak power point in outdoor conditions and to operate at that point, so that solar PV can produce the highest output each time it is used. A peak power point strategy that maximizes the output of a solar PV array is proposed. This method establishes the maximum output operation point under the effects of the solar insolation and the module temperature. An automatic converter restoration scheme with block/de-block signal control is proposed to protect the converters from the higher phase current, total capacitor voltage deviation, grid disturbance, and fault current. The proposed scheme also tracks the peak power point (PPP) of the solar array with stable output voltage under varying operating conditions. It reduces the error signal and ripples at the PPP during instantaneous and incremental conductance to zero. In addition, it controls the solar PV system under constantly changing climatic conditions, and thus improves the system efficiency.
1. Introduction
The attention of countries is shifting towards energy generated from renewable energy resources, for which their sources are replenished on a human time scale. Rising concerns about global warming, energy security, and the impact of greenhouse gas emissions within the global economy have increased interest in developing efficient renewable energy sources for the rapid replacement of fossil fuels. Among these renewable energy resources, solar power is outstanding and popular because of its easy deployment to the power system and cheap maintenance cost compared to the conventional method of electricity generation [1,2]. In South Africa, a nominal capacity of about 8.3 GW from different kinds of renewable energy was attained in 2020, where solar accounted for 2.5 GW of this capacity [3]. Nevertheless, this is not sufficient and more will soon be deployed across the country. The benefits of accessing solar energy are numerous, and include the lack of direct radiation, appropriateness for low energy consumption, and suitability for remote areas that do not have access to the electricity grid [4,5,6,7]. The solar output voltage increases when its cells are connected in series with each other to form solar arrays. The amount of energy produced by the solar array is dependent in the voltage/current at the peak power point, the fill factor, and the open and short circuit voltage/current, whereas the temperature, sum irradiance, PV array age, and degradation of the solar cells determine its performance [8]. The solar array open circuit voltage increases (slightly) with irradiance, although accompanying temperature increases will reduce the . Hence, intermittent solar energy is produced on a daily basis [9,10,11]. In addition, peak power may not be accessed because of the variability in the sun irradiance and temperature changes. A solar PV system that comprises a controller, an interface unit, a converter, and PV arrays can be integrated into the grid.
Several tracking algorithms have been developed recently to access peak power under any certain sun irradiance and temperature such, as the secant and Weibull distribution methods [12,13,14,15,16,17]. The perturb and observation method is a popular algorithm used due to its simplicity and quick application, but the production of oscillations at its output level is a setback of the method. In addition, PPP tracking may be in the wrong direction if there is a quick change in the direction of the sun’s irradiance [18,19]. Incremental Conductance is another algorithm that possesses the advantage of improved capability compared to the perturb and observe (P & O) method. However, this method has the disadvantage of reduction in efficiency because it can swing round the peak power point tracking (PPPT) [20,21]. Nevertheless, Incremental Conductance has been modified in the literature and combined with different control schemes to access MPP from solar PV to reduce some of the tracking challenges. Fuzzy logic control was used to vary the voltage step size, which improves the MPPT performance during static and dynamic environmental conditions [22]. Two step-size methods for IC MPPT were compared for variable and fixed step sizes in [23,24], which presented a self-predictive incremental conductance (SPInC) algorithm to detect the dynamic intensity of radiation/temperature to reduce output power ripples, and [25] used a modified variable step-size IC technique for MPPT to control the step size using a constant preset scaling factor. References [26,27,28] confirmed that the IC MPPT method is better than the classic P & O approach in terms of output voltage, current, and power, whereas [29] proposed a conductance-based method of the MPPT algorithm to minimize the power fluctuation effect when the solar system is connected to the grid. References [30,31] employed the IC algorithm to track MPPT under the rapidly varying illumination intensity, [32,33] optimized P & O and accessed MPPT, [34,35] presented P & O and IC to control the battery storage current and supercapacitor, [36] presented the grasshopper optimization algorithm (GOA) with IC to find a suitable tracking area for the global maximum power point (GMPP), and [37] proposed an angle of incremental conductance (AIC) method and Interval Type-2 Takagi Sugeno Kang fuzzy logic controller (IT2-TSK-FLC) to access MPPT.
Most of the aforementioned modified algorithms generally solved some of the solar PV system tracking challenges. However, the protection of the point of common coupling converters in the advent of a higher phase current/voltage, a switch-on instantaneous input current surge, solar PV faults, and grid faults were not considered. This paper presents a strategy for improved incremental conductance combined with an integral regulator (IC + IR) to produce zero error at the PPP during both instantaneous conductance and incremental conductance. The proposed method incorporates an automatic restoration scheme with block/de-blocking signal control to isolate the grid converters switching in the advent of a higher phase current, a switch-on instantaneous input current surge, solar PV faults, and grid faults. The algorithm employed in this paper achieves perfect efficiency, time reduction, and error minimization in the tracking of PPP. The error signal generated at the PPP during instantaneous conductance and the incremental conductance is reduced to zero by the integral controller. A PV solar system integrating a DC-DC boost converter with IC + IR for tracking of PPP was modeled in the MATLAB/SIMULINK environment. The overall closed-control-loop system integrating the DC-DC boost converter and IC + IR are used to ensure the stability of the output signals (i.e., voltage, current) of the solar PV and to supply constant power to the load under a variable solar irradiance and temperature. The contributions of the paper are summarized as follows:
- Improved incremental conductance with an integral regulator strategy (IC + IR) to track the peak power point and maximize the output of the solar PV system under outdoor conditions.
- An automatic converter restoration scheme that incorporates a block and de-blocking restoration control scheme was designed to control the converter’s switching mechanism and to prevent the device from a higher phase current/voltage, a switch-on instantaneous input current surge, solar PV faults, and grid faults.
- The proposed method attenuates the occurrence of oscillations and ripples in the output power due to the error signal generated between the instantaneous and incremental conductance.
- The proposed method provides grid voltage stability under variations in load, solar irradiance, and temperature.
The paper is arranged into four sections. Section 2 presents PV modeling, the perturb and observe strategy, incremental conductance, an improved incremental conductance design with an integral regulator strategy, boost converter modeling, a proposed converter restoration scheme, a proposed converter block/de-block scheme, and an explanation of the network used. Simulation results and discussion are presented in Section 3, and Section 4 presents the conclusion.
Research Question:
- How can the impact of irradiance and temperature variations on the solar PV output be controlled?
2. Method and Materials
2.1. Photovoltaic Modeling
The equivalent circuit of the single and double diode model of a solar cell is shown in Figure 1, consisting of shunt and series resistors, with a connected current source and diode, where represents the PV cell output current; V represents the PV cell output voltage; refers to the photo-generated controlled current; is the current in the diode branch; is the series resistance, which considers losses in cell interconnections and junctions; and is the shunt resistance, which includes the current leakage to the ground in the case when the diode is in reverse bias. Therefore, the current–voltage characteristics of the circuit can be expressed in Equations (1)–(8). Irrespective of the electrical analysis, the solar panels are modeled as a constant current source. A solar panel comprises two or more solar cells connected in series/parallel and arranged in a framed form or module, and a solar array comprises a group of solar panels [38,39].
The current–voltage curve (I–V curve) consists of the short-circuit current, ; open-circuit voltage, ; peak voltage, ; and current, . Therefore, these are used to design the diode model of the photovoltaic cell. The output current of a solar cell can be computed using Equation (1) or (2) [40]. From Equation (2), q is the quantity of electron charge (1.6 × 10⁻¹⁹C), α is the ideality factor of the diode, γ is the Boltzmann’s constant , and T is the operating temperature. The increase in the solar irradiation will result in an increase in the solar cell voltage and power, but the consequent temperature increase can have a negative impact on the output voltage and power [41,42]. Equations (2) and (3) are inserted into Equation (1) and rearranged to obtain Equation (4):
A solar array comprises various series of solar cells connected in parallel. Hence, the output voltage and current of the solar PV array may be increased to suit the conditions and requirements. The I–V characteristics of a solar arrays are expressed in Equation (5), in which is the number of solar cells in series, and is the number of solar cells in parallel.
However, the accuracy of the single-diode model decreases at low irradiance, especially around . Hence, the two-diode model in Figure 1b can be recommended, which takes into account the effect of recombination by introducing another diode in parallel. This mathematical model is expressed in Equation (9) according to the Shockley equation. The two diodes represent the polarization phenomenon, denote power losses, and and are the diffusion and saturation currents. To consider the dependence on the temperature and irradiance in Equation (9), and are the ideal coefficients of the diffusion and compound diodes, respectively. represent the terminal current and voltage of the PV cell, and is the band-gap energy, −1.7 × 10⁻¹⁹ J. Solar PV conversion is the method of converting the photon energy into electrical energy through the absorption of light by the material. When a photon strikes the surface of the material, it rips out and ejects an electron from a lower energy level to a higher level, resulting in the formation of an electron-hole pair at the same level of energy, and the return to equilibrium by converting part of the electrical energy into thermal energy. The released electron passes through the forbidden band toward the conduction band if the energy received is sufficient. In the case in which the width of the band gap is between 0.4 and 0.7 eV (i.e., the forbidden spectrum of solar energy band), a free flow of electrons is generated, and the photovoltaic cell can then cause a continuous-type electric current, which should be guided to pass in the external circuit. Therefore, as a compromise, a band gap between 1.0 and 1.7 eV makes an effective solar semiconductor; in this range, electrons can be freed without creating too much heat. The difference between the two modeling equations is the introduction of a saturation current. The two-diode model represents the recombination losses occurring at the junction of the solar cell. Considering the mathematical manipulation and the number of iterations involved, the single diode model may be faster, less complex, and subject to fewer errors compared to the two-diode model. However, the two-diode model provides precise and exact graph characteristics under varying weather conditions, with longer iterations and parameter manipulation. Hence, the number of equations and unknown parameters increases, thereby making calculations slightly more complex. is the photo current, which is a function of temperature and solar radiation, in addition to , and , which can be obtained analytically. could be obtained by iteration using the Newton–Raphson method [43].
where:
2.2. Overview of Perturb and Observe Strategy
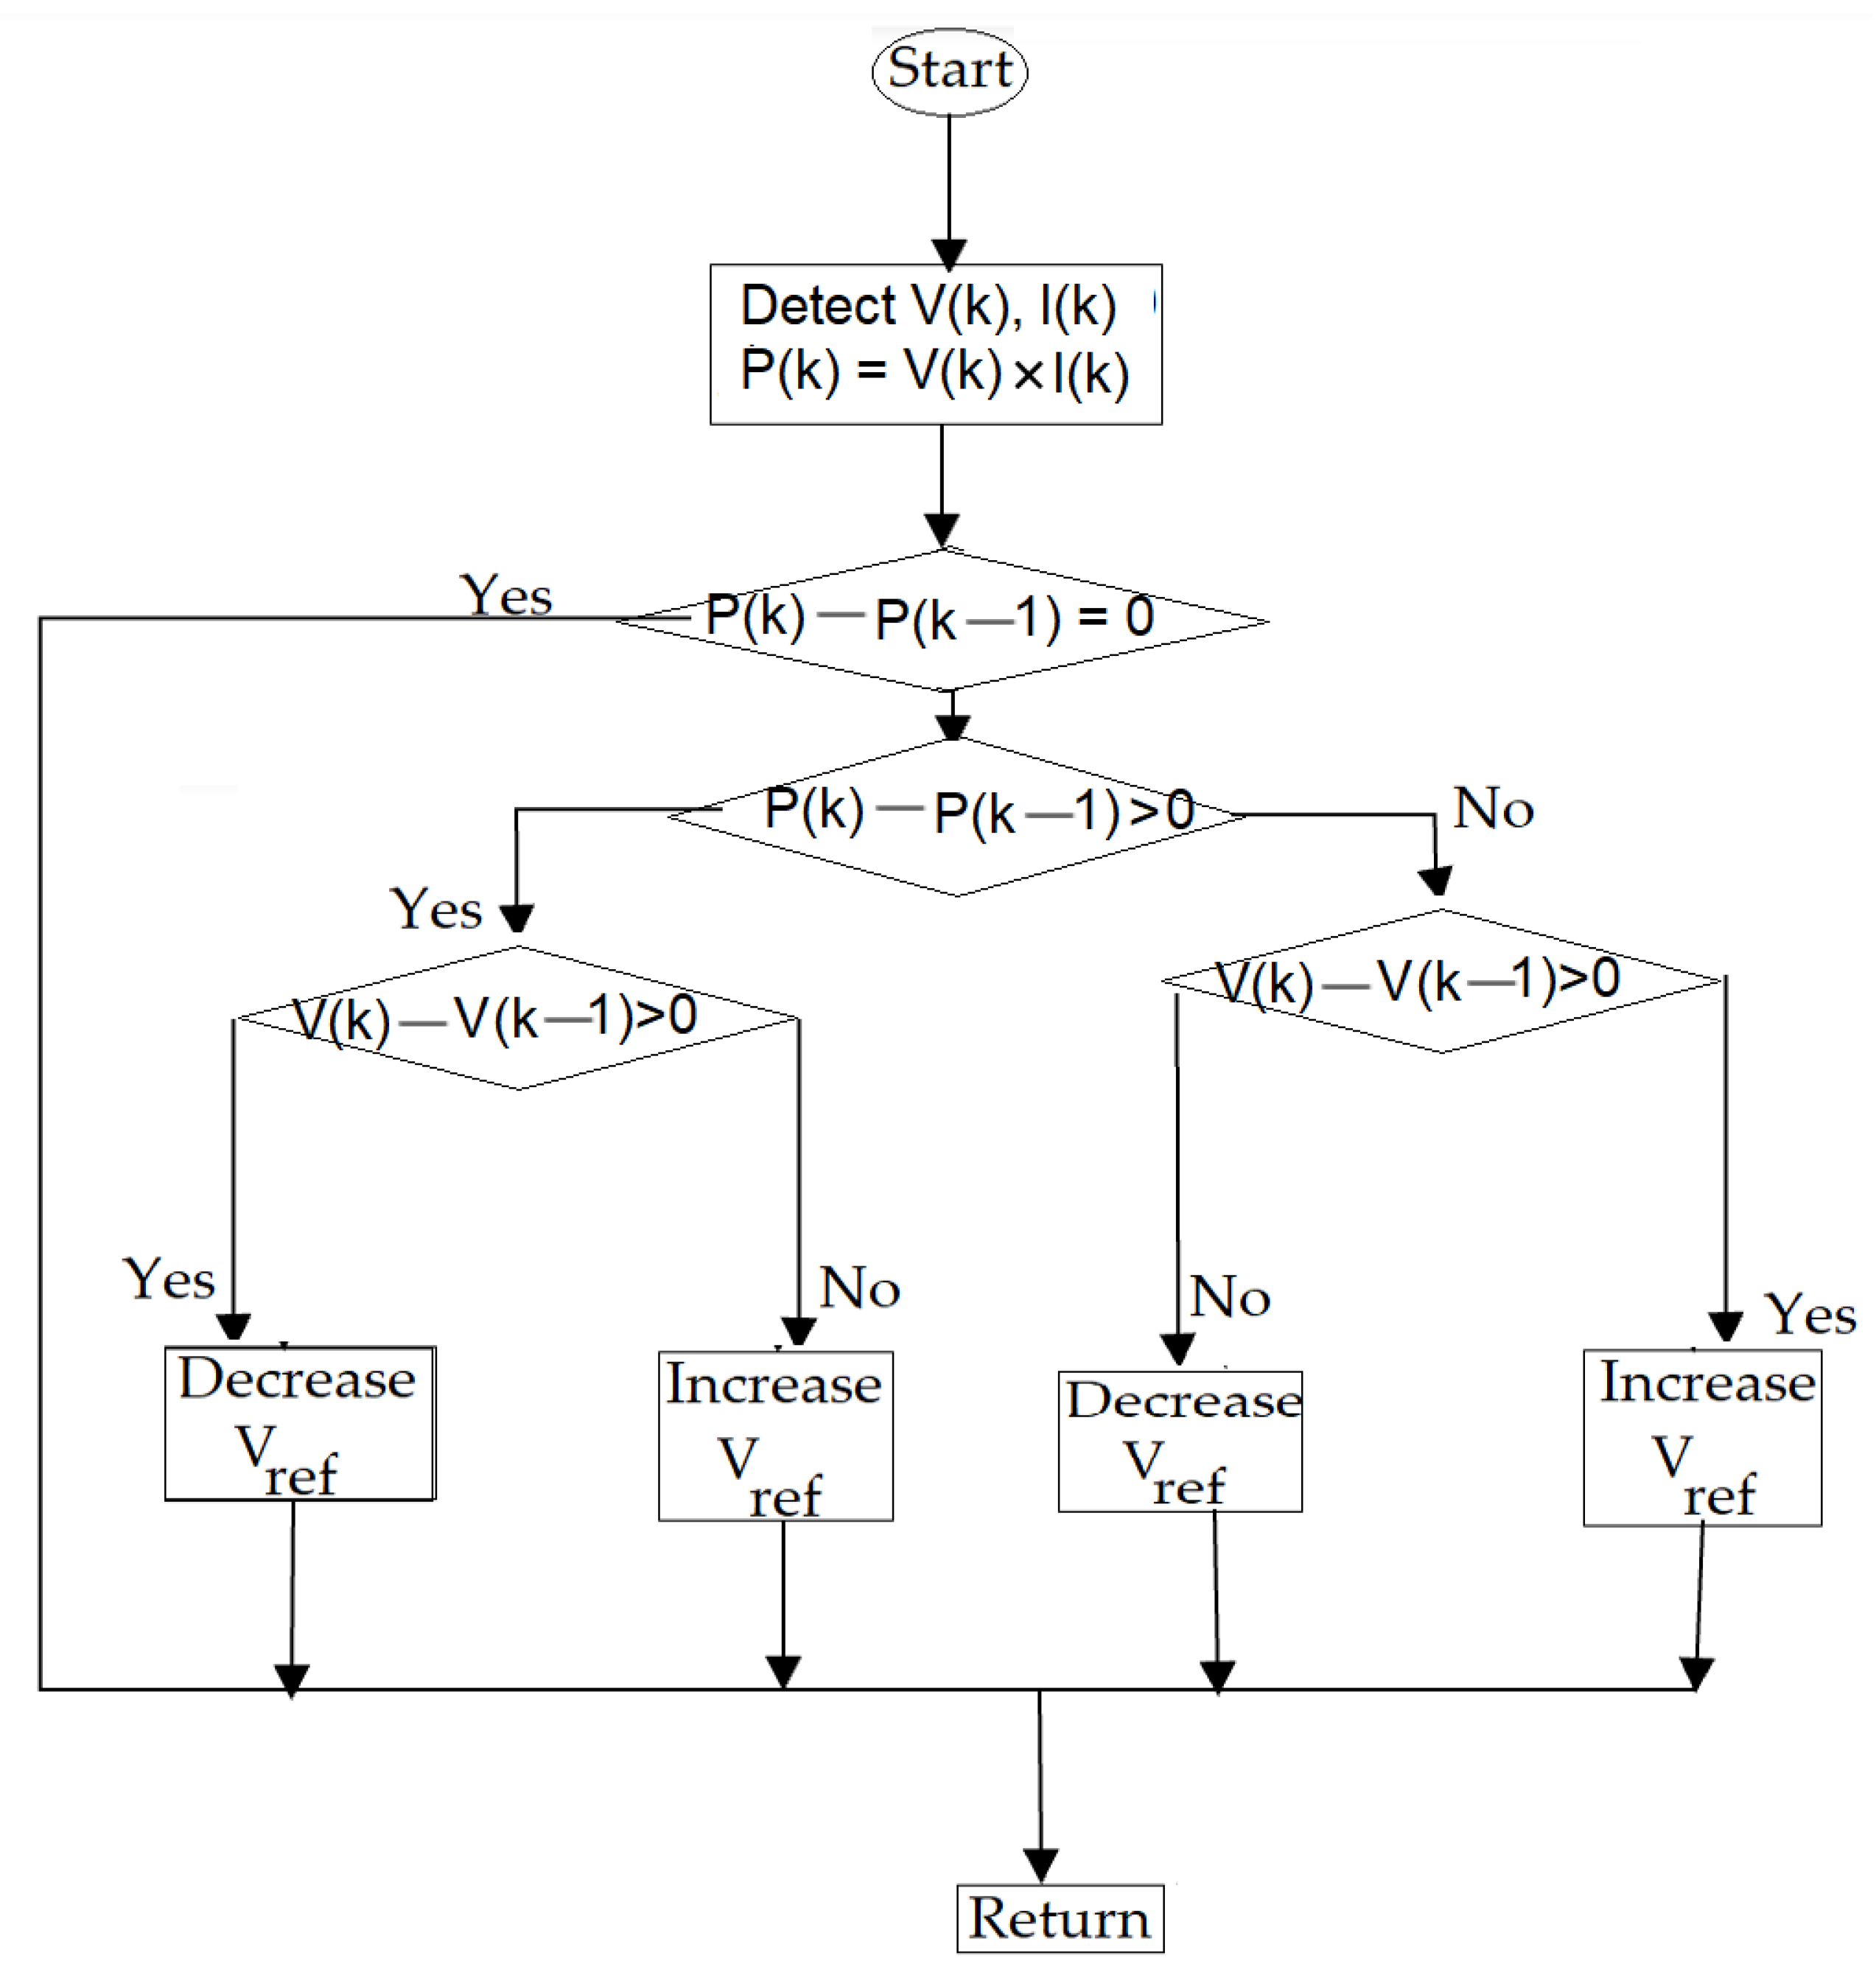
The perturb and observe method of PPPT of a solar system is the simplest power tracking strategy. This is a process by which an operating voltage is adjusted, forcing the power of the solar system to an elevated “hill” level and sustaining it. It is otherwise known as hill climbing. In this method, an increment in the operating voltage to the maximum level when there is an improvement in the amount of power generated is sustained, but will stop when the power is about to drop. The very point at which the power generated is highest just prior to falling is known as the PPP. The power output of the solar system has the tendency to vary due to its non-linear characteristics, and changes in temperature and irradiation [44,45]. The power generated is compared to the previous power produced by computing the system voltage and the current. The negative or positive signs in the variation of power and voltage obtain can influence the decision in the direction of the algorithm. Moreover, the two successive values are taken and measure the variation in power and voltage by controlling the duty circle. The step size of the PPP tracking establishes the power loss and the speed of the system. If there no voltage is produced, the perturb and observe algorithm (P & OA) will oscillate around the PPP tracking. When there is an increase in the voltage produced, a change in the power level will be verified by the P & OA; an increase in voltage means that the power generated will be improved by the P & OA. The drawback is that the voltage level never remains at the same level when the PPP reaches a level similar to the power level [46,47]. The PPP tracking strategy makes use of the iteration approach in attaining the voltage and the current through which the solar system generates its highest power with the influence of temperature and irradiation. The flow chart of P & OA is depicted in Figure 2, and is summarized as follows: and data are collected from solar panels where and are solar panel current and voltage.
- is calculated from and .
- Power and voltage data are saved.
- The data are verified for the next successive immediate values and the first step is repeated.
- The data processed at immediate values are subtracted from the data processed at .
- If on the right-hand side of the solar curve, the slope of the graph will be negative. Similarly, if on the left-hand side of the solar curve, the slope will be positive. Consequently, the reduced duty cycle appears at the right-hand side of the curve, and excessive duty appears on the left-hand side of the curve.
- Depending on the polarity of the slope after subtraction, the algorithm decides the change in the duty cycle.
2.3. Incremental Conductance
Incremental conductance works on the principle that the slope of the solar power graph is negative on the right-hand side and positive on the left-hand side, but is otherwise equal to zero, which is known as incremental conductance and can be used to obtain the solar power derivative with respect to voltage [32,33]. The strategy of incremental conductance is based on the derivative of the solar PV system power and the voltage equal to zero at the PPP. It locates the PPP due to the equality of conductance and conductance increment . Since a solar PV system’s current depends on voltage, the solar power can be obtained. When Equation (10) is equal to zero, the highest power point can be obtained when the incremental conductance is equal to the negative of the instantaneous conductance, as depicted in Equations (11)–(15), and the voltage at that point is known as the PPP voltage in Equation (16). This PPP voltage is sustained by the controller until there is a change in the solar irradiation due to variation in atmospheric conditions. Figure 3 shows the incremental conductance algorithm, and the algorithm process decreases or increases , to trace the new PPP.
The speed of PPP tracking is dependent on the increment step; the greater the step increase, the faster the PPP tracking. Hence, it may not exactly operate at the PPP but oscillate around it. Therefore, with the implementation of the strategic control of the converter device, the load resistance can be matched to the , where is the open circuit voltage and is the short circuit current of the solar system. The IC method involves further calculation in the regulator, and can track varying conditions more quickly than the perturb and observe method. Nevertheless, oscillations can be generated at the output power due to the error signal generated between the instantaneous conductance and the incremental conductance [48,49].
2.4. Improvement in Incremental Conductance with Integral Regulator Strategy
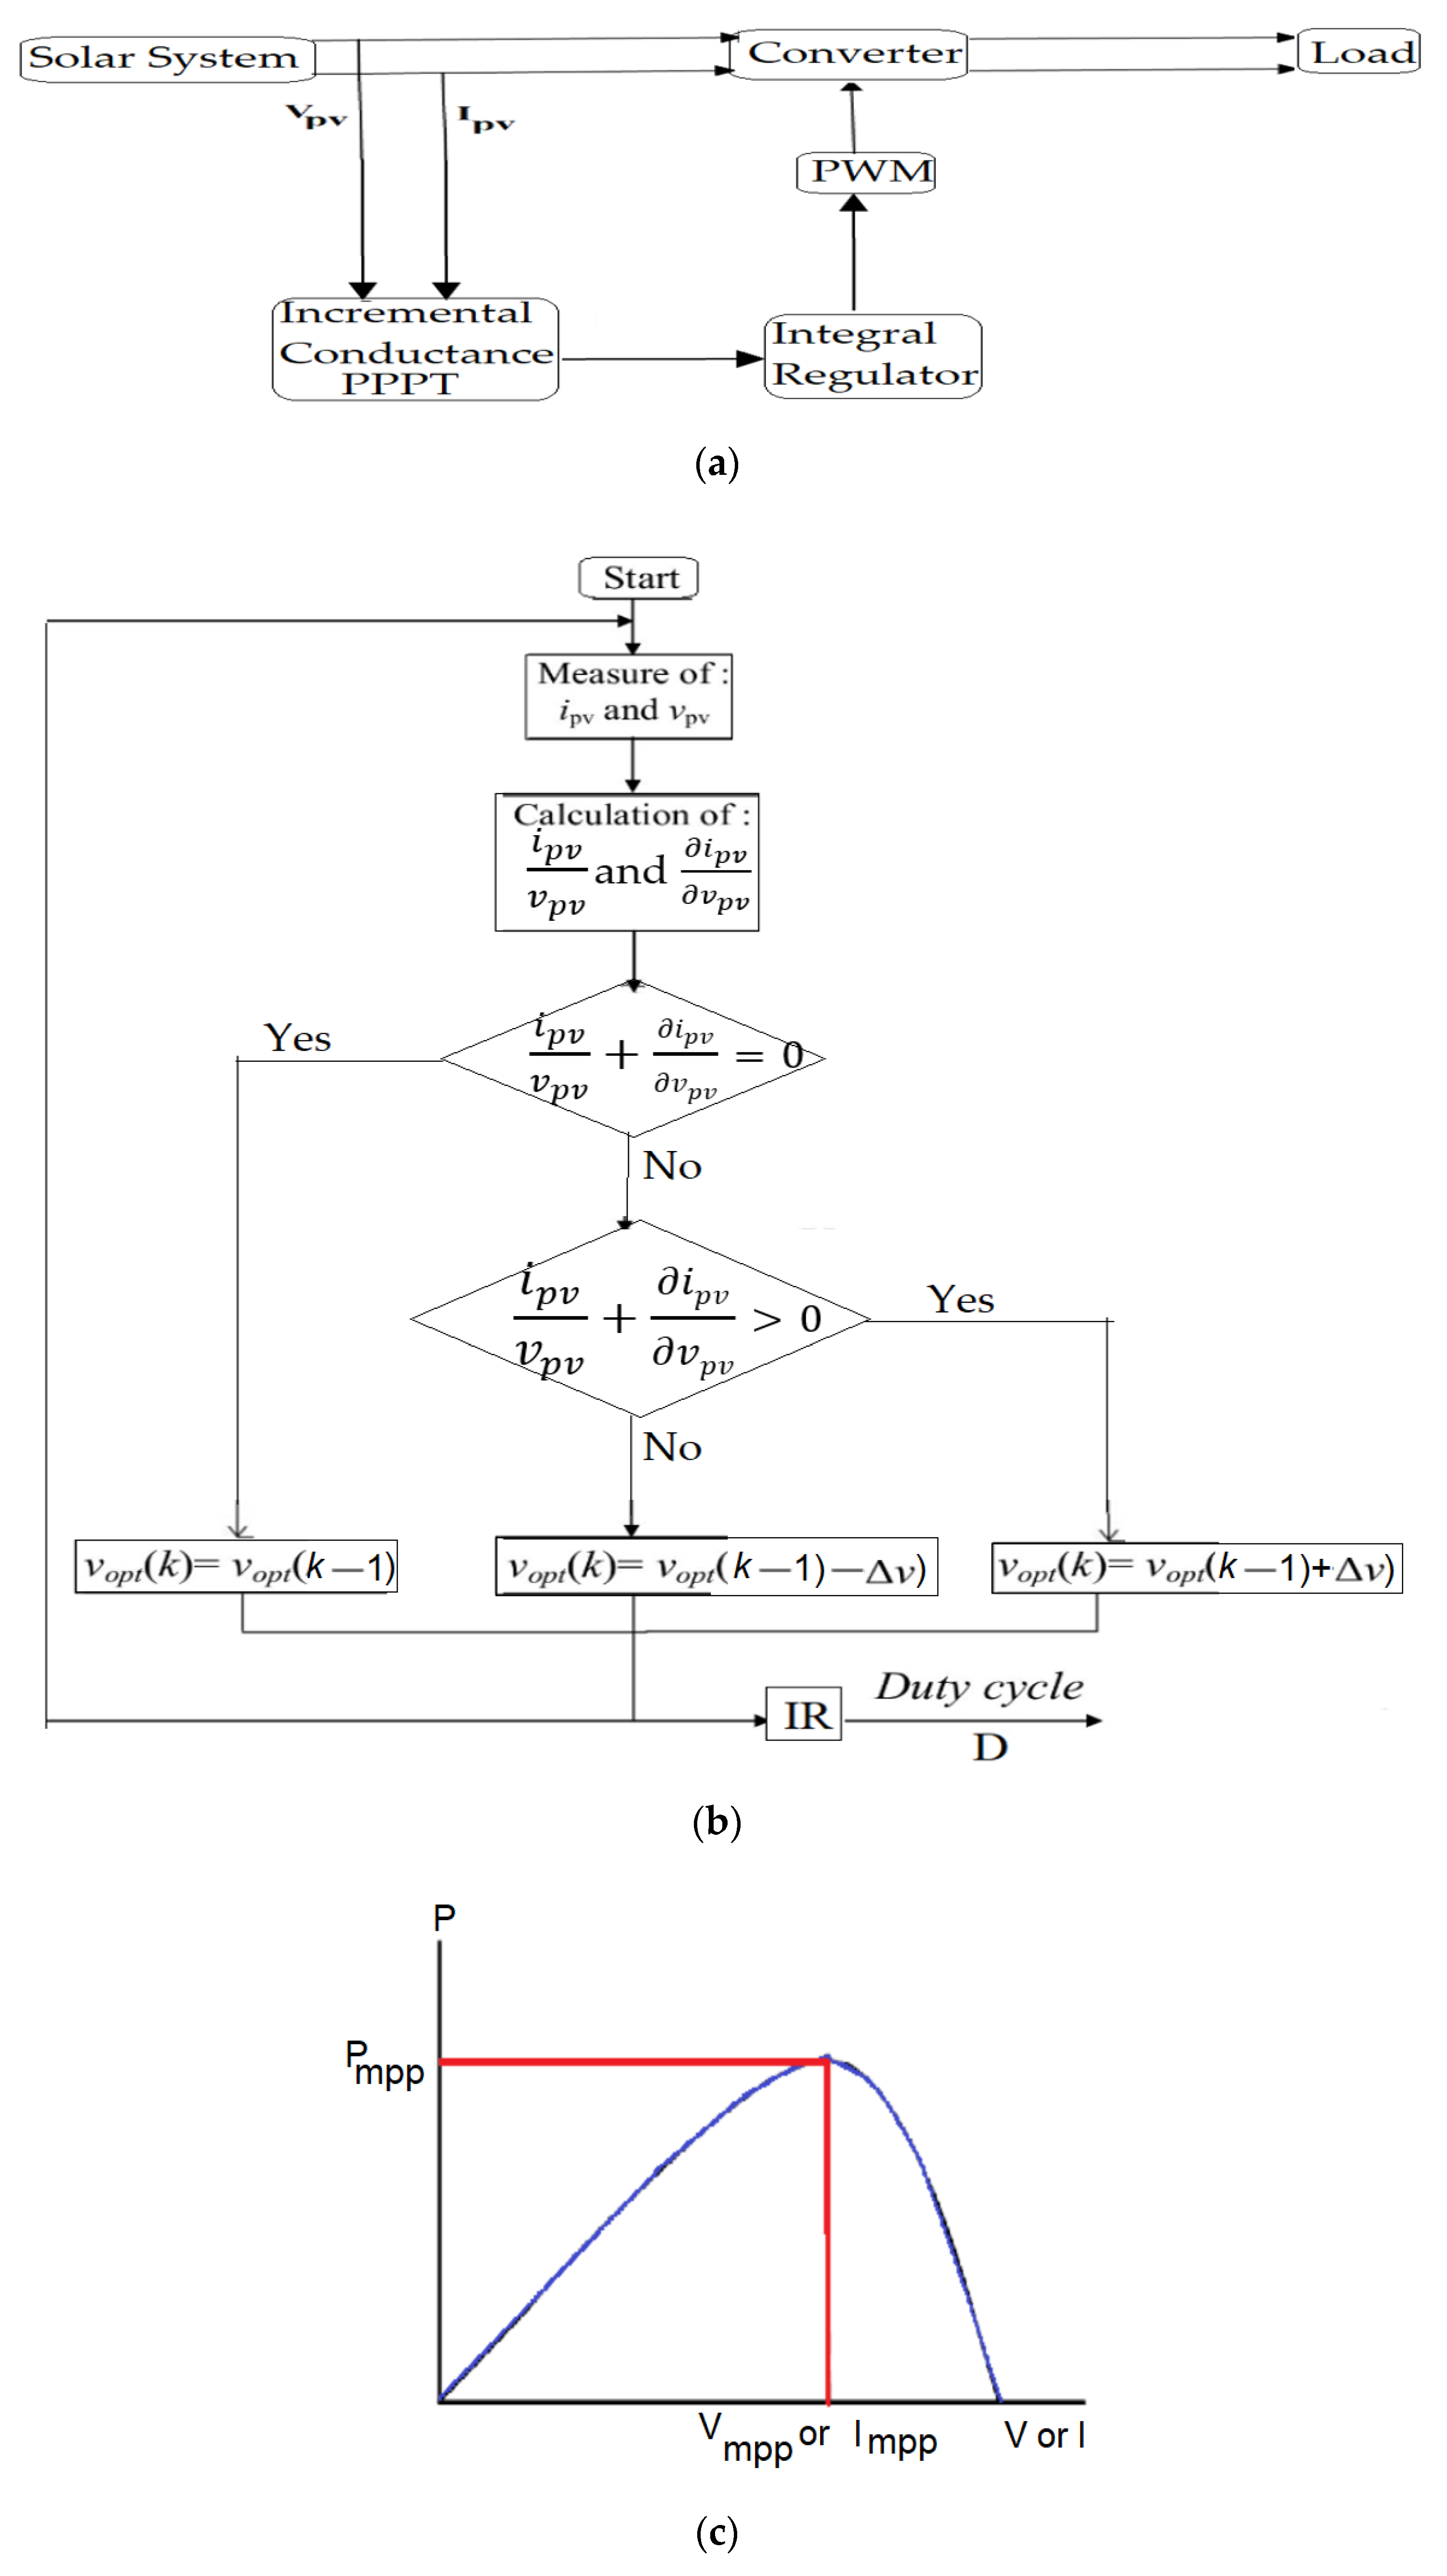
The principle of PPPT is to move the operating point by increasing (decreasing the duty cycle D) when is positive, or decreasing (increasing the duty cycle D) when is negative. The integral regulator controller is added to the incremental conductance to minimize the generated oscillation at the output power, obtain perfect efficiency, reduce error, and reduce the time taken in tracking the PPP, as depicted in Figure 4. Figure 4a depicts the block diagram of the IC + IR. The PPP can be tracked by comparing the instantaneous conductance to the incremental conductance . The condition = 0, to obtain PPP in Equation (17), is rarely met [50]. The incremental conductance algorithm is constructed based on the slope of the power curve against each of the voltage or the current of the PV array, which is considered to be zero at the PPP, and in which a movement towards the left or the right is negative or positive, respectively, as explained in Figure 4c. The system operating point is to the right of the PPP in Equation (18), and to the left of the PPP in Equation (19). Hence, a new parameter is introduced as in Equation (20). This error signal is regulated by an integral regulator to adjust the PV output voltage. From the flowchart of an improved IC in Figure 4b, when ∆v is small, the controller feedback is slow, resulting in losses of power. In contrast, when ∆v is big, inaccuracy in arises, and undesirable oscillations appear in the controller results. The amplitude of the oscillations around the PPP is controlled by the value of ; the amplitude decreases with the increase in , and for a moderate value of , the operating point moves away from the true PPP. Thus, the value of should be precisely determined for improved performance of the PPPT system. When = 0 has been reached because of the implemented adjustment, the PV module power will be maintained at the PPP. The error signal generated at the PPP during instantaneous conductance and incremental conductance is reduced to zero by the application of the integral regulator strategy, which is used to drive the error signal (e) to zero in Equation (21). When the integral regulator is added to the incremental conductance, there will be a reduction in the output oscillation, resulting in a better digital resolution of the output, perfect control, and adaptation of the solar PV system to the constantly changing climatic conditions, thus improving the system efficiency. The integral controller improves the precision of both the system’s large step sizes, when the operational level is far from the PPP, and when the small step sizes of the PPP are reached, to extract the maximum possible level of power. The integral regulator performs the manipulation by accumulating the instantaneous error, then multiplying it by the integral gain and adding it to the controller output. To reach the peak power, the source impedance is equal to the output impedance such that, by varying the duty cycle of the converter, the source and output impedance are matched; hence, the peak power can be attained. When the error is minimized, the regulator output will be equal to the duty cycle correction. The error signal e obtained in IC is processed through the IR controller to eliminate the error e in Equation (22), where represent the gains of the controller. The output signal of the controller is further fed to PWM, which generates the corresponding pulses for the IGBT of the boost converter. The updated duty cycle D(new) is modified in Equation (25).
2.5. Boost Converter Modeling
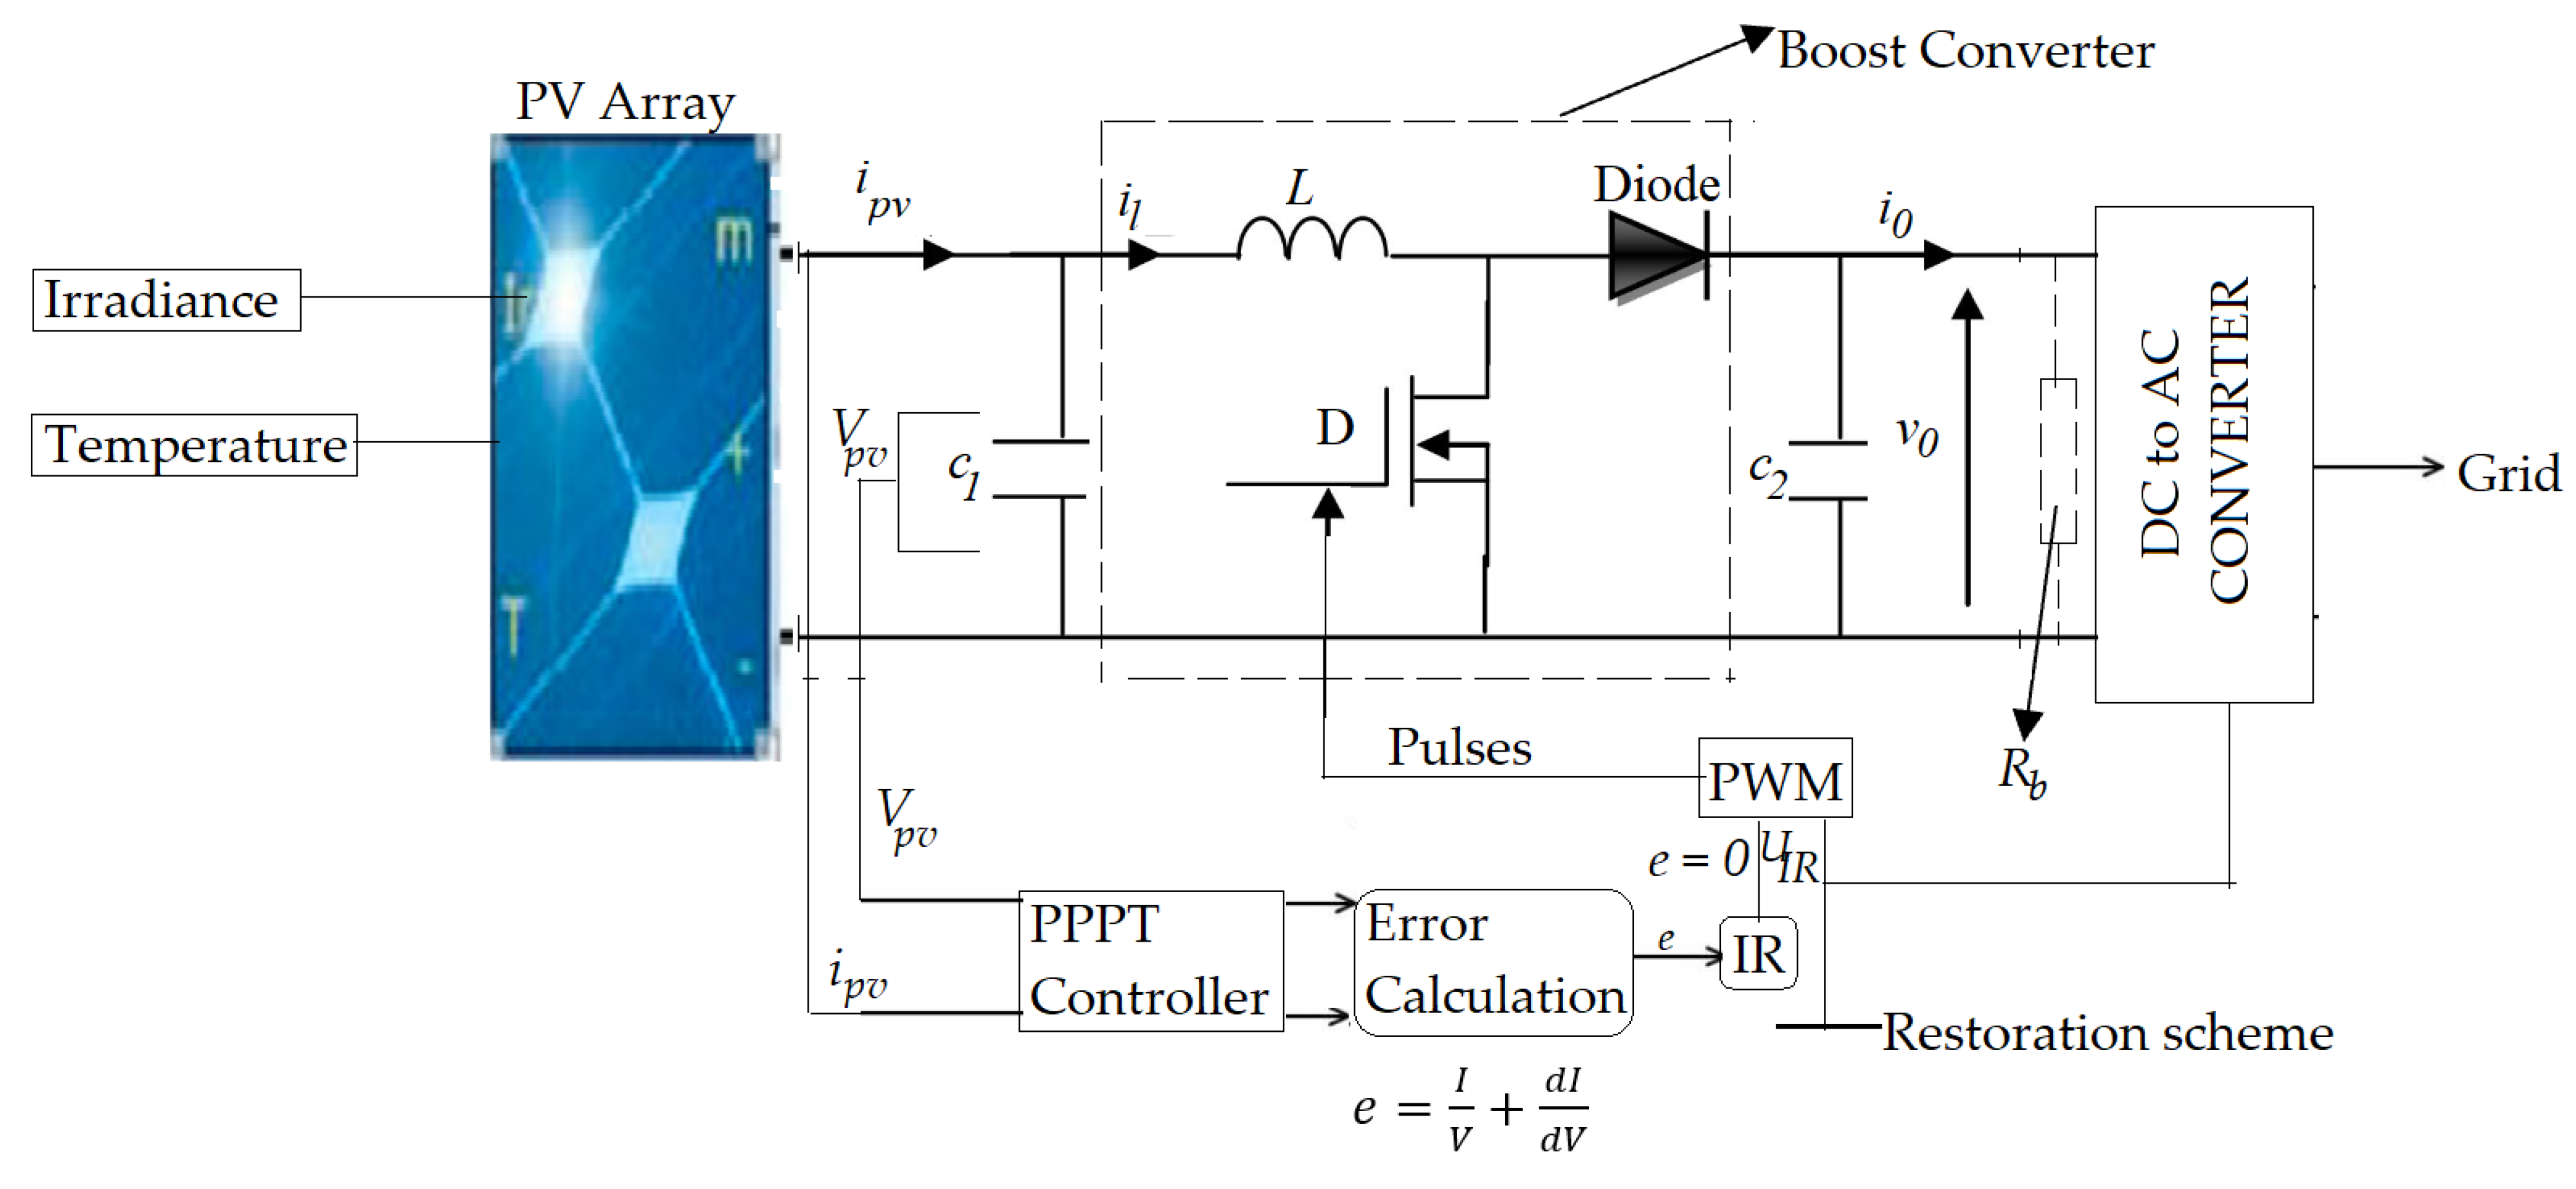
The effective implementation of the PPP tracking method involves a converter (usually a DC-to-DC converter). To ensure the optimization output power allocation of the solar PV system, a boost converter is vital for variable weather conditions. Figure 5 depicts the proposed boost converter and IC + IR for the PPPT technique. The input decoupling capacitance (C) is connected in shunt with the solar PV array. The input inductance of the converter (L) is vital for PPPT dynamics; hence, it guides the PPPT process and regulates the solar PV voltage to exactly match the voltage at the PPPT.
The challenge of low power output is a common occurrence in the conventional IC technique, in which the PPP accomplishment is limited, resulting in the reduction in the tracking efficacy, which is resolved by the proposed method in this paper. The error signal e obtained in IC is processed through an IR controller to eliminate error. The proposed IC + IR algorithm to access the PPP is demonstrated using a DC-to-DC boost converter in Figure 5, and its mathematical model of the converter can be expressed in Equations (26)–(28).
When is considered in Figure 5, after applying the Laplace transform, the transfer function of the boost converter can be expressed in Equation (29), and Equation (30) gives the overall transfer function of control to the PV voltage.
The parameters of a discrete RI controller can be achieved by a continuous RI regulator. The transfer function of the continuous RI regulator can be expressed in Equation (31):
2.6. Proposed Converter Restoration Scheme
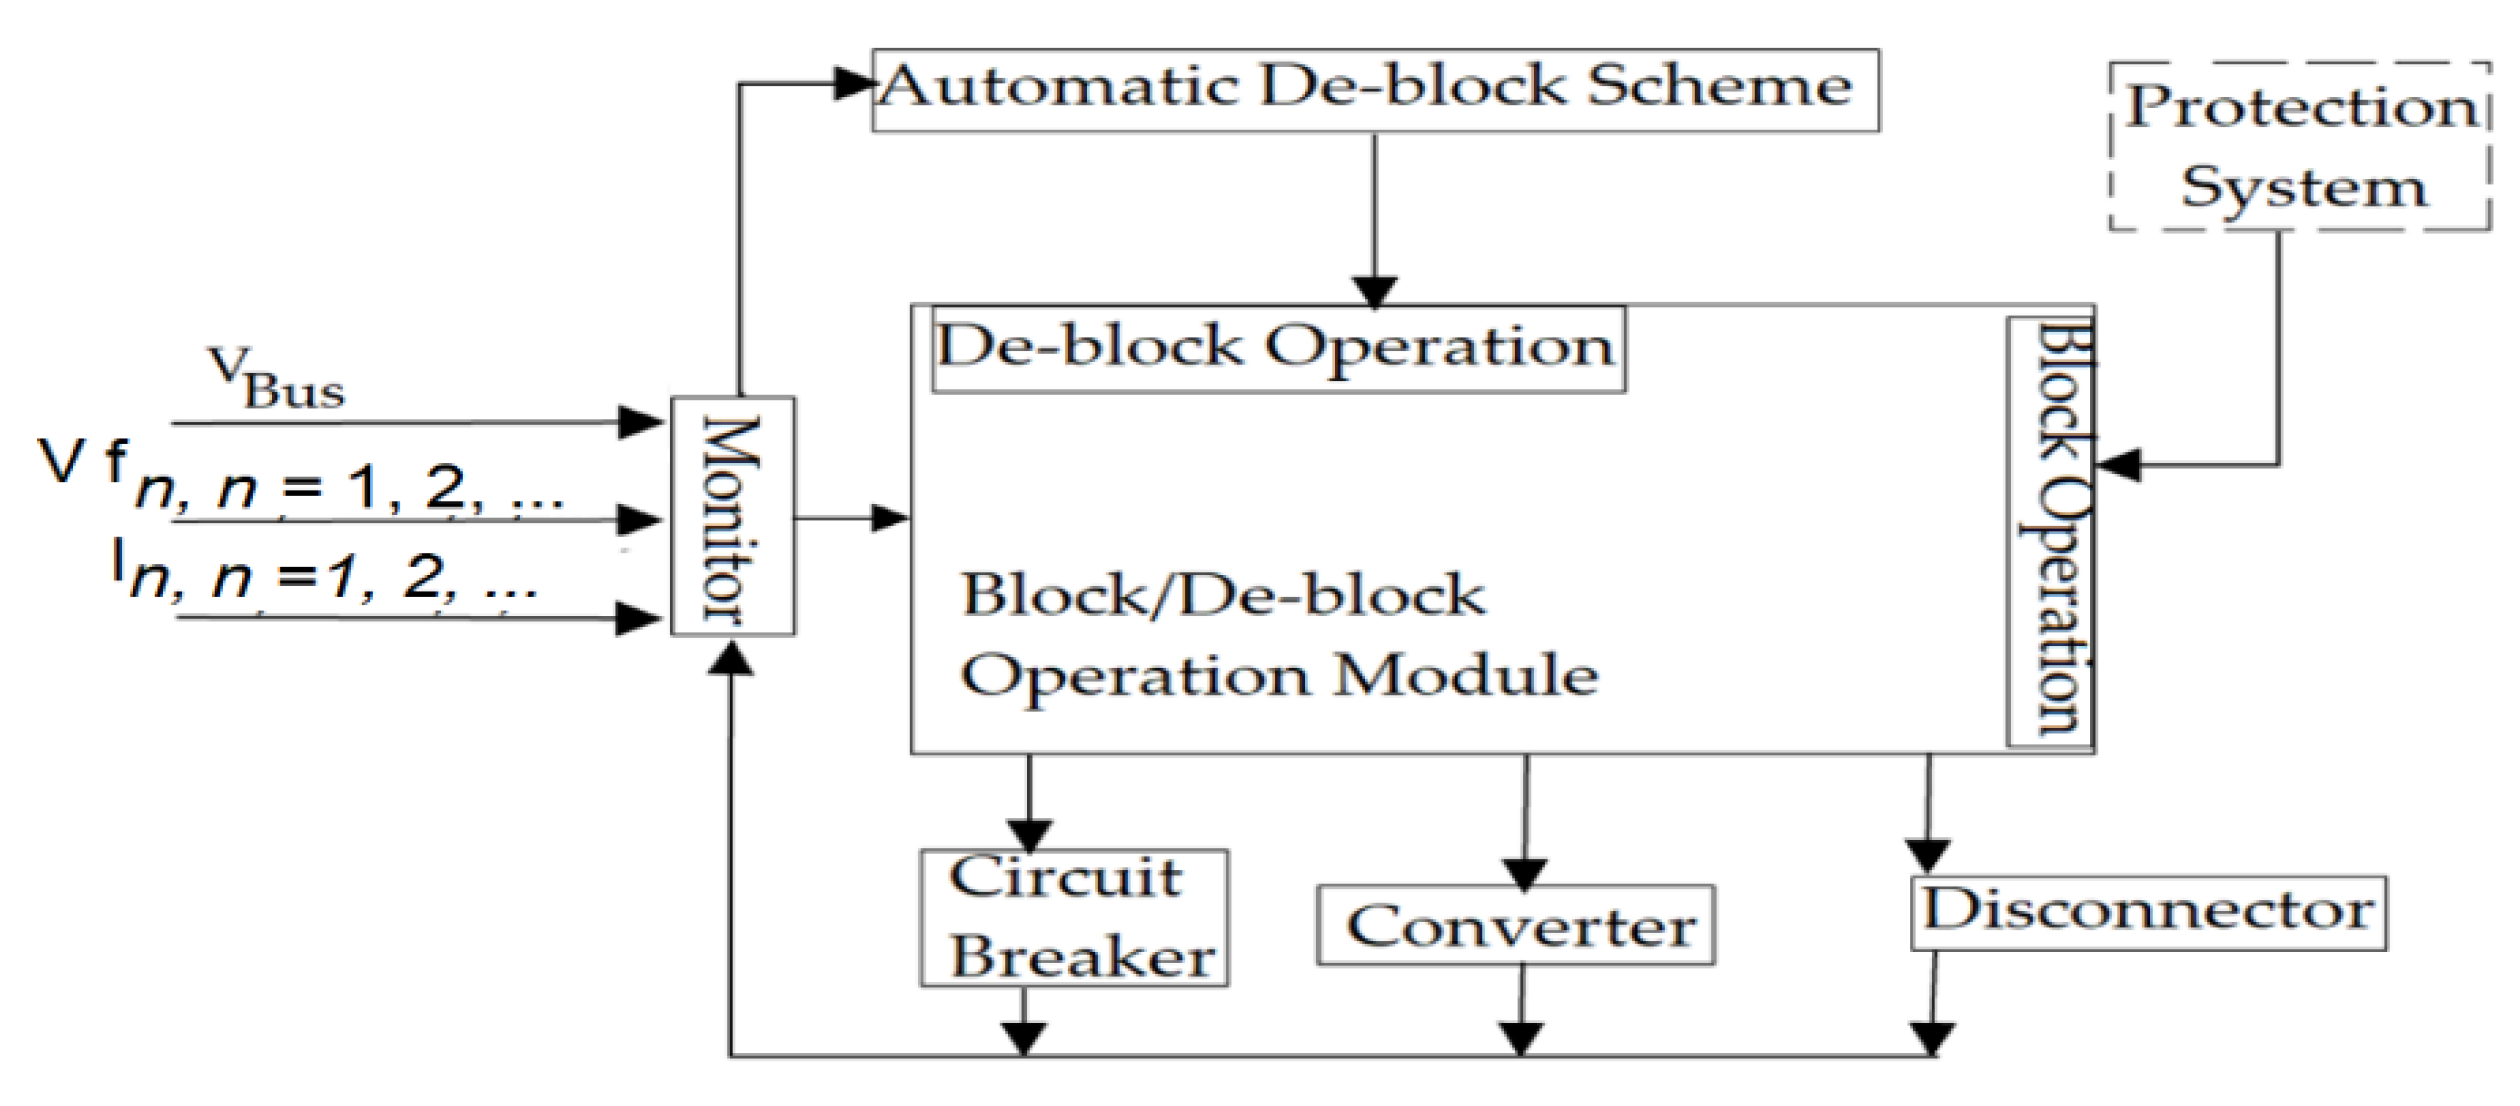
The block and de-block control scheme of the converter is considered as an event-activated module to simplify the interfaces between the different modules. Logic B is the block signal at the input of the converters (DC-to-DC and DC-to-AC), and is normally low or zero, as depicted in Figure 6. When the converter receives the signal, it automatically blocks the converter. With the advent of higher phase current/voltage and faults on the grid, the circuit breaker and the disconnector are properly coordinated to carry out the fault isolation process. The fault is sensed by the converters and receives a blocking signal, while the circuit breaker receives the opening signal and isolates the fault. During this period, the converter behaves like a rectifier diode. The proposed converter control scheme consists of the block/de-block module, the monitor module, and the auto de-block module. The voltage, current, disconnector, and converter information are collected, analyzed, and re-arranged by the control monitor into different kinds of signal, such as event and logic signals, and the signal is transmitted to the next module as an operation signal.
2.7. Proposed Converter Block/De-Block Scheme
The block and de-block operation orders to the converter are generated by the block/de-block module, as depicted in Figure 7. The block/de-block module comprises of four inputs and two outputs. Input (a) is the state of opening the grid circuit breaker when the state is low or zero. Input (b) is the event to de-block the converter after the closing of the circuit breaker by the AND gate. Input (c) is the event to block the converter when it receives an unwanted signal, such as an over-voltage or a current fault, which will reset the [Set-Reset (SR)] trigger and (Q) will go to zero or a low state, thereby opening the circuit breaker. The reset input resets the device to its original state with an output Q, which will be either at a high level of 1 or a low level of 0, depending on the set/reset condition. The SR logic is a one-bit bistate device that has two inputs known as set and reset. The device is Set (S) when the output is 1 and Reset (R) when the output 2 is zero (0). The blocking of the converter is vital to protect the grid-switching devices from current faults, voltage increases, and under-voltage. At the clearing of the grid fault event, the converters are de-blocked to restore power. When the de-block signal is received by the converters, the circuit breaker will turn off before the converters de-block. Input (d) is any fault occurrence that may occur from the DC side.
2.8. Test System Description
A 100.7 kW, 330 SunPower array (SPR-305E-WHT-D) solar PV system was utilized for three-phase grid integration under varying solar irradiation. The parameters are depicted in the Appendix A. The IC + IR technique was proposed to extract peak power from the solar PV array. The solar PV array feeds power of 100.7 kW to the grid through a DC-to-DC boost converter followed by DC-AC conversion via a voltage source inverter (VSI). The output voltage of the solar PV array that corresponds to peak power serves as the input of the DC-DC boost converter whose gating pulse is generated from the IC + IR PPPT algorithm. The output of the DC-to-DC converter is connected to the VSI through a DC-link capacitor whose value is maintained at a constant 500 V to balance the power flow within the designed system. The three-phase VSI is fed by solar PV and injects active power into the grid operating under a unity power factor (UPF). A DC voltage of 500 V is converted to 260 VAC by VSI. A 100 kVA, 260 V/20 kV three-phase transformer is employed to interface the VSI with the grid. The block and deblock operation modules are incorporated into the converters to generate the block and de-block signal sequences for the converters, and was designed with the MATLAB/Simulink environment. The solar module consists of two inputs: the temperature in degrees and the irradiance in W/m2. The VSI has internal and external control strategies, which adjust the direct quadrature currents , of the active and reactive current components, while the external control strategy adjusts the voltage of the DC link. The system temperature and the solar irradiation characteristics are obtained at 25 °C and 1000 W/m2 respectively. At the system peak power, the network improves from 273 to 500 VDC. The tracking controller varies and optimizes the duty cycle of the converter to access the peak power. The power factor is kept at unity by the VSI by setting to zero and converting the DC voltage link from 500 VDC to 260 VAC. The converted output voltages of the current regulator and are modulated and utilized by the pulse width modulation generator. A 10 kVAR filtering unit is connected to the VSI output to minimize harmonics generated by the converter. The phase lock loop, voltage, and current regulators of the control system use a sample time of 100 µs and it takes 1 µs to obtain an appropriate pulse width modulation waveform.
3. Results and Discussion
The network was simulated for 3 s. At t = 0.05 s, a time delay block/de-block was introduced into the signal path of both the boost converter and the VSI to delay the insertion indices before a converter switch occurs in the continuous model in Figure 8a. This is applied to prevent the effect of higher phase current, total capacitor voltage deviation, and unwanted signals, such as a switch-on instantaneous input current surge drawn by an electrical device connected to the grid when first turned on. The converter behaves as a rectifier between 0.01 and 0.05 s, and the direct current link capacitor is charged to about 578.7 V (Figure 8b), while the solar voltage obtained is 320.9 V (Figure 8c). The value obtained is equal to the open circuit voltage in Equation (32). At t = 0.05 s, the boost converter and VSI are de-blocked (Figure 8a), and the duty cycle of the boost converter is fixed at D = 0.5 (Figure 8d). The direct current link voltage is controlled and maintained at a steady state of 500.8 V at t = 0.25 s (Figure 8e). Hence, the solar PV steady state voltage in Equation (34) is obtained. The calculated steady state voltage of 250.3 V in Equation (37) agreed with the simulated value of 249.5 V in Figure 8f. The grid current and voltage were kept at a unity power factor such that they were in phase. The solar and the grid output power obtained were 95.3 and 93. 5 kW, respectively (Figure 8g), which are not equal to the rating of the solar PV (100.7 kW).
At t = 0.4 to 0.6 s, PPP tracking is enabled while the PPP regulator initiates the regulation processing by controlling and varying the duty cycle to extract the peak power. Figure 9a depicts the simulation results for solar PV output power, voltage, grid output power, and the duty cycle. The solar PV peak power attained is 100.361 kW, the grid power output is 98.7236 kW, the solar PV voltage improves from 251.6923 to 273.5001 V at t = 0.42 s and is sustained until t = 0.6 s, and the duty cycle reaches 0.44807 and maintains stability at 0.45433 (Figure 9a). The simulation result obtained from the solar PV output voltage in Figure 8a is compared with the solar array specification in Equation (38); both results are the same as those of Equation (40). The error generated is minimized and reduced to zero at t = 0.42 s by the regulator controller in Figure 9b. From the simulation results, there is a strong trend of increasing and decreasing solar PV efficiency. Basically, efficiency improves with irradiance since the fill factor improves as the module voltage/current characteristic graph changes. However, losses also rise and ultimately cause the efficiency to degrade as the irradiance maintains an increase, reaching a peak value at a certain temperature. The impacts of the array temperature and irradiance are obvious, such that there is a decrease in efficiency with an increase in the array back-surface temperature, and a peak value of efficiency is attained when the irradiance is below 1000 W/m2. This satisfied the research question posed in the introduction section, and highlights that the solar radiation has a direct effect on the temperature of the solar cell, as this temperature increases with the increase in solar radiation. The increased temperature was the main cause of the decline in the output of the solar PV. The rise in solar radiation increases the output current until the temperature of the cell interferes and causes the current to fall. The resulting voltages are not significantly affected by the rise in the current, but the effect is greater due to the increase in the cell temperature. A low current and voltage cause a decrease in the resulting power and efficiency of the cell.
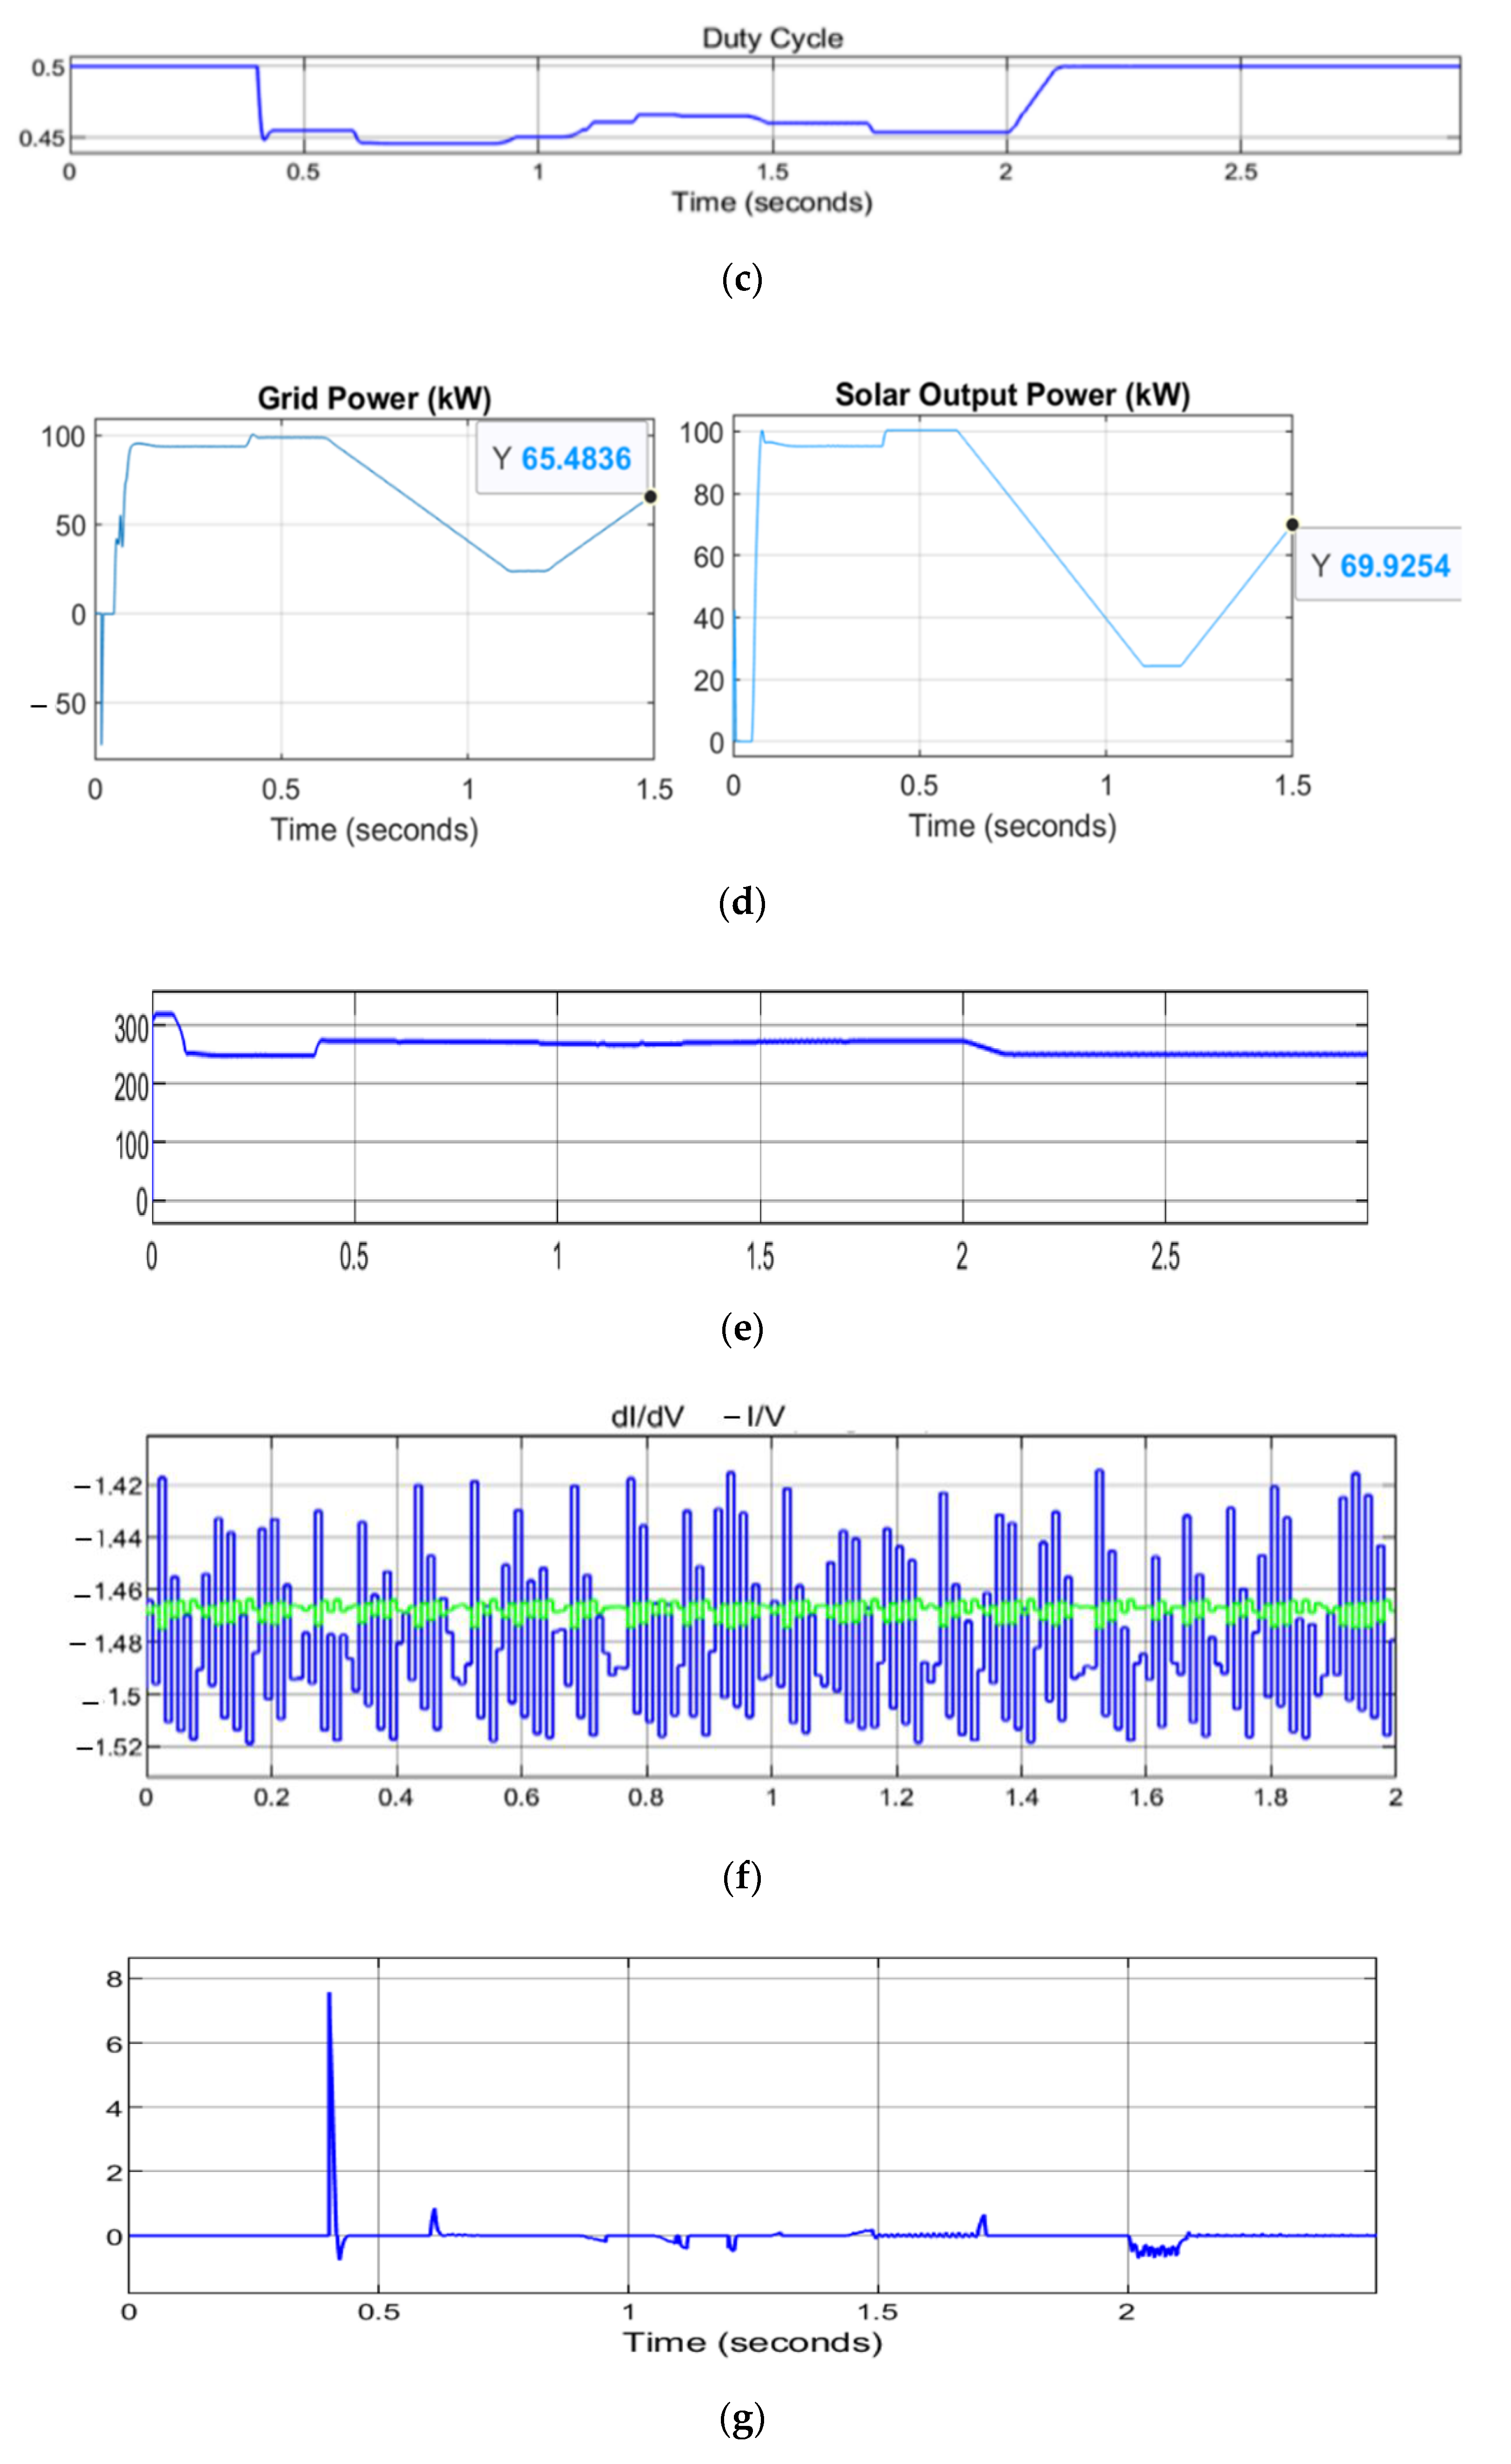
The simulation response between t = 0.62 and 1.5 s shows that there is a variation in the solar PV irradiance (Figure 10); the irradiance of the sun changed suddenly from 100 W/m2 251.116 W/m2 within 0.5 s and maintained stability for 0.1 s. It changed from 251.116 to 686.7565 W/m2 within 0.5 s (Figure 10a), and the temperature remained constant at 25 degrees at t = 1.5 s in Figure 10b. The duty cycle continued to change at t = 1.5 s in Figure 10c but remained stable at t = 2.1 s while D = 0.46007. The variation in the irradiation of the sun resulted in the reduction in the solar PV and the grid output power. Moreover, the solar PV output power changed within 0.5 s from 100.361 to 25 kW, and was stable at 69.9254 kW. The grid output power changed from 98.7236 to 28.2 kW and remained stable at 65.4836 kW within 0.6 s in Figure 10d, while the temperature remained unchanged at 25 degrees. When t was between 1.2 and 1.54 s, the irradiation of the sun was restored from 251.116 to 1000 W/m2 within 0.5 s, while the temperature changed within 0.1 s from 25 to 50 degrees in Figure 10b. The total duration of the change in the sun irradiation was 1.1 s; during this period, the output power was low, but the IC + IR (the green color in Figure 10e) located the PPP due to the equality of conductance (1/V) and conductance increment (∆I/∆V), while the PPP tracking algorithm continued to track the peak power. The solar voltage output attained 295 V but remained stable at 290 V at 2.1 s (Figure 10f). The application of the IR controller minimized the error signal, ripples, and oscillations generated at the sliding surface between the instantaneous and incremental conductance (Figure 10g). The variation in the irradiation caused the voltage of the boost converter to fluctuate between 0.6 to 1.6 s in Figure 10h, but VSI maintained a stable grid voltage throughout the sun irradiation variation in Figure 10i. The VSI prevented the occurrence of a voltage dip in the grid during the variation in irradiation, temperature, and load. The grid voltage remained within the acceptable range and the currents drawn by the loads were very low during the change in the sun irradiation (Figure 10j). The solar PV output power may change suddenly due to a sudden change in solar irradiation caused by the deflection of the incoming beam, clouds, airborne aerosols, snow, ice, and reflectivity of the ground surface. However, with the application of the IC + IR algorithm proposed in this research paper to track the solar PV PPP, an acceptable grid voltage and a stable voltage output of the solar PV array can be achieved. Thus, the proposed approach satisfies the research question asked at the beginning of this research paper. Moreover, the proposed automatic restoration scheme can protect the point of common coupling converters from the higher phase current/voltage, a switch-on instantaneous input current surge, and solar PV and grid faults. The integral controller improves the precision of the system’s large step sizes when the operational level is far from the PPP, and when the small step sizes of the PPP are reached to extract the maximum possible level of power. It also minimizes the error (dI/dV + I/V) between the instantaneous conductance and the incremental conductance, reduces ripples, and improves the accuracy.
4. Conclusions
This paper presents an IC + IR to extract the peak power output from a solar PV array. The proposed method provides excellent and accurate results in tracking peak power output, and an acceptable grid voltage is maintained during weather variations. Ripples and errors (dI/dV + I/V) from PPP tracking on the sliding surface between the instantaneous and incremental conductance are regulated by the integral controller. The proposed converter restoration scheme with block/de-block signal control introduces a delay in the signal path for the converters switching to prevent the effects of higher phase current, deviations in total capacitor voltage, and unwanted signals, such as a switch-on instantaneous input current surge drawn by an electrical device connected to the grid when first turned on. The proposed approach reduces the oscillations in the solar output voltage, resulting in a better digital resolution of the output power, perfect control, and adaptation of the solar system to constantly changing climatic conditions. Thus, the system efficiency is improved. Recommendations regarding two important aspects are made to plant owners who want to ensure their plant’s safety: to monitor the plant through the application of the inverter restoration scheme that incorporates block/de-block control to ensure the safety of the operator, and to provide protection from electrocution and accidents due to grid faults in solar PV panels. Future research will look at the possibility of integrating the flexible needs and voltage stability criteria for microgrids with high renewable energy penetration and storage devices incorporating Internet tracking control.
Author Contributions
A.A.S.: Conceptualization; Methodology; Software; Validation. Formal analysis; Investigation, Writing-original draft. Formal analysis; Investigation, Writing-original draft. K.M.; Formal analysis; Investigation; Writing-review, Supervision; Project administration. I.E.D.: Conceptualization, Methodology, Resources; Writing, Editing; Co-Supervision; Funding/APF. All authors have read and agreed to the published version of the manuscript.
Funding
This research received no external funding.
Institutional Review Board Statement
Not applicable.
Informed Consent Statement
Not applicable.
Data Availability Statement
No data collected.
Conflicts of Interest
I declared that there is not conflict of interest with anybody/institution on this paper during and after the investigation work carried out.
Nomenclature
| PCC | Point of common coupling |
| DC-DC | Direct current to direct current |
| PPP | Peak power point |
| PPPT | Peak power point tracking |
| P & OA | Perturb and observe algorithm |
| GW | Gigawatt |
| PV | Photovoltaic |
| IC | Incremental conductance |
| IR | Integral regulator |
| Open circuit voltage | |
| Short circuit current | |
| G | Surface irradiation at module temperature (T) in kW/m2 |
| Irradiation at standard temperature condition | |
| ∆I | Change in current |
| ∆V | Change in voltage |
| Direct current of the active component | |
| Quadrature currents of the reactive component | |
| VSC | Voltage source converter |
| Input voltage | |
| Output voltage | |
| I0 | Output current of the DC-DC boost converter |
| Switching frequency | |
| Change in voltage | |
| PV output current | |
| PV output voltage | |
| Energy gap of solar cell | |
| Photo-generated current | |
| Series resistor | |
| Shunt resistor | |
| Instantaneous conductance | |
| Incremental conductance | |
| q | Quantity of electron charge |
| α | Ideality factor of the diode |
| γ | Boltzmann’s constant , |
| T | Temperature |
| Diode saturation current | |
| Standard temperature condition | |
| No. of series solar modules | |
| Open circuit voltage | |
| D | Duty |
| Direct current link voltage | |
| Direct current | |
| INC | Incremental conductance |
| MPPT | Maximum power point tracking |
| GMPP | Global maximum power point |
| UPF | Unity power factor |
| Temperature coefficient | |
| Thermal coefficient |
Appendix A

Table A1.
Specifications used for the PV-module, Boost Converter and Transformer.
| Parameters | Values |
| Number of cells per module | 5 |
| Number of parallel strings | 66 |
| Modules connected in parallel | 305.2 W ± 5% |
| Number of series-connected cells | 96 |
| Open-circuit voltage | 64.2 V |
| Short-circuit current | 5.96 A |
| 62.1 volts | |
| Voltage at peak power | 54.7 volts |
| Current at peak power | 5.58 amps |
| Boost converter | Component’s value |
| Inductance | 5 mH |
| Capacitor | 12,000 mF |
| Transformer rating | Component’s value |
| R1, R2 | 1 m Ohm |
| L1, L2 | 3 mH |
| Primary voltage | 260 volts |
| Secondary voltage | 25 kV |
| Nominal power | 100 kVA |
| Solar array output voltage | 250 volts |
| Boost converter output | 500 volts |
| Modulation Index | 0.85 |
References
- Mirza, U.; Ahmad, N.; Majeed, T.; Harijan, K. Wind Energy Development in Pakistan. Renew. Sustain. Energy Rev. 2007, 11, 2179–2190. [Google Scholar] [CrossRef]
- Paul, A.V.; Stephan, S.; Simon, B.; Lennart, S.; Joachim, M. Modeling Energy Demand—A Systematic Literature Review. Energies 2021, 23, 7859. [Google Scholar]
- Chaudhry, M.A.; Raza, R.; Hayat, S.A. Renewable Energy Technologies in Pakistan: Prospects and Challenges. Renew. Sustain. Energy Rev. 2009, 13, 1657–1662. [Google Scholar] [CrossRef]
- Akinyemi, A.S. Optimum Impacts of Renewable Energy Generation on Voltage Dip and Voltage Profile in a Distribution Network. Inter. J. Sci. Eng. Res. 2019, 10, 280–291. [Google Scholar]
- Akinyemi, A.S.; Awodele, K. Voltage Profiles Improvement with Wind Energy Converter Connected to a Distribution Network. In Proceedings of the Southern Africa University Power Engineering Conference SAUPEC, Johannesburg, South Africa, 28–30 January 2015. [Google Scholar]
- Akinyemi, A.S.; Davidson, I.E. Impact of Renewable Energy Generation on Voltage Flicker with Dynamic Load Connected to Distribution Network. Inter. J. Appl. Eng. Res. 2019, 14, 3137–3145. [Google Scholar]
- Osaloni, O.O.; Akinyemi, A.S. Voltage Profile improvement and Loss Reduction in LV Distribution network using Genetic Algorithm. Inter. J. Sci. Eng. Res. 2019, 10, 1857–1863. [Google Scholar]
- Winstona, D.P.; Kumaravelb, S.; Kumarc, B.P.; Devakirubakaran, S. Performance Improvement of Solar PV Array Topologies During Various Partial Shading Conditions. Sol. Energy 2020, 196, 228–242. [Google Scholar] [CrossRef]
- Chuanxiang, X.; Kazutaka, I.; Tsugutomo, K.; Keishin, K.; Qiang, G. Proposal for an Active PV Array to Improve System Efficiency During Partial Shading. IEEE Access 2021, 9, 143423–143433. [Google Scholar]
- Mahmoud, N.A.; Karar, M.; Matti, L.; Mohamed, M.D. An Efficient Fuzzy-Logic Based Variable-Step Incremental Conductance MPPT Method for Grid-Connected PV Systems. IEEE Access 2021, 9, 26420–26430. [Google Scholar]
- Elianne, M.; Jenny, C.; Geovanny, M. Short-Term Forecasting of Wind Energy: A Comparison of Deep Learning Frameworks. Energies 2021, 22, 7943. [Google Scholar]
- Abunima, H.; Teh, J. Reliability Modeling of PV Systems Based on Time Varying Failure Rates. IEEE Access 2020, 8, 14367–14376. [Google Scholar] [CrossRef]
- Panda, B.; Panda, B.; Khillo, A.; Pradhan, A.; Jena, C. PV Based DC-DC Converter Design Using MPPT for Stand Alone System. Int. J. Sci. Technol. Res. 2020, 9, 5075–5079. [Google Scholar]
- Imran, P.; Immad, S.; Saad, M.; Adil, S.; Mohd, T.; Basem, A. Most Valuable Player Algorithm based Maximum Power Point Tracking for a Partially Shaded PV Generation System. IEEE Trans. Sustain. Energy 2021, 12, 18761890. [Google Scholar]
- Rajib, B.R.; Rokonuzzaman, M.; Nowshad, A.; Mahmuda, K.M.; Sanath, A.; Saifur, R.; Jagadeesh, P. A Comparative Performance Analysis of ANN Algorithms for MPPT Energy Harvesting in Solar PV System. IEEE Access 2021, 9, 102137–102152. [Google Scholar]
- Catalina, G.; Carlos, R.; Samir, K.; Jose, R. MPPT Algorithm Based on Artificial Bee Colony for PV System. IEEE Access 2021, 9, 43121–43133. [Google Scholar]
- Anusha, K.; Hossein, D.T.; Nandha, K.K.; Glen, G.F.; Josep, P.; Thangavel, S. Flexible Power Point Tracking for Solar Photovoltaic Systems Using Secant Method. IEEE Trans. Power Electron. 2021, 36, 9419–9429. [Google Scholar]
- Afzaal, M.U.; ISajjad, I.A.; Awan, A.B.; Paracha, K.N.; Khan, M.F.; Bhatti, A.R.; Tlili, I. Probabilistic Generation Model of Solar Irradiance for Grid Connected Photovoltaic Systems Using Weibull Distribution. Sustainability 2020, 12, 2241. [Google Scholar] [CrossRef] [Green Version]
- Santos, J.L.; Antunes, L.; Chehap, A.; Cruz, C. A Maximum Power Point Tracker for PV System Using a High-Performance Boost Converter. Elsevier Sol. Energy 2006, 80, 772–778. [Google Scholar] [CrossRef]
- Welfle, A.; Thornley, P.; Röder, M. A Review of the Role of Bioenergy Modelling in Renewable Energy Research Policy Development. Biomass Bioenergy 2020, 136, 105542. [Google Scholar] [CrossRef]
- Thellufsen, J.Z.; Lund, H.; Sorknæs, P.; Østergaard, P.A.; Chang, M.; Drysdale, D.; Sperling, K. Smart Energy Cities in a 100% Renewable Energy Context. Renew. Sustain. Energy Rev. 2020, 129, 109922. [Google Scholar] [CrossRef]
- Saibal, M.; Ashok, K.A. Comparative Analysis of Various P O MPPT Algorithm for PV System Under Varying Radiation Condition. Inter. In Proceedings of the 2021 1st International Conference on Power Electronics and Energy (ICPEE), Bhubaneswar, India, 2–3 January 2021. [Google Scholar]
- Khadidja, S.; Mountassar, M.; M’hamed, B. Comparative Study of Incremental Conductance and Perturb Observe (P O) MPPT Methods for Photovoltaic Application. In Proceedings of the 2017 International Conference on Green Energy Conversion Systems (GECS), Hammamet, Tunisia, 23–25 March 2017. [Google Scholar]
- Podder, A.K.; Roy, N.K.; Pota, H.R. IET Review Power Gener. MPPT Methods for Solar PV system. Crit. Rev. Based Track. Nat. 2019, 13, 1615–1632. [Google Scholar]
- Akinyemi, A.S.; Kabeya, M.; Davidson, I.E. Voltage Rise Regulation with a Grid Connected Solar Photovoltaic System. Energies 2021, 14, 7510. [Google Scholar]
- Gupta, A.K.; Pachauri, R.K.; Maity, T.; Chauhan, Y.K.; Mahela, O.P.; Khan, B.; Gupta, P.K. Effect of Various Incremental Conductance MPPT Methods on the Charging of Battery Load Feed by Solar Panel. IEEE Access 2021, 9, 90977–90988. [Google Scholar] [CrossRef]
- Zand, S.J.; Hsia, K.H.; Eskandarian, N.; Mobayen, S. Improvement of Self-Predictive Incremental Conductance Algorithm with the Ability to Detect Dynamic Conditions. Energies 2021, 14, 1234. [Google Scholar] [CrossRef]
- Owusu-Nyarko, I.; Elgenedy, M.A.; Abdelsalam, I.; Ahmed, K.H. Modified Variable Step-size Incremental Conductance MPPT Technique for Photovoltaic Systems. Electronics 2021, 10, 2331. [Google Scholar] [CrossRef]
- Pathak, P.K.; Padmanaban, S.; Yadav, A.K.; Alvi, P.A.; Khan, B. Modified Incremental Conductance MPPT Algorithm for SPV-based Grid-tied and Stand-alone Systems. IET Gen. Trans. Distrib. 2021, 10, 776–791. [Google Scholar] [CrossRef]
- Hussaian, C.B.; Rani, C. Different Conventional and Soft Computing MPPT Techniques for Solar PV Systems with High Step-Up Boost Converters: A Comprehensive Analysis. Energies 2020, 13, 371. [Google Scholar]
- Noureddine, B.; Djamel, B.; Vicente, F.; Fares, B.; Boualam, B.; Bachir, B. Maximum Power Point Tracker Based on Fuzzy Adaptive Radial Basis Function Neural Network for PV-System. Energies 2019, 12, 2827. [Google Scholar]
- Tomasz, B. A Conductance-Based MPPT Method with Reduced Impact of the Voltage Ripple for One-Phase Solar Powered Vehicle or Aircraft Systems. Energies 2020, 13, 1496. [Google Scholar]
- Ma, M.; Liu, X.; Lee, K.Y. Maximum Power Point Tracking and Voltage Regulation of Two-Stage Grid-Tied PV System Based on Model Predictive Control. Energies 2020, 13, 1304. [Google Scholar] [CrossRef] [Green Version]
- Leopoldo, G.; Belem, S.; Otniel, P.; Juan Carlos, Á.; Pánfilo, R.M.; Rigoberto, M. Flatness-Based Control for the Maximum Power Point Tracking in a Photovoltaic System. Energies 2019, 12, 1843. [Google Scholar]
- Femia, N.; Petrone, G.; Spagnuolo, G.; Vitelli, M. Optimization of Perturb and Observe Maximum Power Point Tracking Method. IEEE Trans. Power Electron. 2005, 20, 963–973. [Google Scholar] [CrossRef]
- Hyeon-Seok, L.; Jae-Jung, Y. Advanced MPPT Algorithm for Distributed Photovoltaic Systems. Energies 2019, 12, 3576. [Google Scholar]
- Mohamed, L.; Daniel, T.C.; Petru, A.C. Management and Performance Control Analysis of Hybrid Photovoltaic Energy Storage System under Variable Solar Irradiation. Energies 2020, 13, 3043. [Google Scholar]
- Espi, J.M.; Castello, J. A Novel Fast MPPT Strategy for High Efficiency PV Battery Chargers. Energies 2019, 12, 1152. [Google Scholar] [CrossRef] [Green Version]
- Wijaya, B.H.; Subroto, R.K.; Lian, K.L.; Hariyanto, N. A Maximum Power Point Tracking Method Based on a Modified Grasshopper Algorithm Combined with Incremental Conductance. Energies 2020, 13, 4329. [Google Scholar] [CrossRef]
- Fatih, O.K.; Ahmet, G.; Mustafa, S. Design and Hardware Implementation Based on Hybrid Structure for MPPT of PV System Using an Interval Type-2 TSK Fuzzy Logic Controller. Energies 2020, 13, 1842. [Google Scholar]
- Raihan, K.; Pranda, M.P.; Hyunjin, L. Performance Assessment of Global Horizontal Irradiance Models in All-Sky Conditions. Energies 2021, 23, 7939. [Google Scholar]
- Anjan, D.; Imtiaz, P.; Dastgir, M.G.; Asim, N.; Temitayo, O.O.; Hugo, R.; Arif, S. Voltage Regulation of Photovoltaic System with Varying Loads. In Proceedings of the 2020 SoutheastCon, Raleigh, NC, USA, 28–29 March 2020. [Google Scholar]
- Michelle, K.S.; Mehreen, G.S.; Hassam, C. Review on the Sources of Power Loss in Monofacial and Bifacial Photovoltaic Technologies. Energies 2021, 23, 7935. [Google Scholar]
- Krishnendu, S.; Arkatanu, M.; Mandal, K.K.; Bhimsen, T. Control Strategy for Active and Reactive Power Regulation of Grid Tied Photovoltaic System. In Proceedings of the Control Strategy for Active and Reactive Power Regulation of Grid Tied Photovoltaic System, Kolkata, India, 5–7 February 2021. [Google Scholar]
- Diego, A.F.; Alberto, L.; Norma, L.; Octavio, G.; César, D.; Ignacio, A. Optimal Strategy for the Improvement of the Overall Performance of Dual-Axis Solar Tracking Systems. Energies 2021, 22, 7795. [Google Scholar]
- Vincenzo, F.; Aldo, O.; Alessandra, D.G. Assessment of the Usability and Accuracy of Two-Diode Models for Photovoltaic Modules. Energies 2017, 10, 564. [Google Scholar]
- Wang, Z.; Peng, Y.; Liu, Y.; Guo, Y.; Liu, Y.; Geng, H.; Li, S.; Fan, C. Photovoltaic Power Quality Analysis Based on the Modulation Broadband Mode Decomposition Algorithm. Energies 2021, 23, 7948. [Google Scholar] [CrossRef]
- Daniele, Z.; Marija, D.; Luciano, M.S. Income Maximization in a Maltese Household Photovoltaic System by Means of Output and Consumption Simulations. Energies 2021, 23, 7934. [Google Scholar]
- Mehmet, A.Y.; Marzena, N. Modified Maximum Power Point Tracking Algorithm under Time-Varying Solar Irradiation. Energies 2020, 24, 6722. [Google Scholar]
- Aouchiche, N.; Cheikh, M.A.; Becherif, M.; Ebrahim, M.A.; Hadjarab, A. Fuzzy Logic Approach Based MPPT for the Dynamic Performance Improvement for PV Systems. In Proceedings of the Fuzzy Logic Approach Based MPPT for the Dynamic Performance Improvement for PV Systems, Boumerdes, Algeria, 29–31 October 2017. [Google Scholar]
Figure 1.
(a) Single-diode PV cell model; (b) double-diode PV cell model.

Figure 2.
Perturb and observe flowchart.

Figure 3.
Flowchart of incremental conductance.

Figure 4.
(a) Block diagram of incremental conductance with an integral regulator; (b) IC PPPT technique flowchart; (c) PV array power curve.
Figure 4.
(a) Block diagram of incremental conductance with an integral regulator; (b) IC PPPT technique flowchart; (c) PV array power curve.

Figure 5.
Proposed boost converter and the IC + IR PPPT technique.

Figure 6.
Proposed diagram of converter restoration scheme.

Figure 7.
Converter block/de-block module strategy.

Figure 8.
(a) Converters block/de-block; (b) DC link and reference voltage; (c) solar PV voltage corresponding to open circuit voltage; (d) boost converter duty cycle; (e) regulated DC link voltage; (f) solar output voltage and power; (g) solar PV and grid output power.
Figure 8.
(a) Converters block/de-block; (b) DC link and reference voltage; (c) solar PV voltage corresponding to open circuit voltage; (d) boost converter duty cycle; (e) regulated DC link voltage; (f) solar output voltage and power; (g) solar PV and grid output power.


Figure 9.
(a) PPP tracking; (b) regulator reduces error to zero at t = 0.4 s.

Figure 10.
(a) Change in the sun irradiance; (b) change in the temperature; (c) duty cycle; (d) grid and solar output power; (e) solar output voltage; (f) incremental conductance algorithm tracking the PPP; (g) error minimized by the application of the integral regulator scheme; (h) boost converter; (i) VSC voltage; (j) grid voltage and current.


Publisher’s Note: MDPI stays neutral with regard to jurisdictional claims in published maps and institutional affiliations. |
© 2022 by the authors. Licensee MDPI, Basel, Switzerland. This article is an open access article distributed under the terms and conditions of the Creative Commons Attribution (CC BY) license (https://creativecommons.org/licenses/by/4.0/).
Share and Cite
MDPI and ACS Style
Stephen, A.A.; Musasa, K.; Davidson, I.E. Modelling of Solar PV under Varying Condition with an Improved Incremental Conductance and Integral Regulator. Energies 2022, 15, 2405. https://doi.org/10.3390/en15072405
AMA Style
Stephen AA, Musasa K, Davidson IE. Modelling of Solar PV under Varying Condition with an Improved Incremental Conductance and Integral Regulator. Energies. 2022; 15(7):2405. https://doi.org/10.3390/en15072405
Chicago/Turabian StyleStephen, Akinyemi Ayodeji, Kabeya Musasa, and Innocent Ewean Davidson. 2022. "Modelling of Solar PV under Varying Condition with an Improved Incremental Conductance and Integral Regulator" Energies 15, no. 7: 2405. https://doi.org/10.3390/en15072405
Note that from the first issue of 2016, this journal uses article numbers instead of page numbers. See further details here.