
Quantifying of Vision through Polymer Dispersed Liquid Crystal Double-Glazed Window


1
Industry & Innovation Research Institute, Sheffield Hallam University, Sheffield S1 1WB, UK
2
Kuwait Fund for Arab Economic Development, Mubarak Al-Kabeer St., Safat, P.O. Box 2921, Kuwait City 13030, Kuwait
*
Author to whom correspondence should be addressed.
Energies 2022, 15(9), 3196; https://doi.org/10.3390/en15093196
Submission received: 26 February 2022
/
Revised: 20 April 2022
/
Accepted: 25 April 2022
/
Published: 27 April 2022
(This article belongs to the Topic Building Energy and Environment)
Abstract
:The visual linking of a building’s occupants with the outside views is a basic property of windows. However, vision through windows is not yet a metricized factor. The previous research employs a human survey methods to assess the vision through conventional windows. The recently fabricated smart films add a changeable visual transparency feature to the windows. The varied operating transparency challenges the evaluation of vision. Therefore, surveying human preferences is no longer a feasible approach for smart windows. This paper proposes an image-processing-based approach to quantify the vision quality through smart windows. The proposed method was experimentally applied to a polymer dispersed liquid crystal (PDLC) double-glazed window. The system instantaneously determines the available contrast band of the scenes seen through the window. The system adjusts the excitation of the PDLC film to maintain a desired vision level within the determined vision band. A preferred vision ratio (PVR) is proposed to meet the requirements of occupant comfort. The impact of the PVR on vision quality, solar heat gain, and daylight performance was investigated experimentally. The results show that the system can determine the available vision comfort band during daytime considering different occupant requirements.
1. Introduction
Windows are considered to be an essential part in the envelope of buildings as they play an important role in providing the daylight for the internal environments and maintaining vision comfort for the occupants.
The major tendency to conduct large studies on windows has resulted in associated challenges such as vision comfort. Vision comfort not only concerns the quantity of daylight in indoor environments, but also refers to the vision quality through the window. Understanding the quality and quantity of daylight in buildings is thus crucial to satisfying the indoor occupant comfort. Daylight glare (DG), correlated color temperature (CCT), and color rending index (CRI) are the three crucial components to understand visual comfort [1]. However, these components describe the comfort in a static scenario where glazing has a constant transparency. Using switchable glazing, such as the newly developed thin films, in which the transparency changes, results in more challenges to assess the vision comfort.
Studies have been carried out to investigate the impact of daylight, and evaluate or improve the daylight performance and visual comfort in current and future buildings [2,3,4]. For example, Wang et al. [5] studied the influence of outdoor views provided by the window on patients who had undergone surgery in Taiwan. The authors concluded that vision comfort through the window dramatically reduced the usage of medicines to treat aches.
Pilechiha et al. [6] introduced a new method to optimize energy consumption through windows of office buildings. The author emphasized that the proposed method should not impact the quality of vision through the window or the quantity of the daylight inside the building.
Dušan et al. [7] proposed a special approach to design a lighting system for industrial buildings. The author stated that, in addition to the availability of adequate daylight in the working area, the workers must have contact with the external environment to improve their performance.
In addition to the studies mentioned above, other papers analyzed the function of windows and their influence on different kinds of occupants, such as employees, workers, and patients. These studies affirmed that the essential functions of windows are providing daylight and maintaining good vision of the outdoor views [8,9,10].
Ma et al. [11] surveyed the preferences of a set of students regarding the vision comfort and discomfort glare of a study area for six months. The authors used the output data to create a building information model (BIM), which was translated into an algorithm for a machine learning system, and the resultant algorithm was used to control a proposed window shading system.
Day et al. [12] surveyed 5031 people in the United States regarding their satisfaction in their visual comfort. They were distributed in three different buildings. The buildings employed automated blinds, electrochromic glazing, and roller shades techniques, respectively, to control the accessed daylight in the buildings. The people in buildings 1 and 2, who occupied the most luminous environments, were satisfied, with higher levels of output and higher levels of contentment. Moreover, the satisfaction level of occupants was directly proportional to the seating position inside the building. The most satisfied people where those sitting closer to the windows. Negative feedback was provided by the occupants of building 3, which had the lowest level of luminance due to the use of electrochromic glazing.
Lim et al. [13] examined the influence of an artificial light-controlled system on energy consumption and occupants’ behavior in two different workplaces. Access to daylight was provided in the first workplace, but not in the second. The results showed that utilization of the authors’ proposed lighting system in the first area contributed to a reduction of 78% in the lighting energy consumption. Additionally, the occupants in both workplaces were satisfied with the brightness of the environment.
The cases cited above, in addition to other studies [14,15,16], depended on individuals’ observations to evaluate the vision comfort in different environments, including the quantity of the received daylight and the quality of vision through the window towards external views. However, questionnaires are a time-consuming method to gather human preferences during different seasons. In addition, this approach cannot ensure that the gathered data are sufficient to cover all expected user needs in practical applications.
New technologies have been developed recently in the windows industry, which have introduced innovative materials to replace or add to the glazing, such as semi-transparent photovoltaic panels (STPVs), suspended particle device (SPD) films, electrochromic films, and polymer dispersed liquid crystal (PDLC) films. All have different optical and thermal characteristics compared to normal glass. Integrating these panels and films into glazing introduces other dimensions to be investigated, i.e., some have controllable optical and thermal properties [17,18,19,20,21,22].
Another study by Ghosh et al. [1] analyzed the daylight performance of building-integrated photovoltaic (BIPV) windows in an office building in Saudi Arabia. The result shows that a transparency of 50 to 70 percent can ensure a comfort glare level during winter, and 70% transparency in summer. By comparison, increasing the transparency to 90% resulted in a high daylight level inside the building; however, the discomfort due to glare was indicated to be high.
Detsi et al. [23] evaluated the energy consumption of lighting, cooling, and heating loads in office buildings in Athens and Stockholm. The study proposed a triple-glazed window of thermochromic, electrochromic, and low-e coatings in Insulated Glass Units (IGUs). Overall annual energy savings of 18.5% and 8.1% were achieved in Athens and Stockholm, respectively. The study concluded that the proposed window provides good visual comfort for employees in terms of the daylight glare index. The visible transparency of the proposed window ranged from 0.46 to 0.75; however, the study did not evaluate the quality of the external views within the given range of transparency.
Ko et al. [24] investigated the performance of an SPD window in an office building in South Korea. The research method relied on varying the visible transparency of the SPD film by changing the applied voltage; thus, the solar heat gain coefficient (SHGC) was modified accordingly (the SHGC controllable range was 0.11 to 0.45). An annual energy saving of 4.1% was realized; however, reducing the visible transparency compromised the clarity of the vision toward the outside environment for the employees.
Oh et al. [25] analyzed the feasibility of attaching different types of PDLC thin film to the windows and the façade walls in terms of energy consumption and daylight performance. Utilization of different kinds of PDLC thin films with existing windows showed energy savings of between 3.1% and 17%; in addition, the discomfort glare ratio of the internal environment was enhanced. Again, the study ignored the effect of reducing the visible transmission, after adding the PDLC film, on the quality of vision through the window.
Hemaida et al. [26] investigated the influence of employing PDLC windows in office buildings on cooling consumption in Riyadh, Saudi Arabia, and heating consumption in London, UK. The study concluded that the proposed window was more efficient, reducing cooling capacity by 12.8% in Riyadh, while the same window led to a reduction in heating capacity of 4.9% in London. The study also deduced that the PDLC window provides an acceptable level of daylight for interior environments. The results showed that the window accomplished 75.8% of the annual required daylight glare in Riyadh and approximately 63% in London. The study mentioned that the visible transmittance of the window ranged from 44% (OFF state) to 79% (ON state); however, the study neglected to assess the impact of decreasing the glazing visible transmission on the vision through the window.
Previous research, especially that utilizing dynamic windows, has focused on evaluating vision comfort by quantifying the daylight in internal environments. The assessment usually relies on measuring the available luminance. However, visual access to the external environment through the window has been studied only by surveying and analyzing human preferences. With introducing the switchable films and dynamic optical and thermal properties of glazing, there are many settings that can bring challenges to be surveyed or investigated to assess the vision comfort properly. If artificial intelligence is used to dominate how windows are controlled, it is important to quantify visual comfort and develop algorithms to parameterize it.
Human visual perception is based on the contrast of images [27,28,29]. The contrast property enables human eyes to distinguish between two adjacent objects in an image [30,31]. Therefore, quantifying vision through glazing can be achieved using an artificial vision system to derive the real-time contrast value, which reflects the quality of human vision.
Previous studies have employed image processing to determine the daylight glare index, discomfort glare index, and other factors that reflect the quantity of daylight in a specific area. For example, Fan et al. [32] used image-based simulation to determine the daylight level in a gymnasium. In addition, Hegazy et al. [33] quantified the daylight in a virtual environment using luminosity histogram analysis. This method uses digital images of the environment, in which each pixel is represented in the luminosity histogram according to its brightness level, which reflects the luminance of a particular point in a given area. Futagami et al. [34] utilized an image-based motion sensor to determine the luminance level of a workplace. The images were taken by a visible light camera. Day et al. [12] evaluated the daylight illuminance in three office buildings. The research team captured HDR images and then processed them using the Evaglare algorithm [35] to determine the daylight glare probability. None of these studies evaluated the vision to exterior views through PDLC glazing.
To summarize, the previous studies emphasized that visual linking of occupants to the external views is an essential function for windows. Unfortunately, assessment of vision through windows was not considered by most of the previous research, although some papers relied on surveying of individuals’ preferences to assess the vision through windows. However, surveys usually require a large amount of time to cover all seasonal conditions; in addition, the outcome data may not be adequate to cover the wide variety of preferences of users in real life. Furthermore, following the integration of thin-film technologies with the window industry, and the addition of variable-transparency features to windows, surveying is no longer a feasible method to evaluate the vision through windows.
Therefore, this paper proposes an online image-processing-based method to quantify the vision through a PDLC double-glazed window. This approach can be used to establish levels of occupants’ visual comfort, which are fed into a controller to constrain the transparency setting of the PDLC to prevent discomfort. The proposed system adds observability and controllability features for buildings’ controllers, i.e., artificial intelligence systems, to mathematically define the visual comfort of smart windows and to ensure a minimum level of viewing quality towards external views for the occupants. Overall, the proposed method will provide an alternative way to assess vision through windows, and save time in window design, considering all the expected configurations of smart windows.
2. Materials and Methods
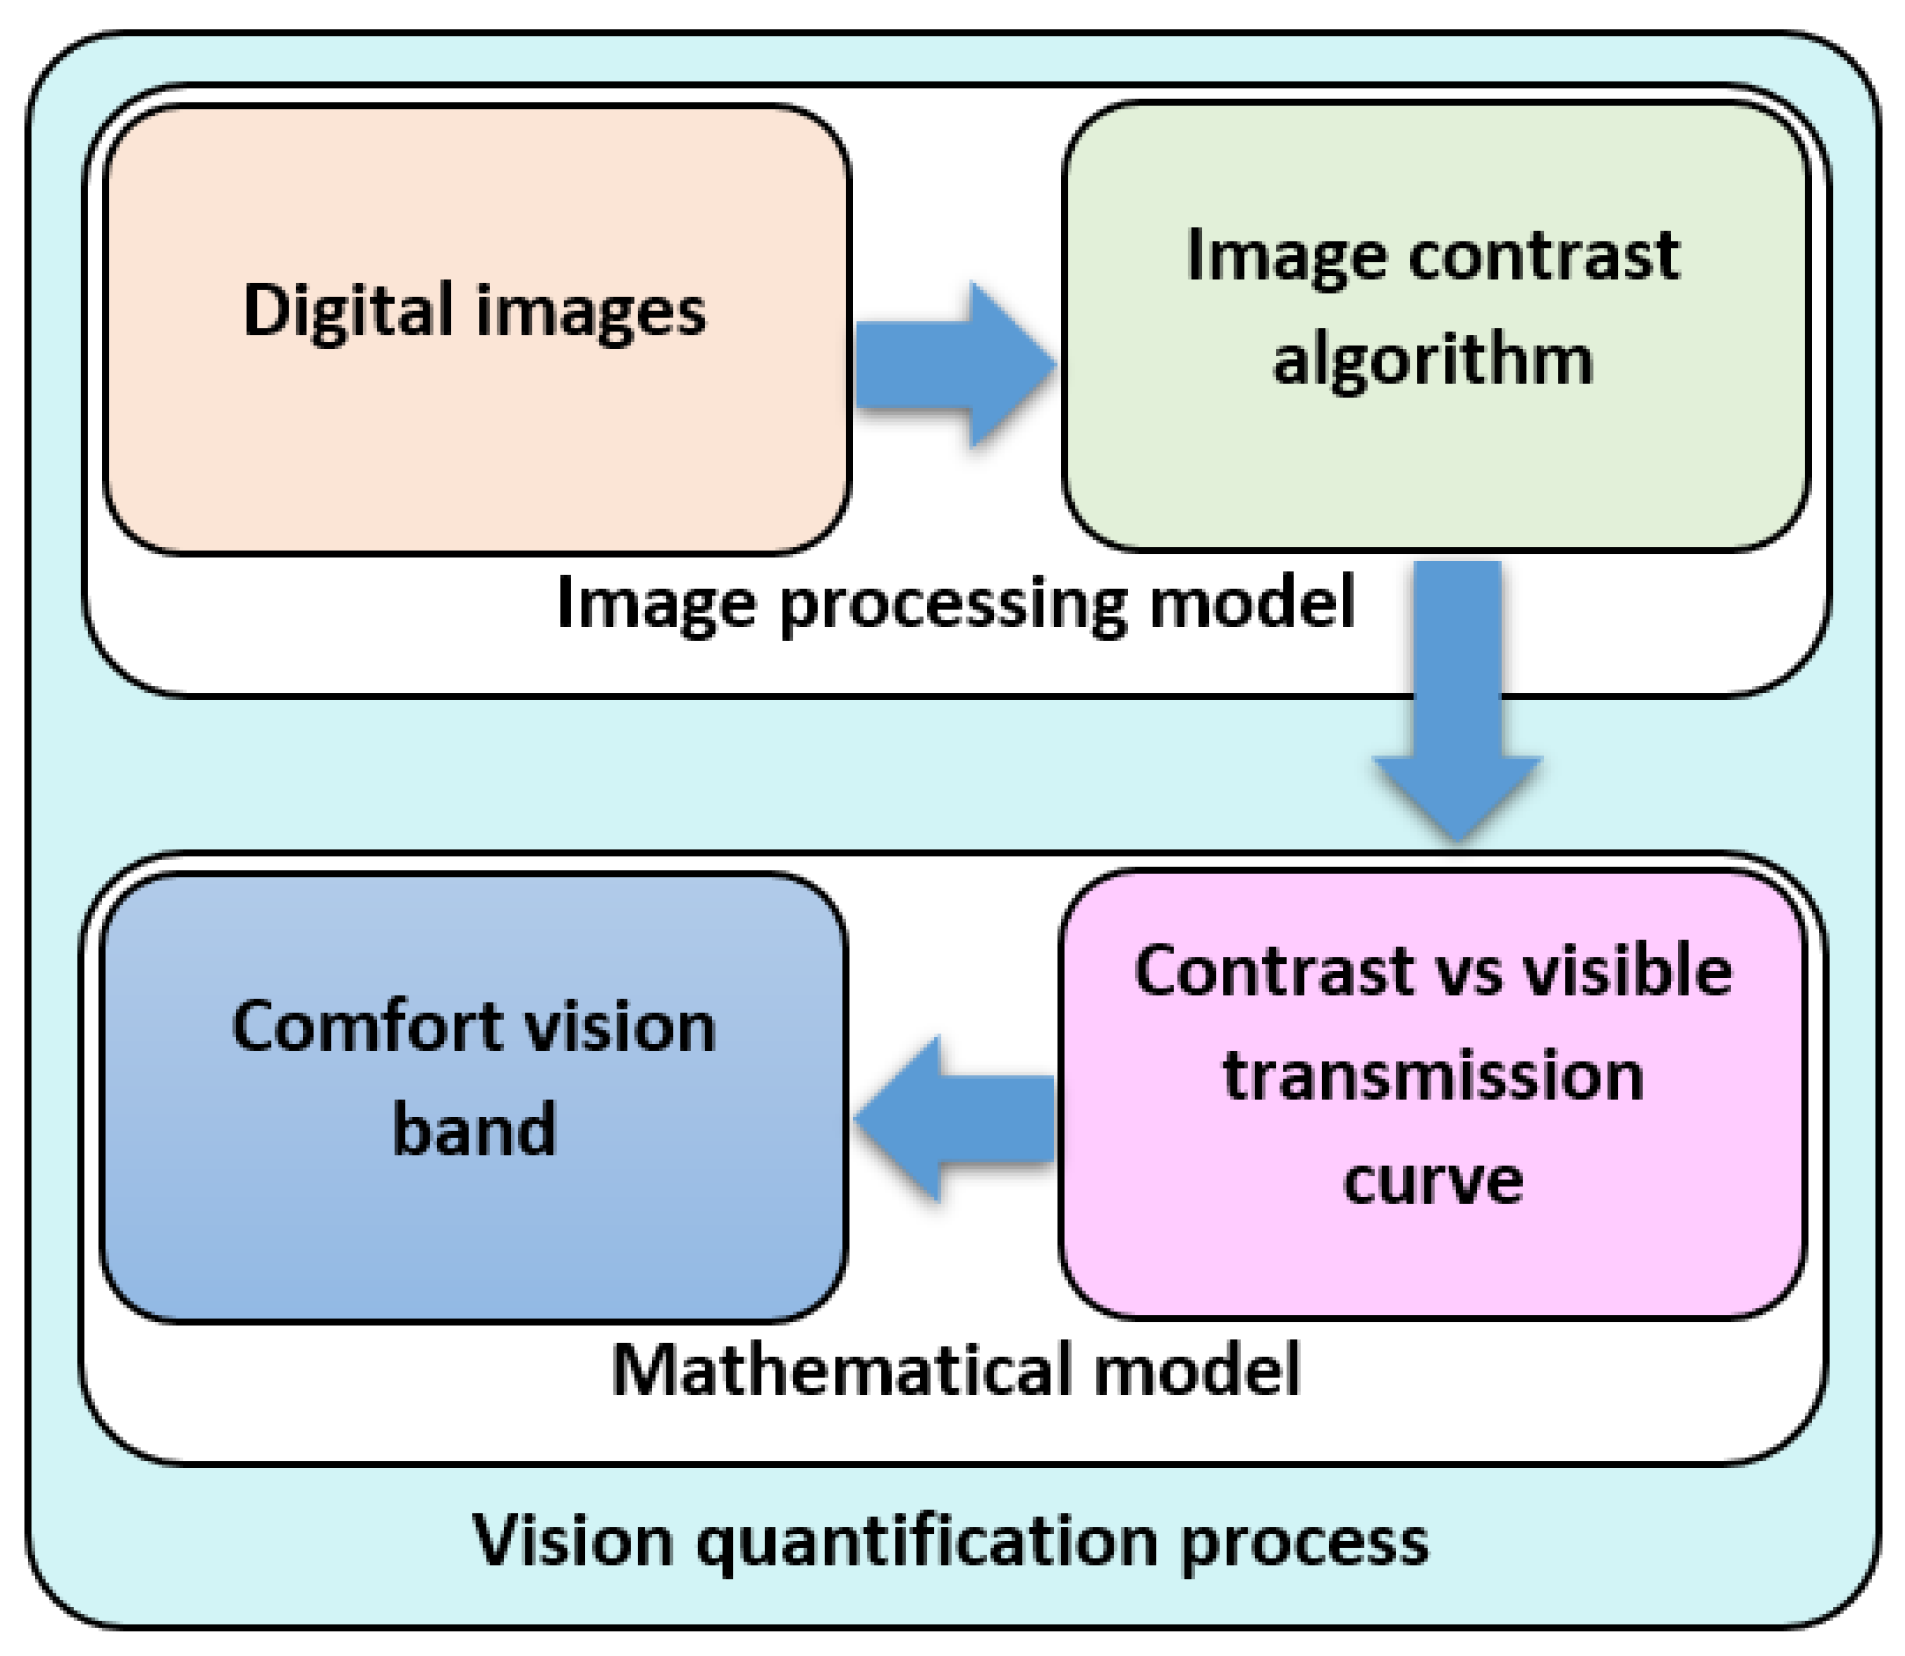
Figure 1 demonstrates the proposed online vision quantification methodology. It has two components: (a) an image-processing model and (b) a mathematical model.
- To develop the image-processing model, a vision sensor, such as an HD camera, captures a set of photos from inside an environment towards the external views through the PDLC double-glazed window. A group of 16 photos is captured every 30 min. Each photo is taken with different levels of PDLC transparency, i.e., from an opaque state to a transparent state. Thereafter, the contrast value of each image is extracted individually based on a developed algorithm that sends a combination of transparency and contrast.
- To develop the mathematical model, an instantaneous contrast curve is obtained between contrast values and the operating visible transmission for each time slot during the daytime. The vision comfort band is derived with the lowest and highest allowed values of image contrast at a given time. This is fed back to the PDLC transparency setting to further limit the transparency range.
2.1. Methodology Setup
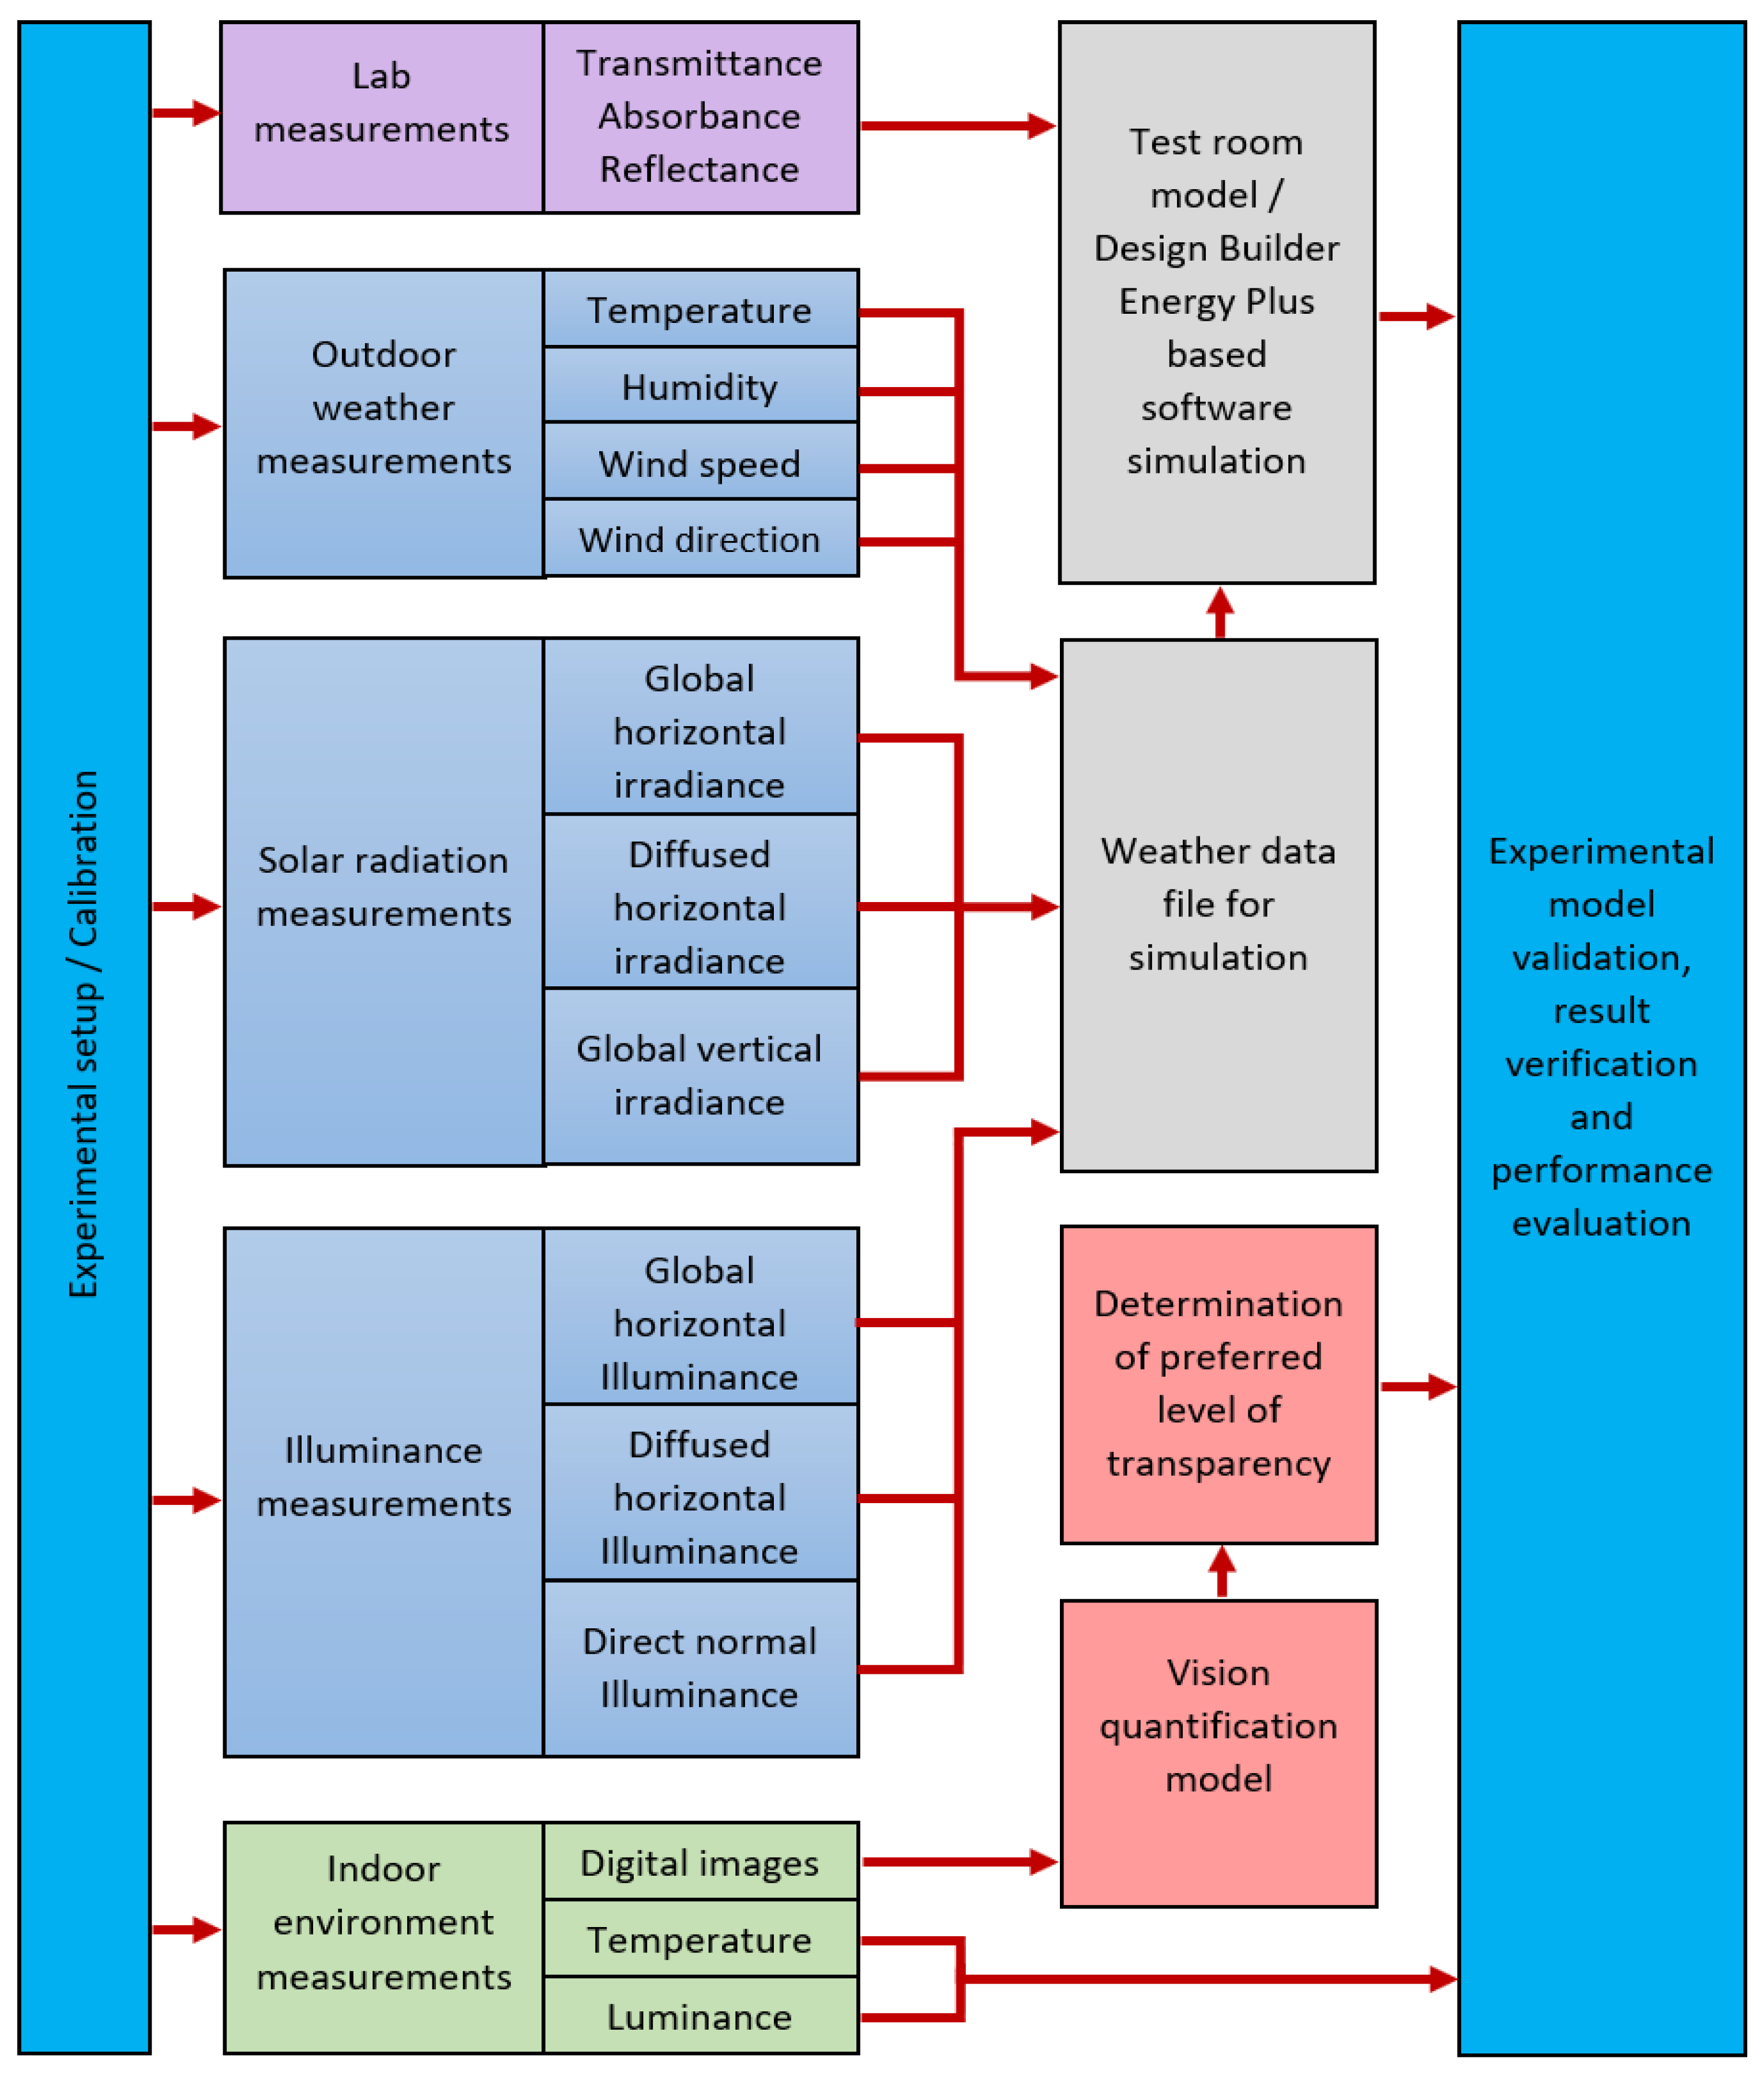
The experimental setup includes a test room, sensors, and data loggers required for indoor and outdoor measurements, as shown in Figure 2. The optical properties of the glazing were measured by a spectrometer device in the laboratory. In addition, a weather data file was necessary to apply the experimental outdoor conditions to the simulated model; however, three kinds of data were required to prepare the weather data. Firstly, outdoor weather data include the temperature, humidity, atmosphere pressure, wind speed, and wind direction. Secondly, solar radiation data encompass global horizontal irradiance, diffused horizontal irradiance, and global vertical irradiance. The direct normal irradiance (DNI) is also needed for the weather data file; however, Equation (1) was used to estimate it [36]:
where is the direct normal irradiance in W/m2, is the global horizontal irradiance in W/m2, is the diffused horizontal irradiance in W/m2, and is the zenith angle.
Thirdly, the illuminance data comprise global horizontal illuminance, diffused horizontal illuminance, and direct normal illuminance. The Illuminance Engineering Society of North America (IESNA) approach provides an appropriate approximation for the available illuminance in solar radiation. The following equations elucidate the illuminance calculation procedures of the IESNA method, as proposed by Kandilli and Ulgen [37]:
where is the extraterrestrial illuminance, is the solar illuminance constant, and is the day of the year. Then, the direct normal illuminance can be determined using Equation (3):
where m is the air mass, which can be expressed as follows:
where is the angle of altitude in degrees, and the small “c” is a constant, which can be quoted from Table 1 according to the sky condition. Thereafter, direct horizontal illuminance is calculated using Equation (5):
Based on the condition of the sky, the diffuse (or sky) horizontal illuminance can be computed using Equation (6):
The constants A, B, and C categorize the condition of the sky into cloudy, partly cloudy, and clear. Table 1 depicts the value of sky parameters for each category; it is noted that, on a cloudy day, no direct sun is available; therefore, .
Finally, the total illuminance falling on the horizontal plane is given in Equation (7):
The experimental indoor measurements involve the temperature and illuminance level inside the test room, which are used to evaluate the performance and validate the system. Additionally, digital images are captured from inside the test room towards the external environment through the window. These images are applied to the proposed vision quantification model to determine the comfort vision band in real time. The outdoor measurements were employed to prepare the weather data file of the commercial DESIGN BUILDER software. DESIGN BUILDER software was used to derive the energy model. The weather and optical data were applied to the model to achieve the simulation. The simulated and experimental data, in addition to the outcome of the quantification process, were used to validate the experimental model, verify the experimental result, and evaluate the system performance.
2.2. Image Processing
For contrast measurement, the RMS contrast method in Equation (8) was adopted [38]:
where M and N are the numbers of columns and rows of the image , respectively; is the value of the pixel in the ith column and the jth row; and is the average brightness of the image , which is given in Equation (9) in the range [0, 1]:
The images in Figure 3 were captured in an external environment during daytime on a sunny day through a double-glazed PDLC window with different visible transparencies. Each image was taken after setting the applied AC voltage of the PDLC within the rated voltage (0 to 200 V), as shown in the figure.
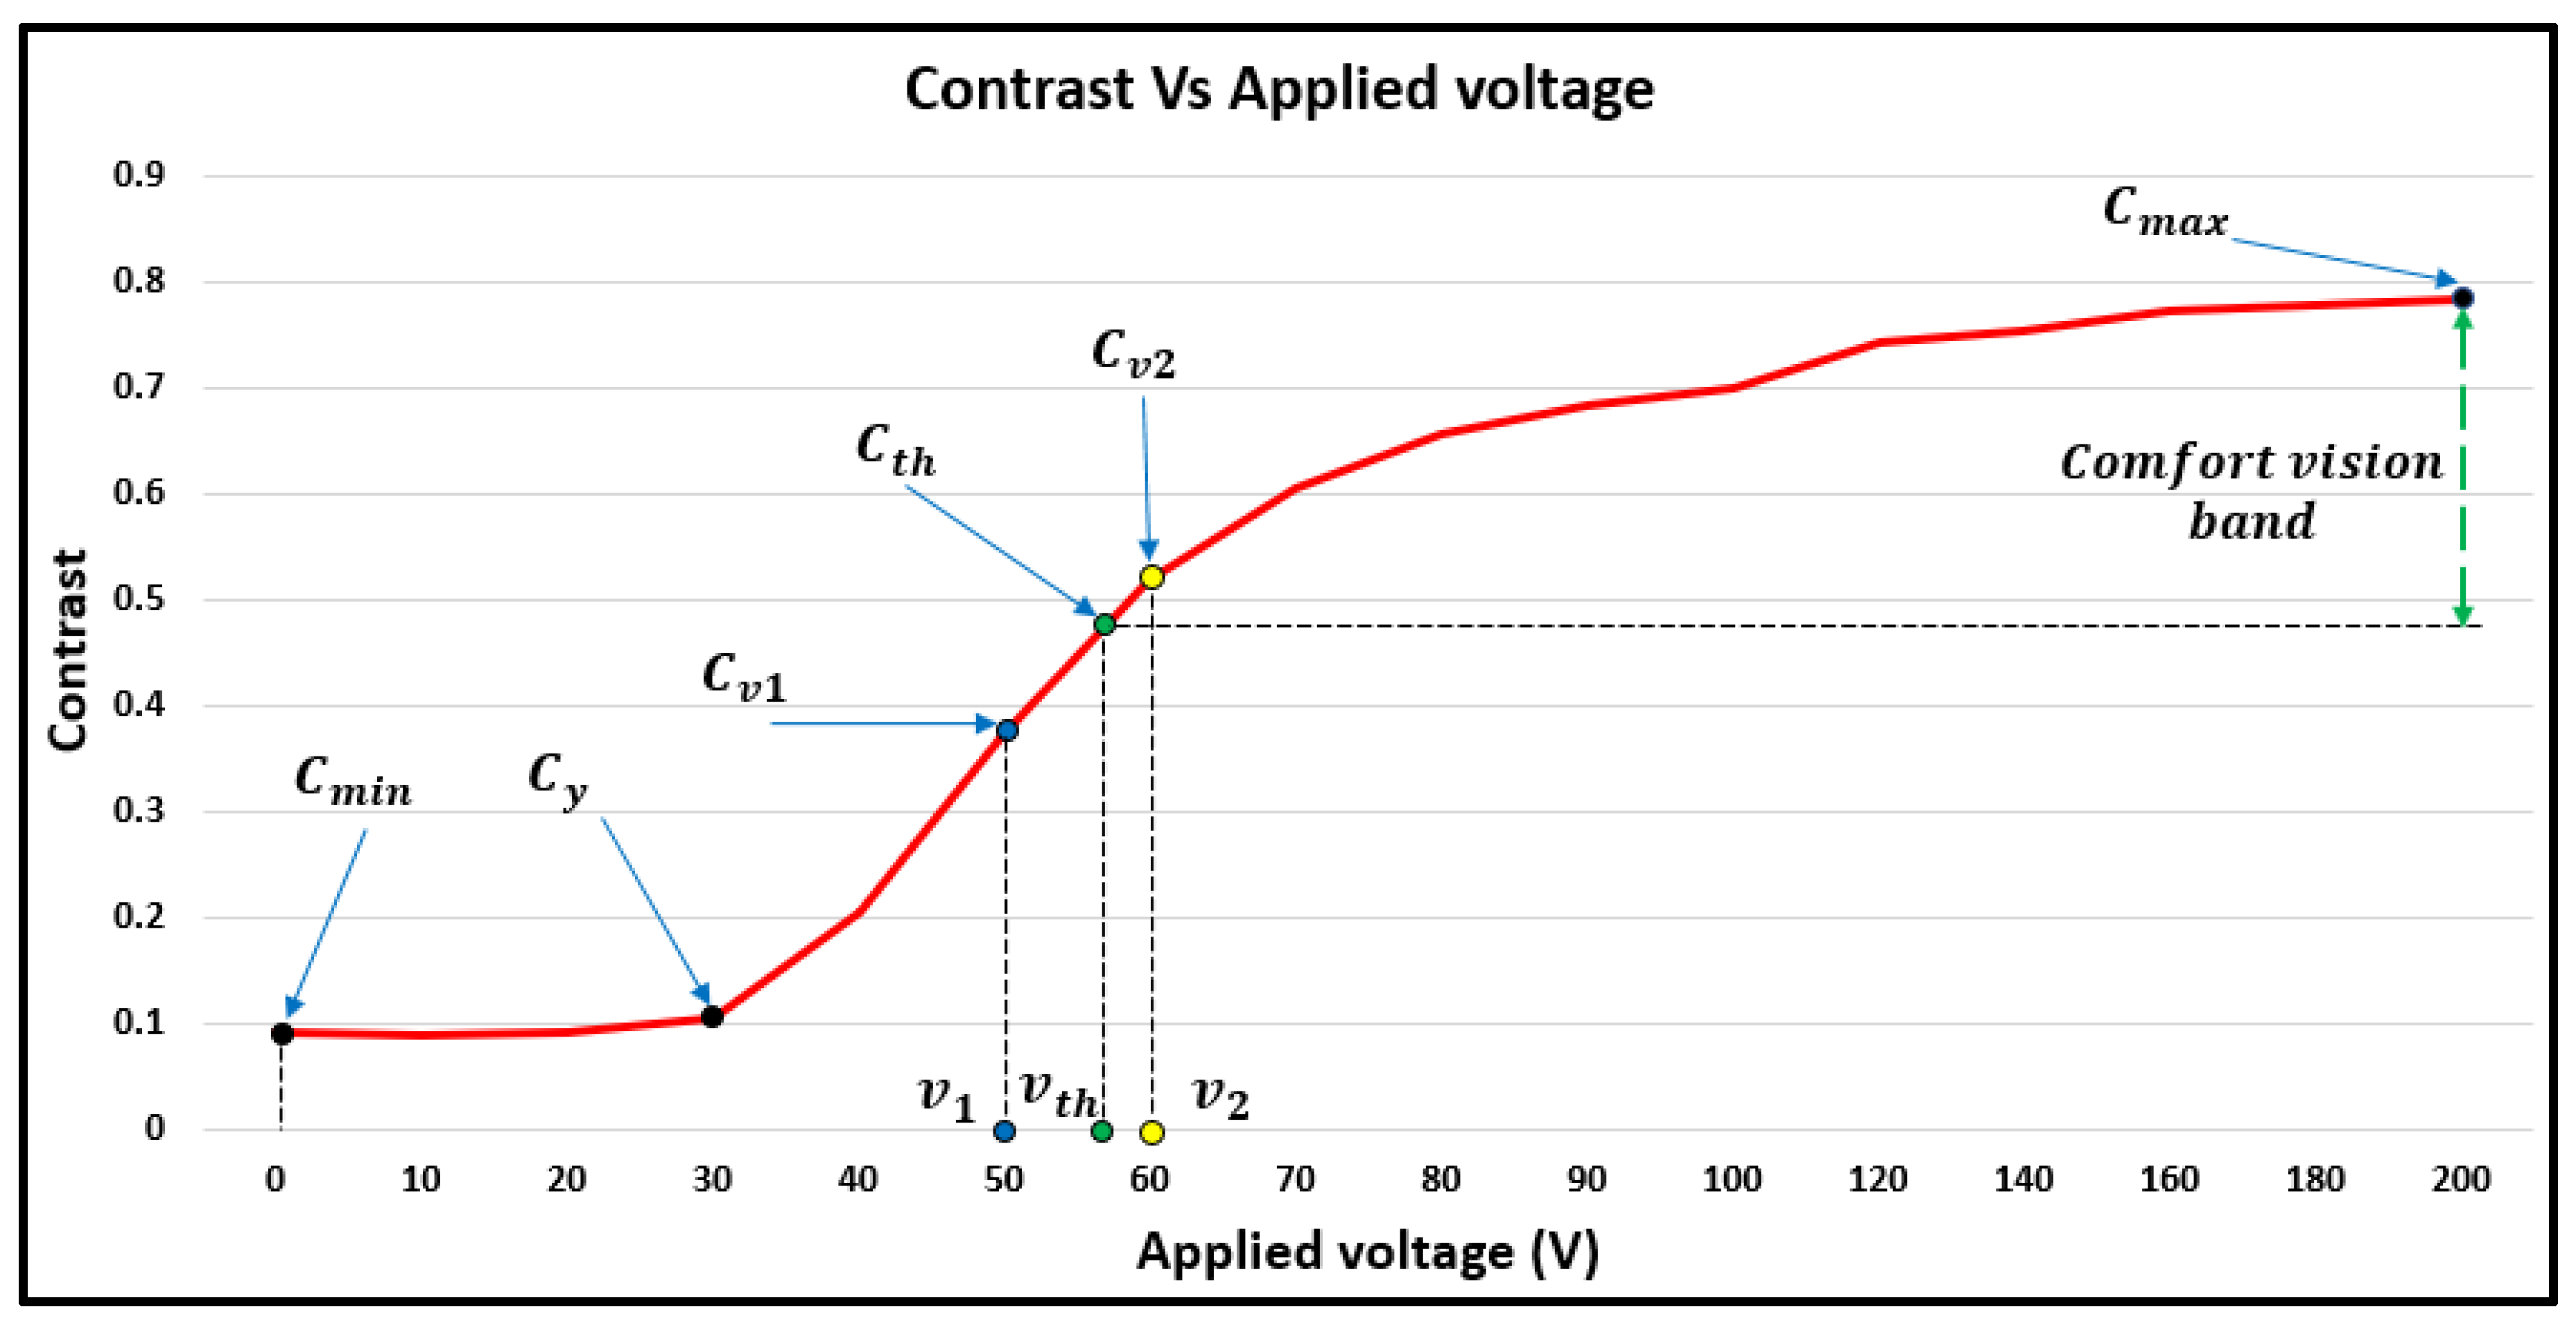
The relationship of the contrast with the applied voltage was obtained, as shown in Figure 4. Three regions can be recognized in the curve. The first region is between the minimum contrast point () and point (); obviously, the contrast has low values as the PDLC film is in its opaque state. The second region is between () and the threshold contrast point (), in which the contrast value is dramatically increased with the increase in the applied voltage. The third region is between () and the maximum contrast point (), in which the contrast begins to show a saturation response to the applied voltage.
The vision is considered to be comfortable if the contrast is above approximately 0.48; this value is the threshold value of the contrast, and was calculated graphically from the contrast–voltage curve. However, this point does not correspond to a fixed transparency and voltage in all cases. The threshold contrast point () represents a proposed minimum comfort band that limits the transparency. In Figure 4, the threshold contrast value lies between two given points, ( and (; hence, the threshold contrast value can be expressed mathematically as below:
To estimate the threshold voltage (), the segment of the curve between ( and ) is assumed to be a linear relationship; this assumption leads to:
or:
Consequently, the system chooses one operating point within the comfort vision band based on the user’s preference. However, the user’s preference is also referenced to . The range that the user can set is from 0 to 100%, which maps to the range from to . In our paper, a preferred vision ratio (PVR) is proposed to quantify the user setting. Thus, if the PVR = 0%, then the operating point is at the threshold value (), whereas the system works at () if the PVR = 100%. Consequently, the preferred contrast value () can be determined as below:
The corresponding applied voltage at the preferred contrast can be defined by substituting Equation (12) into Equation (11), as shown below:
3. Experiment
3.1. Experimental Setup
Two small-scaled test rooms of the same size were made from a triple-layer insulated board. The board consists of a thick layer of polystyrene with thermal conductivity of 0.046 W/m.K. The polystyrene is sandwiched between two thin layers of steel. The first room had a conventional double-glazed window having the specifications shown in Table 2. This room was considered as the reference model in the experiments. The second room had the same window, except that a PDLC thin film was attached to the inner pane of the double-glazed window. The second room was used to evaluate the proposed vision quantification process. Both rooms were equipped with a temperature sensor to measure the temperature of the enclosure; in addition, a flux sensor was centered inside each test room at a height of 15 cm. Table 2 provides more details about the test room structure, double-glazed window, and the PDLC film.
For outdoor weather conditions, a weather station was utilized to record the temperature, humidity, pressure, wind speed, and wind direction. Additionally, three pyranometers were employed to measure global horizontal irradiance (GHI), diffused horizontal irradiance (DHI), and global vertical irradiance (GVI). All pyranometers were interfaced with a datalogger device to collect the data. More details about the sensors used in the experiment are provided in Table 3.
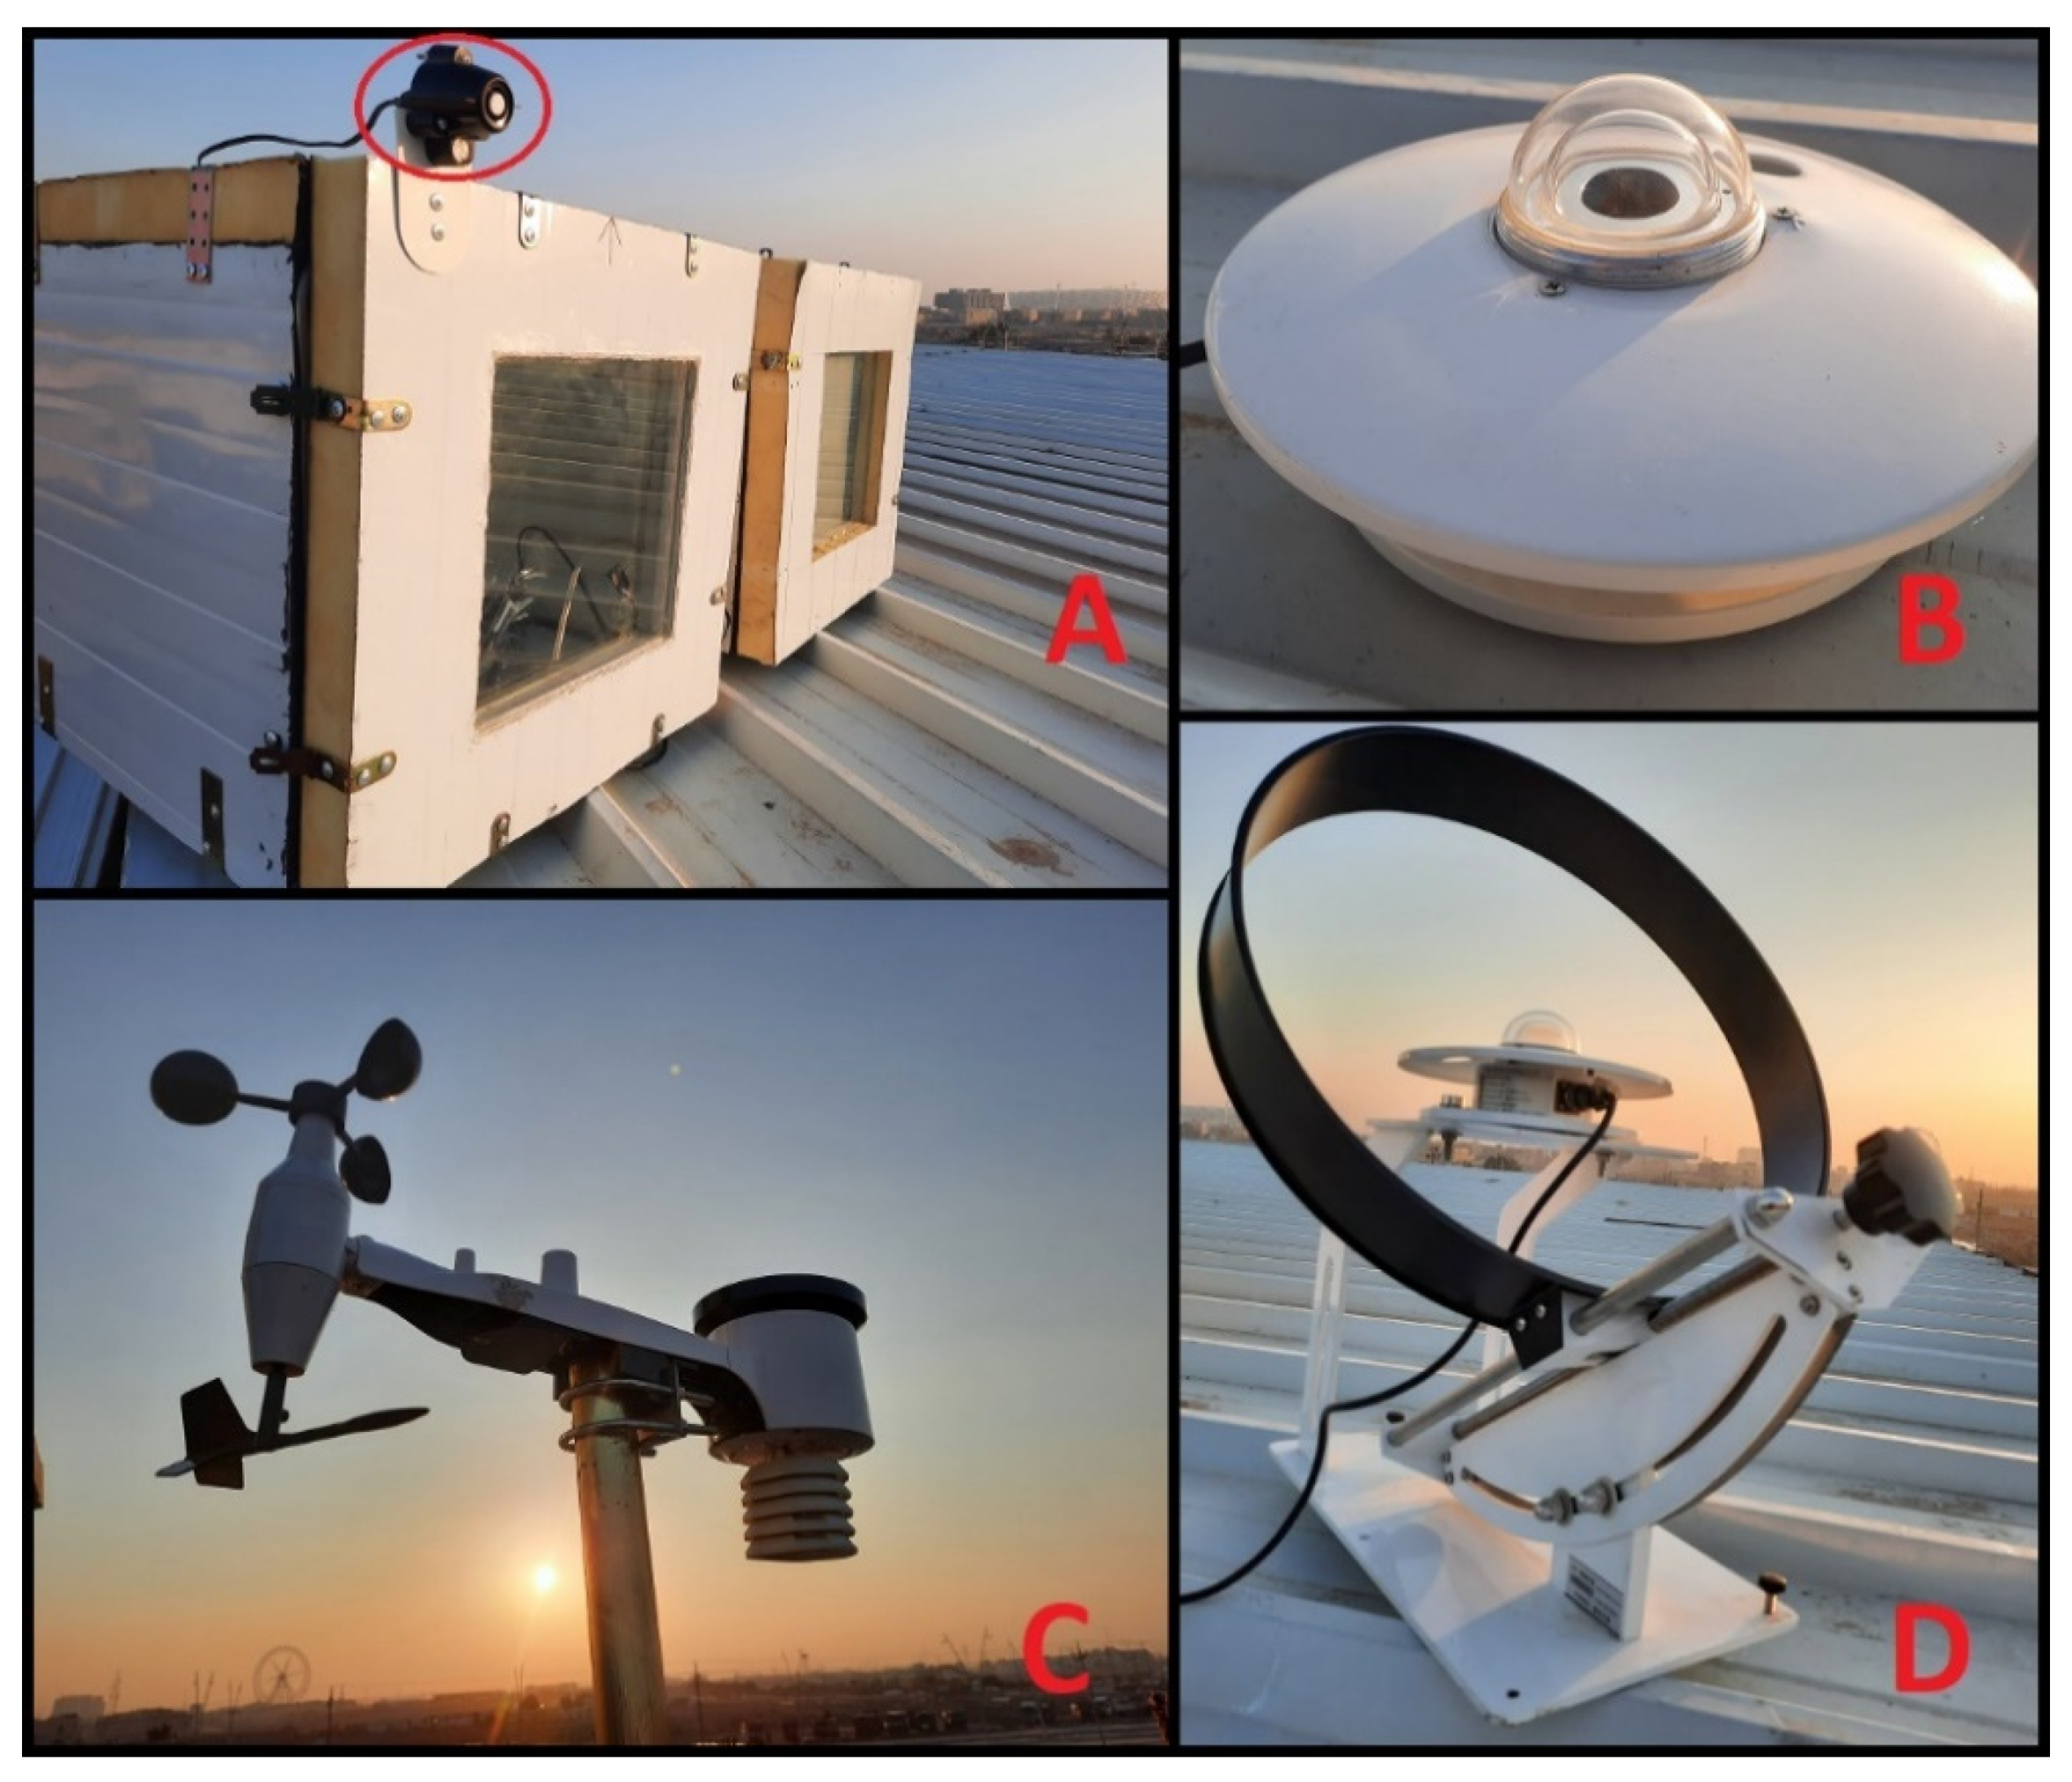
In the second test room, because the experiments required a variable AC voltage for the PDLC film, a 300 V/500 VA VARIAC transformer was used to adjust the desired voltage during the experiment. Furthermore, a high-definition camera was fixed in the room 5 cm from the inner pane of the window. The camera was horizontally oriented toward the window to capture the external views through the window. The digital camera was connected to a PC via an IP network; therefore, the images were directly transferred to the PC, and Windows-based software was used to manage the image-capturing operation. Finally, MATLAB code was developed to compute the contrast value of the captured images during the execution of the experiments. The frequency of this process was 30 min. Figure 5 shows the experimental setup, including the reference test room, PDLC test room, three pyranometers, and weather station.
3.2. Experiment Scenarios
The two test rooms were installed in Basra, Iraq (latitude: 30.5 and longitude: 47.8) on the roof of the Basra oil training institute. The window for each room was oriented to the south. The experiment was continuously carried out for four days during daytime, from 11 to 14 August 2021. The experiment was executed every day with a different PVR. Table 4 shows the four scenarios, 1 to 4, that were implemented during the first to the fourth day of the experiment, respectively. It is worth mentioning here that the PVR was determined only for the window of the second test room to show the influence of the PVR on vision quality, in addition to the other parameters of the system, such as internal temperature, internal daylight, and solar heat gain.
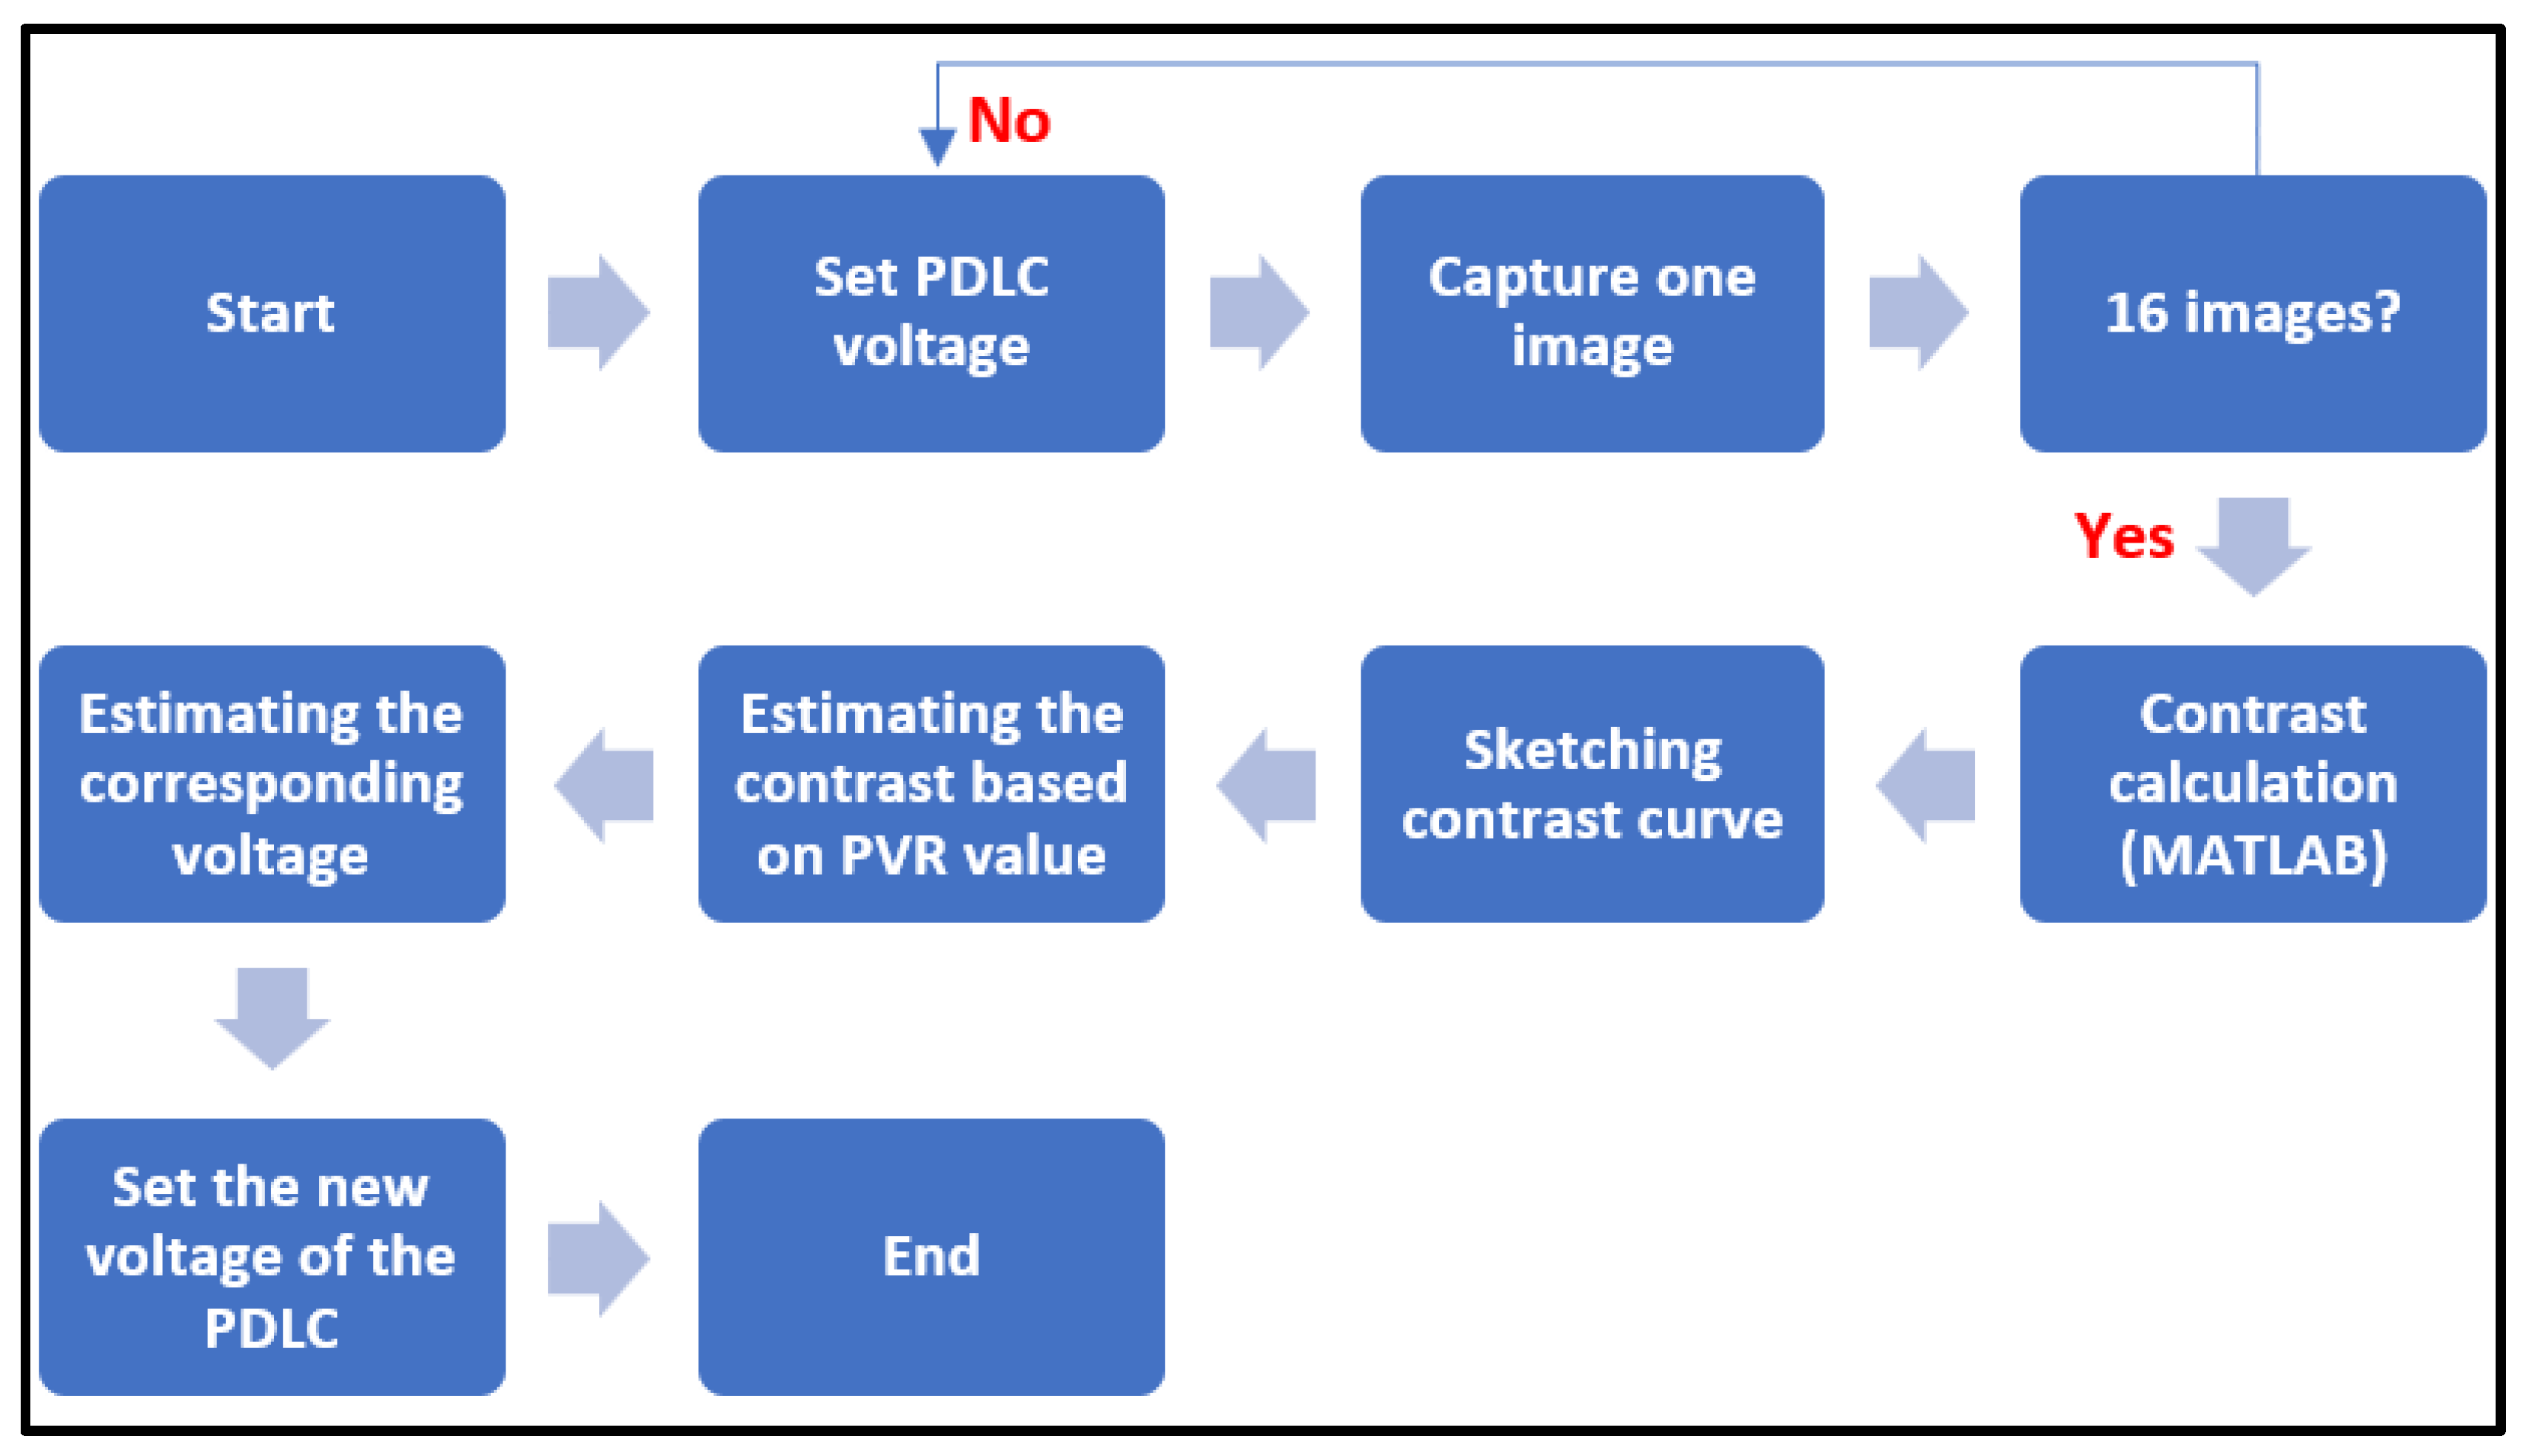
The experiment was executed from 5:30 AM to 6:30 PM. The process shown in Figure 6 was run 27 times daily (every 30 min) on the second room. The process required 2 min to be executed manually each time. The algorithm started by setting the PDLC film voltage to a specific value from among 16 values in the range 0 to 200 V. One image was taken each time for each voltage value. MATLAB then obtained the voltage versus contrast relation and the threshold value .
Thereafter, the instantaneous contrast value was calculated using Equation (12) based on the preferred value of the PVR. The corresponding voltage was graphically determined from the instantaneous contrast–voltage curve, or from Equation (13). Finally, VARIAC output was set to the new voltage value from Equation (13) to realize the instantaneous preferred transparency. This value should ensure visual comfort.
3.3. Simulation
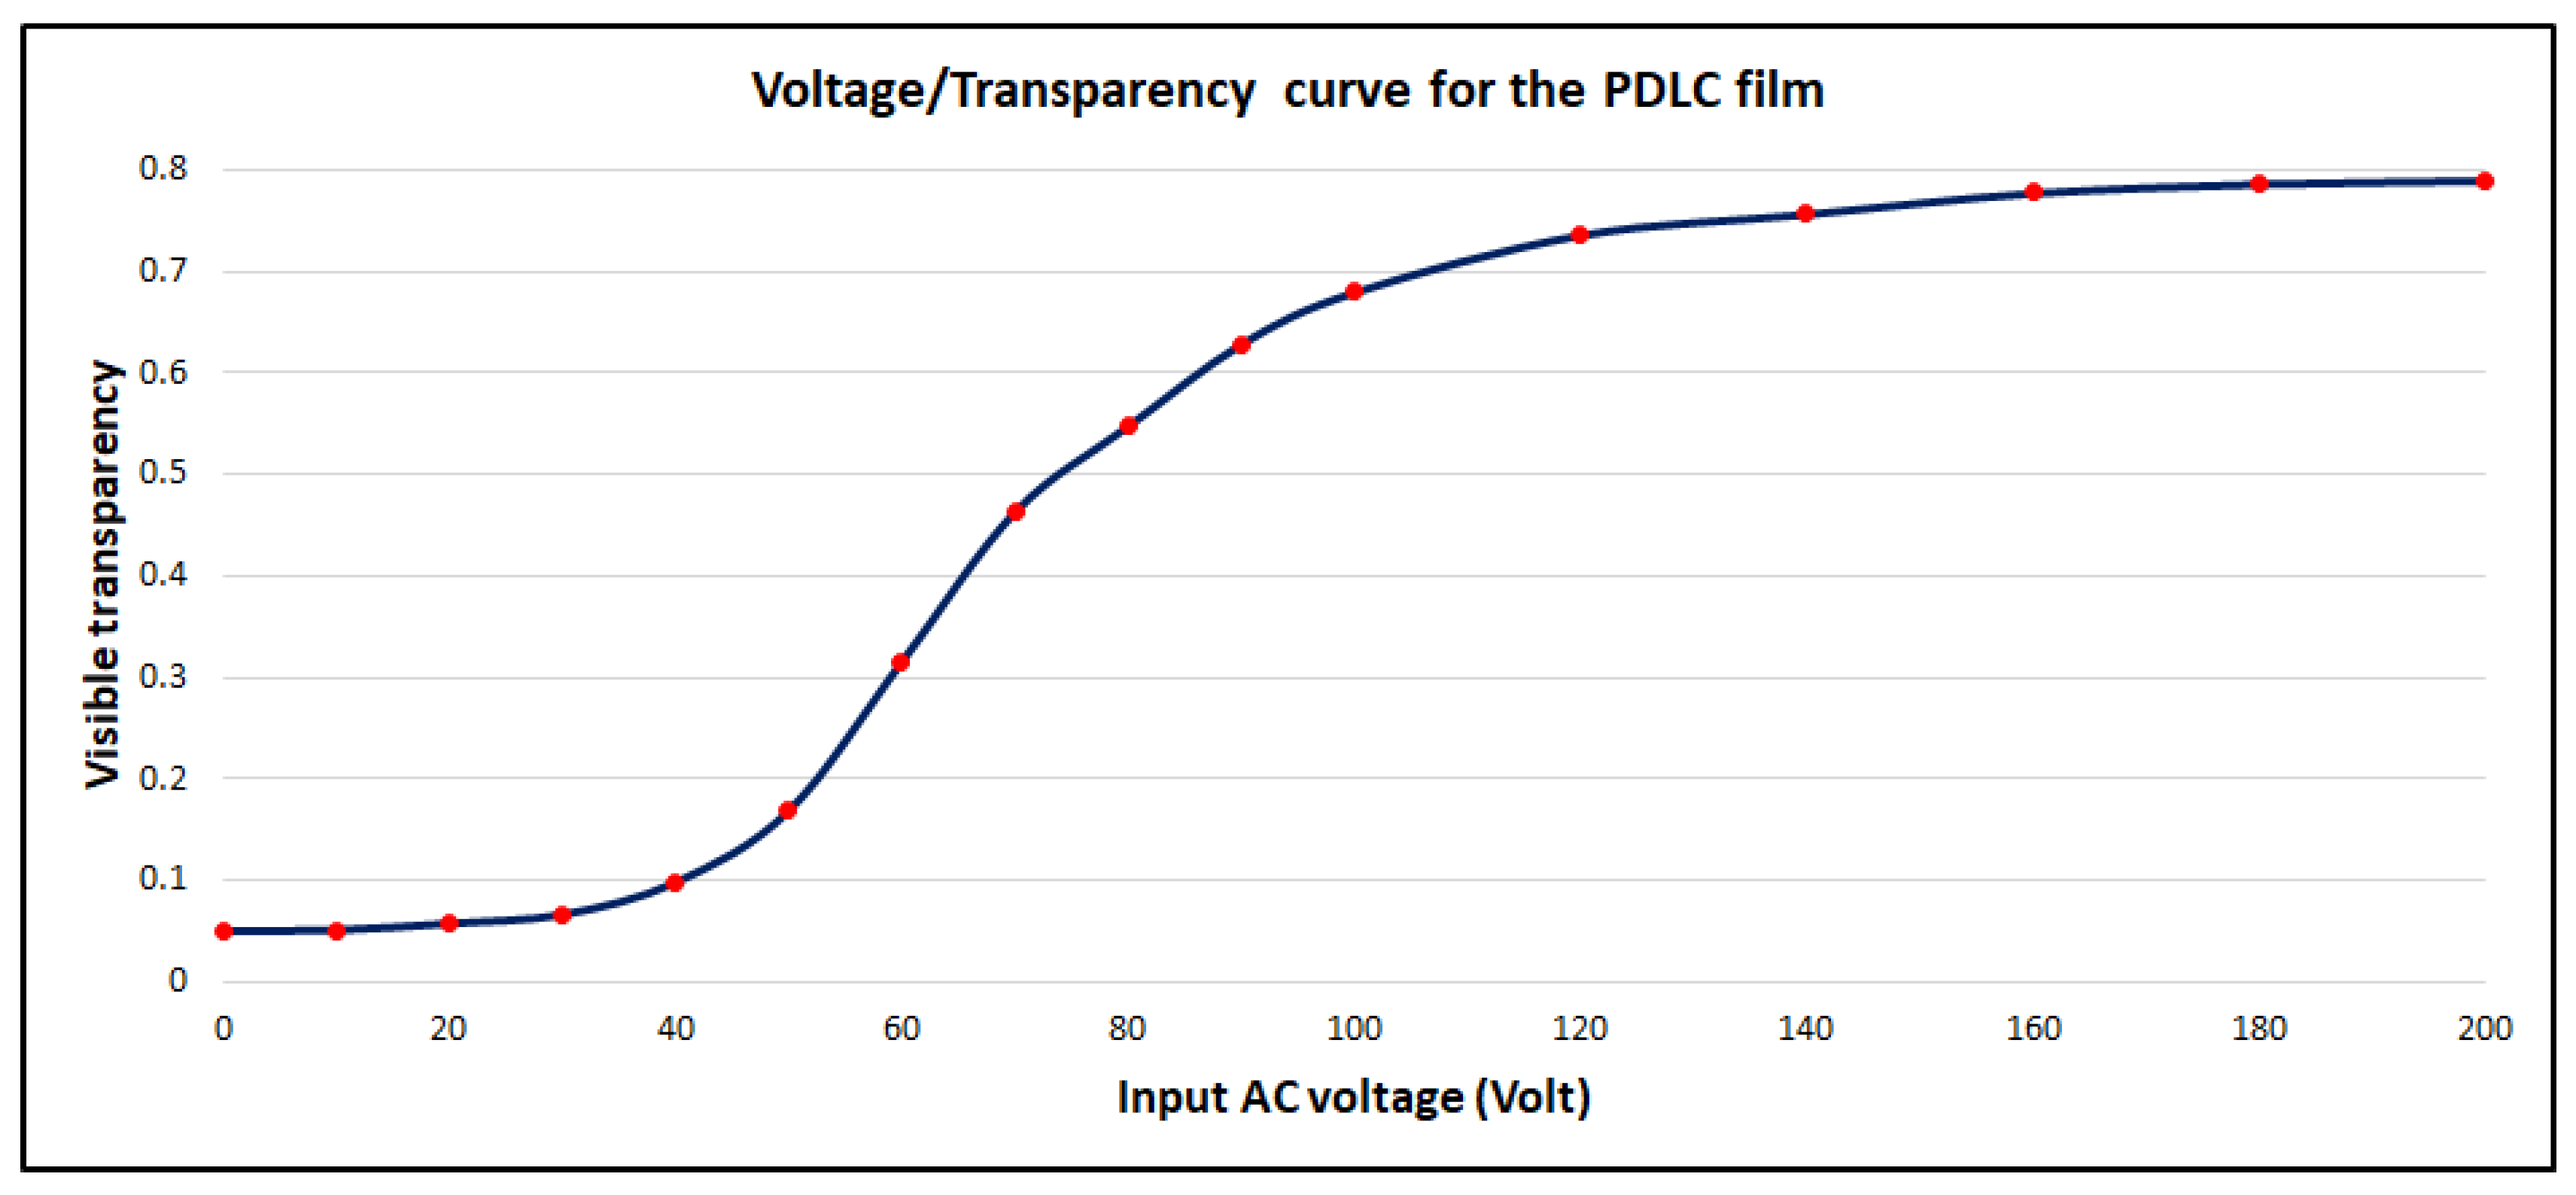
The two experimental test rooms, namely, the first room with the conventional double-glazed window and the second room with the PDLC double-glazed window, were modeled in DESIGN BUILDER software based on the properties listed in Table 2. Simultaneously, the weather data file required for the simulation was prepared using the computed illuminance data, experimental solar irradiance data, and weather conditions recorded by the weather station. Since the visible transparency of the PDLC film was changed during the experiments, during the simulation, it was necessary to adjust the visible transmission of the PDLC film accordingly at different times. This task was achieved by referring to the transparency–voltage curve of the film. A spectrometer was used to measure the visible transmission of the utilized PDLC film against different input AC voltages; the resultant curve is shown in Figure 7.
4. Results, Validation, and Discussion
The objectives of this section are:
- To demonstrate the experimental and simulation results of the implemented scenarios mentioned in Table 4.
- To compare the experimental and simulation outcomes to validate the system.
- To investigate the impact of the PVR on different factors of the system.
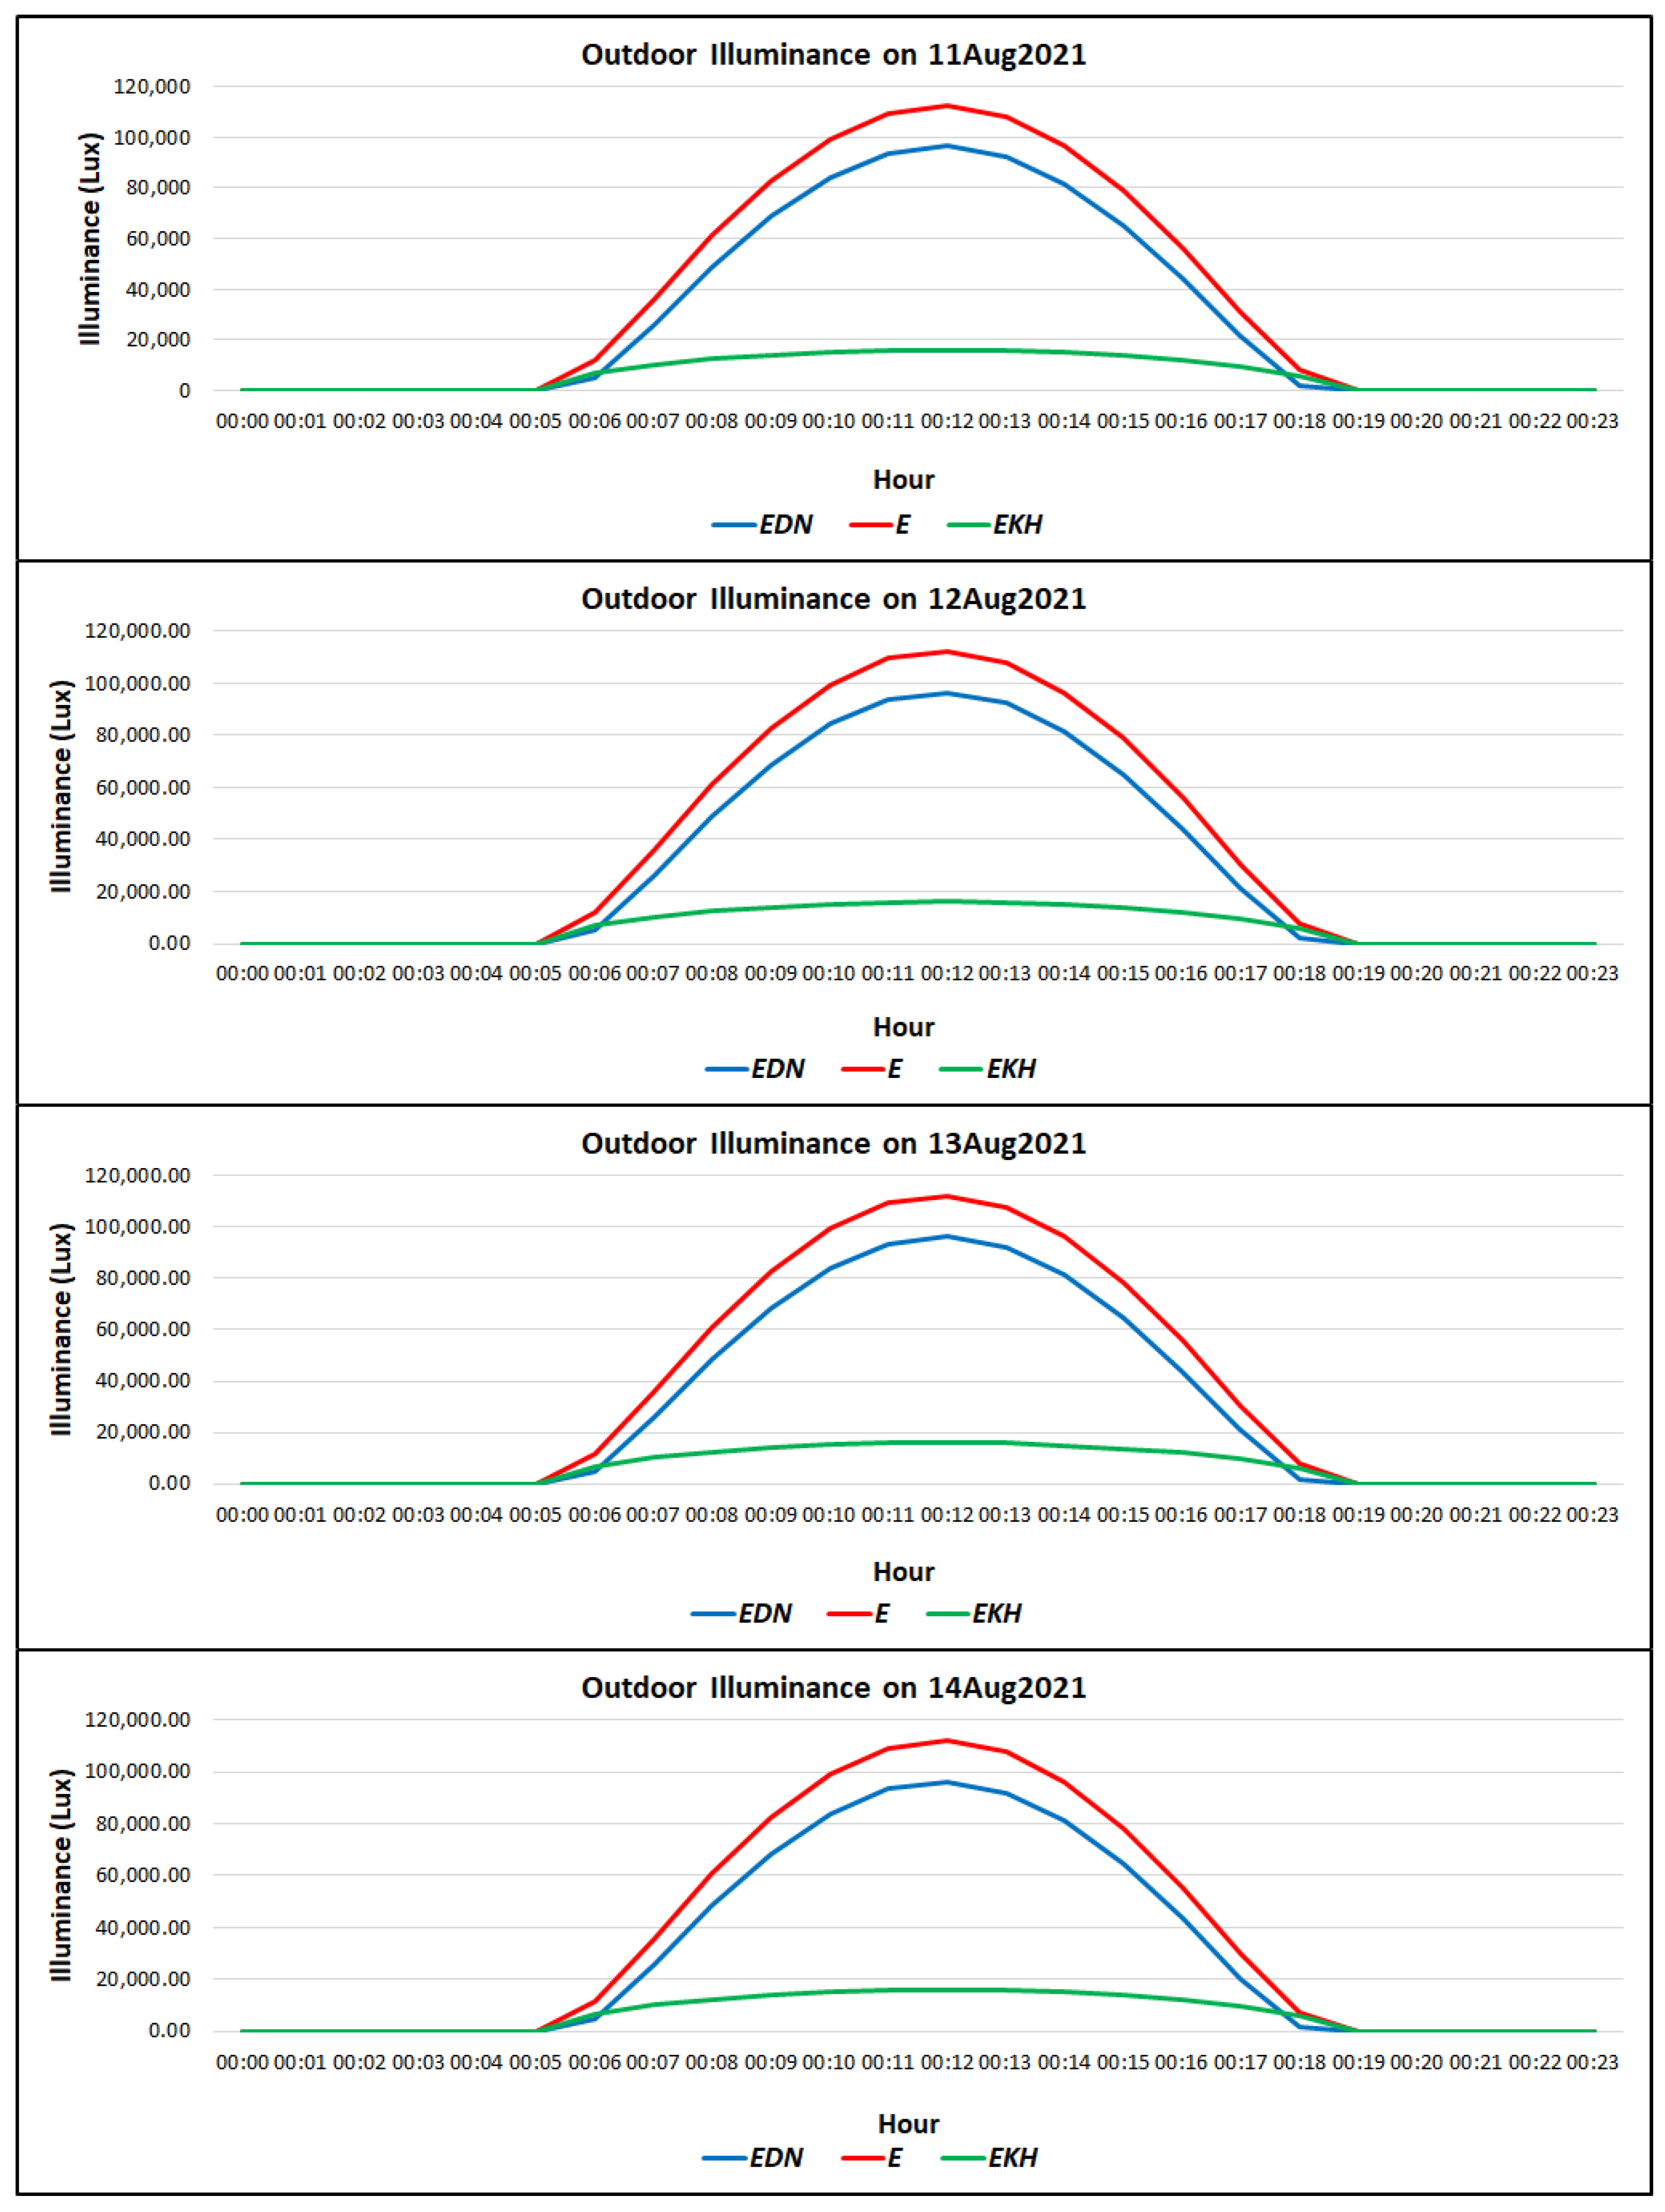
According to the IESNA approach mentioned in Equations (2)–(7), the illuminance data were calculated for 11 to 14 August 2021, as shown in Figure 8, including direct normal illuminance , diffuse horizontal illuminance , and the total illuminance . The effective daylight period was from 5:00 am and 7:00 pm; however, the calculation showed that the available estimated illuminance during the four days was approximately equal. There are two reasons for this: first, since the days of the experiment were consecutive, the sun elevation angle was almost the same; second, because the four days had the same sky clearness parameters (sunny days).
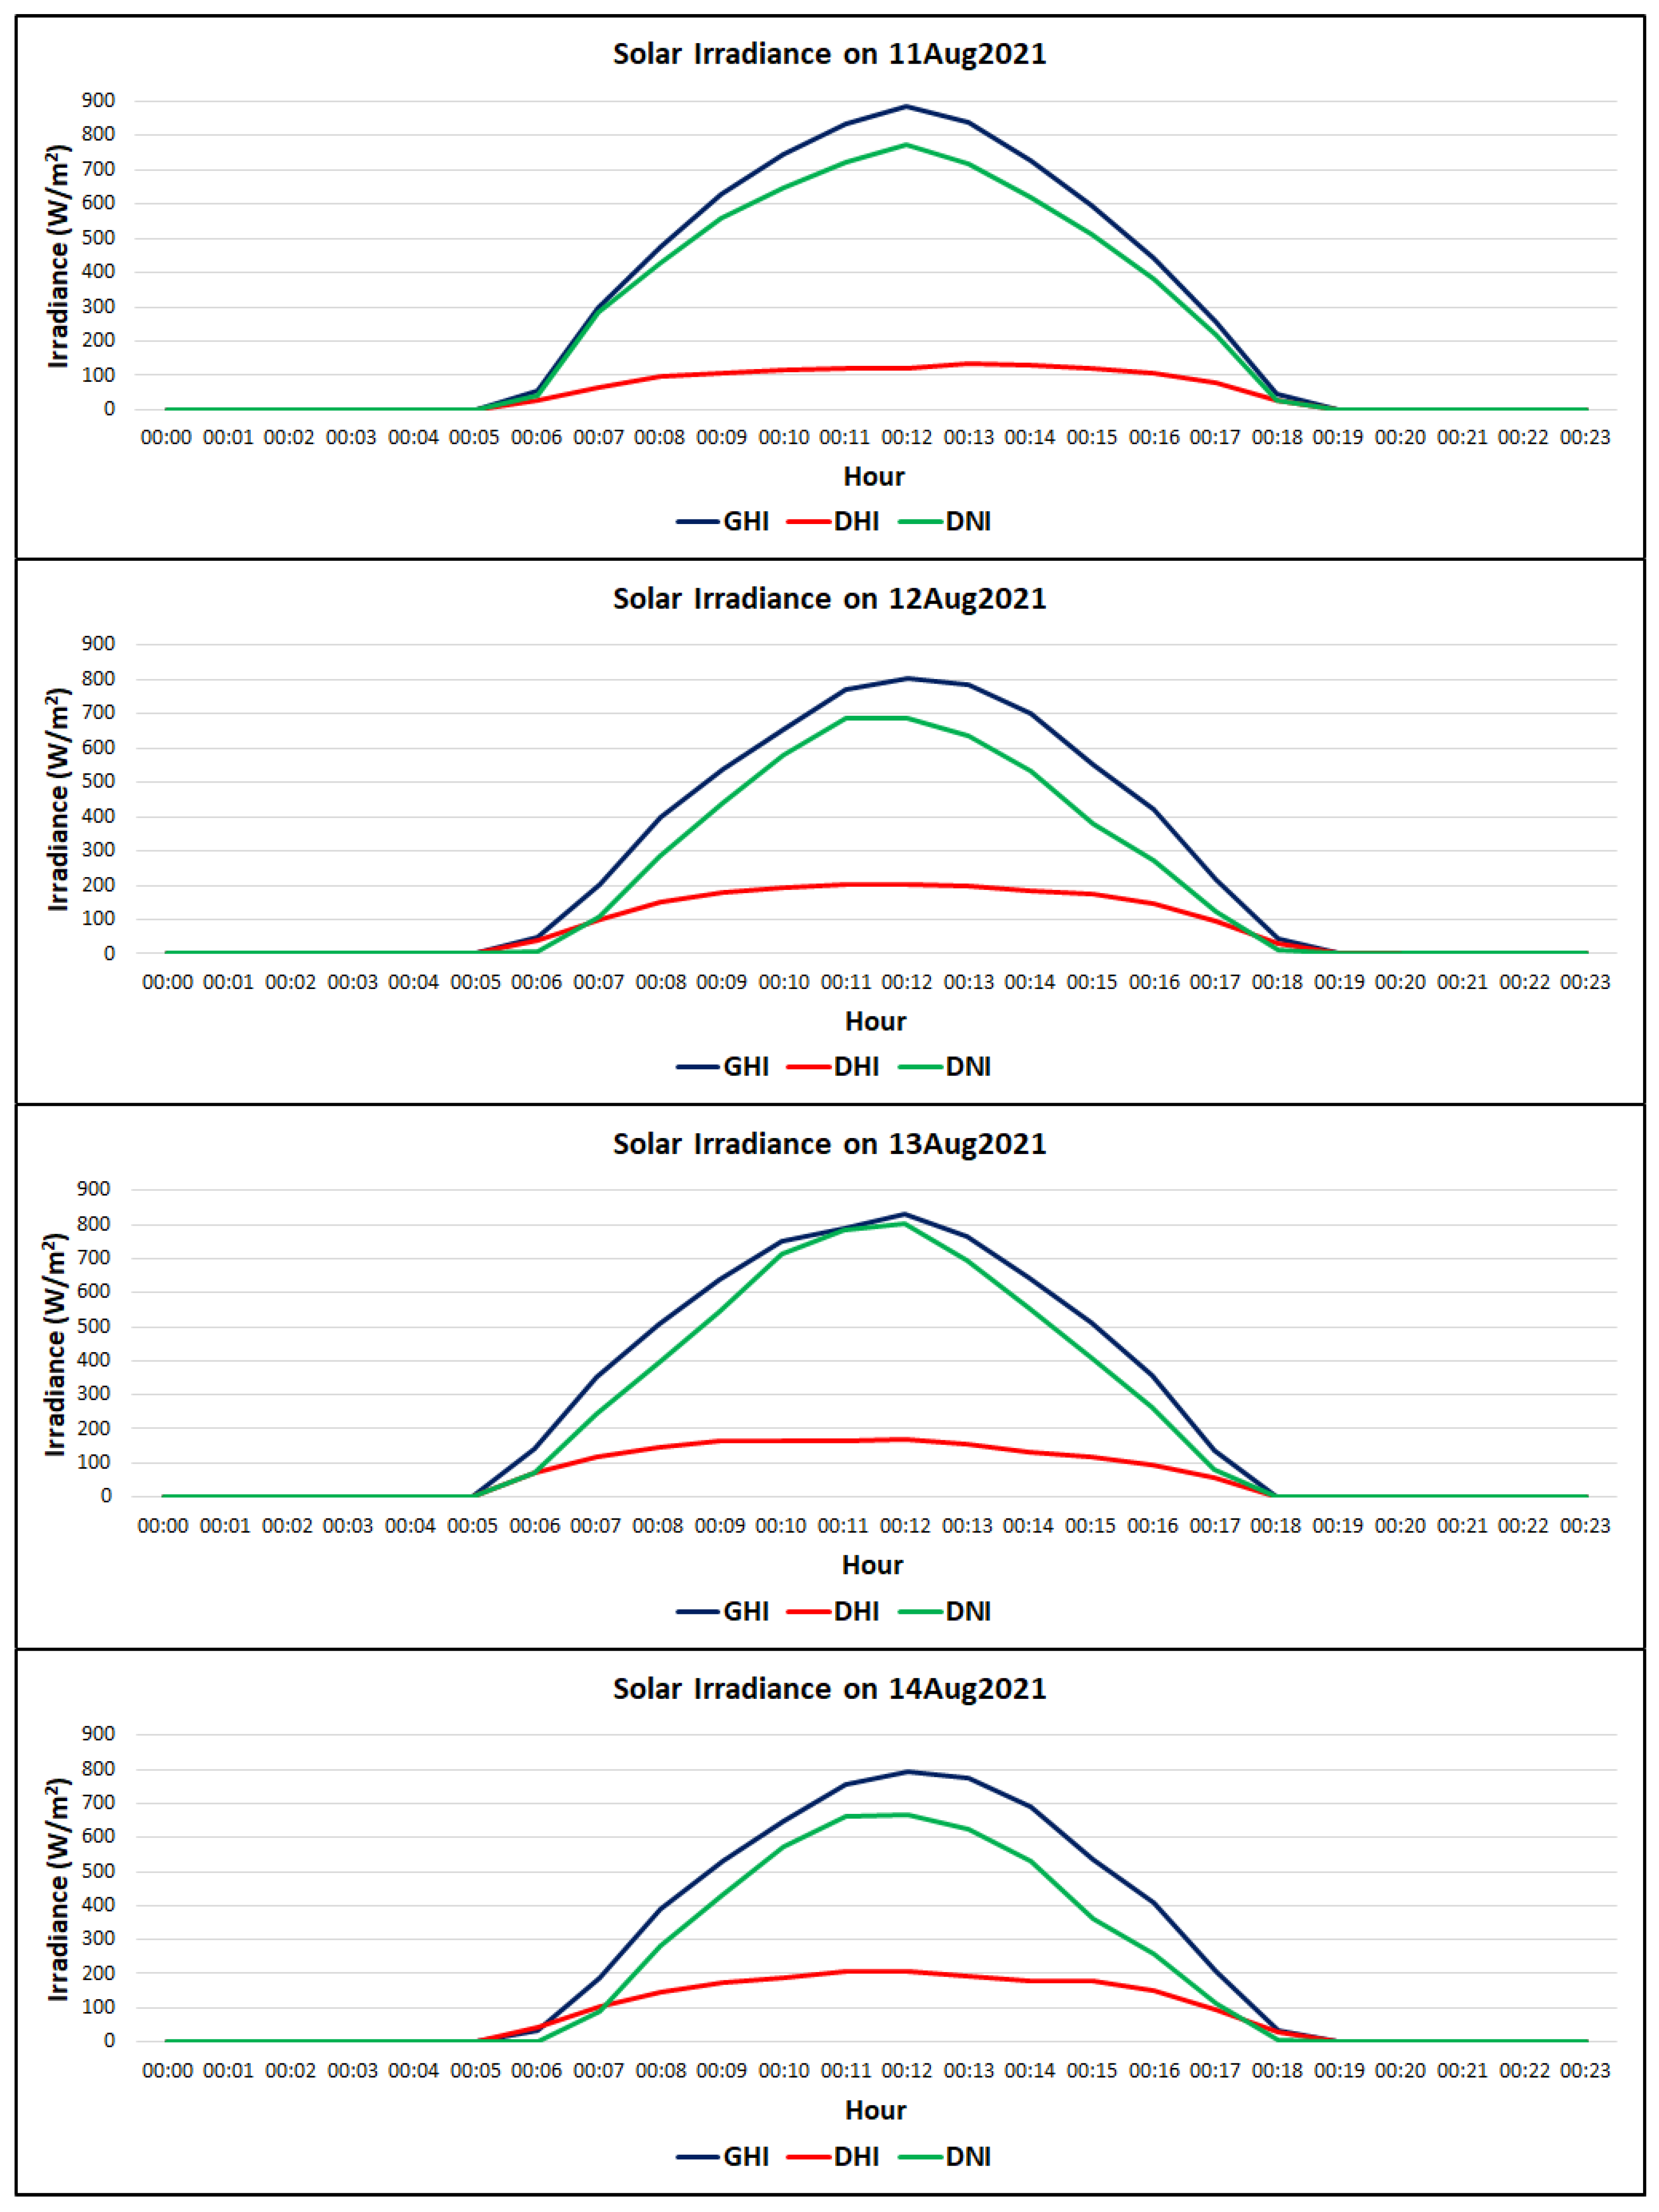
The solar irradiance data during the four days are shown in Figure 9, including global horizontal irradiance and diffuse horizontal irradiance ; solar radiation slightly varied from 11 to 14 August 2021.
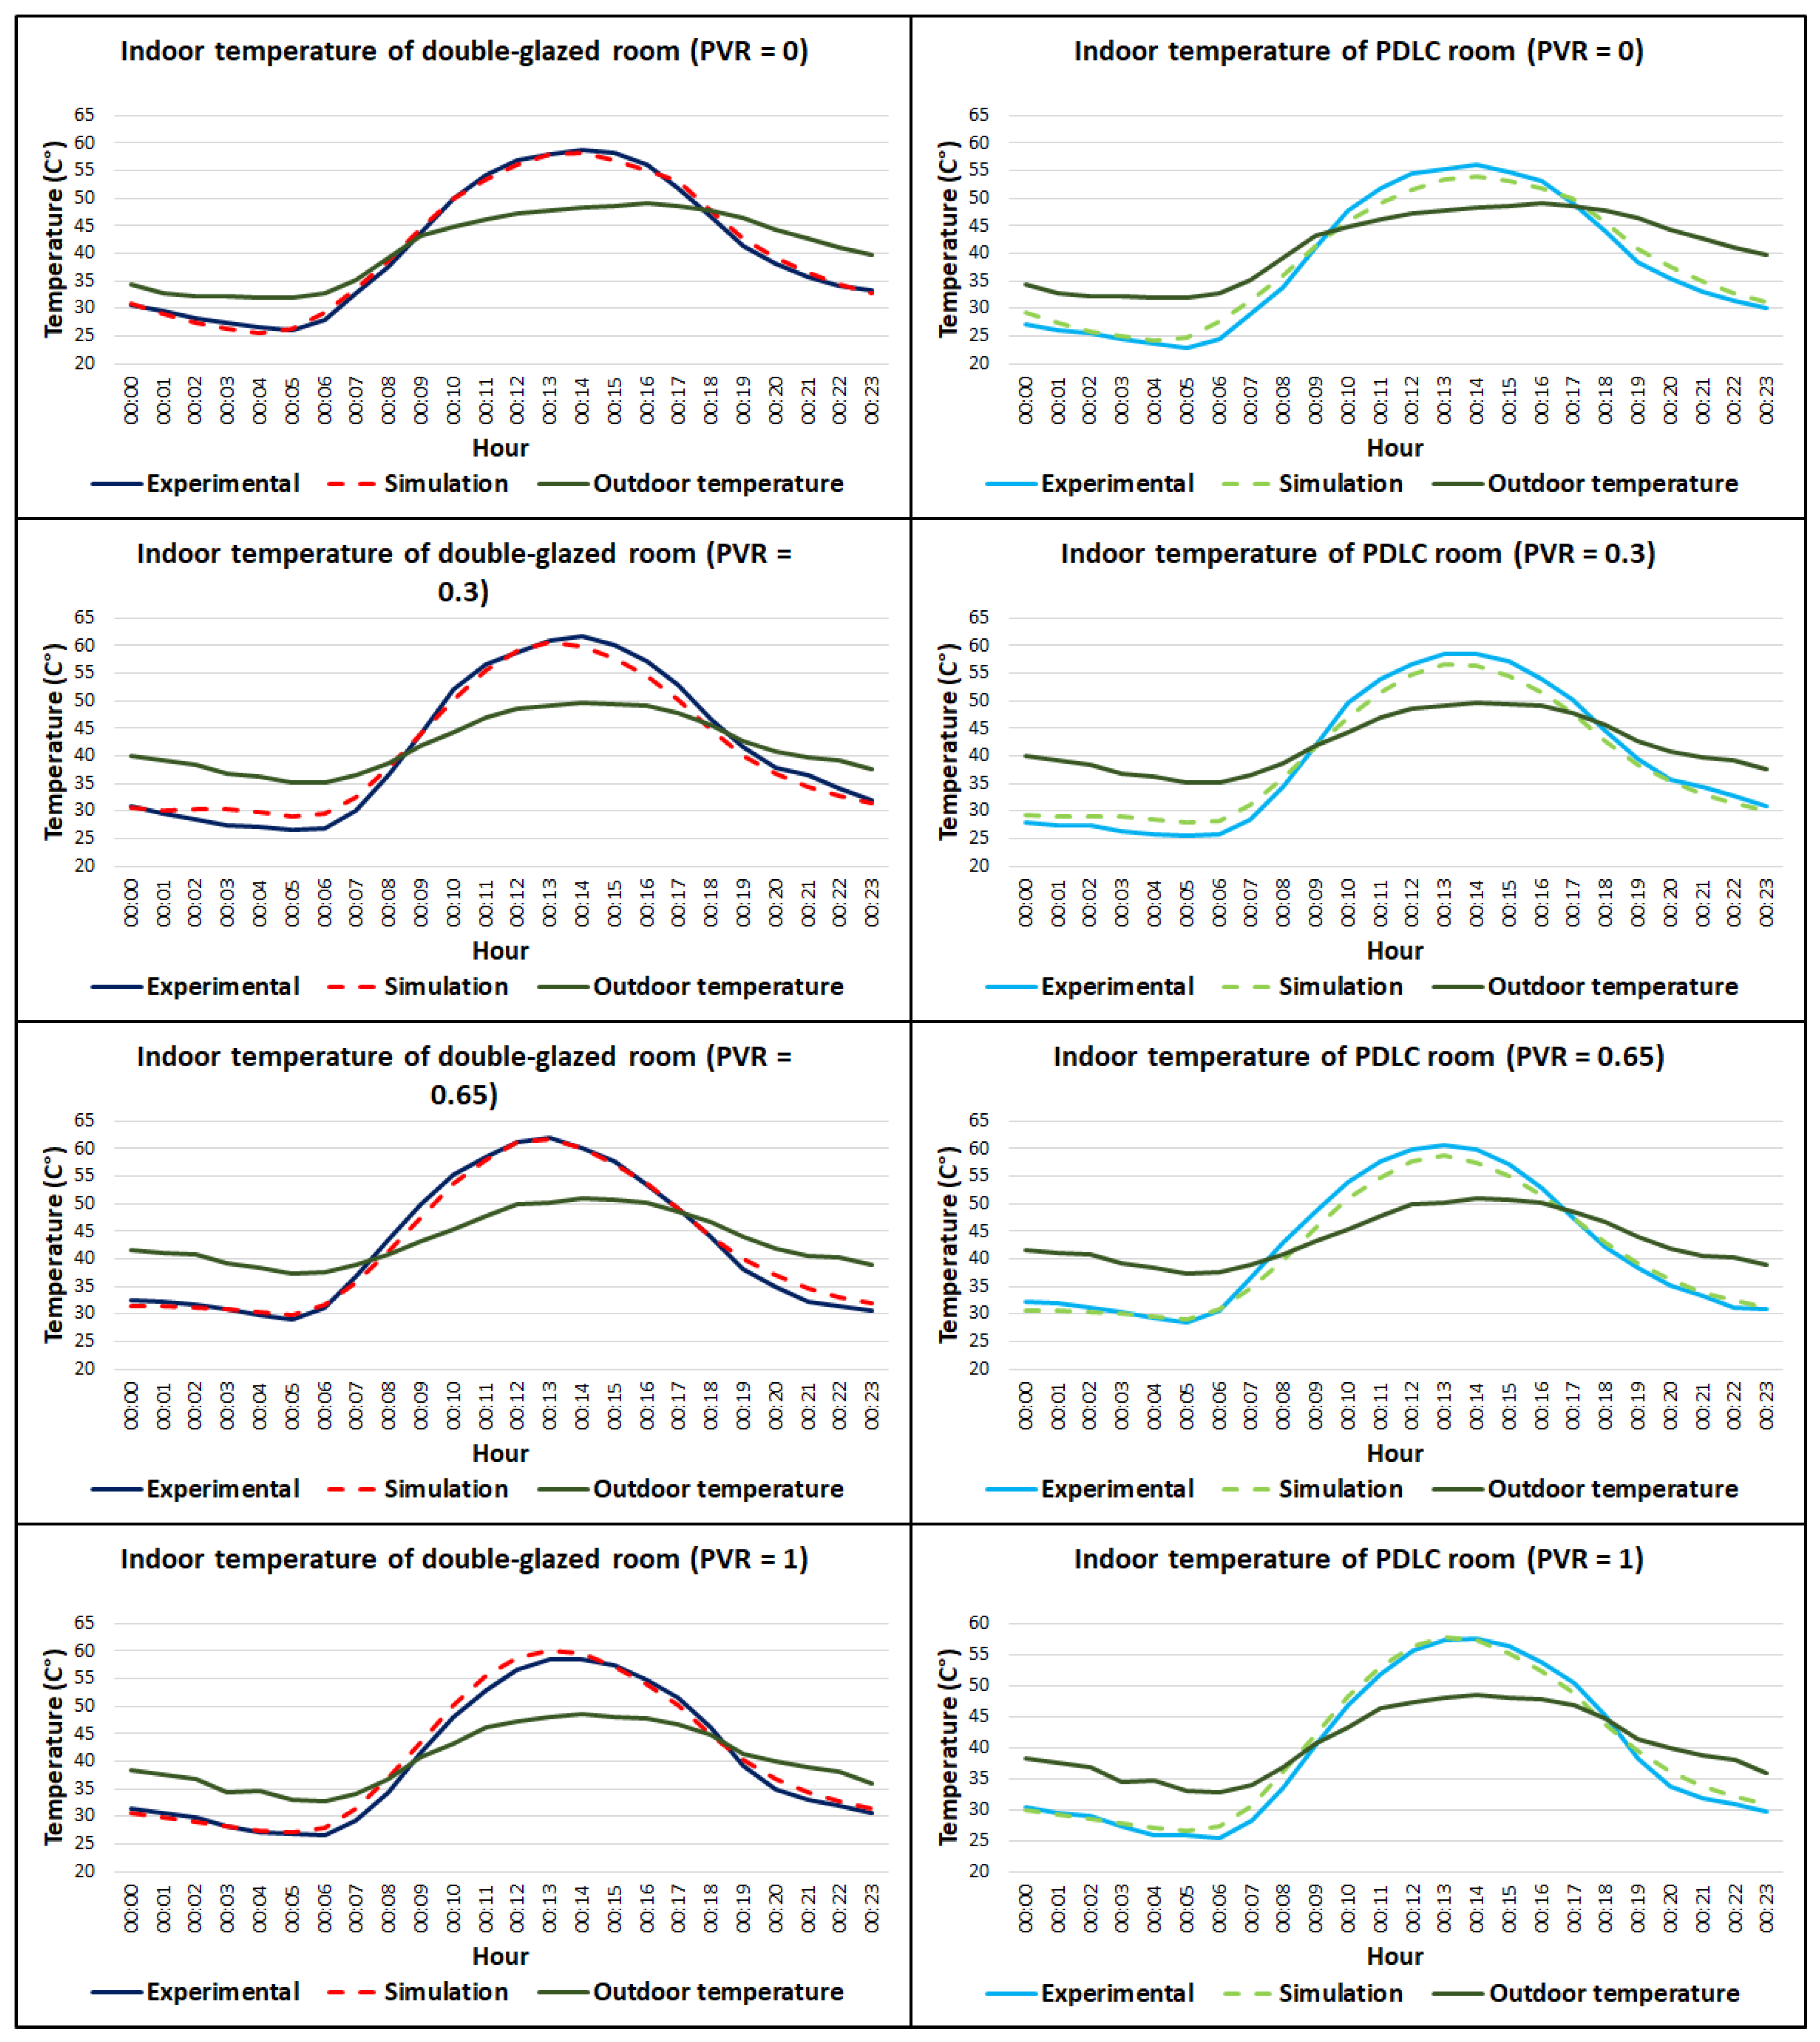
The indoor and outdoor temperatures of the test rooms are plotted against the days of the experiment in Figure 10. During the first day, when the PVR was adjusted to 0, which corresponds to the minimum available contrast in the comfort vision band, the experimental and simulated indoor temperatures responded to the variation in the outdoor temperature with good correlation. The maximum recorded temperature inside the reference model at 2:00 p.m. was 58.8 °C, and the average temperature was 41 °C, whereas the highest and average temperatures for the PDLC model were 56 and 38 °C, respectively. The average deviations between the experimental and simulated temperatures inside the double-glazed window room and the PDLC room were 0.12 and 0.37 °C, respectively.
During the second day, the PVR was equal to 0.3, and the experimental and simulated indoor temperatures varied in the same pattern as that of the outdoor temperature. The experimental and simulated indoor temperatures in both rooms were approximately equal. Moreover, the maximum observed temperature inside the reference model at 2:00 pm was 61.7 °C, and the average temperature was 41.5 °C, whereas the highest and average temperatures for the PDLC model were 58.5 and 39.4 °C, respectively. The average differences between the experimental and simulated temperatures inside the reference room and the PDLC room were 0.19 and 0.22 °C, respectively.
Similar observations were made on the third day, when the PVR was set to 0.65. The greater temperature noted inside the reference model at 2:00 pm was 62 °C, and the average temperature was 42.3 °C, whereas the highest and average temperatures for the PDLC model were 60.7 and 40.8 °C, respectively. The average variances between experimental and simulated temperatures inside the reference window room and the PDLC room were 0.1 and 0.3 °C, respectively.
For the fourth day, when the PVR was set to 1, the highest recorded temperature inside the reference model was at 2:00 pm, and was 58.6 °C, and the average temperature was 40 °C, whereas the highest and average temperatures for the PDLC model were 57.5 and 38.8 °C respectively. The average disparities between the experimental and simulated temperatures inside the reference room and the PDLC room were 0.2 and 0.24 °C, respectively.
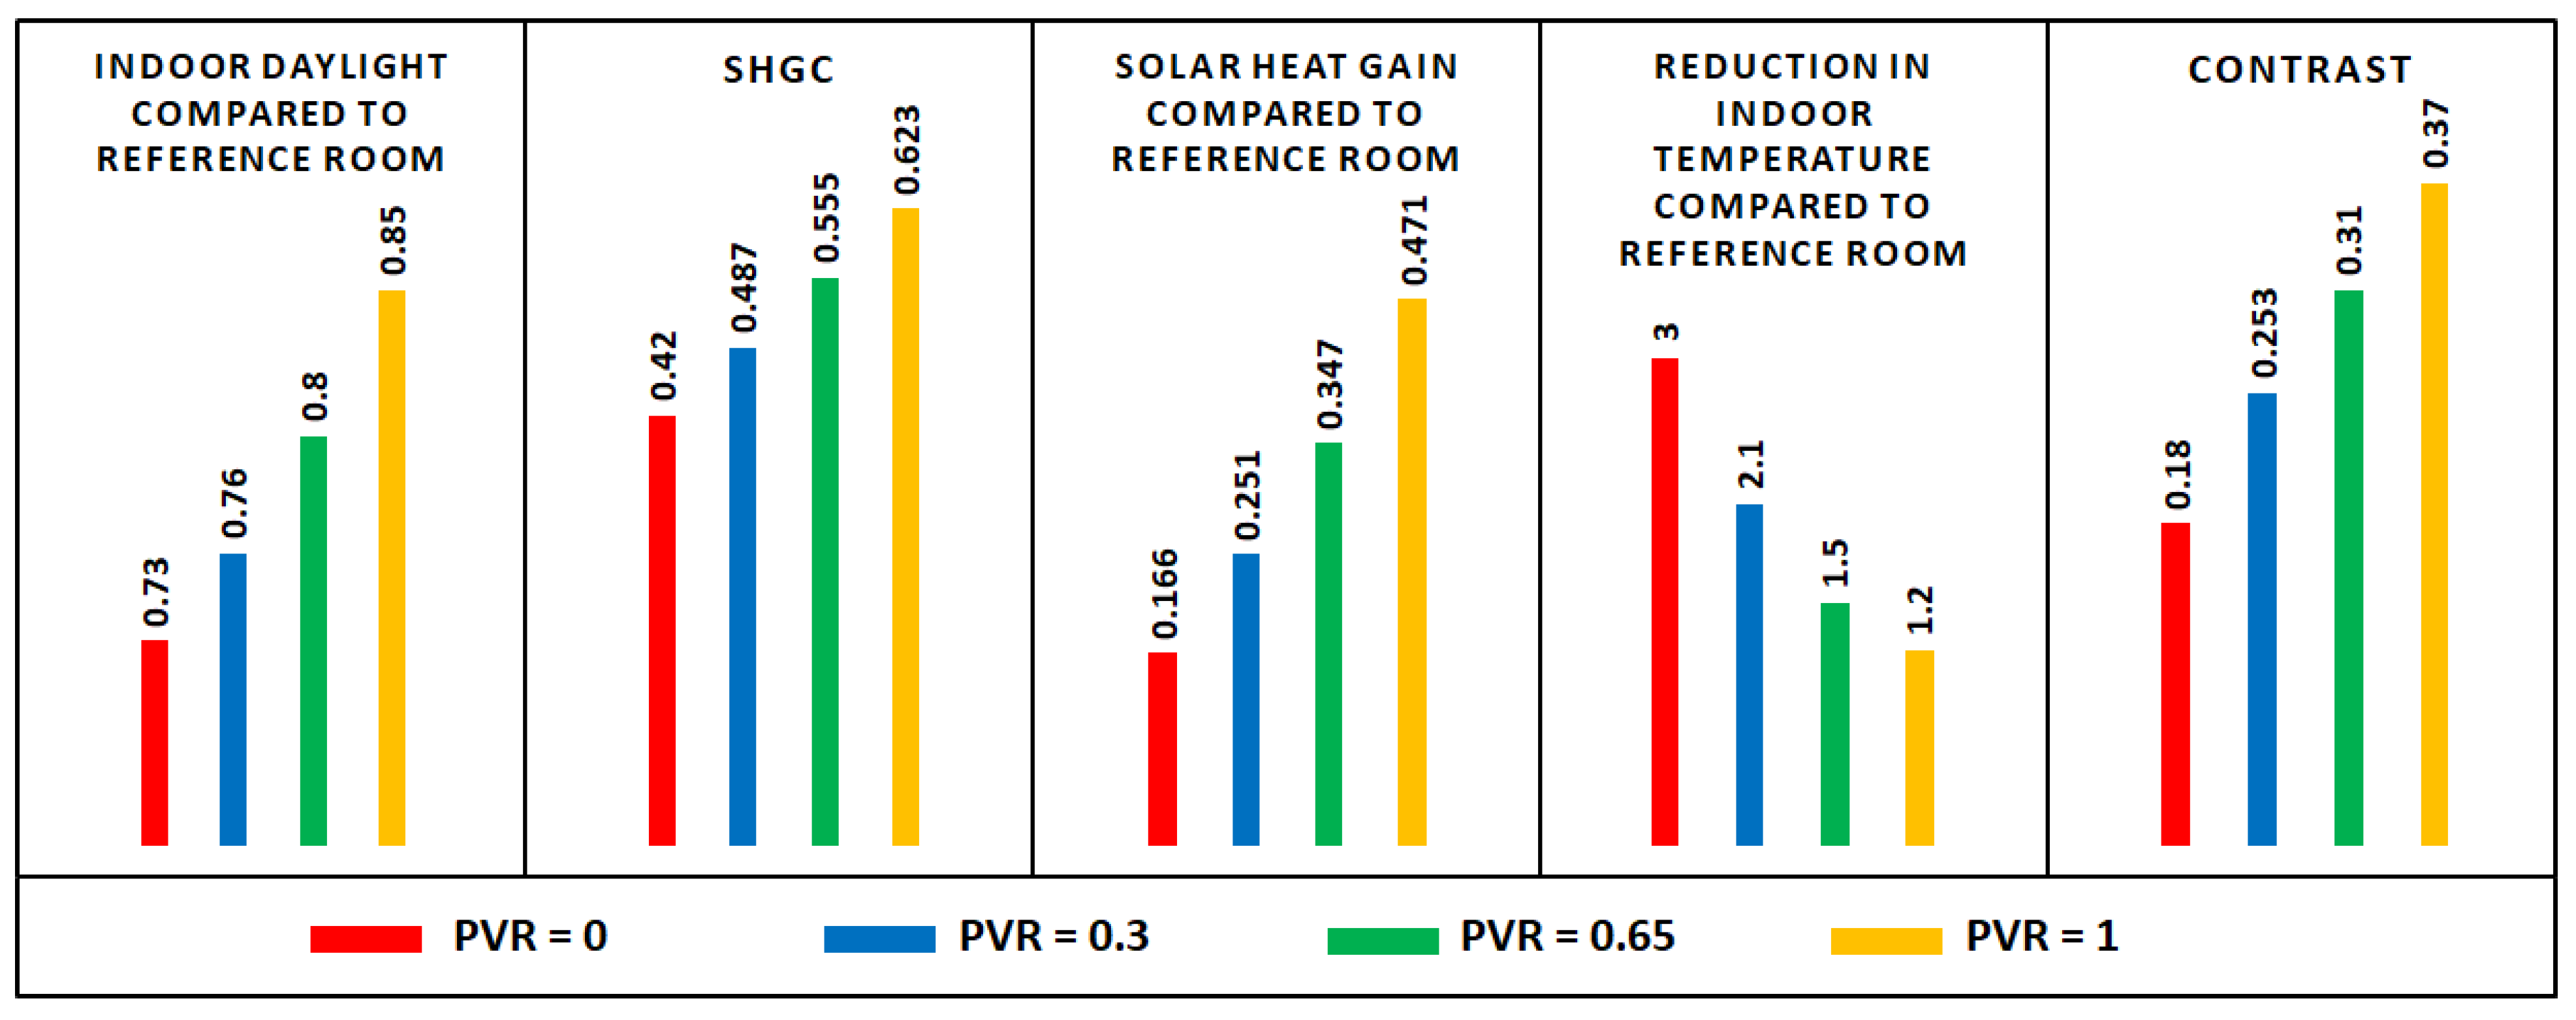
Evidently, increasing the value of the preferred vision ratio (PVR) led to an increase in the PDLC room temperature; for instance, for PVR of 0, 0.3, 0.65, and 1, the average temperature inside the reference room exceeded that of the PDLC room by 3, 2.1, 1.5, and 1.2 °C respectively. Alternatively, with the rise in the PVR, the temperature of the PDLC model approached the temperature inside the reference room; this is because the increase in the PVR allows more solar irradiance to enter the PDLC test room as the transparency becomes higher.
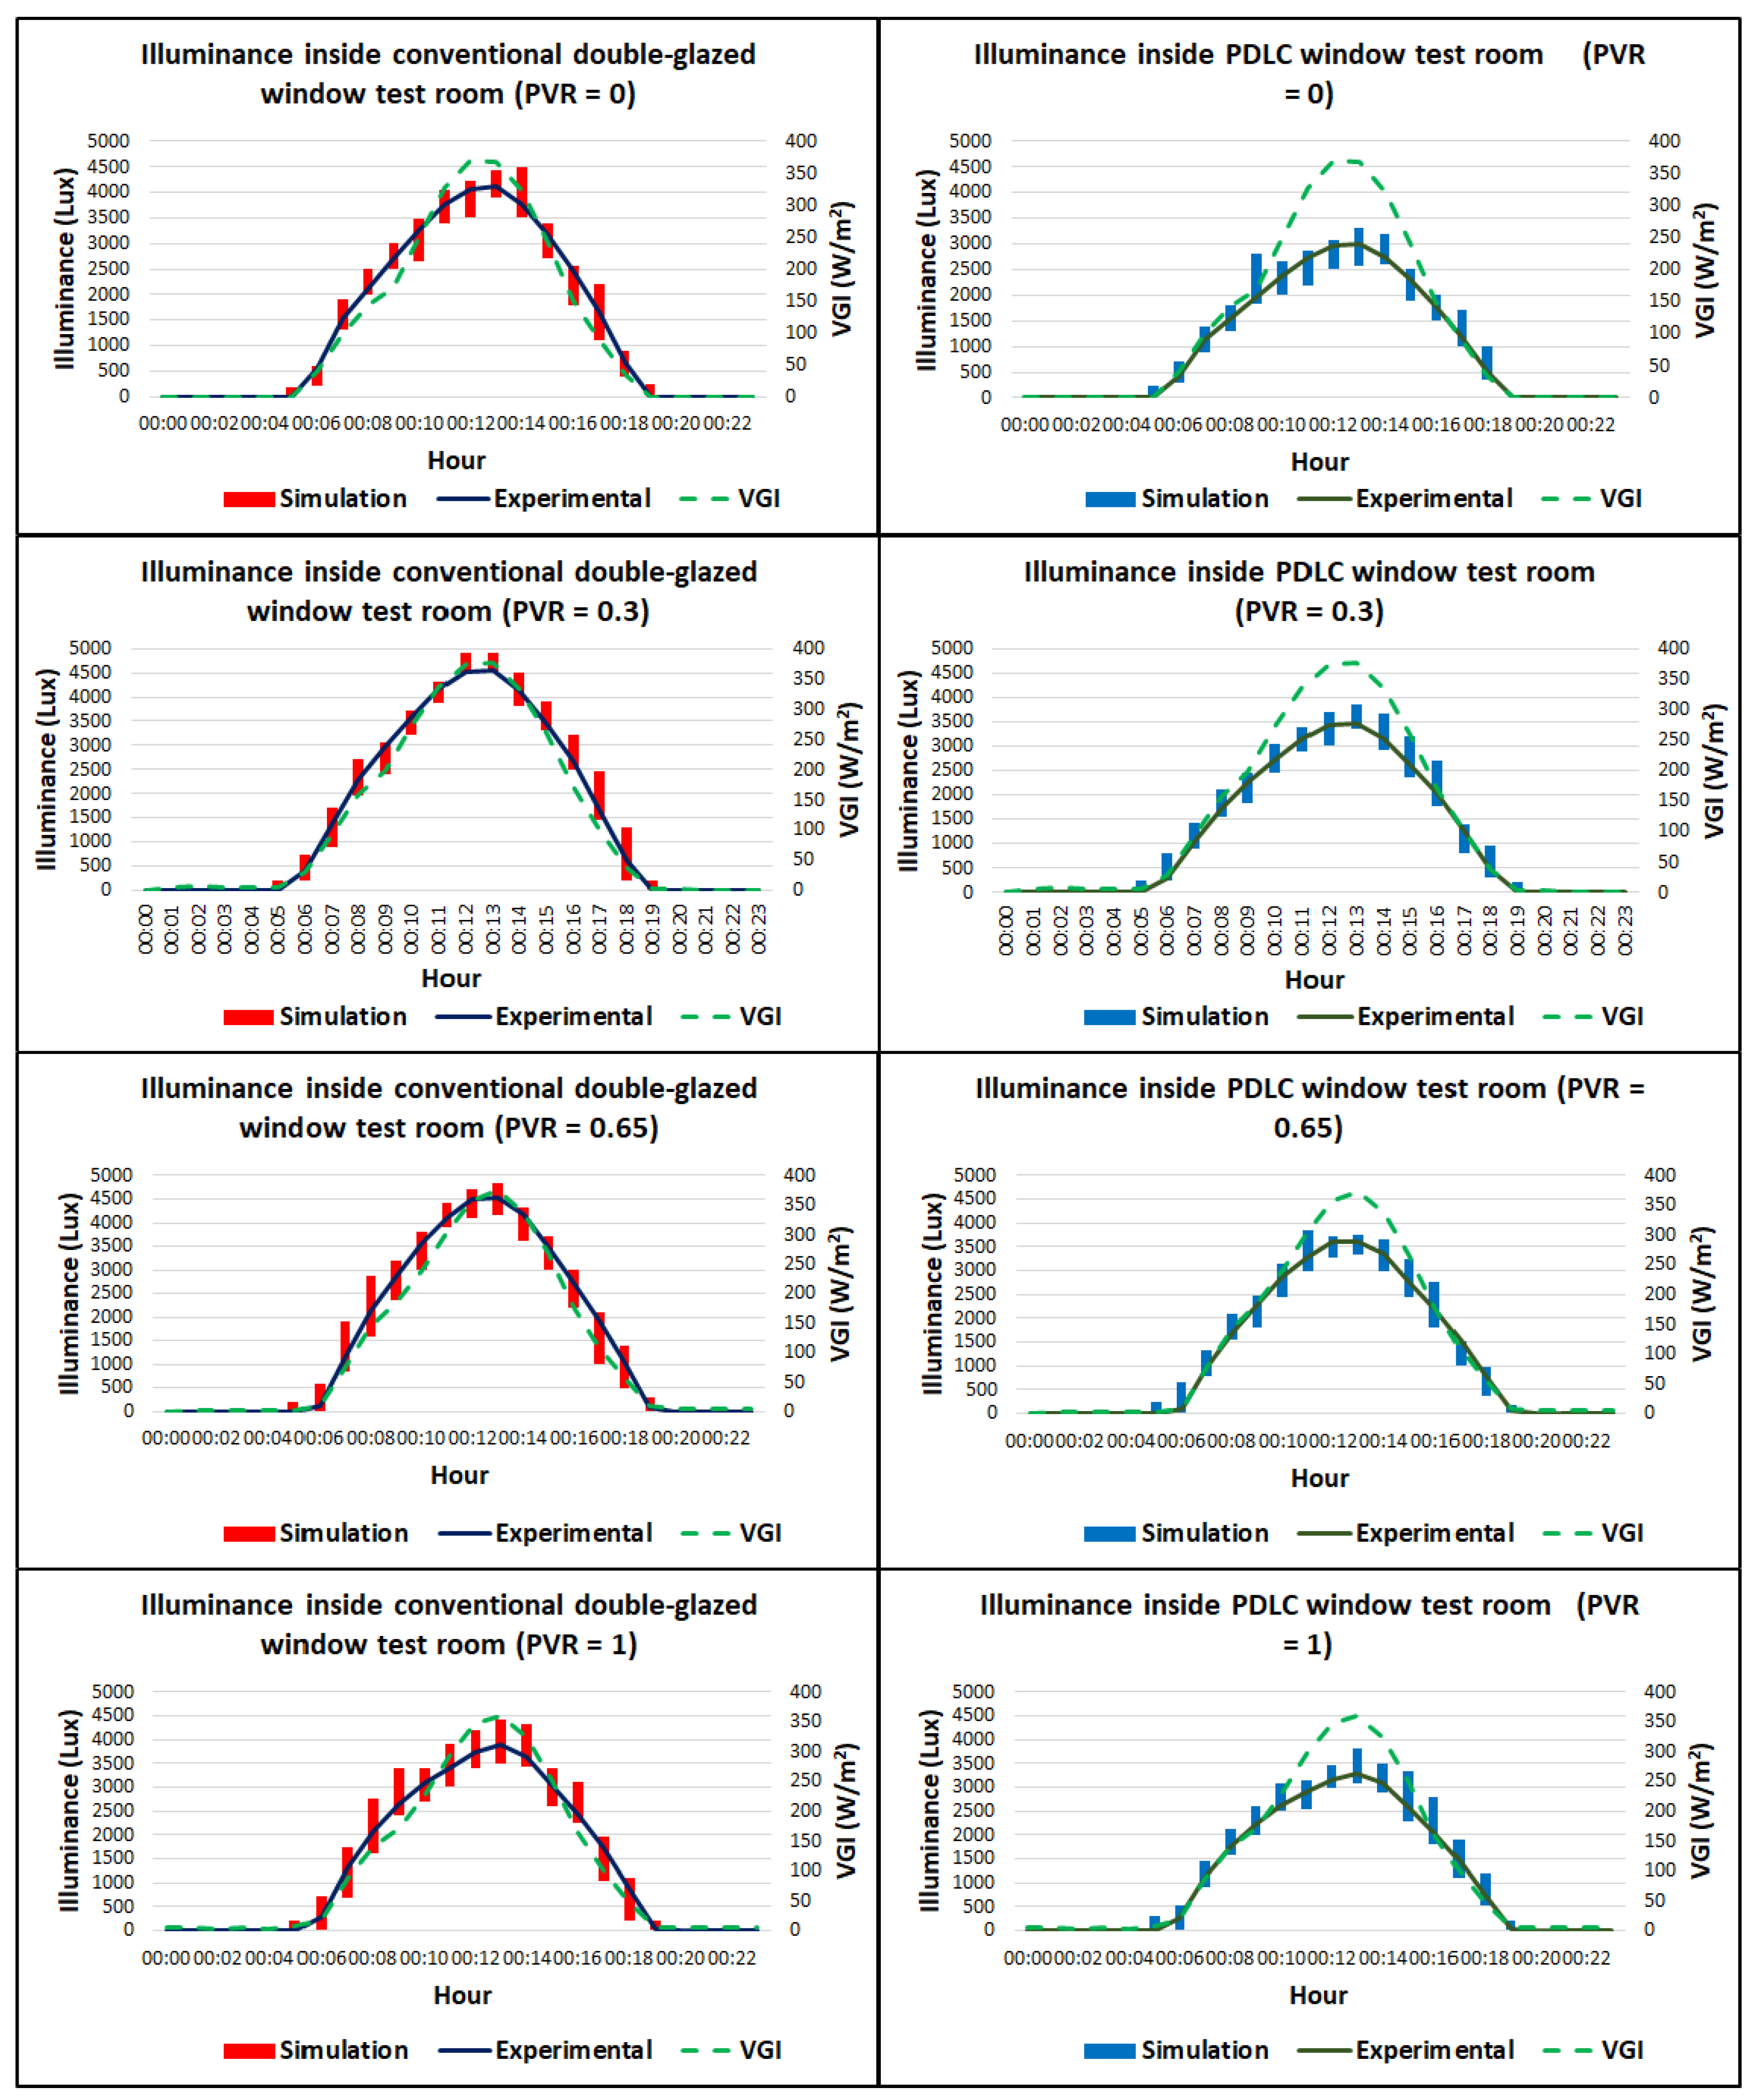
Figure 11 shows the experimental and simulated daylight values, in lux; these represent the illuminance intensity at the point inside the test rooms where the flux sensor was positioned. For the simulated daylight curves, DESIGN BUILDER software provides a range of illuminance values for a given point during the simulation; therefore, the values of simulated indoor illuminance are sketched as ranges in different hours during the daytime. Figure 11 also elucidates vertical global irradiance ().
Starting with day 1 and a PVR of 0, the experimental and simulated indoor illuminance values respond to the variation in the outdoor vertical global irradiance with good correlation. The maximum recorded illuminance inside the reference model at 12:00 pm (at the highest value of ) was 4.1 Klux, and the average illuminance was 2.6 Klux, whereas the highest and average illuminance values for the PDLC model were 3 and 1.9 Klux, respectively. Similar trends can be observed for other PVR settings on other days.
As a result of increasing the PVR, more daylight reached the internal environment. For example, when the PVR was set to 0 during the first day of the experiment, the average daylight in the PDLC test room was 73% of that in the reference test room. Thereafter, the change in daylight increased to 76, 80, and 85% for PVR values of 0.3, 0.65, and 1, respectively. As mentioned previously, raising the PVR offers higher visible transparency and permits more daylight to enter the PDLC test room. The average deviations between experimental and simulated daylight values inside the reference room and the PDLC room were 20 lux and 39 lux on day 1, 57 lux and 69 lux on day 2, 81 lux and 29 lux on day 3, and 39 lux and 108 lux on day 4, respectively.
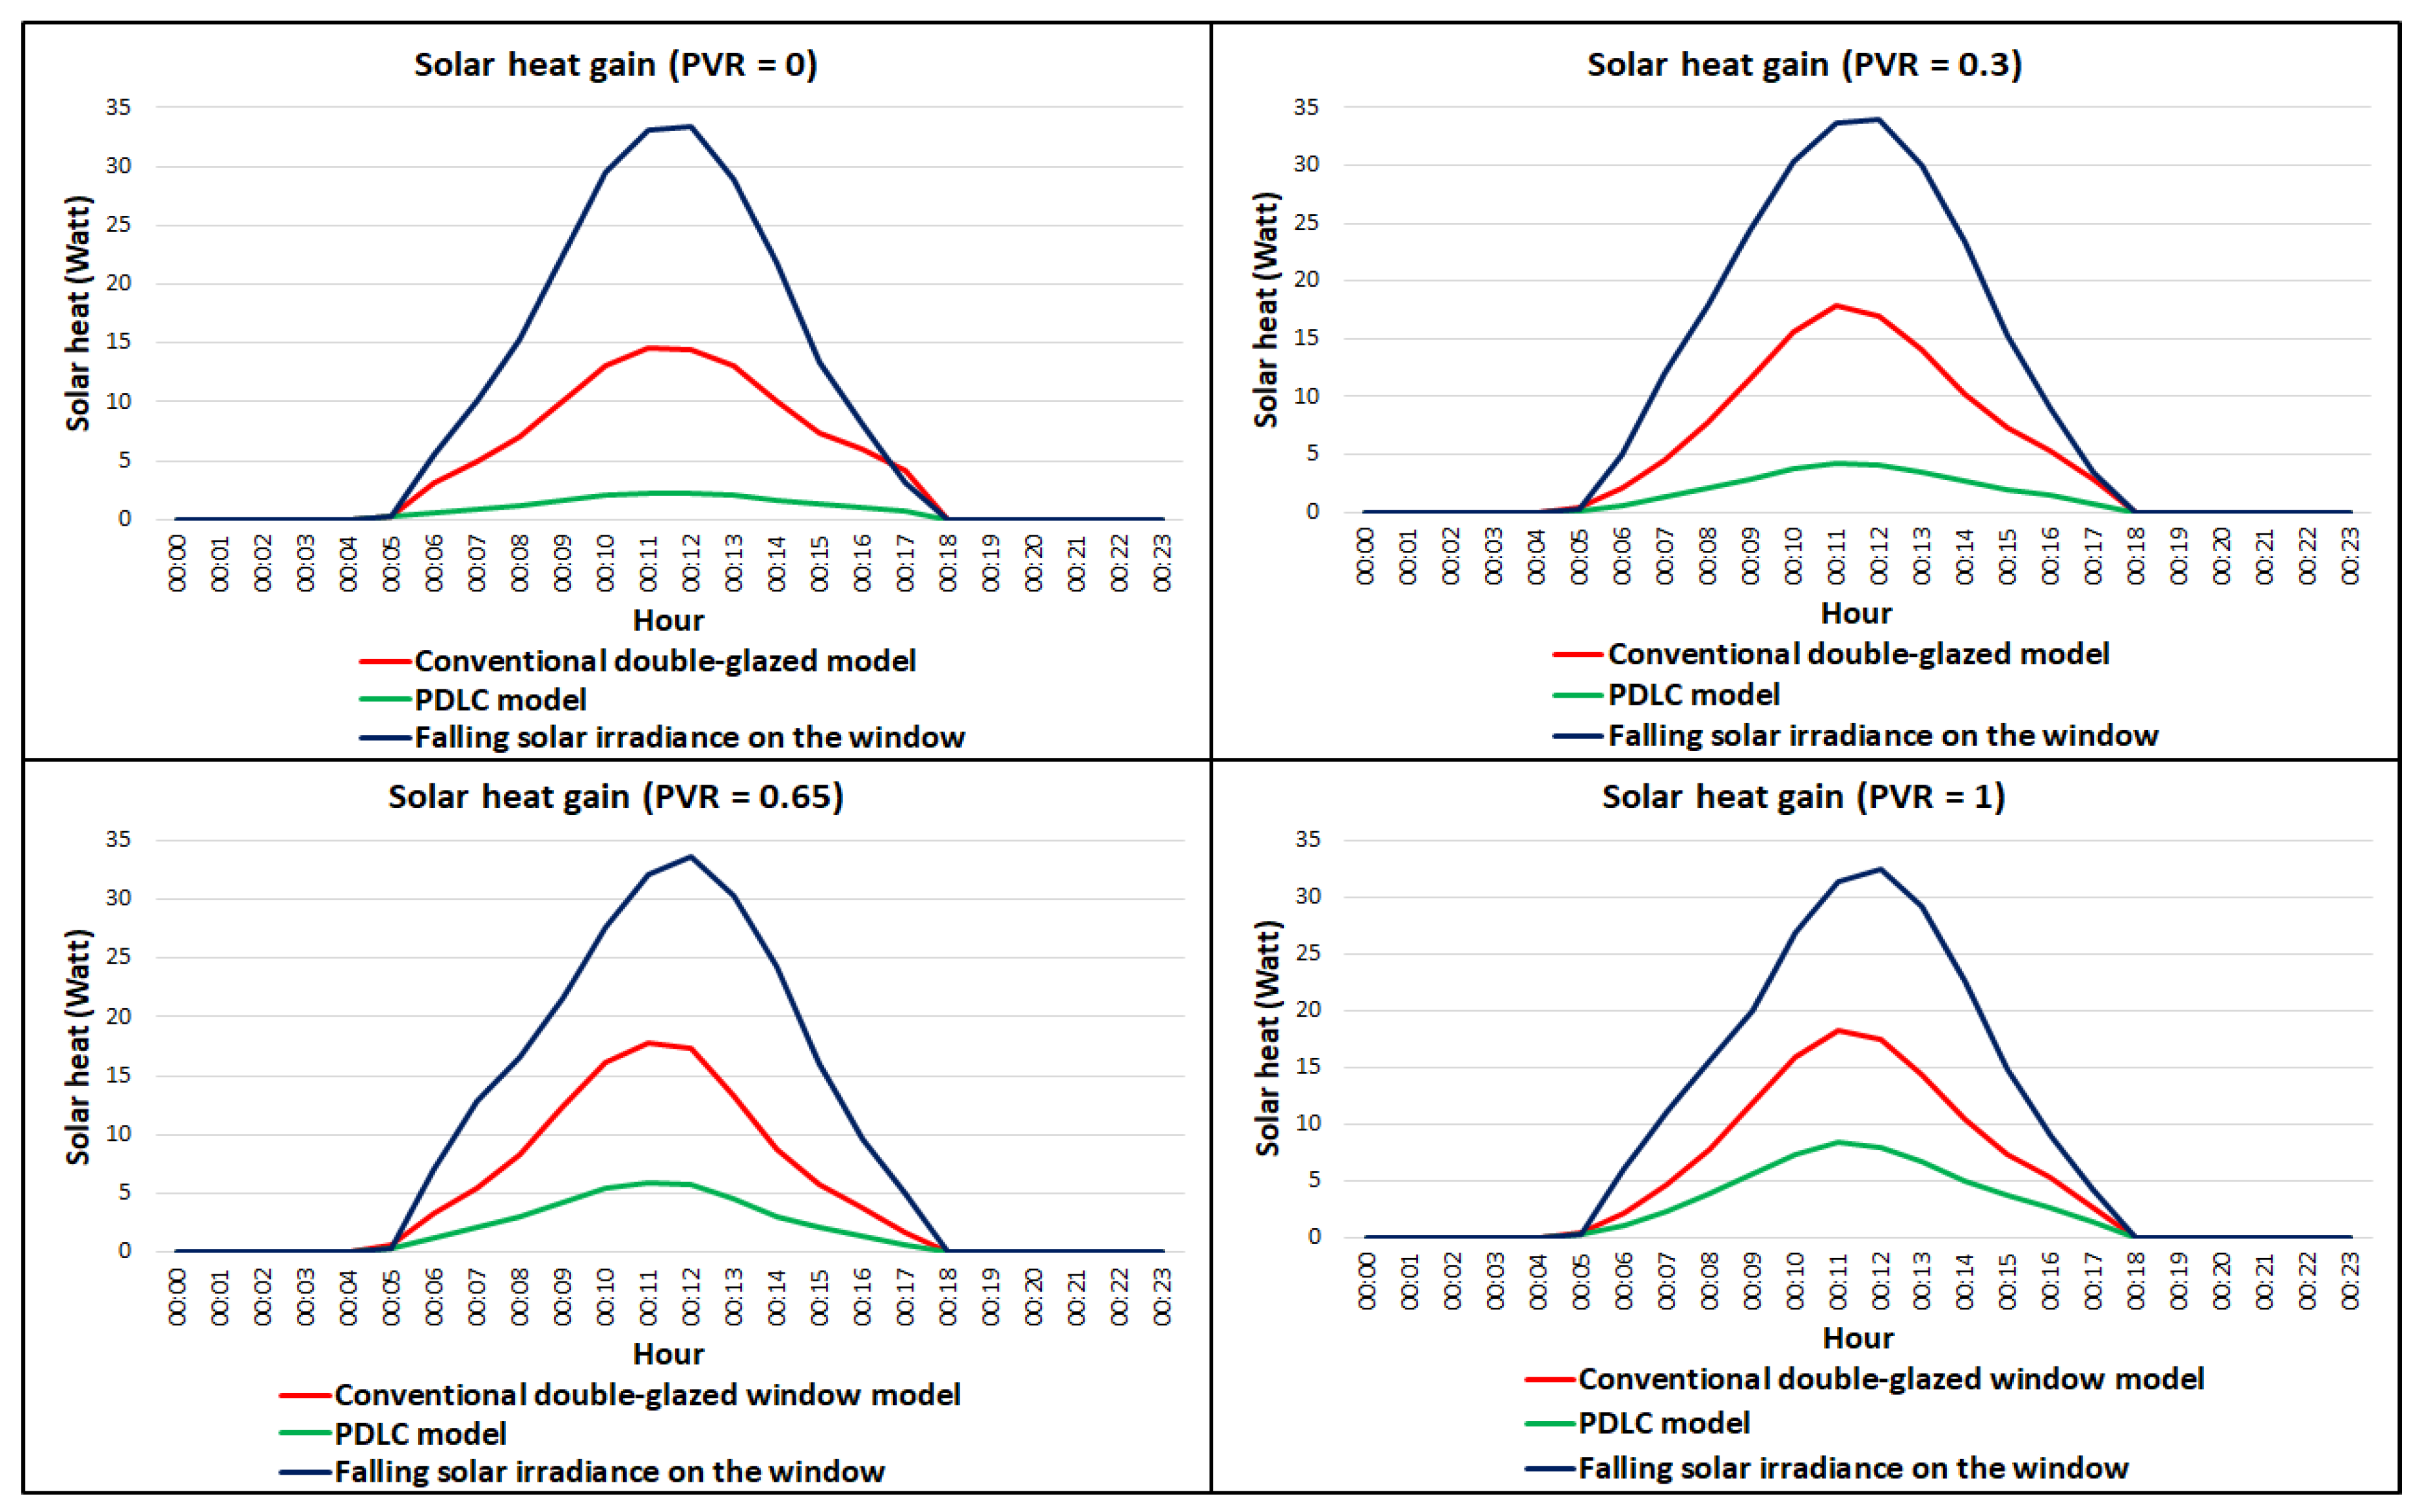
As the PDLC window has different transparency compared to the conventional double-glazed window, the window has a different solar heat gain coefficient (). Consequently, the solar heat gain values inside the two test rooms were not identical. Figure 12 depicts the experimental solar irradiance on the window and the simulated solar heat gain for both test rooms during the days of the experiment.
Overall, the effective solar heat gain occurred between 5:00 am and 6:00 pm, with the highest gain at 12:00 pm. The heat gain mimics the envelope of the solar irradiance on the window. During the first day of the experiment, with a PVR of 0, the maximum heat gain in the reference test room was 14.6 W and the average value was 8.32 W. By comparison, the highest recorded heat gain in the PDLC test room was 2.23 W and the average value was 1.38 W. Furthermore, with a PVR of 0.3, the greater heat gain noted inside the reference test room was 17.85 W and the average value was 8.95 W, whereas for the PDLC test room, the highest recorded heat gain was 4.25 W and the mean value was 2.24 W. Additionally, when the value of the PVR was set to 0.65, the superior observed heat gain in the reference test room was 17.8 W, and the average value was 8.81 W; similarly, the highest registered value in the PDLC test room was 5.88 W and the median value was 3.05 W. Finally, during day 4 of the experiment, with a PVR of 1, the heat gain in the reference room had a maximum value of 18.28 W and an average value of 9.09 W, whereas the highest observed value in the PDLC test room was 8.33 W and the mean value was 4.28 W.
Clearly, raising the preferred vision ratio resulted in an increase in a heat gain inside the PDLC test room; for instance, with a PVR of 0, the average heat gain inside the PDLC test room was only 16.6% of that in the reference room; this percentage was 25.1% with a PVR of 0.3, 34.7% with a PVR of 0.65, and 47.1% with a PVR of 1. Moreover, the solar heat gain coefficients computed by the DESIGN BUILDER software were 0.42, 0.49, 0.56, and 0.78 based on PVRs of 0, 0.3, 0.65, and 1, respectively.
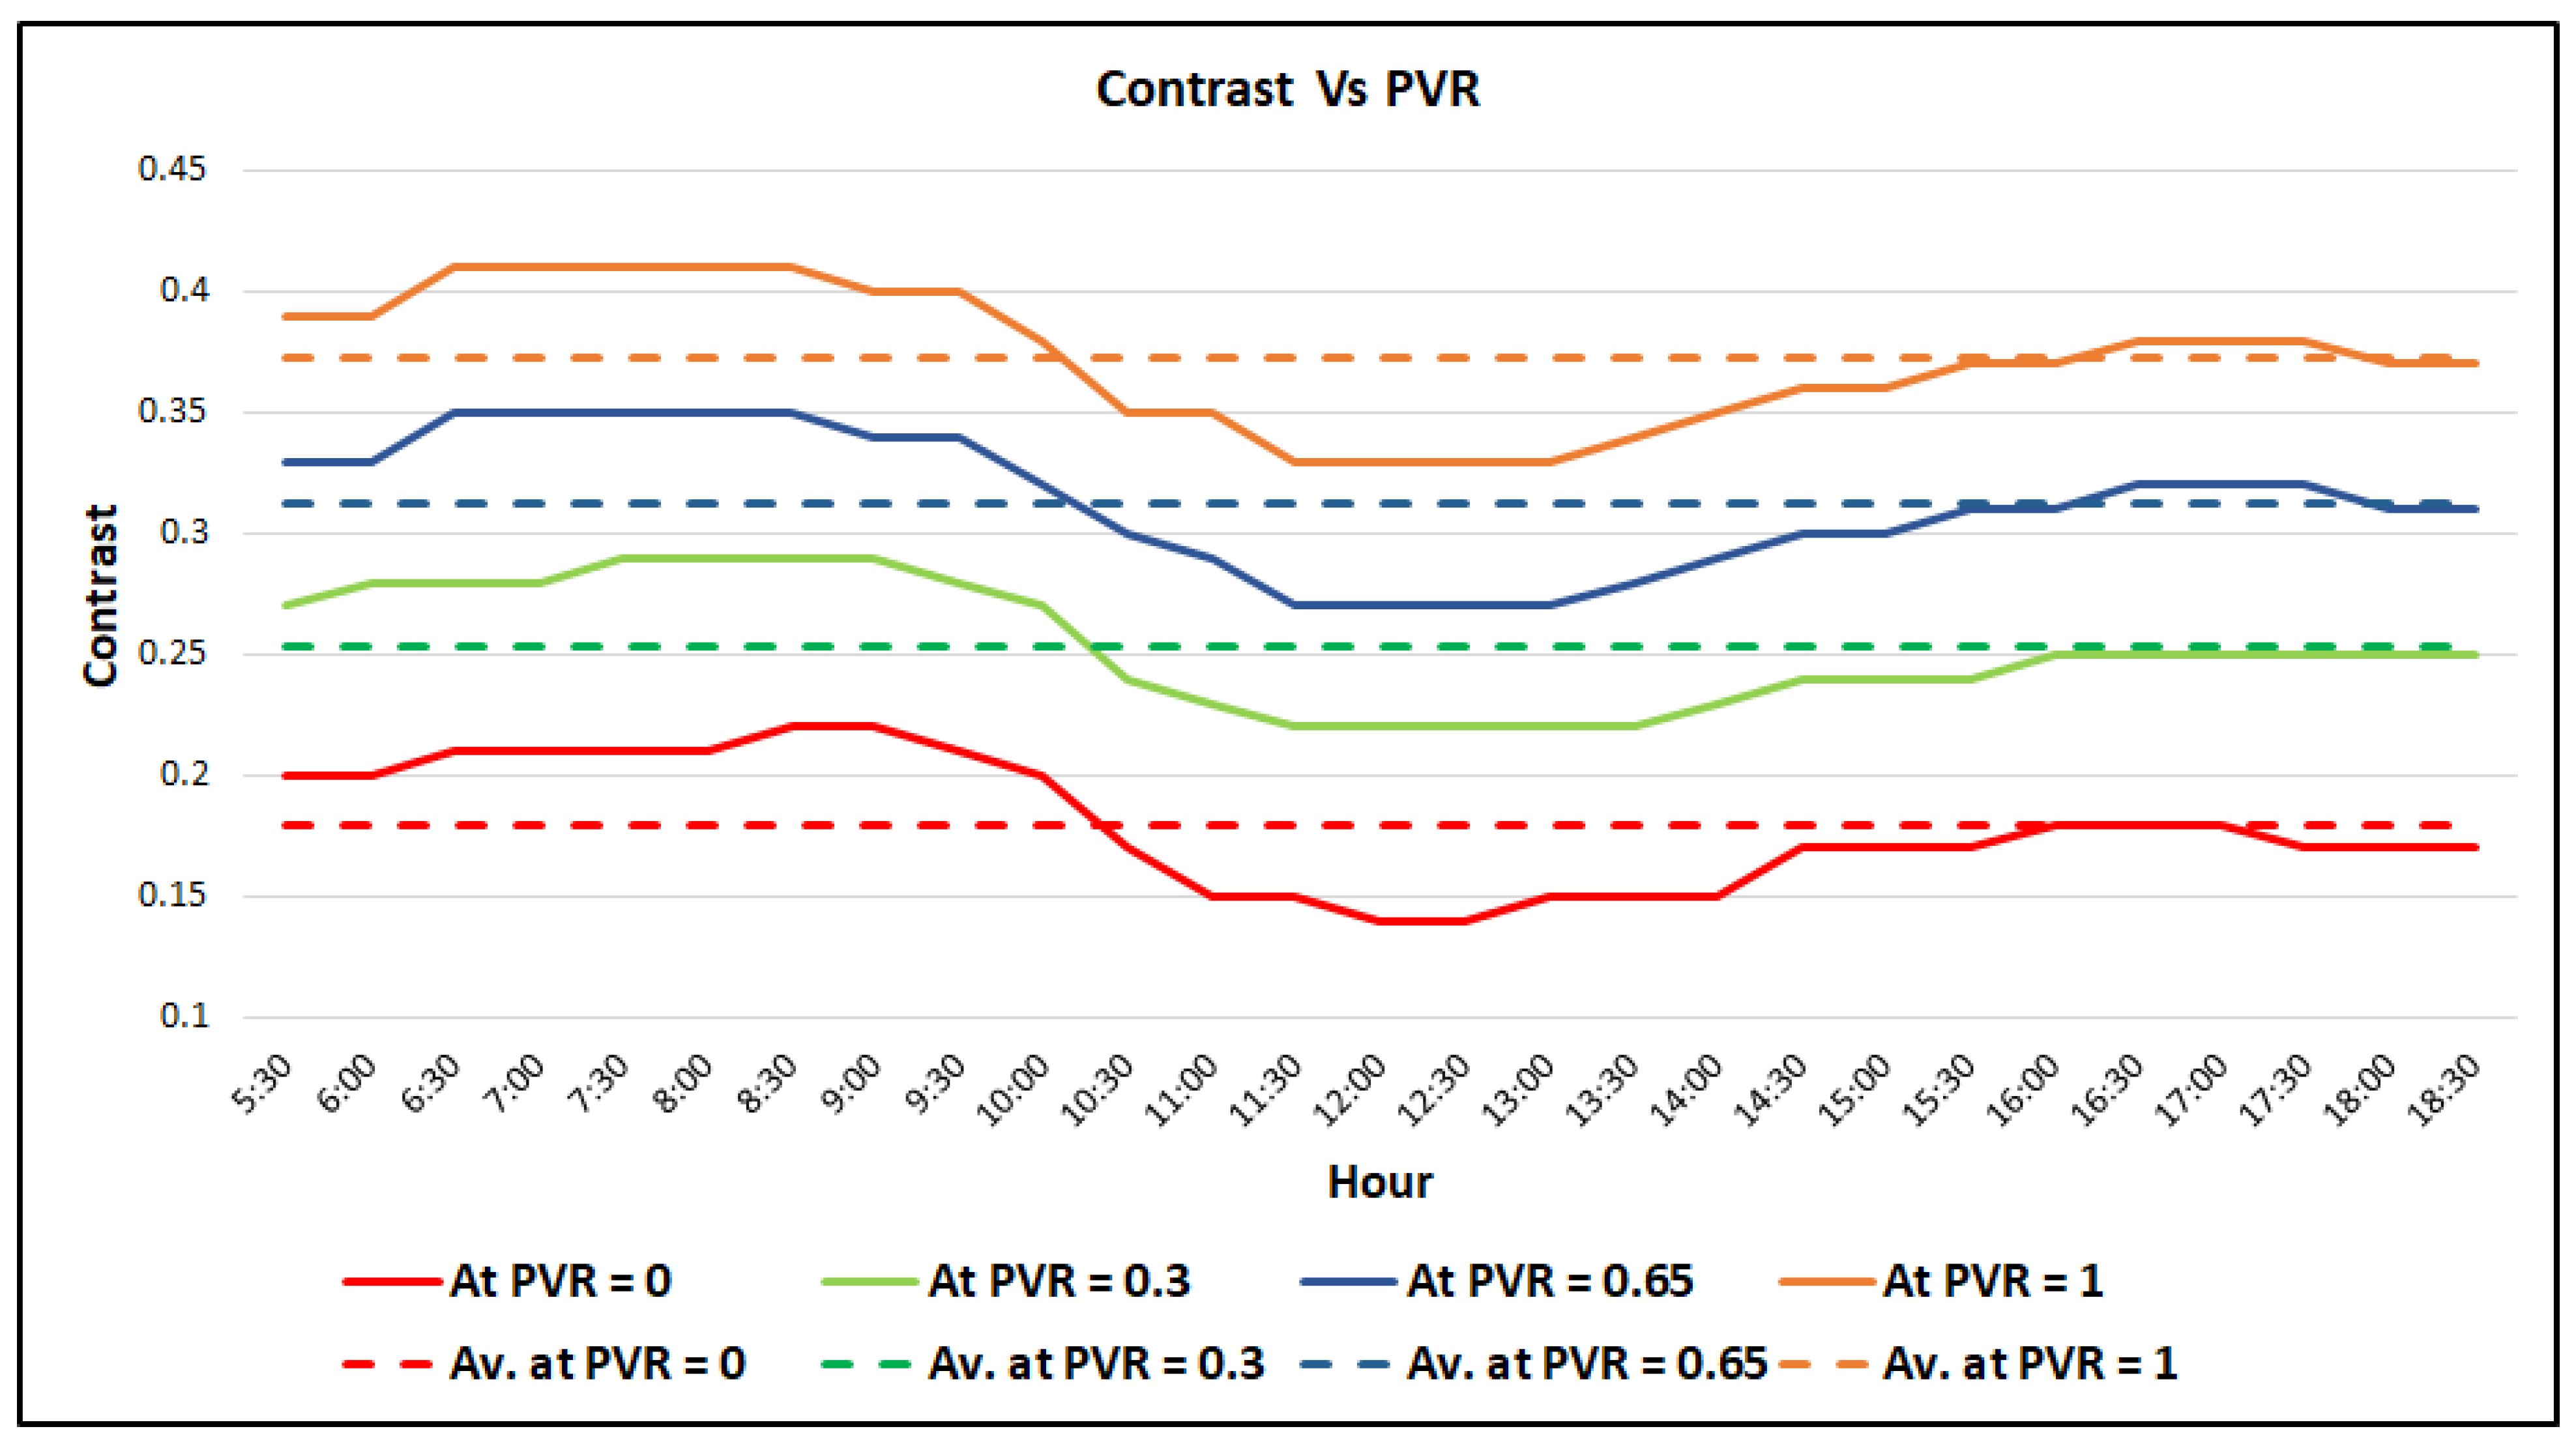
Modifying the PVR has a direct impact on the quality of vision through the PDLC window, as elucidated earlier, since it determines the operating point on the comfort vision band of the contrast–voltage curve, which represents the contrast value of the instantaneous external scene seen through the window. Consequently, the visible transparency was estimated accordingly. Figure 13 depicts the contrast values during daytime, which were determined by the proposed algorithm during the days of the experiment. Obviously, choosing a higher PVR prompts the system to increase the contrast; thus, the average contrast values were 0.18, 0.25, 0.31, and 0.37 for PVRs of 0, 0.3, 0.65, and 1, respectively.
However, Figure 13 shows a fluctuation in the contrast value during the daytime. The proposed system increases the contrast value during the early and late hours of daytime (low illuminance hours). In contrast, the system lessens the contrast during midday hours when the available illuminance in the external environment is too luminous. Hence, the lowest contrast occurred at the highest outdoor illuminance (at 12:00 pm).
During the experiment, the contrast–voltage curves were inflated during low daylight hours or reduced during high daylight hours; thus, the comfort vision band was expanded or limited accordingly. This modification in the contrast–voltage curve led to a change in the PVR; therefore, the system tried to keep the PVR constant by simultaneously updating the contrast value.
The interaction of the system with the outdoor illuminance mimics the behavior of the human eye. The pupil in the human eye is responsible for controlling the quantity of light that enters the eye to maintain a certain level of vision, and has a dilatable diameter to achieve a light-controlling action [39,40].
The proposed algorithm was executed every 30 min during daytime, as mentioned earlier; however, the experiment shows that the achieved contrast values were in the vicinity of the setpoint. To achieve a more precise contrast value, the processing frequency can be increased to 10 min.
In practical applications, the present study assumed that the scene was fixed during image capturing. However, if the view instantaneously changes (e.g., the sudden appearance of dirt, dust, or rain on the window), two consequences can be expected. First, if the sudden change is small then it will not affect the contrast calculation. Second, if the sudden change is large, then it may lead to a nonstandard form of the contrast curve. In this case, the quantification process should be modified to recognize this change and to avoid this limitation in real time using image-processing techniques.
Figure 14 shows the overall assessment of the system in terms of the daylight entering the indoor environment, indoor temperature, solar heat gain, and vision contrast through the window, which are directly proportional to the PVR.
It can be concluded that setting a higher PVR leads to better vision quality through the window and enhances the daylight performance in indoor environments. Unfortunately, this choice results in an increase in the heat gain inside buildings, and raises the average indoor temperature; as a result, more energy consumption is required for cooling loads in hot regions. However, providing good vision quality is undoubtedly an essential challenge and a trade-off can be considered. By comparison, in a temperate climate, such as that of the UK, this challenging trade-off may be more easily addressed because the energy consumption is expected to increase due to the lower temperature. Utilizing the newly developed thin films must not impact the vision through windows, but it is necessary to achieve a balance between energy consumption, vision quality, and daylight performance to obtain optimum overall performance.
The conducted experiment showed that utilizing normal LDR images is a suitable approach for the contrast–voltage curve. Using HDR images can generate more precise contrast curves. However, HDR images have greater color representation (16 bit instead of 8 bit in LDR images); this increases the complexity of the image processor, which effectively inflates the cost. At the stage of implementing the processor, it will be possible to compare the efficiency of the processing using LDR and HDR images, and thereby evaluate the precision of the contrast values in both cases.
If a commercial building is equipped with the proposed system, based on the procedures of the quantification algorithm, the visible transparency of the windows would change from an opaque to a translucent state every 30 min. This would not be acceptable to the occupants. Therefore, it is proposed to conduct the quantification procedures on a reference window located in a building that has fewer people, and distribute the data and transparency settings to other glazing in the building.
It is worth mentioning that the proposed quantification method is not restricted to PDLC windows, but can also be employed for other kinds of conventional and smart windows, whenever it is necessary to evaluate the quality of vision. However, conventional windows provide a high quality of external scenes, mostly due to the high visible transparency of their glass; therefore, the proposed method may be more useful in the case of smart windows.
5. Conclusions
This study aimed to quantify the vision through smart windows using an image-processing approach to achieve visual comfort for the occupants. A small-scale room was equipped with a PDLC double-glazed window and used as an example to realize the proposed system. Online image processing was proposed to derive the available comfort vision from the contrast–voltage curve of the PDLC film in real time, and to constrain the PDLC transparency range to achieve occupant satisfaction. The main contributions were as follows: first, mathematically defining the comfort vision band for PDLC double-glazed windows; and second, introducing the preferred vision ratio (PVR), which ensures a desired level of vision for the occupants. The main outcomes of this work can be summarized as follows:
- Vision through smart windows can be quantified in terms of the contrast of the scenes measured through the window toward the external views.
- The proposed PVR allows users to choose the preferable level of vision through the window.
- The experiment showed that varying the PVR from 0 to 1 can modify the average contrast value from 0.18 to 0.37 in a clear sky environment.
- The proposed algorithm ensures that the transparency of the window will not be less than a threshold value, in turn ensuring a minimum level of vision quality.
- The experiment showed that varying the PVR of the PDLC window from 0 to 1 increased the solar heat gain coefficient (SHGC) from 0.42 to 0.623.
- The experiment showed that modifying the PVR of the PDLC window from 0 to 1 allowed more daylight to enter the internal environment (73% to 85% compared to conventional double-glazed windows).
The test room was simulated in the DESIGN BUILDER software under the experimental weather conditions, and the simulation results were compared with the experiment outcome to validate the experimental results. In commercial buildings, employing the proposed system constrains the vision through smart windows within the comfort vision band. The system also helps to replace the conventional human preference surveying methods, thus saving time and effort. Moreover, future studies can utilize the proposed PVR to evaluate the vision level through smart windows. Overall, the proposed system adds observability and controllability capabilities for building controllers, thus helping achieve comfortable living environments for the occupants. In future, the proposed system may use HDR images for more precise contrast curves. Moreover, employing image-processing techniques enables the system to deal with instantaneous changes that may occur in the scenes during image capturing. In addition, an embedded system can be designed to implement the proposed quantification algorithm. This would help to reduce the time taken in the process and obtain more precise real-time visible transparency values for the glazing.
Author Contributions
Conceptualization, M.L., F.A.-n. and W.I.; Data curation, M.L.; Formal analysis, M.L., F.A.-n. and W.I.; Investigation, M.L.; Methodology, M.L.; Resources, M.L. and H.A.; Software, M.L.; Supervision, F.A.-n. and W.I.; Validation, M.L.; Visualization, M.L.; Writing—original draft, M.L.; Writing—review & editing, F.A.-n., W.I. and H.A. All authors have read and agreed to the published version of the manuscript.
Funding
This research received no external funding.
Institutional Review Board Statement
Not applicable.
Informed Consent Statement
Not applicable.
Data Availability Statement
Not applicable.
Conflicts of Interest
The authors declare no conflict of interest.
References
- Ghosh, A.; Mesloub, A.; Touahmia, M.; Ajmi, M. Visual comfort analysis of semi-transparent perovskite based building integrated photovoltaicwindow for hot desert climate (riyadh, saudi arabia). Energies 2021, 14, 1043. [Google Scholar] [CrossRef]
- Rabani, M.; Madessa, H.B.; Nord, N. Achieving zero-energy building performance with thermal and visual comfort enhancement through optimization of fenestration, envelope, shading device, and energy supply system. Sustain. Energy Technol. Assess. 2021, 44, 101020. [Google Scholar] [CrossRef]
- Basinska, M.; Kaczorek, D.; Koczyk, H. Building thermo-modernisation solution based on the multi-objective optimisation method. Energies 2020, 13, 1433. [Google Scholar] [CrossRef] [Green Version]
- Cesari, S.; Valdiserri, P.; Coccagna, M.; Mazzacane, S. The energy saving potential of wide windows in hospital patient rooms, optimizing the type of glazing and lighting control strategy under different climatic conditions. Energies 2020, 13, 2116. [Google Scholar] [CrossRef]
- Wang, C.H.; Kuo, N.W.; Anthony, K. Impact of window views on recovery—an example of post-cesarean section women. Int. J. Qual. Health Care 2019, 31, 798–803. [Google Scholar] [CrossRef] [PubMed]
- Pilechiha, P.; Mahdavinejad, M.; Rahimian, F.P.; Carnemolla, P.; Seyedzadeh, S. Multi-objective optimisation framework for designing office windows: Quality of view, daylight and energy efficiency. Appl. Energy 2020, 261, 114356. [Google Scholar] [CrossRef]
- Katunský, D.; Dolníková, E.; Doroudiani, S. Integrated lighting efficiency analysis in large industrial buildings to enhance indoor environmental quality. Buildings 2017, 7, 47. [Google Scholar] [CrossRef] [Green Version]
- Batool, A.; Rutherford, P.; McGraw, P.; Ledgeway, T.; Altomonte, S. Window Views: Difference of Perception during the COVID-19 Lockdown. LEUKOS-J. Illum. Eng. Soc. North Am. 2021, 17, 380–390. [Google Scholar] [CrossRef]
- Dodo, Y.A.; Kandar, M.Z.; Ossen, D.R.; Jibril, J.D.a.; Bornoma, A.H.; Abubakar, A.I. Importance of a view window in rating green office buildings. Adv. Mater. Res. 2013, 689, 180–183. [Google Scholar] [CrossRef]
- Roetzel, A.; Tsangrassoulis, A.; Dietrich, U.; Busching, S. On the influence of building design, occupants and heat waves on comfort and greenhouse gas emissions in naturally ventilated offices. A study based on the EN 15251 adaptive thermal comfort model in Athens, Greece. Build. Simul. 2010, 3, 87–103. [Google Scholar] [CrossRef]
- Ma, G.; Pan, X. Research on a visual comfort model based on individual preference in china through machine learning algorithm. Sustainability 2021, 13, 7602. [Google Scholar] [CrossRef]
- Day, J.K.; Futrell, B.; Cox, R.; Ruiz, S.N. Blinded by the light: Occupant perceptions and visual comfort assessments of three dynamic daylight control systems and shading strategies. Build. Environ. 2019, 154, 107–121. [Google Scholar] [CrossRef]
- GLim, H.; Keumala, N.; Ghafar, N.A. Energy saving potential and visual comfort of task light usage for offices in Malaysia. Energy Build. 2017, 147, 166–175. [Google Scholar] [CrossRef]
- Meresi, A. Evaluating daylight performance of light shelves combined with external blinds in south-facing classrooms in Athens, Greece. Energy Build. 2016, 116, 190–205. [Google Scholar] [CrossRef]
- Aries, M.B.C.; Veitch, J.A.; Newsham, G.R. Windows, view, and office characteristics predict physical and psychological discomfort. J. Environ. Psychol. 2010, 30, 533–541. [Google Scholar] [CrossRef]
- Jakubiec, J.A. The Use of Visual Comfort Metrics in the Design of Daylit Spaces. Massachusetts Institute of Technology. 2014. Available online: http://hdl.handle.net/1721.1/91295 (accessed on 1 September 2021).
- Setyantho, G.R.; Park, H.; Chang, S. Multi-criteria performance assessment for semi-transparent photovoltaic windows in different climate contexts. Sustainability 2021, 13, 2198. [Google Scholar] [CrossRef]
- Basher, M.K.; Alam, M.N.E.; Alameh, K. Design, development, and characterization of low distortion advanced semitransparent photovoltaic glass for buildings applications. Energies 2021, 14, 3929. [Google Scholar] [CrossRef]
- Gardymova, A.P.; Krakhalev, M.N.; Zyryanov, V.Y.; Gruzdenko, A.A.; Alekseev, A.A.; Rudyak, V.Y. Polymer dispersed cholesteric liquid crystals with a toroidal director configuration under an electric field. Polymers 2021, 13, 732. [Google Scholar] [CrossRef]
- Chen, G.; Hu, W.; Zhou, L.; Zhang, H.; Wang, L.; Zhang, C.; Sun, J.; Zhang, L.; Yuan, X.; Zhu, S. The electro-optical properties and adhesion strength of epoxy-polymercaptan-based polymer dispersed liquid crystal films. Crystals 2021, 11, 567. [Google Scholar] [CrossRef]
- Shchegolkov, A.V.; Jang, S.H.; Shchegolkov, A.V.; Rodionov, Y.V.; Sukhova, A.O.; Lipkin, M.S. A brief overview of electrochromic materials and related devices: A nanostructured materials perspective. Nanomaterials 2021, 11, 2376. [Google Scholar] [CrossRef]
- Brzezicki, M. A systematic review of the most recent concepts in smart windows technologies with a focus on electrochromics. Sustainability 2021, 13, 9604. [Google Scholar] [CrossRef]
- Detsi, M.; Manolitsis, A.; Atsonios, I.; Mandilaras, I.; Founti, M. Energy savings in an office building with high WWR using glazing systems combining thermochromic and electrochromic layers. Energies 2020, 13, 3020. [Google Scholar] [CrossRef]
- Ko, Y.; Oh, H.; Hong, H.; Min, J. Energy consumption verification of spd smart window, controllable according to solar radiation in south korea. Energies 2020, 13, 5643. [Google Scholar] [CrossRef]
- Oh, M.; Lee, C.; Park, J.; Lee, K.; Tae, S. Evaluation of energy and daylight performance of old office buildings in South Korea with curtain walls remodeled using polymer dispersed liquid crystal (PDLC) films. Energies 2019, 12, 3679. [Google Scholar] [CrossRef] [Green Version]
- Hemaida, A.; Ghosh, A.; Sundaram, S.; Mallick, T.K. Simulation study for a switchable adaptive polymer dispersed liquid crystal smart window for two climate zones (Riyadh and London). Energy Build. 2021, 251, 111381. [Google Scholar] [CrossRef]
- Bourbakis, N.G. Emulating Human Visual Perception for Measuring Difference in Images Using an SPN Graph Approach; IEEE: New York, NY, USA, 2002. [Google Scholar]
- Sasaki, H.; Todorokihara, M.; Ishida, T.; Miyachi, J.; Kitamura, T.; Aoki, R. Effect of noise on the contrast detection threshold in visual perception. Neurosci. Lett. 2006, 408, 94–97. [Google Scholar] [CrossRef]
- Butler, P.D.; Silverstein, S.M.; Dakin, S.C. Visual Perception and Its Impairment in Schizophrenia. Biol. Psychiatry 2008, 64, 40–47. [Google Scholar] [CrossRef] [Green Version]
- Veth, M.J.; Raquet, J.F. Image-Aided Navigation—Concepts and Applications. In Position, Navigation, and Timing Technologies in the 21st Century: Integrated Satellite Navigation, Sensor Systems, and Civil Applications; IEEE: New York, NY, USA, 2021; pp. 1571–1595. [Google Scholar] [CrossRef]
- Driggers, R.; Jacobs, E.; Young, S. Signal Processing and Performance Analysis for Imaging Systems. Artech. 2008. Available online: http://ieeexplore.ieee.org/document/9100126 (accessed on 1 September 2021).
- Fan, Z.; Liu, M.; Tang, S. A multi-objective optimization design method for gymnasium facade shading ratio integrating energy load and daylight comfort. Build. Environ. 2021, 207, 108527. [Google Scholar] [CrossRef]
- Hegazy, M.; Yasufuku, K.; Abe, H. Evaluating and visualizing perceptual impressions of daylighting in immersive virtual environments. J. Asian Archit. Build. Eng. 2021, 20, 768–784. [Google Scholar] [CrossRef]
- Futagami, T.; Yano, T.; Huang, C.; Enohara, T. Experimental evaluation for daylight-linked gradation lighting control using image-based motion sensors. IEEJ Trans. Electr. Electron. Eng. 2020, 15, 723–732. [Google Scholar] [CrossRef]
- Suk, J.; Schiler, M. Investigation of Evalglare software, daylight glare probability and high dynamic range imaging for daylight glare analysis. Lighting Res. Technol. 2013, 45, 450–463. [Google Scholar] [CrossRef]
- Kandilli, C.; Ulgen, K. Numerical Assessment of Downward Incoming Solar Irradiance in Smoke Influenced Regions—A Case Study in Brazilian Amazon and Cerrado. Remote Sens. 2021, 13, 4527. [Google Scholar] [CrossRef]
- Kandilli, C.; Ulgen, K. Solar illumination and estimating daylight availability of global solar irradiance. Energy Sources Part A Recovery Util. Environ. Eff. 2008, 30, 1127–1140. [Google Scholar] [CrossRef]
- Ionescu, C.; Fosalau, C.; Petrisor, D. A study of changes in image contrast with various algorithms. In Proceedings of the 2014 International Conference and Exposition on Electrical and Power Engineering, Iasi, Romania, 16–18 October 2014; pp. 100–104. [Google Scholar] [CrossRef]
- Wyatt, H.J. The Form of the Human Pupil. Vis. Res. 1995, 35, 2021–2036. [Google Scholar] [CrossRef] [Green Version]
- Hanke, F.D.; Hanke, W.; Scholtyssek, C.; Dehnhardt, G. Basic mechanisms in pinniped vision. Exp. Brain Res. 2009, 199, 299–311. [Google Scholar] [CrossRef] [PubMed]
Figure 1.
Visual comfort quantification block diagram.

Figure 2.
Methodology setup.

Figure 3.
Digital images with different applied voltages.

Figure 4.
Contrast curve.

Figure 5.
Experimental setup. (A): Reference room with double-glazed window (closer), PDLC room (further), and the pyranometer for vertical global irradiance measurement (circled). (B): Pyranometer for global horizontal irradiance measurement. (C): The weather station. (D): Pyranometer for diffuse horizontal irradiance measurement.

Figure 6.
Algorithm for adjusting the excitation of the PDLC film used in the experiment.

Figure 7.
Transparency–voltage curve of the PDLC thin film.

Figure 8.
Calculated outdoor illuminance data during experiment days based on IESNA approach.

Figure 9.
Solar irradiance data.

Figure 10.
Indoor temperature for the test rooms versus PVR.

Figure 11.
Indoor illuminance for the test rooms versus PVR.

Figure 12.
Solar heat gain for the test rooms versus PVR.

Figure 13.
Contrast versus the PVR.

Figure 14.
Results summary.


Table 1.
The constants of sky parameters.
| Sky Condition | c | A, Klux | B, Klux | C, Klux |
|---|---|---|---|---|
| Clear | 21 | 0.8 | 15.5 | 0.5 |
| Partly cloudy | 0.8 | 0.3 | 45 | 1 |
| Cloudy | No direct sun | 0.3 | 21 | 1 |
Table 2.
Specifications of the experimental setup.
| Item | Part | Details |
|---|---|---|
| Board | Polystyrene thickness | 4.9 cm |
| Steel thickness | 0.05 cm | |
| Wall dimension of the room | 55 × 55 cm2 | |
| Room dimensions | 45 × 45 × 45 cm3 | |
| Double glazed window | Room area | 30 × 30 cm2 |
| WWR | 44% | |
| Glazing type | Clear | |
| Glazing thickness | 0.4 cm | |
| Thermal conductivity for the glazing | 0.9 W/m.K | |
| Glazing transmittance | 0.83 | |
| Glazing reflectance | 0.12 | |
| Glazing absorbance | 0.039 | |
| Depth of the air layer | 2 cm | |
| Outside reveal depth | 0 cm | |
| PDLC film | Rated voltage | 220 AC volt |
| Thickness | 0.36 mm | |
| Visible transparency (OFF/ON) | 0.05/0.83 | |
Table 3.
Technical specifications of the sensors.
| Sensor | Technical Specifications |
|---|---|
| Pyranometer (for global horizontal irradiance measurement) | Veinasa-ZFS Solar total radiation sensor, sensitivity 7~14 μV per w/m2, and measurement range 0~2000 W/m2 |
| Pyranometer (for diffused horizontal irradiance measurement) | Veinasa-SFS Scattered radiation sensor, sensitivity 7~14 μV per w/m2, and measurement range 0~2000 W/m2 |
| Pyranometer (for global vertical irradiance measurement) | Davis Instruments 6450 Solar Radiation Sensor, sensitivity 1.67 mV per W/m2, measurement range 0~1800 W/m2 |
| Lux meter (for indoor illuminance measurement) | OPT3001 Ambient Light Sensor, measurement range 0.01 lux to 83 k lux |
| Temperature sensor (for indoor temperature measurement) | AM2302 humidity and temperature sensor, sensitivity 0.1 Celsius, and measurement range −40~80 Celsius |
Table 4.
The scenarios of the experiment.
| Scenario | Day | Test Room 1 | Test Room 2 | |
|---|---|---|---|---|
| Window Type | PVR | Window Type | ||
| 1 | 1st | Conventional double-glazed window | 0 | Double-glazed PDLC window |
| 2 | 2nd | 0.3 | ||
| 3 | 3rd | 0.65 | ||
| 4 | 4th | 1 | ||
Publisher’s Note: MDPI stays neutral with regard to jurisdictional claims in published maps and institutional affiliations. |
© 2022 by the authors. Licensee MDPI, Basel, Switzerland. This article is an open access article distributed under the terms and conditions of the Creative Commons Attribution (CC BY) license (https://creativecommons.org/licenses/by/4.0/).
Share and Cite
MDPI and ACS Style
Lami, M.; Al-naemi, F.; Alrashidi, H.; Issa, W. Quantifying of Vision through Polymer Dispersed Liquid Crystal Double-Glazed Window. Energies 2022, 15, 3196. https://doi.org/10.3390/en15093196
AMA Style
Lami M, Al-naemi F, Alrashidi H, Issa W. Quantifying of Vision through Polymer Dispersed Liquid Crystal Double-Glazed Window. Energies. 2022; 15(9):3196. https://doi.org/10.3390/en15093196
Chicago/Turabian StyleLami, Mohammed, Faris Al-naemi, Hameed Alrashidi, and Walid Issa. 2022. "Quantifying of Vision through Polymer Dispersed Liquid Crystal Double-Glazed Window" Energies 15, no. 9: 3196. https://doi.org/10.3390/en15093196
Note that from the first issue of 2016, this journal uses article numbers instead of page numbers. See further details here.