1. Introduction
Up to the present, most Chilean homes have an electromechanical meter that registers electric consumption and is checked by the providing company every 30 days. The energy prices established in the traditional tariff options are fixed for the 24 of the day, this being the example for the residential tariff of the regulated sector in Chile, denominated BT1 [
1], and which is also applied to the tariffs for consuming periods in CESPA microgrid.
The city of San Pedro de Atacama is isolated from the Chilean National Electric System (SEN, Sistema Eléctrico Nacional), and therefore, the CESPA company is the one in charge of generating and distributing the electric energy to the customers from San Pedro de Atacama, as well as its surroundings, similar to the performance of a microgrid. Its generation plan is thermic based on diesel and liquefied natural gas (LNG), with a capacity of 4 MW. By the end of 2021, the construction of a PV power plant of 2 MWp was allotted, which will allow the company to diversify the current energetic matrix and extend the total installed capacity to 6 MW.
According to the register of turnover from February 2020, CESPA is in charge of providing electrical energy to a total of 2254 customers, from which 1802 are residential customers (80%) and 452 are commercial customers (20%). All of them are adherent of a tariff scheme structured in nine sections of energy volume, where the marginal price increases due to the total amount of consumed energy; that is to say, when a certain margin of monthly consumption is exceeded, the electricity price is raised to a higher price because it is placed in the higher consumption section.
Table 1 shows the current tariff scheme of CESPA, which is a flat structure offering a null incentive, so customers make a real DSM.
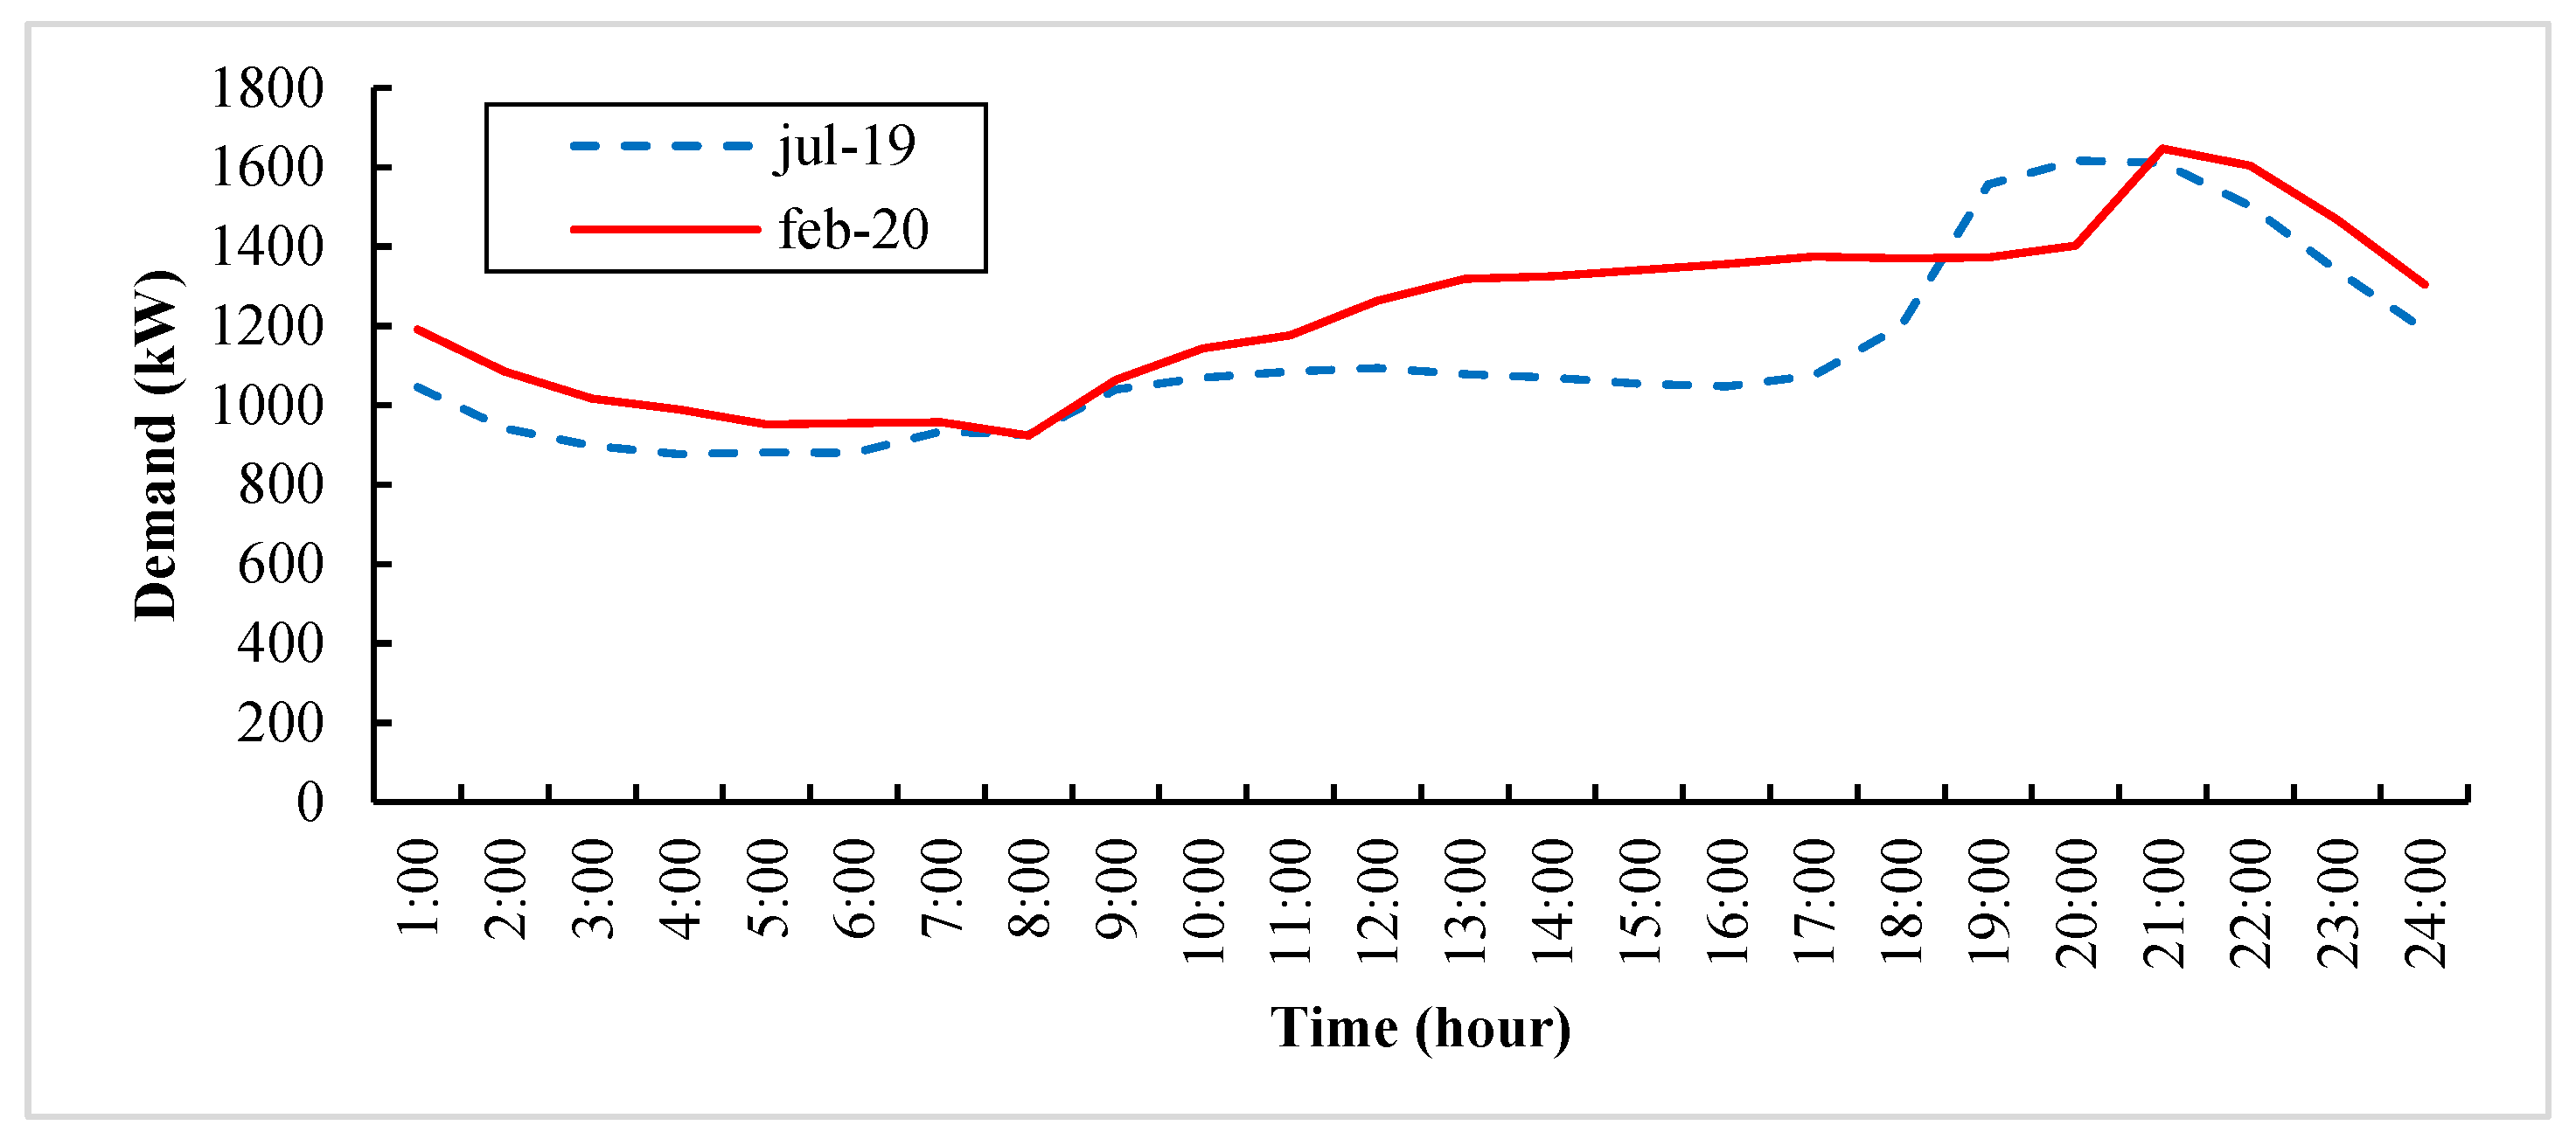
The consequence of the current tariff scheme of CESPA is made clear in the demand profile of the electric system.
Figure 1 shows the demand profiles in months of different seasons in July 2019 (Chilean winter) and February 2020 (Chilean summer). Changes up to a doubling between the minimum demand of 800 kW and the maximum demand of 1600 kW, independent of the season of the year, are observed.
If a change in the measurement equipment to smart meters is considered [
2], then several new tariff options can be proposed to the customers, ones that consider different prices according to the time of the day the energy is consumed. With scheduled pricing, customers are encouraged to use energy during lower price times. The incorporation of the smart meters considers an Advanced Metering Infrastructure, AMI, which uses bidirectional communication and the Internet of Things, IoT, for a daily and systematic measurement, lecture, monitoring, and electrical consumption management for large customer groups. Then, a bigger protagonist of the customers in the decision making is promoted, for example, in the DSM through scheduled tariffs, which maximizes the energetic source of the electrical system.
This work makes the most of the function of scheduled invoicing that can be programmed in the smart meters, and with it, propose a variable pricing scheme in the time, such as the TOUP and the first application in Chile with time-varying price option rates in the cost of energy consumed.
The TOUP tariff scheme is a tool capable of implementing the DSM based on prices to promote the suitable management of the customers’ demand profile [
3]. In this way, the proposed objective is to optimize both the use of electric energy and the available infrastructure, benefiting both the CESPA company and its customers, technically and economically. The article is developed as follows. In
Section 2, a bibliographic revision of some of the tariff schemes of scheduled or time-variable type, which were used to select the TOUP option proposed for the customers of CESPA, is presented. In
Section 3, the TOUP structure is modeled, defining the time bands and price levels for residential and commercial customers. Tariff formulas for each section of the monetary charges are also presented. In
Section 4, the results of the monthly economic projections for customers and the CESPA company considering the implementation of the tariff proposal are presented. In
Section 5, the analysis of the results is presented; finally, in
Section 6, the conclusions of the work are shown.
2. Tariff Schemes of Time-Variable Pricing
Tariff schemes of time-variable pricing have been discussed in the literature for a long time as a measure to increment the DSM in the short-term in electrical systems [
4]. This continues naturally because pricing depends on supply and demand, and in this case, the DSM based on prices works in a way that optimizes both generation and consumption, avoiding the necessity of costly investments in the production and transmission capacities of energy systems.
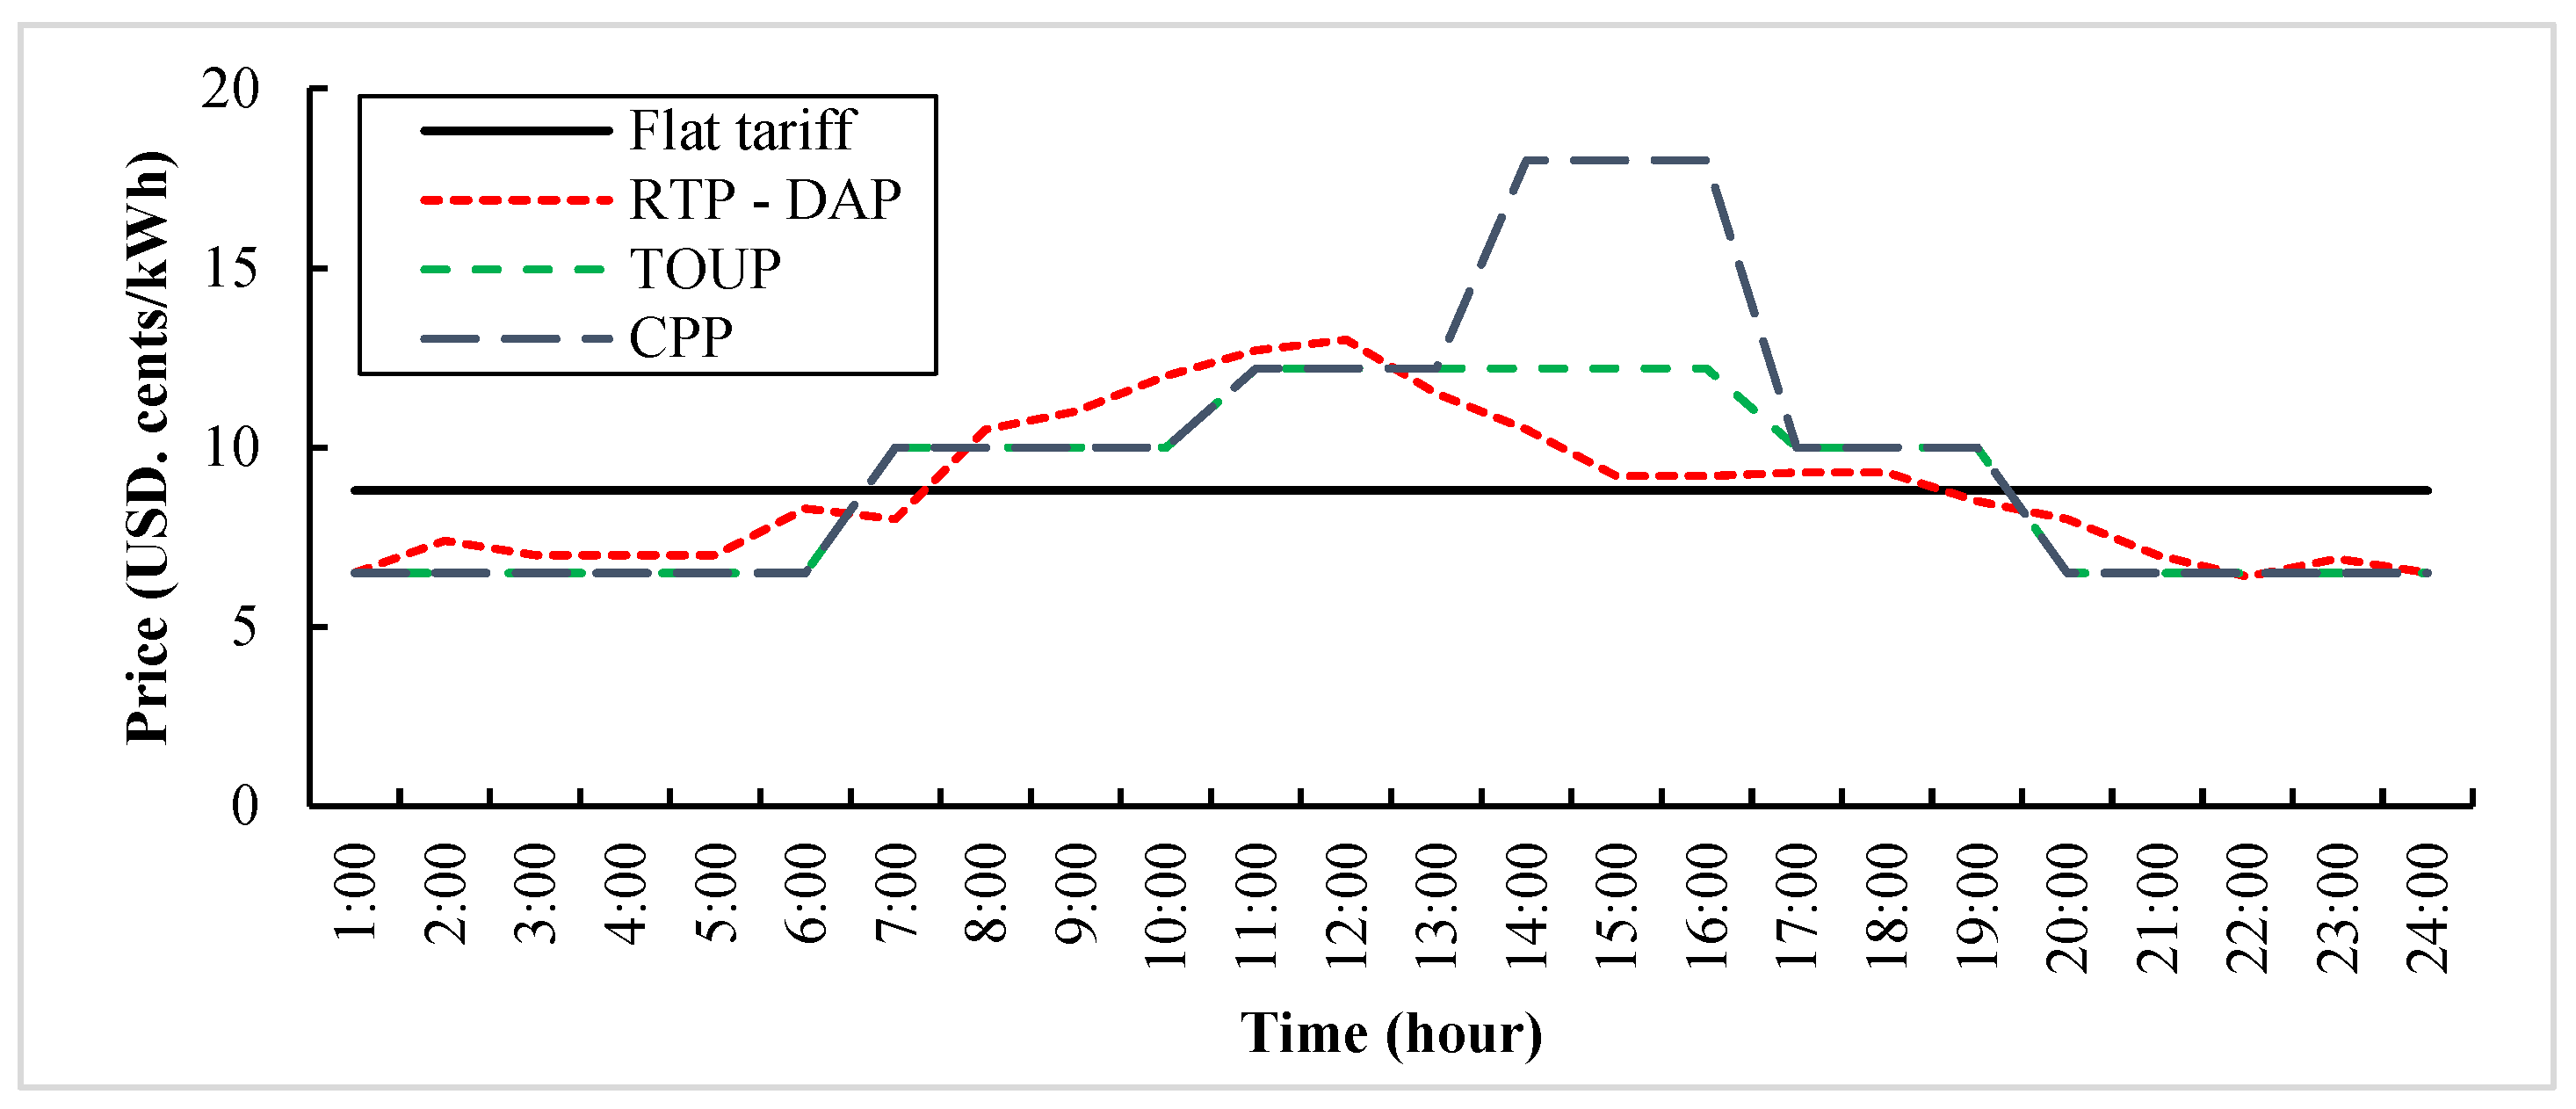
Figure 2 shows time-variable tariff schemes whose prices are tabulated in cents of a dollar per kWh. These tariffs consider Real-Time Pricing, RTP, which depend directly on the daily spot market [
5,
6]; Day Ahead Pricing, DAP, which depends on the day market before the bid [
7,
8]; the TOUP scheme that is used for this proposal, in which prices vary according to the hours of the day, but in levels and fixed periods [
9,
10]; and finally, tariffs with Critical Peak Pricing, CPP, which impose higher prices if the system is severely restricted [
11,
12]. All these tariffs are of a different option from the flat tariff where customers pay the same price for the energy they consume at any time and therefore do not receive economic incentives to modify their consumption profile.
2.1. Real-Time Pricing (RTP)
The RTP tariff structure is articulated on the real price of the wholesale market customers who are capable of monitoring and participating actively and, whether reducing or changing their prices, can make the most of low prices in the wholesaling market. This means that the RTP is usually scheduled based on prices which are updated hourly. That is, RTP divides prices into periods of 24 h, as shown in
Figure 2, where RTP is compared to other time-variable tariff schemes with a flat tariff. As for experiences of implementation, this system has become common in countries of the European Union, and Japan is following their example.
On the other hand, it is important to say that the RTP scheme is an ideal option since it effectively links retail tariffs with fluctuating wholesaling prices. However, the high cost of installation of a system to communicate tariffs in real-time to customers and their lack of knowledge are the main obstacles to implementing the RTP scheme, which makes it impossible in many areas [
5,
6].
2.2. Day-Ahead Pricing (DAP)
In this tariff structure, differently from RTP, where prices are updated hourly (see
Figure 2), with DAP, companies obtain market prices per hour for the 24 h of the next operating day, when the daily wholesaling market is resolved, and it is transmitted with no margin to the customers. Electricity customers react to this price signal, for example, changing their peak demand periods to the no peak periods. This helps to reduce the relationship between the maximum and the minimum peak of electricity demand, flattening the price curve. A clear example of the implementation of DAP occurs in Spain, where this scheme is used in one called Voluntary Price for the Small customer (PVPC, Precio Voluntario para el Pequeño Consumidor).
Finally, to implement the DAP scheme in customers, certain technical conditions must be fulfilled. Infrastructure such as bidirectional communication and smart meters is fundamental. In addition, it is advisable to install automated controllers to optimally manage the charge profile to follow the economic signal of DAP. Because of this, and similar to RTP, the high cost of installation of a system to communicate tariffs with next-day prices to customers and their lack of knowledge are the main obstacles for its implementation [
7,
8].
2.3. Time of Use Pricing (TOUP)
TOUP programs are a hybrid between a structure of flat tariff pricing and an RTP structure since prices vary through the day but at levels and fixed periods. TOUP tariffs are predetermined for a monthly or quarterly validity and are based on the general trends of daily and seasonal wholesale prices, and they do not directly reflect the quick changes in the wholesaling market. Most TOUP structures have two or three levels (off-peak price, mid-peak price, and peak price) where the relationship is approximately 2:1, 3:1, 4:1, and even 5:1 between the peak price and off-peak price. In
Figure 2, a TOUP structure of three levels is shown. Regarding the adoption of the TOUP scheme in countries and companies, it can be said that it is currently the most used within the category of time-variable pricing tariffs and the literature supports it. For example, experiences are reported in China, the United Kingdom, Malaysia, and the United States.
In addition, it can be said that to implement the TOUP scheme, not many technical and human requirements are needed, unlike RTP and DAP, since, in addition to the AMI infrastructure, educational or instructional instances are necessary from the companies to their customers, by way of reporting the news about this tariff scheme, such as the time bands and differences between them. Moreover, with an appropriate design, it can provide good prices to customers to the benefit of the operation of the electric system. Because of that, the TOUP scheme is the one selected to introduce the concept of the time-variable pricing tariff option for customers of CESPA [
9,
10].
2.4. Critical Peak Pricing (CPP)
The CPP scheme is a mechanism of dynamic pricing based on TOUP and RTP, since prices vary throughout the day but at more stable levels and intervals. Like TOUP, CPP has the same design of two or three levels. However, there is an additional “critical peak” price that exceeds the peak price during a determined number of times a year, which can even have a relation of 15:1 between the schedules critical peak and off-peak prices (see the example in
Figure 2).
As an additional difference from a TOUP scheme, energy prices in CCP are more dynamically fixed and can be decided with announcements 24 h earlier, usually in only a few cases in the year. In addition, the reasons to declare a critical price day can be based, for example, on weather conditions or a malfunction in the power plant that impedes satisfying all the demand [
11,
12].
2.5. Experiences of Countries in South America
At a regional level, most applications involve the TOUP scheme, which, depending on the country, are addressed to residential customers and at a higher charge of consumption. In
Table 2, two South American experiences of implementing the TOUP tariff in Brazil and Uruguay, together with their fundamental characteristics, are summarized.
3. Model of TOUP Structure for CESPA
Applying the TOUP methodology, the CESPA company will be able to consider different time bands with different prices for the energy, and with it, customers will tend to optimize their consumption to reduce their total costs. To that end, it is necessary to first learn some energy valuation principles of TOUP which were established in [
15] and then model the pricing structure for customers of CESPA:
The TOUP price must be under the objective of the DSM. It means that the energy price of TOUP can benefit any or all customers, sources of energy, and society but cannot harm any of them.
Principle of determination of the petition of time bands. It means that the partitions of time must correctly reflect the curve of demand of the system; in specific, the peak time has to start before and end after the presence of the maximum demand.
Avoid loss risk in the distributor company. This point encourages to protect the off-peak time of lowest economic cost for customers, so as not to create an imbalance in the benefits of TOUP between the customers and the company.
Determinant principle of the curve of the response of the customer. It means that the customer’s response has to be considered to improve the pricing signs in the TOUP tariffs.
Then, time bands and price levels, together with charges and tariff formulas of the TOUP scheme, must be collected and defined.
3.1. Time Bands and Price Levels
Not all customers have the same demand profile throughout the day, so it is imperative to have different time bands and price levels for each customer type. In CESPA, there are two groups of customers: residential and commercial. To define time bands and price levels for each group, an analysis of the electric demand of the system in a period of twelve months is carried out, which allows one to know the consumption profile of the customers in different months of the year.
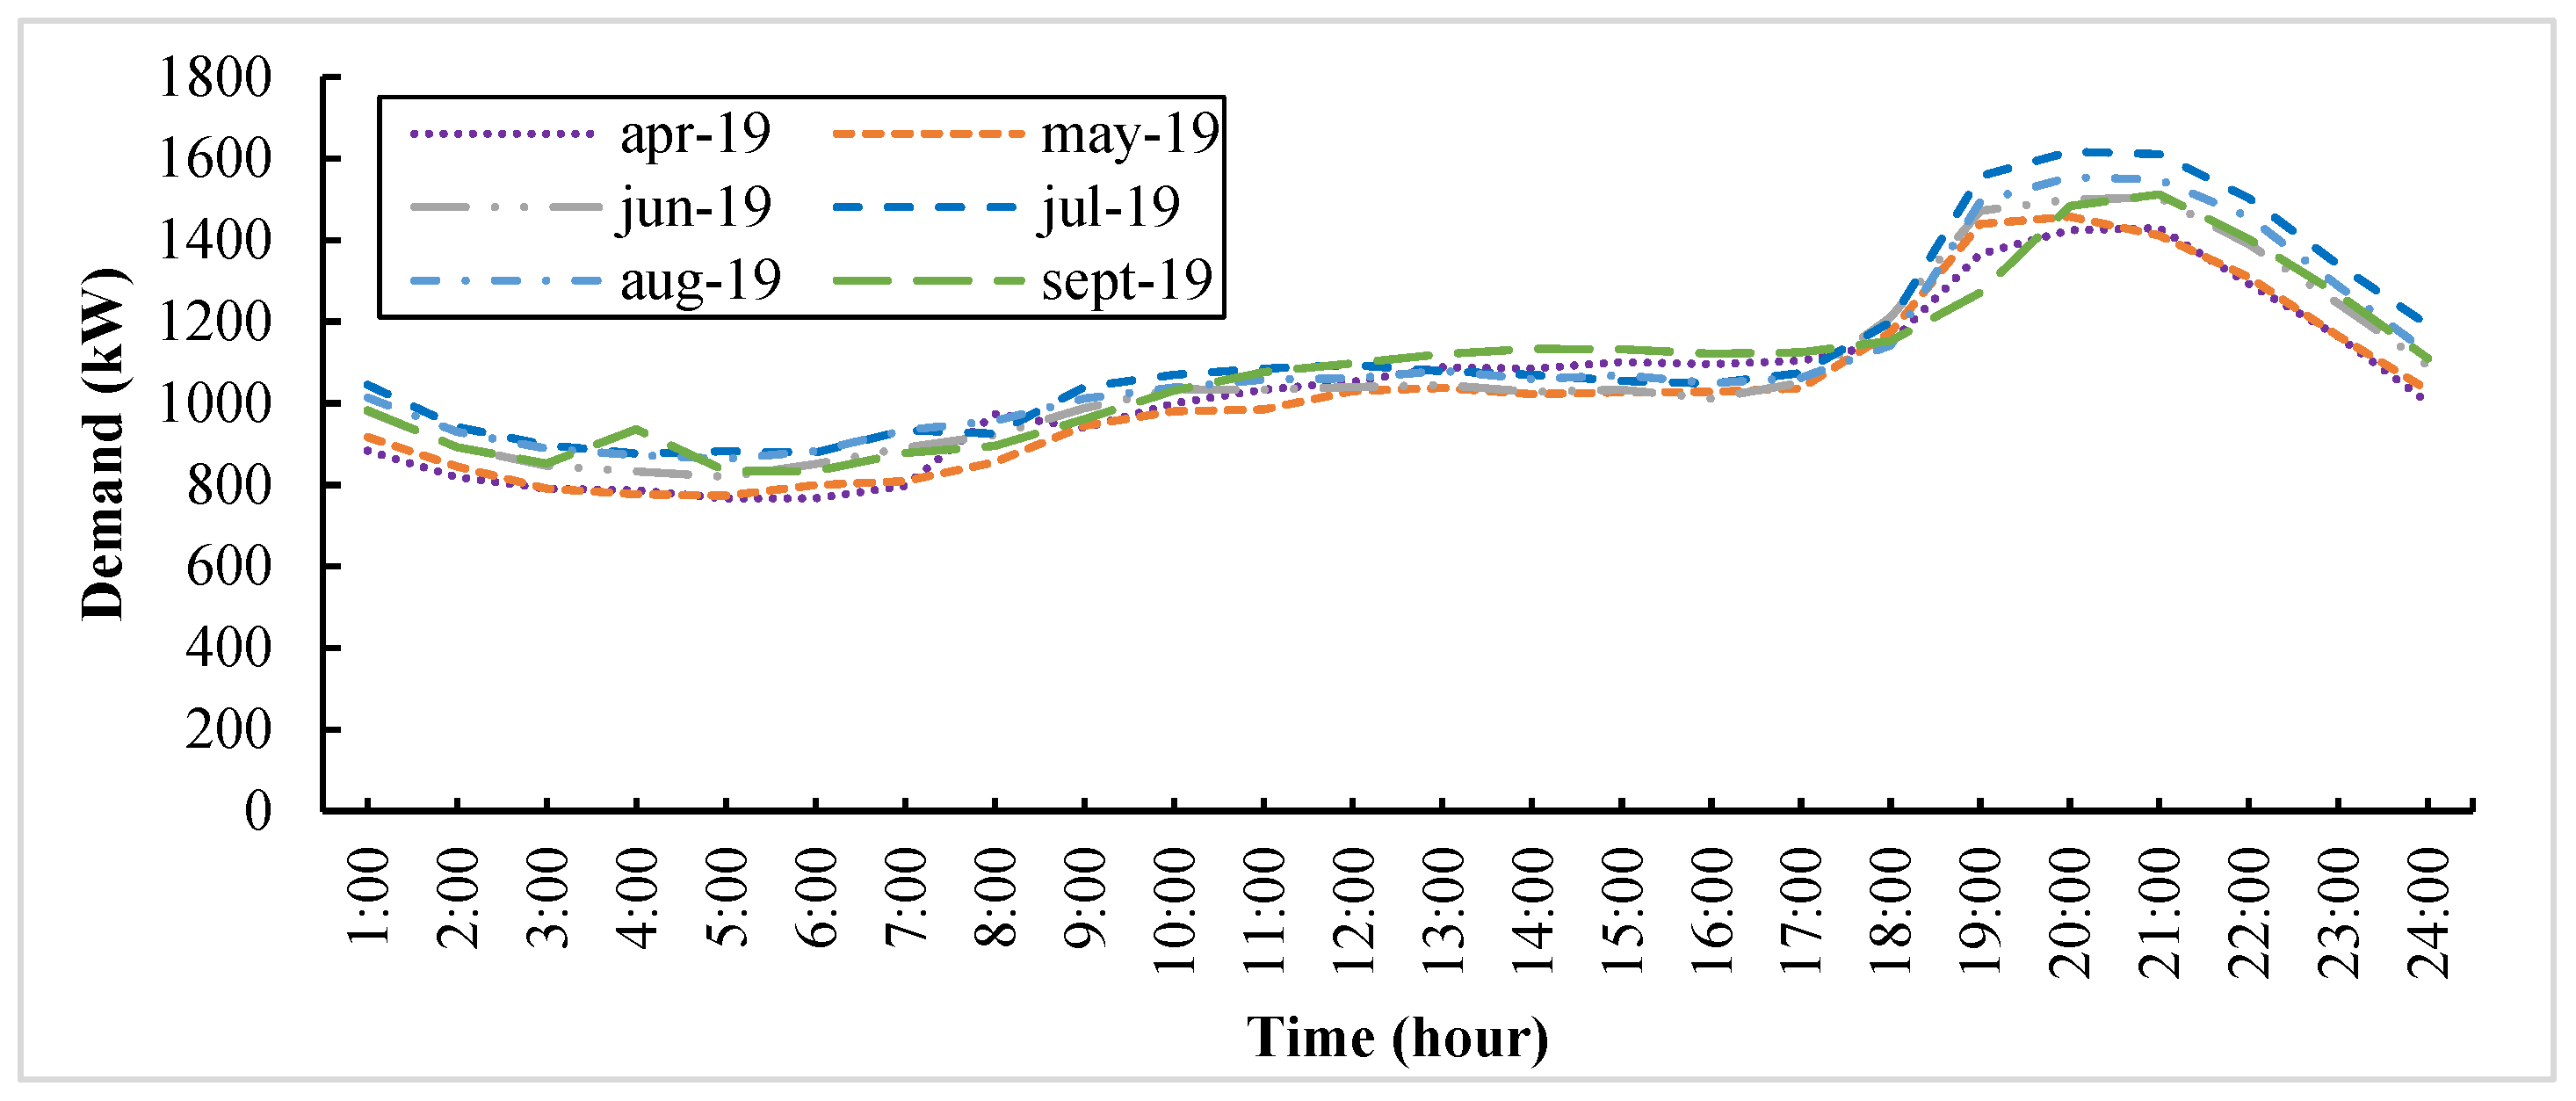
Figure 3 shows the average demand profile between months from April 2019 to September 2019, whereas
Figure 4 considers the months from October 2019 to March 2020. The months are divided into two groups to analyze the seasonal effect, delivering additional information for the study.
Figure 3 shows that the demand profile between the months from April 2019 to September 2019 is very similar in each of these months, and it is divided into three different levels of power: minimum, medium, and maximum demand. The minimum demand is present between 24:00 and 07:00 and has an approximate value of 800 kW. Regarding medium demand, it follows the minimum demand between 09:00 and 17:00 each month and reaches a value higher than 1000 kW. Then, it shows that the maximum demand starts approximately at 21:00, and in this case, the obtained value is 1600 kW at its highest point in July 2019.
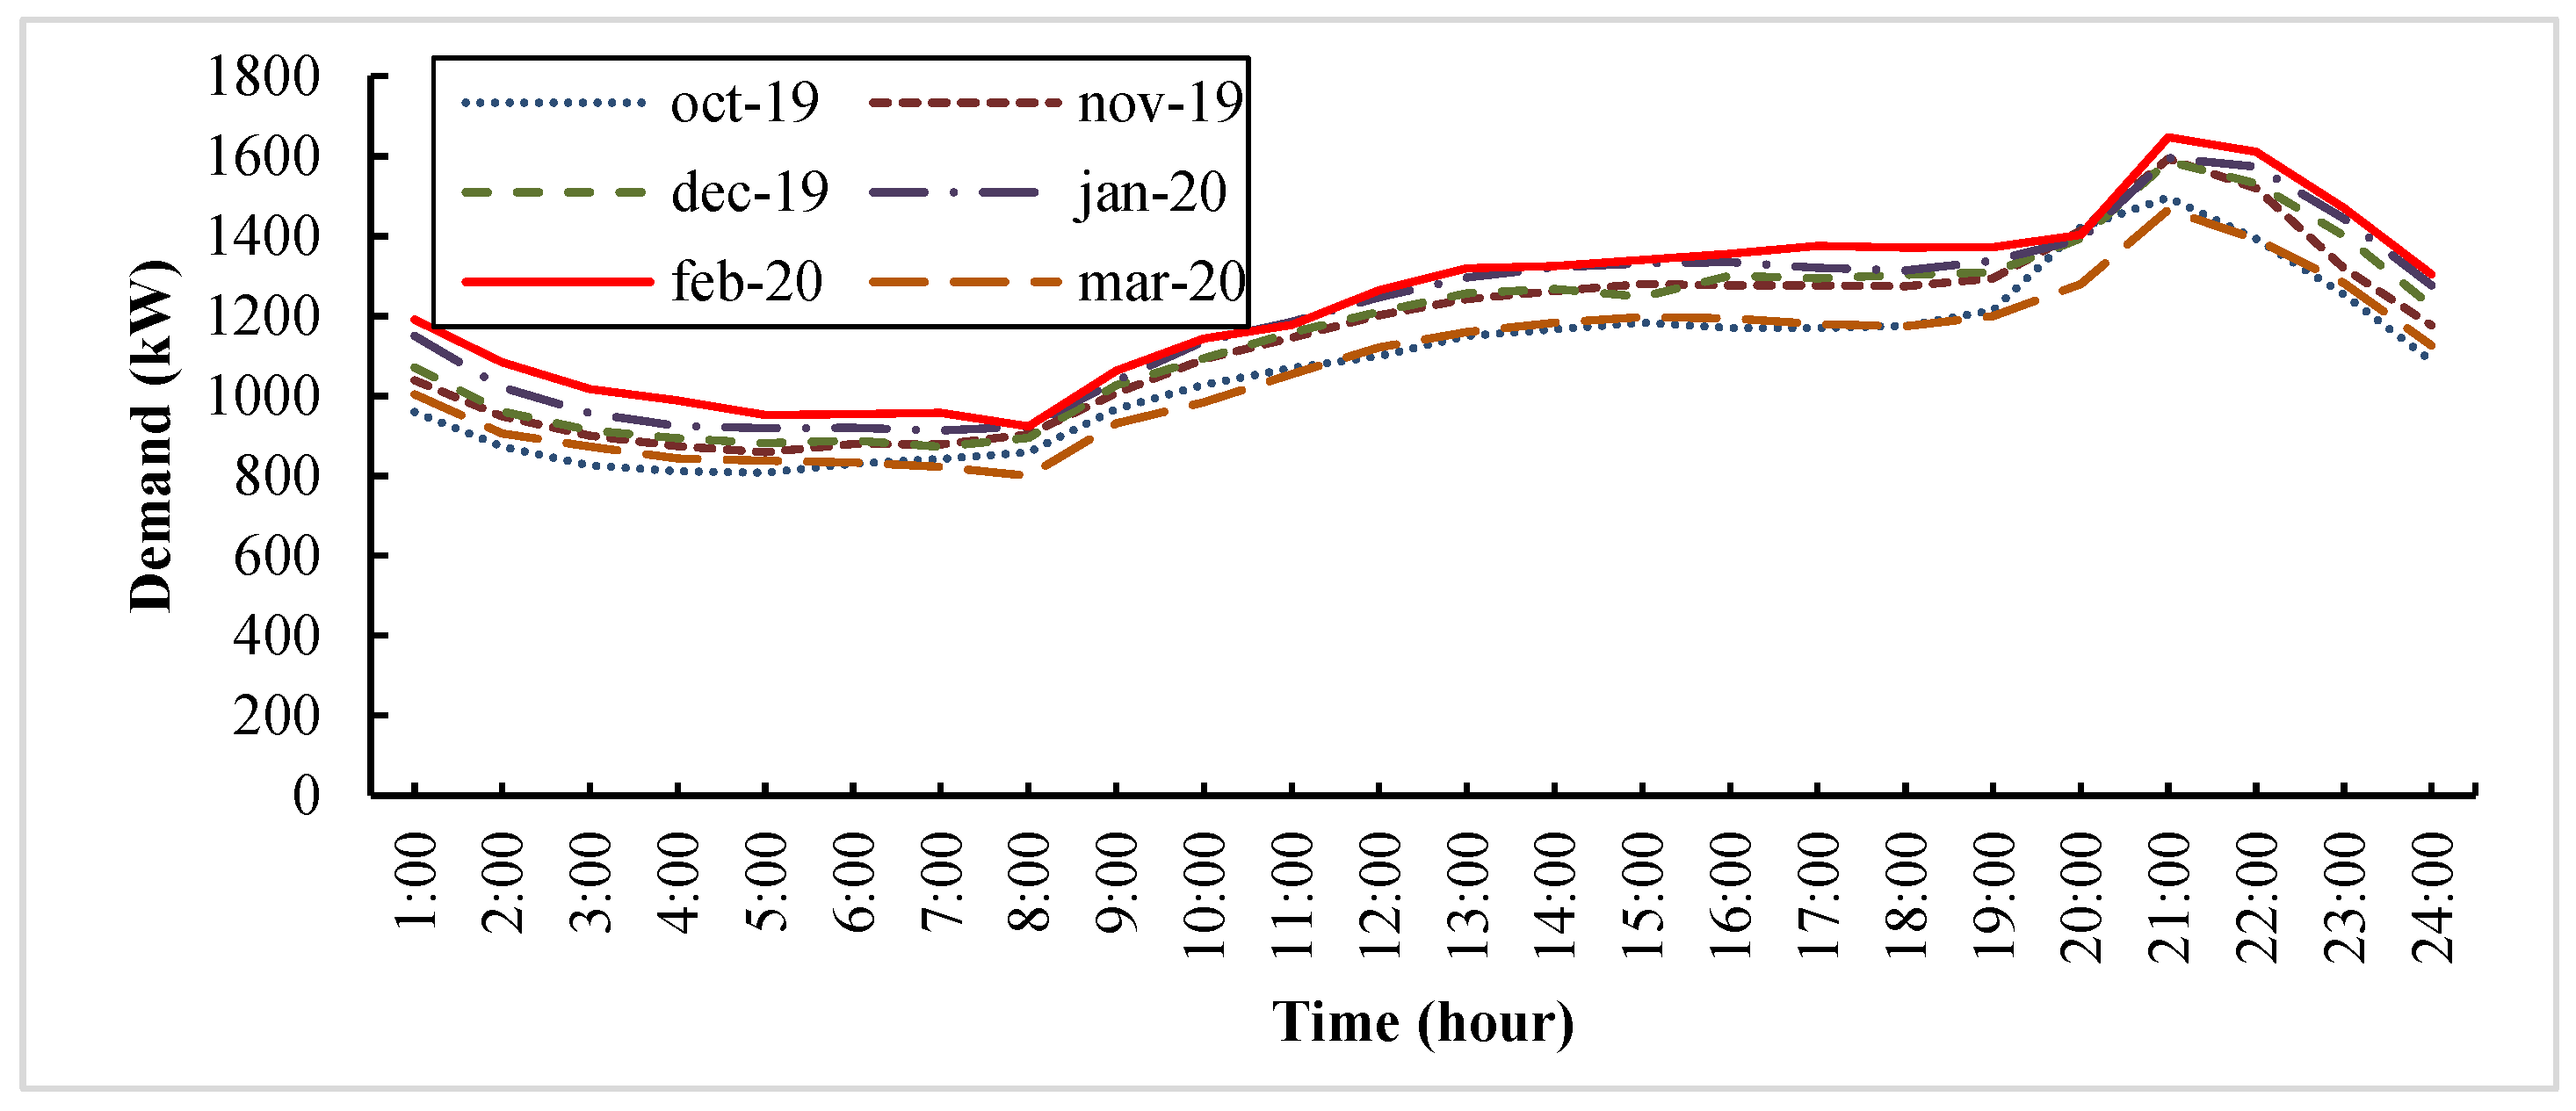
Similarly,
Figure 4 shows demand profiles for October 2019 to March 2020, and like the previous case, three zones are identified. In this case, medium demand reaches an approximate average value of 1300 kW (13:00 to 20:00), which can be attributed to the seasonal effect with months more associated with tourism activities in San Pedro de Atacama and to the use of acclimatization devices by the tourists who make the medium demand larger. Meanwhile, the maximum demand is 1600 kW, as in February 2020. It starts later (20:00 to 22:00), also due to the seasonal effect, where, in these months, days have more hours of natural light. Therefore, the medium and the maximum demand are reached at a later time. The differences between minimum and maximum values are less significant than those in months from April 2019 to September 2019.
It is important to highlight that the demand profiles that were previously shown are the same for each working day, weekend, and holiday.
Figure 3 and
Figure 4 represent the total demand of the electric system, this is the consumption of residential and commercial customers; therefore, it is not possible to discriminate demand separately. Based on the information on [
16], it is assumed that the maximum demand is caused mainly due to the activities of residential customers. From the work by He L. et al. [
17], it is assumed that the level of medium demand is caused by the activities of commercial customers with price profiles of hotels and hostels, shopping centers, restaurants, small stores, and office buildings.
Table 3 shows the time band and price level options for residential customers and
Table 4 for commercial customers.
In this proposal, each group of customers will have two options to choose from according to their need for electric energy. On the other hand, per each price level, there will be a charge for consumed energy, which will be multiplied times the consumption, in kWh, of each time band. In addition, these charges will reflect the values of energy and power that the CESPA company will generate from the generation technologies and the cost of transporting the energy through the distribution networks.
3.2. Tariff Formulas
Tariffs are set guaranteeing prices that benefit the customers, the general energy system, and CESPA company, both technically and economically.
Table 5 shows the formulas of the tariff options for unitary prices under energy in kWh for residential customers, and similarly,
Table 6 shows the same information for commercial customers.
For
Table 5 and
Table 6, peak hours (HP, Horario Punta), mid-peak hours (HMP, Horario Media Punta), and off-peak hours (HNP, Horario No Punta) are shown. The variable AGC corresponds to the Average Generation Cost (CPG, Costo Promedio de Generación), which represents the investment in the purchase of fuel and maintenance for generating a kWh of energy in the different generation technologies at CESPA. The thermal plant currently has a cost of 0.164 (USD/kWh), and the future photovoltaic solar plant has an AGC of 0.0684 (USD/kWh) [
18]. The APC component is the Average Production Cost, and it corresponds to the cost in the purchase of fuel, maintenance, and operating expenses (salary of professionals, technicians, and others) in the production of a kWh; it is applied to the off-peak time band of residential customers to prevent economic loss risk in the more extensive time band of the TOUP proposal. DLF is the Distribution Loss Factor (FPD, Factor de Pérdidas de Distribución), and it is obtained as the relation of the generated and sold energy, and it is not applied in the residential options to avoid overcharging. It is important to highlight that their variables described in Equations (1)–(4) will be calculated concerning the previous “i” month to the one to which the resulting tariffs will be applied.
As for PHF, it is the Peak Hour Factor (FHP, Factor de Horas Peak). It corresponds to a relation of approximately two to five times between the peak price and off-peak price in the residential TOUP options and of three to five times between the peak price and off-peak price in the commercial TOUP options. The component MPHF corresponds to the Mid-Peak Hours Factor (FHMP, Factor de Horas Medio Peak), and it is given by a relation of approximately 2:1 between the mid-peak price and the off-peak price in the case of commercial TOUP options. Finally, the component UF corresponds to the Utility Factor (FU, Factor de Utilidad), which represents the margin of turnover that the supplying company CESPA will obtain as a minimum due to the commercialization of electric energy, in this case, 6% according to the last legislative modification in Chile in the year 2019 [
19]. It should be noted that these factors are intended to distribute the benefits of TOUP options in a better way among all types of clients.
4. Results
This section shows the results of the application of the proposed methodology. Demand scenarios are studied considering that the photovoltaic plant of 2 MW is operating together with the current thermal plant, calculated using the Solar Explorer software [
20]. Energy prices include prices for different time bands of TOUP options for residential and commercial customers, considering the variation in the energetic matrix depending on the hour of the day. In addition, numbers are projected on the assumption that the TOUP tariff scheme replaces, in a mandatory form, the current tariffs per consumption section in all customers. Under these conditions, savings and profits caused by the TOUP scheme are quantified, for both customers (residential and commercial) and the electric company CESPA.
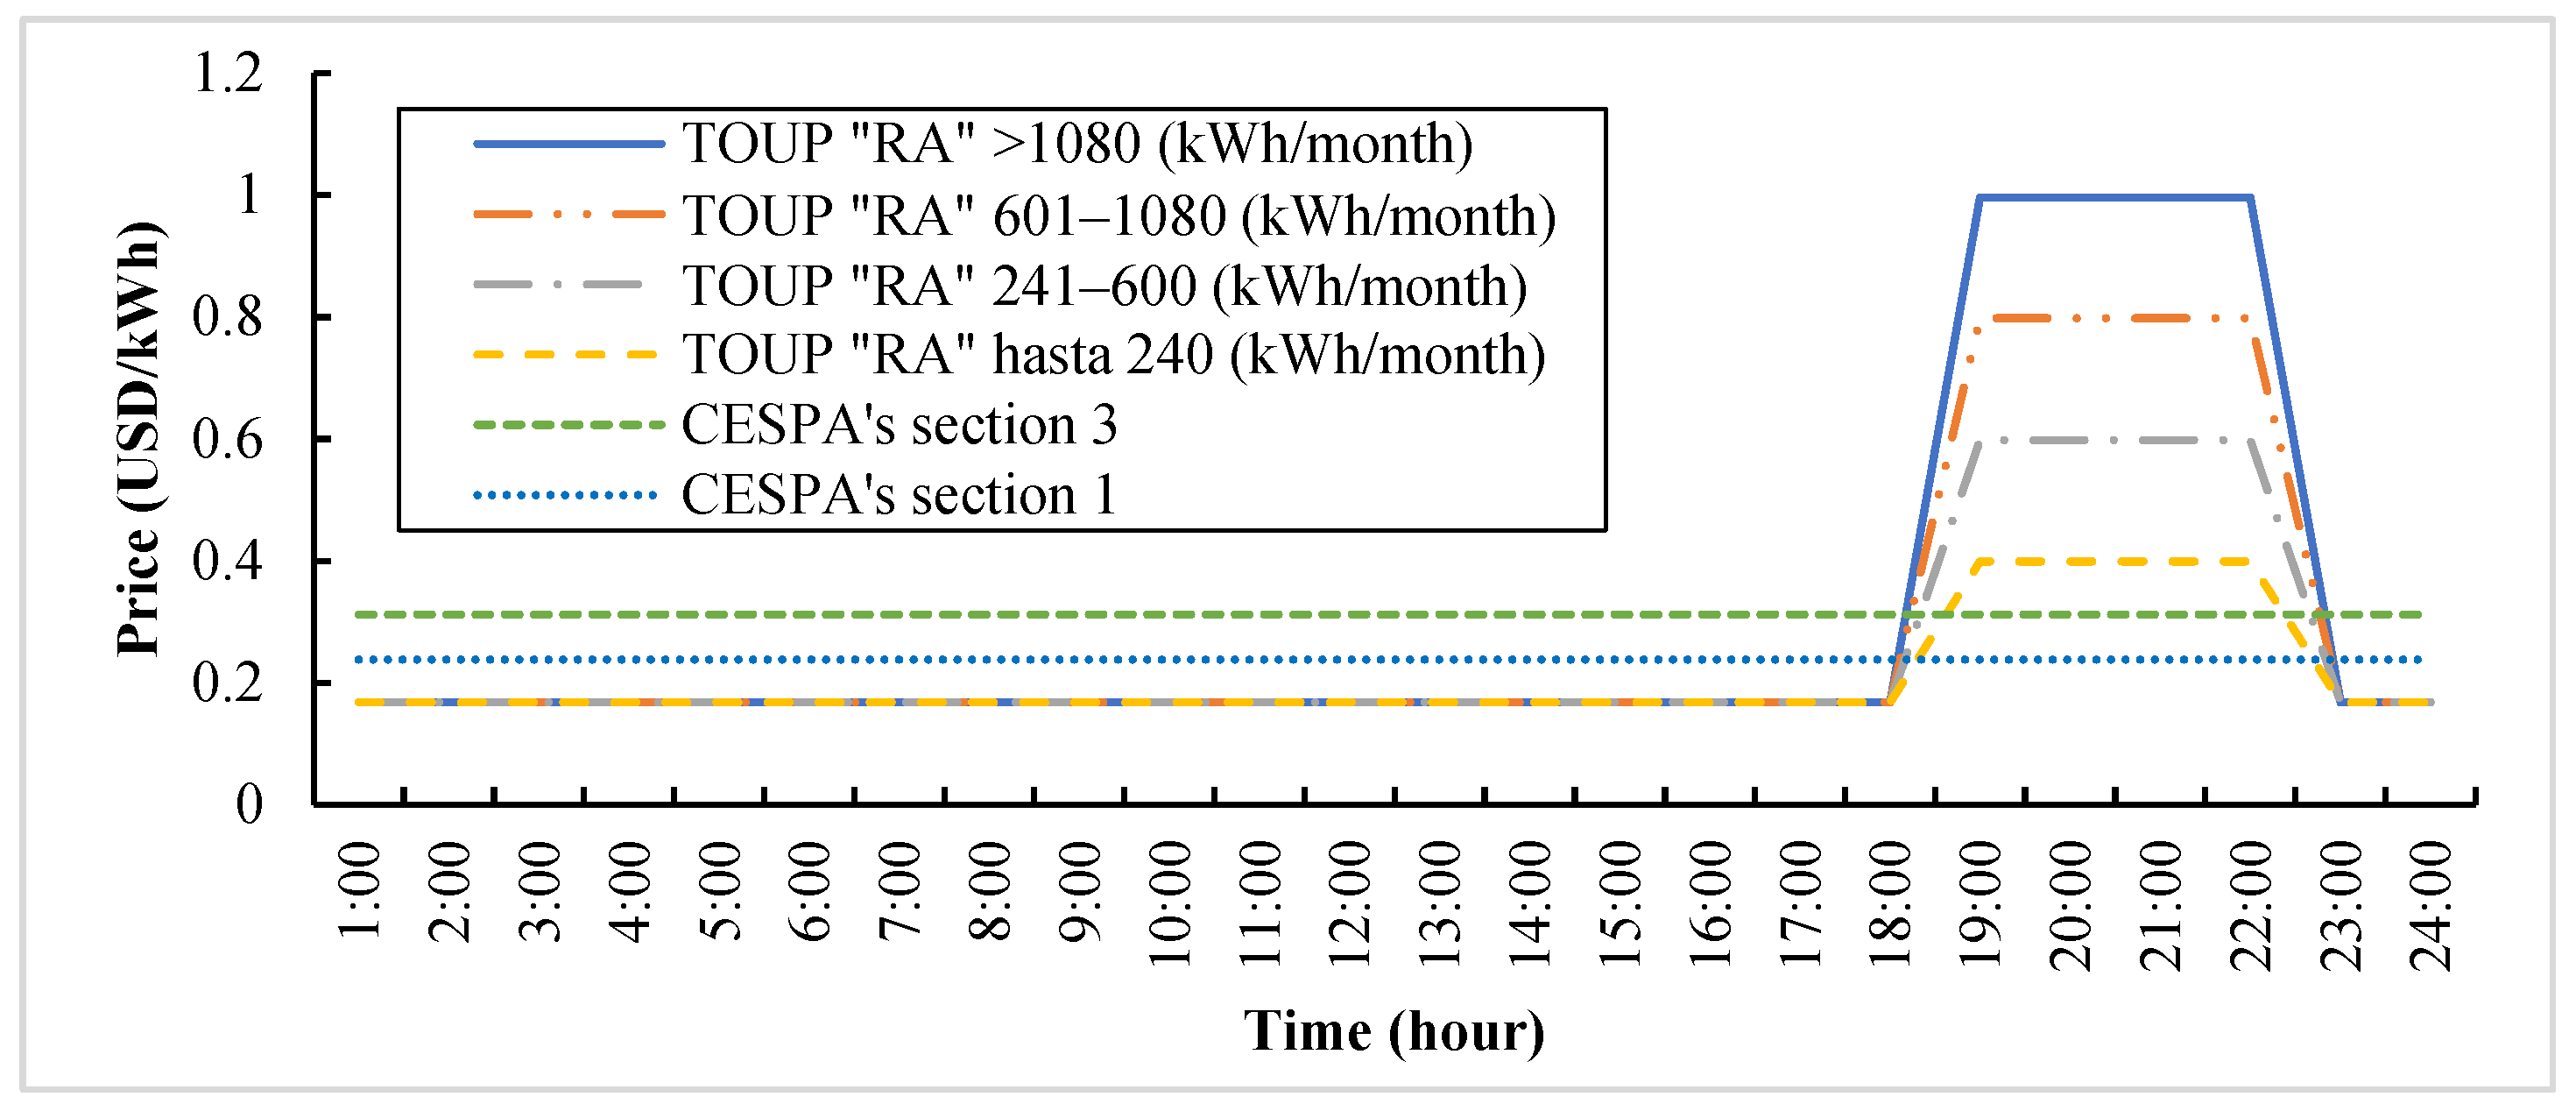
4.1. Energy Price with TOUP Options
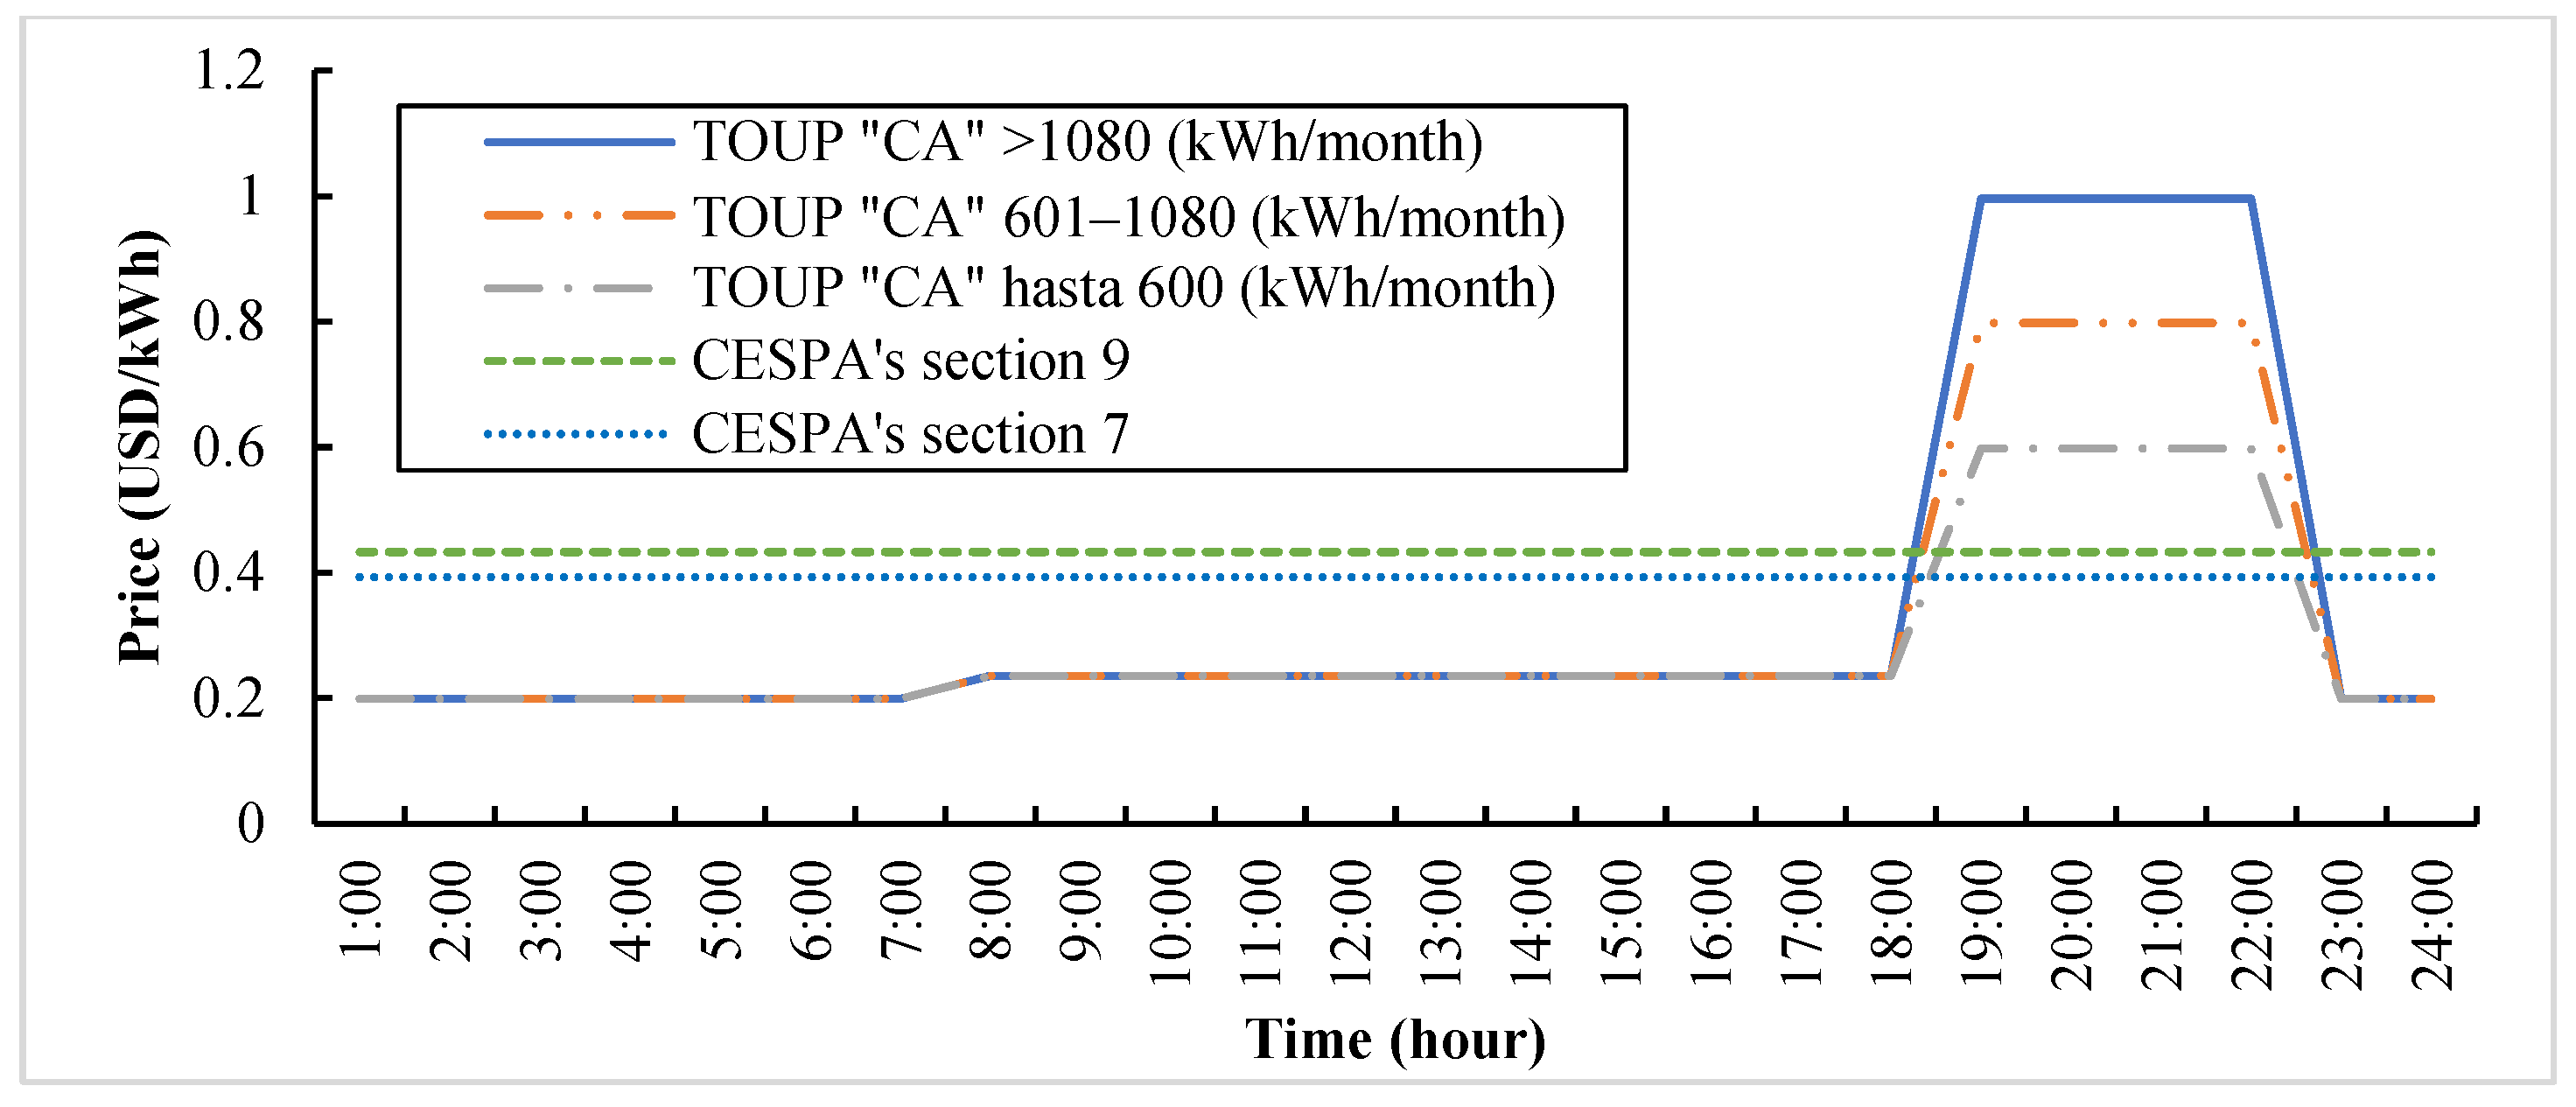
Figure 5 summarizes the variation in prices per time bands of the TOUP residential A option, following the trends of a month as of February 2020 as an example. The same is shown in
Figure 6 but for the TOUP commercial A option.
In both
Figure 5 and
Figure 6, there is a stepped relation between peak price and off-peak price delimited by the FHP of two to five times, which varies according to the monthly consumption volume in residential and commercial customers.
4.2. Variations for CESPA Customers with TOUP Options
In the savings projection for customers with TOUP options, two cases are supposed, the first one without a change in the consumption of customers and the second one with a change in the charge of consumption. In the latter case, there is a 12% change for the months from April to September due to having an additional peak hour, and there is a 7% change for the months from October to March due to having one less peak hour, assuming a higher effort by customers the first groups of months to have an effective DSM.
This is summarized in
Table 7 for residential customers and in
Table 8 for commercial customers, considering the trends of a month such as February 2020, where a variation (+) implies an increment and a variation (−) implies a reduction or saving in the electricity bills for customers.
In
Table 7 and
Table 8, the variation in the billing of residential and commercial customers with TOUP is exposed in the trends of a month such as February 2020. Columns in the context of “TOUP Bill with no change (USD)” scenario, the “TOUP Bill with change (USD)” scenario, and the percentage variations are included. For example, for a residential customer categorized in section 1 of the current CESPA tariff system, they would pay an amount of USD 28.37 with the TOUP rates, which is equivalent to a reduction of 0.5% in the actual bill; however, if the client changes 7% of his consumption in a month such as February, the client would pay an amount of USD 27.79 with the TOUP, and that would imply a savings of more than 2.5% of the actual bill.
Additionally, to benefit all customers, moving commercial customers of sections 1 and 2 (consumption ≤ 240 kWh/month) to residential options is recommended, which will firstly result as affected (see
Table 7 and
Table 8).
4.3. Variations for the Supplying Company CESPA with TOUP
On the other hand, the projection of profit supposes a 12%change in charge in the total consumption behavior of customers for the months from April to September and of 7% for the months from October to March as an effect of price signals. In addition, losses of I
2R could be reduced by approximately 1%. It is important to highlight that the variation projection for CESPA with TOUP is conditioned by two means: (
i) the future implementation of the PV plants and (
ii) the installation of smart meters at the company’s final customers. Thereon, and following the example of the same month of February 2020,
Table 9 shows the variation in incomes for CESPA, without moving commercial customers of low consumption to residential options, whereas
Table 10 shows the same, but with the moving of commercial customers of low consumption to residential options.
Additionally, the monthly average is shown, in an annual cycle of the variation projection at the income levels for the CESPA company, considering the trends of the 12 months from April 2019 to March 2020initially studied in the profiles of demand. This also considers the months where the company can propose a peak hour of higher cost, considering that for a month like February (or any other from October to March), in this proposal, the income level is lower concerning the months from April to September.
Another thing to note is that, currently, the high level of technical losses of about 30% is because the main source (generating plant) is located approximately 10 km from its main centers of consumption. In addition, the electrical lines that interconnect these loads are conductors that present a low section and, therefore, a high electrical resistance. It is important to point out that CESPA is a 20-year-old company, and its main supply lines have not changed despite the sustained growth in the number of clients in recent years. Additionally, there are non-technical losses attributable to billing problems and non-registration of some clients that are not accounted. All the above finally causes the CESPA system to present levels of losses that are out of the ordinary. The company is currently working to reduce both losses.
4.4. AMI Infrastructure Cost and Investment Recovery
Table 11 shows the estimated recovery cost and time of investment for the necessary AMI infrastructure to implement the TOUP options considering cases of commercial customers with or without a change of category. The prices of smart meters are obtained from estimates of one of the available suppliers in Chile [
21].
Table 11 shows that if commercial customers who are affected with an increment in their invoice due to the tariff change cannot move to the residential option, the investment recovery time will be 5 years; on the contrary, if these commercial customers move to the residential option, then the investment recovery time will be approximately 10 years. These profits only consider the reason of investment versus incomes, leaving the economic benefits aside, which are reported in the response time in case of failure, the online monitoring of electric variables, and network operation, among others.
5. Results Analysis
Based on the presented results, analyzing the savings variations for customers in trends of a month such as February 2020, being a favorable month for customers because of having one less peak hour of higher price, it is observed that all residential customers with or without a change in the charge would obtain a monthly reduction in their electricity bills, reaching up to 18.7% in the cases of the customers of section 5 (see
Table 7). Moreover, in commercial customers, depending on the consumption volume and particular demand profile, the majority can also access monthly reductions in the electricity bills, except customers of sections 1 and 2 (see
Table 8). It is recommended to move this group of customers to the residential options to benefit all users; this way, a commercial customer of section 2 would pay 19.1% less, instead of 12.9% more.
In addition, when analyzing the variation in the incomes for the supplying company CESPA, the same month, February 2020, was examined. Without moving commercial customers of low consumption to the residential options, the total invoicing would decrease by 17.2% due to the cheaper sales; at the same time, total production cost would decrease 25.3% as an effect of low costs in the photovoltaic generation, and the monetary valuation of loss would also decrease by 25.7%, which results in a projected a 3.7% increment in net income for this month. However, this result can improve if the monthly average is taken in an annual cycle, making the company obtain a favorable increment in their income level of 15.6% (see
Table 9). In case the company accepts to move commercial customers of low consumption to the residential options in trends of a month such as February 2020, incomes would reduce by 3.0%, but the monthly average in an annual cycle would maintain positive with an increment in the income levels of 7.7% (see
Table 10).
Also as part of the results, it can be said that the TOUP tariff scheme that has been proposed in this work would be easy to implement, due to the simplicity of its model, which would be advantageous for clients and companies. On the other hand, it would have the disadvantage that the price signal to customers would not be updated instantly as RTP or DAP, which could have the drawback that prices would not be updated in relation to the variation of the on CESPA costs, i.e., depending on the share of PV generation in capturing consumer consumption. In any case, with the TOUP approach, it would be a good measure to encourage DSM in the electricity market of a small company with flat prices that are not very favorable to customers.
It is important to highlight that, once the tariff scheme presented in this work has been implemented, in order to improve the price signal of TOUP, it is proposed, as future work, to use price optimization models and, eventually, a system of surveys to clients, as indicated in [
22].
6. Conclusions
The TOUP methodology to implement new tariff options for residential and commercial customers of the company CESPA has been proposed; together with the installation of a PV plant, it would benefit both the clients and the company.
This method seeks to promote energy consumption when the photovoltaic generation is sufficient through the price signal of the TOUP proposed in this work, thereby reducing the costs of the CESPA company and attenuating its carbon footprint by promoting the use of renewable energies.
The initial results present a reduction in the total amount that 80% of connected customers have to pay, and 100% of them if they are allowed to change their category. As for the electric company CESPA, in both cases, an increment in its incomes is obtained, the higher increase being in the case of not changing customer categories.
When applying DSM, customers obtain maximum monthly savings of 18.7% for residential customers and 19.1% for commercial ones. As for the company CESPA, an increment in its income of approximately 7.7% is obtained. In addition, CESPA would be able to recover its investment within a maximum period of 122 months (10.17 years.)
An appropriate DSM allows for moving between 7% and 12% of the maximum demand to other time bands, lowering the curve of total demand and optimizing the use of electric energy and the available infrastructure in the electric system.
As future projects, the electric company CESPA is evaluating the experimental implementation in an important sector of the network to validate the theoretical results obtained in this study.
Likewise, with the experimental implementation of this work, it is intended to improve the results that are obtained, with the introduction of new approaches to TOUP rates, for example, adapting the price signal with optimization models and adding a demand component within the structure of charges to customers.
The projections of this work will allow the CESPA company to lead the first application in Chile with option-type tariffs of time-variable pricing, in this case, with TOUP. Moreover, this type of price ratewill be a reference in the Chilean electricity market and will surely promote the shift towards the adoption of smart meters.


 ,
, 


