1. Introduction
Manufacturing facilities consume about 35% of domestic energy in the United States per year [
1]. Many researchers have indicated that implementing an effective energy management system (EnMS) is one of the most important approaches to improve energy efficiency and reduce energy consumption and energy cost [
2,
3,
4]. Multiple studies had demonstrated that an effective energy management system helps achieve substantial energy savings, up to 40% for some industries and facilities [
5,
6]. However, the implementation rate of energy management systems has been low (3% to 40%) for many countries (e.g., Sweden, Denmark, and Turkey), even for industries with high energy intensity (e.g., foundries, food, and iron and steel) [
7,
8,
9]. In the US, less than 4% of facilities taking part in the Manufacturing Energy Consumption Survey (MECS) indicated that they are implementing ISO 50001 (although over 75% of respondents to the survey did not know what ISO 50001 is, so that number may be underestimated). Additionally, only 16% have an employee who is responsible for energy management, and over 25% do not even know if their company has an energy goal (about 23% responded that they did have an energy goal) [
10].
The reasons for the low implementation rate of energy management systems had been investigated by multiple researchers. For example, Sa et al. identified the complexity of the manufacturing processes and operations and access to capital resources as two main barriers for implementing an effective energy management system by studying 15 manufacturing companies of various sizes located in Sweden [
11]. Lawrence et al. identified “high complexity of production processes” as the main knowledge-related barrier and “slim organization” as the main organizational barrier by studying the pulp and paper industry in Sweden [
12]. Multiple studies also investigated the barriers for some components of EnMS, for example, investment for energy efficiency technologies and implementation of energy-efficiency projects [
13,
14]. However, only one article was found about the barriers and challenges of implementing ISO 50001-based energy management systems. In this study, the top five barriers were identified as “lack of disaggregated and transparent energy consumption data”, “lack of in-house expertise”, “energy management not integrated/rewarded within company culture”, “lack of on-going top management support” and “challenges conducting measurement and verification” by studying 23 cases [
15]. As indicated by Wu et al., the research in identifying barriers and challenges for implementing ISO 50001-based energy management systems is still in “its nascent stages” [
16]. To contribute to this understudied area, this paper discusses the implementation and outcomes of the first Better Plants 50001 Ready Virtual In-plant Training. The Better Plants program, a voluntary partnership initiative for industrial companies and organizations, was started in 2011 [
17]. By 2021, more than 250 leading manufacturers and public water and wastewater treatment utilities, with more than 3000 facilities, partnered with Better Plants to receive technical assistance and improve energy efficiency, sustainability, and competitiveness [
18]. In-plant trainings are one of the technical assistance programs offered by Better Plants, which had to be adapted to a virtual format due to the COVID-19 pandemic [
19]. A series of poll questions was included in the 50001 Ready Virtual In-plant training to prompt discussion and provide more insight in identifying where Better Plants partners were encountering barriers and challenges.
As discussed above, the implementation of energy management systems for manufacturing companies has been low for many countries and even for some energy-intensive sectors. However, very few studies have been conducted regarding the barriers and challenges that companies face while implementing ISO 50001-based energy management systems. To improve the implementation of energy management systems, this study conducted an online survey of 40 polling questions during the 50001 Ready Virtual In-Plant Training to identify the barriers and challenges of implementing ISO 50001-based energy management systems. This paper provides (1) an overview of 50001 Ready and the 50001 Ready Navigator tool and details on the 50001 Ready VINPLT and its outcomes, (2) important observations about the status of the training participating companies’ EnMSs, and (3) major barriers and challenges for implementing EnMSs that were identified from the online survey study.
2. Overview of 50001 Ready and 50001 Ready Navigator
ISO 50001 EnMS—the Requirements with Guidance for Use Standard provides a practical framework for organizations to build an effective energy management system [
20]. ISO 50001 was first published in 2011 and uses the Plan–Do–Check–Act continuous improvement model. Although many facilities in the US have implemented the ISO 50001 Energy Management standard, the process and cost of certification had been reported as the major barriers for wider adoption [
16].
To address these barriers and provide national recognitions without complicated and costly third-party audits, the US DOE launched 50001 Ready in 2017. 50001 Ready is a self-paced, no-cost program to facilitate organizations to implement ISO 50001-based EnMS and build a culture of energy improvement [
21]. It uses the 50001 Ready Navigator, an online tool developed by DOE, to provide a streamlined and step-by-step approach and useful tools and templates to help facilities and organizations implement an ISO 50001-based EnMS [
22]. The 50001 Ready Navigator guides users through 25 tasks, as shown in
Table 1, to help create the EnMS. Upon self-attested completion of the 25 tasks and demonstrated energy performance improvement, DOE recognizes the facilities as “50001 Ready”.
3. The 50001 Ready VINPLT and Its Outcomes
To help partners overcome one of the major barriers of implementing energy management systems—the lack of in-house technical expertise [
23]—Better Plants created In-Plant Trainings (INPLTs) to train partners on how to identify energy conservation opportunities, quantify savings from those opportunities, and implement projects to realize the energy and cost savings. More information about INPLTs can be found elsewhere [
24]. Currently, the COVID-19 pandemic prevents Better Plants from delivering INPLTs in the traditional in-person fashion. To continue the INPLTs during the pandemic, Better Plants piloted Virtual In-Plant Trainings (VINPLTs) on wastewater treatment and ammonia industrial refrigeration systems from 27 October to 19 November 2020 [
19]. The VINPLT pilot was well received, and participants requested more trainings on various topics.
The Better Plants program delivered a VINPLT on the 50001 Ready program from 9 February to 30 March 2021. The 50001 Ready VINPLT was open and free to all Better Plants partners and consisted of eight 2.5 h online training sessions (2 h of lecture and 0.5 h of questions and answers) delivered on Tuesdays. More details about the agenda for the 50001 Ready VINPLT can be accessed elsewhere [
25]. Participants who were interested in implementing an ISO 50001-based EnMS and making their facilities 50001 Ready after the VINPLT were invited to join the US DOE 50001 Ready Implementation Cohort starting in May 2021 [
26]. The cohort lasted 6 to 12 months and continues to provide one-on-one coaching and tailored technical assistance as these companies complete the 25 tasks in the 50001 Ready Navigator to become 50001 Ready.
The goal of the 50001 Ready VINPLT was to train participants on the fundamentals of ISO 50001 Standard and the 25 tasks of 50001 Ready Navigator. Furthermore, 40 live polling questions were conducted during the training to help identify the challenges and barriers facing the participating companies, and the responses were used to inform the DOE of the ever-evolving needs and challenges when establishing energy management systems. This is critical for the 50001 Ready program to continue to have meaningful impact on establishing energy management systems [
16].
The training was conducted using the Zoom video platform. Case studies and real-life plant data were used to enhance the learning experience, and Zoom live polls were launched to engage the participants and collect feedback during training sessions. Kahoot! quizzes were used at the end of each training session to emphasize key points and enhance participants’ understanding of the content.
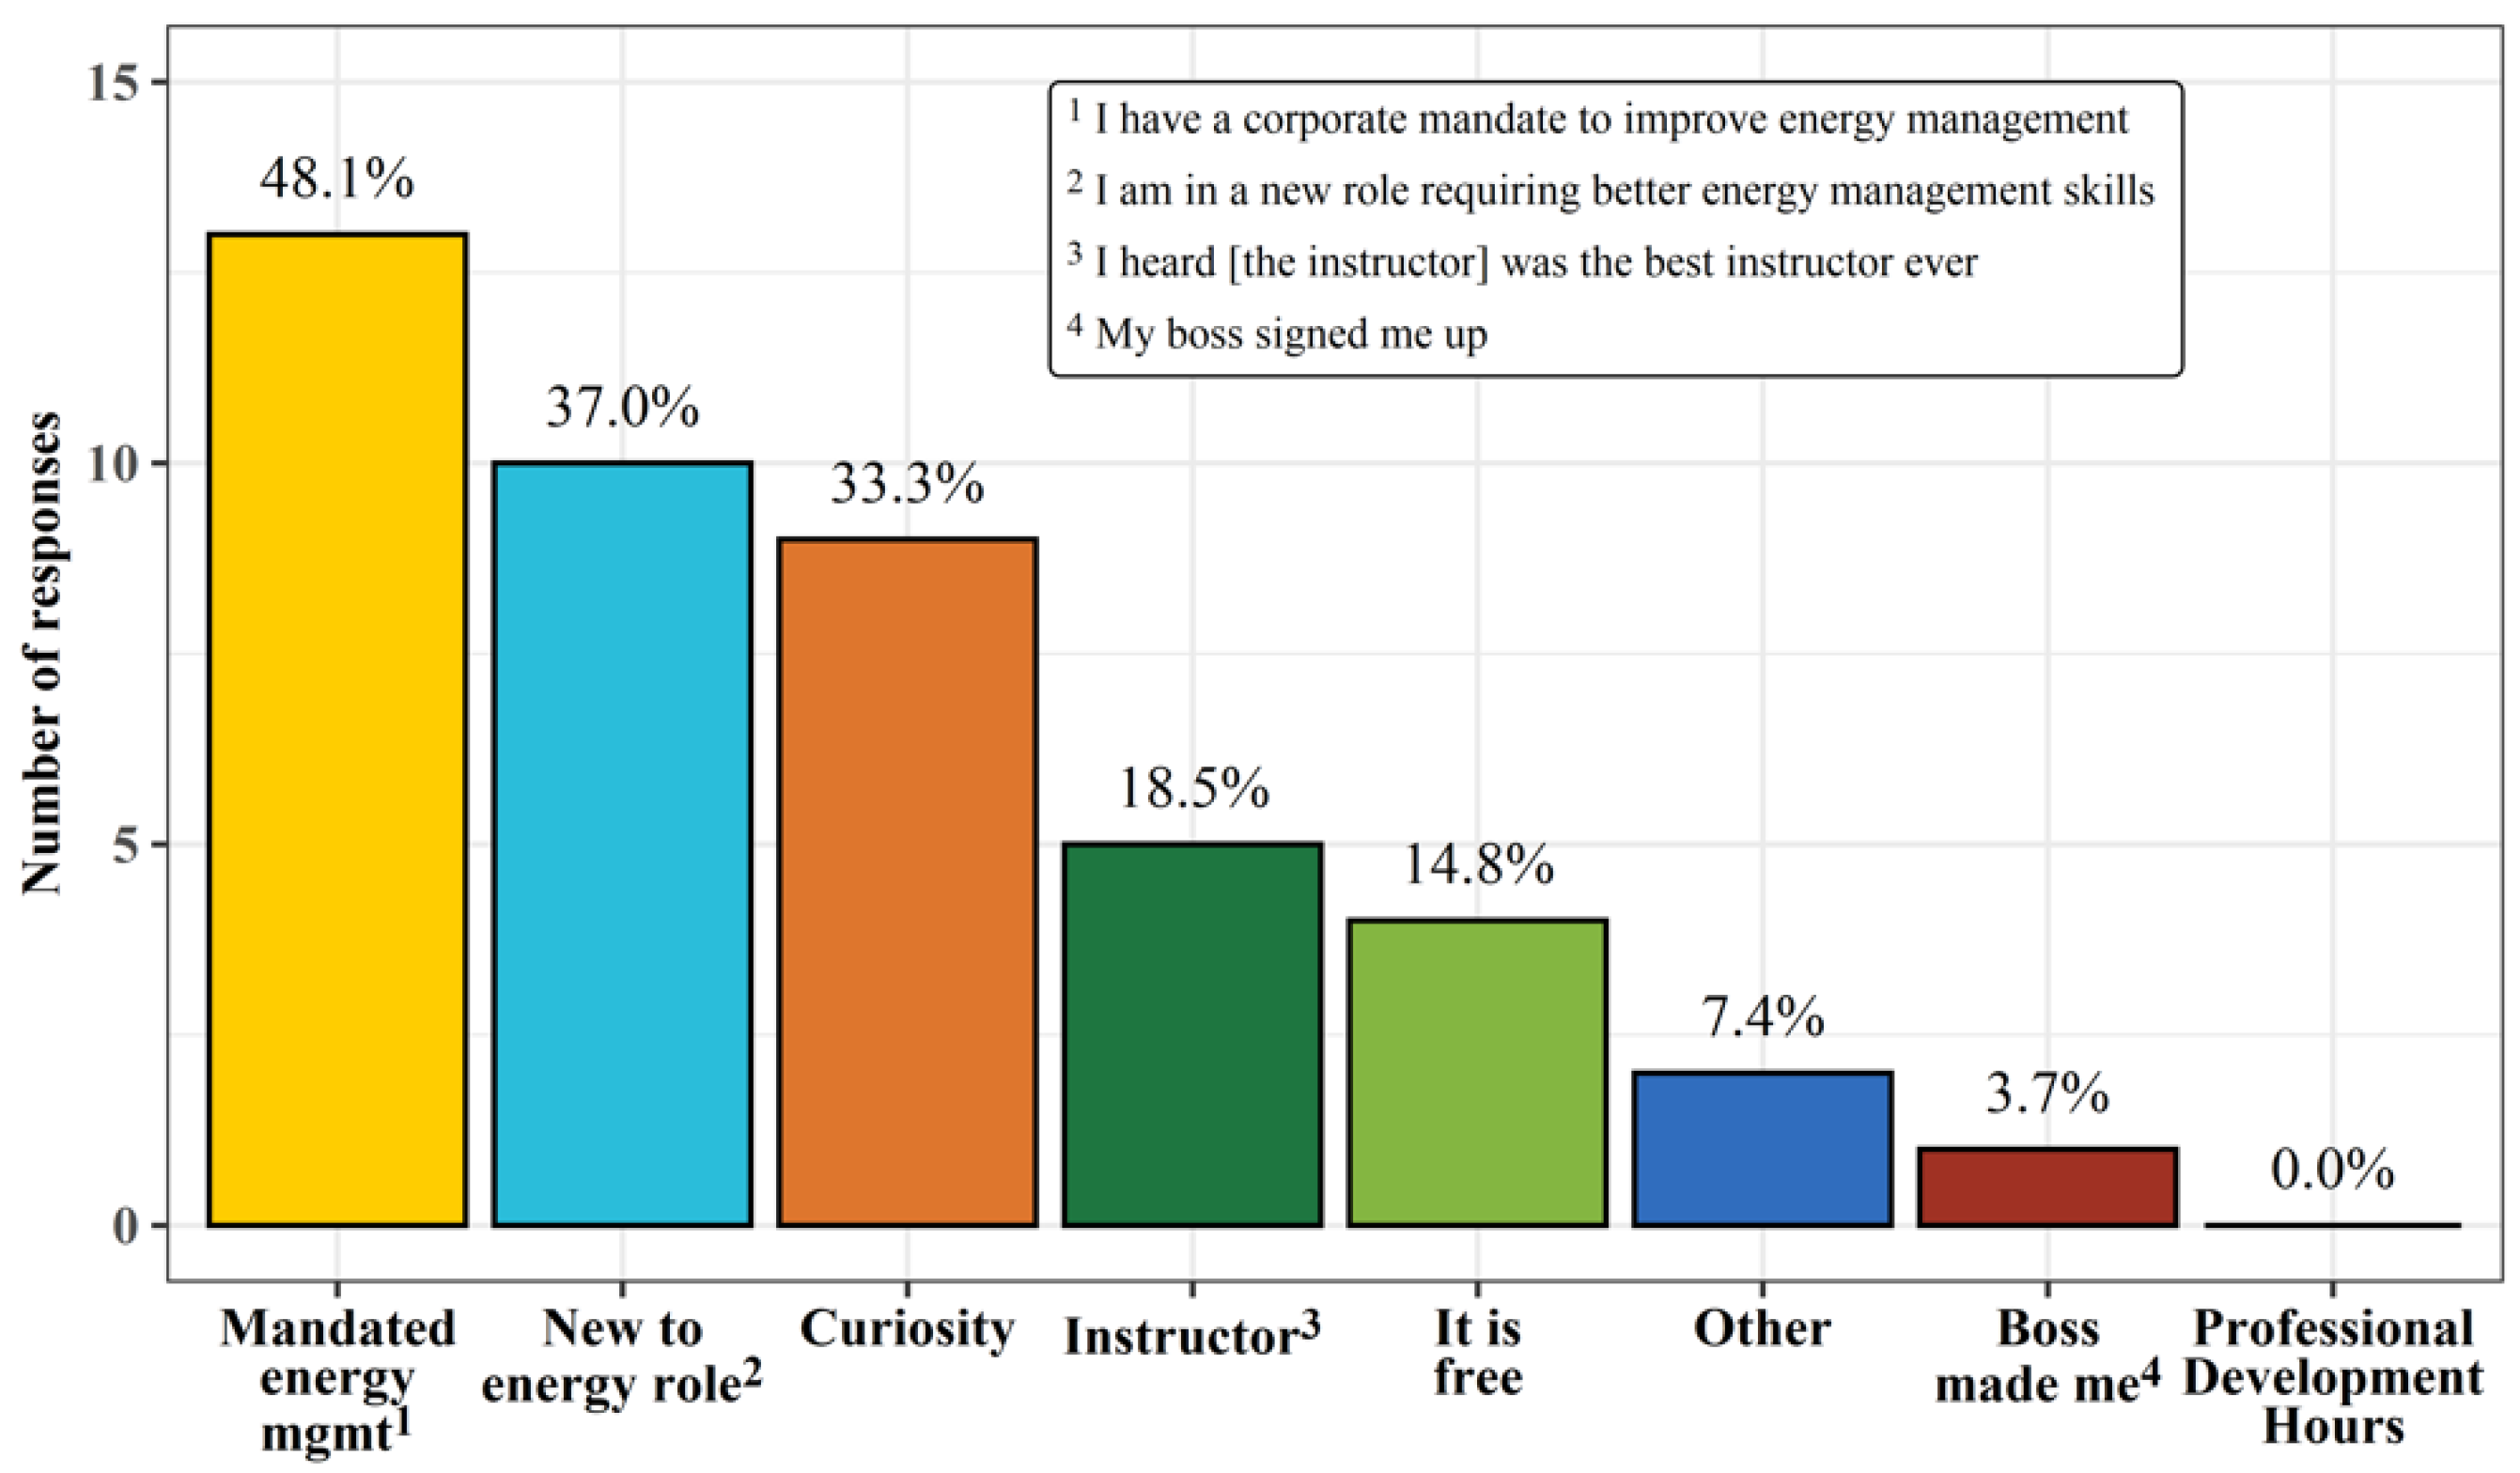
A total of 54 participants from 28 companies and organizations attended the training with participants attending an average of five out of eight sessions. The survey data showed that the top three reasons for attending this VINPLT were being responsible for improving energy management, being new to the role of energy management, and curiosity (
Figure 1).
To maximize the benefits of these virtual training sessions, homework assignments were given to the participants at the end of each session and were due by the following Monday. These homework assignments were designed for participants to review covered content, prepare them for the next session, and starting their work on the 25 tasks of the 50001 Ready Navigator. Survey data showed that 61.1% of the participants spent 0–2 h on the homework each week and 16.7% spent 2 h or more.
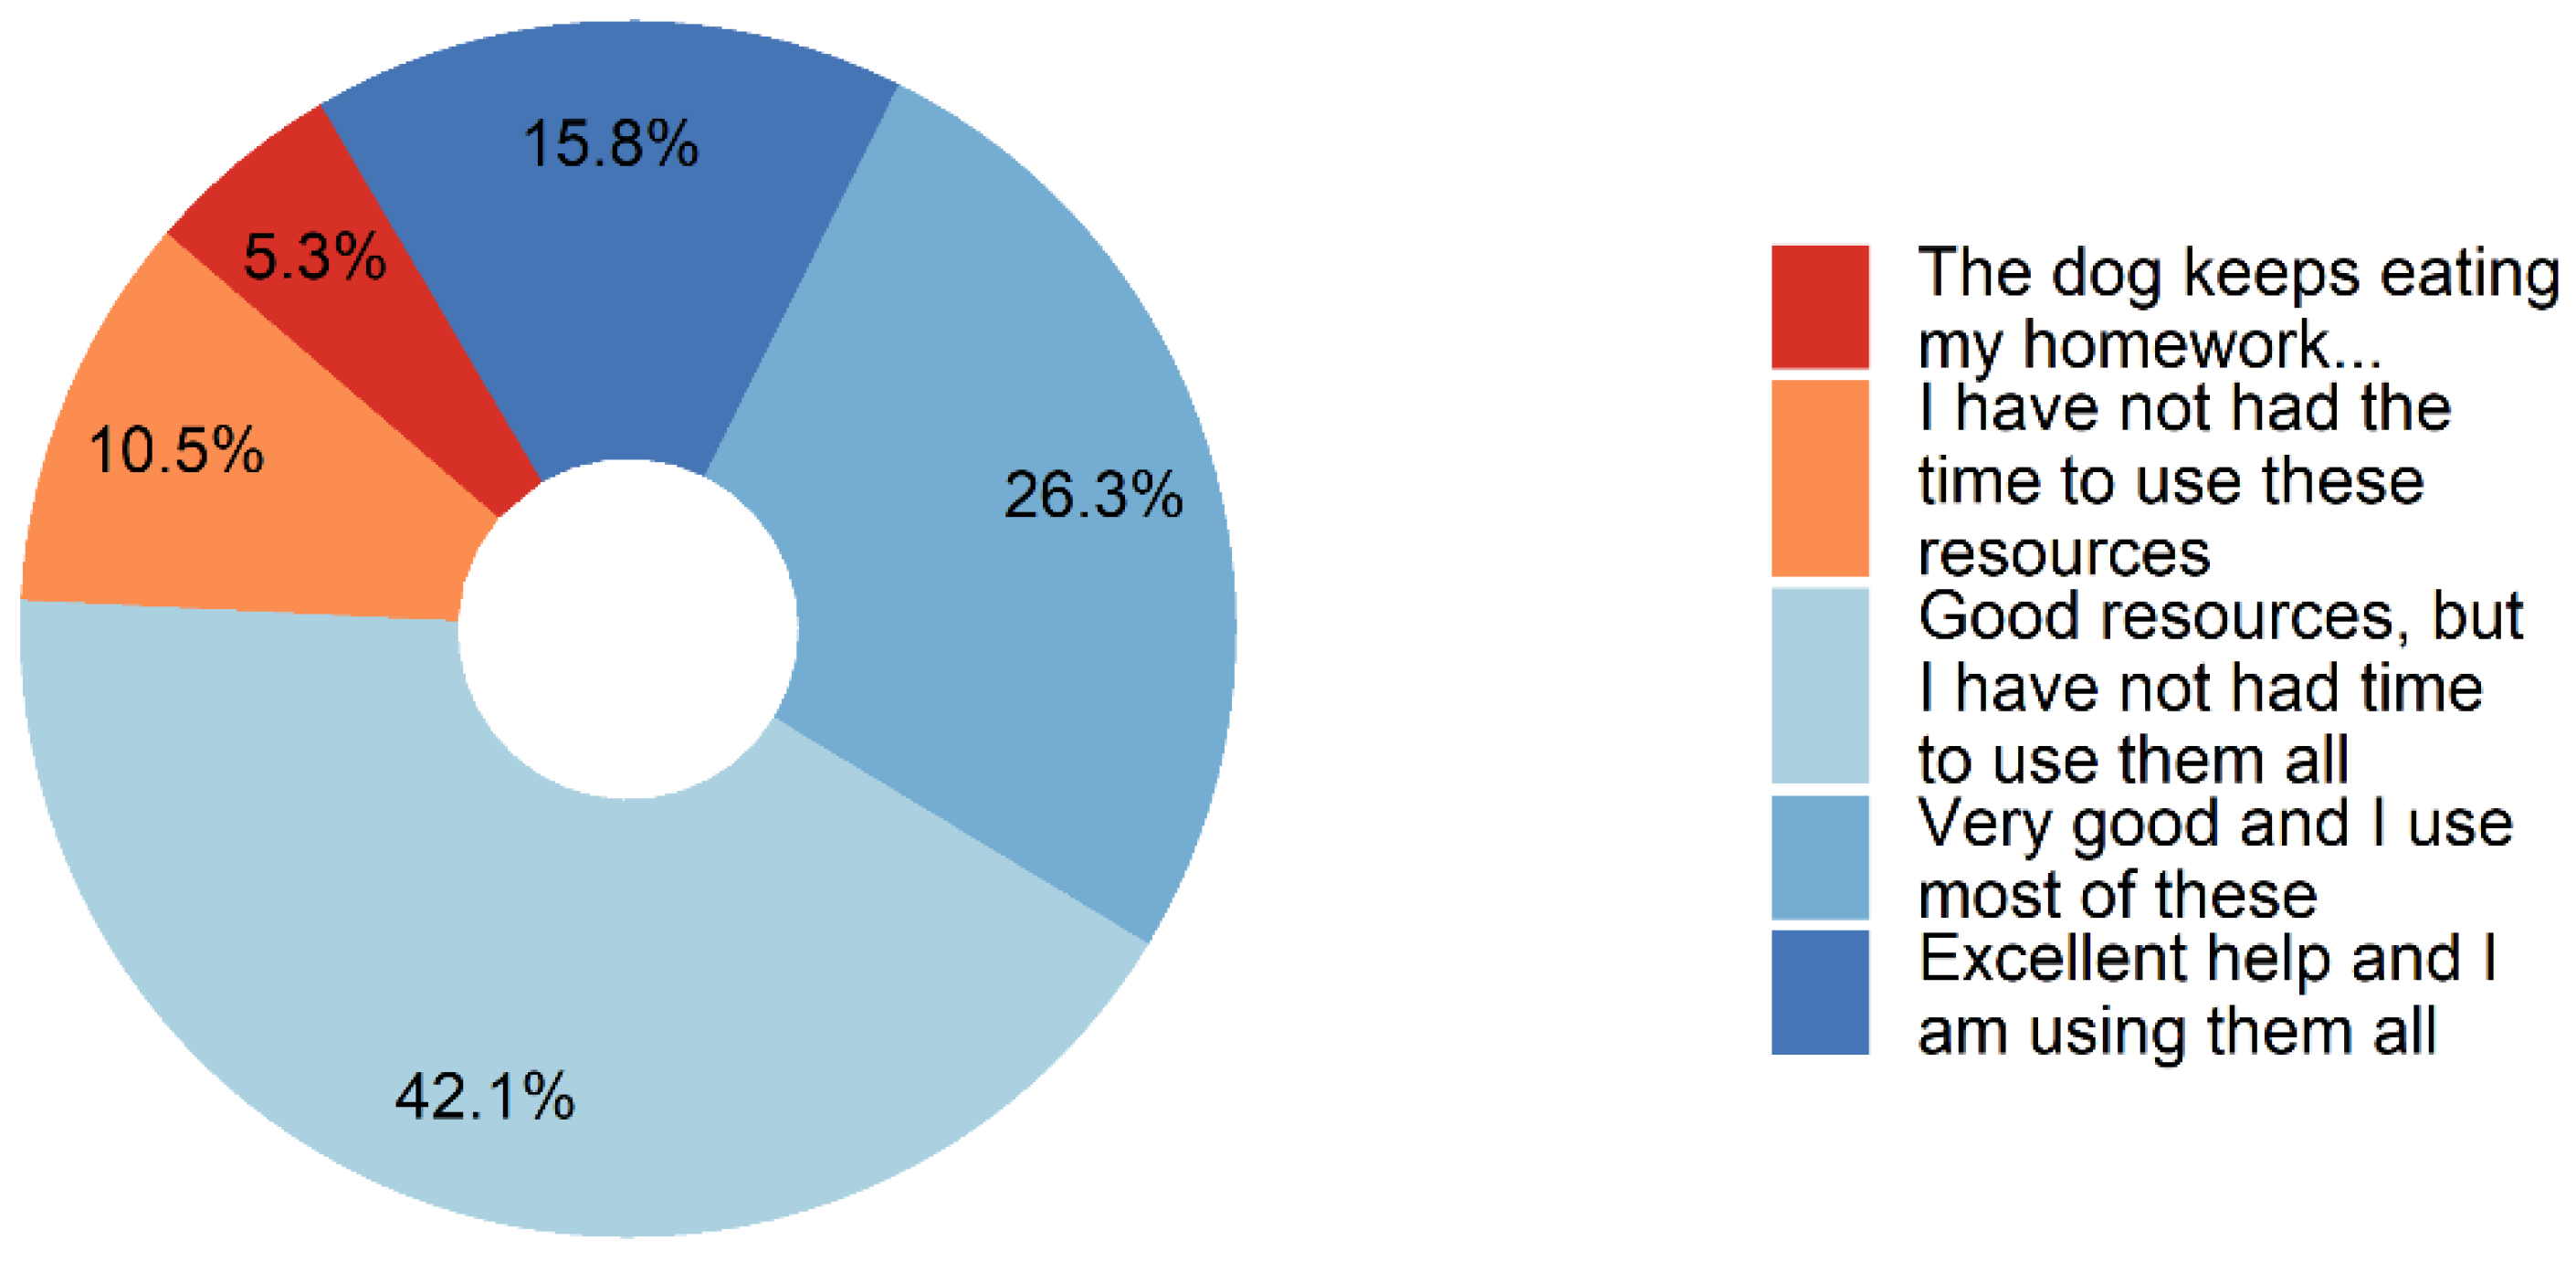
The 50001 Ready Navigator also includes the Playbook for users to organize their documents and track the status of each task. The Playbook has 25 worksheets to help users create a living record of their EnMS. Completed example worksheets for each task of the 50001 Ready Navigator were provided in the training to participants to facilitate the completion of these tasks in the future for their own plants. Completing the worksheets is not required to receive the 50001 Ready recognition. Survey data showed that 84.2% of participants considered the completed example playbooks to be good resources and that 42.1% of the participants used all or most of them (
Figure 2). These completed example playbooks can be downloaded elsewhere [
27].
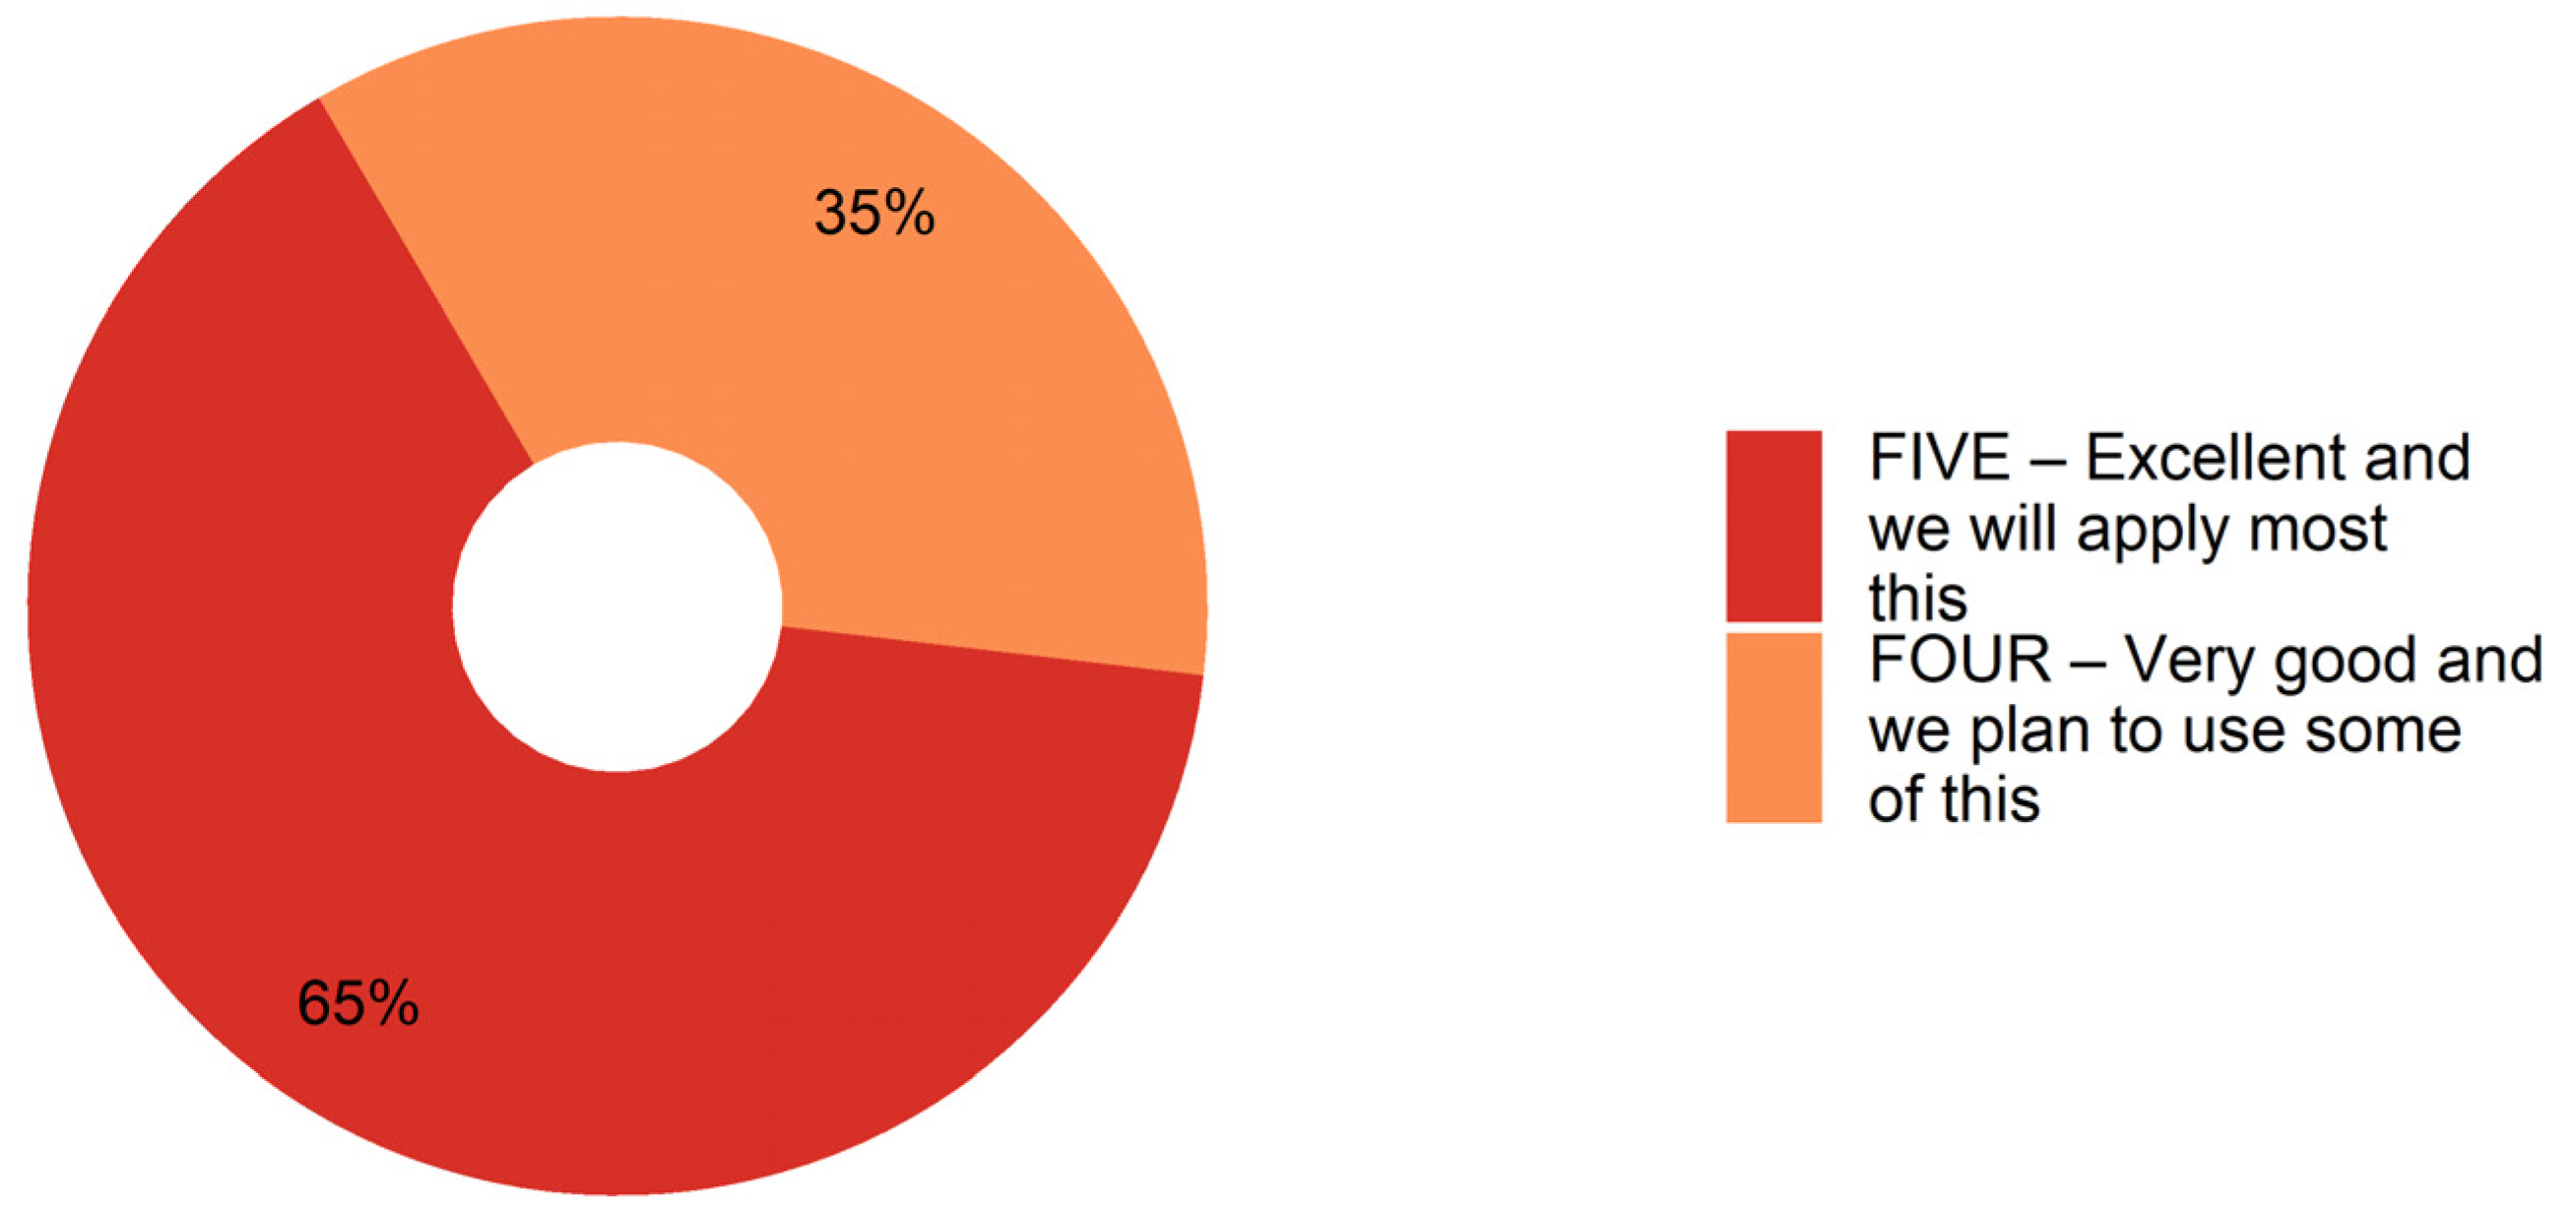
In Session 8, this whole training event was evaluated by employing the survey question “On a scale of 1 to 5, how would you rate the value of this Better Plants training on 50001 Ready based energy management?”
Figure 3 showed that 65% of the participants gave a rating of 5, indicating that this training was excellent and that they would apply most of the content. No participants gave a rating lower than 4.
4. Live Polling Questions
As mentioned above, throughout the VINPLT, the trainer launched 40 polling questions, which can be categorized into six groups based on the types of information the questions were intended to collect.
Table 2 shows the groups, an example question from each group, and the number of questions in each group.
Table 3 shows the entirety of Group 3’s questions (EnMS of participants’ plants).
As shown in
Table 4, for polling questions in Groups 1 and 3, the answers presented four levels of status and one silly answer option. For Group 2, the answers presented five levels of status and one silly answer option. The silly answer options were provided to give some levity to the training and make participants feel less embarrassed by a low status.
Because the answers to these polling questions are text, it is challenging to process and analyze; to simplify the analysis and presentation of the participants’ responses, a simplified legend and numerical value were assigned to each answer, as shown in
Table 5. Because the highest completion status level (i.e., Level A) means the companies “have all in place, but still a little tweak is needed”, but not 100% complete, the max score was set to 95, not 100.
5. Findings from Polling Results
This section discusses some major findings from the responses to the polling questions in Groups 1 through 3. In
Figure 6,
Figure 7,
Figure 8 and
Figure 9, the average scores were calculated to indicate the overall status of responding participants using the assigned numerical values to different answered levels in
Table 5. The diamond symbols, presenting the average cores, were colored to match the status shown in the color legend in each figure.
5.1. Status of Tasks 1–24
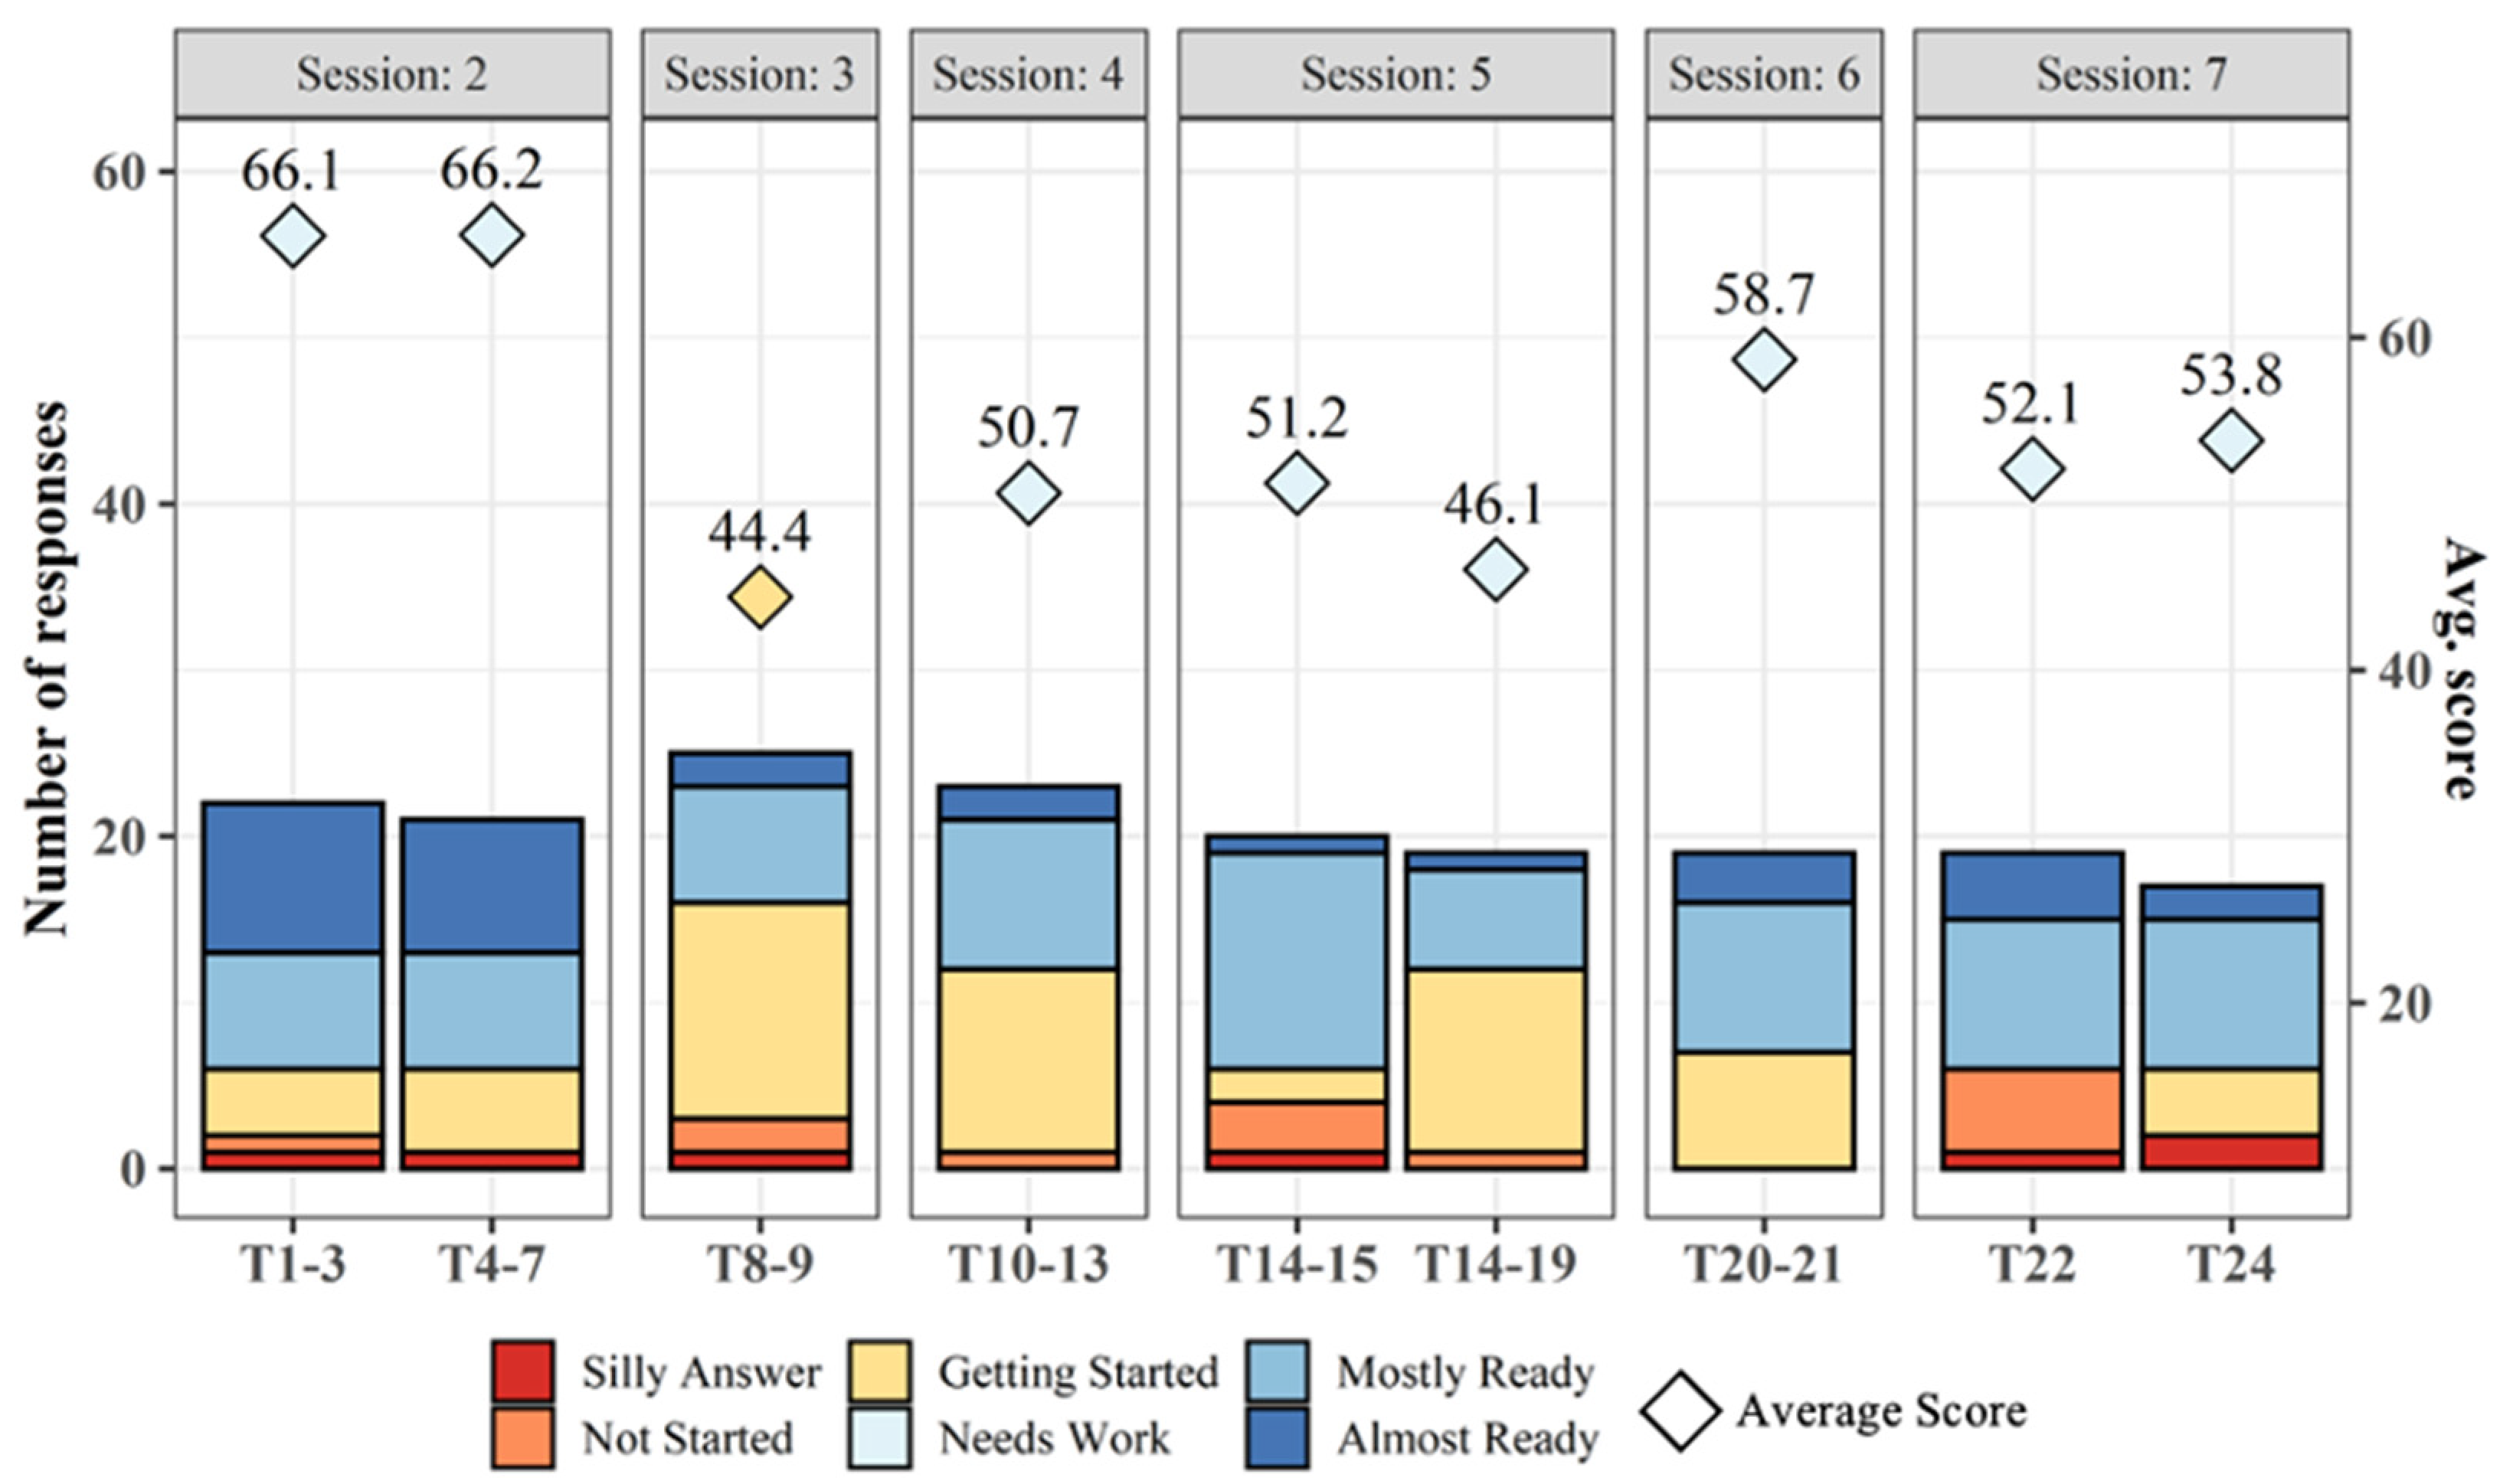
Figure 6 shows the responses to the polling questions about the status of Tasks 1–24. Each polling question received an average of about 20 votes. The polling question associated with Tasks 8 and 9 received the most votes (25), and the one associated with Task 24 received the least votes (16).
Figure 6.
Responses to status of Tasks 1–24 (source: based on the polling survey results).
Figure 6.
Responses to status of Tasks 1–24 (source: based on the polling survey results).
The participating companies had the highest average scores on Tasks 1–3 (66.1) and 4–7 (66.2). Tasks 1–7 also received the most responses on “Almost Ready,” meaning that these companies had already performed more work for the tasks in the sections of Context of the Organization (Tasks 1–3: An EnMS and Your Organization; People and Legal Requirements Affecting the EnMS; Scope and Boundaries) and Leadership (Tasks 4–6: Management Commitment; Energy Policy; Energy Team and Resources). Thus, it would take less effort for these organizations to complete these tasks and to be ready for 50001 Ready recognition.
The participating companies had lower average scores on Tasks 8–19. Tasks 8 and 9 also received the most responses on “Getting Started.” Tasks 14–19 received the fewest responses on “Almost Ready” and the lowest average scores, meaning that for the participating companies, more work was required to complete the sections of Support (Tasks 14–16: Competence and Training; Awareness and Communication; Documenting the EnMS) and Operation (Tasks 17–19: Operational Controls; Energy Considerations in Design; Energy Considerations in Procurement). The reason why participating companies had lower average scores on Tasks 8–19 was not explored. One possible reason is that these tasks are more complex than other tasks and require more efforts from employees, and companies lack the resources to complete them. Follow-up research work has been planned for better understanding.
5.2. Confidence in Implementing 50001 Ready after Each Session
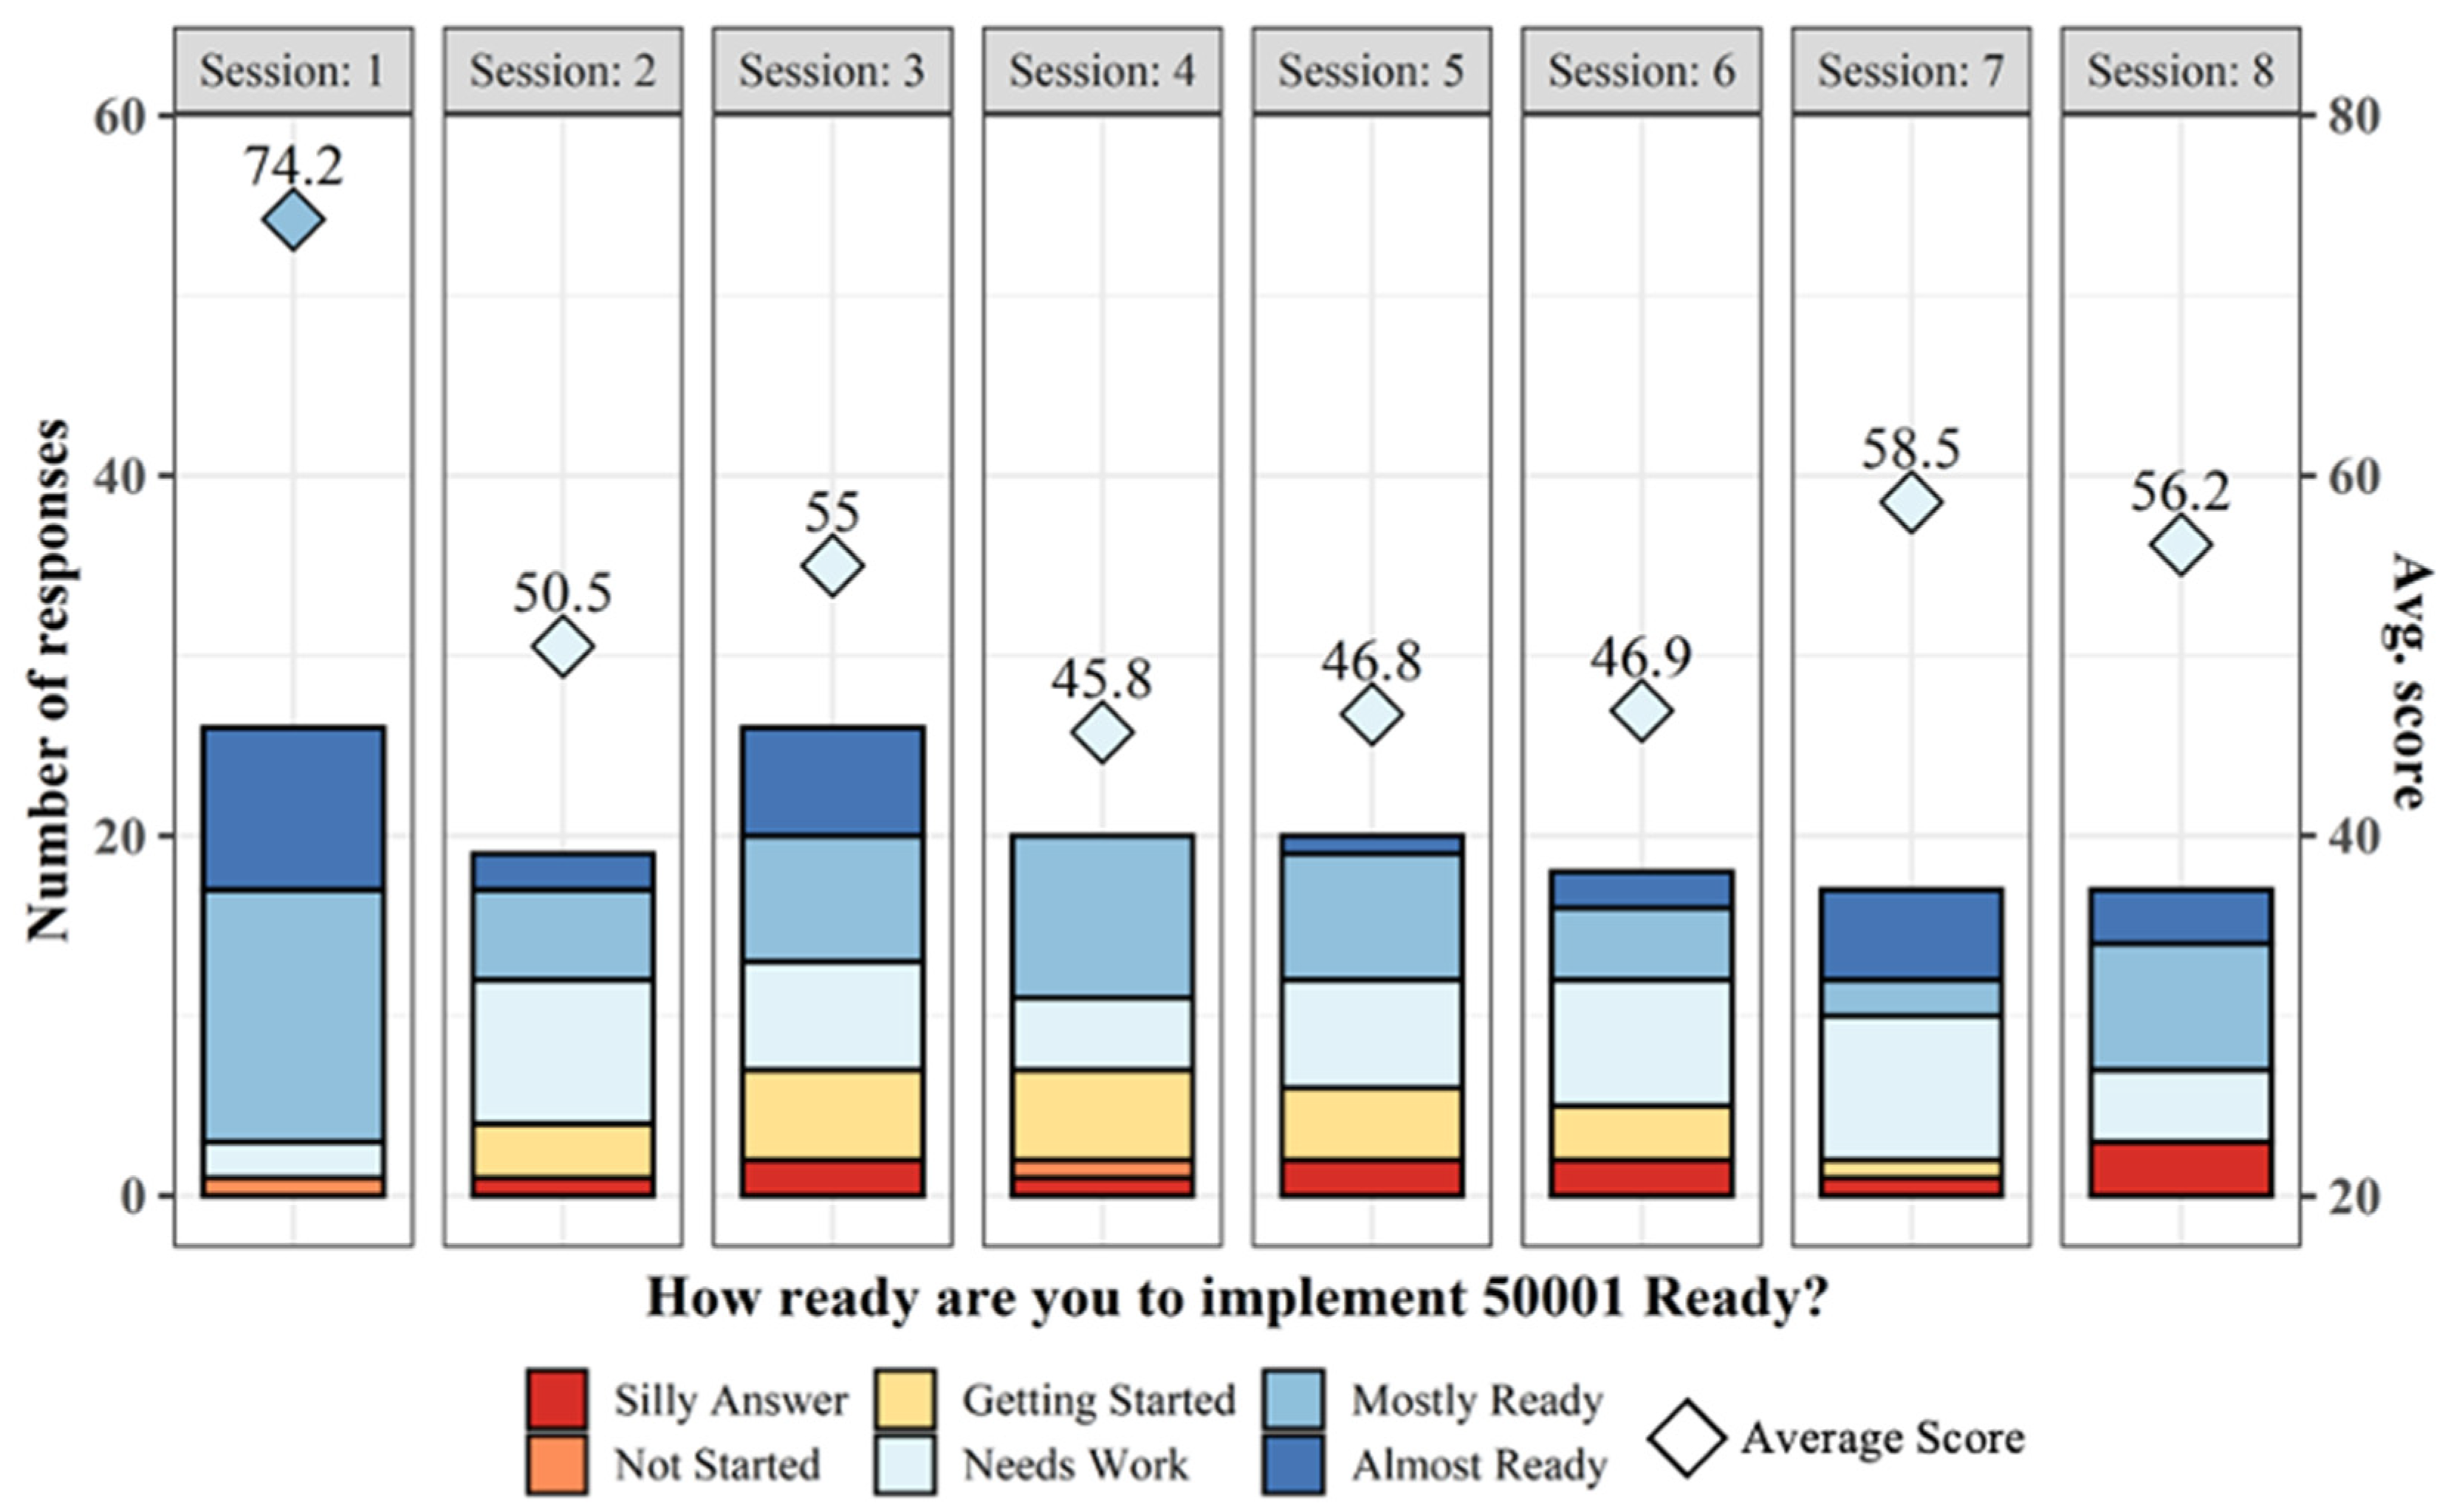
Figure 7 shows the responses to the survey question of “How do you feel about 50001 Ready helping you with your energy management plans?” at the end of each session. After the first session, the participants were most optimistic (averaging “Mostly Ready”) about implementing 50001 Ready to improve their EnMS. Their confidence (i.e., the average score) dropped significantly after Sessions 2 and 3 and reached the lowest point after Session 4. The confidence after Sessions 5 and 6 maintained the same low of Session 4 but bounced back higher after Sessions 7 and 8. At the end of Session 4, no one voted for “Almost Ready” in the poll. The reason could be that the participants were recognizing the substantial amount of required effort to complete Tasks 10–13 (Improvement Opportunities; Energy Performance Indicators and Energy Baselines; Objectives and Targets; Action Plans for Continual Improvement). Starting after Session 5, an increasing number of participants indicated “Almost Ready,” and the confidence in implementing 50001 Ready grew significantly after Sessions 7 and 8.
Figure 7.
Responses to “How do you feel about 50001 Ready helping you with your energy management plans?” (source: based on the polling survey results).
Figure 7.
Responses to “How do you feel about 50001 Ready helping you with your energy management plans?” (source: based on the polling survey results).
5.3. Energy Management Systems
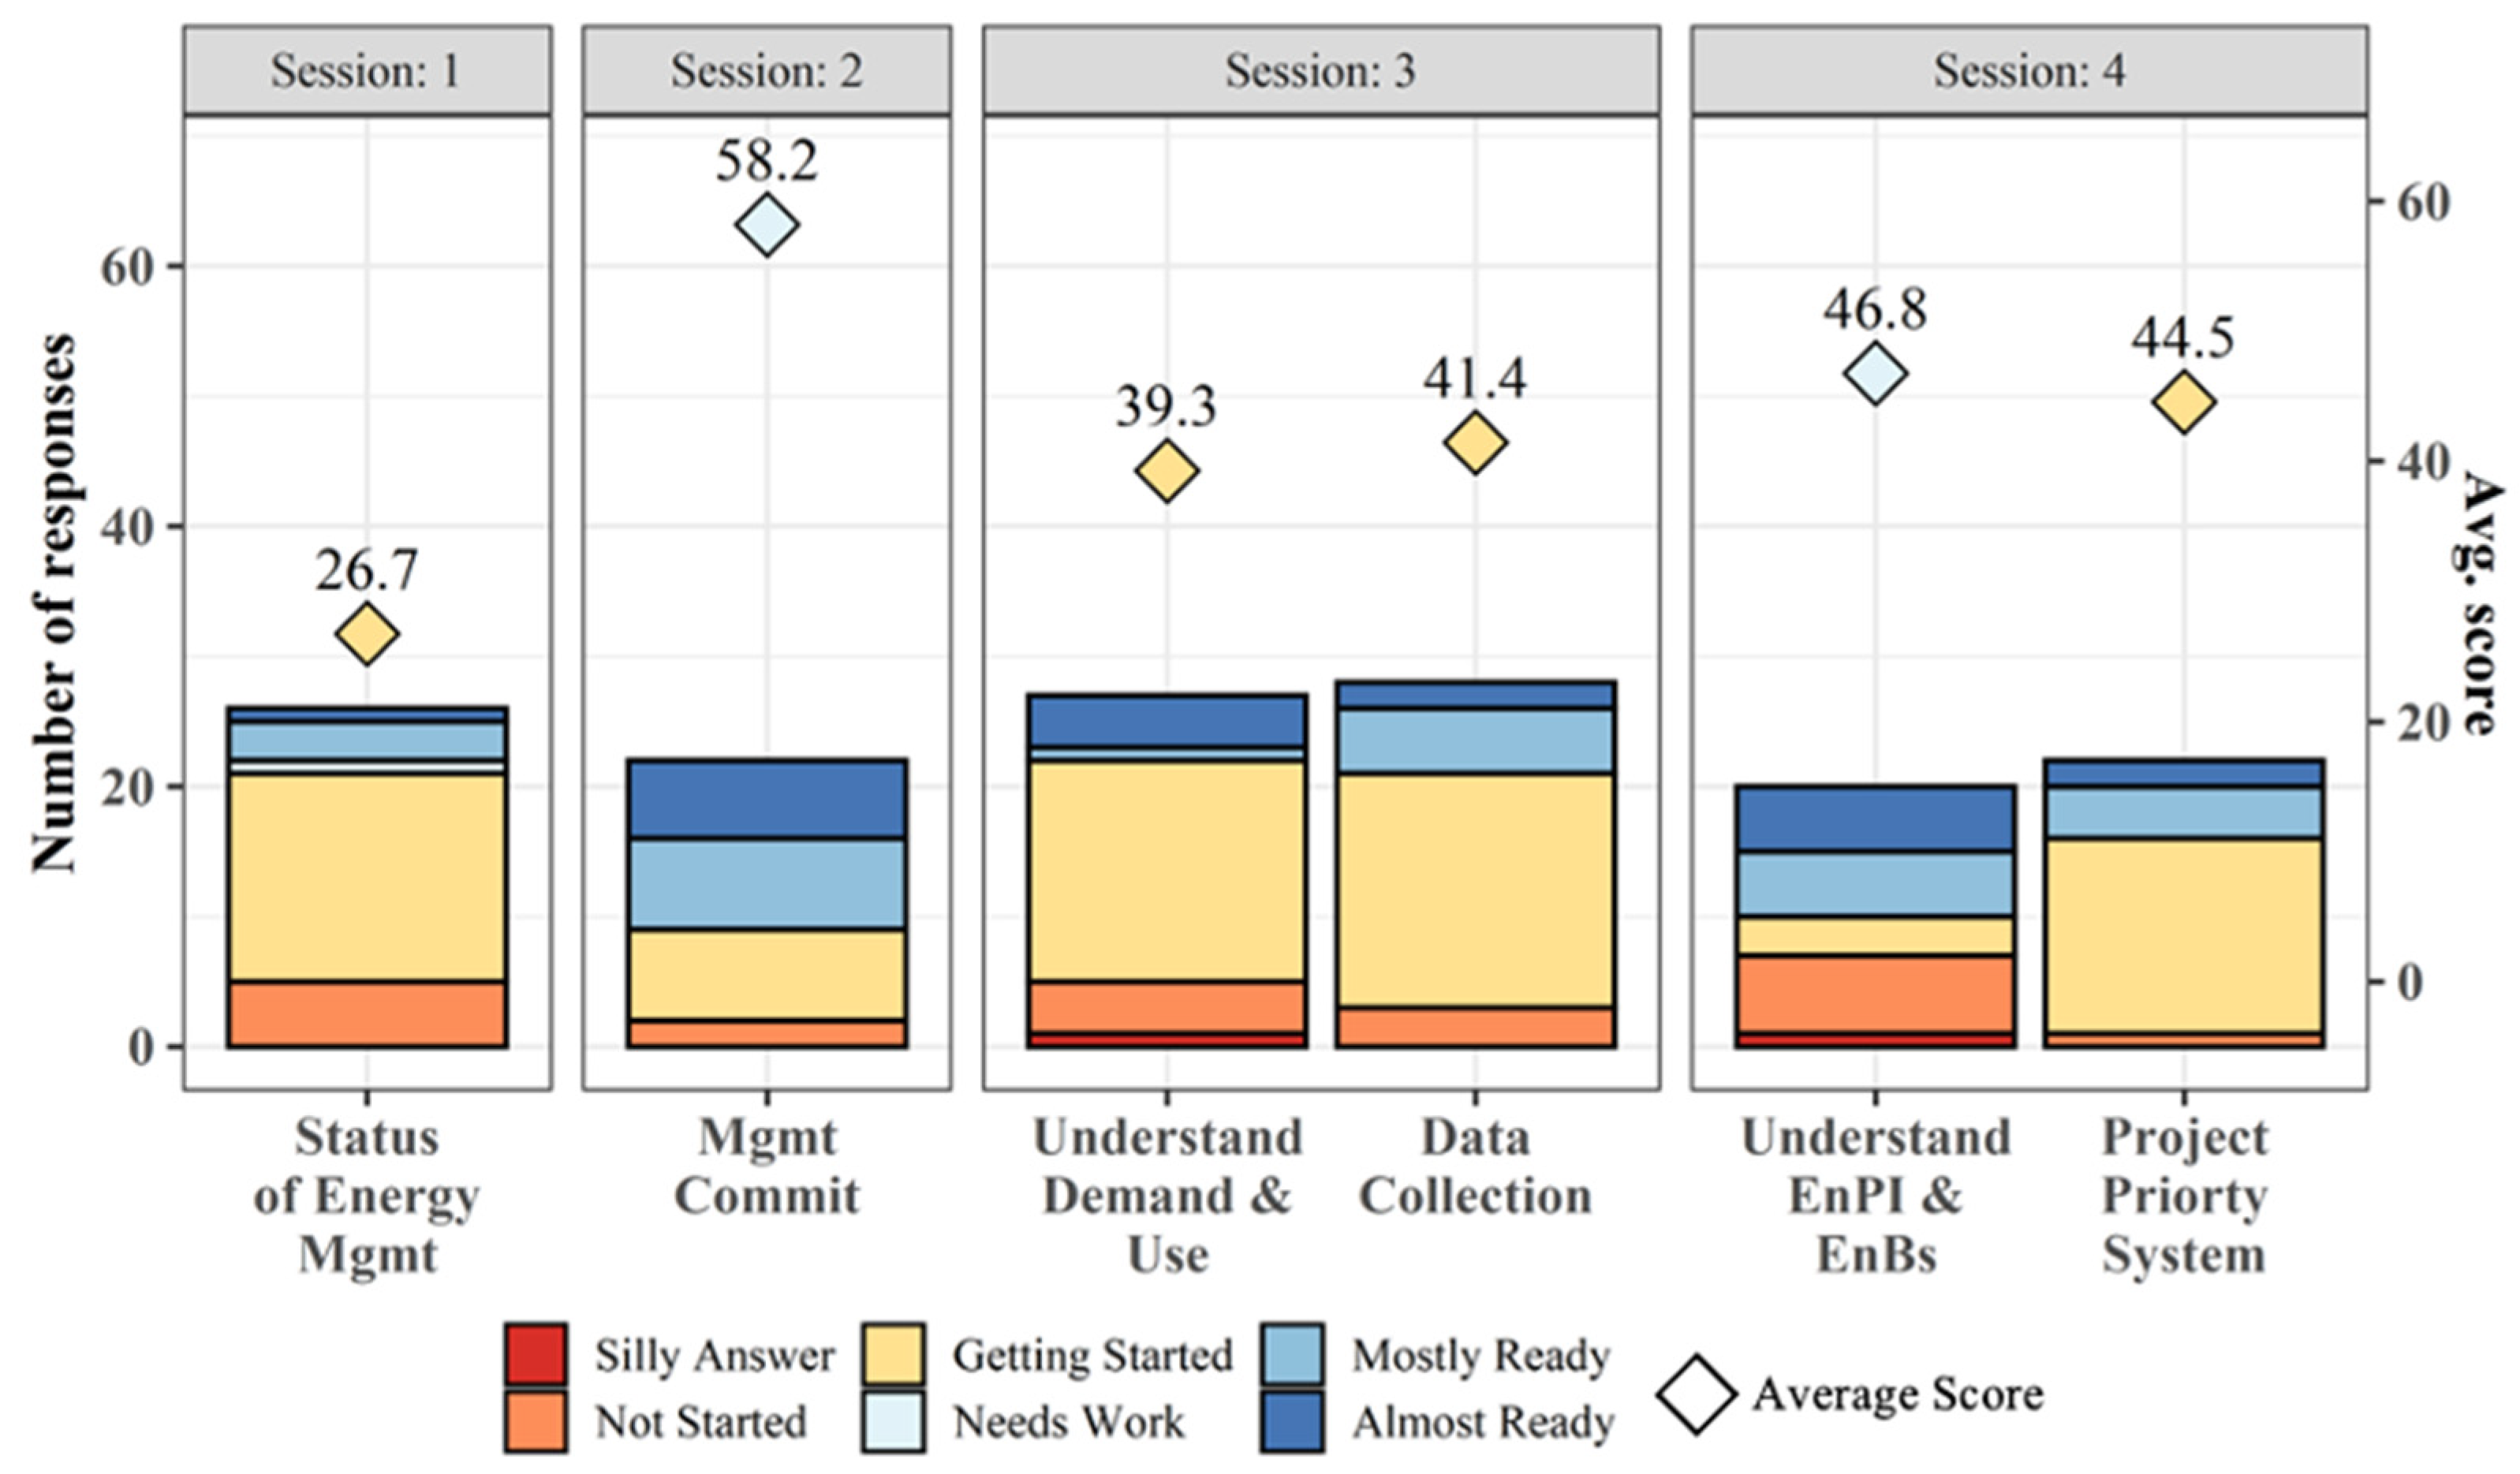
Figure 8 and
Figure 9 show the responses to the more specific EnMS status-related questions of Group 3, which are shown in detail in
Table 3.
Figure 8.
Responses to questions about energy management in Sessions 1–4 (source: based on the polling survey results).
Figure 8.
Responses to questions about energy management in Sessions 1–4 (source: based on the polling survey results).
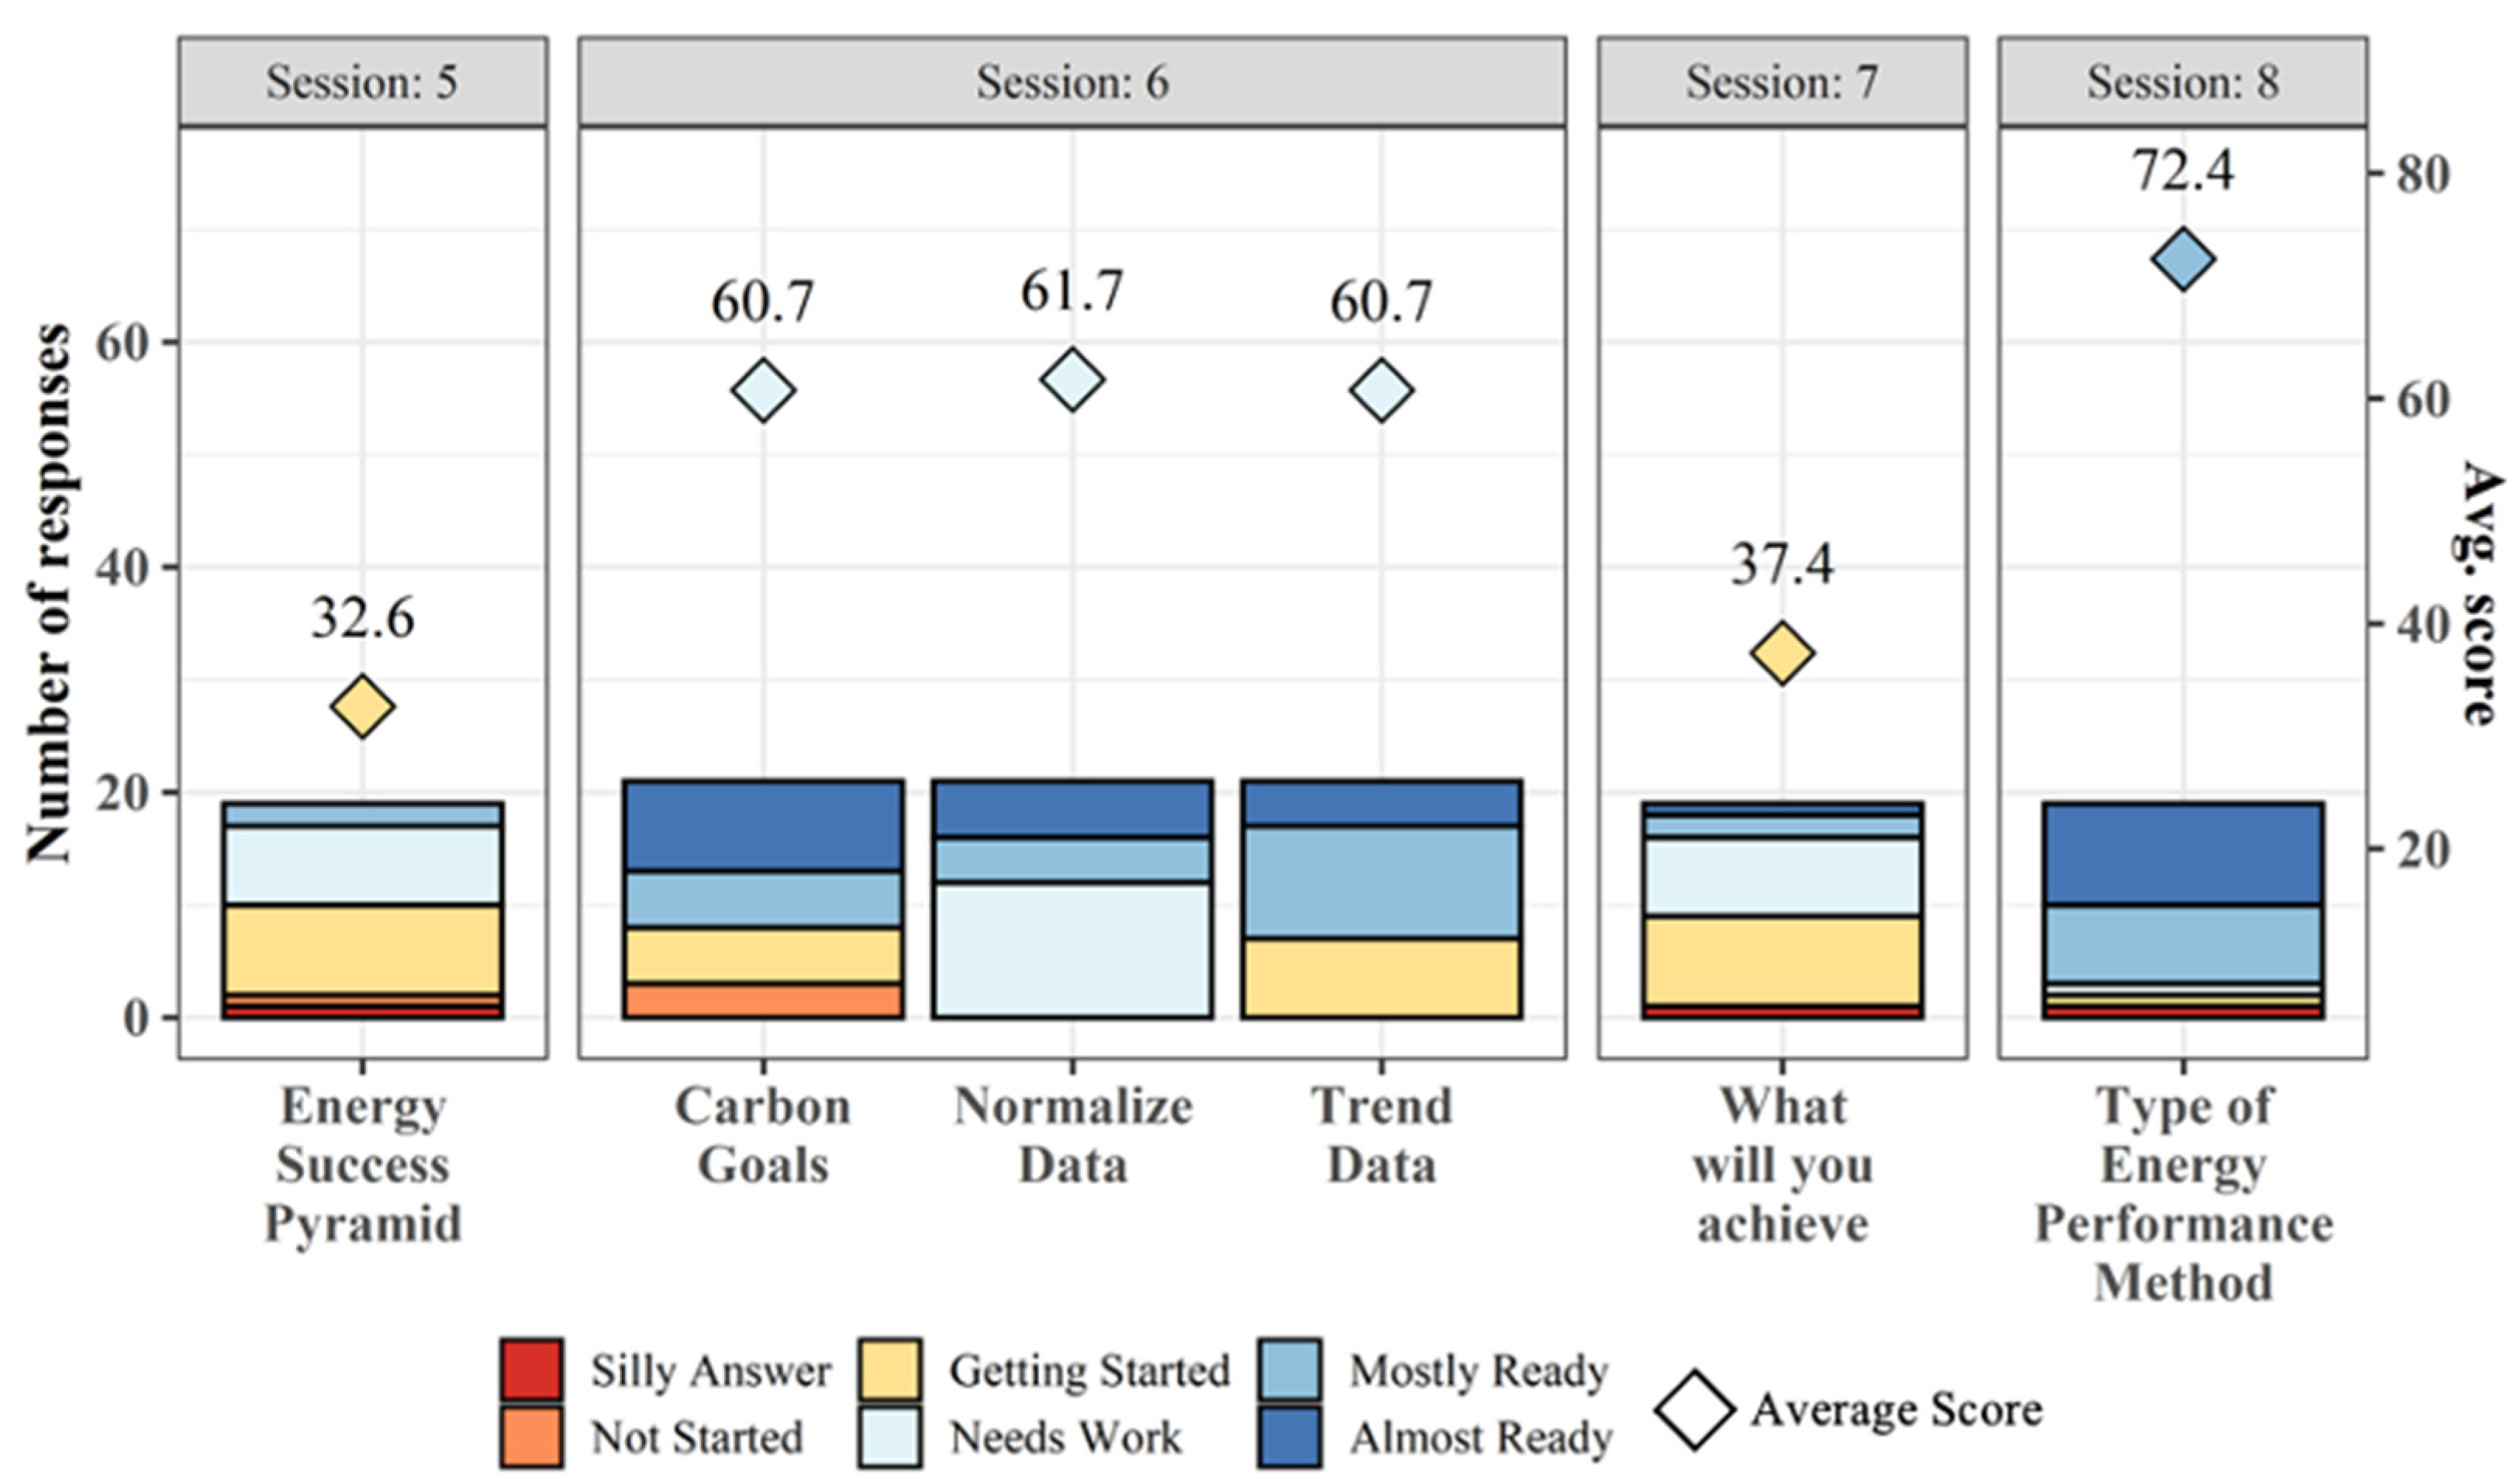
Figure 9.
Responses to questions about energy management in Sessions 5–8 (source: based on the polling survey results).
Figure 9.
Responses to questions about energy management in Sessions 5–8 (source: based on the polling survey results).
Participants scored the lowest on the question about “Status of Energy Management” in Session 1. Only one participant indicated that their company had the status of “Almost Ready” or “has plans to pursue Superior Energy Performance at one or more sites.” Most (16 out of 26) participants were just “Getting Started,” and they were “working with Better Plants and ready to engage more with 50001 Ready.” To help these companies interested in “engaging more with 50001 Ready”, the 50001 Ready Implementation Cohort was introduced in Session 8, and five companies joined the Cohort with the goal of making their facilities 50001 Ready.
A high score for the question about Management Commitment in Session 2 implied that the top management of most participating companies (59%; 13 out of 22) believes that energy management is important. Among these 13 responses, six participants felt “they were fully supported by the management” and seven participants thought that the management “did not fully understand the resource requirements for a 50001 Ready implementation”. About 36% (eight out of 22) of the participants indicated that they were “just learning about 50001 and will need to educate my top management on this and see where we go from there”. Only one participant indicated that “this is going to be a real uphill battle with my top management”.
The scores for two polling questions in Session 3 were low with most participants indicating the status of “Getting Started.” In other words, for “Understand Demand and Data,” they “are good on energy in but would need some effort to get energy use.”. For “Data Collection,” they “are good on incoming energy and utility bills, but [they] need more work on relevant variables and production data.”
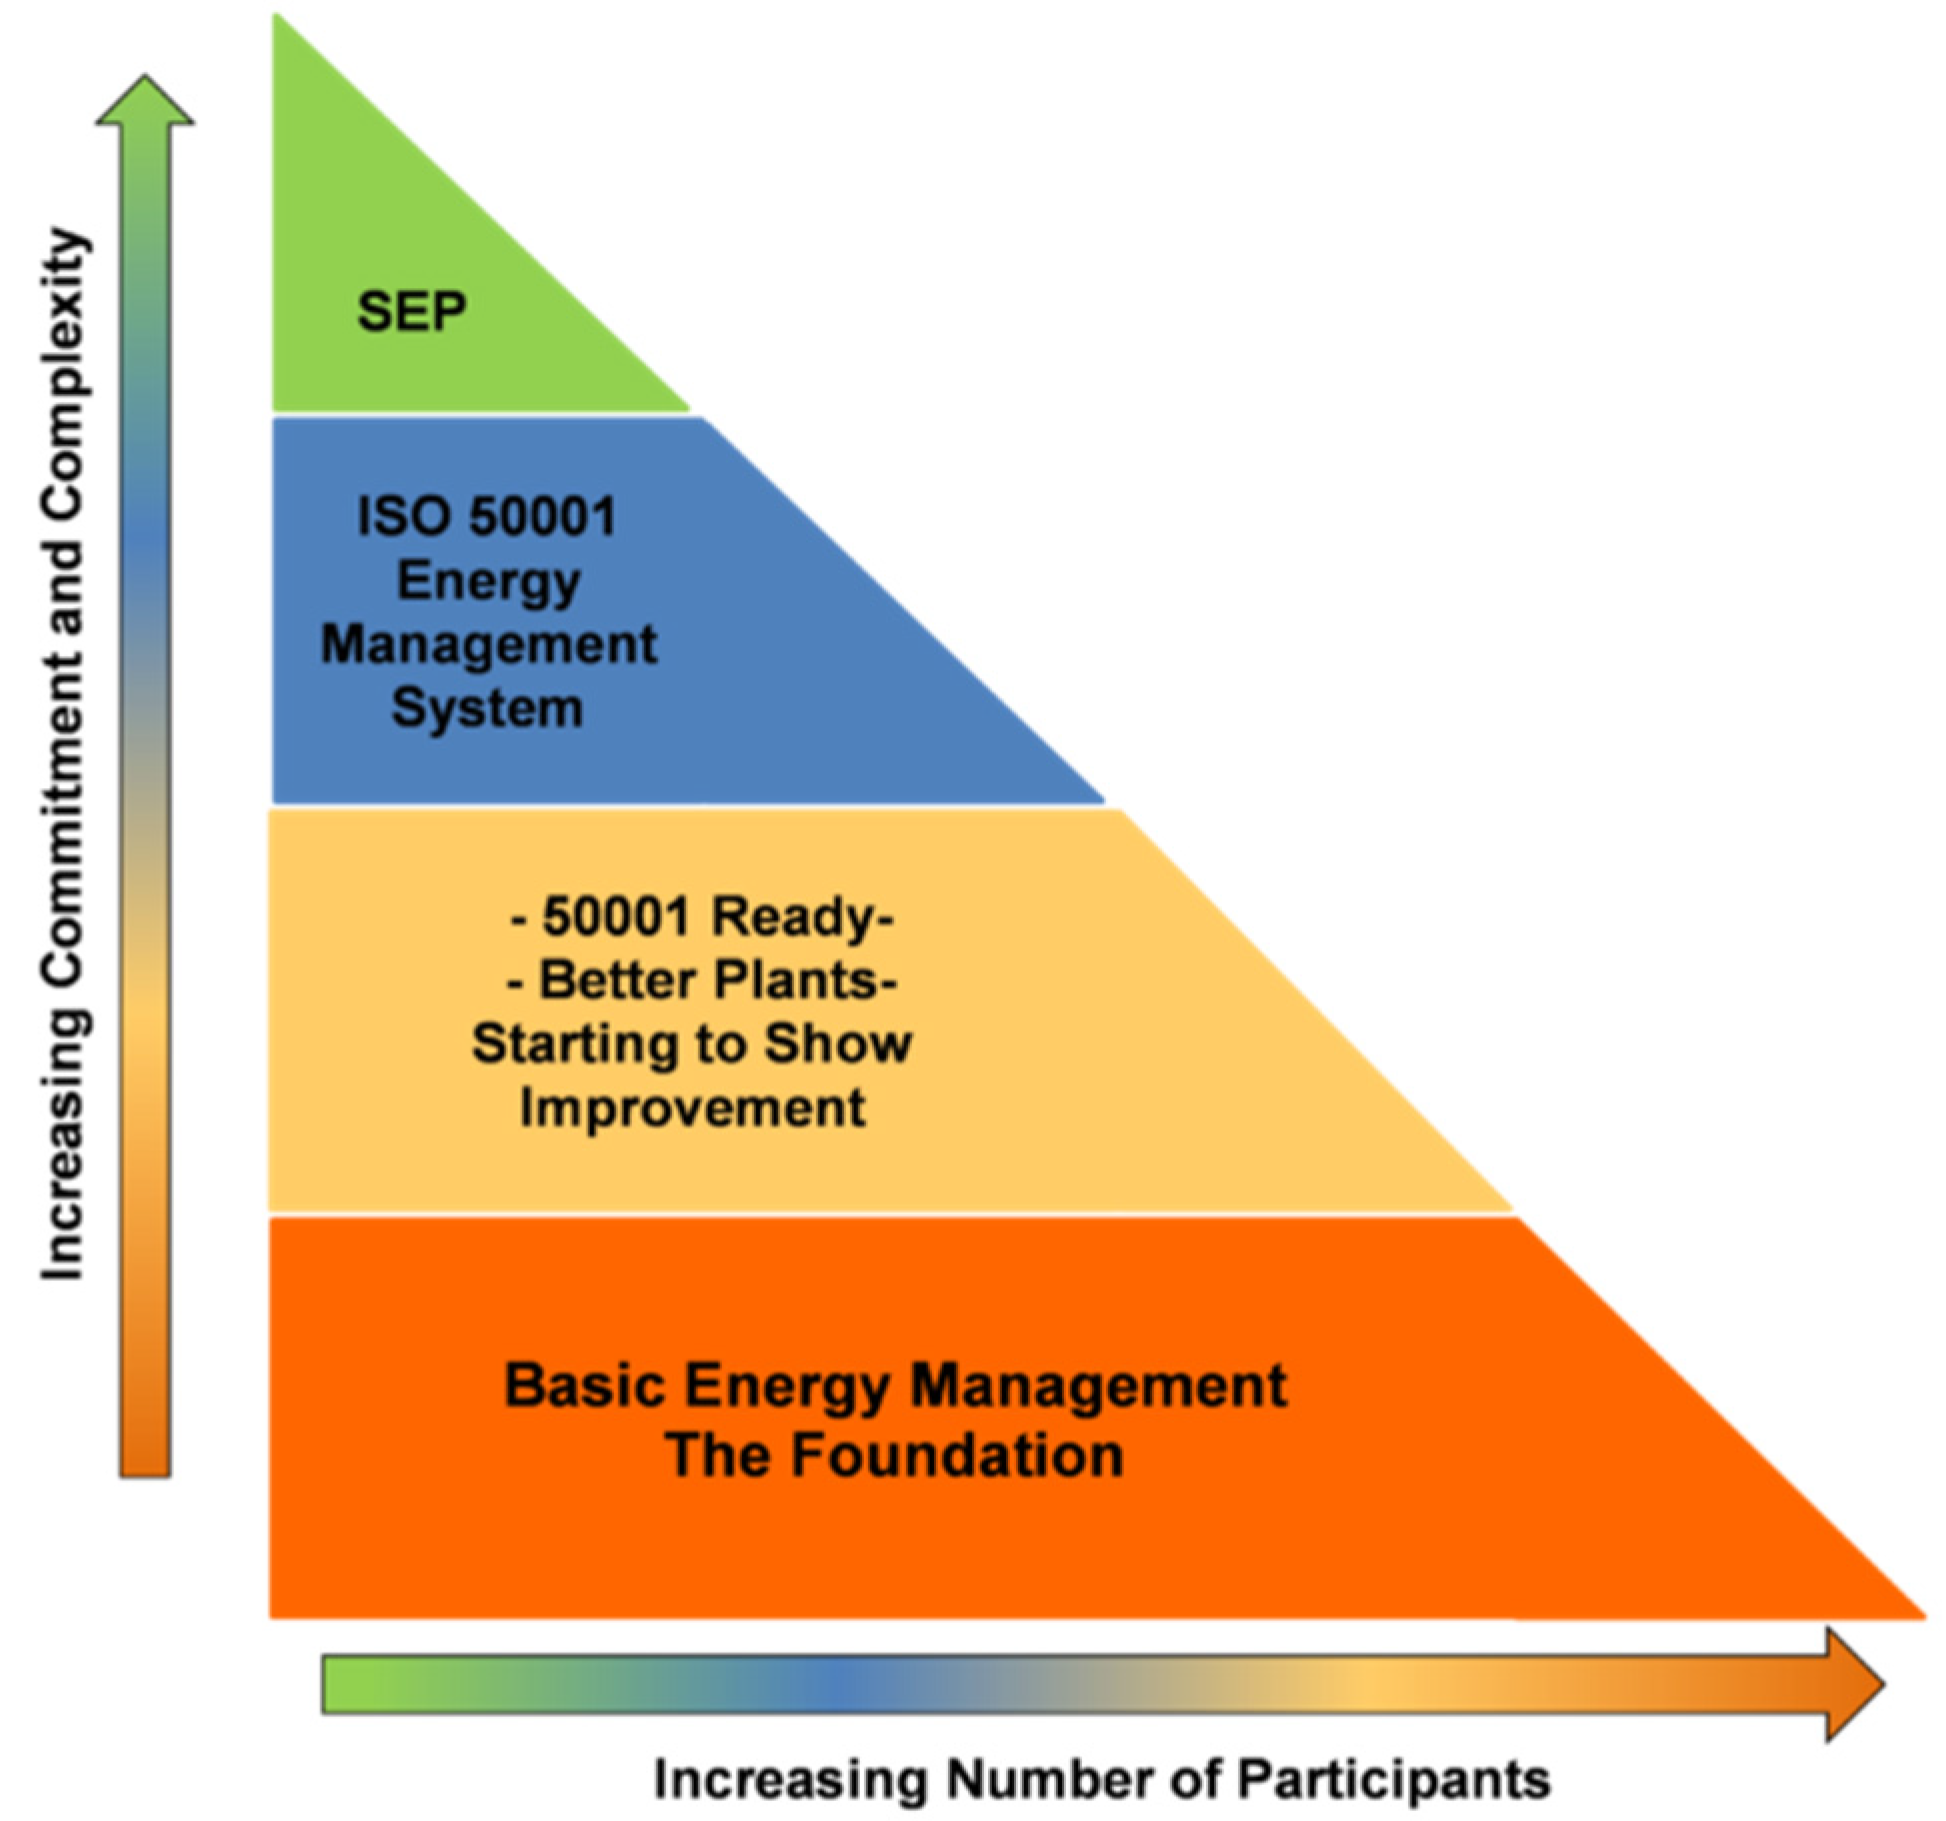
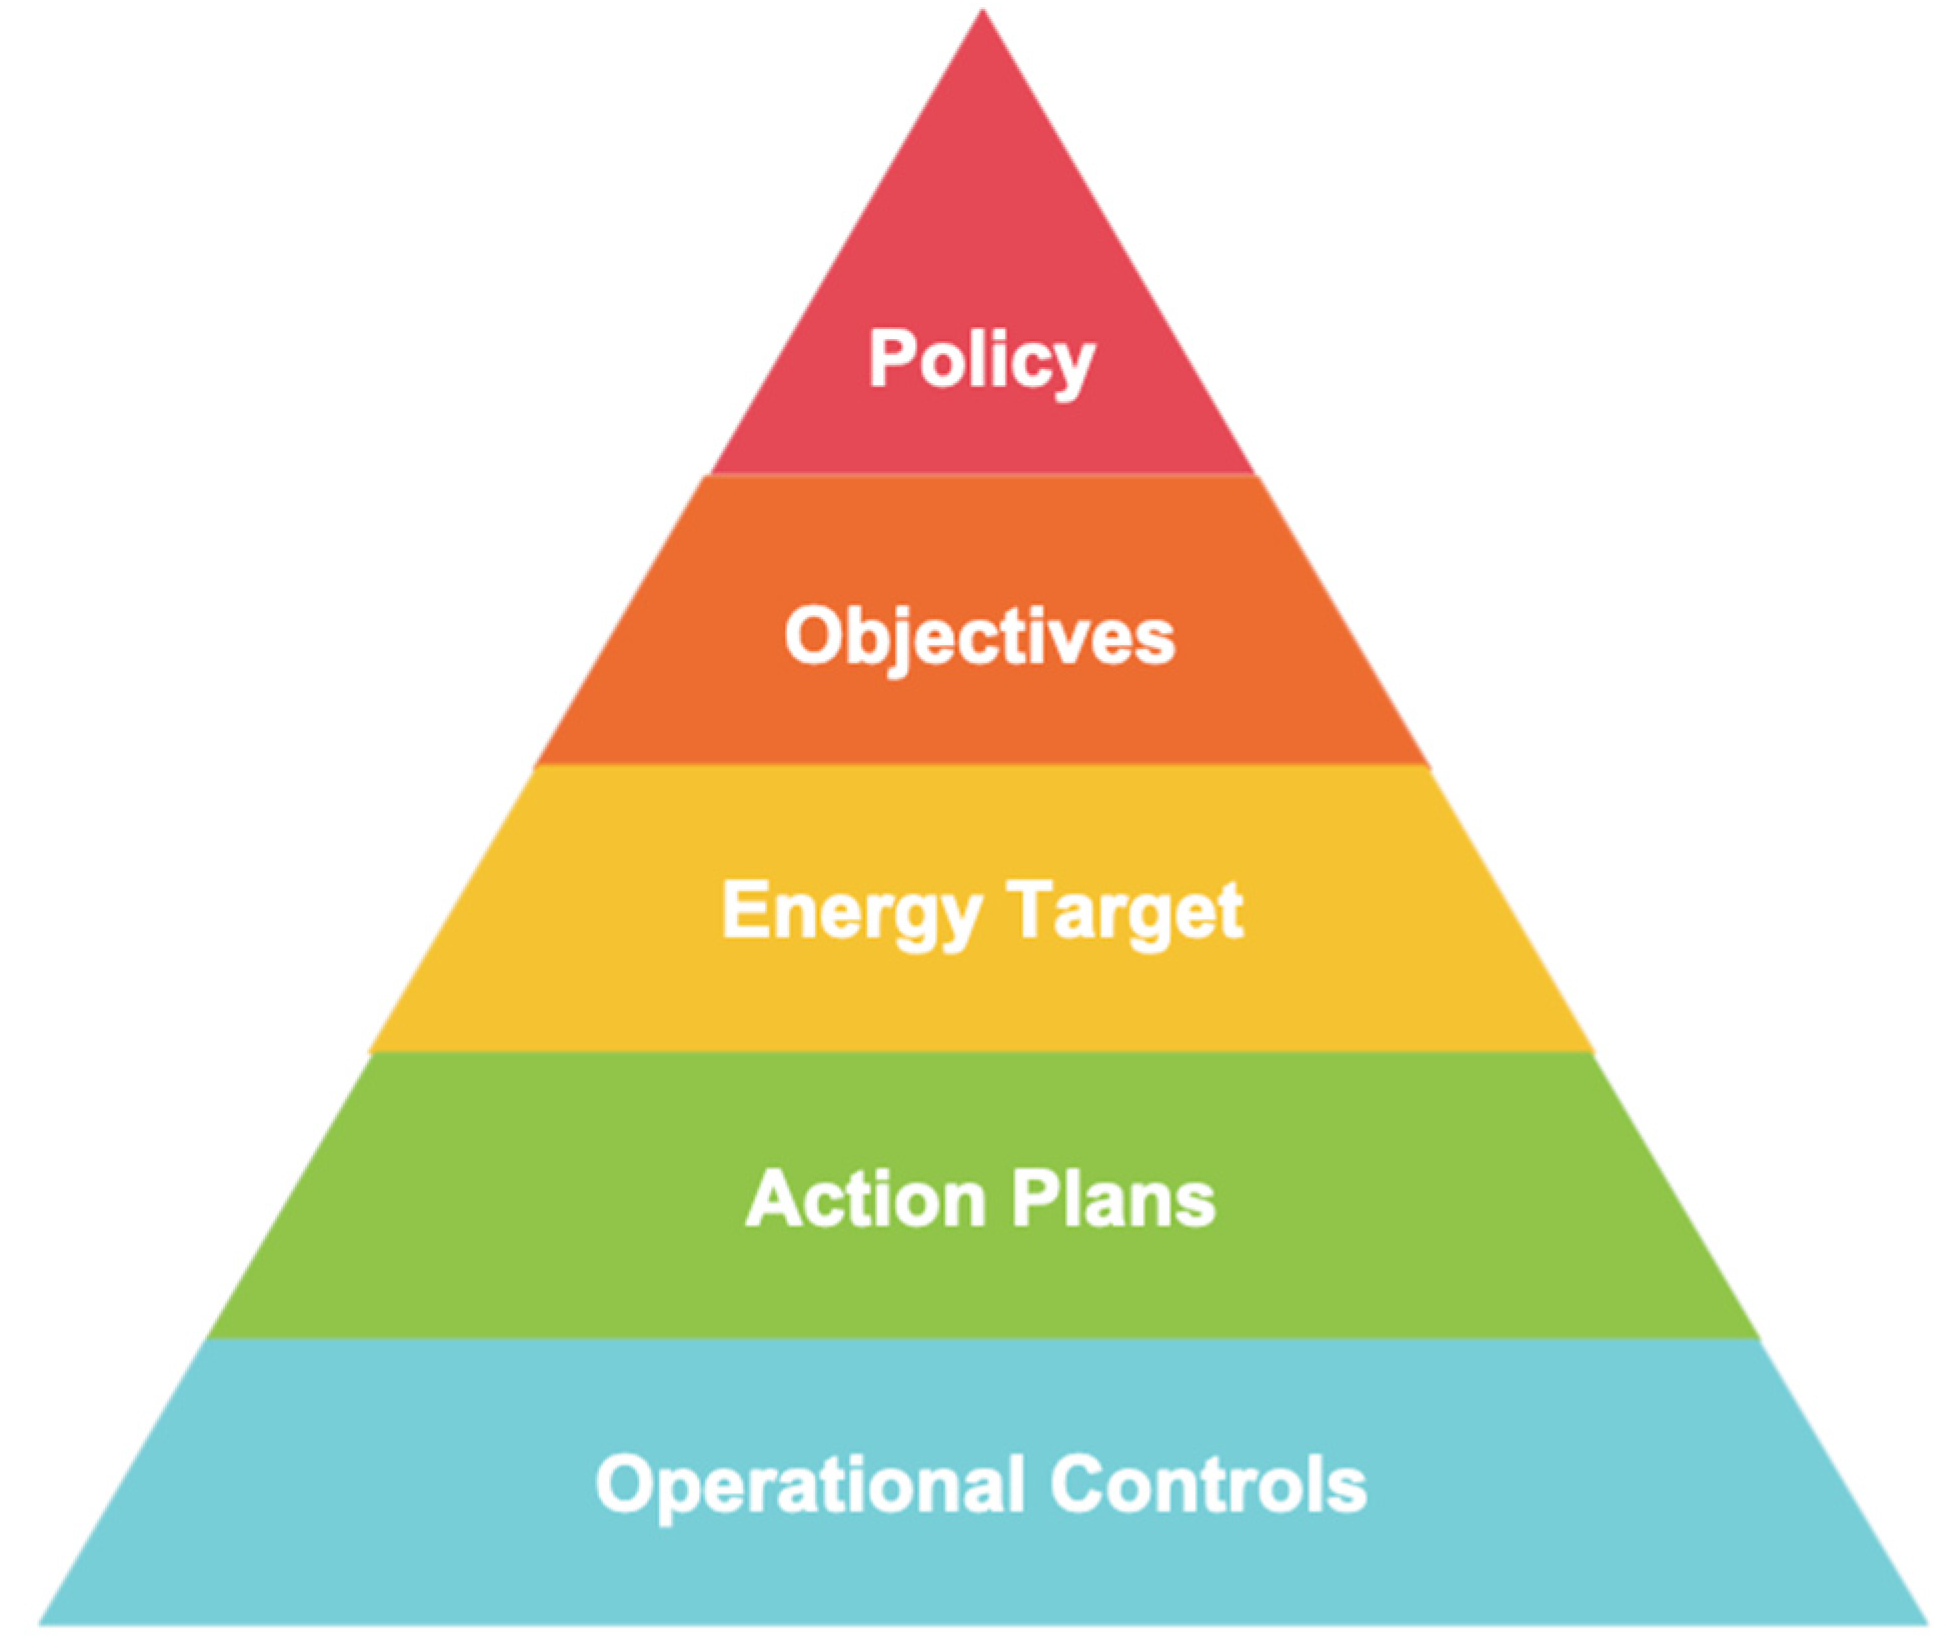
The answers to the polling question about “Energy Success Pyramid” in Session 5 indicated that most participants had the status of “Needs Work” and “have found solid rock and are working on the foundation” or the status of “Getting Started” and they are “still digging the foundation and looking for that solid rock to start on.”
For the question of “What Will You Achieve?” in Session 7, most participants “would like to achieve 50001 Ready Recognition from DOE” (“Needs Work”) and “would incorporate some of the principles [they] have learned to improve [their] energy management” (“Getting Started”). Two participants “planned to achieve ISO 50001 third-party certification” (“Mostly Ready”), and only one participant “planned to achieve both ISO 50001 and Superior Energy Performance third-party certifications” (“Almost Ready”).
The answers to the question about “Type of Energy Performance Method” showed that about 47% (nine out of 19) participants were considering using linear regression models to track the energy performance of their plants (“Almost Ready”).
5.4. Limitations of the Research Methodology
This study was performed using online polling surveys during the training sessions. Overall, between 20 and 30 people attended each session (average attendance of 25.75 individuals over eight sessions). Over half (57%) answered every question in the session, almost one-third (32%) answered over half the questions, and the remaining (12%) answered fewer than half, for an average response rate of 83% among attendees (55% out of total registrants). Additionally, the participants in the surveys might not be indicative of average US manufacturers. All the survey participants were from manufacturing companies that are Better Plants partners; therefore, they have already committed to energy intensity reduction goals. Additionally, these companies have already started building their energy management systems (whether that was a goal or not) and have already been implementing more energy management practices and achieving higher energy efficiency than typical US manufacturers [
18].
Because of the relatively small sample size and background of the survey precipitants, the findings about the status of energy management systems might be more applicable to manufacturing companies with more experience in energy management. Typical US manufacturers could face additional challenges and barriers that had not been identified in this study. This study represents a precursor to a larger work examining the energy management and sustainability efforts of US manufacturing, and the future work will include a larger sample and participants with more diverse background on energy managements to draw more generalized conclusions for US manufacturers.
6. Discussion
The surveys conducted during training showed that most participants considered themselves “Almost Ready” at the beginning of the first sessions, covering the initial tasks on Context of the Organization and Leadership (Tasks 1–7). Conversely, the later tasks on Planning, Support, and Operation (Tasks 8–19) had more “Not Started”, “Getting Ready,” and “Mostly Ready” answers. This indicates that most of the participating companies require more efforts and resources to complete tasks associated with these later tasks, and it is one of the areas that programs such as the Better Plants Program, 50001 Ready, and other technical partnership programs can focus their guidance and trainings on.
Other poll questions focused on more specific aspects of the EnMS programs’ development to better understand where future trainings need to focus. Most of the participants (59%, 13 out of 22) felt that their top management believes that energy management is important, although about half (7 out of 13) of those respondents indicated that their management does not fully understand the resources required to implement 50001-based energy management systems. Unrealistic expectations of management relating to the time and resources required to create an EnMS could have a large, negative impact on successful implementation. Programs or guidance specifically targeting corporate management, with details on what is needed to create a successful program and the benefits thereof could help reduce this added burden.
Another key training area that the polls found is related to the tasks “Understand Demand and Data” and “Data Collection”. Only 68% of the participating companies considered themselves nearly complete with these tasks (answering, “I am good on energy in but would need some effort to get energy use” and “we are good on incoming energy and utility bills, but we need more work on relevant variables and production data”) at the beginning of that session. However, at the end of that session (Session 3), there was a rise in the confidence of the participants, possibly indicating that while they started the session with these tasks less complete, the training they received helped them believe they could do so, and the level of training given by the VINLPT was sufficient.
Unfortunately, the next three sessions focusing on Tasks 10–21 (including Planning, Support, Operation, and Performance Evaluation) ended with a much lower participant confidence. While this was likely influenced by the complexity and resources required to complete those tasks, it could also indicate that more time could be spent on these topic areas to help improve participant understanding and thus confidence.
One of the topics in the last session in low confidence period (Session 6) covered using linear regression models to understand and track energy performance. During the training, only about 47% (nine out of 19) of the participants indicated that they are considering using linear regression models. As linear regression for data analysis is strongly recommend by 50001 Ready (and required by ISO 50001-2018), this is regrettably low and paired with the low participant confidence at the end of the session. This indicates a major barrier for the success of an EnMS at these organizations. Considering the complexity of creating linear regression models and the low number of participants willing to use them, even after receiving training, more in-depth training, and guidance for creating valid linear regression models could increase their utilization in future EnMS. Although the overall participant confidence increased for the last two sessions, the participants never regained their initial confidence. Looking at the specific responses rather than just the average score, after the first session, more participants responded with “Not Started” or “Getting Started” which increased until Session 4; then, it started going back down. By the end of the training, no participants responded that they were “Not Started” and fewer answered “Getting Started” (though many did answer with the “Silly Answer”). Instead, the category “Needs Work” increased, indicating that the training had started the participants toward creating their EnMS.
Overall, these findings indicate that most companies understood the importance of an effective energy management system but also understood that they had only just begun the journey of establishing their energy management systems and needed more assistance and resources in multiple areas. Developing training and guidance for the topics understanding energy use, collecting and analyzing energy performance data, optimizing equipment operational controls, creating action plans, and especially creating linear regression models could help increase the prevalence of industrial facilities with successful EnMS.
This matches the findings of previous work [
15], which found that the understanding of energy use, collecting, and analyzing energy performance data were indicated as challenges by about 25% of the case studies. Although the challenges of optimizing equipment operational controls, creating action plans, and using more advanced energy tracking methodology were not explicitly listed as major challenges in [
15], they could be caused by the “lack of in-house experts” in energy efficiency as identified in [
15]. Our findings showed that while most of the top management did not fully understand the required time and resources needed to develop successful energy management systems, they did understand the importance of energy management systems overall. Therefore, the “lack of on-going top management support” as identified in [
15] could be overcome by providing programs or guidance specifically targeting corporate management, with details on what is needed to create a successful program.
7. Conclusions
The Better Plants program held a virtual training series on the implementation of EnMS using 50001 Ready for its partners to increase the implementation of EnMS by US industrial facilities. Of those who participated, 65% gave a rating of 5, indicating that the training was excellent and that they would apply most of the content; the remaining 35% gave a rating of 4, indicating that the training was “very good” and that they would apply some of the content. After the training, five companies joined the 50001 Ready Implementation Cohort to continue receiving aid in their goal of completing the 25 tasks of the 50001 Ready Navigator. Although this is only a small number of the participating companies (five out of 28), this could have been influenced by several of the participants’ concerns about the lack of support from their management teams. Even though few companies were continuing with the cohort, about 62% (16 out of 26) of the participants responded that they were “working with Better Plants and ready to engage more with 50001 Ready”; however, only one “had plans to pursue Superior Energy Performance at one or more sites.”
The survey data showed that although many companies understand the importance of an effective EnMS, about half of them do not understand the required resources for building EnMS, and most of them have only just begun establishing these systems.
Several barriers to the implementation of successful EnMS were identified via polls during the VINPLT sessions as well as areas in which additional training and guidance could help improve participants’ understanding and confidence and thus the completion of successful energy management programs: (1) inadequate assistance on tasks in the Planning, Operation, and Performance Evaluation sections. More assistance in this area could help participants obtain a better foundation for completing these more complex, but also critical, energy management tasks; (2) lack of training on developing valid linear regression models for more accurate energy performance tracking; (3) inadequate resources targeted at improving corporate management’s understanding of the time and resources needed to build an EnMS as well as the benefits. More assistance could also help those who begin to create an EnMS obtain the buy-in and needed resources from management and finish the work; (4) lack of assistance for understanding energy use, collecting, and analyzing energy performance data, optimizing equipment operational controls, and creating action plans. More technical support in this area can help create action items for energy efficiency improvement.
It is worth noting that all the survey participants were US DOE Better Plants partners, who overall had more experience in energy management than typical manufacturers. Therefore, typical US and international manufacturers might face different or more barriers and challenges than identified in this study. Future studies will be valuable to include manufacturers with more diverse background in energy management.
8. Future Work
The US DOE Better Plants program has planned to follow up with the VINPLT participants about their status on the 25 tasks in about one year, to identify needed assistance on completing these tasks and establishing their own energy management systems, and to understand the reasons behind some observations and conclusions. The findings will be incorporated into future 50001 Ready VINPLTs for improvement.


 ,
, 


