
Global Advancement of Nanofluid-Based Sheet and Tube Collectors for a Photovoltaic Thermal System


1
Higher Institution Centre of Excellence (HICoE), UM Power Energy Dedicated Advanced Centre (UMPEDAC), Level 4, Wisma R&D, University of Malaya, Jalan Pantai Baharu, Kuala Lumpur 59990, Malaysia
2
Institute for Advanced Studies, University of Malaya, Kuala Lumpur 50603, Malaysia
*
Author to whom correspondence should be addressed.
Energies 2022, 15(15), 5667; https://doi.org/10.3390/en15155667
Submission received: 8 June 2022
/
Revised: 13 July 2022
/
Accepted: 14 July 2022
/
Published: 4 August 2022
(This article belongs to the Section A2: Solar Energy and Photovoltaic Systems)
Abstract
:The photovoltaic thermal (PVT) system was initially developed by attaching a simple sheet and tube thermal collector to the PV panel to improve cell performance while producing heat energy. The collector designs and heat transfer fluid are the main focus of PVT research, with the sheet and tube collector being the direct reference, and nanofluid being the promised working fluid. This study intends to review the development of the sheet and tube PVT (ST-PVT) system reported by researchers in the literature by searching and selecting quality literature from reputable academic databases guided by set criteria to maintain the consistency and validity of the literature selection. The findings indicate that the ST-PVT system with no glazing and a serpentine collector offers the most desirable thermal and electrical performance. It is also learned that CuO/water nanofluid enhances ST-PVT overall efficiency at a higher rate. However, it is observed that nanofluid required more pumping power, up to 67% for 0.4 wt% SiO2/water concentration compared to water. Also, many ST-PVT studies are only in the numerical modeling stage, while the negative impact of nanofluids is still rarely discussed in the literature. Thus, more research is required to prove the advantages of the ST-PVT system, especially in collector design and nanofluid application.
1. Introduction
The photovoltaic thermal (PVT) system is a further development of solar energy utilization technology that combines photovoltaic (PV) technology with solar thermal collectors. PV technology converts light radiation from the sun into electrical power, while a thermal collector utilizes heat from sunlight for domestic heating and other purposes. The essence of PVT systems lies in their collector, which absorbs heat from the PV cell to maintain its temperature and deliver heat for different process needs. PVT systems also prevent overheating in the PV cells [1]. A PV module can only convert 4–17% of the incoming solar radiation into electricity [2]. The rest is reflected, dissipated to the environment, and converted into heat, which causes the PV temperature to rise. Still, the rising temperature reduces its performance further [3]. Therefore, many studies on the PVT system have focused on the performance of thermal collectors to maintain the PV temperature and maximize thermal efficiency.
The PVT system has been studied since the 1970s mainly to overcome the limited space on building rooftops for installing PV modules and solar water heaters (SWH) separately. Early research on PVT systems used a flat-plate thermal collector attached to the PV back cover to reduce its temperature, as studied by Wolf [4]. He researched the performance of PVT systems with water-cooled flat-plate thermal collectors in a closed-loop circulation of a residential building. He observed that PVT performance could be maximized with good temperature regulation of PV cells and optimal heat use from the collector, so there is no need to waste heat on the environment. In similar research, Kern and Russell [5] proved that the flat-plate thermal collectors in a PVT system could produce higher energy for each unit area, namely, electrical and thermal energy. Raghuraman and Hendrie [6] further explored liquid and air PVT systems and found that the bond of the collector plate to the PV cell layer dramatically determines the amount of heat transferred.
Since these initial studies, new designs for thermal collectors have been extensively studied and experimented with two primary fluids as the heat transfer fluid (HTF): air and water. Until recently, further research on thermal collectors utilizing these fluids has been carried out, with water-based thermal collectors found to be superior in heat absorption and thermal efficiency to air [7]. Accordingly, research on liquid-based thermal collectors dominates the literature and is now the most commercially available PVT system. Nevertheless, other fluids were also investigated, including glycerol, synthetic oil, refrigerant, nanofluids, and other fluids with high thermal conductivity. The HTF performance generally depends on the mass flow rate to cool the PV cells for better PVT performance; the faster the flow rate, the better the heat transfer. However, if the flow rate of this HTF exceeds the critical flow rate, the thermal efficiency will decrease due to less time in heat absorption, due to the flow being too fast [8].
In terms of thermal collectors design, several designs have been studied for PVT applications, including flat-plate collectors (FPC), compound parabolic concentrators (CPC), and Fresnel lens concentrators. Aste et al. [9] learned that the most widely used PVT collector is the FPC with sheet and tube arrangement. An FPC features a metal plate with high thermal conductivity attached to the back layer of the PV panel. The metal plate absorbs heat from the PV cells and then transfers it to the HTF through channels or tubes (metal pipes), a flat-plate thermal collector unit. Thus, the FPC performance depends on several aspects such as material type, attachment method, fluid type, and fluid flow velocity.
Many literature reviews have been carried out to discuss the development of PVT systems, as shown in Table 1. Besides FPC-PVT, other thermal collectors’ applications that have been reviewed include parabolic PVT and concentrated PVT. However, none of the reviews are specific to sheet and tube thermal collectors, considering this is the initial design of a PVT system. Still, the ST-PVT arrangement remains a primary reference or a comparison for PVT studies. Therefore, this paper intends to review recent research on various aspects of the application of nanofluid-based sheet and tube collectors in the PVT system.
This paper analyzes several parameters that have been discussed in the research literature on PVT development, especially with sheet and tube designs. The first part of this study elaborates on the background of PVT design, such as its application, performance compared to other collectors, economic level, and designs already available in the market. Next, the authors review the selection of collector configuration and its development in concept or field experiments. This study also examines how these designs are developed by modeling, material selection, and installation techniques. Subsequently, the authors focus on the utilization of nanofluid in the PVT system. Lastly, the discoveries and directions for future thermal collector research are discussed and summarized.
2. Methodology
The use of thermal collectors with sheet and tube configurations has existed since the initial research on PVT systems. However, no paper explicitly reviews this type of collector concerning the PVT systems. Hence, this study attempts to acknowledge several questions to be answered. First, what aspects should be considered by researchers in developing PVT systems using these collectors? Second, what designs have been examined, and how did PVT systems perform using these configurations? Third, what process was carried out by the researcher in developing the sheet and tube collector as a continuous improvement upon previous research? Fourth, what additional equipment or materials are used to maximize PVT performance with sheet and tube collectors? Finally, what is the level of performance of nanofluids in PVT systems? Thus, this work reviews published papers discussing PVT systems, primarily focusing on those utilizing sheet and tube absorbers to answer these questions.
This study is a narrative review that identifies previous studies with the principles of searching the literature, identifying keywords, reviewing abstracts and articles, and documenting the results [36]. The keywords of the research questions above were searched mainly in the Scopus and Web of Science databases with the help of Publish or Perish software to select and analyze academic papers with the primary consideration of citation metrics, total citations, and h-index [37]. An example of the direct searching result of published articles using the keyword “PVT photovoltaic thermal” from Scopus and Web of Science databases is shown in Figure 1. The literature is determined based on the most matches with the keywords, the number of citations, the journal, and finally, the year of publication. An additional search on Google Scholar was also conducted occasionally to answer the critical questions completely. The use of the specific sheet and tube term to identify PVT systems is not frequent, so it is necessary to examine all selected literature and then eliminate inconsistent results by reading the detailed experimental setup or the illustrations shown.
Nevertheless, this study identified two main limitations of a narrative review: the objectivity of the researcher and dependence on self-claimed evidence [38]. Six steps were carried out in this work to maintain the consistency and validity of the literature used, i.e., formulating the problem, searching for existing literature, screening for inclusion, assessing the quality of data sources, extracting data, and synthesizing data [39]. Also, from the initial search results, this study applies five criteria to guide literature selection and minimize bias in the conclusion: peer-reviewed journal articles or reports from a reputable institution, available as full text, published in English, empirical articles or literature reviews, and describing the ST-PVT system or its aspects.
Therefore, the sequence of the steps carried out in this study begins with searching the scientific literature from the database to identify relevant studies. Subsequently, the authors determine keywords to narrow the search for more specific articles with a combination of several keywords to ensure relevant search results. In the next step, papers are reviewed to find the answer to the investigation subject by synthesizing the research results that have been done previously. Finally, the authors summarize and synthesize the findings from the literature, integrate the findings from the reviewed papers into this study, and answer the research questions.
3. PVT Development Features
The PVT system has been studied and developed into commercial products that have continuously improved for better performance for nearly five decades. Fundamental theory and several design concepts have been offered since the first decade of research, followed by cost-performance evaluation and design improvements in the next decade [1]. PVT development was also studied with an application-oriented design focus, such as building-integrated PVT system. Furthermore, in the third decade, mathematical modeling with the help of software and computational fluid dynamics (CFD) began to emerge. However, not many PVT designs and experiments have proven their feasibility until recently. Flat-plate collectors are the most studied because of their ease of application, such as for integrated buildings, practical application, and easy modification from existing PV modules [32].
A PVT system is generally designed in such a way for some specific purpose for which it will be used. Nevertheless, the performance of various existing PVT systems has also been continuously studied along with the recent advancement of PV technology and thermal collectors. Moreover, with the commercial availability of PVT modules, affordability is also the focus of the newly emerging PVT industry in product development. This chapter illustrates some of the parameters that form the background for designing thermal collectors for PVT systems.
3.1. Performance Aspect
PVT systems improve the performance of photovoltaics in generating electricity while also providing thermal energy. The HTF lowers the PV panel temperature so that its electricity conversion efficiency is higher than the stand-alone PV module. Herrando et al. [40] found that PVT can save up to 16.0 tonnes of CO2 over a 20-year lifetime compared to 11.8 tonnes of CO2 saved with PV systems. Moreover, FPC is the most popular collector for low-temperature heat utilization for water heaters and PVT [12,34]. FPC is usually used at low operating temperatures below 60 °C and medium temperatures between 60–100 °C. The features of FPC in the PVT systems, as shown in Figure 2, are the following:
- A flat metal plate is mounted behind the Tedlar (the back sheet layer of the PV panel) to capture heat from PV cells, usually made of aluminum or copper plate. To avoid heat being trapped between the Tedlar and the flat plate, thermal paste or thermal grease is added.
- The fluid flowline is attached to metal plates in the form of channels, passages, or tubes. The fluid flowing in this channel transfers thermal energy from the collector to a tank or other location for different process requirements.
- Insulation material is commonly attached to cover the fluid flowline to keep heat wasted on the environment. This insulation can be foam, glass wool, or other materials with low conductivity.
Figure 2.
A typical arrangement of the ST-PVT System.

In addition to these main features, PVT-FPC is sometimes also equipped with other components to increase performance as follows:
- PCM installed between the fluid channels or pipes serves to store heat from the flat plate. PCM has been proven to keep additional heat for later use and improve PVT performance where the PV cell is maintained at a low temperature for longer.
3.1.1. Electrical Performance
Electrical efficiency is one criterion of the ST-PVT system’s performance. However, most of the research on PVT systems focuses excessively on the thermal aspect [42]. The thermal absorber addition commonly induces a significant increase in thermal efficiency, but a low increase in electrical efficiency. Bhattarai et al. [43] observed that PVT systems were 16% more energy-efficient than conventional solar collectors and could generate electricity with 13.69% efficiency. They also found that the insignificant improvement in electrical efficiency is because of the increasing water temperature. The high fluid temperature and high solar radiation could lower the heat conduction coefficient to decrease overall efficiency. Another factor that affects PVT performance is the use of auxiliary devices. PVT systems need supporting equipment such as pumps, control systems, or additional heaters for optimal performance. However, additional devices would reduce the PVT system’s overall power generation capacity.
Improving the thermal conductivity of the thermal absorber is one way to enhance the electrical performance of a PVT system. The heat will be directly transferred to the HTF, and the temperature of the PV cell can be maintained at a lower level. A mathematical model of an ST-PVT system with glazing has been carried out by Rejeb et al. [44] to evaluate PVT’s thermal and electrical performance. They found agreement with the study of Bhattarai et al. [43] that an increase in the packing factor and heat conduction coefficient between the absorber plate and the PV cell increases the PVT electrical efficiency.
Another method to improve PVT overall performance is to set the optimal air gap arrangements in glazed PV panels. In their experiments in Zhuhai, China, Lu et al. [45] learned that providing a 20 mm-wide air gap between the glass and the top EVA layer resulted in the highest overall efficiency due to the high thermal efficiency. However, if the air gap layer is removed, the resulting electrical efficiency is the highest among other arrangements. Moreover, single glazing is suitable for accommodating a balanced thermal and electrical efficiency. Still, PVT without glazing is proven to produce the best electrical performance, is more economical, and has the fastest payback period [46].
3.1.2. Thermal Performance
The performance of sheet and tube thermal collectors for application in PVT systems has been proven to increase the electrical efficiency of PV panels, albeit the thermal efficiency of this system may be lower than that of a dedicated SWH [47]. The performance of the PVT collector may be lower due to the less than optimal exposure to sunlight caused by the obstruction of the PV cell and the limitation of the optimal temperature for PV cells. Santbergen et al. [48] conducted a comparative study between conventional solar collectors and sheet and tube PVT glazing systems. They concluded that the thermal efficiency of the PVT system is about 15% lower than that of the solar collector. The thermal efficiency drops due to the high emissivity of the PV cell. Bhattarai et al. [43] also prove that conventional solar thermal collectors provide better thermal efficiency with 71.5% compared to 58.7% produced by PVT systems. Nevertheless, in terms of space-saving and increasing electrical efficiency from PV cells, a PVT system is better than a separated PV panel and solar thermal collectors [49].
The PVT system with additional glazing is an innovation to maximize heat absorption and reduce top convection losses. Glazing with an air gap is also effective in enhancing PVT systems’ thermal performance. The air gap works by retaining heat in the stagnant air or gas layer between the collector and the glass without blocking light from entering the PV cells. The glazing should reduce conduction and radiation losses from the thermal collector to improve heat absorption [8]. Thus, the thermal performance of glazed ST-PVT is commonly higher than unglazed PVT. Nevertheless, the complexity of the installation compared to the benefits received remains to be studied, especially for long-term use. Zondag [10] suggested that future studies should focus more on adding glass to the PVT collector and the long-term performance of PVT systems individually or in a group.
Adding glass increases thermal but not electrical efficiency because of the optical loss on the top of the glass [50]. Also, as the temperature of the PV panel increases, the electrical performance of this type of PVT system decreases and is generally lower than that of the unglazed collector. Herrando et al. [40] recommended sheet and tube PVT collectors with single glazing for domestic installation as they provide balanced thermal and electrical output at a reasonable cost. In an experiment in London, England, they found that ST-PVT with glazing could supply 51% of the total electricity demand and 36% of the entire hot water demand for a year with a flow rate of 20 L/h. They also noticed that glazed PVT supplies slightly more electricity than PV-only systems.
Besides the correct glazing mode, the PVT performance is influenced by the geometry and size of the drains, the water flow speed and temperature, the PV type, and the appropriate weather [17]. Thus, two ways to improve the performance of the PVT system are changing the absorber design to create turbulence in the tube flow and adding nanomaterials to increase thermal efficiency [34]. The insulation on the back of the system also affects the PVT system’s thermal efficiency, despite mainly being affected by the thermal contact between the PV and the thermal collector [51]. Hence, increasing the thermal performance can also be done by increasing the contact of the absorber with the PV cell. In the case of sheet and tube collectors, this means increasing the number of tubes to be more tightly packed [52,53]. However, increasing the number of tubes would increase costs and lead to more extended payback periods. Lastly, the connection between PVT systems can also reduce performance in group PVT installations. Series connections are not recommended because the electrical efficiency decreases with increasing inlet temperature [18]. Conversely, a parallel connection is advised to obtain higher thermal energy and increased electrical efficiency.
3.2. Application Aspect
Generally, the PVT system is designed according to the application, such as domestic hot water systems, greenhouses, heat pumps, or water desalination. The PVT-FPC is usually used for residential and commercial use because of its simple mechanical structure [12]. Residential buildings for one or several households became the focus of recent PVT development due to their limited installation area and investment. In addition, PVT systems to provide electricity and heat for residential buildings, as well as offices, hotels, and hospitals, are effective operationally and financially [54].
3.2.1. Domestic Application
The use of PVT systems with sheet and tube collectors for domestic or small scale use usually prioritizes affordable prices and availability in the market. The PVT system is better for domestic hot water production because it generates electricity for the pump despite its slightly lower thermal performance than the dedicated solar water heater [40]. ST-PVT also has good thermal efficiency and is simple, inexpensive, and easy to integrate with standard PV panels without significant modifications [55]. Although ST-PVT may have no better heat transfer than PVT with a flat box thermal collector, it is easier to manufacture and withstands high water pressures [56]. Channeled collectors also have a more complex working difficulty.
On the other hand, although metal sheet and tube collectors generally perform better, roll bond collectors tend to be less expensive because they can be easily mass-produced. Roll bond collectors made from aluminum or fiber are also widely available for small-scale or domestic use. Bombarda et al. [57] tested two PVT systems with roll bond type collectors in residential buildings compared to the more popular sheet and tube collectors in Milano, Italy. They found that the roll bond design resulted in an 8% higher thermal efficiency than sheet and tube collectors but with a slight difference in electrical efficiency of about 0.6%. Also, Kim and Kim [58] observed that PVT with channeled collectors could deliver higher efficiencies of 70% for thermal and 15% for electrical, or 4% and 1% higher than ST-PVT.
In contrast, Dubey and Tay [59] found that sheet and tube collectors performed slightly better than a parallel-plates flow channel PVT with 40.7% thermal efficiency and 11.8% electrical efficiency. Again, a study by Aste et al. [60] on roll bond thermal collectors made of aluminum resulted in an electrical efficiency of 13.2%, slightly lower than the conventional PV module electrical efficiency of 13.4%. They also observed that this PVT system could produce a thermal efficiency of 28.8%. Therefore, ST-PVT is more recommended because it could be superior in simplicity and installation cost for domestic usage.
3.2.2. Building-Integrated
A building-integrated photovoltaic thermal (BIPVT) system is designed and modified to obtain the advantages of electrical and thermal energy without a separate installation for the specific application of a PVT system on the building. The BIPVT system is a PVT system that becomes a unit within the building structure, initially studied for building-integrated photovoltaics [61,62]. Most of the BIPVT system is a modification of the roof, while only about one-third is a modification of a facade attached to the building walls [63]. BIPVT systems with sheet and tube thermal collectors are show promise for a future renewable energy trend, but face many challenges. Because of high installation costs, several early studies have focused on applying BIPVT systems only for commercial buildings and only recently have studied their application for family residences. Further, Maghrabie et al. [64] have reviewed the development of BIPVT technology over the last decade with the conclusion that the complexity of the system and the high investment cost are still significant challenges that limit its use only to commercial buildings. The BIPVT application is also limited, and its performance depends on the weather conditions and the thermal absorber design [35].
In terms of thermal collectors, several types of collectors have been studied in the BIPVT system. Ibrahim et al. [65] tested the flat plate collector BIPVT system utilizing a spiral flow absorber from a rectangular stainless steel pipe based on Malaysia’s meteorological condition. They found that this system could produce an average electrical efficiency of 10.8%, a thermal efficiency of 48%, and a combined PVT efficiency of 59%. Yin et al. [66] propose a BIPVT design with the concept of a multifunctional roofing system, as shown in Figure 3. This system consists of a transparent protective layer, a silicon PV module, and a functionally graded material (FGM) layer containing heat-conducting aluminum, high-density polyethylene insulation, and water tubes. This system was advantageous because the PV modules operate at lower temperatures due to water cooling in summer. In addition, the temperature in the house becomes cooler because heat is absorbed by water, so that electricity consumption for cooling is reduced.
Furthermore, a BIPVT system for roof installation could utilize existing roofing materials like light steel or aluminum sheets. Anderson et al. [67] found that this system would save costs because it uses the current roof sheets, so there is no double cost for roof and PVT systems. The integration of PVT on the building also provides good insulation on the back of the panel. Thus, heat loss can be prevented when the PVT is integrated with the roof [51]. Additionally, facade BIPVT installation has also shown good prospects for ST-PVT application. Piratheepan and Anderson [68] tested the BIPVT facade on a building wall in the subtropical climate of Auckland with additional glazing and reflectors to increase the amount of light entering the PV cell. Cooling tubes fed with cold water are installed in the back of the PV panel layer attached to the absorber plate.
BIPVT technology offers many benefits that encourage its utilization in the future, but more study is needed to enhance its performance while lowering the installation cost. The BIPVT system should have a similar abilities as stand-alone PVT systems while improving the overall PV performance. BIPVT with sheet and tube collector could also effectively provide hot water and integrate with the house ventilation system. This dual working fluid BIPVT efficiency could increase with better thermal contact between the solar cell and the absorber [68]. In addition to the water, the primary purpose of the airflow is to cool down the PV further because increasing PV temperature could decrease electricity production [8,69]. The most apparent trade-off for this system is improved PVT efficiency versus increased investment. Hence, like other renewable energy issues, the role of the government in supporting it with consistent regulations is very much needed for the future of BIPVT technology.
3.2.3. Desalination
The potential of ST-PVT for desalination in remote areas outside electrical grid coverage, such as remote islands, is enormous. The co-generation model to simultaneously produce clean water and electricity has previously been studied utilizing PV panels. This model has further advanced to tri-generation with the addition of hot water production. The desalination technology powered by a PVT system could provide the electricity and heat needed. The electricity generated by PVT provides power for pumps, electric heaters, and other supporting equipment. Then, the hot water can be used to preheat saline water, heat brine to reduce its viscosity, and heat water to be evaporated in a concentrator. Alqaed et al. [70] calculated that the energy supplied by the PVT system is optimal at around 70%, with the remaining 30% from the grid and battery to provide power continuously.
PVT integration is beneficial for any desalination process, with the two most promising types being humidification-dehumidification (PVT-HDH) and reverse osmosis (PVT-RO) systems. The PVT-HDH can produce more electricity even though the water capacity is less and a more expensive investment [71]. To prove the PVT-HDH, Gabrielli et al. [72] mathematically modeled PVT-HDH with the help of commercial software Aspen Plus® for co-generation in electricity and clean water. They realized that PVT as an energy source is the most cost-optimal solution applied to areas with high electricity prices. Ambient conditions with good sunlight and the larger scale PVT-HDH construction could reduce the cost of clean water produced.
On the other hand, the main focus of PVT-RO integration is the salinity level of the feed. The PVT can reduce the feed density by raising its temperature so that the RO system works efficiently and reduces the overall system cost to produce affordable clean water. Ammous and Chaabene [73] modeled PVT-RO using LabVIEW software to determine the effect of heating feed water for process efficiency. They learned that the performance of PVT, electrical and thermal, was affected by the rate of water flow into the PVT system as this flow rate affected the quality and quantity of output of the RO system. Alqaed et al. [70] found that a PVT-RO desalination system could reduce costs up to 18% lower than conventional power sources and significantly reduce CO2 pollution. The flat-plate PVT collector rule in the RO system mainly provides electricity for the pump. Still, they also provide heat to preheat the feed water, reducing its viscosity and lowering the pump load.
3.3. Economic Aspect
Economic analysis for the PVT systems is still rarely found in the literature despite this being a sensitive issue when PVT enters the market. Studies focusing on the financial aspect of the PVT system are still limited, albeit this is very important to attract consumers, investors, and decision-makers [42]. From the application point of view, BIPVT technology offers an attractive solution for limited PVT installation areas with direct integration into the building structure, promising space savings and investment costs [11]. However, a techno-economic study for each design and specific location should also be carried out independently to give better calculation results based on these variables.
Furthermore, additional costs must be considered with enhanced HTF or thermal storage. The use of nanofluids and PCM in PVT systems might improve their performance but may not be economically satisfactory compared to the benefits gained. A study by Hosseinzadeh et al. [74] for a cost analysis of a PVT system in Malaysian weather with the addition of PCM found that in the long term, the PVT-PCM system provides benefits of US$ 779.48 after the fourth year of use. Also, the cost of building a PVT-PCM system requires almost three times the investment than PV-only, although it may be more economical in the long run. In agreement with this, Hossain et al. [75] learned that the cost-benefit would be positive in four years. Hence, the PVT-PCM system should be planned for more extended periods of use to get more benefits.
Several ways to make the PVT system more economically profitable are a more straightforward design of thermal collectors, cheaper materials, and mass production. However, the stakeholders should support these approaches to ensure the consumer receives all the benefits with low investment and a faster payback period. Lu et al. [45] found that currently available PVT systems have a payback period of 2.4 to 3.03 years, depending on the arrangement, better than the independent solar thermal collector system, with a payback period of 3.7 years.
3.4. Existing Trends
The PVT system has been on the market for more than a decade despite not being very significant compared to PV development. A survey of 36 PVT manufacturers and suppliers from 14 countries by Weiss and Dür [76] in 2020 shows that the current PVT capacity is around 944 MW, 712 MW for thermal, and 232 MW for electricity. More than half of PVT systems are installed in Europe, with France being the most and 35% in Asia, mainly installed in China. Of this amount, 60% of the installation area of 1,275,431 m2 uses a water collector without glazing, and 37% uses an air-collector PVT. About a third of the existing PVT systems are used to supply electricity and hot water to households. Figure 4 shows the proportion of PVT applications.
Various PVT products are available as thermal collectors for PV panels or installation packages. There is also the choice of a complete PVT module in one product or a separate thermal collector to be attached to the PV module individually. Flat plate collectors with sheet and tube configurations are still widely produced, with roll-bond collectors next in line. Other designs such as concentrated PVT and evacuated tubes are also available, although limited. Table 2 shows various PVT products available in markets with European and Chinese dominance.
4. Collector Design
The PVT system was developed to overcome two main problems: the limited space for the simultaneous installation of PV panels and water heaters and to maintain the PV cell’s efficiency so that it does not decrease because of the increase in temperature. Researchers have conducted various experiments with different tube configurations in the thermal collector to achieve these two goals without sacrificing economics. Aside from external influences such as solar radiation, ST-PVT characteristics are influenced by internal parameters such as tube materials and configuration [49].
ST-PVT has been developed for more than four decades, so many designs have been studied and experimented with. Still, the design and fabrication of PVT thermal absorbers are indispensable research in addition to materials and coatings [15]. The Sheet and tube collector is the most common flat plate PVT collector in two configurations: harp and serpentine. However, many techniques have also been introduced in the literature, such as a double serpentine and spiral tube. Table 3 summarizes the research and experiments that utilize sheet and tube collectors as heat traps for PVT systems.
As shown in Table 3, the three primary sheet and tube thermal collectors’ arrangements for the PVT system studied are serpentine, harp, and spiral. Thus, this sub-chapter reveals to what extent research on these three main configurations has conducted.
4.1. Serpentine
Sheet and tube thermal collectors with serpentine configurations make up the primary subject of early research on PVT systems. This configuration offers many advantages, such as simplicity, minimum pressure drops, and easy adjustment to the PV panel shape. Low-pressure loss of the fluid passing through the collector tubes means reducing the need for pump pressure and utilizing less power. Lari and Sahin [100] observed that the serpentine collector design in a PVT system increases the electrical output by 8.5% compared to a PV system with no cooling. Shahsavar [101] studied a modified sinusoidal serpentine collector to compare it with a standard serpentine design, as shown in Figure 5. He found this design change to increase the thermal efficiency by up to 30.63% and electrical efficiency by up to 2.32% more than PVT with a plain serpentine collector. These findings show that serpentine collectors produce high thermal performance but minor electrical efficiency enhancement, in line with the results tabulated in Table 3.
Another study on serpentine ST-PVT was carried out by Gupta et al. [102]. They analyzed numerically a glazed PVT system combined with thermoelectric using weather data from Pune, India. They found that the serpentine collectors could increase overall electrical efficiency by 8.4% and overall thermal efficiency by 14.8%. Another modified serpentine ST-PVT collector was also investigated by Hossain et al. [75], as shown in Figure 6. A two-side serpentine tube collector for PVT is tested in outdoor Malaysian peninsular weather. An 0.5-inch copper tube was designed to bend to fill the plate area with a distance between tubes of not less than 10 cm, and the distance between the parallel two sides is 17.78 cm. They observed that this configuration has an average electrical efficiency of 11.08% and thermal efficiency of 87.72%.
The modified serpentine tube enhances the standard design’s performance, which holds HTF longer in the collector by rerouting the tube path. However, the drawback of standard configuration as uneven temperature distribution where the location near the water inlet has a lower temperature is still exist. In contrast, modified designs require more capital which might not be economical. Another drawback is that the area near the water outlet has a higher temperature because of its smaller water flow and wider temperature distribution [103]. Thus, this design is proposed to investigate further with an additional inlet port. Also, standard serpentine design should be the main design developed for ST-PVT in the future.
4.2. Harp
The harp design (parallel tubes) is the next most popular configuration in ST-PVT, following the trend of its application in solar water heating systems. Sheet and tube thermal collectors with this configuration are believed to have better temperature distribution due to more water inlets. However, multiple tubes mean many bends or junctions in the collector, so the pressure drop is also high. With a similar water flow rate, harp configurations make PV cells lower in temperature and more uniform temperature distribution than serpentine collectors [103].
An ST-PVT system with a harp design with natural circulation water was investigated by He et al. [56], as shown in Figure 7a. The thermal absorber comprises seven parallel copper tubes attached to an aluminum plate with two risers on the top and bottom of the absorber for cooling water inlet and outlet. They found that this system produced an average of 40% thermal efficiency, or about 75% of the performance of traditional solar thermosiphon systems. It also delivers about 10% electrical efficiency, slightly lower than PV modules without thermal absorbers. They suspect that the extra thermal resistance of the extra aluminum absorber plate and an adhesive layer reduce the heat received by the water in the copper tube.
Similarly, Nualboonrueng et al. [50] numerically investigated the ST-PVT system with three types of PV panels–a-Si, mc-Si, and c-Si–to meet the typical consumption of a medium-sized house in Bangkok, Thailand, as shown in Figure 7b. The PV panels were coated with glass on the top surface and a Tedlar layer on the back. The tedlar then glued to the collector metal plate with thermal epoxy. Copper tubes with a harp design are attached under the plate and then covered with rock wool insulation. This system was optimized at a cooling water rate of 20 kg/h with a maximum thermal efficiency of 46.8%. Thus, this system could also be used in thermosiphon mode with the fastest payback period of 6.4 years.
The harp design provides lower performance than the serpentine collector. Although the flow is predicted to be more even, the heat transferability is reduced by other factors, such as difficulty in getting good contact with the absorber plate. As shown in Figure 8, a modification of harp design was studied by El Hocine et al. [104] on three configurations: parallel vertical (harp), absorber enclosure, and a combination of the two connected in series,. They found that this configuration resulted in an electrical efficiency of 12.7% and a thermal efficiency of 36.32%. The results of this modification are improving, while it is still low compared to serpentine collectors. Therefore, future research on this design should focus on maximizing the thermal contact with the PV cells.
4.3. Spiral
Like the serpentine, the spiral configuration relies on a low-pressure drop as an advantage. The fluid input port is usually placed outside the collector, while the output port is in the middle of the collector. Many studies have proven that this configuration produces better performance than other configurations such as harp and serpentine. A performance study of a PVT system with a spiral-shaped collector was also carried out by Senthilraja et al. [105] in Chennai, India, as shown in Figure 9. They observed that this configuration could reduce the PV module temperature by 20.01% and increase its electrical efficiency by up to 8.5% at a water flow rate of 0.011 kg/s. In Algeria, Boumaaraf et al. [99] learned that this configuration could increase the electrical efficiency from 7.93–9.65%, and the thermal efficiency reaches 74.3%.
An example of a spiral design application study is the PV cooling experiment by Bhattacharjee et al. [106]. They experimented in Agartala, India on cooling back surface PV panels with three heat pipe designs, as shown in Figure 10. These designs are semioval serpentine, circular spiral, and circular spiral-shaped semi-flattened. These three types of pipes are attached to the back surface with the help of pressing with bamboo sticks to ensure the pipes stick tightly so that heat transfer can be maximized. They use an automatic control valve to regulate the flow of cold water only when the saturation temperature is reached. They concluded that the circular spiral-shaped semi-flattened copper pipe provided the best cooling for PV. This design increases the PV efficiency, voltage, power, and fill factor by 4.32%, 1.26%, 16.77%, and 19.8%, respectively.
Furthermore, an experiment on a spiral rectangular tube absorber was conducted by Razali et al. [107]. However, it was observed that the sharp-angle of this rectangular tube creates a significant pressure loss so that the maximum increase in power is obtained at a mass flow rate of 0.0255 kg/s. They also concluded that the addition of 0.1 wt% nanofluids to this spiral PVT slightly increased the electrical efficiency of the PV module but not significantly.
Although it has not been widely applied in PVT systems, the spiral design has been tested on solar thermal collectors as a reference. For instance, Verma et al. [41] experimented with a flat plate solar heat collector with a spiral design to compare it with the conventional harp design, as shown in Figure 11. They found that this design increased the thermal efficiency by up to 21.45% compared to the harp design at a mass flow rate of 0.026 kg/s. They also learned this design has a lower pressure drop and uses up to 30% more efficient materials, reducing manufacturing costs.
A spiral tube collector is not yet available on the market, so researchers usually modify the PV module attached to the collector. The tube is generally made of copper pipe shaped to spiral and then bonded to a copper plate using the brazing technique or laser welding. The tubes usually utilize a 0.5 inch diameter copper pipe, while the plate commonly uses a 5 mm thick copper or aluminum plate. The performance improvement result of this design encourages more experiments to be conducted in the future.
4.4. Other Design
In addition to the three popular configurations, many studies modify the tube diameter and path to optimize heat absorption in the collector. The comparison of three thermal absorber designs, namely web-flow, direct flow, and spiral flow, using stainless steel tubes, was investigated by Fudholi et al. [8], as shown in Figure 12. In their laboratory testing with artificial solar radiation, the spiral configuration produces the highest performance, namely 13% electrical efficiency and 52% thermal efficiency at a mass flow rate of 0.041 kg/s and a solar radiation level of 800 W/m2. As indicated in the previous research, the performance of ST-PVT is influenced by the HTF flow rate. The HTF flow rate significantly affects the overall performance of the PVT, but the maximum efficiency is achieved if the flow is neither slow nor too fast [108].
In an analysis of the sheet and tube design, Herrando et al. [52] observed that the pipe diameter did not affect its thermal performance, but rather the number of tubes installed in each unit area increased the efficiency by up to 20–25 pipes. Hissouf et al. [53], in their research on the effect of tube design and HTF on PVT performance, also learned that more tubes mean more heat exchange surface area, so that the heat extracted is also higher, enhancing PVT thermal and electrical performance. Piratheepan and Anderson [68], in their experiment on facade BIPVT, found that increasing the flow rate of water provided only little benefit to collector efficiency. At the same time, the addition of cooling tubes has more apparent benefits in increasing efficiency but at a higher cost. Still, this finding might contrast with other studies that increasing HTF flowrate can enhance PVT performance [53,98]. Aside from the number of tubes, PVT efficiency is also affected by the collector design that directs the HTF flow evenly and minimizes pressure drop. Thus, these two factors of tube number and flow rate should be assessed before designing a new thermal collector.
5. Collector Development
5.1. Modelling
The development of research on PVT in the early 21st century carried out a lot of mathematical modeling using software assistance with or without field experiments. Modeling can tell researchers about possible experimental results with defined inputs so that the more accurate the information, the closer the actual result to the output. The more parameters entered, the more precise the outcome, but the more sophisticated the software and the price. Mathematical modeling often gives different results from the results of field experiments, primarily due to the lack of carefulness by researchers in selecting the variables that may be involved. In addition, uncontrollable factors can also affect the deviation between experimental and theoretical values, such as wind speed changes, air temperature fluctuations, and solar radiation blocked by dust or other impurities [104]. Another factor that affects the experimental results is the change in the sunlight angle. Finally, the practical effect might differ from the mathematical calculation because of the heat loss from the PVT part exposed to air due to radiation or convection.
The modeling results are often in agreement with the experimental results, both in a controlled environment such as a laboratory or in an open environment. Still, they can also show quite striking differences. Fayaz et al. [109], in their numerical test with COMSOL Multiphysics and an experimental PVT system with a novel thermal collector design, observed differences in thermal efficiency results of 81.24% numerically and 79.1% experimentally. Different results were also obtained for electrical efficiency improvement, namely 10.72 numerically and 12.25% experimentally. Also, the numerical and experimental results of overall efficiency are enhanced by 6.26% and 5.73%, respectively.
Some numerical studies have been carried out without field experiment confirmation. For example, Baranwal and Singhal [108] have modeled a PVT system with a spiral-shaped thermal collector with ANSYS 18.0 software utilizing a 25 mm diameter copper pipe. They found that the overall efficiency of PVT increased to a maximum of 53.66% at 800 W/m2 irradiation as the water flow rate increased. Another study by Nahar et al. [110] modeled a pancake (spiral) collector in three dimensions to determine its performance on a PVT system. They used COMSOL Multiphysics software for this numerical simulation with the help of mathematical equations for the validation of thermal and electrical models. They observed that the maximum electrical efficiency from this model was 12.9%, in perfect agreement with the reference model of 12.7% by Gutierrez-Miravete and Fontenault [111].
However, these modeling results should be experimentally proven to confirm their validity, because the assumption of a stable environment in the model can be misleading. Usama Siddiqui et al. [112], in a three-dimensional modeling study for PV panels, found that it is challenging to match variations in environmental temperature in actual experiments with modeling because the cell temperature is unstable and increases if the ambient temperature rises. They realized that in numerical modeling, temperature parameters could be varied easily. As a result, the electrical performance of the outdoor investigation decreases lower than the modeling, which assumes the cell temperature will be the same as the ambient temperature. Moreover, the change in cell temperature was slower in the experiment, so the overall efficiency tended to fall and did not match the numerical predictions [110].
5.2. Materials
The choice of material for sheet and tube collectors is usually based on their heat transfer performance, because the purpose of this collector is to absorb as much heat as possible. Copper is the most widely used material for tubes due to its availability in various shapes and sizes, and is easy to bend. As for sheets, aluminum plates are more commonly referenced in the literature, followed by copper plates. The modern PVT currently utilizes polymer as collector material because it is lighter and cheaper. However, although a thermal absorber from polymer is cheaper, Simón Allué et al. [113] observed that PVT with an aluminum absorber has a 62% efficiency. In comparison, PVT with a polymer absorber has an efficiency below 50%. Moreover, absorbers made of galvanized steel are lower in manufacturing costs than those made of copper [49,104].
A comparison of various designs and materials of PVT systems has been studied by Herrando et al. [52]. They designed 26 absorbers; 10 absorbers are sheet and tube with different aluminum and chopper materials with 6–10 mm diameter. The rest of the thermal collectors are flat box structures with variations in aluminum, copper, and polymer materials. They found no significant difference between copper and aluminum pipes in thermal performance, even though the latter had lower thermal conductivity. A similar finding was also reported by Nahar et al. [110] in their modeling to measure the performance of spiral collectors made of aluminum and copper with a variation of the inlet velocity, irradiation level, inlet, and ambient temperature, while other parameters were held constant. They noticed that these two materials gave almost the same performance, so it was recommended to choose a cheaper and lighter aluminum for the PVT collector.
Further, the performance of a specially designed collector from a stainless steel material was investigated by Al-Shamani et al. [114], as shown in Figure 13. They claimed that the initial cost of the absorber is only 2.9% of the total cost in this PVT system, while nanofluids take up 10.85% of the total cost. By testing SiO2, TiO2, and SiC nanofluids, they found that this ST-PVT collector works optimally with SiC nanofluids, producing a thermal efficiency of 81.73% and an electrical efficiency of 13.52% with a flow rate of 0.170 kg/s and a solar radiation level of 1000 W/m2. The results of this experiment are excellent and can be considered for future development. However, this experiment was conducted in an artificial environment, so the outdoor performance might be different. Also, the weight of the additional stainless steel may not be suitable for roof installation and will be challenging to maintain.
Additionally, with variations in the cooling fluid, the collector material must resist problems that may arise, such as corrosion and other chemical reactions in the fluid environment. This issue is essential to address for the long-term utilization of ST-PVT as important as the issue of material degradation in PV panels. Unfortunately, very limited research has focused on the effect of working fluid on the collector material, both in the PVT system and the solar water heater system. At the same time, there is still minimal discussion of nanofluid’s impact on the flow media and the environment, even in the general study of nanofluid utilization. Hence, further study on this issue is encouraged to comprehensively consider material selection for ST-PVT thermal collectors.
5.3. Lamination and Insulation Technique
Many of the studied PVT systems are modifications of the PV panels with the addition of thermal collectors. These studies often ignore the attachment technique between the PV panel’s back layer and the thermal collector. The common assumption is that the Tedlar is connected well to the collector, the heat is well conducted, and the heat loss is low so that it can be neglected. Tedlar is the outermost layer of PV modules that does not change when exposed to light because it is made of polyvinyl fluoride (PVF). Tedlar provides additional insulation as the EVA coating, while protecting the PV cells from moisture [104]. Thus, heat transfer from the PV cell to the absorber plate could be constrained by the presence of these layers, primarily if no additional adhesive is provided to help absorb heat.
The effect of gluing PV panels and thermal collectors using adhesive tape compared to a clamped collector without adhesive has been examined by Brötje et al. [115]. They analyzed the impact of an air gap between the thermal collector and the PV panel on PVT performance, especially using roll bond and sheet and tube collectors. They observed a strong influence of the air gap, mainly on thermal performance. They also realized that without using thermal paste or adhesives, the temperature of the PV cells tends to be higher, resulting in lower electrical efficiency. In contrast, a study by Leonforte et al. [116] found no need to use adhesive (thermo-conductive glue) with a direct lamination technique. The adhesive is resistant when exposed to high temperatures from the PV cell or the thermal absorber. Also, adhesive raises the risk of condensation between the two parts. There could also be air trapped when applying adhesive, decreasing the thermal exchange coefficient and causing uneven temperature distribution. In agreement with this, De Keizer et al. [51] discovered that the thermal paste is not necessarily the most cost-effective system solution in their research, comparing three types of PVT systems with and without adhesives. Thus, a PVT system without glue might improve PVT performance at a lower manufacturing cost.
Despite the debate on the importance of adhesive, the quality of attachment affects the overall PVT performance. If there is a medium to attach the two, it must be ensured that the thermal conductivity is high enough for the complete heat transfer from the PV cell to the absorber. Low-quality adhesives, air gaps, or non-adherence of the absorber evenly will increase the conductive heat coefficient between the PV module and the absorber. This poor contact will cause imperfect heat transfer and decrease the temperature gradient between the PV module and the absorber. Rejeb et al. [117] found that PVT systems with a simple adhesive (heat transfer coefficient 45 W/m2K) resulted in electrical and thermal efficiencies of 14.25% and 67%, respectively. In contrast, laminated PVT systems with advanced component encapsulation results in higher performance of 15.10% electrical and 71% thermal.
Additionally, heat insulation needs to be installed to prevent heat loss from the collector due to direct contact with outside air. Better insulation can prevent heat loss to reduce convective heat transfer, especially in windy environmental conditions [51]. Many kinds of insulation are widely available and commonly work well in PVT systems. Several materials that were used in the PVT research are asbestos [56], high-density polyethylene [66], rock wool [50], and polyethylene foam [118]. Additionally, the back of the PVT system could also be isolated using glass wool and then covered with an aluminum casing to minimize heat loss from the thermal absorber [99].
5.4. Phase Change Materials
The prominent role of phase change materials (PCM) in a PVT system is to store heat from the HTF long enough for night use or when there is not enough exposure to sunlight. Attaching PCM directly to the PV panel back layer also allows it to maintain lower temperatures for a longer time when the panel is exposed to sunlight. At a low temperature, the electrical efficiency of the PV cell will be maintained optimally. Hossain et al. [75] investigated the performance of a PVT system with different materials of PCM. They learned that PVT-PCM could produce a 14% higher maximum power and 4.72% higher electrical efficiency than PV panels. Rajoria et al. [35], in their study on BIPVT, also observed that the use of nanofluids and PCM can improve thermal performance, with thermal efficiency reaching 72% and overall efficiency as high as 85.7%. However, the initial cost for PVT-PCM was much higher, almost three times that of conventional PV systems [74]. Thus, the application of PCM in the ST-PVT system might not be economically feasible.
On the other hand, another study by Simón Allué et al. [113] found that PVT-PCM with an aluminum absorber resulted in slightly higher overall efficiency at 63% than reference PVT without PCM at 60%. They concluded that the addition of PCM did not directly impact increasing the PVT performance but increased the heat generation capacity by up to 30%, which can be used when sunlight is not available. In line with this finding, Fayaz et al. [119] investigated the application of paraffin PCM in water-cooled ST-PVT systems with solar irradiation variations with the average inlet water temperature at 32 °C and mass flow rate at 0.5 L/min, as shown in Figure 14. Their field experiments revealed the highest measured electrical efficiency differences were not significant between the PV, PVT, and PVT-PCM systems of 13.56%, 13.74%, and 13.87%, respectively. Surprisingly, the maximum thermal efficiency obtained at 200 W/m2 solar irradiation for PVT systems was 75.1%, higher than PVT-PCM of 71.1%. Applying PCM might negatively impact ST-PVT systems instead of leading to advancement.
6. Nanofluids in the PVT System
Research on improving PVT performance with nanoparticle-basedheat transfer fluids has been carried out in the last decade. The addition of nanoparticles, which have high thermal conductivity, increases the heat transfer coefficient and heat absorption of the HTF in the collector, enhancing PVT thermal efficiency. With better heat absorption, temperature build-up in PV cells can be prevented so that the average electrical efficiency is also expected to be better. However, nanofluid studies to improve electrical and thermal performance as a whole PVT system are still rare. Most of the studies on nanofluids in PV panels are aimed at PV cooling [120].
On the other hand, ST-PVT systems mainly rely on water as their working fluid, so their efficiency is limited by heat capacity and poor water absorption properties. Thus, the addition of nanoparticles should increase the solar collector’s absorption efficiency due to the improved radiative properties of the liquid [118]. Al-Waeli et al. [42] found that cooling PV panels with nanofluids increases the thermal efficiency by up to 89.75% and lowers the temperature of PV modules by up to 28.1% compared to cooling with water alone. However, nanofluids have disadvantages: poor stability, high cost, high viscosity, and environmental issues.
6.1. Nanofluid Selection
The performance of PVT systems utilizing HTF fluid that contains nanoparticles, i.e., nanofluid, has been studied by many researchers. However, much research on the nanofluid application in PVT systems has focused on thermal performance. The classification of commonly used nanoparticles is shown in Figure 15. With the main application of PVT technology for residential and small-scale industries, the researchers should also consider economic and environmental factors in the selection.
6.1.1. Nanofluids Types
Various nanoparticles, especially carbon-based, metal-based, and polymeric nanoparticles, were tested numerically and experimentally to compare PVT systems with pure water cooling or PV panels. Sheikholeslami et al. [34] have reviewed nanomaterials to improve PVT systems’ performance over the last ten years. They found that alumina (Al2O3) is the most popular nanoparticle used in conjunction with a flat plate PVT thermal collector, followed by multi-walled carbon nanotubes (MWCNT) and copper (Cu), as shown in Figure 16. These three most popular nanofluids have been investigated further to determine their performance in the PVT system.
An experiment on ST-PVT using 0.2 wt% alumina/water (Al2O3/H2O) nanofluid has been carried out by Yousefi et al. [122]. They learned that nanofluids increased collector efficiency by 28.3% compared to HTF water. This finding is similar to Sheikholeslami et al. [34], who found that Al2O3/water can improve PVT thermal performance by up to 29%. In agreement with this, Zamen et al. [123] tested various Al2O3/water nanofluid concentrations as the HTF on the ST-PVT system with a half-tube serpentine collector. They found that the optimal concentration was achieved at 0.5 wt%, where PVT experienced an increase in thermal efficiency of 126.71% and electrical performance increased by 7.38% compared to water only.
However, slightly different results were shown by Sardarabadi and Passandideh-Fard [124], who tested the performance of 0.2 wt% of TiO2, ZnO, and Al2O3 nanoparticles in deionized water, numerically and experimentally. They observed that, compared to PV only, PVT system that utilizing TiO2/water and ZnO/water nanofluids had slightly better performance in terms of electrical efficiency by 6.54% and 6.46%, respectively, while the use of Al2O3/water nanofluids increased its performance by 6.36%. Also, ZnO/water had the highest system thermal performance compared to Al2O3/water nanofluids and deionized water only. Likewise, Alsalame et al. [125] tested experimentally and carried out CFD analysis to evaluate the efficiency of the ST-PVT system using pure water, CuO/water, and Al2O3/water nanofluids. They found that the use of Al2O3/water nanofluids only slightly increased the performance of ST-PVT compared to water, namely 8.19% for thermal efficiency and 0.08% for electrical efficiency. On the other hand, CuO/water nanofluid showed better performance by increasing the thermal efficiency by 11.75% and improving the electrical efficiency by 0.11%, compared to pure water.
Furthermore, the second most studied type of nanofluid is multi-walled carbon nanotubes (MWCNT) nanofluid. Carbon-based nanometer-sized particles have several advantages over metal-based nanomaterials, i.e., low density, high intrinsic thermal conductivity, superior strength, and high aspect ratio [126]. Nasrin et al. [118] modeled and tested a water-based MWNCT nanofluid in a closed circuit indoor experiment to determine its effect on increasing the performance of the PVT system. They set a mass flow rate of 0.5 L/min and then varied the irradiation level from 200 to 1000 W/m2 and the weight fraction of MWCNT/water nanofluid from 0–1%. They learned that the most favorable MWCNT/water weight fraction for PVT systems was less than 1%. Unfortunately, only a slight increase in overall PVT performance is required, about 4.11% higher than PVT/water from experimental results. This result might occur due to poor blending between nanoparticles and water as the base fluid. The mixing process of carbon nanoparticles with a base fluid requires extra treatment to increase the effectiveness of carbon-based nanofluid [127].
On the other hand, another study by Fayaz et al. [109] found that with an optimal flow rate of 120 L/h, MWCNT nanofluid in the ST-PVT system increases electrical efficiency by 10.72% experimentally and 12.25% numerically, compared to PV without cooling. Also, the utilization of the 0.75% weight fraction of MWCNT nanofluid improved overall ST-PVT efficiency by up to 5.73% compared to water-cooled with the same flow rate. A similar result was discovered by Alous et al. [128] in their investigation of the effect of 0.5 wt% concentration of water-based graphene nanoplatelets and MWCNT nanofluids on the performance of ST-PVT with the serpentine configuration at a mass rate of 0.5 L/min in Turkey. They noticed that MWCNT/water and graphene nanoplatelets–water nanofluids increased electrical efficiency by 10.6% and 9.0% and thermal efficiency by 8.6% and 22.1%, respectively, compared to distilled water.
Further, another most experimented metal-based nanofluid in sheet and tube collectors is copper oxide/water (CuO/H2O). Hussain and Kim [129] observed that ST-PVT’s average total efficiency using CuO nanofluids performs best at 78.4%, compared to pure water and Al2O3 nanofluids at 67% and 75.7%, respectively. In agreement with this, Faizal et al. [130] also observed that CuO produces the highest thermal efficiency compared to SiO2, TiO2, and Al2O3 due to lower specific heat and higher density of nanoparticles. Sahota and Tiwari [131] also discovered that the hybrid system of PVT and solar still enhanced its thermal energy and exergy performance by utilizing CuO/water nanofluids. However, Al-Shamani et al. [132] argue that the SiO2 nanofluid had better performance than CuO and ZnO nanofluid. They realized that the ST-PVT system with SiO2 nanofluid increases the electric efficiency by 12.7% and the thermal efficiency to 64.4%.
Additionally, several metal-based nanofluids also promise comparable performance, although they are not as popular as alumina and copper oxide. Lari and Sahin [100] found that PVT collectors with silver/water (Ag/H2O) nanofluid can increase thermal output by 18% compared to water-cooled PV systems. Nasrin et al. [133] also discovered that silver/water nanofluids enhanced thermal PVT efficiency by 7.49% greater than pure water. In comparison, copper/water (Cu/H2O) and aluminum/water (Al/H2O) nanofluids increased PVT thermal performance by 7.08% and 4.97%, respectively. Moreover, Al-Waeli et al. [134] experimented on SiC/water nanofluid for cooling the ST-PVT system. They observed that the 3 wt% SiC/water nanofluid increased the overall efficiency by 88.9%, with a breakdown of the electrical efficiency of 24.1% and the thermal efficiency of 100.19% compared to the separate PV systems. Also, Ghadiri et al. [135] learned that iron oxide nanofluids (ferrofluids) are the prospective HTF for PVT because their rheological characteristics, viscosity, and conductivity can be changed under an external magnetic field.
6.1.2. Economic Views on Nanofluid
The use of nanofluids has been proven to improve PVT performance. However, other factors must be considered for economic reasons, such as the additional costs for nanoparticles, mixing process, more power for pumps, safety measure related cost, and cost for minimizing hazard to the environment. Al-Waeli et al. [42] studied a 3% nanofluid of silicon carbide/water (SiC/H2O) mixture as HTF in an ST-PVT with rectangular pipes as the thermal absorber. They discovered that this system could generate electricity with an average efficiency of 14.25% and a payback period of seven to eight years, with the selling price of electricity reaching 0.196 USD/kWh. A study by Al-Shamani et al. [132] also found that the payback period for silica/water (SiO2/H2O) nanofluid was eight years, or three years faster than water PVT. However, a study in India by Khan et al. [136] discovered that using 0.6% zinc/water (Zn/H2O) nanofluids in the PVT system mitigates about 23.142 tons of CO2 in twenty years and gives an energy payback period of 2.82 years. Lari and Sahin [100], in their research in Saudi Arabia, found that the cost of energy from PVT systems with silver/water (Ag/H2O) nanofluid is 82% cheaper than the domestic price of electricity, while the payback period is about two years. Hassani et al. [137] learned that optimized nanofluid-based PVT configuration could produce the lowest exergy payback of 2 years compared to 3.48 years for standard PV and 2.55 years for PVT systems.
The finding on the economic value of PVT systems with nanofluid is quite reassuring, especially with the relatively short payback period. However, there may be some factors that were not adequately considered in the calculations. Modeling by Hussain and Kim [129] found that the energy payback period of parallel tube PVT with CuO nanofluid is eight years, half a year faster than the Al2O3 nanofluid and one year faster than water cooling alone. However, if the solar radiation becomes 1100 W/m2, the energy payback period is three to four years faster. Abadeh et al. [138] observed that the payback period for PVT systems with a government subsidy scheme of 75% for pure water, TiO2/water, ZnO/water, and Al2O3/water nanofluids was 2.56, 2.54, 2.5, and 2.58 years, respectively. However, without government subsidies, the payback period for the PVT system is about eight years.
6.1.3. Environmental Aspect
Nanoparticles as additional chemicals in PVT working fluids certainly have environmental impacts that must be considered. Nevertheless, only a limited amount of research on PVT has focused on environmental impact and life cycle assessments, as shown in Table 4. Studies on the effects of nanofluids in PVT systems on the environment are still few. Most of this research discusses the advantages of using nanofluids for the environment. A model of a modified PV module with dual thermal units to assess environmental aspects has been developed by Hassani et al. [137]. They used one layer of CNTs/water nanofluids in the rear PV panel as a thermal absorber, and one layer of Ag/water nanofluids in the front as an optical filter. They discovered that this configuration of PV/T system produces more pollutants than other configurations during the manufacturing process. Still, its pollution prevention outperformed the rest by about 448 kg CO2 equivalent per square meter per year in the operational phase. Also, Abadeh et al. [138] found that nanofluids in a PVT system can reduce carbon dioxide emissions by 17% more than PV units without cooling.
On the other hand, research that focuses on discussing the impact of nanofluids on the environment, in general, is relatively adjacent. For example, Schrand et al. [141] found that some metal-based nanoparticles, including Ag, Au, and Cu, are toxic to human health and increase their toxicity when the particle size is reduced. Moreover, some nanoparticles, such as copper and copper oxide, are toxic to some aquatic species and possibly harmful to humans [142]. The use of nanofluids for ST-PVT systems must pay attention to the threat of environmental pollution due to leaks or post-use management. With the best stability reported in the literature for only several months, the control of the residual nanofluid waste needs to be carefully planned. The addition of chemicals in the nanofluids manufacture is likely to affect the environment [42]. Also, the addition of nanofluid to HTF causes this liquid not to be used directly for domestic needs. One way to utilize this PVT system with nanofluid is to use the nanofluid in a separate loop with the water used for domestic heating [41].
6.2. Nanofluid Properties
6.2.1. Base Fluid
Water has many advantages as a heat transfer fluid in a PVT system. This fluid is non-toxic, has a high thermal conductivity value, is easy to find, and is easy to use without any other heat exchangers. The use of water as a heat transfer medium has also been proven to be effective in ST-PVT and different liquid PVT configurations. Research on ST-PVT commonly uses water, but concentrated PVT is more experimentally varied, such as silicone oil-based nanofluids with MXene (Ti3C2) [143], various vegetable oils [144], and Jatropha curcas crude oil [145]. Huang and Marefati [146] found that of all solar collectors studied, water as HTF provided better energy performance than Thermia Oil B, either with or without the addition of nanoparticles. Another study by Khan et al. [136] on the effect of additional 25% propylene glycol and 25% ethylene glycol on 0.6% Zn/water discovered higher electrical performance gains of 21.89% and 26.57%, respectively. This additional quarter of propylene glycol and ethylene glycol also increased the thermal efficiency by 60.39% and 75.82%, respectively, compared to pure water HTF.
An example of an experiment on olein palm oil with MXene nanoparticles (MXene-OPO) nanofluids was carried out by Samylingam et al. [147] on a PVT sheet and tube with concentration variations of 0.01–0.2 wt%. From experimental and numerical analysis, they noticed that the thermal conductivity of OPO increased linearly with increasing concentration, with a maximum of 68.5% at 0.2 wt% at 25 °C. They also found that MXene-OPO increased heat removal by 8.5%, electrical efficiency by 13.8%, and thermal efficiency by 11.2% from the PV/T thermal system compared to alumina/water nanofluid. Similarly, Rubbi et al. [148] studied the performance of the ST-PVT serpentine collector design with MXene/Soybean oil (Ti3C2/SO) 0.125 wt% heat transfer fluid. They discovered that compared to soybean oil, the thermal conductivity of Ti3C2/SO was 60.82% higher at 55 °C for a weight fraction of 0.125 wt%. They also compared the performance of ST-PVT numerically with water, alumina/water nanofluid, and MXene/Palm Oil. Ti3C2/SO produces 84.25% better thermal efficiency and a lower surface temperature of 14 °C than water, giving 15.44% higher electrical output than alumina/nanofluid water at 0.07 kg/s discharge.
6.2.2. Concentration and Viscosity
Various nanofluids used to improve a PVT sheet and tube work optimally at specific concentrations. As a rule of thumb, the more nanoparticles, the higher the thermal conductivity and the greater the PVT performance. However, the higher the concentration, the weaker the stability of the mixture so that it is prone to precipitation in a relatively short time. Likewise, nanoparticles tend to agglomerate when in a higher concentration solution, and the stability of a homogeneous solution will be reduced [149]. Faizal et al. [139] found that high concentrations of SiO2/water nanofluid increase pumping power up to 33% for 0.2 wt% and up to 67% for 0.4 wt% compared to water. Al-Waeli et al. [42] found that adding the mass fraction of nanofluids is only optimal to a certain extent. For example, they discovered that the addition of SiC nanoparticles above 0.3% in a SiC/water nanofluid only slightly increases the thermal conductivity, but can significantly increase the power consumed by the pump.
Another study on low concentration variations was conducted by Khan et al. [136] on the PVT system using water-based nanofluid as HTF with zinc/water (Zn/H2O). They found that a 0.6% zinc nanoparticles mixture gave the best performance enhancer with 18.11% electrical efficiency and 54.71% better thermal efficiency than pure water HTF. Likewise, in their experiment, Abdallah et al. [120] tested the performance of a PVT system using a water-based MWCNT nanofluid in a low concentration between 0–0.3% at a constant flow of 1.2 L/min. They learned that the most favorable dilution was 0.075% by volume of the MWCNT, where the PV temperature could drop to 12 °C at maximum incident radiation. The average overall efficiency obtained at this concentration is 61.23%, and a maximum of 83.26%. Hader and Al-Kouz [150] numerically tested Al2O3/water nanofluids in PVT with finned collectors. They observed that the overall PVT efficiency is increased with increasing volume fraction of nano-sized solid particles, but this also raises the coefficient of friction.
Furthermore, nanofluid was also examined at a higher concentration. Nasrin et al. [133] performed three-dimensional numerical modeling to simulate the effect of three types of water-based nanofluid concentrations on the PVT system thermal performance. They found that the optimum nanofluid concentration was 2% by weight of water. Also, Ghadiri et al. [135] experimented with iron oxide/water (Fe3O4/H2O) nanofluid or ferrofluid for PVT with various weights fractions. They discovered that ferrofluid with a concentration of 1% by weight increased the system’s thermal efficiency up to 65.96%, while for 3% by weight, the efficiency increased by 68.88%. These values are 41% and 45%, higher than PVT using distilled water as HTF. However, metal-based nanofluid tends to overload the pump if the concentration is high, while carbon-based nanofluid reduces thermal performance if the concentration increases. Thus, the concentration of nanoparticles may vary in providing the best performance for the PVT system, mainly depending on the type and medium [151].
Researchers usually use small nanofluid concentrations in the PVT system with a sheet and tube thermal collector applications. Hussain and Kim [129] learned that increasing the weight fraction from 0–0.8% of nanofluids increased the viscosity of the Al2O3/water nanofluid by 9.9% and the CuO/water nanofluid by 10.8%. Next, Al-Waeli et al. [152] also noticed that the fluid’s viscosity increased with increasing nanofluid concentration from 0–4% by 0.0076% for Al2O3, 0.0039% for CuO, and 0.0088% for SiC. Additionally, Al-Waeli et al. [134] found that the addition of 3 wt% SiC nanoparticles at a test temperature of 25–60°C slightly increased the nanofluid density by 0.0082%, increased the viscosity by 1.8%, and increased the thermal conductivity by 8.2%.
Nanofluid viscosity is essential in improving PVT performance and overall system economy. The effect of adding nanoparticles to fluid viscosity varies depending on several factors such as nanoparticle shape and size, liquid base, temperature, pH, surface tension, nanoparticle chemistry, and the dispersion method [44,152,153]. The thermal conductivity of nanofluids increases with increasing concentration and temperature [154]. The heat transfer from PV cells to nanofluid is enhanced with more nanoparticle concentration, so the thermal performance is higher. However, viscosity and pump power also rise with increasing nanofluid concentration.
6.2.3. Other Properties
Enhancing ST-PVT performance using nanofluid should also consider other significant nanofluid properties such as deposition, boiling point, thermal conductivity, the Nusselt number, and the Reynolds number. The addition of nanoparticles, especially metal-based, needs to be watched for deposits in tubes and water storage tanks. Deposits of nanoparticles will cause a decrease in thermal performance and might clog the tubes. The deposition rate is also affected by the boiling point of the nanofluid. Lee and Mudawar [155], in a 1% Al2O3/water nanofluid flow-boiling experiment, found that the initial onset of the vaporization boiling of the liquid led to rapid and severe nanoparticle deposition. Thus, nanofluid boiling in a PVT system can cause a catastrophic effect.
Regarding thermal conductivity, Hussain and Kim [129] observed increasing the weight fraction of Al2O3 and CuO nanofluids from 0–0.8% in thermal conductivity increased by 10.7% and 14.1%, respectively. Al-Waeli et al. [152] also discovered that water-based nanofluids with a volume fraction of 4% increased the thermal conductivity by 1.96% for Al2O3, 3.42% for CuO, and 4.8% for SiC. However, improving the thermal conductivity is not only done by increasing the concentration of nanoparticles. In nanofluid solutions exposed to high temperatures, the molecules move faster so that the collisions between nanoparticles and liquid molecules are more heightened, ultimately increasing the thermal conductivity [122].
Lastly, although mostly found in the numerical study, a nanofluid’s Nusselt and Reynolds number increment can also enhance its heat transfer and thermal efficiency. Faizal et al. [130] tested the use of a 0.2% silica/water (SiO2/H2O) nanofluid in flat plate solar collectors. They found an increase in the Nusselt and Reynolds number to increase thermal efficiency to 23.5%. Hader and Al-Kouz [150] tested a PVT system numerically with a finned thermal collector and an Al2O3/water nanofluid working fluid. They noticed that the overall PVT efficiency increased with an increasing Reynolds number due to better heat transfer. Nevertheless, the rise in the Reynold number means that the increased friction coefficient risks an increasing deposition rate and mineral scaling.
6.3. Nanofluid Parameters
Various parameters such as velocity and flow rate should be investigated closely to measure the effectiveness of nanofluid in enhancing ST-PVT performance. Khanjari et al. [151], in their numerical simulation for harp-designed ST-PVT using pure water, Ag/water, and Al2O3/water nanofluid, found that higher fluid velocities increased electrical energy efficiency but not thermal energy efficiency. By increasing the velocity from 0.05–0.23 m/s, the thermal efficiency of the ST-PVT system decreased by 10%, 13%, and 13.7% for Ag/water nanofluids, Al2O3/water nanofluids, and pure water, respectively. This relatively low optimal flow rate also agreed with the study by Al-Shamani et al. [132]. Their investigation of CuO, SiO2, and ZnO water-based nanofluids with 1% weight concentration discovered that the most optimal mass flow rate was 0.03 kg/s. Sardarabadi et al. [156] noticed that different fluids have different optimal flow rates. Their investigation of the effects of 1–3 wt% silica nanoparticles on serpentine ST-PVT found that the highest system efficiency was 30 L/h silica/water nanofluid, or lower than the optimum flow of pure water at 40 L/h.
Furthermore, another parameter that affects nanofluid performance is the nanoparticle size. In general, the smaller the size of the nanoparticles, the better, because the smaller are more soluble in water and increase the thermal conductivity. Ambreen and Kim [157], in a review of the effect of particle size on the effective thermal conductivity of nanofluids, show optimized thermophysical properties for particle sizes below 100 nm. Thus, nanofluids limiting nanoparticle size to more than 100 nm did not provide a significant increase in thermal conductivity [158]. In agreement with this, Goshayeshi et al. [159] studied the effect of particle size and type on the increase of Ferro-nanofluid heat transfer, showing the optimal size of nanoparticle to be 20 nm. In addition, Maheshwary et al. [154], in their research on the effect of particle size and shape on the thermal conductivity of titania/water nanofluids, found that the nanofluid viscosity and pump ability decreased with decreasing nanoparticle size but increasing thermal conductivity.
Lastly, the nanofluid mixture stability is one parameter that is an issue in its implementation. Nanofluid improves ST-PVT’s thermal and electrical performance as long as the mixed conditions do not change. The stability of nanoparticles in base liquids, in which their thermophysical properties are retained, dispersed uniformly, and suspended stably for an extended period, is still a challenge in nanofluid applications. The rule of thumb is the higher the concentration of nanoparticles, the lower the stability. However, this stability may change depending on the temperature, circulation speed, and the tube material used for the nanofluid’s circulating medium. Al-Waeli et al. [42] discovered that stability determines whether these nanofluids are suitable for use as HTF in PVT systems because, for long periods, they will experience many cycles of heating and cooling processes. Settlement and concentration gradients in nanofluids can cause component blockage and fluctuating heat loads, reducing long-term thermal performance in the cooling system reservoir [155].
On the other hand, most stability measurements in previous studies were in stationary tubes, so they may not be very accurate in PVT applications where the temperature fluctuates. In a laboratory setting, Al-Waeli et al. [152] learned that Al2O3 nanofluid with a volume fraction of 4% started to precipitate in 162 days, CuO in 144 days, and SiC in 186 days. Still, with a volume fraction of 1%, the Al2O3, CuO, and SiC nanofluids start to precipitate in 208, 189, and 212 days, respectively. However, in another setting, Al-Waeli et al. [134] give different results on 1–4 wt% SiC/water nanofluid stability with 0.1 mL of cetyl trimethyl ammonium bromide. They learned that the nanofluid was stable under examination for three months, although the thermal conductivity was reduced to 0.003 W/m K after six months.
7. Discussion and Further Research
Researchers have considered many aspects of developing a PVT system using sheet and tube collectors. Performance improvement is the main focus, both electricity as a product of PV cells and thermal as a product of thermal collectors. Unfortunately, thermal efficiency gets more attention than electrical efficiency because of its significant increase. The addition of glazing to increase thermal performance is a dominant focus in the literature, followed by nanofluid applications and collector modification. On the other hand, a vital issue in PV active cooling systems such as ST-PVT is the rate and amount of heat dissipation and utilization of the extracted heat, mainly if it is applied on a large scale such as a solar power plant [3]. Furthermore, in increasing the electrical efficiency of PV, the main factors found are the improvement of thermal contact and heat removal of the PV cell. In this case, glazing installation is counter-productive to increasing the PVT system’s electrical performance. Hence, researchers need to look for alternatives to maximize ST-PVT overall performance by improving the thermal contact, enhancing the laminating process, and selecting the correct absorber type [160].
Furthermore, the ST-PVT design is also evolving. Researchers have examined the three main sheet and tube configurations: harp, serpentine, and spiral. A full report on PVT performance is easily found using these configurations and becomes the primary reference for new innovative designs. Some designs still retain the advantages of the original design, such as a minimum pressure drop for the serpentine and a more even temperature gradient for the harp design, while minimizing the drawbacks. For instance, an innovation to eliminate the plate for the absorber in the ST-PVT system has been claimed to provide equivalent performance at a lower cost when the tube is directly attached to the PV panel [161]. Another novel design of square metal tubes also promises increased contact heat transfer. Thus, the choice of material becomes a particular challenge regarding availability, effectiveness, and economic aspects. Metal-based materials, including aluminum and copper, are still excellent because of their proven performance [162]. Cheaper and lighter materials such as polymers, plastics, or carbon fiber are also tested as alternatives but are more known for roll bonds collectors.
In addition to performance, PVT application is also an aspect of research on PVT systems, with the mainstream being residential, building-integrated, and desalination. Other applications, such as heat pumps, large-scale power generation, trigeneration, etc., are still little discussed in the literature. Furthermore, the economic aspect is also widely studied as a consideration for PVT users and manufacturing companies. Product reliability and cost are still obstacles in commercial PVT applications [15]. From several product samples presented, sheet and tube collectors for PVT systems are still the most offered products either independently or as a PVT package. Therefore, future economic studies on PVT based on the manufacturer and an industrial point of view are expected to be appearing more to stimulate more production and utilization of the PVT system.
Other promising research niches also lie in nanofluid and PCM integration to enhance PVT performance and store thermal energy for use when needed. Nanofluids were initially studied in heat exchangers to improve heat transfer due to the increased thermal conductivity of the base fluid. Along with this trend, much research is conducted on nanofluids application as HTF in PVT systems, especially for concentrated collectors. Meanwhile, there is not much research on nanofluids in sheet and tube collectors, but they can give an idea of their potential in the future. Metal-based nanofluid is still the main study focus as the most effective heat dissipator from the thermal collector, while research on carbon-based nanofluids is limited, especially in PVT systems. Hence, studying the impact of MWCNT nanofluids on PVT system performance in different climates and working conditions is still needed [128].
However, some issues still need to be resolved regarding absorber design, nanofluid application, and PCM integration in the ST-PVT. First, developing the sheet and tube collector is a long process and must be validated at every stage. Many designs have been validated, but field experiments have not yet been carried out to confirm them [42]. On the other hand, modeling is also important to anticipate, and the expectations obtained from the experiment become more accurate so that not a lot of costs are wasted. Second, the utilization of heat from PVT systems is still very little discussed in the literature. Water with medium to low temperature may not be very adequate for use other than for household purposes, so future studies should address this problem on a large scale. Third, the nanofluids’ issues of mixture stability, effect on absorber material, and environmental impact, especially regarding PVT systems, are rarely examined, although they are crucial for commercial purposes. Lastly, some studies have shown that PCM has less impact on PVT systems, especially electrical performance. Therefore, future PVT-PCM research efforts should consider the economical use of PCM with more practically oriented experiments [163].
8. Conclusions
This study explores the development of sheet and tube thermal collectors in PVT systems from their first development to new features being researched to indicate that the collector is still the main factor influencing PVT performance. This paper also investigates the extent of applying nanofluids in ST-PVT. Although still new in ST-PVT, the widespread use of nanofluids promises even more excellent service in the future. Some conclusions that can be drawn are as follows:
- ST-PVT without glazing produces the most satisfactory electrical performance with the lowest investment. However, single glazing PVT with a 20 mm air gap should be considered for more balanced thermal and electrical efficiency.
- The serpentine collector promises the highest thermal efficiency due to longer tubes absorbing heat from the panel. At the same time, the harp design proved to give better electrical performance because of a more even temperature.
- Aluminum and copper are found to have the highest quality for use as ST-PVT collectors’ materials, with aluminum preferred because it is the lightest and most affordable.
- Metal-based nanofluid offers a more satisfactory performance than carbon-based nanofluid, with copper oxide being preferred due to its superior performance. Other promising nanofluids such as alumina and silicon dioxide also ensure a good result in the ST-PVT system.
- A low concentration of nanofluid is preferred to provide good performance and a low risk of precipitation. Higher concentration might offer higher thermal efficiency but overload the pump with high pressure, and it is not easy to maintain its stability. It has been learned that 0.4 wt% SiO2/water requires 67% more pumping power compared to water.
The use of a PVT system is still commercially limited, even though the PVT system is advantageous for long-term use. Several challenges have been identified, such as many studies have been carried out using only numerical modeling. Also, nanofluids in the PVT system might be unsuitable for residential use or small-scale industry due to their complicated preparation, additional equipment required, and waste management concerns. Thus, further research is proposed to focus more on the applicable ST-PVT system rather than focusing only on its performance, which may be challenging to implement. Likewise, researchers still need to look for other alternatives and prove that PVT system is economically and environmentally beneficial.
Author Contributions
Conceptualization, M.F.U. and M.H.; methodology, M.F.U.; resources, M.F.U.; writing—original draft preparation, M.F.U.; writing—review and editing, M.H. and N.A.R.; supervision, M.H. and N.A.R.; project administration, M.F.U.; funding acquisition, M.H. and N.A.R. All authors have read and agreed to the published version of the manuscript.
Funding
The article processing charge (APC) was funded by UM Power Energy Dedicated Advanced Centre (UMPEDAC) and the Higher Institution Centre of Excellence (HICoE) Program Research Grant, UMPEDAC—2020 (MOHE HICOE—UMPEDAC), Ministry of Education Malaysia, PPSI-2020-HICOE-01, RU002-2021, University of Malaya.
Institutional Review Board Statement
Not applicable.
Informed Consent Statement
Not applicable.
Data Availability Statement
Not applicable.
Acknowledgments
The authors are grateful for the technical and financial assistance of UM Power Energy Dedicated Advanced Centre (UMPEDAC) and the Higher Institution Centre of Excellence (HICoE) Program Research Grant, UMPEDAC—2020 (MOHE HICOE—UMPEDAC), Ministry of Education Malaysia, PPSI-2020-HICOE-01, RU002-2021, University of Malaya. The authors also thank the Malaysian International Scholarship, Ministry of Higher Education, Malaysia.
Conflicts of Interest
The authors declare no conflict of interest.
References
- Chow, T.T. A review on photovoltaic/thermal hybrid solar technology. Appl. Energy 2010, 87, 365–379. [Google Scholar] [CrossRef]
- Salari, A.; Hakkaki-Fard, A. A numerical study of dust deposition effects on photovoltaic modules and photovoltaic-thermal systems. Renew. Energy 2019, 135, 437–449. [Google Scholar] [CrossRef]
- Hasanuzzaman, M.; Malek, A.B.M.A.; Islam, M.M.; Pandey, A.K.; Rahim, N.A. Global advancement of cooling technologies for PV systems: A review. Sol. Energy 2016, 137, 25–45. [Google Scholar] [CrossRef]
- Wolf, M. Performance analyses of combined heating and photovoltaic power systems for residences. Energy Convers. 1976, 16, 79–90. [Google Scholar] [CrossRef]
- Kern, J.E.C.; Russell, M.C. Combined photovoltaic and thermal hybrid collector systems. In Proceedings of the IEEE Photovoltaic Specialists Conference, Washington, DC, USA, 5–8 June 1978. [Google Scholar]
- Raghuraman, P.; Hendrie, S.D. Analytical predictions of liquid and air photovoltaic/thermal, flat-plate collector performance. In Proceedings of the JASME Winter Annual Meeting, Chicago, IL, USA, 16 November 1980. [Google Scholar]
- Dwivedi, P.; Sudhakar, K.; Soni, A.; Solomin, E.; Kirpichnikova, I. Advanced cooling techniques of P.V. modules: A state of art. Case Stud. Therm. Eng. 2020, 21, 100674. [Google Scholar] [CrossRef]
- Fudholi, A.; Sopian, K.; Yazdi, M.H.; Ruslan, M.H.; Ibrahim, A.; Kazem, H.A. Performance analysis of photovoltaic thermal (PVT) water collectors. Energy Convers. Manag. 2014, 78, 641–651. [Google Scholar] [CrossRef]
- Aste, N.; del Pero, C.; Leonforte, F. Water flat plate PV–thermal collectors: A review. Sol. Energy 2014, 102, 98–115. [Google Scholar] [CrossRef]
- Zondag, H.A. Flat-plate PV-Thermal collectors and systems: A review. Renew. Sustain. Energy Rev. 2008, 12, 891–959. [Google Scholar] [CrossRef] [Green Version]
- Ibrahim, A.; Othman, M.Y.; Ruslan, M.H.; Mat, S.; Sopian, K. Recent advances in flat plate photovoltaic/thermal (PV/T) solar collectors. Renew. Sustain. Energy Rev. 2011, 15, 352–365. [Google Scholar] [CrossRef]
- Tyagi, V.V.; Kaushik, S.C.; Tyagi, S.K. Advancement in solar photovoltaic/thermal (PV/T) hybrid collector technology. Renew. Sustain. Energy Rev. 2012, 16, 1383–1398. [Google Scholar] [CrossRef]
- Zhang, X.; Zhao, X.; Smith, S.; Xu, J.; Yu, X. Review of R&D progress and practical application of the solar photovoltaic/thermal (PV/T) technologies. Renew. Sustain. Energy Rev. 2012, 16, 599–617. [Google Scholar] [CrossRef]
- Reddy, S.R.; Ebadian, M.A.; Lin, C.X. A review of PV–T systems: Thermal management and efficiency with single phase cooling. Int. J. Heat Mass Transf. 2015, 91, 861–871. [Google Scholar] [CrossRef]
- Kumar, A.; Baredar, P.; Qureshi, U. Historical and recent development of photovoltaic thermal (PVT) technologies. Renew. Sustain. Energy Rev. 2015, 42, 1428–1436. [Google Scholar] [CrossRef]
- Good, C. Environmental impact assessments of hybrid photovoltaic-thermal (PV/T) systems—A review. Renew. Sustain. Energy Rev. 2016, 55, 234–239. [Google Scholar] [CrossRef]
- Besheer, A.H.; Smyth, M.; Zacharopoulos, A.; Mondol, J.; Pugsley, A. Review on recent approaches for hybrid PV/T solar technology. Int. J. Energy Res. 2016, 40, 2038–2053. [Google Scholar] [CrossRef]
- Sahota, L.; Tiwari, G.N. Review on series connected photovoltaic thermal (PVT) systems: Analytical and experimental studies. Sol. Energy 2017, 150, 96–127. [Google Scholar] [CrossRef]
- Al-Waeli, A.H.A.; Sopian, K.; Kazem, H.A.; Chaichan, M.T. Photovoltaic/Thermal (PV/T) systems: Status and future prospects. Renew. Sustain. Energy Rev. 2017, 77, 109–130. [Google Scholar] [CrossRef]
- Yazdanifard, F.; Ameri, M.; Ebrahimnia-Bajestan, E. Performance of nanofluid-based photovoltaic/thermal systems: A review. Renew. Sustain. Energy Rev. 2017, 76, 323–352. [Google Scholar] [CrossRef]
- Preet, S. Water and phase change material based photovoltaic thermal management systems: A review. Renew. Sustain. Energy Rev. 2018, 82, 791–807. [Google Scholar] [CrossRef]
- Kasaeian, A.; Tabasi, S.; Ghaderian, J.; Yousefi, H. A review on parabolic trough/Fresnel based photovoltaic thermal systems. Renew. Sustain. Energy Rev. 2018, 91, 193–204. [Google Scholar] [CrossRef]
- Joshi, S.S.; Dhoble, A.S. Photovoltaic-Thermal systems (PVT): Technology review and future trends. Renew. Sustain. Energy Rev. 2018, 92, 848–882. [Google Scholar] [CrossRef]
- Yazdanifard, F.; Ameri, M. Exergetic advancement of photovoltaic/thermal systems (PV/T): A review. Renew. Sustain. Energy Rev. 2018, 97, 529–553. [Google Scholar] [CrossRef]
- Vaishak, S.; Bhale, P.V. Photovoltaic/thermal-solar assisted heat pump system: Current status and future prospects. Sol. Energy 2019, 189, 268–284. [Google Scholar] [CrossRef]
- Abbas, N.; Awan, M.B.; Amer, M.; Ammar, S.M.; Sajjad, U.; Ali, H.M.; Zahra, N.; Hussain, M.; Badshah, M.A.; Jafry, A.T. Applications of nanofluids in photovoltaic thermal systems: A review of recent advances. Phys. A Stat. Mech. Its Appl. 2019, 536, 122513. [Google Scholar] [CrossRef]
- Jia, Y.; Alva, G.; Fang, G. Development and applications of photovoltaic–thermal systems: A review. Renew. Sustain. Energy Rev. 2019, 102, 249–265. [Google Scholar] [CrossRef]
- Tao, M.; Zhenpeng, L.; Jiaxin, Z. Photovoltaic panel integrated with phase change materials (PV-PCM): Technology overview and materials selection. Renew. Sustain. Energy Rev. 2019, 116, 109406. [Google Scholar] [CrossRef]
- George, M.; Pandey, A.K.; Abd Rahim, N.; Tyagi, V.V.; Shahabuddin, S.; Saidur, R. Concentrated photovoltaic thermal systems: A component-by-component view on the developments in the design, heat transfer medium and applications. Energy Convers. Manag. 2019, 186, 15–41. [Google Scholar] [CrossRef] [Green Version]
- Lamnatou, C.; Notton, G.; Chemisana, D.; Cristofari, C. Storage systems for building-integrated photovoltaic (BIPV) and building-integrated photovoltaic/thermal (BIPVT) installations: Environmental profile and other aspects. Sci. Total Environ. 2020, 699, 134269. [Google Scholar] [CrossRef]
- Hemmat Esfe, M.; Kamyab, M.H.; Valadkhani, M. Application of nanofluids and fluids in photovoltaic thermal system: An updated review. Sol. Energy 2020, 199, 796–818. [Google Scholar] [CrossRef]
- Noxpanco, M.G.; Wilkins, J.; Riff, S. A review of the recent development of photovoltaic/thermal (Pv/t) systems and their applications. Future Cities Environ. 2020, 6, 9. [Google Scholar] [CrossRef]
- Bandaru, S.H.; Becerra, V.; Khanna, S.; Radulovic, J.; Hutchinson, D.; Khusainov, R. A Review of Photovoltaic Thermal (PVT) Technology for Residential Applications: Performance Indicators, Progress, and Opportunities. Energies 2021, 14, 3853. [Google Scholar] [CrossRef]
- Sheikholeslami, M.; Farshad, S.A.; Ebrahimpour, Z.; Said, Z. Recent progress on flat plate solar collectors and photovoltaic systems in the presence of nanofluid: A review. J. Clean. Prod. 2021, 293, 126119. [Google Scholar] [CrossRef]
- Rajoria, C.S.; Kumar, R.; Sharma, A.; Singh, D.; Suhag, S. Development of flat-plate building integrated photovoltaic/thermal (BIPV/T) system: A review. Mater. Today Proc. 2021, 46, 5342–5352. [Google Scholar] [CrossRef]
- Demiris, G.; Oliver, D.P.; Washington, K.T. Defining and Analyzing the Problem, in Behavioral Intervention Research in Hospice and Palliative Care; Elsevier: Amsterdam, The Netherlands, 2019; pp. 27–39. [Google Scholar]
- Harzing, A.W. Publish or Perish. 2007. Available online: https://harzing.com/resources/publish-or-perish (accessed on 7 July 2022).
- Ferrari, R. Writing narrative style literature reviews. Eur. Med. Writ. Assoc. 2015, 24, 230–235. [Google Scholar] [CrossRef]
- Templier, M.; Paré, G. A Framework for Guiding and Evaluating Literature Reviews. Commun. Assoc. Inf. Syst. 2015, 37, 6. [Google Scholar] [CrossRef]
- Herrando, M.; Markides, C.N.; Hellgardt, K. A UK-based assessment of hybrid PV and solar-thermal systems for domestic heating and power: System performance. Appl. Energy 2014, 122, 288–309. [Google Scholar] [CrossRef] [Green Version]
- Verma, S.K.; Sharma, K.; Gupta, N.K.; Soni, P.; Upadhyay, N. “Performance comparison of innovative spiral shaped solar collector design with conventional flat plate solar collector”. Energy 2020, 194, 116853. [Google Scholar] [CrossRef]
- Al-Waeli, A.H.A.; Sopian, K.; Kazem, H.A.; Chaichan, M.T. Nanofluid based grid connected PV/T systems in Malaysia: A techno-economical assessment. Sustain. Energy Technol. Assess. 2018, 28, 81–95. [Google Scholar] [CrossRef]
- Bhattarai, S.; Oh, J.-H.; Euh, S.-H.; Krishna Kafle, G.; Hyun Kim, D. Simulation and model validation of sheet and tube type photovoltaic thermal solar system and conventional solar collecting system in transient states. Sol. Energy Mater. Sol. Cells 2012, 103, 184–193. [Google Scholar] [CrossRef]
- Rejeb, O.; Dhaou, H.; Jemni, A. A numerical investigation of a photovoltaic thermal (PV/T) collector. Renew. Energy 2015, 77, 43–50. [Google Scholar] [CrossRef]
- Lu, L.; Wang, X.; Wang, S.; Liu, X. Analysis of Three Different Sheet-and-Tube Water-Based Flat-Plate PVT Collectors. J. Energy Eng. 2017, 143, 04017022. [Google Scholar] [CrossRef]
- Rejeb, O.; Dhaou, H.; Jemni, A. Parameters effect analysis of a photovoltaic thermal collector: Case study for climatic conditions of Monastir, Tunisia. Energy Convers. Manag. 2015, 89, 409–419. [Google Scholar] [CrossRef]
- Huide, F.; Xuxin, Z.; Lei, M.; Tao, Z.; Qixing, W.; Hongyuan, S. A comparative study on three types of solar utilization technologies for buildings: Photovoltaic, solar thermal and hybrid photovoltaic/thermal systems. Energy Convers. Manag. 2017, 140, 1–13. [Google Scholar] [CrossRef]
- Santbergen, R.; Rindt, C.C.M.; Zondag, H.A.; van Zolingen, R.J.C. Detailed analysis of the energy yield of systems with covered sheet-and-tube PVT collectors. Sol. Energy 2010, 84, 867–878. [Google Scholar] [CrossRef]
- Touafek, K.; Khelifa, A.; Adouane, M. Theoretical and experimental study of sheet and tubes hybrid PVT collector. Energy Convers. Manag. 2014, 80, 71–77. [Google Scholar] [CrossRef]
- Nualboonrueng, T.; Tuenpusa, P.; Ueda, Y.; Akisawa, A. The performance of PV-t systems for residential application in Bangkok. Prog. Photovolt. Res. Appl. 2013, 21, 1204–1213. [Google Scholar] [CrossRef]
- De Keizer, C.; De Jong, M.; Mendes, T.; Katiyar, M.; Folkerts, W.; Rindt, C.; Zondag, H. Evaluating the Thermal and Electrical Performance of Several Uncovered PVT Collectors with a Field Test. Energy Procedia 2016, 91, 20–26. [Google Scholar] [CrossRef] [Green Version]
- Herrando, M.; Ramos, A.; Zabalza, I.; Markides, C.N. A comprehensive assessment of alternative absorber-exchanger designs for hybrid PVT-water collectors. Appl. Energy 2019, 235, 1583–1602. [Google Scholar] [CrossRef] [Green Version]
- Hissouf, M.; Feddaoui, M.B.; Najim, M.; Charef, A. Performance of a photovoltaic-thermal solar collector using two types of working fluids at different fluid channels geometry. Renew. Energy 2020, 162, 1723–1734. [Google Scholar] [CrossRef]
- Tripanagnostopoulos, Y. Aspects and improvements of hybrid photovoltaic/thermal solar energy systems. Sol. Energy 2007, 81, 1117–1131. [Google Scholar] [CrossRef]
- Zondag, H.A.; de Vries, D.W.; van Helden, W.G.J.; van Zolingen, R.J.C.; van Steenhoven, A.A. The yield of different combined PV-thermal collector designs. Sol. Energy 2003, 74, 253–269. [Google Scholar] [CrossRef]
- He, W.; Zhang, Y.; Ji, J. Comparative experiment study on photovoltaic and thermal solar system under natural circulation of water. Appl. Therm. Eng. 2011, 31, 3369–3376. [Google Scholar] [CrossRef]
- Bombarda, P.; Di Marcoberardino, G.; Lucchini, A.; Leva, S.; Manzolini, G.; Molinaroli, L.; Pedranzini, F.; Simonetti, R. Thermal and electric performances of roll-bond flat plate applied to conventional PV modules for heat recovery. Appl. Therm. Eng. 2016, 105, 304–313. [Google Scholar] [CrossRef]
- Kim, J.H.; Kim, J.T. The Experimental Performance of an Unglazed PVT Collector with Two Different Absorber Types. Int. J. Photoenergy 2012, 2012, 312168. [Google Scholar] [CrossRef]
- Dubey, S.; Tay, A.A.O. Testing of two different types of photovoltaic–thermal (PVT) modules with heat flow pattern under tropical climatic conditions. Energy Sustain. Dev. 2013, 17, 1–12. [Google Scholar] [CrossRef]
- Aste, N.; Leonforte, F.; Del Pero, C. Design, modeling and performance monitoring of a photovoltaic–thermal (PVT) water collector. Sol. Energy 2015, 112, 85–99. [Google Scholar] [CrossRef]
- Eiffert, P.U.S. Guidelines for the Economic Analysis of Building-Integrated Photovoltaic Power Systems; National Renewable Energy Laboratory: Golden, CO, USA, 2000. [Google Scholar] [CrossRef] [Green Version]
- Hayter, S.J.; Martin, R.L. Photovoltaics for Buildings Cutting-Edge PV. In Proceedings of the UPVG Utility PV Experience (UPEx) ’98, San Diego, CA, USA, 28–30 September 1998. NREL/CP-550-25764. [Google Scholar]
- Shukla, A.K.; Sudhakar, K.; Baredar, P. Recent advancement in BIPV product technologies: A review. Energy Build. 2017, 140, 188–195. [Google Scholar] [CrossRef]
- Maghrabie, H.M.; Elsaid, K.; Sayed, E.T.; Abdelkareem, M.A.; Wilberforce, T.; Olabi, A.G. Building-integrated photovoltaic/thermal (BIPVT) systems: Applications and challenges. Sustain. Energy Technol. Assess. 2021, 45, 101151. [Google Scholar] [CrossRef]
- Ibrahim, A.; Fudholi, A.; Sopian, K.; Othman, M.Y.; Ruslan, M.H. Efficiencies and improvement potential of building integrated photovoltaic thermal (BIPVT) system. Energy Convers. Manag. 2014, 77, 527–534. [Google Scholar] [CrossRef]
- Yin, H.M.; Yang, D.J.; Kelly, G.; Garant, J. Design and performance of a novel building integrated PV/thermal system for energy efficiency of buildings. Sol. Energy 2013, 87, 184–195. [Google Scholar] [CrossRef]
- Anderson, T.N.; Duke, M.; Morrison, G.L.; Carson, J.K. Performance of a building integrated photovoltaic/thermal (BIPVT) solar collector. Sol. Energy 2009, 83, 445–455. [Google Scholar] [CrossRef] [Green Version]
- Piratheepan, M.; Anderson, T.N. Performance of a building integrated photovoltaic/thermal concentrator for facade applications. Sol. Energy 2017, 153, 562–573. [Google Scholar] [CrossRef] [Green Version]
- Vats, K.; Tiwari, G.N. Energy and exergy analysis of a building integrated semitransparent photovoltaic thermal (BISPVT) system. Appl. Energy 2012, 96, 409–416. [Google Scholar] [CrossRef]
- Alqaed, S.; Mustafa, J.; Almehmadi, F.A. Design and Energy Requirements of a Photovoltaic-Thermal Powered Water Desalination Plant for the Middle East. Int. J. Environ. Res. Public Health 2021, 18, 1001. [Google Scholar] [CrossRef] [PubMed]
- Anand, B.; Shankar, R.; Murugavelh, S.; Rivera, W.; Midhun Prasad, K.; Nagarajan, R. A review on solar photovoltaic thermal integrated desalination technologies. Renew. Sustain. Energy Rev. 2021, 141, 110787. [Google Scholar] [CrossRef]
- Gabrielli, P.; Gazzani, M.; Novati, N.; Sutter, L.; Simonetti, R.; Molinaroli, L.; Manzolini, G.; Mazzotti, M. Combined water desalination and electricity generation through a humidification-dehumidification process integrated with photovoltaic-thermal modules: Design, performance analysis and techno-economic assessment. Energy Convers. Manag. X 2019, 1, 100004. [Google Scholar] [CrossRef]
- Ammous, M.; Chaabene, M. Photovoltaic thermal collectors: Reverse osmosis desalination system as an application. Appl. Sol. Energy 2017, 53, 152–160. [Google Scholar] [CrossRef]
- Hosseinzadeh, M.; Sardarabadi, M.; Passandideh-Fard, M. Energy and exergy analysis of nanofluid based photovoltaic thermal system integrated with phase change material. Energy 2018, 147, 636–647. [Google Scholar] [CrossRef]
- Hossain, M.S.; Pandey, A.K.; Selvaraj, J.; Rahim, N.A.; Islam, M.M.; Tyagi, V.V. Two side serpentine flow based photovoltaic-thermal-phase change materials (PVT-PCM) system: Energy, exergy and economic analysis. Renew. Energy 2019, 136, 1320–1336. [Google Scholar] [CrossRef]
- Weiss, W.; Dür, M.S. Solar Heat Worldwide; Global Market Development and Trends in 2020, Detailed Market Data 2019; AEE—Institute for Sustainable Technologies: Gleisdorf, Austria, 2021; pp. 1–83. [Google Scholar]
- Anaf Solar. The H-NRG Moving Energy for You. 2014. Available online: http://dansolar.dk/en/files/2014/04/brochure_HNRG.pdf (accessed on 7 July 2022).
- F.D.E. SOLAR SRL. FDE-HYBRID “The PV-Thermal Panel”. 2021. Available online: https://www.fdesolar.com/wp-content/uploads/2021/03/depliant-FDE-HYBRID-poly_mono.pdf (accessed on 7 July 2022).
- FOTOTHERM S.r.l. Serie AS 300/310/320. 2021. Available online: https://www.fototherm.com/wp-content/uploads/2021/09/FOTOTHERM-srl-Scheda-tecnica-AS-300_310_320-ita-engl-09-2021.pdf (accessed on 7 July 2022).
- Dachziegelwerke Nelskamp GmbH. MS 5 2Power Dachästhetik für Strom und Wärme. 2022. Available online: https://www.nelskamp.de/downloads/Energiedaecher/MS5_2Power/Datenblatt_MS52P.pdf (accessed on 7 July 2022).
- PA-ID Process GmbH. 2POWER HM 1000 Mono Black. 2015. Available online: https://www.enf.com.cn/Product/pdf/Crystalline/57ecb66bef3cd.pdf (accessed on 7 July 2022).
- Poly Solar Solutions AG. PIK® Combi Solar Collector, The New Generation of Modern Solar Technology: The Concept Is Heating with Solar Energy. 2014. Available online: http://www.pss-ag.com/media/archive1/prospekte/Prospekt_englisch.pdf (accessed on 7 July 2022).
- DualSun. SPRING 400 Shingle Black. 2021. Available online: https://my.dualsun.com/wp-content/uploads/sites/2/2021/11/DualSun-EN-Datasheet-SPRING-400-Shingle-Black.pdf (accessed on 7 July 2022).
- Solator GmbH. Datenblatt solator® PV + THERM AUFDACH. 2021. Available online: https://solator.funktionswerbung.com/wp-content/uploads/2021/09/Datenblatt-PVTHERMAU330-Version-07_21.pdf (accessed on 7 July 2022).
- WIOSUN For Renewable Energy Ltd. Clean Energy for Generations: Combined Module PV-Therm. 2019. Available online: https://wiosun.co/Wiosun_English.pdf (accessed on 7 July 2022).
- Endef Engineering S.L. Hybrid Solar Panel Ecomesh. 2020. Available online: https://endef.com/wp-content/uploads/2020/06/ecomesh_ENG.pdf (accessed on 7 July 2022).
- Zhejiang Shentai Solar Energy Co., Ltd. PVT Electricity/Hot Water. 2016. Available online: http://www.suntask.com/index.php?ac=article&at=read&did=104 (accessed on 7 July 2022).
- Abora Energy S.L. Abora aH72 SK: Hybrid Solar Panel with Simultaneous Thermal and Photovoltaic Production. 2022. Available online: https://abora-solar.com/pdf/AH72SK-EN.pdf (accessed on 7 July 2022).
- SOLIMPEKS Solar Energy Crop. Solar Thermal or Solar Photovoltaic? Solimpeks Says ‘Both’. 2022. Available online: https://solimpeks.com/wp-content/uploads/2022/01/Volther%C2%AE%EF%B8%8F-Excell.pdf (accessed on 7 July 2022).
- TES Group Limited. TESZEUS® Photovoltaic-Thermal Hybrid Solar Collector. 2022. Available online: http://www.tessolarwater.com/index_en.html?zeuspv-t.html&2 (accessed on 7 July 2022).
- Kirloskar Solar Technologies PVT. LTD. Electricity and Hot Water: Hybrid PV + Thermal. 2019. Available online: http://kirloskarsolar.com/wp-content/uploads/2019/03/CII-Power-panel1.pdf (accessed on 7 July 2022).
- Lv, J.; He, Z.; Zhao, G.; Li, X.; Hu, Z.; Zhang, J. Analysis on the performance of photovoltiac/thermal solar system. In Proceedings of the 2013 IEEE International Conference on Materials for Renewable Energy and Environment, Chengdu, China, 19–21 August 2013. [Google Scholar]
- Alzaabia, A.A.; Badawiyeha, N.K.; Hantousha, H.O.; Hamidb, A.K. Electrical/thermal performance of hybrid PV/T system in Sharjah, UAE. Int. J. Smart Grid Clean Energy (SGCE) 2014, 3, 385–389. [Google Scholar] [CrossRef] [Green Version]
- Good, C.; Resen, I.; Hestnes, A.G. Solar energy for net zero energy buildings—A comparison between solar thermal, PV and photovoltaic–thermal (PV/T) systems. Sol. Energy 2015, 122, 986–996. [Google Scholar] [CrossRef] [Green Version]
- Lämmle, M.; Oliva, A.; Hermann, M.; Kramer, K.; Kramer, W. PVT collector technologies in solar thermal systems: A systematic assessment of electrical and thermal yields with the novel characteristic temperature approach. Sol. Energy 2017, 155, 867–879. [Google Scholar] [CrossRef]
- Yang, X.; Sun, L.; Yuan, Y.; Zhao, X.; Cao, X. Experimental investigation on performance comparison of PV/T-PCM system and PV/T system. Renew. Energy 2018, 119, 152–159. [Google Scholar] [CrossRef]
- Abdullah, A.L.; Misha, S.; Tamaldin, N.; Rosli, M.A.M.; Sachit, F.A. Theoretical study and indoor experimental validation of performance of the new photovoltaic thermal solar collector (PVT) based water system. Case Stud. Therm. Eng. 2020, 18, 100595. [Google Scholar] [CrossRef]
- Ma, T.; Li, M.; Kazemian, A. Photovoltaic thermal module and solar thermal collector connected in series to produce electricity and high-grade heat simultaneously. Appl. Energy 2020, 261, 114380. [Google Scholar] [CrossRef]
- Boumaaraf, B.; Boumaaraf, H.; Ait-cheikh, M.S.; Khelifa, A. Experimental energy improvement of a special design heat exchanger-based hybrid solar collector for a photovoltaic module square surface. Environ. Sci. Pollut. Res. 2021, 28, 61246–61257. [Google Scholar] [CrossRef]
- Lari, M.O.; Sahin, A.Z. Design, performance and economic analysis of a nanofluid-based photovoltaic/thermal system for residential applications. Energy Convers. Manag. 2017, 149, 467–484. [Google Scholar] [CrossRef]
- Shahsavar, A. Experimental evaluation of energy and exergy performance of a nanofluid-based photovoltaic/thermal system equipped with a sheet-and-sinusoidal serpentine tube collector. J. Clean. Prod. 2021, 287, 125064. [Google Scholar] [CrossRef]
- Gupta, A.; Agrawal, S.; Pal, Y. Performance analysis of the photovoltaic-thermoelectric system combined with serpentine type water collector. Int. J. Energy Res. 2021, 45, 19147–19164. [Google Scholar] [CrossRef]
- Aste, N.; Del Pero, C.; Leonforte, F. Thermal-electrical Optimization of the Configuration a Liquid PVT Collector. Energy Procedia 2012, 30, 1–7. [Google Scholar] [CrossRef] [Green Version]
- El Hocine, H.B.C.; Touafek, K.; Kerrour, F. Theoretical and experimental studies of a new configuration of photovoltaic-thermal collector. J. Sol. Energy Eng. Trans. ASME 2017, 139, 021012. [Google Scholar] [CrossRef]
- Senthilraja, S.; Gangadevi, R.; Marimuthu, R.; Baskaran, M. Performance evaluation of water and air based PVT solar collector for hydrogen production application. Int. J. Hydrog. Energy 2020, 45, 7498–7507. [Google Scholar] [CrossRef]
- Bhattacharjee, S.; Acharya, S.; Potar, A.; Meena, A.; Bairwa, D.S.; Meena, D.; Bhagora, M.; Meena, P.; Gautam, P.K. An investigational back surface cooling approach with different designs of heat-absorbing pipe for PV/T system. Int. J. Energy Res. 2018, 42, 1921–1933. [Google Scholar] [CrossRef]
- Razali, N.F.M.; Fudholi, A.; Ruslan, M.H.; Sopian, K. Electrical characteristic of photovoltaic thermal collector with water-multiwalled carbon nanotube nanofluid flow. Indones. J. Electr. Eng. Comput. Sci. 2019, 13, 324–330. [Google Scholar] [CrossRef]
- Baranwal, N.K.; Singhal, M.K. Modeling and Simulation of a Spiral Type Hybrid Photovoltaic Thermal (PV/T) Water Collector Using ANSYS; Springer: Singapore, 2021; pp. 127–139. [Google Scholar] [CrossRef]
- Fayaz, H.; Nasrin, R.; Rahim, N.A.; Hasanuzzaman, M. Energy and exergy analysis of the PVT system: Effect of nanofluid flow rate. Sol. Energy 2018, 169, 217–230. [Google Scholar] [CrossRef]
- Nahar, A.; Hasanuzzaman, M.; Rahim, N.A. A Three-Dimensional Comprehensive Numerical Investigation of Different Operating Parameters on the Performance of a Photovoltaic Thermal System with Pancake Collector. J. Sol. Energy Eng. Trans. ASME 2017, 139, 031009. [Google Scholar] [CrossRef]
- Gutierrez-Miravete, E.; Fontenault, B. Modeling a Combined Photovoltaic-Thermal Panel. In Proceedings of the 2012 COMSOL Conference, Milan, Italy, 10 October 2012. [Google Scholar]
- Usama Siddiqui, M.; Arif, A.F.M.; Kelley, L.; Dubowsky, S. Three-dimensional thermal modeling of a photovoltaic module under varying conditions. Sol. Energy 2012, 86, 2620–2631. [Google Scholar] [CrossRef]
- Simón Allué, R.; Guedea, I.; Villén, R.; Brun, G. Experimental study of Phase Change Material influence on different models of Photovoltaic-Thermal collectors. Sol. Energy 2019, 190, 1–9. [Google Scholar] [CrossRef]
- Al-Shamani, A.N.; Sopian, K.; Mat, S.; Hasan, H.A.; Abed, A.M.; Ruslan, M.H. Experimental studies of rectangular tube absorber photovoltaic thermal collector with various types of nanofluids under the tropical climate conditions. Energy Convers. Manag. 2016, 124, 528–542. [Google Scholar] [CrossRef]
- Brötje, S.; Kirchner, M.; Giovannetti, F. Performance and heat transfer analysis of uncovered photovoltaic-thermal collectors with detachable compound. Sol. Energy 2018, 170, 406–418. [Google Scholar] [CrossRef]
- Leonforte, F.; Del Pero, C.; Aste, N.; Miglioli, A. Electrical characterization and comparison of a novel covered PVT collector. In Proceedings of the ICCEP 2019—7th International Conference on Clean Electrical Power: Renewable Energy Resources Impact, Otranto, Italy, 2–4 July 2019; pp. 214–220. [Google Scholar] [CrossRef]
- Rejeb, O.; Gaillard, L.; Giroux-Julien, S.; Ghenai, C.; Jemni, A.; Bettayeb, M.; Menezo, C. Novel solar PV/Thermal collector design for the enhancement of thermal and electrical performances. Renew. Energy 2020, 146, 610–627. [Google Scholar] [CrossRef]
- Nasrin, R.; Rahim, N.A.; Fayaz, H.; Hasanuzzaman, M. Water/MWCNT nanofluid based cooling system of PVT: Experimental and numerical research. Renew. Energy 2018, 121, 286–300. [Google Scholar] [CrossRef]
- Fayaz, H.; Rahim, N.A.; Hasanuzzaman, M.; Rivai, A.; Nasrin, R. Numerical and outdoor real time experimental investigation of performance of PCM based PVT system. Sol. Energy 2019, 179, 135–150. [Google Scholar] [CrossRef]
- Abdallah, S.R.; Saidani-Scott, H.; Abdellatif, O.E. Performance analysis for hybrid PV/T system using low concentration MWCNT (water-based) nanofluid. Sol. Energy 2019, 181, 108–115. [Google Scholar] [CrossRef]
- Ahmed, A.; Baig, H.; Sundaram, S.; Mallick, T.K. Use of nanofluids in solar PV/thermal systems. Int. J. Photoenergy 2019, 2019, 8039129. [Google Scholar] [CrossRef] [Green Version]
- Yousefi, T.; Veysi, F.; Shojaeizadeh, E.; Zinadini, S. An experimental investigation on the effect of Al2O3–H2O nanofluid on the efficiency of flat-plate solar collectors. Renew. Energy 2012, 39, 293–298. [Google Scholar] [CrossRef]
- Zamen, M.; Kahani, M.; Rostami, B.; Bargahi, M. Application of Al2O3/water nanofluid as the coolant in a new design of photovoltaic/thermal system: An experimental study. Energy Sci. Eng. 2022. Online Version of Record. [Google Scholar] [CrossRef]
- Sardarabadi, M.; Passandideh-Fard, M. Experimental and numerical study of metal-oxides/water nanofluids as coolant in photovoltaic thermal systems (PVT). Sol. Energy Mater. Sol. Cells 2016, 157, 533–542. [Google Scholar] [CrossRef]
- Alsalame, H.A.M.; Lee, J.H.; Lee, G.H. Performance Evaluation of a Photovoltaic Thermal (PVT) System Using Nanofluids. Energies 2021, 14, 301. [Google Scholar] [CrossRef]
- Aravind, S.S.J.; Ramaprabhu, S. Graphene–multiwalled carbon nanotube-based nanofluids for improved heat dissipation. RSC Adv. 2013, 3, 4199–4206. [Google Scholar] [CrossRef]
- Abdelrazik, A.S.; Al-Sulaiman, F.A.; Saidur, R.; Ben-Mansour, R. A review on recent development for the design and packaging of hybrid photovoltaic/thermal (PV/T) solar systems. Renew. Sustain. Energy Rev. 2018, 95, 110–129. [Google Scholar] [CrossRef]
- Alous, S.; Kayfeci, M.; Uysal, A. Experimental investigations of using MWCNTs and graphene nanoplatelets water-based nanofluids as coolants in PVT systems. Appl. Therm. Eng. 2019, 162, 114265. [Google Scholar] [CrossRef]
- Hussain, M.I.; Kim, J.T. Conventional fluid- and nanofluid-based photovoltaic thermal (PV/T) systems: A techno-economic and environmental analysis. Int. J. Green Energy 2018, 15, 596–604. [Google Scholar] [CrossRef]
- Faizal, M.; Saidur, R.; Mekhilef, S.; Alim, M.A. Energy, economic and environmental analysis of metal oxides nanofluid for flat-plate solar collector. Energy Convers. Manag. 2013, 76, 162–168. [Google Scholar] [CrossRef]
- Sahota, L.; Tiwari, G.N. Exergoeconomic and enviroeconomic analyses of hybrid double slope solar still loaded with nanofluids. Energy Convers. Manag. 2017, 148, 413–430. [Google Scholar] [CrossRef]
- Al-Shamani, A.N.; Alghoul, M.A.; Elbreki, A.M.; Ammar, A.A.; Abed, A.M.; Sopian, K. Mathematical and experimental evaluation of thermal and electrical efficiency of PV/T collector using different water based nano-fluids. Energy 2018, 145, 770–792. [Google Scholar] [CrossRef]
- Nasrin, R.; Hasanuzzaman, M.; Rahim, N.A. Effect of nanofluids on heat transfer and cooling system of the photovoltaic/thermal performance. Int. J. Numer. Methods Heat Fluid Flow 2019, 29, 1920–1946. [Google Scholar] [CrossRef]
- Al-Waeli, A.H.A.; Sopian, K.; Chaichan, M.T.; Kazem, H.A.; Hasan, H.A.; Al-Shamani, A.N. An experimental investigation of SiC nanofluid as a base-fluid for a photovoltaic thermal PV/T system. Energy Convers. Manag. 2017, 142, 547–558. [Google Scholar] [CrossRef]
- Ghadiri, M.; Sardarabadi, M.; Pasandideh-fard, M.; Moghadam, A.J. Experimental investigation of a PVT system performance using nano ferrofluids. Energy Convers. Manag. 2015, 103, 468–476. [Google Scholar] [CrossRef]
- Khan, J.; Ali, R.; Zubair, M.; Yahya, S.M. Energy and Life Cycle Assessment of Zinc/Water Nanofluid Based Photovoltaic Thermal System. Energy Eng. J. Assoc. Energy Eng. 2022, 119, 827–846. [Google Scholar] [CrossRef]
- Hassani, S.; Saidur, R.; Mekhilef, S.; Taylor, R.A. Environmental and exergy benefit of nanofluid-based hybrid PV/T systems. Energy Convers. Manag. 2016, 123, 431–444. [Google Scholar] [CrossRef]
- Abadeh, A.; Rejeb, O.; Sardarabadi, M.; Menezo, C.; Passandideh-Fard, M.; Jemni, A. Economic and environmental analysis of using metal-oxides/water nanofluid in photovoltaic thermal systems (PVTs). Energy 2018, 159, 1234–1243. [Google Scholar] [CrossRef]
- Faizal, M.; Saidur, R.; Mekhilef, S.; Hepbasli, A.; Mahbubul, I.M. Energy, economic, and environmental analysis of a flat-plate solar collector operated with SiO2 nanofluid. Clean Technol. Environ. Policy 2014, 17, 1457–1473. [Google Scholar] [CrossRef] [Green Version]
- Michael Joseph Stalin, P.; Arjunan, T.V.; Matheswaran, M.M.; Dolli, H.; Sadanandam, N. Energy, economic and environmental investigation of a flat plate solar collector with CeO2/water nanofluid. J. Therm. Anal. Calorim. 2019, 139, 3219–3233. [Google Scholar] [CrossRef]
- Schrand, A.M.; Rahman, M.F.; Hussain, S.M.; Schlager, J.J.; Smith, D.A.; Syed, A.F. Metal-based nanoparticles and their toxicity assessment. Wiley Interdiscip. Rev. Nanomed. Nanobiotechnol. 2010, 2, 544–568. [Google Scholar] [CrossRef] [Green Version]
- Khanafer, K.; Vafai, K. A review on the applications of nanofluids in solar energy field. Renew. Energy 2018, 123, 398–406. [Google Scholar] [CrossRef]
- Aslfattahi, N.; Samylingam, L.; Abdelrazik, A.S.; Arifutzzaman, A.; Saidur, R. MXene based new class of silicone oil nanofluids for the performance improvement of concentrated photovoltaic thermal collector. Sol. Energy Mater. Sol. Cells 2020, 211, 110526. [Google Scholar] [CrossRef]
- Hoffmann, J.F.; Vaitilingom, G.; Henry, J.F.; Chirtoc, M.; Olives, R.; Goetz, V.; Py, X. Temperature dependence of thermophysical and rheological properties of seven vegetable oils in view of their use as heat transfer fluids in concentrated solar plants. Sol. Energy Mater. Sol. Cells 2018, 178, 129–138. [Google Scholar] [CrossRef]
- Kenda, E.S.; N’Tsoukpoe, K.E.; Ouédraogo, I.W.K.; Coulibaly, Y.; Py, X.; Ouédraogo, F.M.A.W. Jatropha curcas crude oil as heat transfer fluid or thermal energy storage material for concentrating solar power plants. Energy Sustain. Dev. 2017, 40, 59–67. [Google Scholar] [CrossRef]
- Huang, W.; Marefati, M. Energy, exergy, environmental and economic comparison of various solar thermal systems using water and Thermia Oil B base fluids, and CuO and Al2O3 nanofluids. Energy Rep. 2020, 6, 2919–2947. [Google Scholar] [CrossRef]
- Samylingam, L.; Aslfattahi, N.; Saidur, R.; Yahya, S.M.; Afzal, A.; Arifutzzaman, A.; Tan, K.H.; Kadirgama, K. Thermal and energy performance improvement of hybrid PV/T system by using olein palm oil with MXene as a new class of heat transfer fluid. Sol. Energy Mater. Sol. Cells 2020, 218, 110754. [Google Scholar] [CrossRef]
- Rubbi, F.; Habib, K.; Saidur, R.; Aslfattahi, N.; Yahya, S.M.; Das, L. Performance optimization of a hybrid PV/T solar system using Soybean oil/MXene nanofluids as A new class of heat transfer fluids. Sol. Energy 2020, 208, 124–138. [Google Scholar] [CrossRef]
- Vatanpour, V.; Madaeni, S.S.; Moradian, R.; Zinadini, S.; Astinchap, B. Fabrication and characterization of novel antifouling nanofiltration membrane prepared from oxidized multiwalled carbon nanotube/polyethersulfone nanocomposite. J. Membr. Sci. 2011, 375, 284–294. [Google Scholar] [CrossRef]
- Hader, M.; Al-Kouz, W. Performance of a hybrid photovoltaic/thermal system utilizing water-Al2O3 nanofluid and fins. Int. J. Energy Res. 2019, 43, 219–230. [Google Scholar] [CrossRef] [Green Version]
- Khanjari, Y.; Pourfayaz, F.; Kasaeian, A.B. Numerical investigation on using of nanofluid in a water-cooled photovoltaic thermal system. Energy Convers. Manag. 2016, 122, 263–278. [Google Scholar] [CrossRef]
- Al-Waeli, A.H.A.; Chaichan, M.T.; Kazem, H.A.; Sopian, K. Comparative study to use nano-(Al2O3, CuO, and SiC) with water to enhance photovoltaic thermal PV/T collectors. Energy Convers. Manag. 2017, 148, 963–973. [Google Scholar] [CrossRef]
- Solangi, K.H.; Kazi, S.N.; Luhur, M.R.; Badarudin, A.; Amiri, A.; Sadri, R.; Zubir, M.N.M.; Gharehkhani, S.; Teng, K.H. A comprehensive review of thermo-physical properties and convective heat transfer to nanofluids. Energy 2015, 89, 1065–1086. [Google Scholar] [CrossRef]
- Maheshwary, P.B.; Handa, C.C.; Nemade, K.R. A comprehensive study of effect of concentration, particle size and particle shape on thermal conductivity of titania/water based nanofluid. Appl. Therm. Eng. 2017, 119, 79–88. [Google Scholar] [CrossRef]
- Lee, J.; Mudawar, I. Assessment of the effectiveness of nanofluids for single-phase and two-phase heat transfer in micro-channels. Int. J. Heat Mass Transfer. 2007, 50, 452–463. [Google Scholar] [CrossRef]
- Sardarabadi, M.; Passandideh-Fard, M.; Zeinali Heris, S. Experimental investigation of the effects of silica/water nanofluid on PV/T (photovoltaic thermal units). Energy 2014, 66, 264–272. [Google Scholar] [CrossRef]
- Ambreen, T.; Kim, M.H. Influence of particle size on the effective thermal conductivity of nanofluids: A critical review. Appl. Energy 2020, 264, 114684. [Google Scholar] [CrossRef]
- Hu, G.; Ning, X.; Hussain, M.; Sajjad, U.; Sultan, M.; Ali, H.M.; Shah, T.R.; Ahmad, H. Potential evaluation of hybrid nanofluids for solar thermal energy harvesting: A review of recent advances. Sustain. Energy Technol. Assess. 2021, 48, 101651. [Google Scholar] [CrossRef]
- Goshayeshi, H.R.; Safaei, M.R.; Goodarzi, M.; Dahari, M. Particle size and type effects on heat transfer enhancement of Ferro-nanofluids in a pulsating heat pipe. Powder Technol. 2016, 301, 1218–1226. [Google Scholar] [CrossRef]
- Xu, P.; Zhang, X.; Shen, J.; Wu, Y.; Connelly, K.; Yang, T.; Tang, L.; Xiao, M.; Wei, Y. A review of thermal absorbers and their integration methods for the combined solar photovoltaic/thermal (PV/T) modules. Renew. Sustain. Energy Rev. 2017, 75, 839–854. [Google Scholar] [CrossRef]
- Nahar, A.; Hasanuzzaman, M.; Rahim, N.A.; Parvin, S. Numerical investigation on the effect of different parameters in enhancing heat transfer performance of photovoltaic thermal systems. Renew. Energy 2019, 132, 284–295. [Google Scholar] [CrossRef]
- Prasetyo, S.D.; Prabowo, A.R.; Arifin, Z. The effect of collector design in increasing PVT performance: Current state and milestone. Mater. Today Proc. 2022, 63, S1–S9. [Google Scholar] [CrossRef]
- Nižetić, S.; Jurčević, M.; Čoko, D.; Arıcı, M.; Hoang, A.T. Implementation of phase change materials for thermal regulation of photovoltaic thermal systems: Comprehensive analysis of design approaches. Energy 2021, 228, 120546. [Google Scholar] [CrossRef]
Figure 1.
The number of search results using the keyword “PVT photovoltaic thermal” from Scopus and Web of Science databases.
Figure 1.
The number of search results using the keyword “PVT photovoltaic thermal” from Scopus and Web of Science databases.

Figure 3.
(a) The illustration of proposed BIPVT on roofing panel and (b) BIPVT cross-section. Adapted with permission from ref. [66]. 2013. Yin et al.
Figure 3.
(a) The illustration of proposed BIPVT on roofing panel and (b) BIPVT cross-section. Adapted with permission from ref. [66]. 2013. Yin et al.

Figure 4.
PVT systems utilization worldwide based on application. Data from ref. [76]. 2019. Weiss & Dür.
Figure 4.
PVT systems utilization worldwide based on application. Data from ref. [76]. 2019. Weiss & Dür.

Figure 5.
Model design of serpentine and sinusoidal serpentine configuration. Reprinted with permission from Ref. [101]. 2021. Shahsavar, A.
Figure 5.
Model design of serpentine and sinusoidal serpentine configuration. Reprinted with permission from Ref. [101]. 2021. Shahsavar, A.

Figure 6.
PVT thermal absorber with two sides serpentine configuration. Reprinted with permission from Ref. [75]. 2019. Hossain et al.
Figure 6.
PVT thermal absorber with two sides serpentine configuration. Reprinted with permission from Ref. [75]. 2019. Hossain et al.

Figure 7.
ST-PVT thermal collectors with harp design (a) Front view. Reprinted with permission from Ref. [56]. 2011. He et al. (b) The configuration of collector. Reprinted with permission from Ref. [50]. 2012. Akisawa et al.

Figure 8.
A modification of harp ST-PVT with a combination of two thermal absorbers, redrawn from El Hocine et al. [104].
Figure 8.
A modification of harp ST-PVT with a combination of two thermal absorbers, redrawn from El Hocine et al. [104].

Figure 9.
A modified spiral configuration for PVT-assisted hydrogen production. Adapted with permission from Ref. [105]. 2020. Senthilraja et al.
Figure 9.
A modified spiral configuration for PVT-assisted hydrogen production. Adapted with permission from Ref. [105]. 2020. Senthilraja et al.

Figure 10.
Experimental arrangement of PVT (a) semioval serpentine and (b) circular spiral. Reprinted with permission from Ref. [106]. 2018. Bhattacharjee et al.
Figure 10.
Experimental arrangement of PVT (a) semioval serpentine and (b) circular spiral. Reprinted with permission from Ref. [106]. 2018. Bhattacharjee et al.

Figure 11.
Thermal collector with harp and spiral design. Reprinted with permission from Ref. [41]. 2020. Verma et al.
Figure 11.
Thermal collector with harp and spiral design. Reprinted with permission from Ref. [41]. 2020. Verma et al.

Figure 12.
Several designs on sheet and tube thermal collectors; (a) Web flow, (b) direct flow, and (c) spiral flow. Reprinted with permission from Ref. [8]. 2014. Fudholi et al.
Figure 12.
Several designs on sheet and tube thermal collectors; (a) Web flow, (b) direct flow, and (c) spiral flow. Reprinted with permission from Ref. [8]. 2014. Fudholi et al.

Figure 13.
Proposed stainless steel PVT collector design. Reprinted with permission from Ref. [114]. 2016. Al-Shamani et al.
Figure 13.
Proposed stainless steel PVT collector design. Reprinted with permission from Ref. [114]. 2016. Al-Shamani et al.

Figure 14.
The fabrication process and outdoor experimental setup of PVT and PVT-PCM systems. Reprinted with permission from Ref. [119]. 2019. Fayaz et al.
Figure 14.
The fabrication process and outdoor experimental setup of PVT and PVT-PCM systems. Reprinted with permission from Ref. [119]. 2019. Fayaz et al.

Figure 15.
Nanoparticle classification [121].
Figure 15.
Nanoparticle classification [121].

Figure 16.
Research on nanoparticles in PVT systems. Reproduced with permission from ref. [34]. 2021. Sheikholeslami et al.
Figure 16.
Research on nanoparticles in PVT systems. Reproduced with permission from ref. [34]. 2021. Sheikholeslami et al.


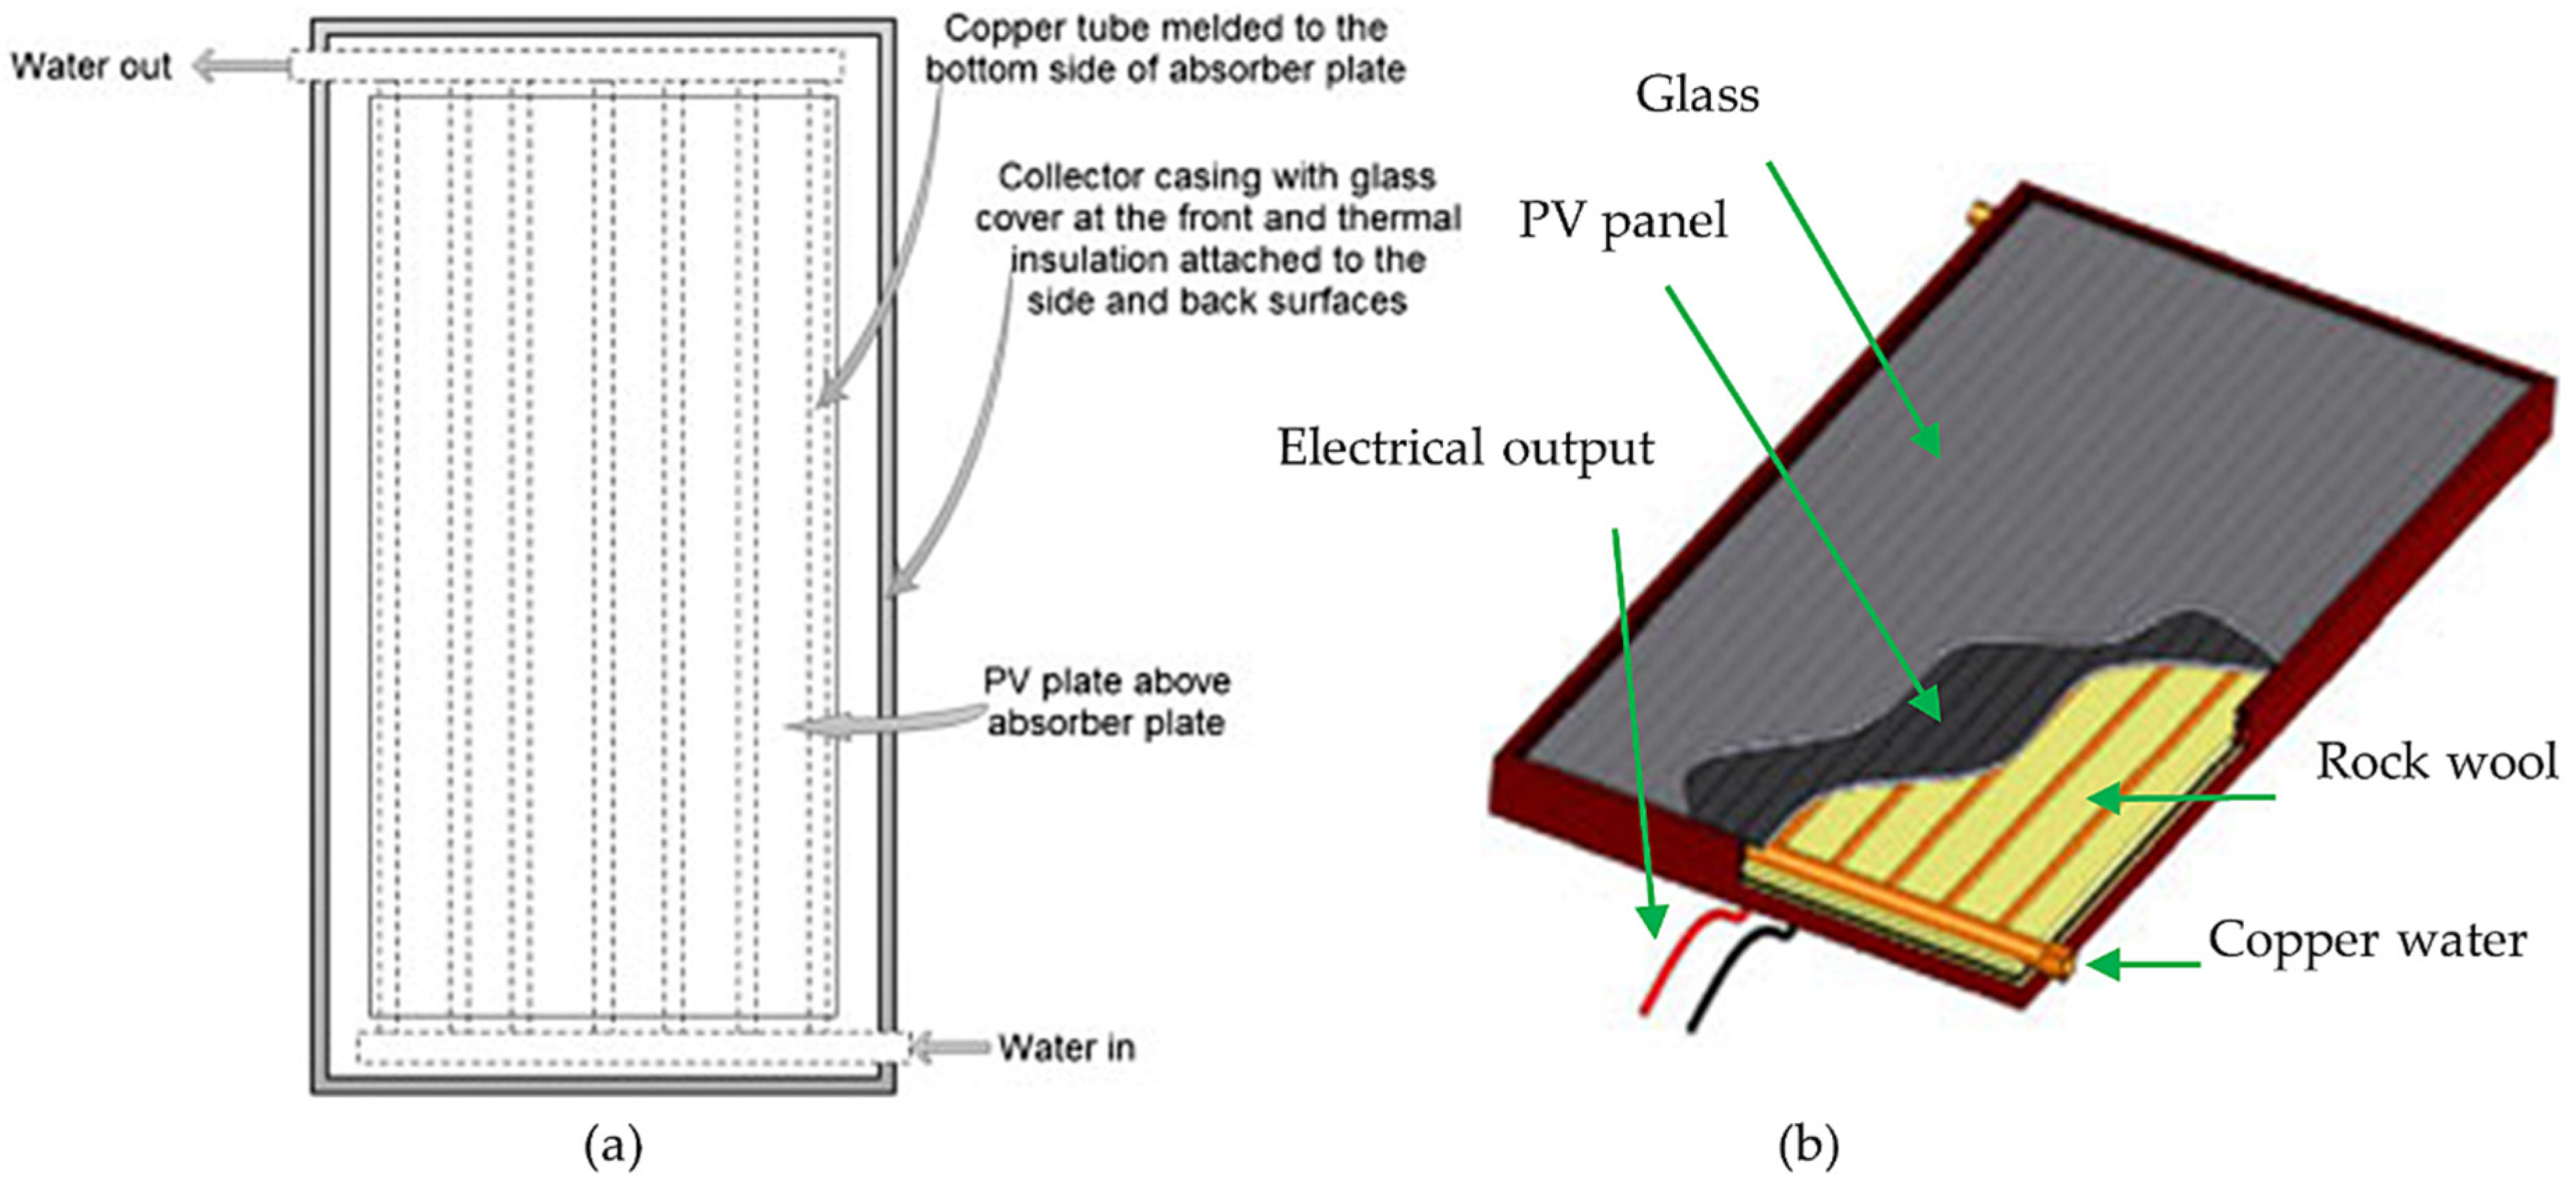
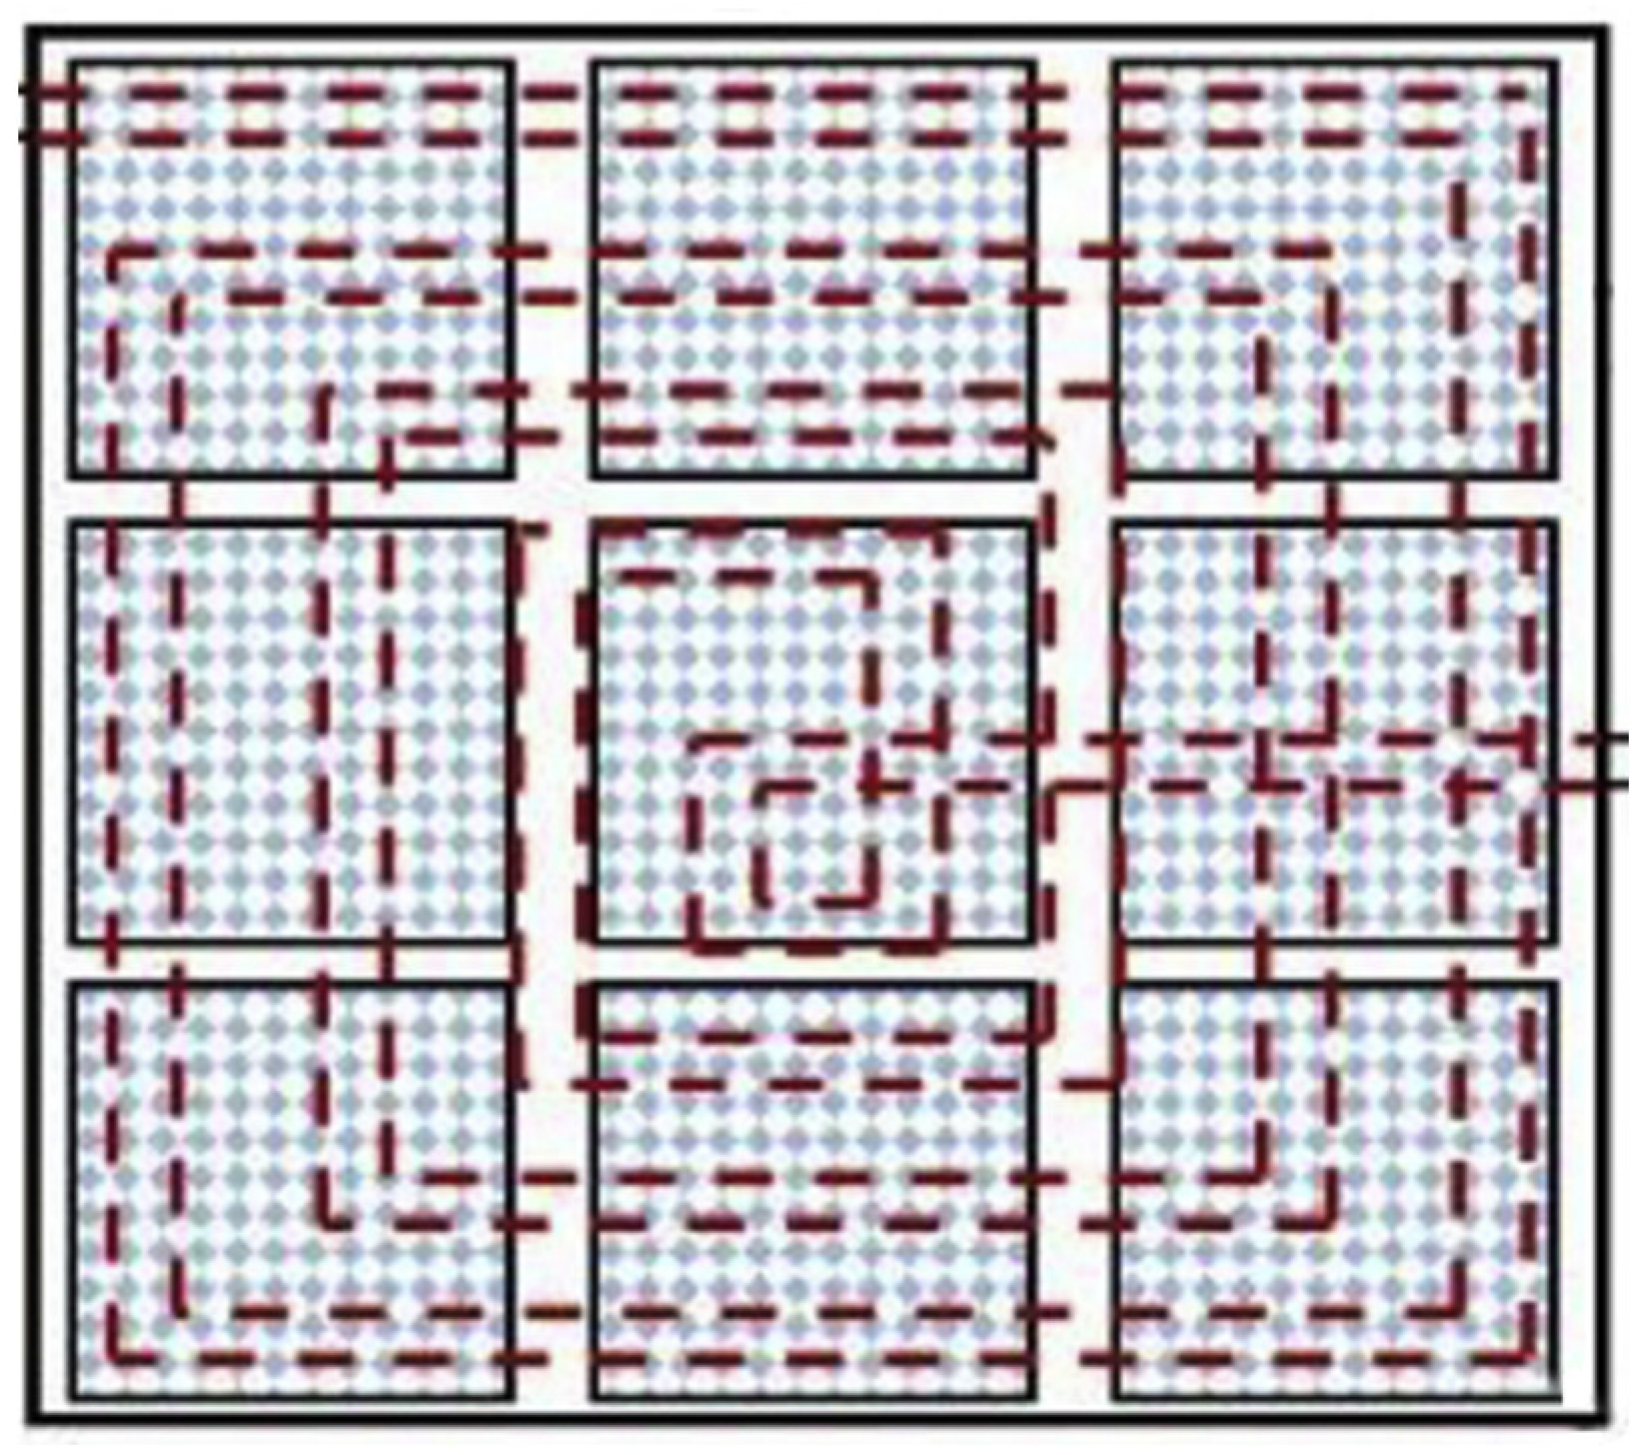
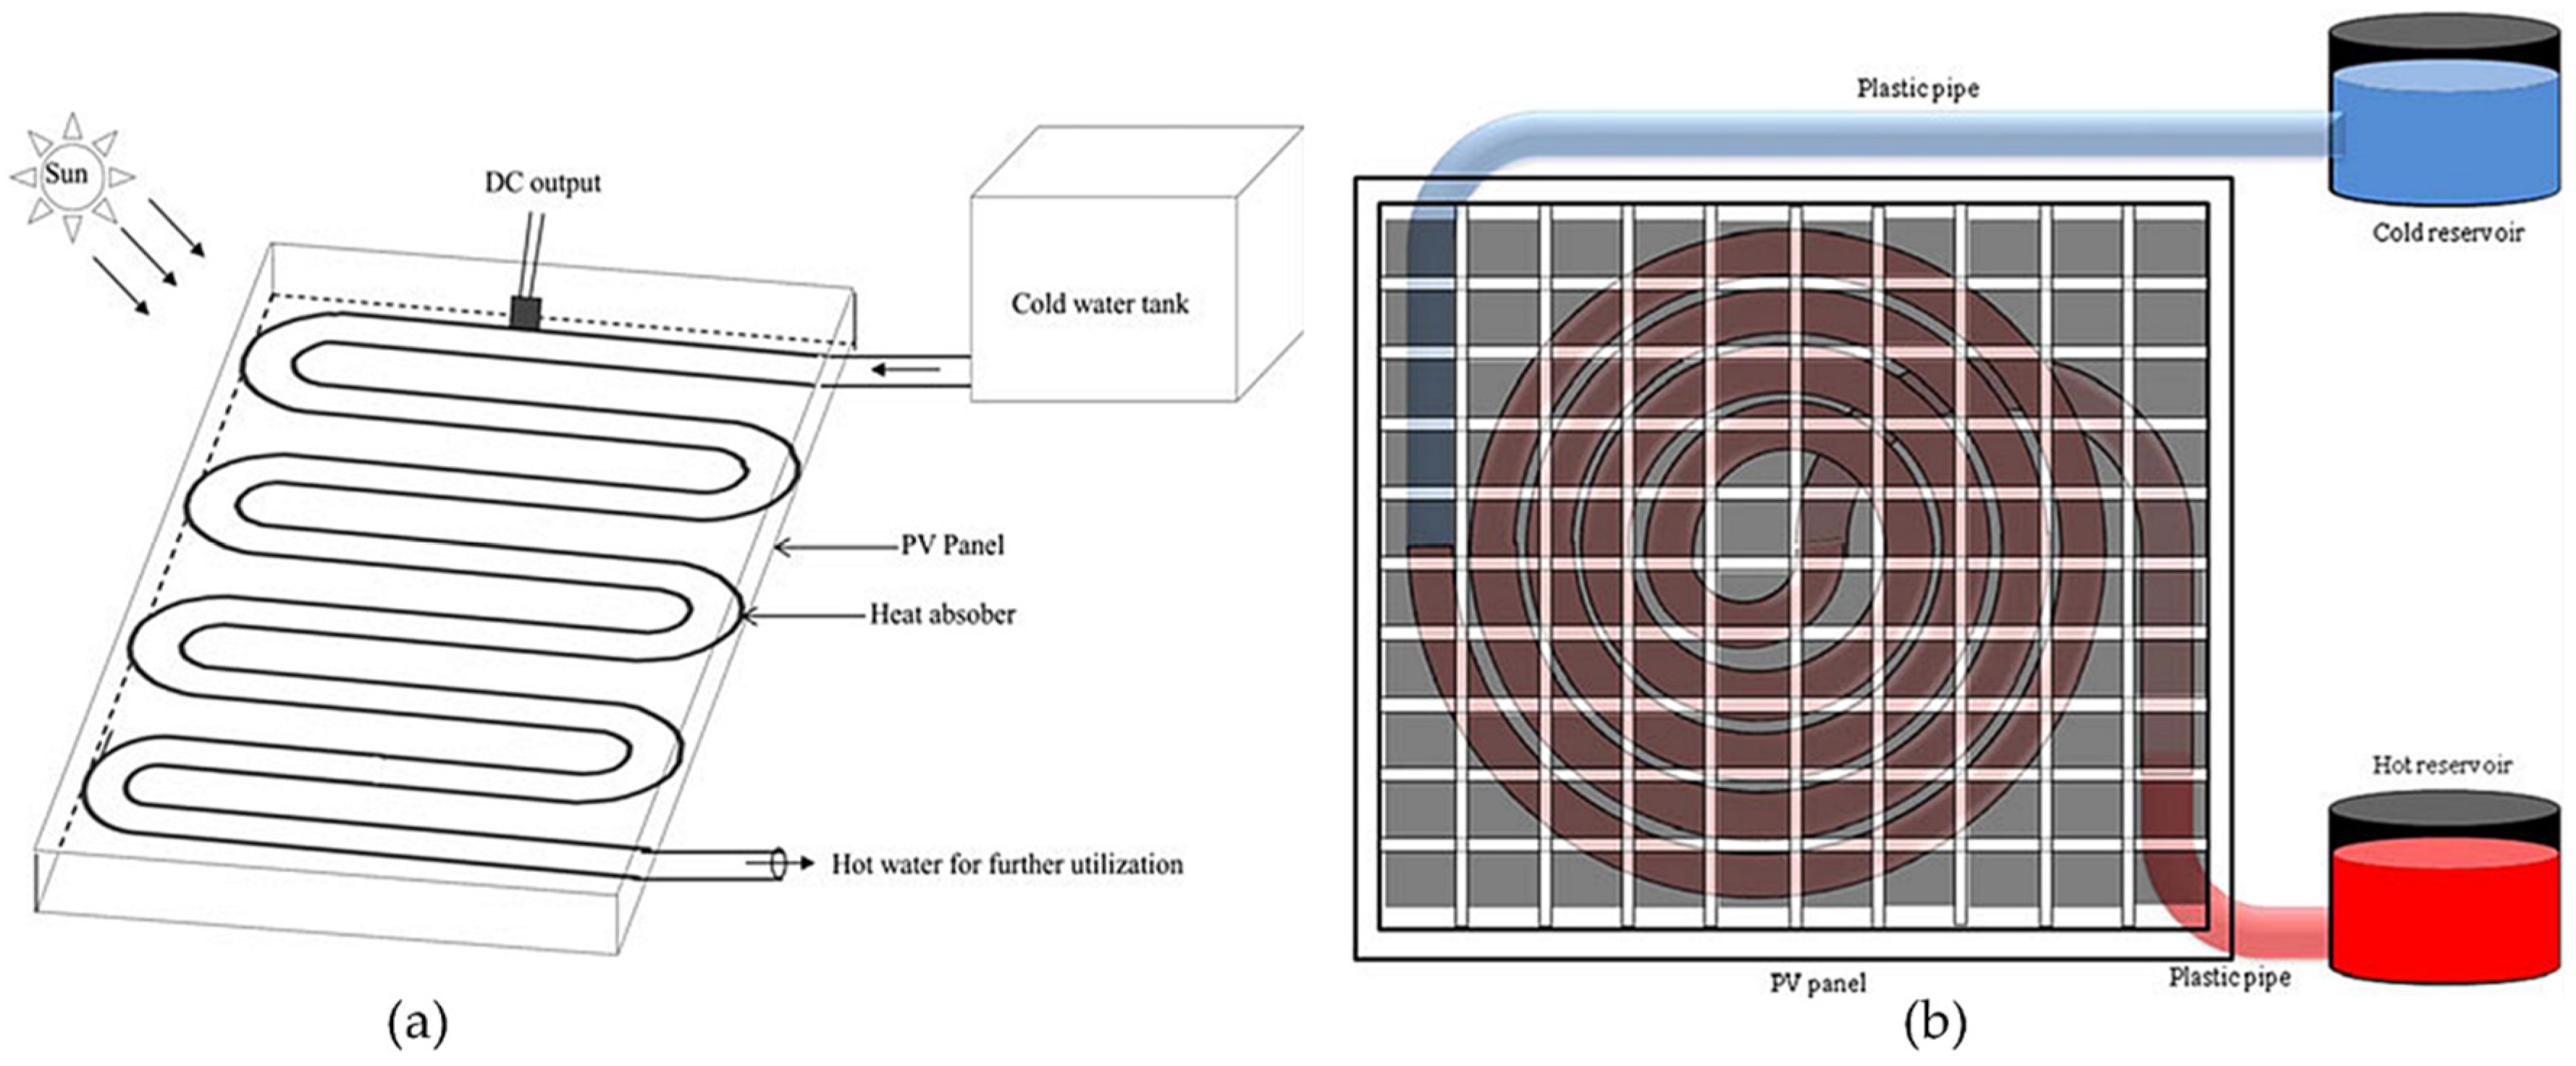
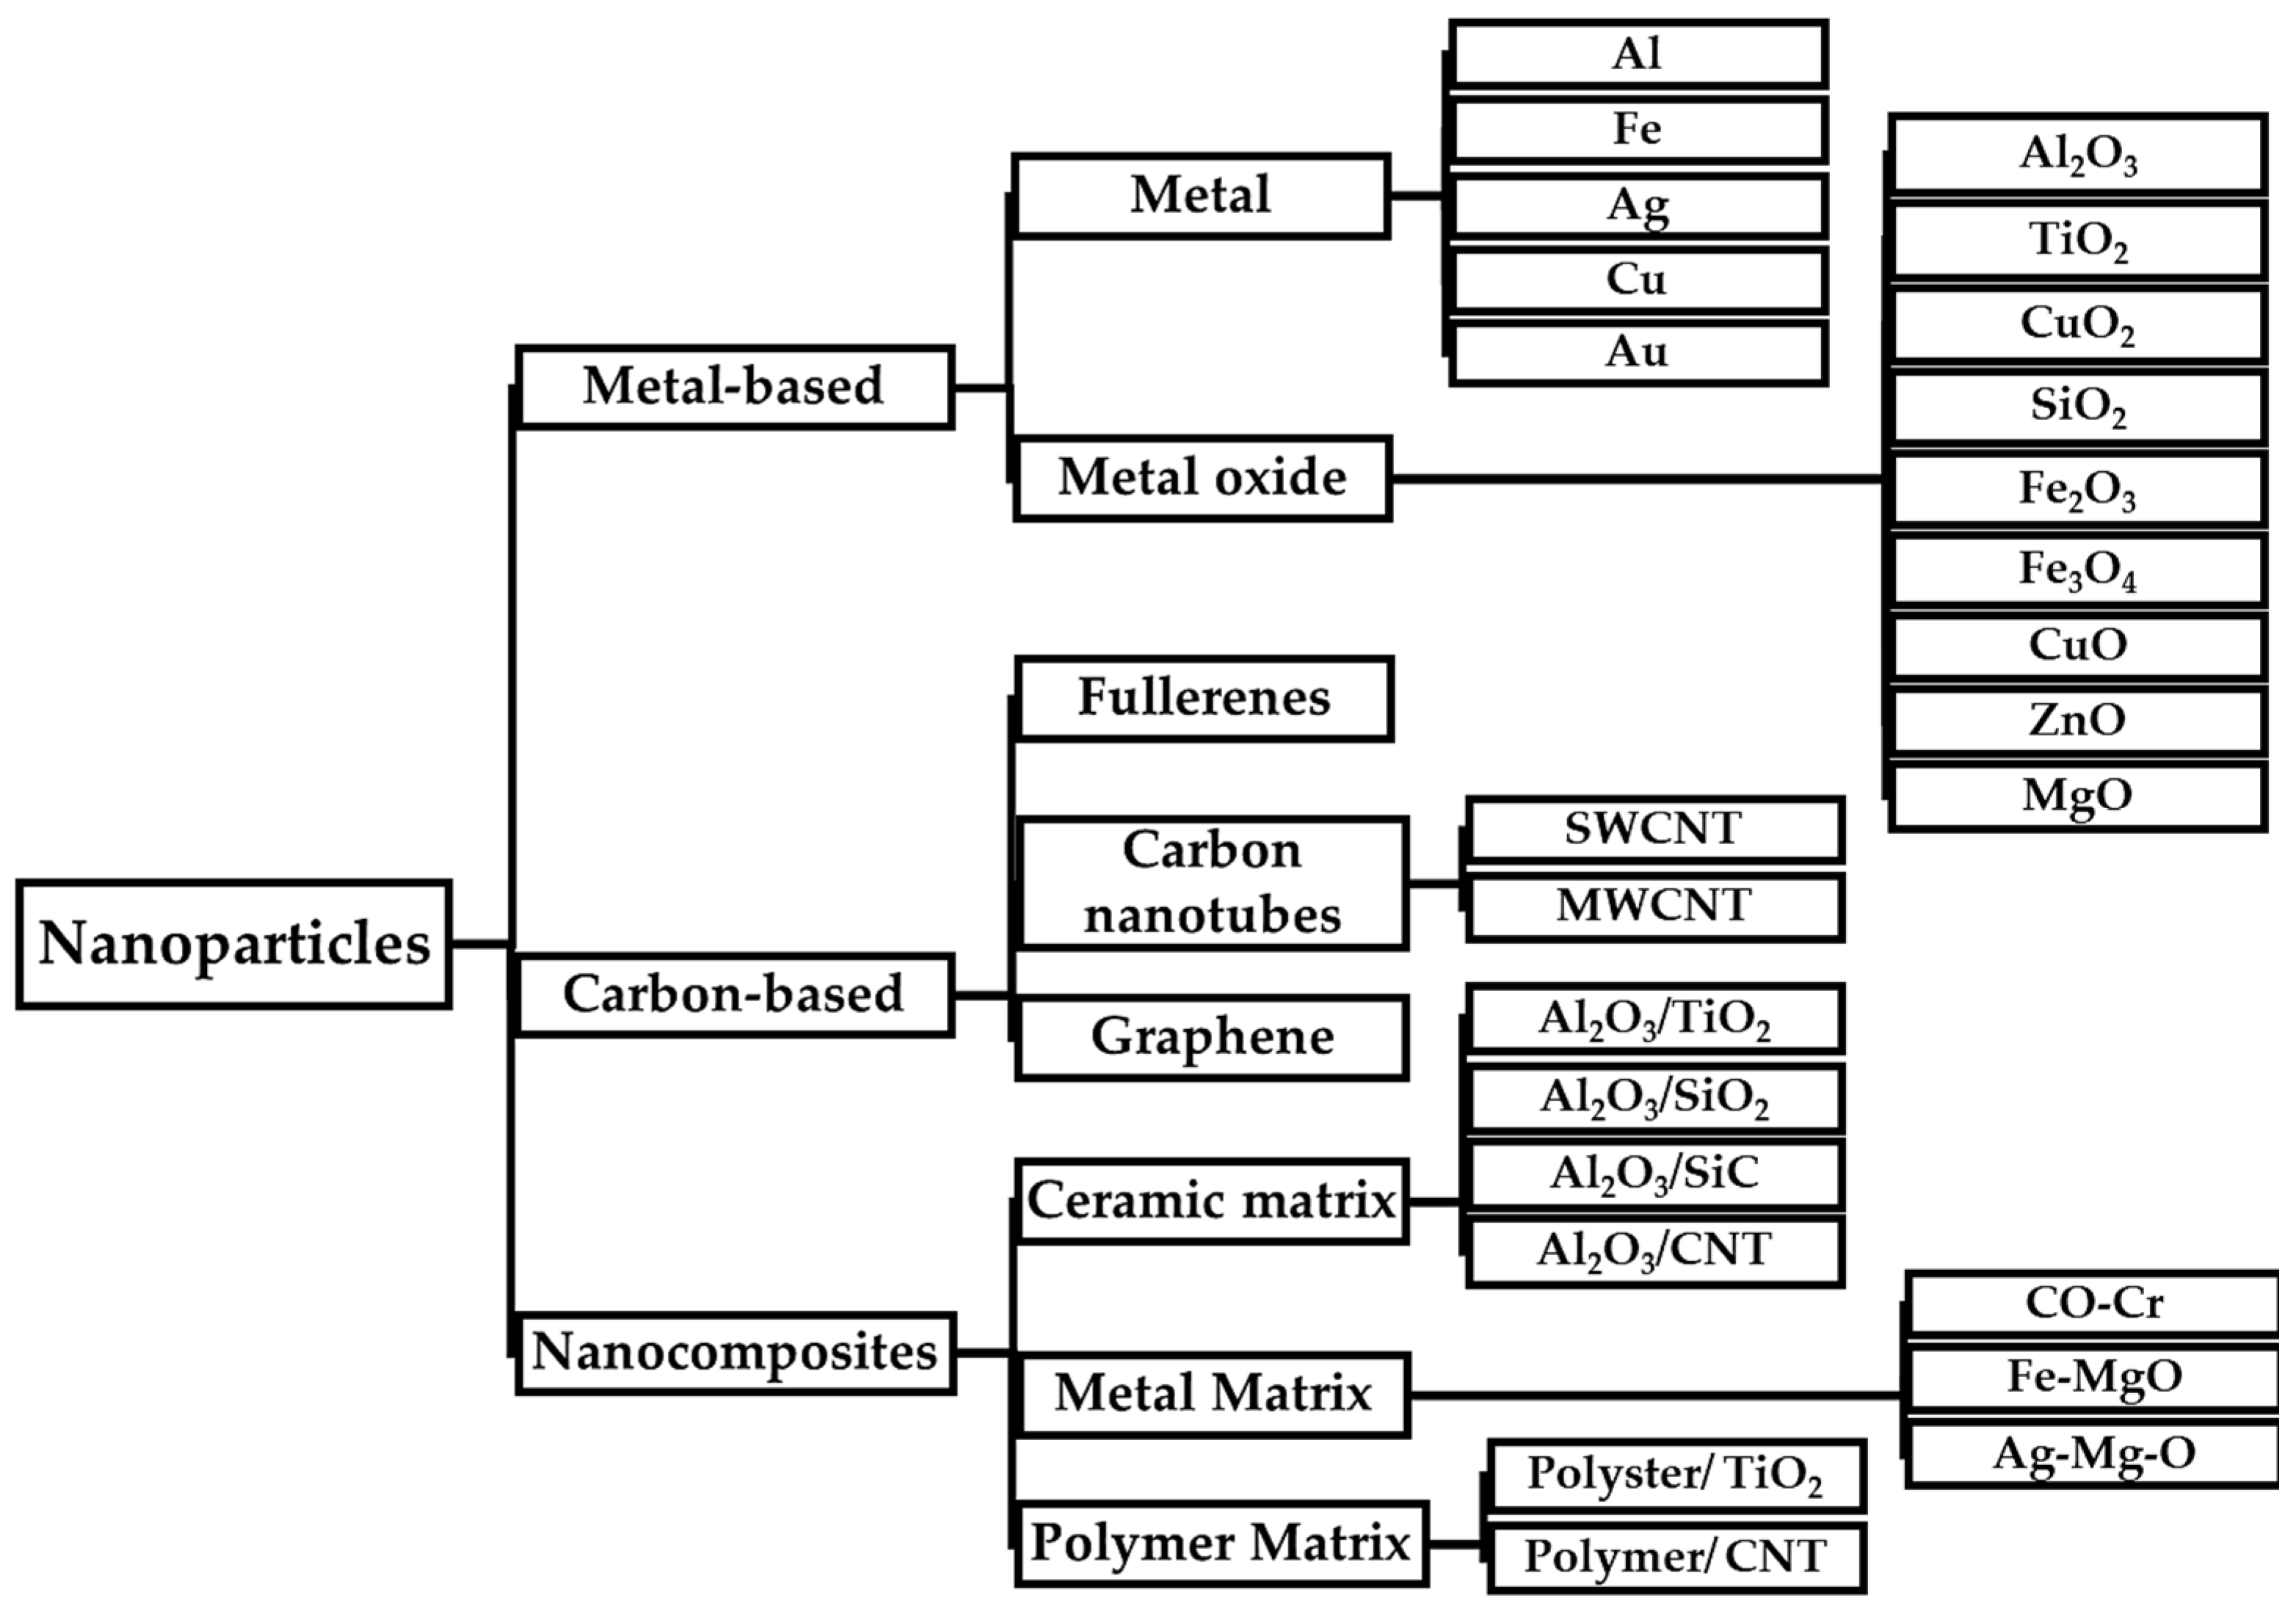
Table 1.
List of previous review papers on PVT systems.
| Authors | Year | Review Focus |
|---|---|---|
| Zondag [10] | 2008 | PVT-FPC system |
| Chow [1] | 2010 | PVT technology |
| Ibrahim et al. [11] | 2011 | PVT-FPC recent development |
| Tyagi et al. [12] | 2012 | PVT collector technology progress |
| Zhang et al. [13] | 2012 | Research and development progress of PVT application |
| Aste et al. [9] | 2014 | PVT with water-cooled collector |
| Reddy et al. [14] | 2015 | PVT thermal operation and efficiency |
| Kumar et al. [15] | 2015 | The historical and recent development of PVT |
| Good [16] | 2016 | Environmental impact from PVT |
| Besheer et al. [17] | 2016 | Recent PVT technique |
| Sahota and Tiwari [18] | 2017 | PVT in group connection |
| Al-Waeli et al. [19] | 2017 | Current status and the prospect of PVT |
| Yazdanifard et al. [20] | 2017 | PVT with nanofluid |
| Preet [21] | 2018 | PCM significance in water-cooled PVT |
| Kasaeian et al. [22] | 2018 | Parabolic PVT |
| Joshi and Dhoble [23] | 2018 | PVT technology and trends |
| Yazdanifard and Ameri [24] | 2018 | PVT exergy progress |
| Vaishak and Bhale [25] | 2019 | PVT-assisted heat pump |
| Abbas et al. [26] | 2019 | Progress of PVT with nanofluid |
| Jia et al. [27] | 2019 | PVT development |
| Tao et al. [28] | 2019 | PV-PCM technology analysis |
| George et al. [29] | 2019 | Concentrated PVT |
| Lamnatou et al. [30] | 2020 | BIPVT environmental overview |
| Hemmat Esfe et al. [31] | 2020 | Progress of nanofluid application in PVT |
| Noxpanco et al. [32] | 2020 | Progress of PVT application |
| Bandaru et al. [33] | 2021 | Examination of PVT for residential application |
| Sheikholeslami et al. [34] | 2021 | PVT-FPC with nanofluid |
| Rajoria et al. [35] | 2021 | BIPVT-FPC advancement |
Table 2.
Various PVT products are available in the market.
| Product | Manufacturer | Absorber Material | Absorber Type | Configuration | PV Type | Liquid | Ref. |
|---|---|---|---|---|---|---|---|
| H-NRG | Anaf Solar, Pavia, Italy | Al | Roll-bond | Serpentine (3 channels) | Poly Si | Water | [77] |
| FDE-Hybrid 300 Mono | F.D.E. SOLAR SRL, Verona, Italy | Al/Cu | Sheet and tube | Harp | Mono Si | premix Glycol | [78] |
| FT320As | FOTOTHERM S.r.l., Gonars, Italy | Al/Cu | Sheet and tube | Harp | Mono Si | Water | [79] |
| MS 5 2Power | Dachziegelwerke Nelskamp GmbH, Schermbeck, Germany | Plastic | Complete surface | Serpentine | Mono Si | Water | [80] |
| HM 1000 Mono Black | PA-ID Process, Kleinostheim, Germany | Plastic | Complete surface | Water channel | Mono Si | Water | [81] |
| PIK® Combi Solar Collectors | Poly Solar Solutions AG, Andwil, Switzerland | Al | Roll-bond | Harp | Mono Si | Water | [82] |
| SPRING 400 Shingle Black | DualSun, Marseille, France | Steel | Complete surface | Harp | Mono Si | Water | [83] |
| solator® PV+THERM AUFDACH | Solator GmbH, Dornbirn, Austria | Steel | Complete surface | Water channel | Mono Si | Water | [84] |
| PV-Therm 2.0 monocrystalline | WIOSUN For Renewable Energy Ltd., Aqaba, Jordan | Steel | Complete surface | Harp | Mono Si | Water | [85] |
| Ecomesh | Endef Solar Solutions, Zaragoza, Spain | Al/Cu | Sheet and tube | Harp | Mono Si | Water | [86] |
| Solar Hybrid Panel | Zhejiang Shentai Solar Energy Co., Ltd., Zhejiang, China | Al/Cu | Sheet and tube | Serpentine | Mono Si | Water | [87] |
| Abora aH72 SK | Abora Energy S.L., Saragossa, Spain | Al/Cu | Sheet and tube | Harp | Mono Si | Water | [88] |
| Volther Excell PVT | Solimpeks Solar Energy Corp., Konya, Turkey | Al/Cu | Sheet and tube | Harp | Mono Si | Water | [89] |
| TESZEUS® 300M | Tianke Energy Saving, Zhuhai, China | Al/Cu | Sheet and tube | Harp | Mono Si | Water | [90] |
| Hybrid Thermal + PV Panel | Kirloskar Solar Technologies PVT. Ltd., Pune, India | Plastic | Roll-bond | Serpentine (dual flow) | Mono Si | Water | [91] |
Table 3.
Research on PVT with sheet and tube collector.
| Authors | Tubes Design | Location | Method | Electrical Efficiency (%) | Thermal Efficiency (%) | Remark |
|---|---|---|---|---|---|---|
| Zondag et al. [55] | Harp | Netherlands | Numerical & Experimental | 7.6 | 24 | ST-PVT is easier to manufacture and design, but 2% less efficient than water channel |
| Santbergen et al. [48] | Serpentine | Netherlands | Numerical | 9.53–10.34 | 14.6–34.5 | System sizing reduces both electrical and thermal efficiency |
| Bhattarai et al. [43] | Harp | South Korea | Numerical & Experimental | 13.69 | 58.7 | PVT efficiency curves using EN 12975 standards |
| Kim and Kim [58] | Harp | South Korea | Experimental | 14 | 66 | The unglazed PVT has better electrical performance than a PV only |
| Lv et al. [92] | Harp | China | Numerical & Experimental | 10.1–10.5 | 40–44.2 | Water as HTF in indoor simulation experiment |
| Dubey and Tay [59] | Harp | Singapore | Numerical & Experimental | 11.5 | 39.4 | PVT electrical efficiency is about 0.4% higher than the conventional PV module |
| Touafek et al. [49] | Serpentine | Algeria | Numerical & Experimental | - | 65 | Experiment using galvanized steel tubes and plate |
| Alzaabia et al. [93] | Harp (square pipe) | UAE | Experimental | 11.5 | 58.4 | The electrical power output of PVT is 15% to 20% higher than traditional PV. |
| Rejeb et al. [44] | Harp | Tunisia | Numerical | 12.0–16.0 | 56–58 | The modeling software used is FORTRAN 90 |
| Good et al. [94] | Harp | Norway | Numerical | 12.0–20.3 | 61.4–71.5 | Glazed and unglazed PVT with a 45-degree tilt angle are compared |
| Lämmle et al. [95] | Harp | Germany | Numerical | 15.0 | 58 | Future PVT collectors must consider architectural integration, collector durability, and economic aspect |
| Ammous and Chaabene [73] | Harp | Tunisia | Numerical | 13–15 | 50–65 | Water as HTF for RO desalination system |
| Yang et al. [96] | Harp | China | Experimental | 10.29–11.08 | 73.7–87.72 | Adding PCM improves overall efficiency to 76.87% |
| Hossain et al. [75] | Serpentine (2 sides) | Malaysia | Experimental | 11.08 | 87.72 | The highest performance is 87.72% |
| Abdullah et al. [97] | Serpentine (2 pipes) | Malaysia | Numerical & Experimental | 11.5 | 58.64 | The water-based PVT system has a higher efficiency than other systems |
| Ma et al. [98] | Harp | China | Numerical | 14.2 | 43.9 | Increasing mass flow rate and lower inlet water temperature Increase the PVT performance |
| Boumaaraf et al. [99] | Spiral | Algeria | Numerical & Experimental | 9.65 | 74.3 | The energy loss from spiral collector PVT is 16% lower than harp design |
Table 4.
Research on the environmental effect of nanofluid utilization in sheet and tube thermal collectors.
Table 4.
Research on the environmental effect of nanofluid utilization in sheet and tube thermal collectors.
| Author | Nanoparticle | Volume Fraction | Application | Environmental Analysis |
|---|---|---|---|---|
| Hassani et al. [137] | CNT, Ag | 0.0104 & 0.21 wt% | PVT system | PVT with CNTs/water as a thermal absorber and Ag/water as an optical filter emits about 885 kg of CO2 during the manufacturing phase for every cubic meter |
| Lari and Sahin [100] | Ag | 0.50% | PVT system | The proposed PVT system can prevent nearly 17 kilo tons of CO2 following the emission factor of 0.654 tCO2/kW in Saudi Arabia |
| Sahota and Tiwari [131] | Al2O3, TiO2, CuO | 0.04–0.13% | PVT system | The hybrid system of PVT and solar still mitigates 24.61 tons per annum of CO2 with the help of nanofluids |
| Hussain and Kim [129] | Al2O3, CuO | 0–0.8 wt% | PVT system | the maximum net CO2 mitigation of 20 years for the CuO/water PVT system was 4.2 tons |
| Abadeh et al. [138] | ZnO, Al2O3, TiO2 | 0.2 wt% | PVT system | PVT/ZnO saves the highest annual emission cost of about 28% and 20% from energy and exergy points of view. |
| Faizal et al. [130] | Al2O3, TiO2, SiO2, CuO | 2–3% | Flat plate solar collector | Nanofluid-based give lower environmental damage costs and about 170 kg less CO2 emissions |
| Faizal et al. [139] | SiO2 | 0.2–0.4% | Flat plate solar collector | The health risk from nanoparticles are minimized because they are dispersed in water and runs on a closed-loop cycle |
| Michael Joseph Stalin et al. [140] | CeO2 | 0.01–0.1% | Flat plate solar collector | Cerium oxide/water (CeO2/H2O) nanofluid prevents the emission of CO2, 175 kg less than a traditional solar water collector |
Publisher’s Note: MDPI stays neutral with regard to jurisdictional claims in published maps and institutional affiliations. |
© 2022 by the authors. Licensee MDPI, Basel, Switzerland. This article is an open access article distributed under the terms and conditions of the Creative Commons Attribution (CC BY) license (https://creativecommons.org/licenses/by/4.0/).
Share and Cite
MDPI and ACS Style
Umam, M.F.; Hasanuzzaman, M.; Rahim, N.A. Global Advancement of Nanofluid-Based Sheet and Tube Collectors for a Photovoltaic Thermal System. Energies 2022, 15, 5667. https://doi.org/10.3390/en15155667
AMA Style
Umam MF, Hasanuzzaman M, Rahim NA. Global Advancement of Nanofluid-Based Sheet and Tube Collectors for a Photovoltaic Thermal System. Energies. 2022; 15(15):5667. https://doi.org/10.3390/en15155667
Chicago/Turabian StyleUmam, Mukhamad Faeshol, Md. Hasanuzzaman, and Nasrudin Abd Rahim. 2022. "Global Advancement of Nanofluid-Based Sheet and Tube Collectors for a Photovoltaic Thermal System" Energies 15, no. 15: 5667. https://doi.org/10.3390/en15155667
Note that from the first issue of 2016, this journal uses article numbers instead of page numbers. See further details here.