Article

Theoretical and Experimental Analysis of Engine Performance and Emissions Fuelled with Jojoba Biodiesel

1
School of Engineering, University of Tasmania, Hobart, TAS 7001, Australia
2
School of Engineering and Technology, Central Queensland University, Rockhampton, QLD 4701, Australia
3
Fuel and Energy Research Group, Central Queensland University, Rockhampton, QLD 4702, Australia
4
Department of Mechanical Engineering, Chittagong University of Engineering & Technology, Chattogram 4349, Bangladesh
*
Author to whom correspondence should be addressed.
Energies 2022, 15(17), 6282; https://doi.org/10.3390/en15176282
Submission received: 21 July 2022 / Revised: 15 August 2022 / Accepted: 24 August 2022 / Published: 28 August 2022
(This article belongs to the Section A4: Bio-Energy)

Abstract

:
Over many decades, isolated regions (e.g., islands, rural and remote areas) have heavily relied on diesel engine for producing power and energy. However, due to depleting fossil fuels and concerning emissions, biodiesels could be the substitute for diesel in power generation sectors. This study developed a single-zone thermodynamic model to predict the engine performances such as brake power (BP), torque, brake thermal efficiency (BTE), brake-specific fuel consumption (BSFC) and ignition delay (ID) times for diesel and jojoba biodiesel. The experiments were conducted on a fully automated, 4-cylinder, 4-stroke, liquid-cooled direct injection 3.7-L diesel engine fueled with diesel (D100) and three jojoba blends (JB5, JB10, and JB20) to validate the model. The performance simulation results agreed with experimental data for all tested fuels at 1200 to 2400 rpm speed and 25%, 50%, 75%, and 100% loading operation. The minimum error (3.7%) was observed for BP for D100 at 2000 rpm and 100% load, and the maximum error (19.2%) was found for JB10 at 1200 rpm and 25% loading operation. As load increases from 25 to 100%, the BSFC and torque difference between diesel and JB20 decreases from 10 to 6.5 and 9 to 6%, respectively. A shorter ID time was observed in JB5 compared to JB10 and JB20. Furthermore, a significant reduction was observed in CO (7.55%) and HC (6.65%) emission for JB20 at 25% and 1200 rpm compared to diesel fuel; however, NOx emission was increased up to 10.25% under any given conditions.

1. Introduction

The demand for power from diesel engine-driven generators rises gradually due to increasing population and urbanization in isolated (e.g., islands, rural and remote) regions. Moreover, mitigating power demand is considered one of the prime issues in isolated areas with fossil fuels, resulting in more dependency on petroleum imports. In recent years, research on diesel engines has become exuberant and arduous due to burning colossal amounts of fuels, and the associated emitted pollutants cause severe health issues for living beings and global warming, including greenhouse effects [1]. The primary source of power generation is fossil fuels that will be evacuated. The deep concern of the researchers is to find alternative sources to improve engine performance and reduce pollutants. The ways that are observed for these two criteria (i.e., performance improvement and emitting less pollutants) of engines are as follows: (a) design upgrade via optimization of internal measurement parameters [2,3,4]; (b) implementation of aftertreatment techniques [5,6]; and (c) utilize biodiesels as alternative diesel fuels [4,7,8]. It was investigated that, as the ignition of fossil fuels is limited, the eco-friendly and less pollutant biodiesels can be the alternative to conventional fuels in diesel generation sectors [9].
In recent years, biofuel production has been an interesting area of research due to renewability and low greenhouse gas emissions in diesel engines [10,11,12]. In terms of combustion, biodiesel shows almost similar characteristics to commercial diesel and less air pollution [13]. On a weight basis, biodiesel contains up to 12% oxygen, and lower HC and CO emissions occur during complete engine combustion [14,15,16]. As jojoba has a higher number of cetene and shows less HC and CO emissions than standard diesel, several experiments were done using jojoba–diesel blends [17,18,19,20]. Huzayyin et al. [21] experimented and found a slight increase in BSFC and less NOx using jojoba–diesel blends compared with pure diesel fuel. An experiment was conducted by Soudagar et al. [22] in which a noticeable reduction was observed in HC (10.27%) emissions at full load operation. Zhang et al. [23] reported that BSFC increased up to 3.3% for B20 compared to diesel. Armando et al. [24] showed lower NO and CO emissions than commercial diesel fuel.
However, the theoretical study through mathematical modelling always helps to enhance the engine performances by studying the complex physical process considering variable speeds, loads, compression ratios, injection timing and rates, etc. Several mathematical modelling approaches (e.g., zero-, quasi-, and multidimensional) were developed to investigate to predict engine behaviour as well as performances. The zero-dimensional approach is the simplest and most preferable method to observe the effects of variations in the engine operating parameters. A zero-dimensional model was developed by Gautam et al. [25] that showed less complexity and was well-matched with experimental results among all these modelling categories. Except for the zero-dimensional model, the other two models such as quasi- and multi-dimensional models increase complexity due to the proximity of physical reality. Zero-dimensional models are classified into three categories: single-zone, two-zone, and multi-zone models. In the single-zone model, the working fluid in the engine is assumed to be a process that exchanges energy and mass and releases energy during the combustion system, applying the first law of thermodynamic.
Hariram et al. [26] examined a zero-dimensional single-zone model using Vibe’s and Wolfer’s correlation to determine performance and ignition delay. Awad et al. [27] developed a single-zone combustion model for a diesel engine considering a triple-Wiebe function and calibrated the experimental model data using diesel and waste cooking oil. Gogoi et al. [28] developed a single-zone thermodynamic model to predict the performance parameters using biodiesel and its blends that reported similar results from the model for BP and BTE. A thermodynamic model was developed by Nabi [29] to evaluate engine performance characteristics considering injection timing, engine speed, and compression ratio. The results showed a closer prediction of simulation results with experimental data. Mustayen et al. [30] developed a single-zone combustion model to predict combustion and engine performances at different speeds under low load conditions for diesel-renewable hybrid systems in rural regions and island power generations. Chmela et al. [31] studied the Arrhenius equation’s zero-dimensional approach to reduce computational time and engine development cost. Ngayihi Abbe et al. [32] investigated a zero-dimensional model executed in MATLAB, given fast and accurate results, and validated biodiesel fuel.
In a diesel engine, the ID plays a vital role in performance and output responses caused by the physical and chemical processes such as atomization of fuel, fuel–air mixing, and chemical reaction [33]. Wolfer proposed a modified Arrhenius equation in direct injection diesel engines [34] to predict ID. Besides, Watson et al. [35] developed ID correlation based on the Wolfer equation, Saravanan et al. [36] developed ID correlation considering average in-cylinder pressure and temperature instead of cylinder temperature and pressure, and Assanis et al. [37] developed an ID correlation based on the fuel–air equivalence ratio under steady-state and transient operations. Hardenberg et al. [38] developed an ID correlation using the cylinder charge temperature and pressure at TDC position and cetane number (CN). CN directly affects ID as a lower CN is the cause of lower combustion, ensuring a longer ID period and lower BTE and BP. Mustayen et al. [39] investigated the ID of a diesel engine under different speeds and loading conditions utilizing standard diesel fuel. All these models showed the same trend: ID time increases as engine loads and speeds due to decreased in-cylinder temperature and pressure. In addition, as engine load decreases, the wall temperature and residual gas also decrease. As a result, in-cylinder temperature and pressure decrease due to later fuel injection, which occurs longer in ID [40,41].
The single-zone thermodynamic model considers a bunch of sub-models such as the Wiebe function, engine geometry, cylinder pressure, heat transfer, heat release model, and ID equation, which are directly correlated with engine performance characteristics (e.g., BP, BTE, torque, and BSFC). The model simulation was performed using pure diesel and three jojoba–diesel blends such as JB5, JB10, and JB20. The first objective of this paper was to use the experimental data for evaluating the accuracy of the theoretical model utilizing standard diesel and three different ratios of jojoba–diesel blends at 1200 rpm, 1600 rpm, 2000 rpm, and 2400 rpm and 25%, 50%, 75%, and 100% load operations. The second objective was to analyze performance parameters at the mentioned operating conditions for all tested fuels. The third objective was the experimental investigation of emissions (NOx, CO, and HC) for all tested blends and compared with standard diesel.
Previous literatures reported that HC and CO decreased with the percentage of jojoba blends increased at high load operation; however, NOx remains the same at any operating condition. Moreover, due to depleting petroleum fuels, jojoba could be the alternative in diesel generation sectors. Table 1 represents the findings of performance and emissions using different JB blends with diesel.

2. Theoretical and Experimental Study

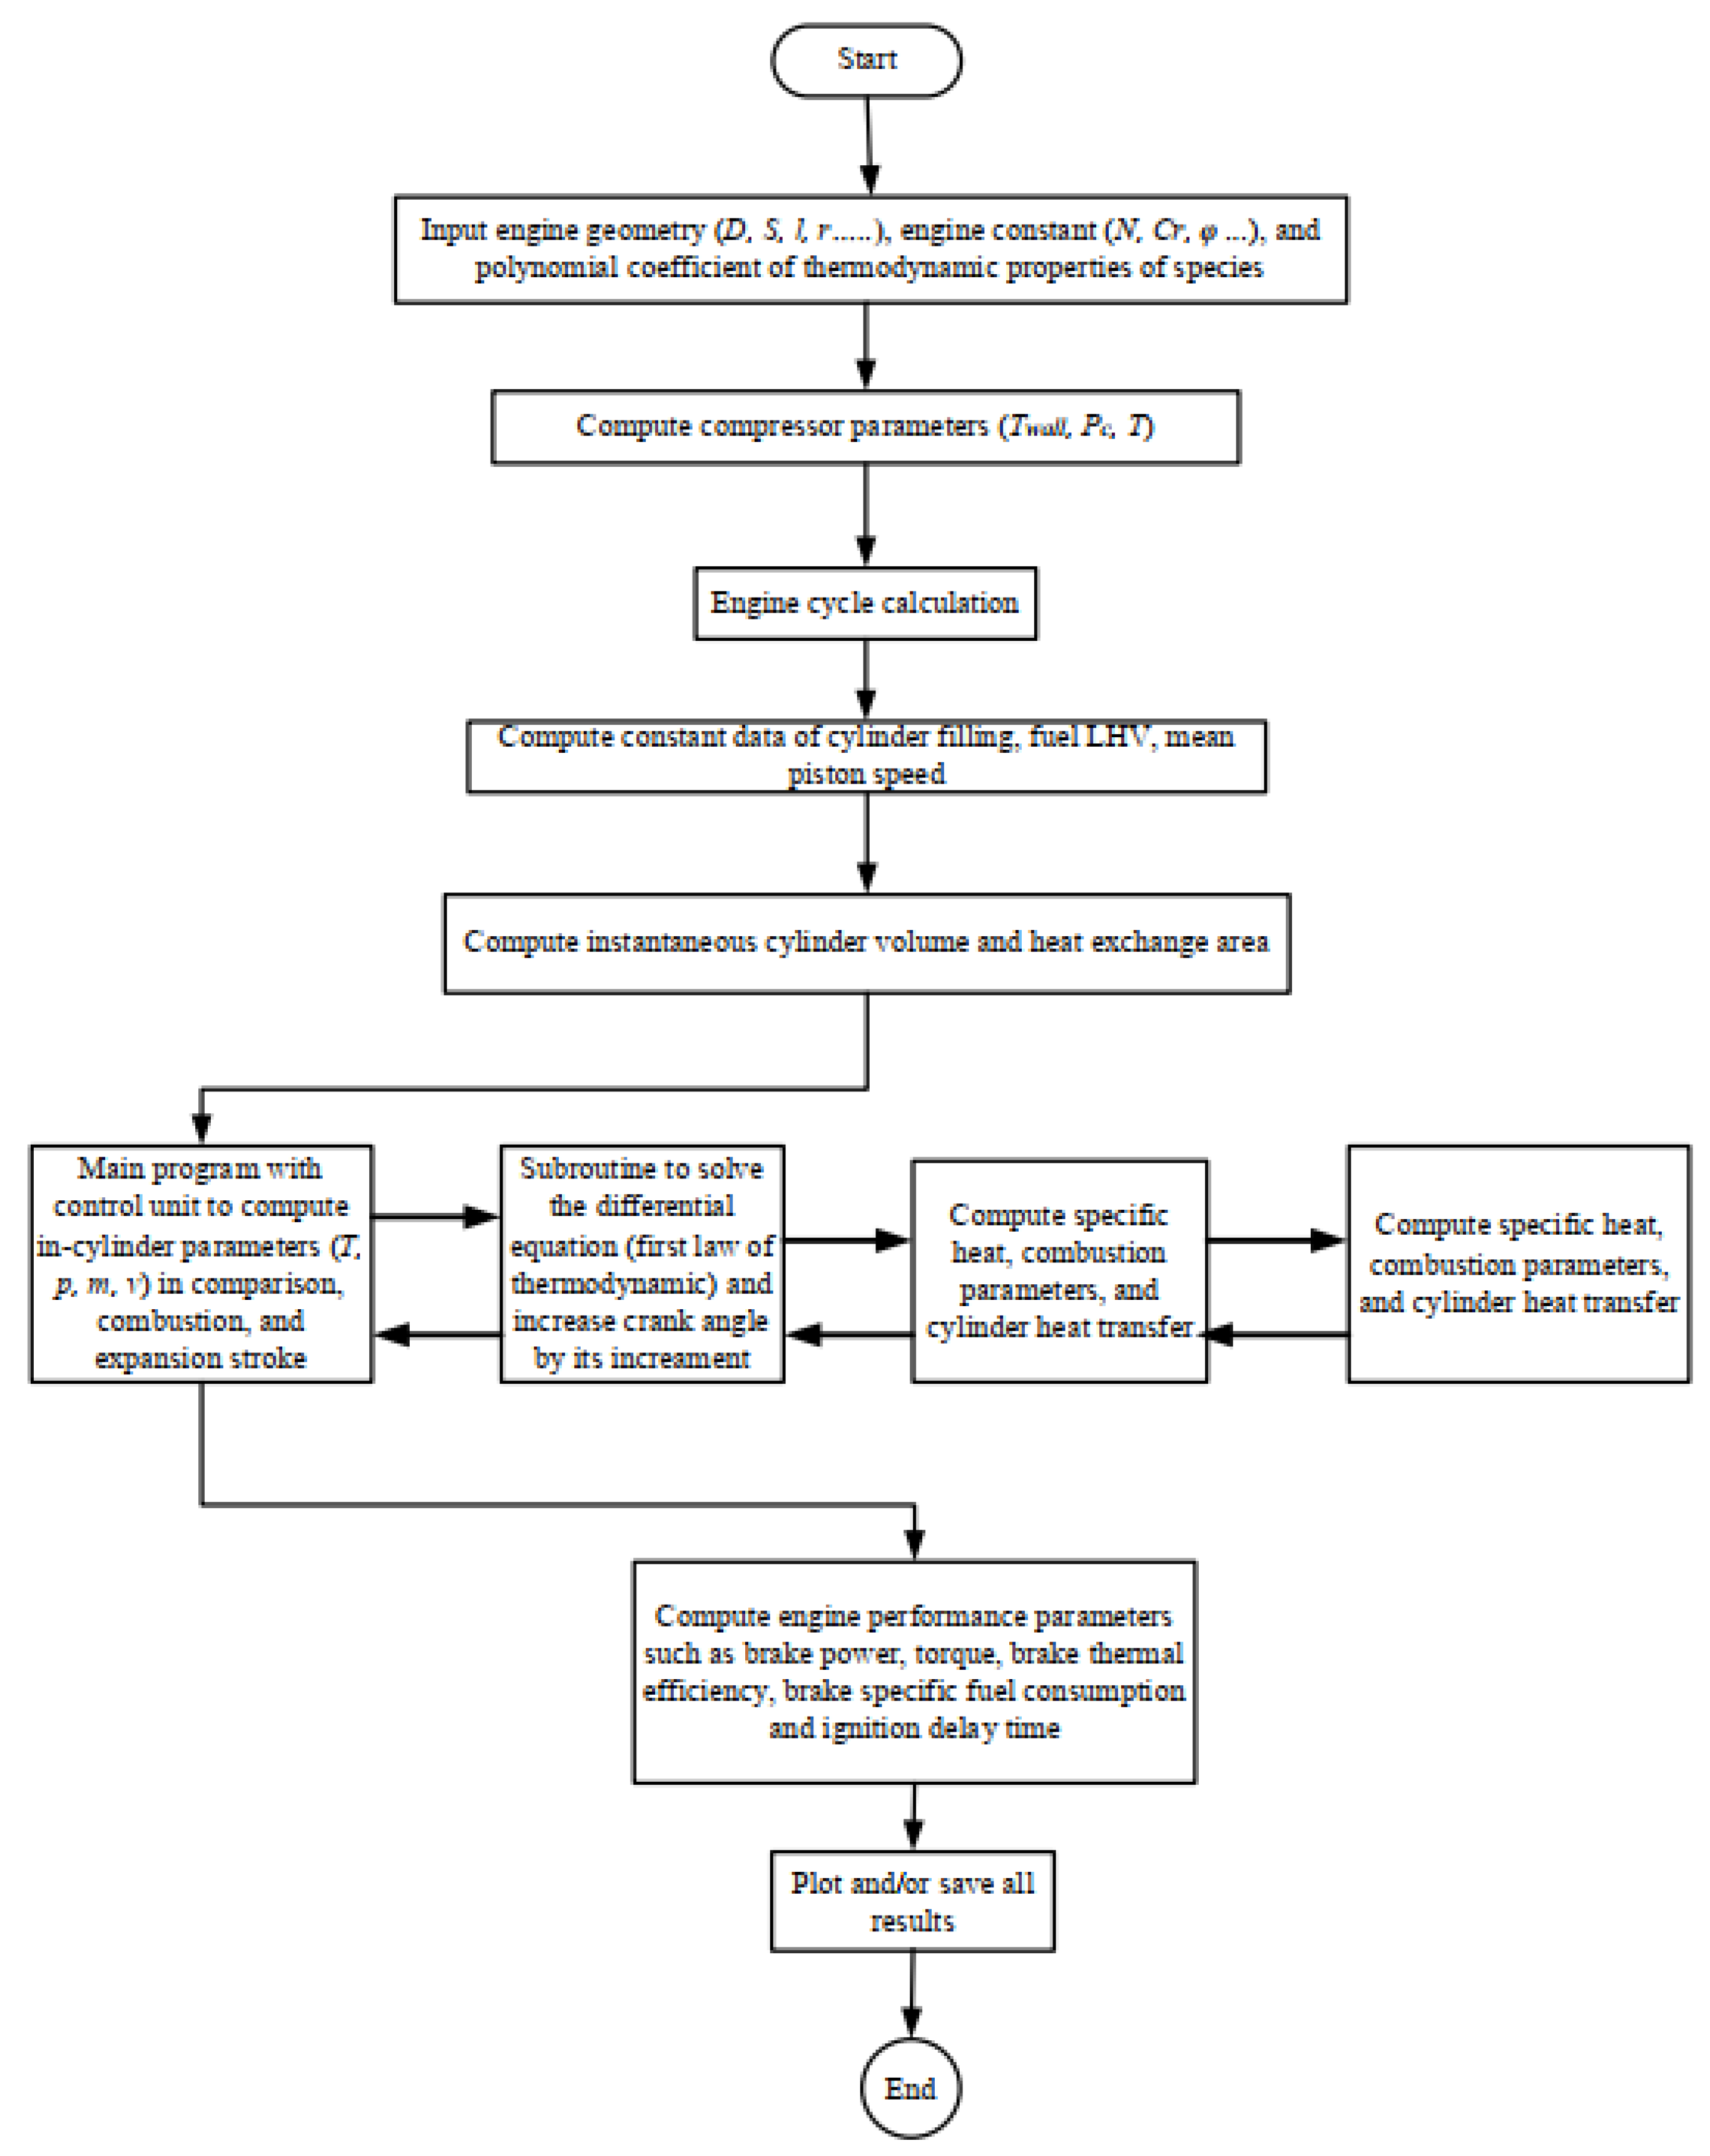
2.1. Model Development

The single-zone model is more suitable for predicting engine performance than other approaches (two-zone and multi-zone) in terms of less complexity, more accuracy, and less computational time. The current section performed a theoretical investigation on pure diesel and jojoba–biodiesel blends. The derivation of V can be derived from the kinematic motion equation used for engine geometry calculations [6] as follows,
V φ = V c + π B 2 4 X φ
X φ = l + R R c o s φ + l 2 s i n 2 φ 1 / 2
A φ = π B 2 4 + π B S 2 ( R + 1 c o s φ + R 2 s i n 2 φ 1 / 2 )
where R is the crank radius ratio, l (m) is the rod length, B is the cylinder bore and S is the stroke, respectively. φ denotes the crank angle (CA) in degrees measured from pressure data [49]. In-cylinder pressure, volume, and specific heat ratio can be express via Equation (4),
d Q n d φ = γ γ 1 . P c d V d φ + 1 γ 1 . V d P d φ + d Q w d φ
where cylinder volume V is defined from Equation (1). P c denotes cylinder pressure, and γ is the specific heat ratio of 1.35 [50]. According to the Newtonian model, heat transfers to the wall can be expressed by,
d Q w d φ = h A φ T g a s T w a l l 6 N
where gas temperature is T g a s and cylinder wall temperature is T w a l l . The cylinder’s instantaneous area is A φ and the heat transfer coefficient h is adopted by the models [51,52,53,54]. The rate of heat transfer was calculated using the Woschni model [53], which is represented below,
h = 3.01426 B 0.2 P c 0.8 T g a s 0.5 v 0.8
where v is burnt gas velocity,
v φ = 2.28 U p ¯ + C 1 V d T g r p r V r p φ p m
In this model, premix and diffusion phase are expressed by Equation (8), which is using the double-Wiebe function [55,56],
x b φ = 1 k = 1 2 β k . e x p a k φ φ k φ k M k + 1
where burnt fuel in the k th is the fraction of β k .
Alkhulaifi et al. [57] developed an ID correlation in which mean temperature and pressure were replaced by start of combustion (SOC) pressure and temperature. This system is cheaper because the data acquisition system (DAC) is not required. The ID model is expressed by this equation,
τ i d = A B P k   P S O C n e x p E a R u T S O C  
where E a is the activation energy, BP is the brake power, and SOC is the start of combustion.
B P = 2 π × N T 1000
where N = number of revolutions per second.
T e = b m e p × V e 2 π × K
where b m e p = brake mean effective pressure (Pa), V e = engine volume (m3), k = 2 for 4 stroke engine.
B S F C   g k W . h = m f   k g h B P   k W × 1000   g k g
B S E C   J W h = B S F C × Q C V  
B T E % = 3600 B S F C k W h × Q H V M J / k g × 100
where B P is the brake power (kW) that is measured from Dyno Dynamics, f is the fuel consumption rate (g/h) and the calorific value is Q C V (kJ/kg).

2.2. Assumption

A significant part of the engine cycle is in the expansion phase, which produces engine power. For engine cycle simulation, the single-zone approach provides satisfactory heat combustion results over a period of 45–55 0CA. The assumptions that are considered for this study are stated below.
(i)
The cylinder charge temperature and pressure vary with CA and are assumed to be uniform.
(ii)
The mass remains constant, because there is no leakage through the piston valve and rings.
(iii)
The heat is transferred to the cylinder head area; however, the piston surface and the cylinder wall are in touch with the gas mixture.
(iv)
The surface temperature is constant during the cycle.
(v)
Due to the combustion chamber mechanism and motion of the piston, heat transfer changes rapidly towards the wall, which is calculated from the combustion gases and wall temperature.
(vi)
Consider uniform crank speed.

3. Simulation Procedure

The Matrix Laboratory (MATLAB) was used to simulate the model for predicting the engine performances. The MATLAB script started with required the engine inputs such as stroke, bore, connecting rod length, cylinder number, and compression ratio, known by engine manufacturers. The governing equation, cylinder area, piston head surface, and clearance volume were calculated using these input parameters. An assumption was made for initial inlet manifold temperature and pressure. Fuel injection timing, intake valve opening (IVO), intake valve closing (IVC), exhaust valve opening (EVO) and exhaust valve closing (EVC) for this simulation are shown in Table 1. Engine geometry, cylinder volume, cylinder pressure and temperature were scripted to calculate total work during the cycle. The essential performance parameters, such as indicated power, friction power, BP, correction factor, etc., were used to calculate the BSFC. The Hardenberg model was used to predict ignition delay at variable speeds and loads. In the plot section, each figure was given a title based on the lower and higher values. Table 2 shows the operating condition for model simulation. A flow chart of the simulation process and model validation is given in Figure 1.

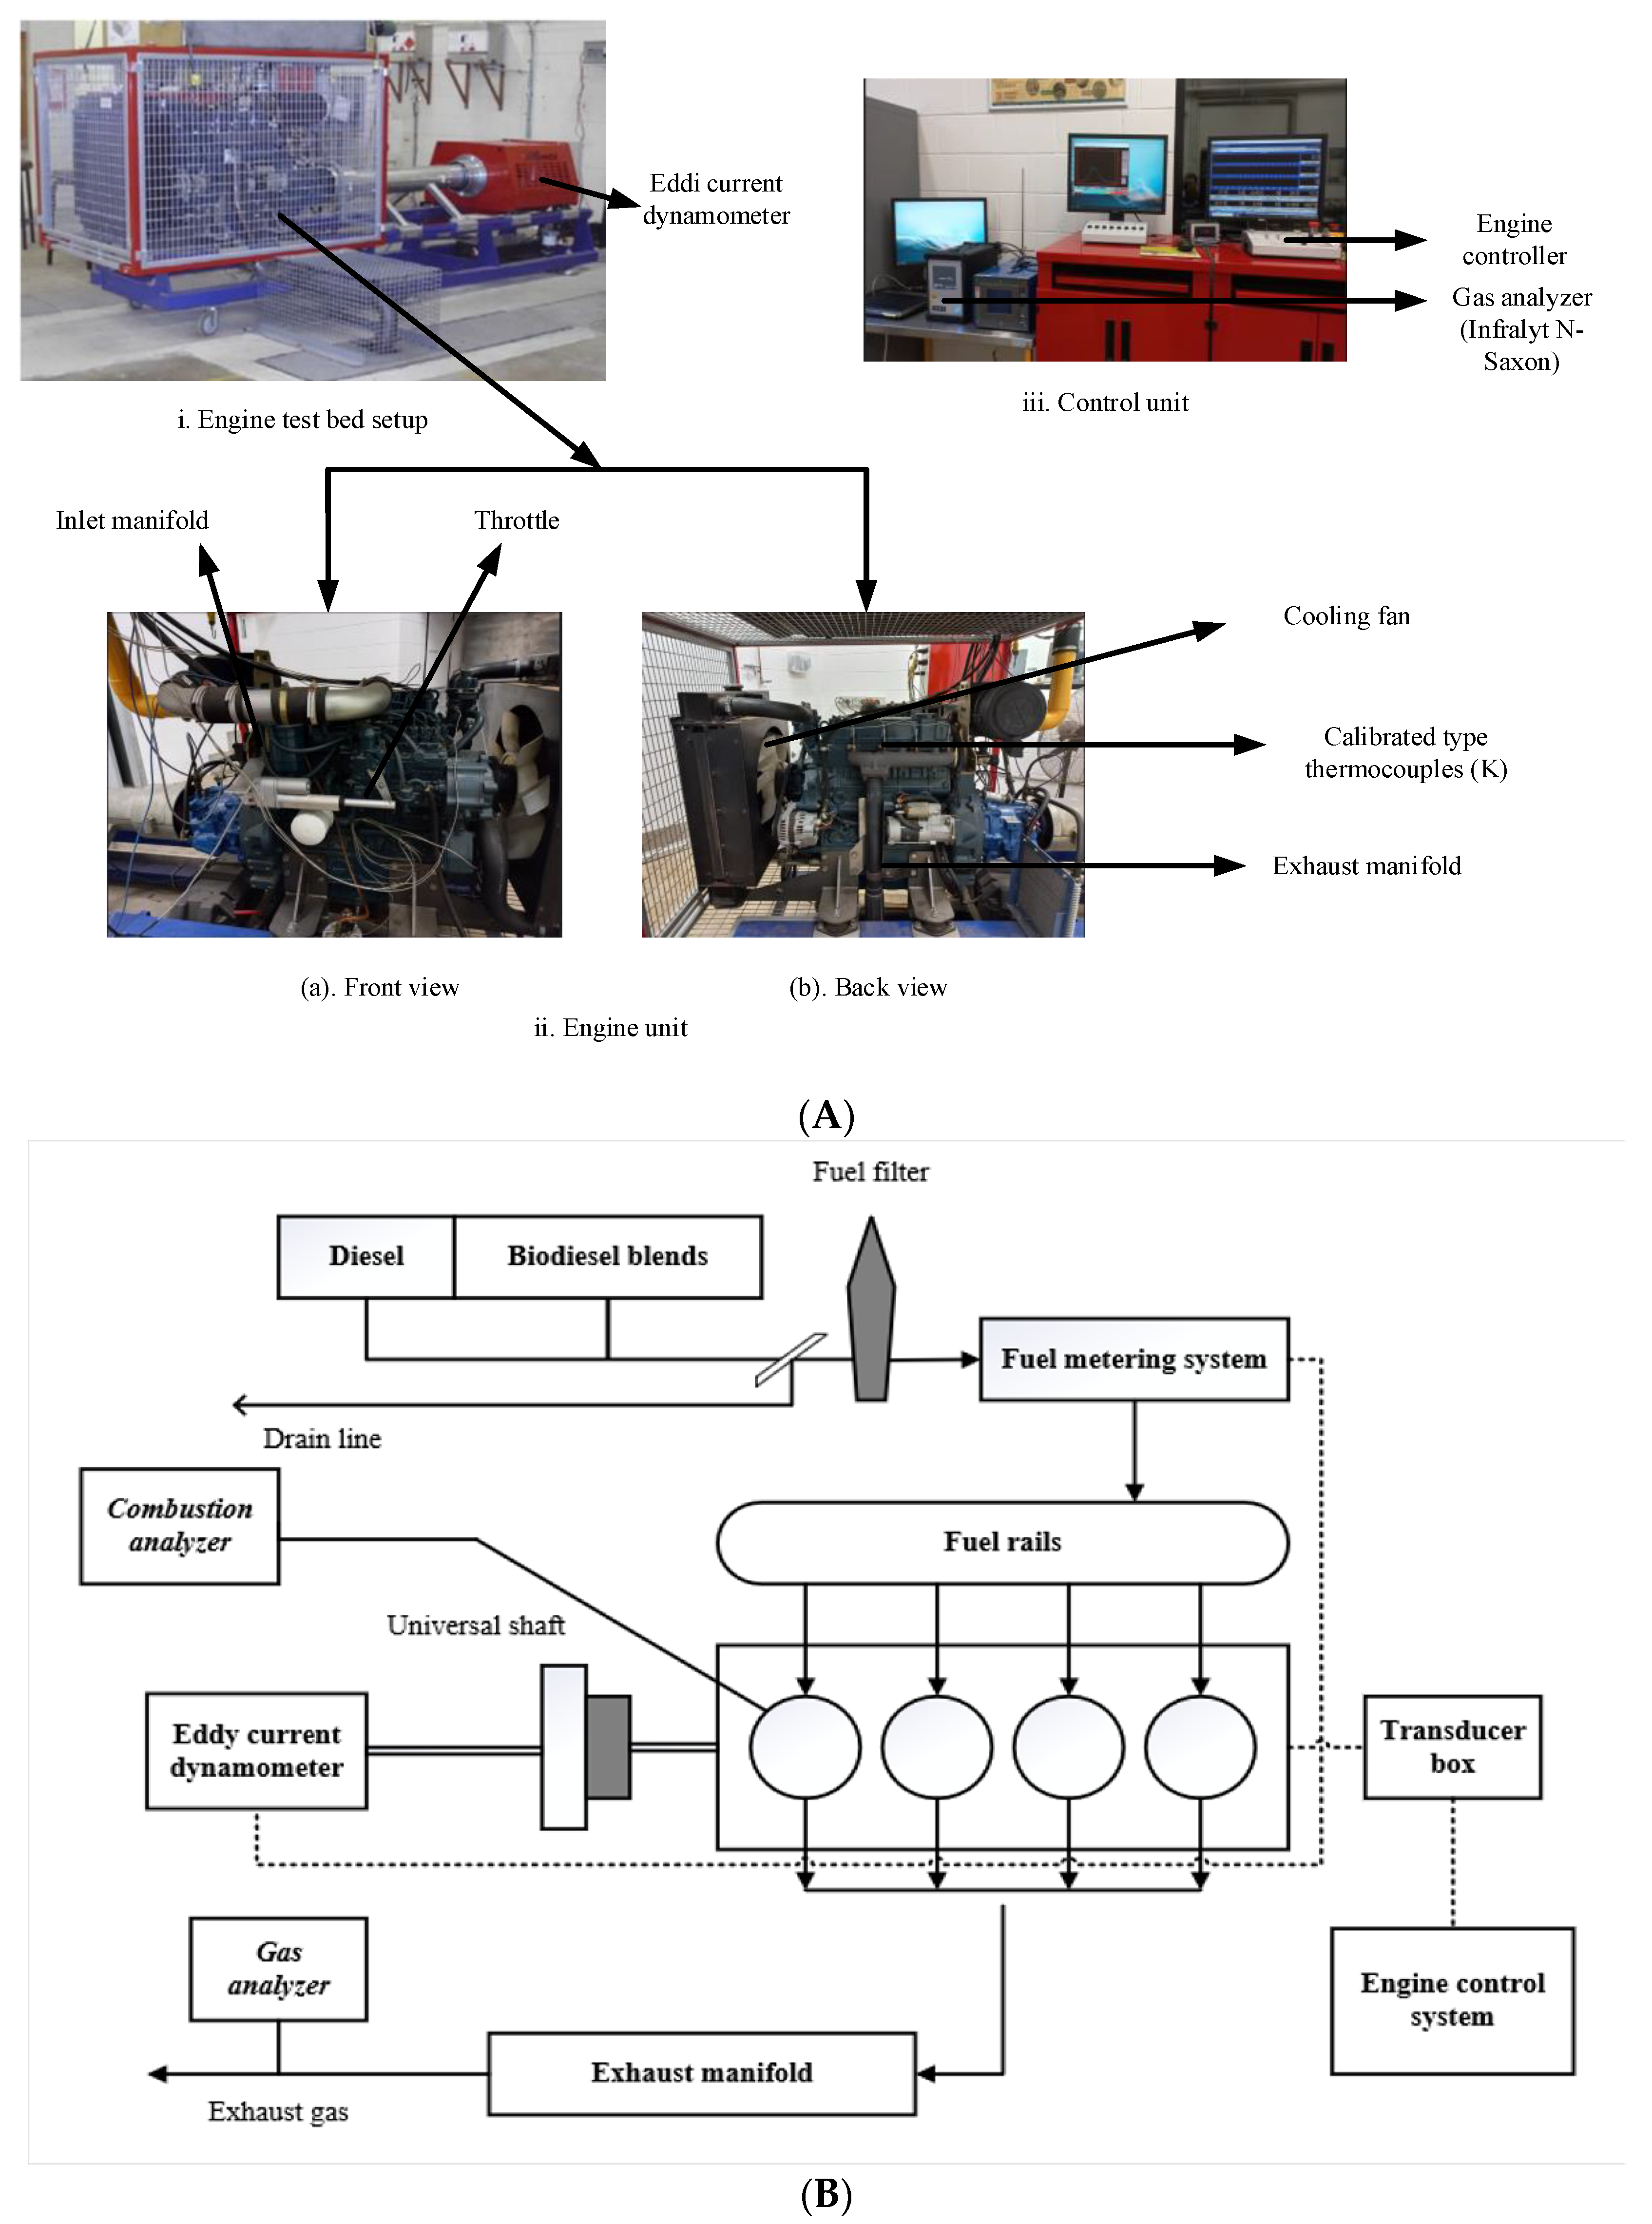
4. Experimental Test Facility

4.1. Engine Description

The experiments were conducted with a fully automated liquid-cooled, 4-cylinders naturally aspirated diesel engine located at the thermodynamic laboratory at CQUniversity, Rockhampton campus. This engine can operate on direct injection mode, and the 4-stroke principle varies from 25% to 100% load and the rotational speed range of 1200 to 2400 rpm. The engine design characteristics are summarized in Table 3.
Figure 2 shows the experimental and schematic layout of the test-bed setup for the present study. The instruments presented in this setup can measure brake power, torque, fuel consumption, intake air flow rate, speed, and emissions (using Infralyt N-Saxon gas analyser) at variable operating conditions (speeds and loads). The designed facilities can conduct the experiments utilizing different test fuels (e.g., diesel and jojoba) for desired speeds and loads.

4.2. Measurement Devices and Test Procedure

The engine is installed on a fully automated test bed and coupled with a “DYNO DYNAMICS” dynamometer with load soak-up and driving capabilities. A control panel was used to operate the dynamometer via knobs. There is also a capability of automatically setting the static injection timing from a switch on the control panel. A Coriolis-type flow meter was considered to measure the rate of fuel (diesel and jojoba) flow of the diesel engine. The inertia is produced by fluid that twists the tube, and a sensor measures a flow signal (linear) generated by rotating. The accuracy of the Coriolis-flow meter for fluid is 0.10%. The engine fuel system was adjusted using two different tanks with nozzle systems to the main fuel supply line. An initial engine run was conducted with pure diesel fuel before starting the test with jojoba–diesel blends. BP, torque, engine speed, and loads were measured using Dyno Dynamics (450DS) software interfaced with a test PC. The ambient air temperature, the intake air temperature inside the intake air manifold, and exhaust temperature inside the exhaust manifold were recorded using calibrated-type (K) thermocouples probes. An Infralyt N-Saxon emission analyzer was used to measure emission gases (NOx, CO, and HC) which can be placed in the control unit (Figure 2(Aiii)) and be interfacing with a test PC. This N-series analyzer is fast and comprehensive with high precision, which can measure the actual pollution level. Due to its small size and light weight, Infralyt N-Saxon can be suitable for stationary or mobile purposes.

4.3. Instrument Accuracy and Measurement Uncertainity

A quantitative evaluation of expected uncertainty in the present measurement was performed following the procedure of Fattah et al. [58]. The uncertainty of BP, BTE, BSFC, BMEP, and torque are 1.3%, 1.9%, 2.01%, 1.81%, and 0.5%, respectively. The overall experimental percentage uncertainty was calculated based on the propagation principle of errors of the present measurement is 6.53%. Table 4 represents the value of accuracy and uncertainty of the measured quantities used during the experiment.

4.4. Fuel Selection, Preparation, and Specifications

A commercially available diesel fuel No-2-D (ASTM D975) was selected for engine testing. Refined quality jojoba biodiesel extracted from crude esterified jojoba oil (CEJO) was utilized in the present study with no additional chemical treatments. CEJO has been collected from Aussie Soap Supplier, Kardinya, Western Australia, and used for base-catalyzed transesterification for filtered jojoba biodiesel. The main reason for selecting jojoba biodiesel is because of it having no sulphur and less carbon monoxide, which ensures that the engines run smoothly and last longer. Moreover, it is safer to store and transport due to higher flashpoints. Furthermore, due to its renewability, wide availability, and environment-friendly aspect compared to fossil fuel, jojoba will be an alternative for diesel engines [59]. To prepare, three different blends of jojoba with diesel were mixed using magnetic hot plate stirrers in the laboratory. The mixing was run for 15 min at 45 °C for each of the blends to ensure that proper diffusion and blending occurred. This blending ratio includes 5%, 10%, and 20% by volume of jojoba biodiesel in a mixture of jojoba–diesel referred to as JB5, JB10, and JB20, respectively. Specimens of the different fuel blends opened the atmosphere and were free from any sign of mixture separation, deposits, or surface reaction after several weeks of monitoring. The properties of all tested fuels are stated in Table 5.

5. Results and Discussions

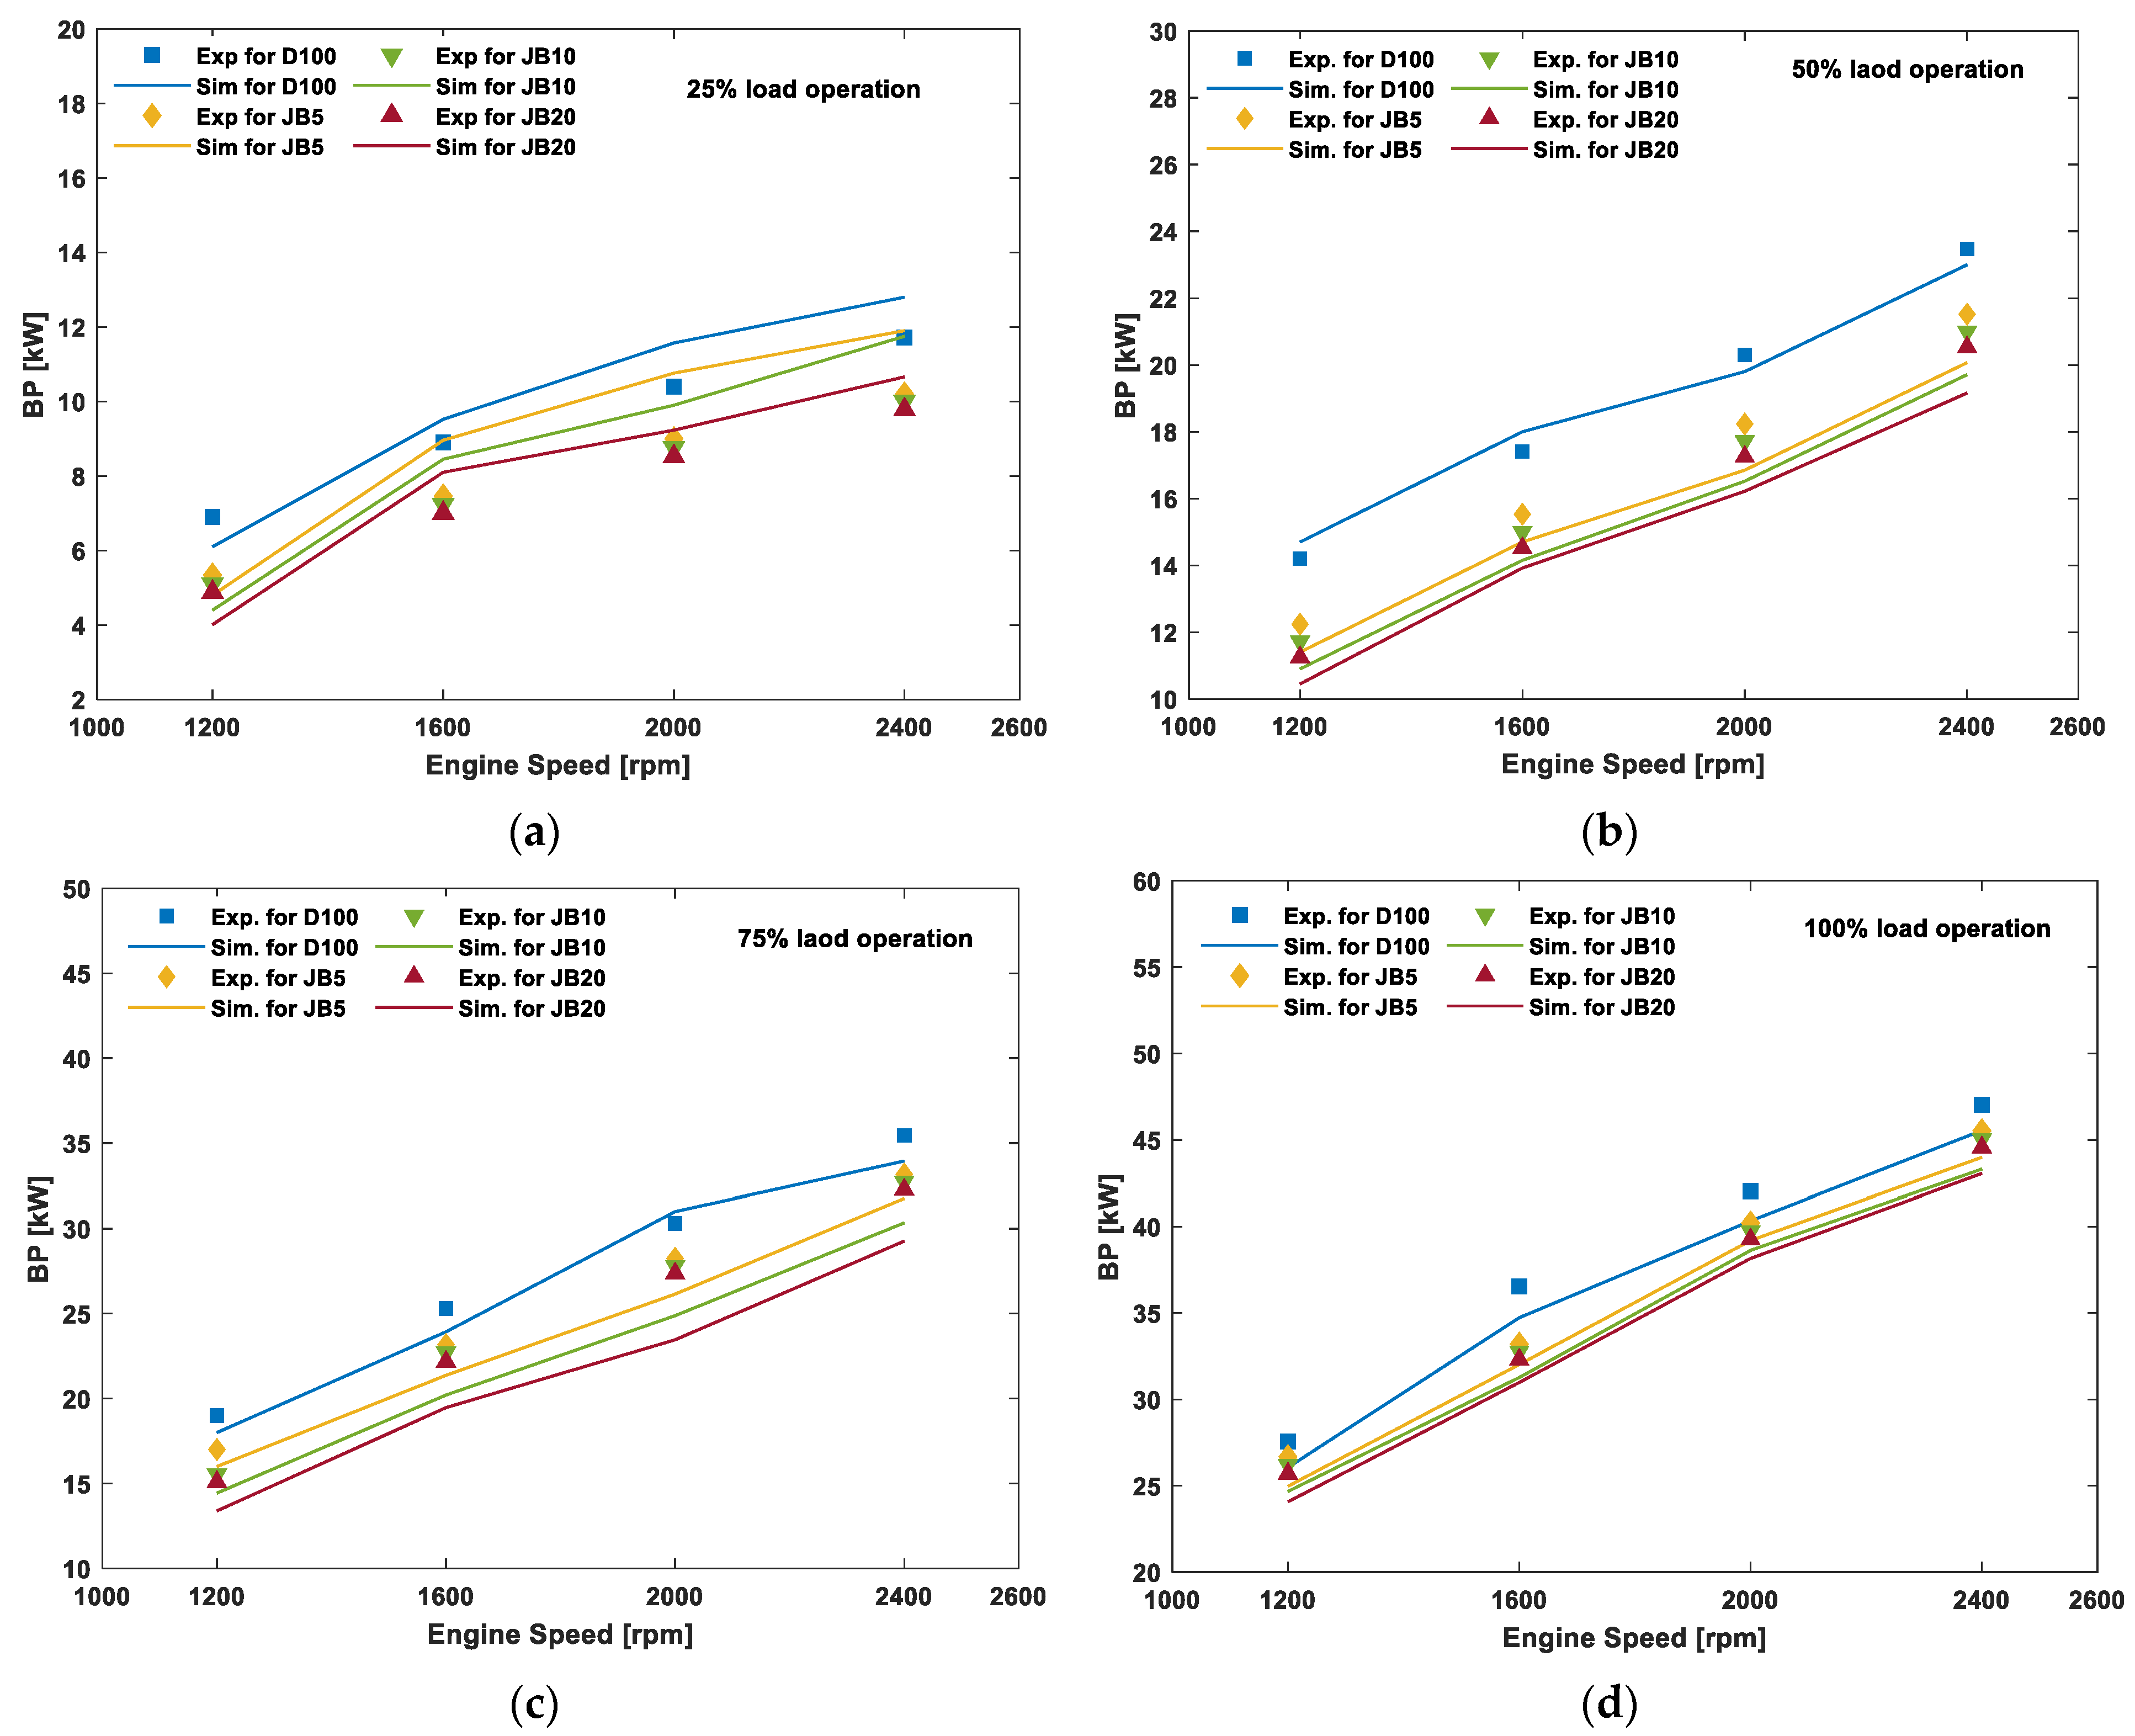
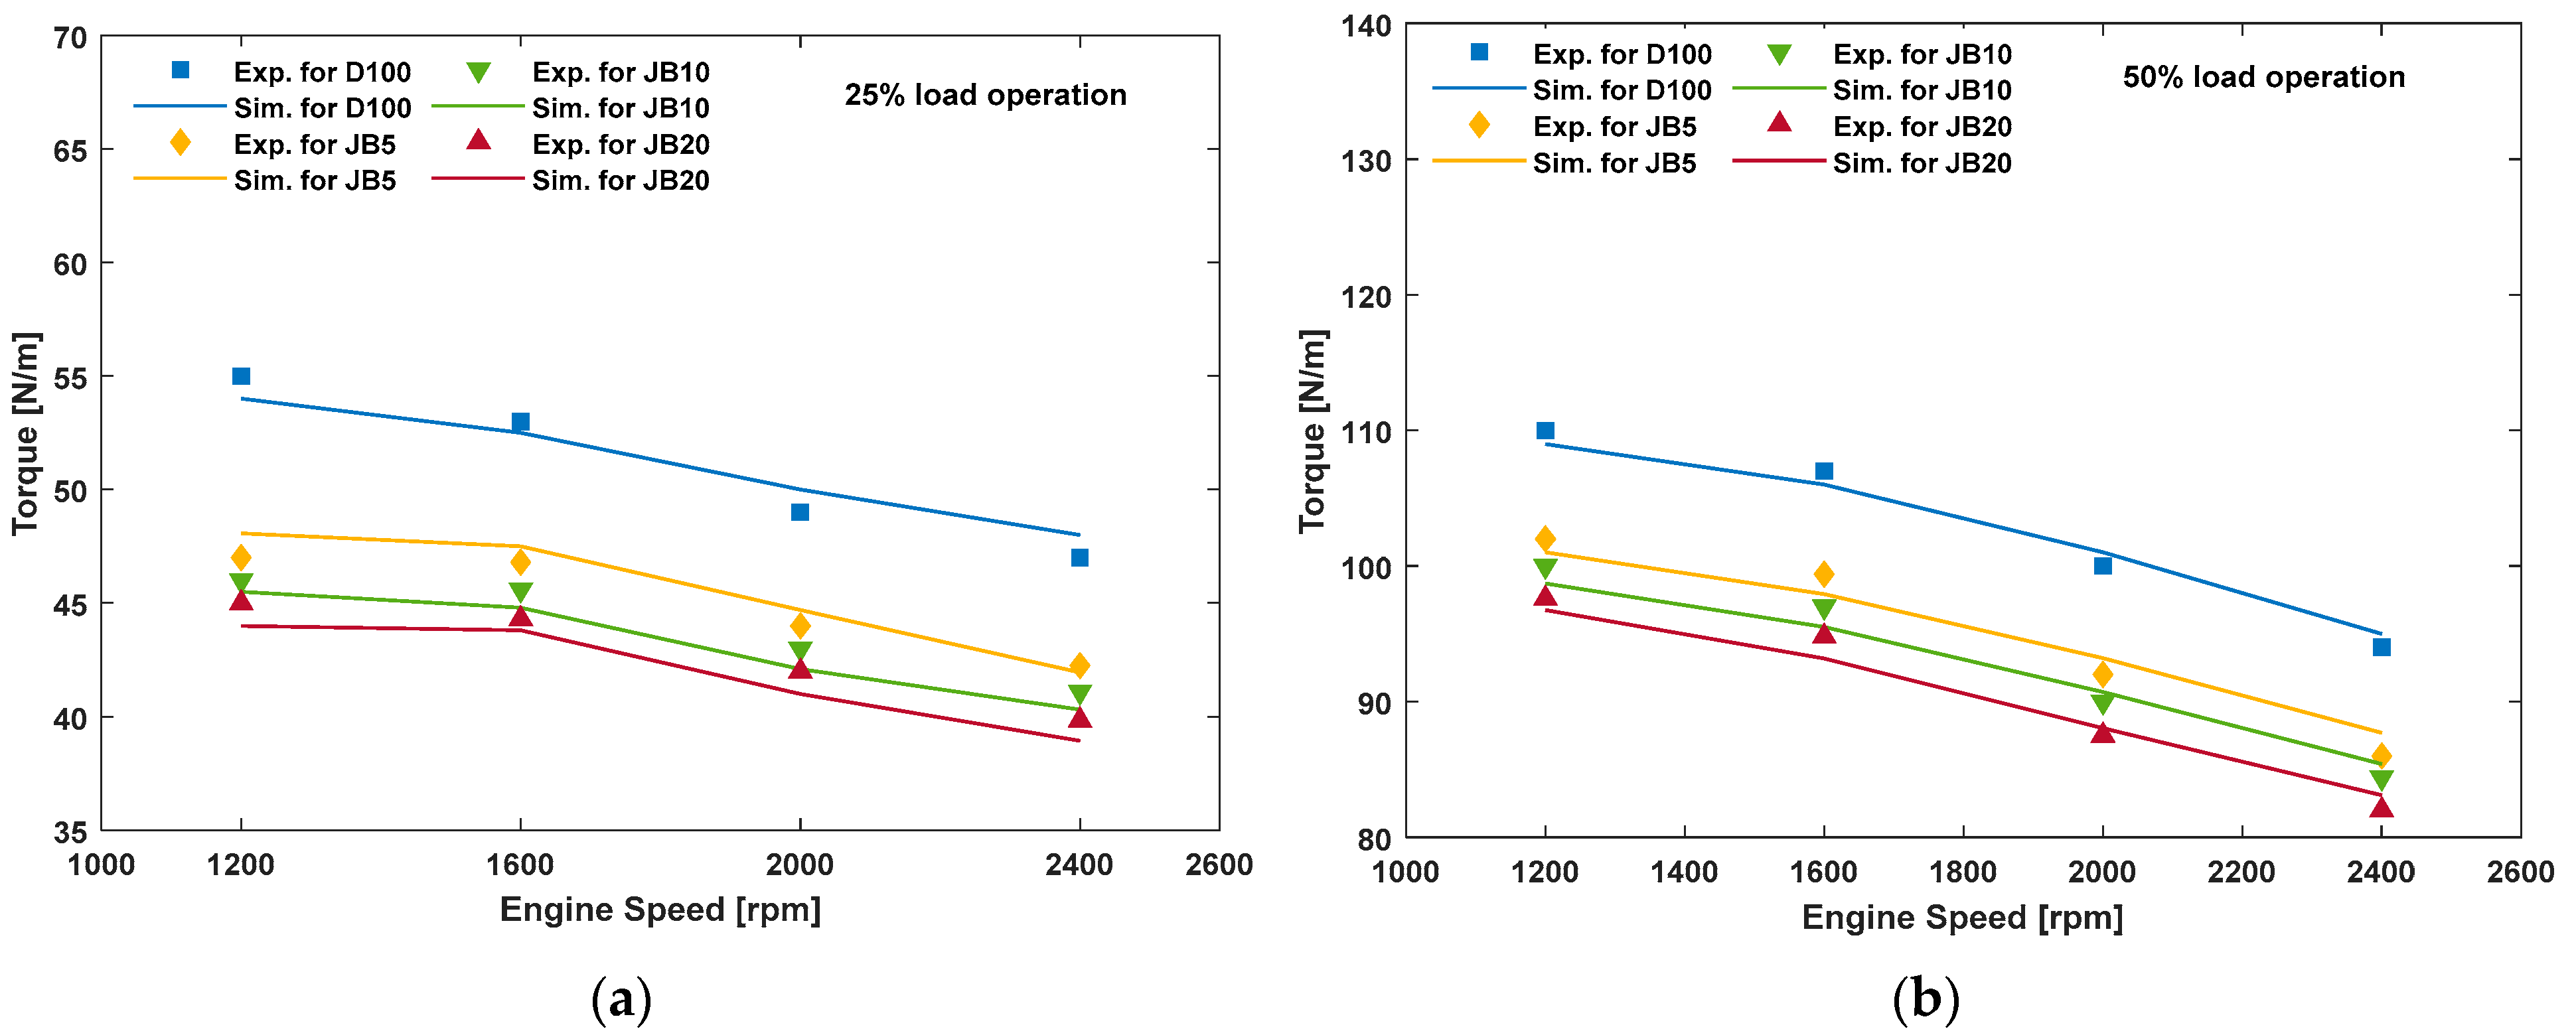
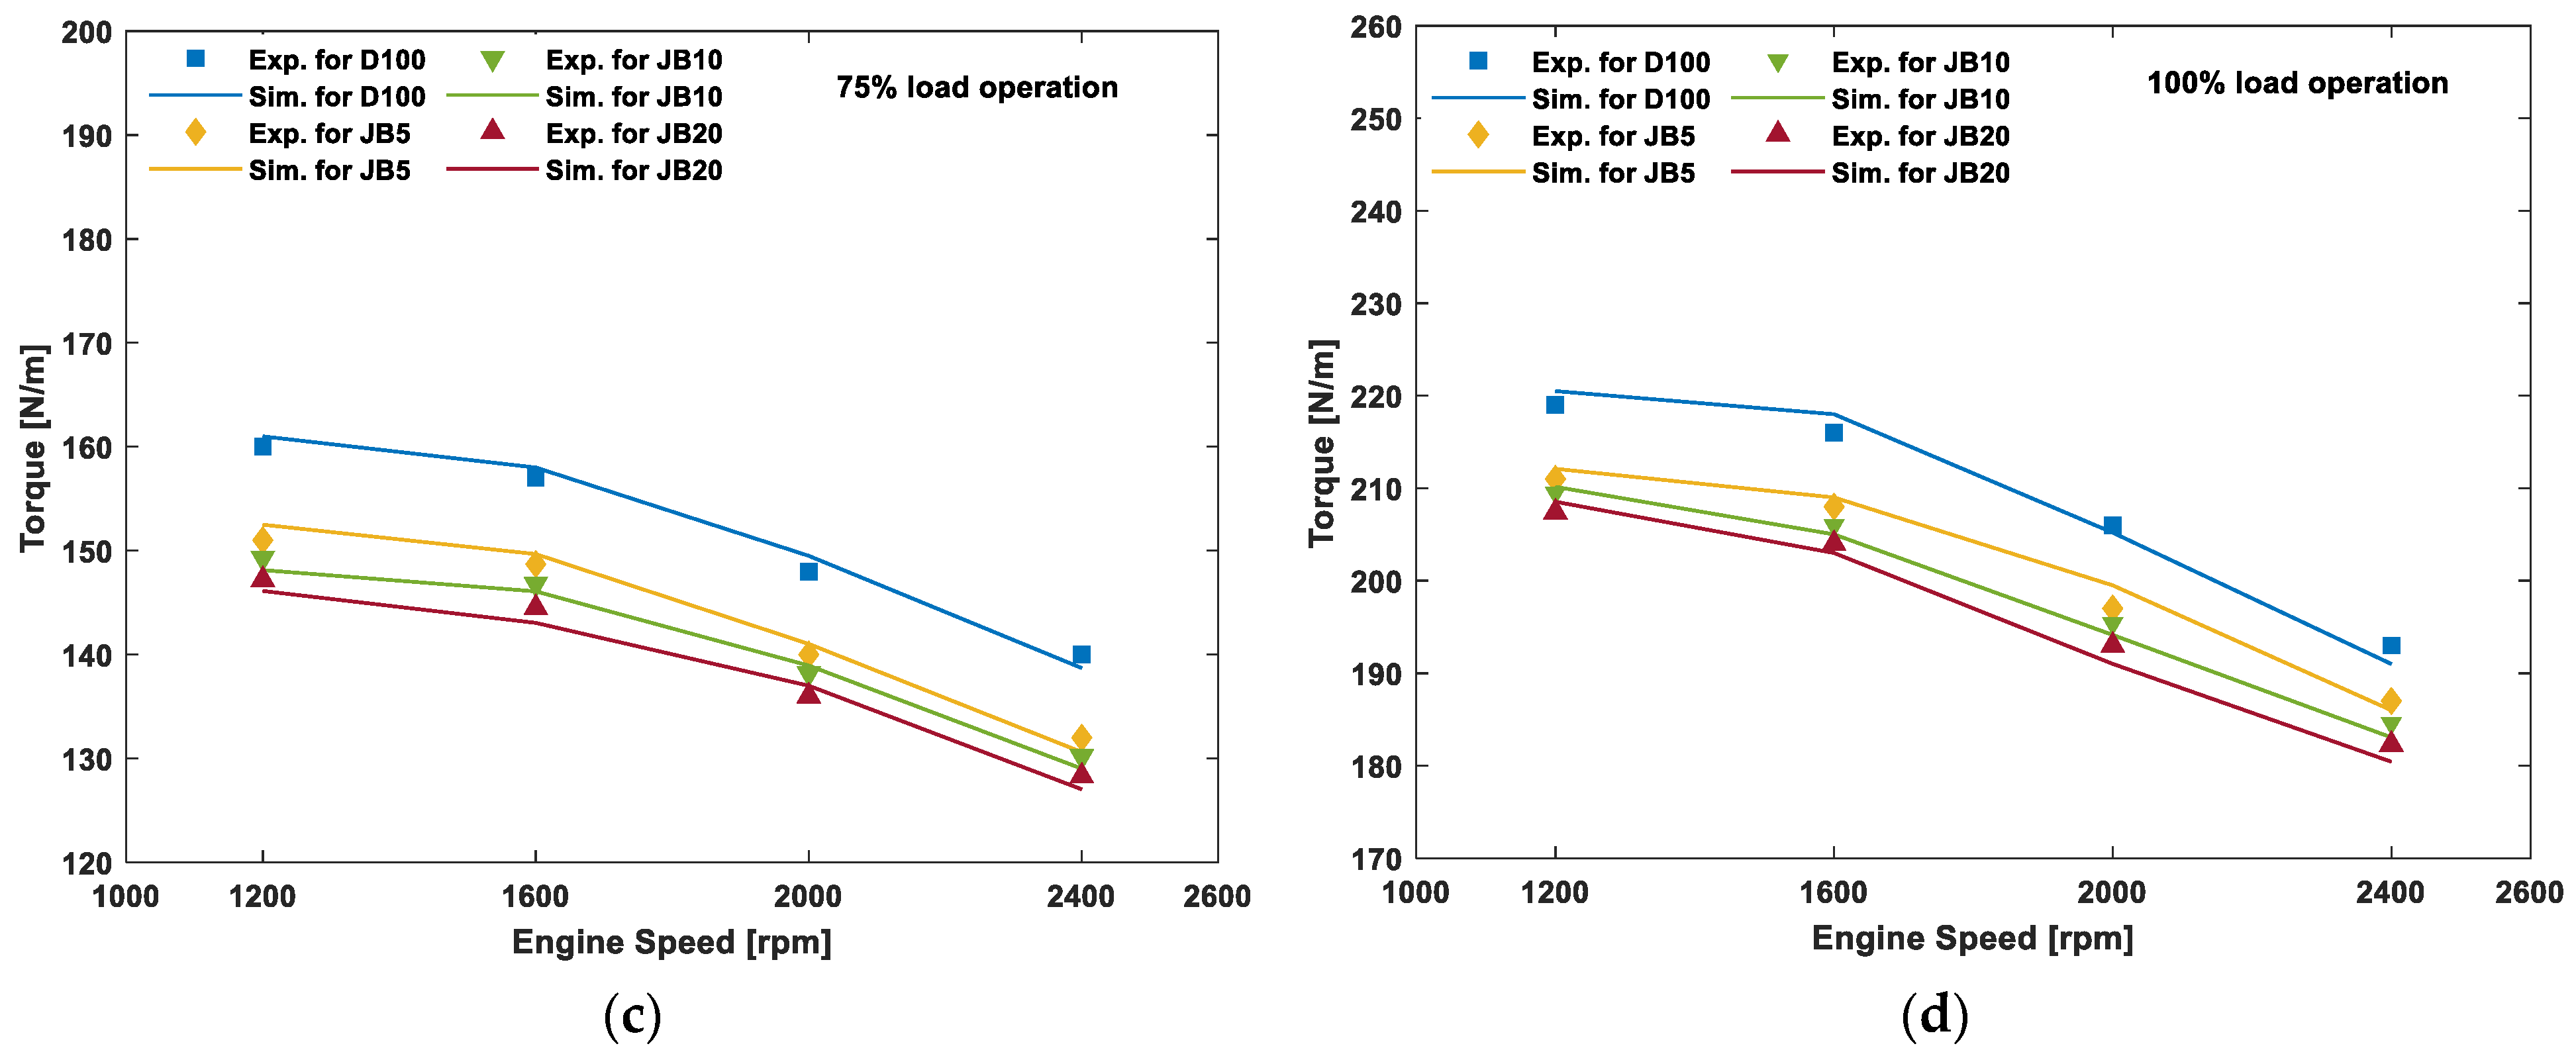
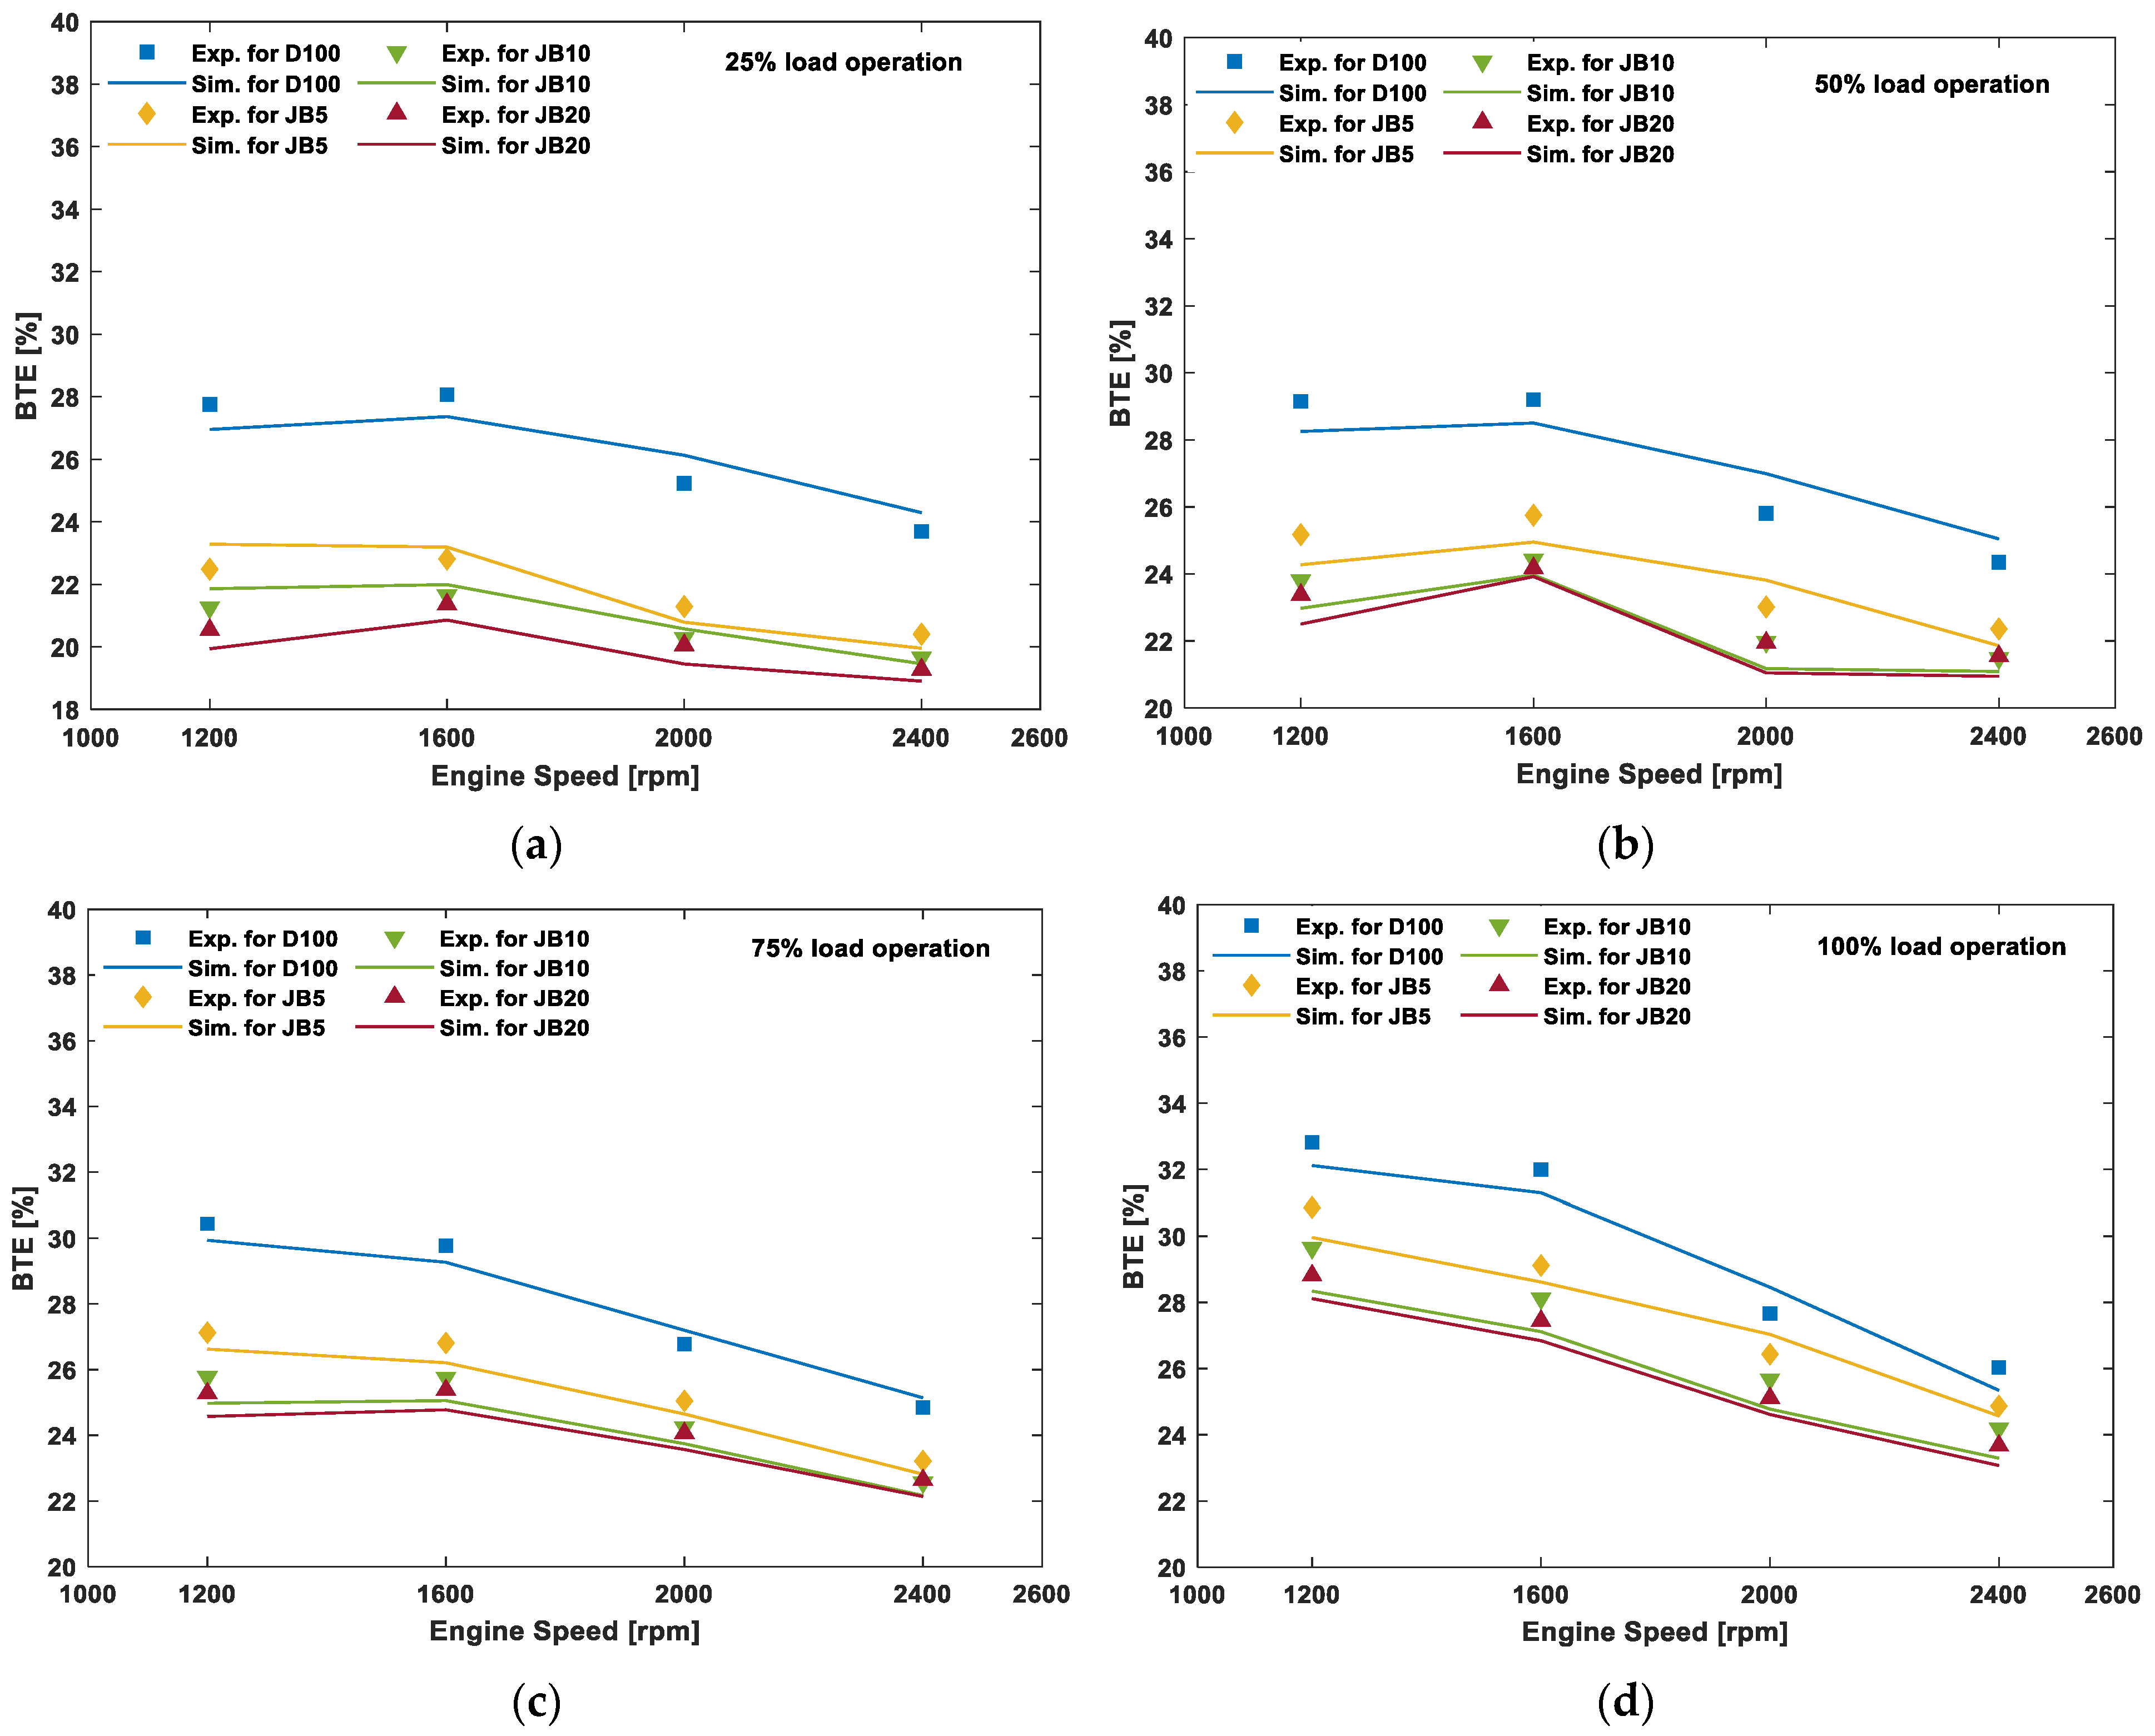
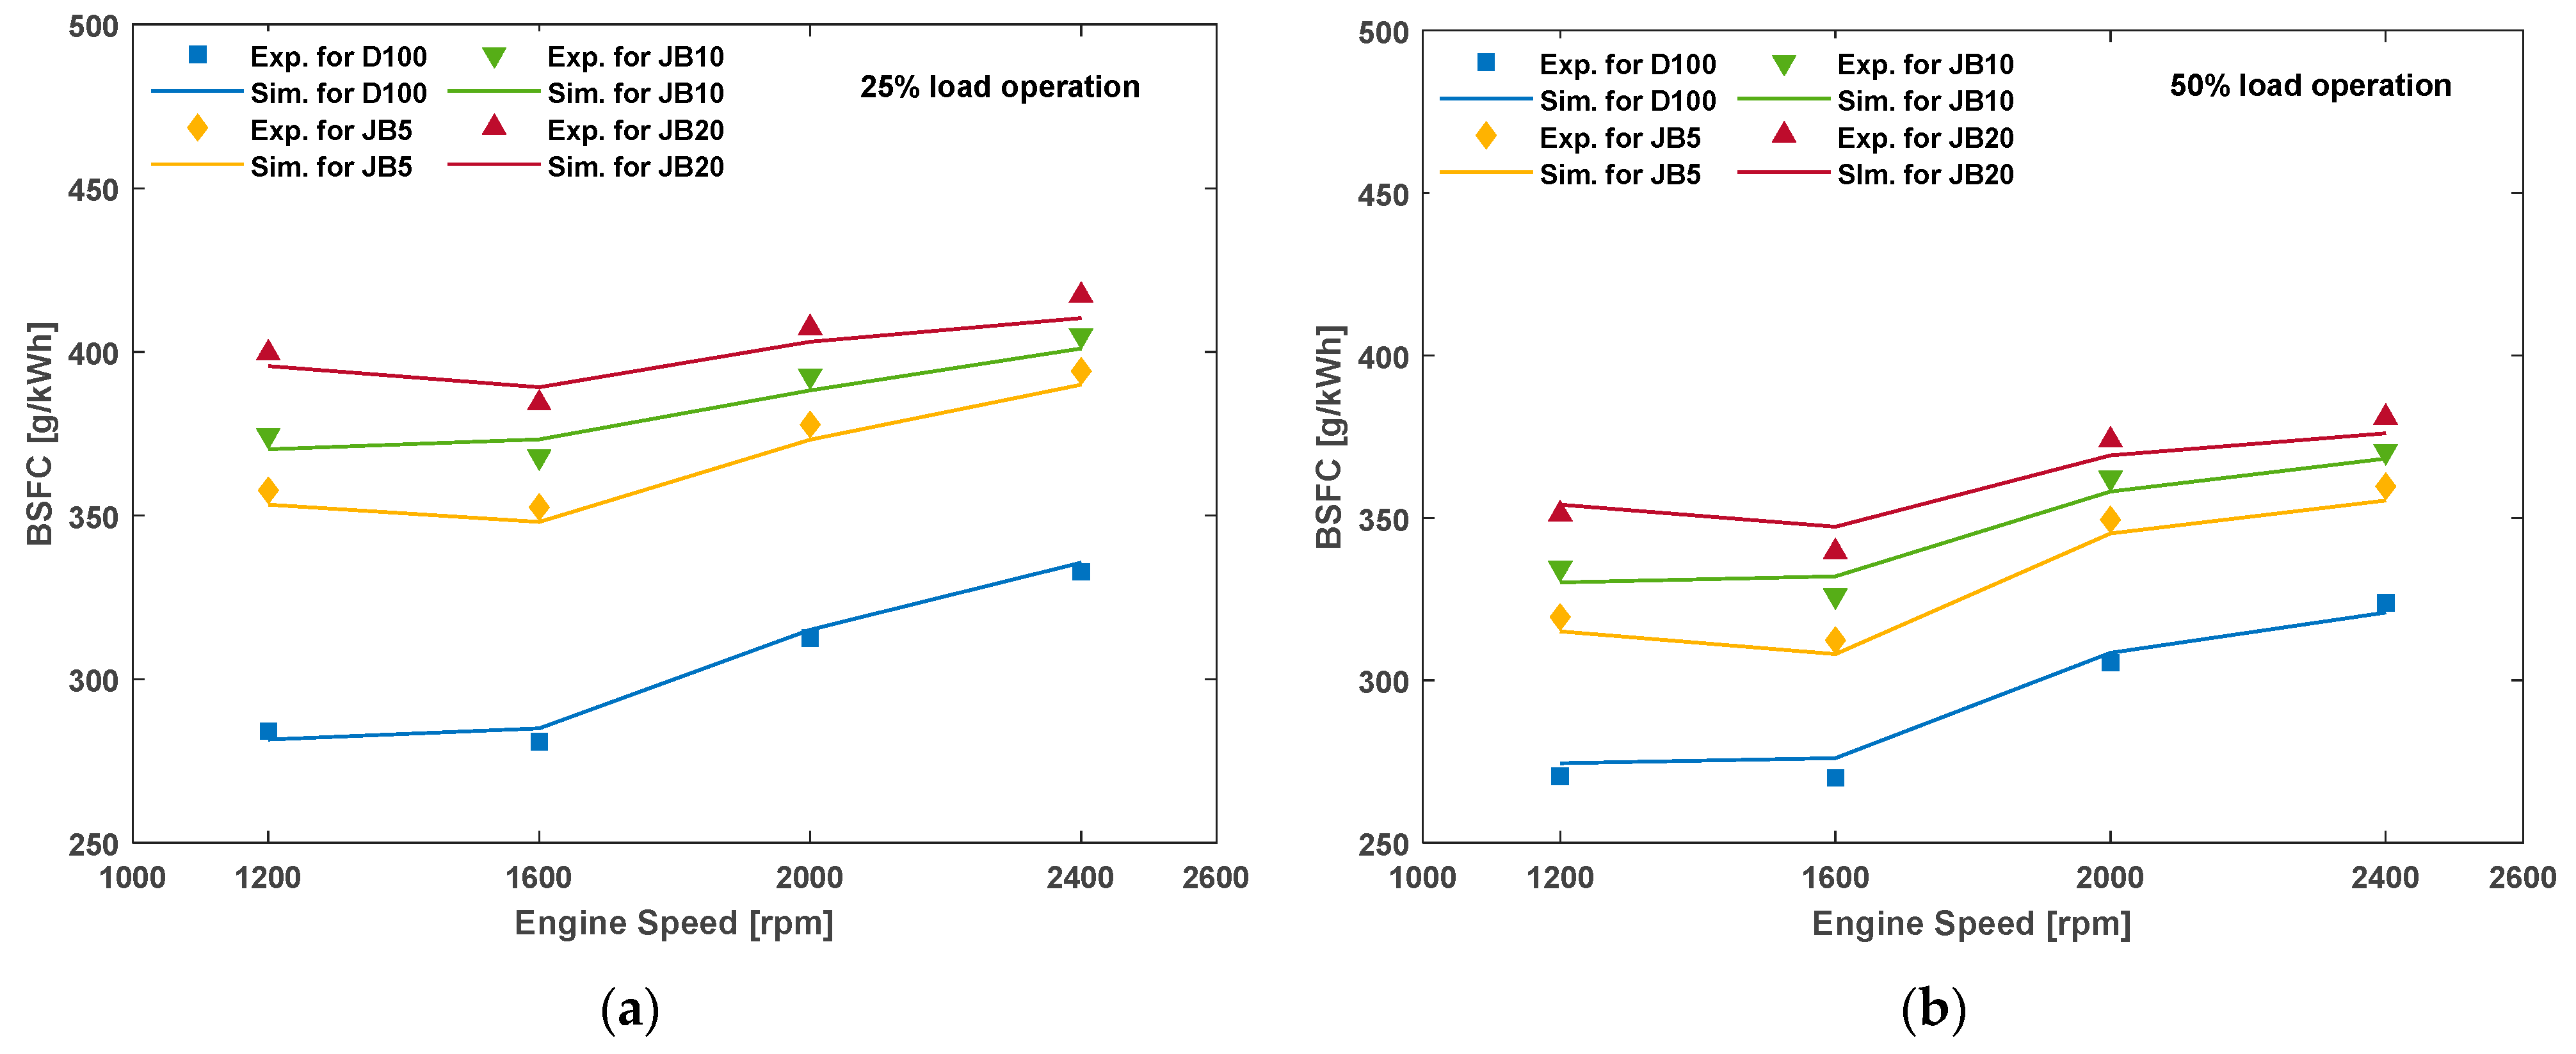
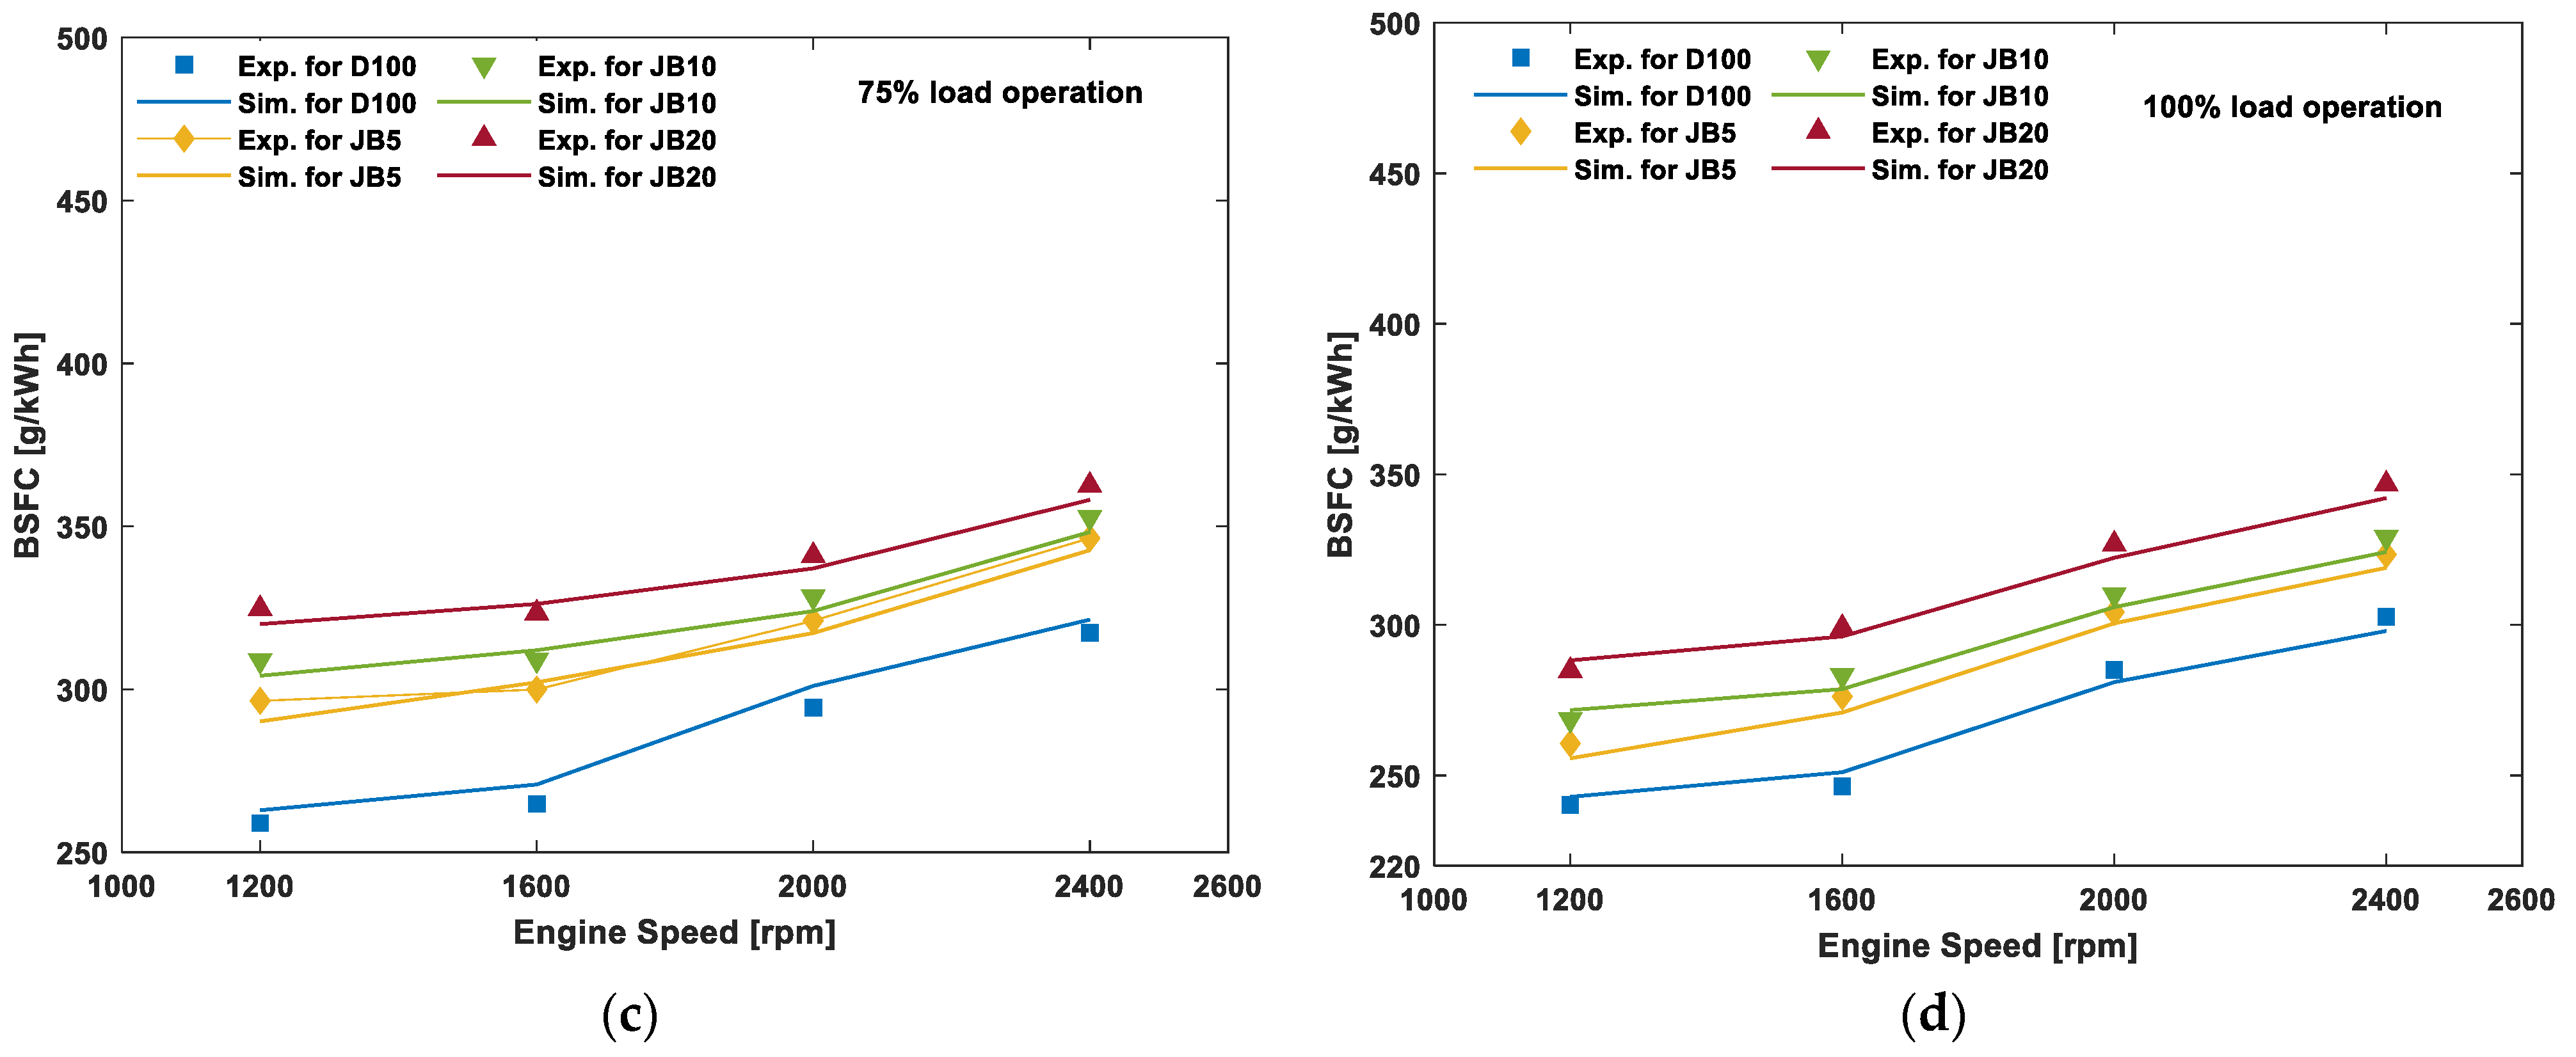
5.1. Engine Performances
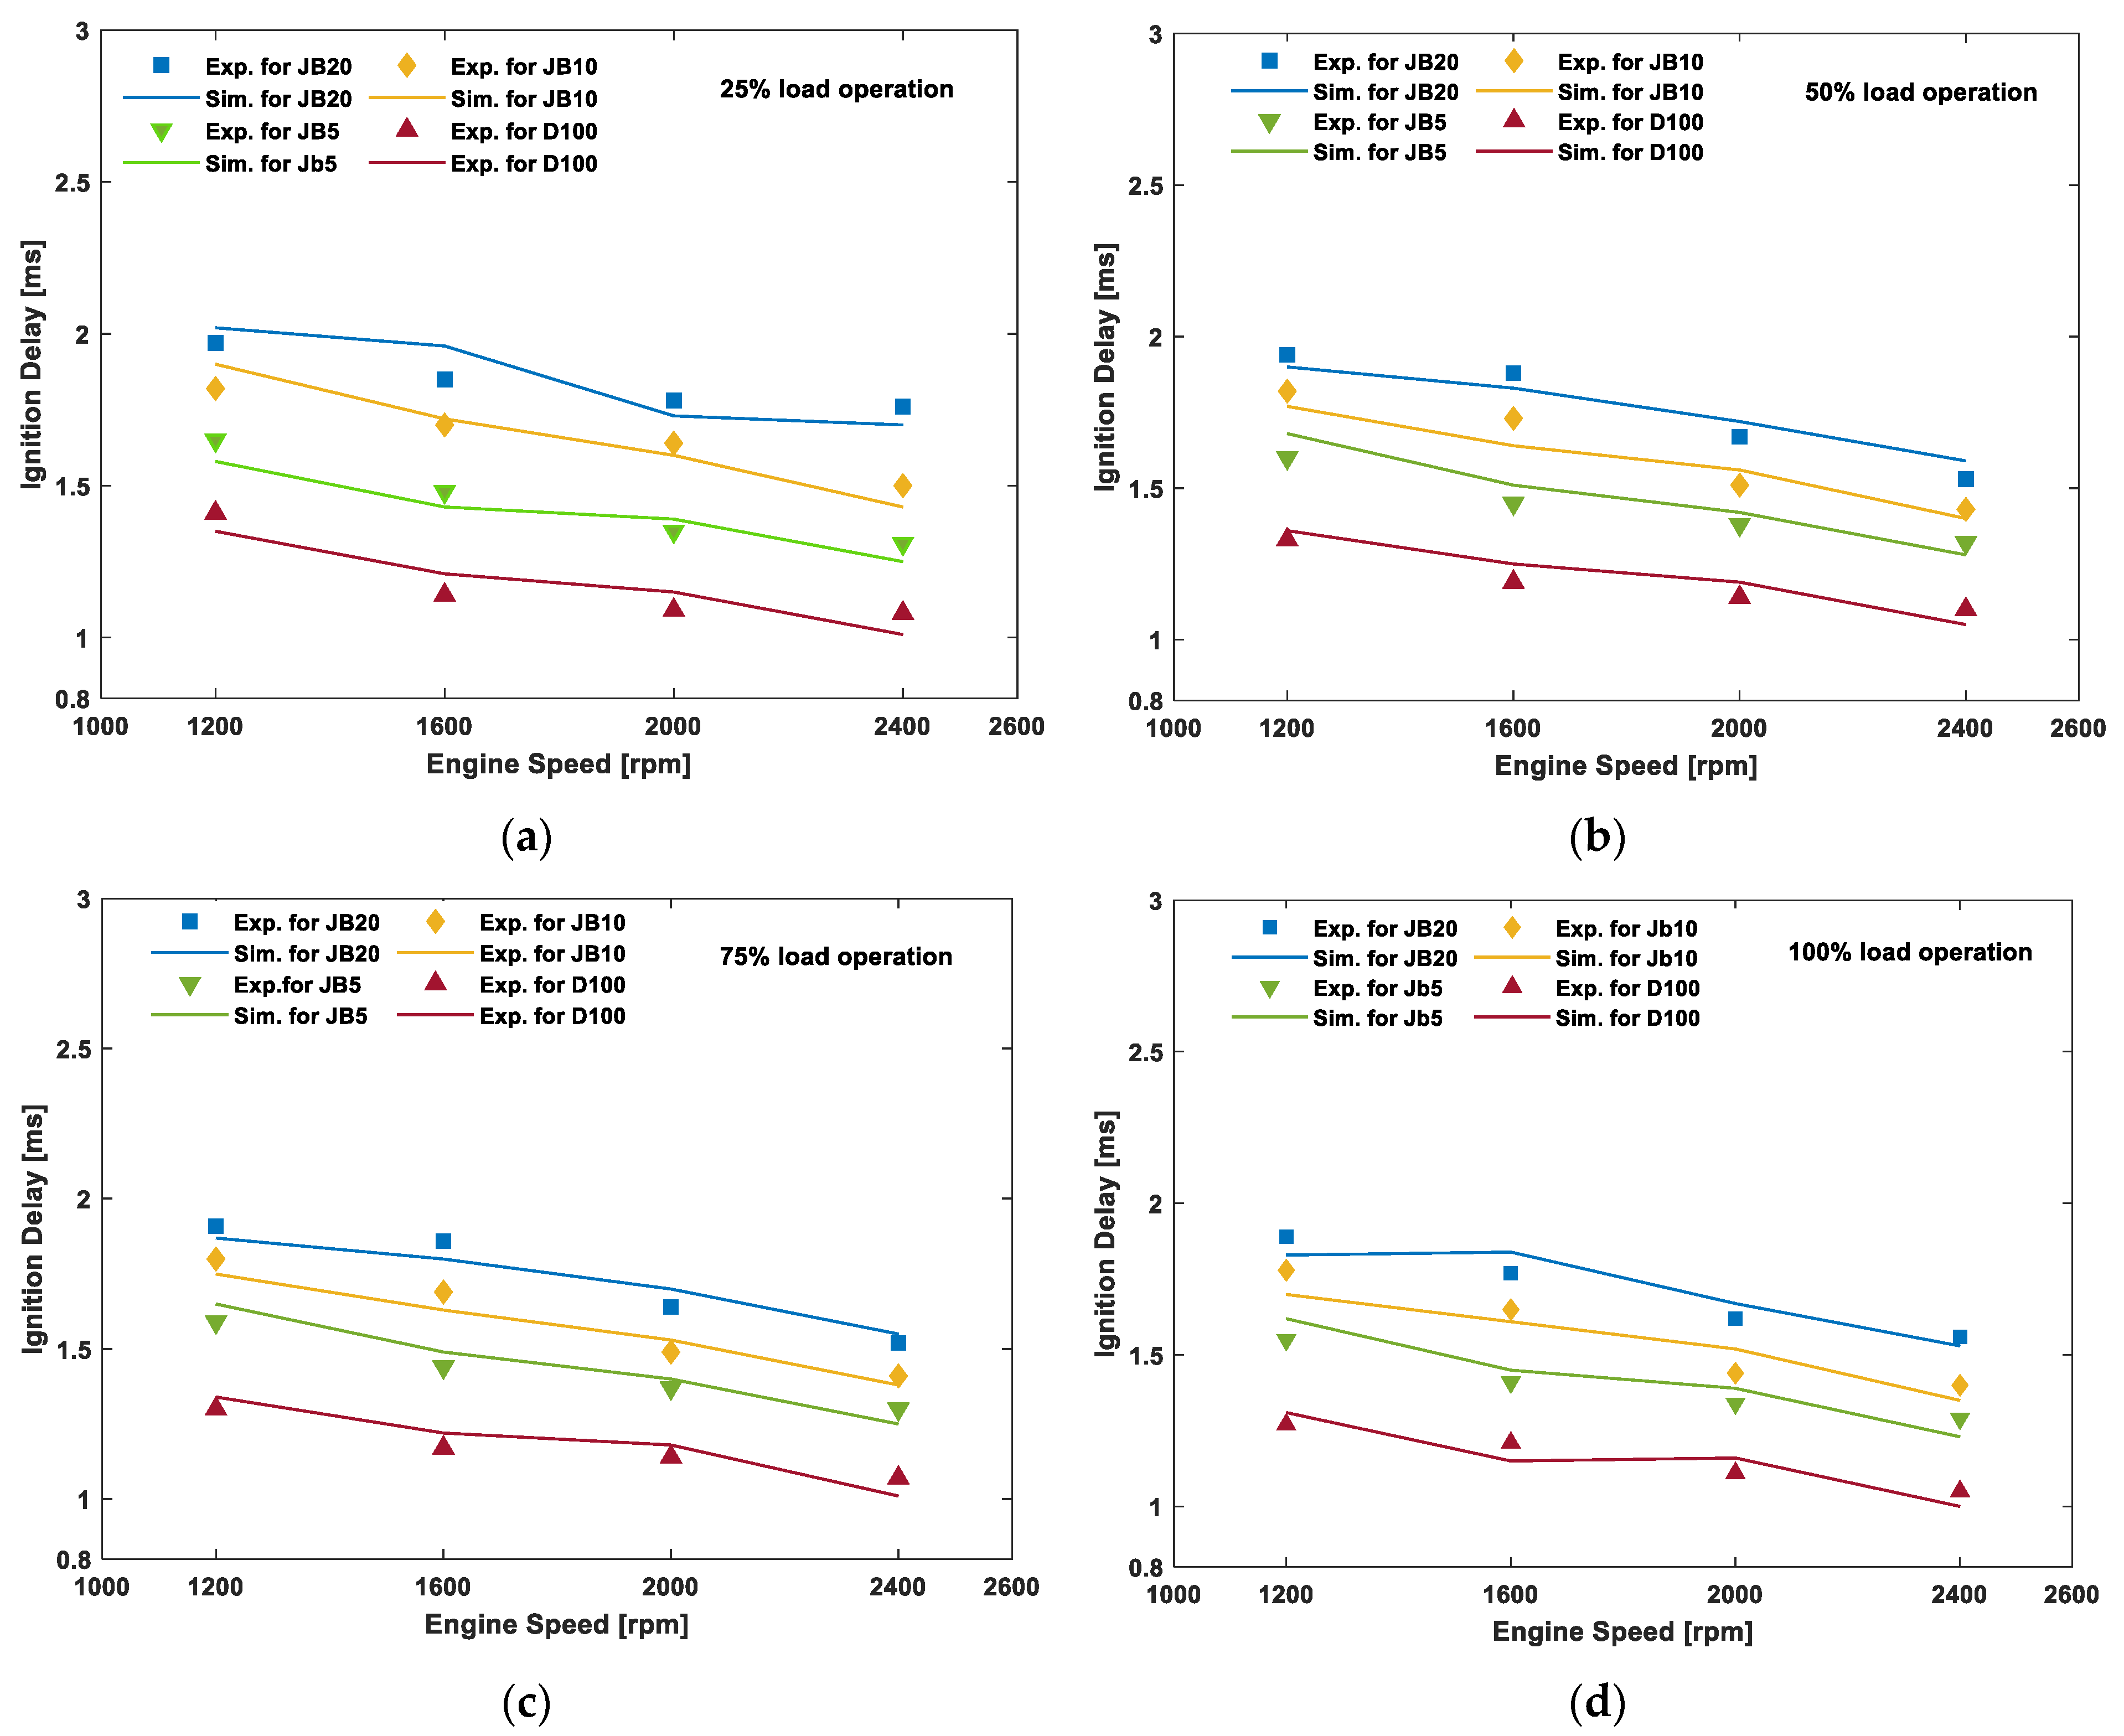
This section compares the numerical results with the experimentally measured data at 1200 rpm, 1600 rpm, 2000 rpm, and 2400 rpm under 25%, 50%, 75%, and 100% loading operation. Three different ratios of jojoba blends (5%, 10%, and 20%) with pure diesel were utilized in the experimental investigation to validate the model. Figure 3a–d illustrates simulation results with experimental validation of BP for D100 and all three blends (JB5, JB10, JB20) at variable speeds and loads. The simulations and experimental curves gradually increase for all tested fuels. Among all the results, diesel reported the highest BP at specified engine speeds.
The calorific value is the most influential parameter because of releasing available energy for producing work. A higher BP was identified due to the higher calorific value of diesel compared to jojoba–diesel blends. Again, due to an increase in viscosity, a more excellent fuel injection atomization increases BP. Figure 3a shows the simulation and experimental BP diagram by utilizing pure diesel (D100) and JB blends at 25% loading conditions considering speeds of 1200 rpm, 1600 rpm, 2000 rpm, and 2400 rpm. BP value increases with speed as the curve trends are authentic in all cases. We observed a closer agreement between simulated and experimental data at all speeds for D100, JB5, JB10, and JB20.
Figure 3b–d compares simulated and measured data of BP utilizing all three jojoba–diesel blends (5%, 10%, and 20%) at the mentioned loads and speed conditions. Diesel fuel indicated higher BP than jojoba–diesel blends. However, the lower the jojoba blend, the higher the BP value due to higher calorific value, density, and viscosity [60,61]. The minimum error was 3.7% at 100% and 2000 rpm for D100, and the maximum error was 15.3% at 2400 rpm and 25% loading operation for JB10. Furthermore, at high load, jojoba performances are closer to diesel compared to lower loading conditions [62].
The model calculates the value of diesel engine torque for all tested fuels under different speeds and loading conditions. Figure 4a represents the theoretical results from simulation work and experimental values from engine testing at 1200 rpm to 2400 rpm speeds under 25% speeds using D100, JB5, JB10, and JB20. The comparison between simulated and experiment curves found that torque decreases with speeds due to reducing intake and exhaust flow restriction, increased frictional resistance, and volumetric efficiency [63]. Meanwhile, torque increases as engine speed decreases due to less brake power and lower combustion efficiency [64,65].
Furthermore, Figure 4b–d represents a comparison of simulation and experimental results at all speeds under 50%, 75%, and 100% loading conditions utilizing pure diesel and all three jojoba–diesel blends. It is to be noted that the simulated torque value is provided directly from the model. In contrast, the experimental values were measured using Dyno Dynamics (450DS) software interfaced with the test PC. A good coincidence exists, with all simulated and measured points lying very close in this diagram. Compared to diesel and jojoba–diesel blends, higher torque showed because of higher calorific value, lower density, and viscosity [66]. Among three percentages (5%, 10%, and 20%) of jojoba blends, the torque value at JB5 is higher than JB20. As it is well known for this kind of engine, both the simulation and experimental curve show the same trends; that is, torque decreases with an increase in engine speed because of volumetric efficiency and friction loss [67]. A good agreement was found between the predicted and measured values of torque. The minimum error was 4.7% at 100% and 1600 rpm for JB5, and the maximum error was 19.2% at 1200 rpm and 25% loading operation for JB10.
Figure 5a examines the variation of calculated and experimental BTE values for D100 and all three jojoba–diesel blends at 25% load with different speeds. It showed that BTE increases with speeds up to 1600 rpm and then decreases with increasing speeds because of insufficient air in the cylinder and compression airdrop, hence the incomplete combustion of fuel [30,68].
Figure 5a–d compares predicted and experimental values at different speeds at 25%, 50%, 75%, and 100% loading conditions for all three (5%, 10%, and 20%) jojoba–diesel blends. The curves showed that the BTE decreases with increasing blends because of higher calorific value and lower fuel consumption. In contrast, BTE increases with speed at a certain level and then decreases due to lower viscosity, higher volatility, and the reduction in heat losses, leading to an increase in the fuel–air mixer [69,70]. More fuel injection pressure at full load conditions causes a negligible effect on the viscosity, leading to maximum combustion and increasing BTE [71]. Figure 5 shows that BTE decreases with increased jojoba blends from JB5 to JB20 in all the graphs. The higher BTE is observed at JB5 compared to JB10 and JB20 due to higher calorific value, less fuel consumption, lower viscosity, and higher volatility, leading to air–fuel mixing [72,73]. Figure 5 represents a good agreement between the simulated and measured values of BTE at all operating conditions. The minimum error was 3.4% at 100% and 2000 rpm for D100, and the maximum error was 18.3% at 1200 rpm and 25% loading operation for JB10.
Figure 6a compares simulation and experimental BSFC values fuelled with D100 and all three jojoba blends at four speeds at 25% loads. A highly satisfactory agreement is observed between them. As expected, the values decrease with a decrease in load due to approaching more prosperous conditions of physical and chemical fuel properties that show less fuel consumption at lower load ranges. In contrast, at high-speed operations, friction heat losses lead to deteriorated combustion that increases BSFC [74,75,76].
BSFC values of three different ratios of jojoba–diesel blends at different speeds and loads are shown in Figure 6b–d. The BSFC curve showed authentic trends in all cases, increasing with speeds due to increased friction power and higher fuel consumption [67,72]. Again, BSFC decreases as the load increases because of higher combustion efficiency and greater BP generated in the higher loading operations [77]. Furthermore, jojoba–diesel blends show higher BSFC than that of diesel fuel because of their high density and less calorific value. Note that high density causes more mass injection for the same volume that increases BSFC [78]. In contrast, the shorter the ignition delay, the larger the BSFC value due to the higher viscosity and volumetric effect of the constant fuel injection rate. After observing the BSFC values, a minimum error of 4.2% was found at 1400 rpm for D100 under 100% load in the present study. The maximum error of 15.7% was located at 1200 rpm for JB20 at 25% loading operation. Table 6 represents minimum and maximum percentage error between simulation and measured values of different parameters.

5.2. ID

ID is the time between the start of fuel injection to the beginning of combustion, which occurs through physical and chemical processes such as fuel atomization, vaporization, and fuel–air mixing [33]. As provided in the literature, the effects of physical factors on ID, compression temperature, and pressure play a key role in engine performance and output response [79]. As engine load decreases, ID time increases, the cause of incomplete combustion and lower cylinder temperature, resulting in engine power and efficiency decrease [36]. Again, the investigation found that retarded fuel injection decreases ignition delay time due to decreased in-cylinder temperature and pressure [40,41]. In contrast, fuel viscosity leads to poor atomization and slower mixing, which is the cause of longer ignition delay.
In the present study, the Assanis correlation [37] was used to calculate diesel ignition delay (time unit) and all three jojoba–diesel blends. In Figure 7a, the simulation values were compared with experimental values, and satisfactory results were observed between them. From Figure 7a, it can be seen that ID time decreases with increased engine speed due to the increase in residual gas and cylinder wall temperature. Consequently, ignition delay time increases with a decrease in engine load due to incomplete combustion for lower charge temperature at injection time, lower residual, and wall temperature at lower loading operations. Again, as engine load decreases, combustion temperature and pressure of the cylinder decreases; thus, ID time increases. As a result, ID detains the start of combustion nearer to the top dead centre (TDC), which reduces engine brake power and efficiency at low load operating ranges.
Figure 7a–d compares simulated and tested values of ID for diesel and all three jojoba–diesel blends at various speeds and loading operations. The simulation and experimental results showed an authentic trend that ID values increases with decreasing speed and load for all biodiesels. A very good agreement was found between simulation and experimental values for all operating conditions. Generally, biodiesels have higher viscosity and lower volatility than pure diesel, leading to a rapid and complex chemical reaction at a higher cylinder temperature. As a result, fuel injection temperature increases and finds shorter ID due to earlier ignition [80]. However, diesel has a greater percentage of diglycerides with lower boiling points than jojoba biodiesel. Moreover, cetane number (CN) significantly impacts the ignition delay period. The increase in CN (highest CN for JB20 shown in Table 5) decreases the ID time. A shorter ID time means an earlier start of combustion (SOC), leading to increased engine efficiency.

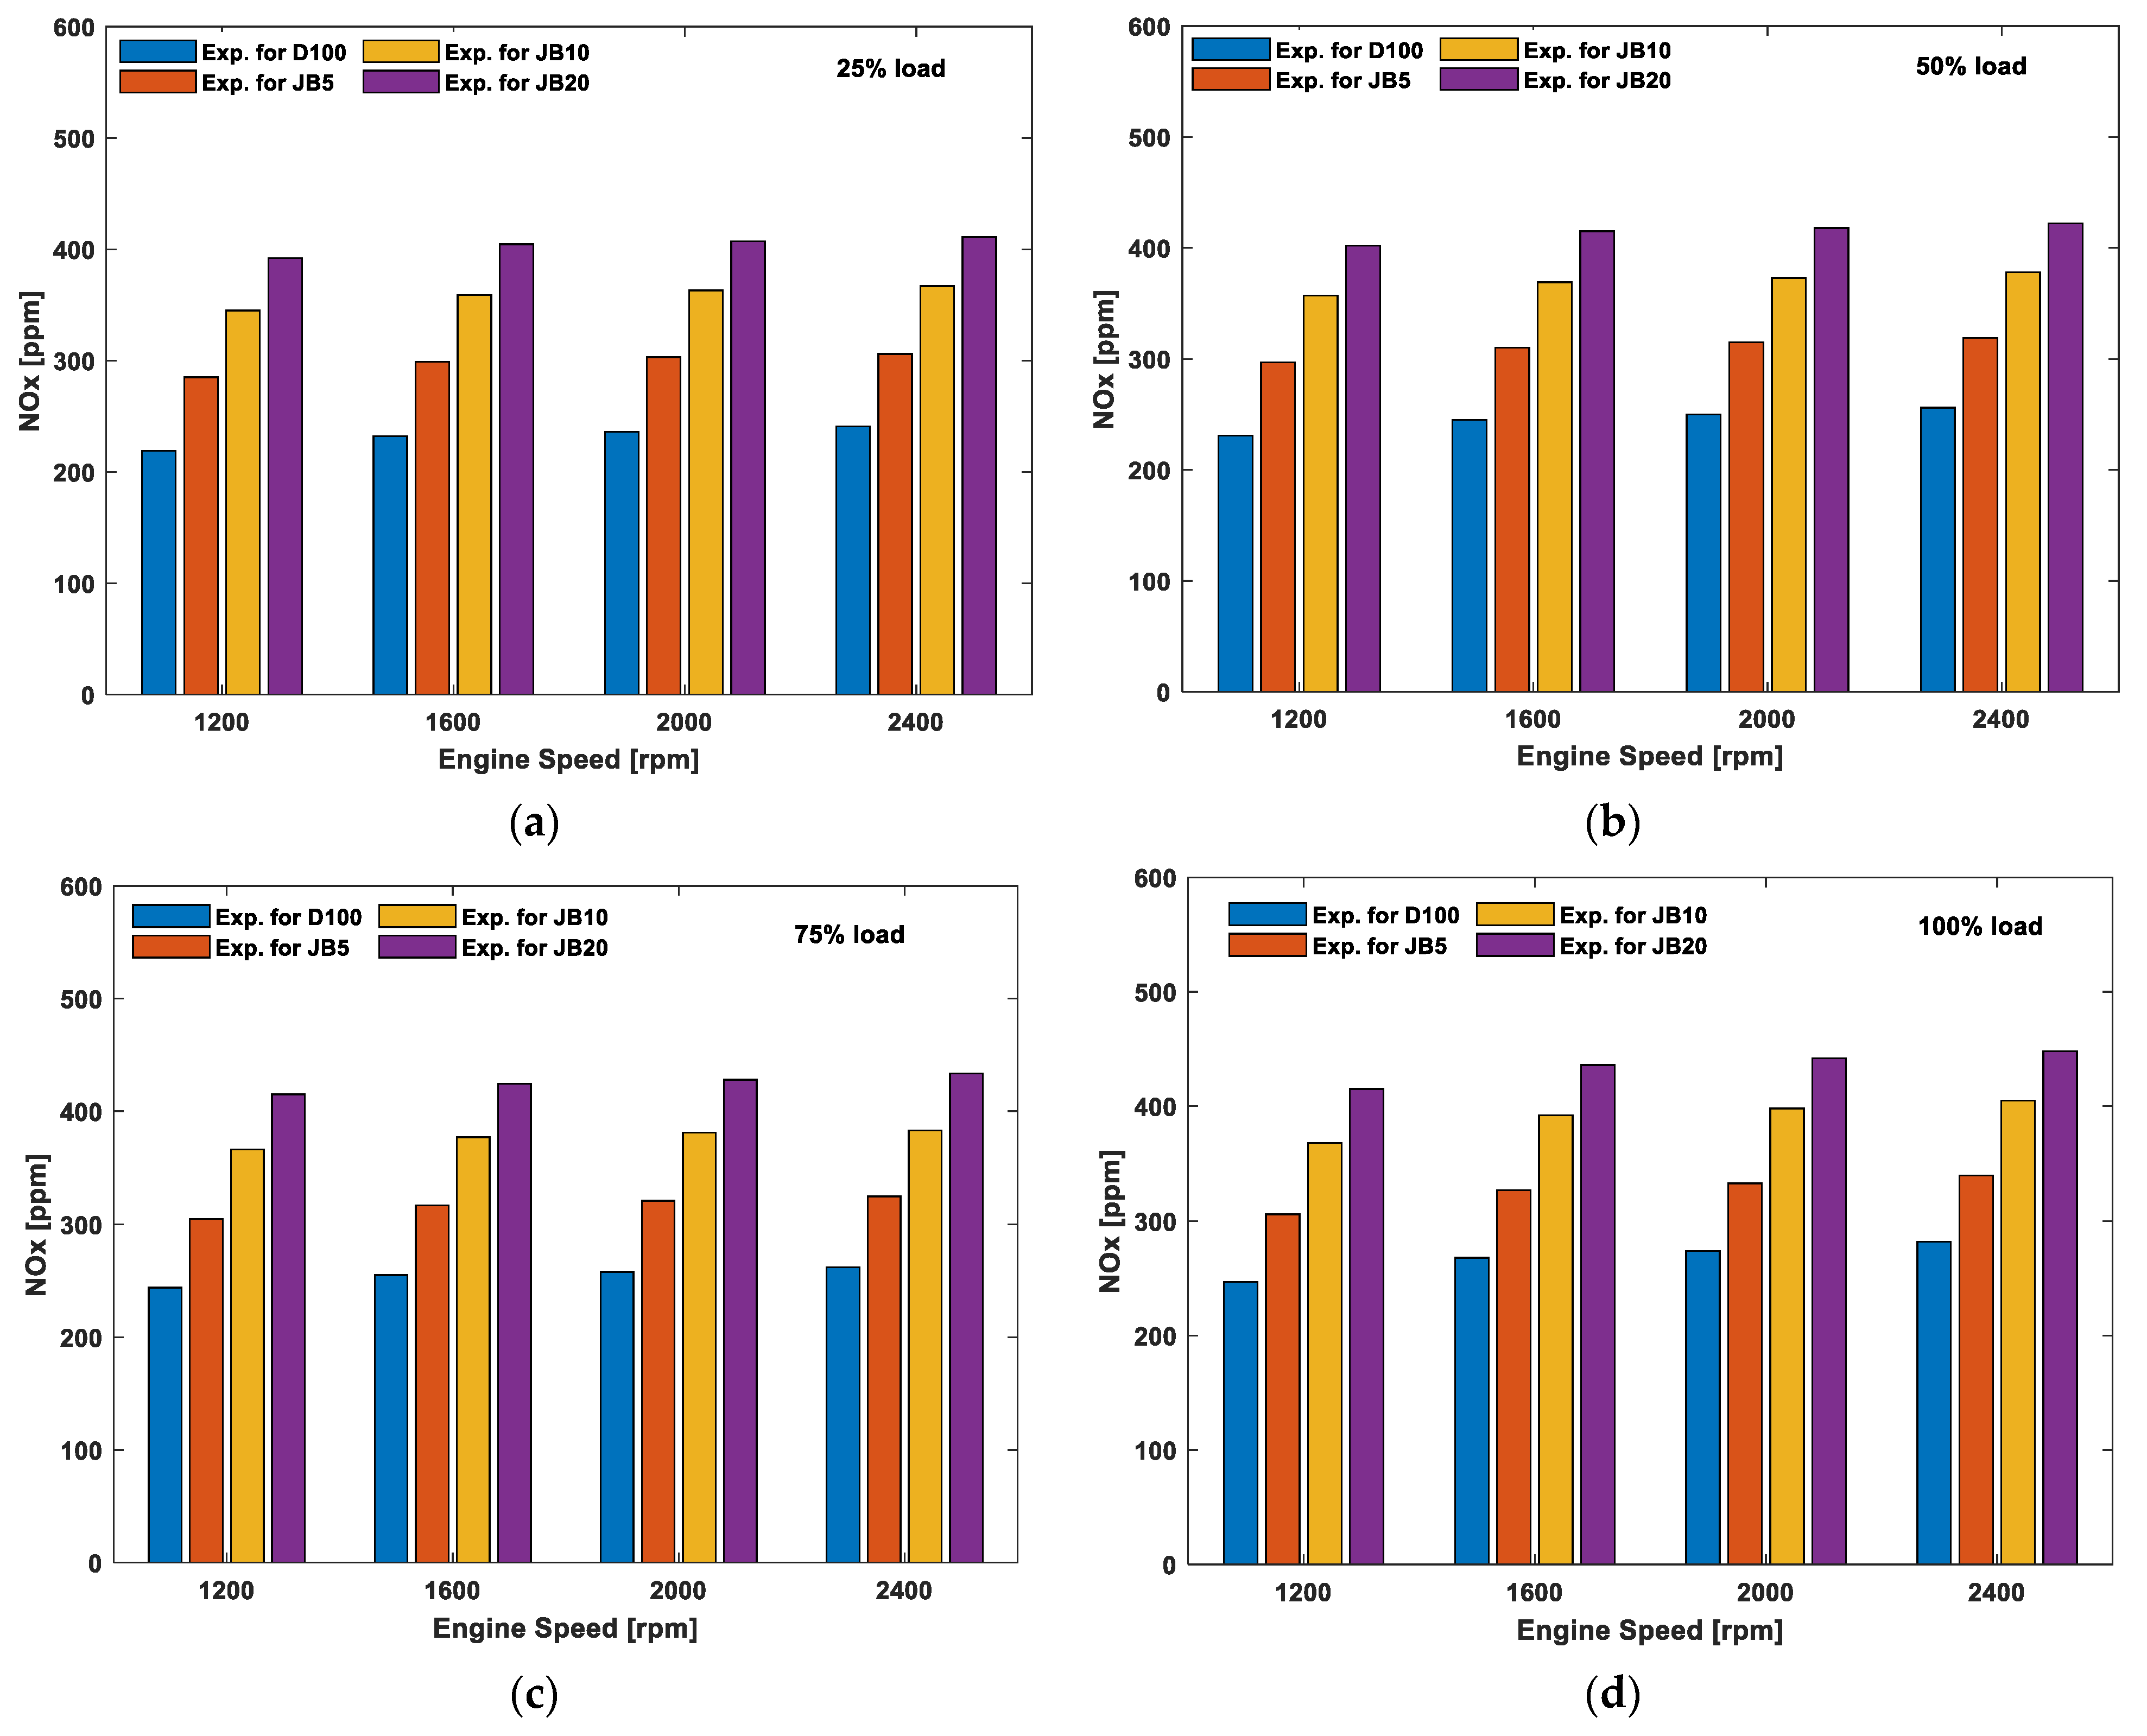
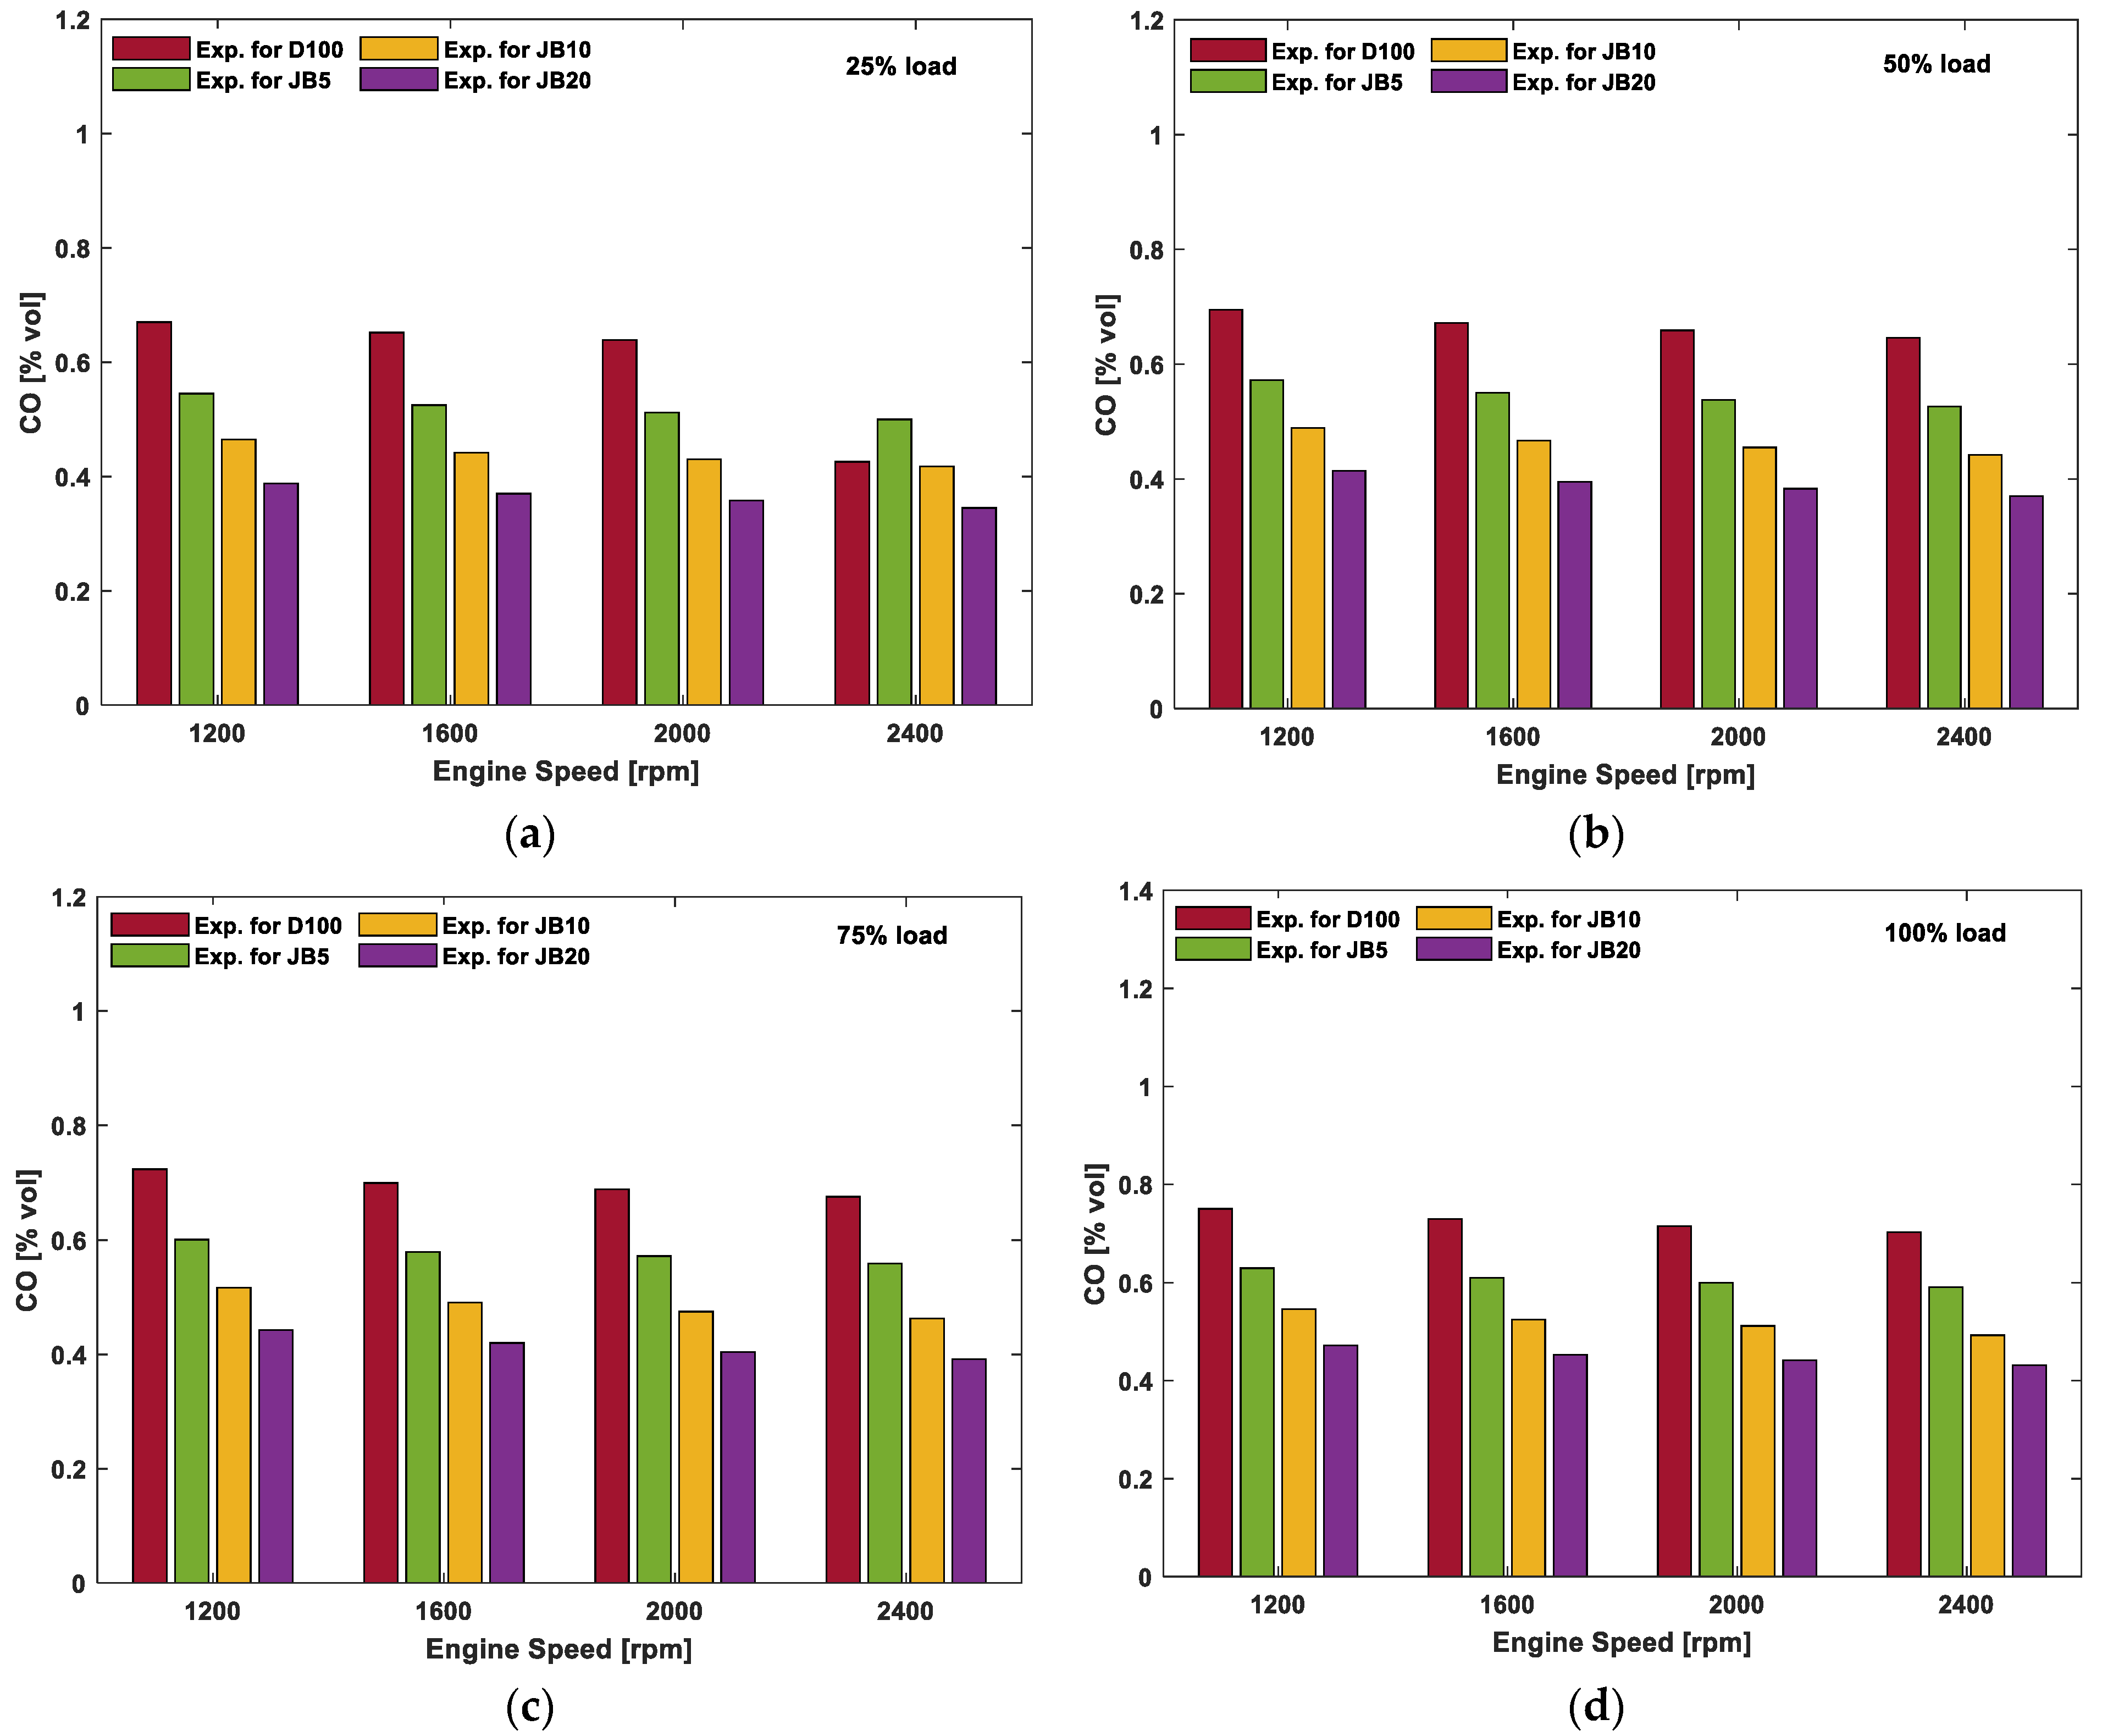
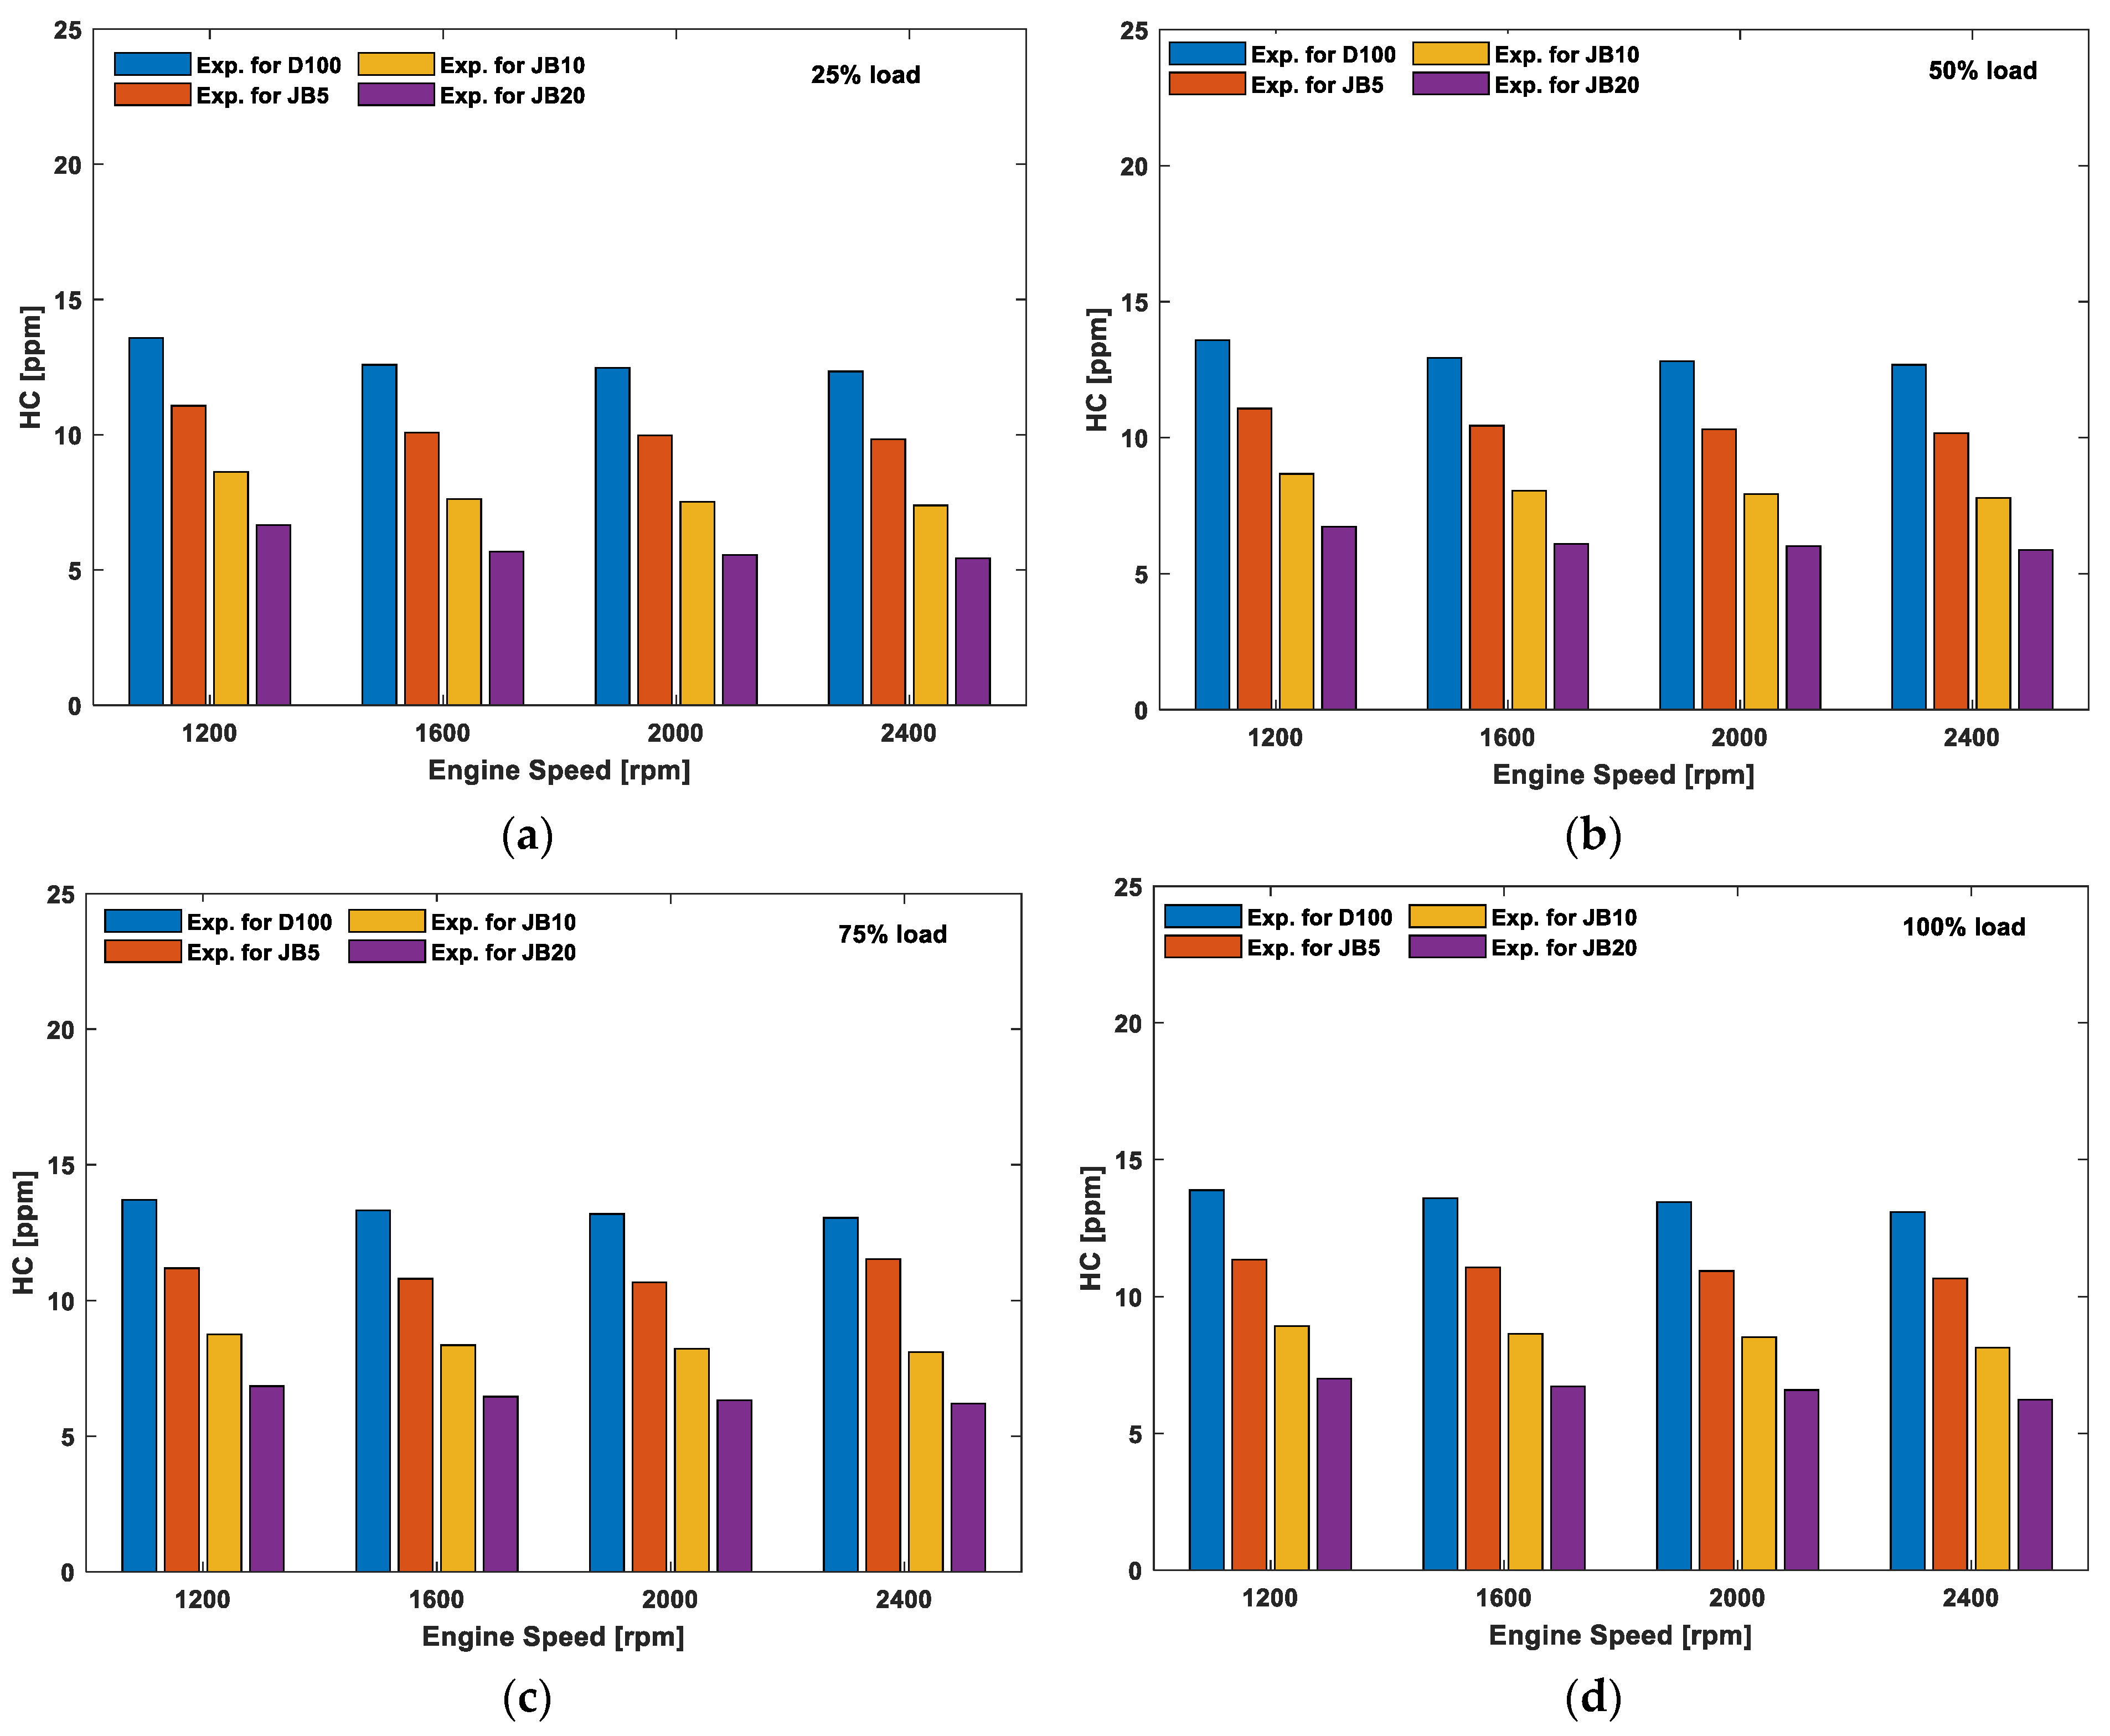
5.3. Emissions Analysis of Diesel and Jojoba Blends

Figure 8a–d indicates the comparison of NOx emission for D100, JB5, JB10, and JB20 at variable speeds and loading conditions. The NOx increases with an increase in speed for all tested fuels, as shown in Figure 8. The NOx emission increases with an increase in jojoba blends because of higher oxygen content and premixed part [81]. In contrast, the higher CN is the cause of shorter ID and produces lower temperature and pressure during combustion, which produces less NOx formation.
In Figure 8a–d, the higher NOx emission was found for JB20 compared to other jojoba–diesel blends at all tested conditions because of the leaner air–fuel ratio and fuel blend’s combustion temperature. As a result, higher oxygen is concentrated in mixed fuel and becomes more oxygenated, which provides access oxygen needed to oxide nitrogen. Thus, NOx increased due to nitrogenated fuel [82,83]. With an increase in engine load, NOx increases for higher cylinder temperature and stoichiometry of the mixture during the combustion period. Furthermore, higher NOx is the reason for the increasing gas temperature and air–fuel ratio at higher engine speeds.
Carbon monoxide (CO) is produced due to an excessively lean or rich fuel air in the engine cylinder. Again, flame quenching in the wall impingement region is another factor in producing CO. Higher CO content in emission is the cause of incomplete or poor combustion. Figure 9a–d represents the comparison of CO for D100, JB5, JB10, and JB20 at all four speeds and four loading conditions. CO emissions decrease with increased speeds for all tested fuels due to the rich fuel–air ratio at higher speeds [84]. Higher oxygen content in the mixture in JB20 decreases CO emissions. The CO emissions for all tested jojoba blends are lower than diesel because of more O2 content and cetene number in the blends. The maximum reduction is observed for JB20 (7.75%) at 25% load operation compared to diesel.
Due to the increase in the mixture’s fuel–air ratio, the CO emission decreases with a decrease in load for all tested fuels at different speeds. Again, CO emission is lower for jojoba blends under all loading operations compared to diesel. The lowest CO value is found at JB20 amongst all other jojoba blends at 1400 rpm and 100% load because of higher density and viscosity at JB20 compared to diesel. Figure 10a–d represents the HC emission for D100, JB5, JB10, and JB20 at different speeds (1200 rpm, 1600 rpm, 2000 rpm, and 2400 rpm) and loading (25%, 50%, 75%, and 100%) conditions. Higher HC emissions are produced at low engine speed for longer ID due to slow swirl air velocity. These figures show that HC emissions are decreasing with an increase in engine speeds due to higher fuel density and viscosity [85]. In addition, due to higher fuel density and viscosity at lower engine speed, the HC is higher [86].
Overall, JB20 represents less HC emission compared to D100, JB5, and JB10 due to higher CN, shorter ID, higher oxygen content, etc., resulting in a markable HC reduction shown in JB20 because of lower carbon and hydrogen content, which is the cause of complete combustion [87]. The lowest decrease in HC emission was found for JB20 (2.95%) compared to other samples at 1500 rpm and 100% load; however, the highest decreasing was found to be 6.65% at 1200 rpm and 25% load. Again, HC increases with an increase in engine load for all tested fuels due to more fuel entering the cylinder and a higher air–fuel ratio. Table 7 represents the findings of NOx, CO, and HC emissions in the present study. Finally, it was concluded that JB20 showed better results in comparison to other blends (JB5 and JB10) [82].

6. Recommendations

Though biodiesels are the alternative to petroleum fuel due to less CO and HC emissions, NOx emission is higher than diesel fuel. A few technologies are becoming popular day by day to overcome the drawbacks of biodiesels such as hybrid, hydrogen [90], and nanoparticles as an alternative to biodiesel. Furthermore, diesel generation using NPs is a promising technique to eliminate harmful gas emissions [91]. A significant improvement in engine performance (e.g., BP, BTE, torque, etc.) using hydrogen fuel was reported by Bakar et al. [92,93]. Moreover, due to the high expense of hydrogen storage and engine modification, hydrogen is less of a concern in developing countries. Besides, nanoparticles (NPs) are also used in a diesel engine to enhance performance and reduce emissions. Studies [94,95,96,97] reported that NPs improved BP, torque, and BTE and decreased BSFC, CO2, CO, and HC emissions compared to diesel. However, ensuring the availability of NPs is one of the challenges nowadays. Furthermore, optimal dosage and sizing [98], stability, and durability are also of concern as the drawbacks of nanoparticles as an engine fuel [99,100]. Atarod et al. [101] reported that nanoparticles diminished NOx formation in a diesel engine at moderate load.

7. Conclusions

This study considered a single-zone thermodynamic model for predicting diesel engine performance behaviors and ID period for loads and speeds as operating parameters. The model proved very effective, with much lower computational time, cost, and effort. For model validation, experiments were conducted on a fully automated engine test bed (Kubota V3300, DI diesel engine) located at the CQUniversity, Rockhampton campus, Australia. A good agreement was observed between the simulation and the experimental results using diesel (D100) and all three jojoba–diesel blends (JB5, JB10, and JB20) at 1200 rpm, 1600 rpm, 2000 rpm, and 2400 rpm speeds under four loadings (25%, 50%, 75%, and 100%) conditions. The findings reasonably aggress with the literature; however, the verified model developed in this paper has contributed significantly to the new knowledge. In most cases, a minimum error of 3.4% was observed at 2400 rpm and full load; however, the maximum error was up to 19.2% for 1200 rpm at 25% load. ID time decreased with increased engine loads and speeds for the tested fuels, which is expected in all cases. Among all three jojoba–diesel blendings, JB5 showed a shorter ID than JB10 and JB20 for all operating conditions. Noticeable reductions of 7.75% and 2.95% were found in CO and HC emissions, respectively, for JB20 blends at 25% and 1200 rpm, compared with standard diesel. However, greater NOx emission (up to 10.25%) was observed under all tested conditions. More research, as recommended in Section 5, in the revised version, should be done to investigate how NOx can be reduced.

Author Contributions

Conceptualization, A.G.M.B.M.; Resources, M.M.K.B.; Software, validation, formal analysis, and writing—original draft preparation, A.G.M.B.M.; Writing—review and editing, M.G.R. and X.W.; Supervision, M.N. and J.H. All authors have read and agreed to the published version of the manuscript.

Funding

The research received no external funding.

Institutional Review Board Statement

No animal was involved in this study.

Informed Consent Statement

Informed consent was obtained from all subjects involved in the study from our department of the facility for the experimental activities.

Data Availability Statement

Not applicable.

Conflicts of Interest

The authors declare no conflict of interest.

References

  1. Labeckas, G.; Slavinskas, S.; Kanapkienė, I. The individual effects of cetane number, oxygen content or fuel properties on performance efficiency, exhaust smoke and emissions of a turbocharged CRDI diesel engine–Part 2. Energy Convers. Manag. 2017, 149, 442–466. [Google Scholar] [CrossRef]
  2. Merola, S.S.; Irimescu, A.; Marchitto, L.; Tornatore, C.; Valentino, G. Effect of injection timing on combustion and soot formation in a direct injection spark ignition engine fueled with butanol. Int. J. Engine Res. 2017, 18, 490–504. [Google Scholar] [CrossRef]
  3. Hardalupas, Y.; Hong, C.; Keramiotis, C.; Taylor, A.M.; Touloupis, D.; Vourliotakis, G. Optical diagnostics investigation into the effect of pilot injection dwell time and injection pressure on combustion characteristics and soot emissions in a single-cylinder optical diesel engine. J. Energy Eng. 2018, 144, 04018056. [Google Scholar] [CrossRef]
  4. Mustayen, A.G.M.B.; Rasul, M.G.; Wang, X.; Negnevitsky, M.; Hamilton, J.M. Remote areas and islands power generation: A review on diesel engine performance and emission improvement techniques. Energy Convers. Manag. 2022, 260, 115614. [Google Scholar] [CrossRef]
  5. Levendis, Y.A.; Pavlatos, I.; Abrams, R.F. Control of Diesel Soot, Hydrocarbon and NOx Emissions with a Particulate Trap and EGR; 0148-7191; SAE Technical Paper; SAE International: Warrendale, PA, USA, 1994. [Google Scholar]
  6. Pulkrabek, W.W. Engineering Fundamentals of the Internal Combustion Engine; Pearson Prentice Hall: Upper Saddle River, NJ, USA, 2004. [Google Scholar]
  7. Rakopoulos, D.C.; Rakopoulos, C.D.; Giakoumis, E.G.; Papagiannakis, R.G. Evaluating oxygenated fuel’s influence on combustion and emissions in diesel engines using a two-zone combustion model. J. Energy Eng. 2018, 144, 04018046. [Google Scholar] [CrossRef]
  8. Anwar, M.; Rasul, M.G.; Hassan, N.M.S.; Jahirul, M.I.; Haque, R.; Hasan, M.M.; Mustayen, A.G.M.B.; Karami, R.; Schaller, D. Stone fruit seed: A Source of renewable fuel for transport. Energies 2022, 15, 4667. [Google Scholar] [CrossRef]
  9. Misra, R.; Murthy, M. Straight vegetable oils usage in a compression ignition engine—A review. Renew. Sustain. Energy Rev. 2010, 14, 3005–3013. [Google Scholar] [CrossRef]
  10. Karthikeyan, S.; Prathima, A.; Elango, A.; Silaimani, S. Environmental effect of vitis vinifera (grape seed oil) biofuel blends in marine engine. Indian J. Geo-Mar. Sci. 2015, 44, 1852–1856. [Google Scholar]
  11. Karthikeyan, S.; Prathima, A.; Sabariswaran, K. An environmental effect of nano additive on performance and emission in a biofuel fuelled marine engine. Indian J. Geo-Mar. 2015, 44, 896–901. [Google Scholar]
  12. Karami, R.; Rasul, M.G.; Khan, M.M.K. CFD simulation and a pragmatic analysis of performance and emissions of tomato seed biodiesel blends in a 4-cylinder diesel engine. Energies 2020, 13, 3688. [Google Scholar] [CrossRef]
  13. Akbarian, E.; Najafi, B. A novel fuel containing glycerol triacetate additive, biodiesel and diesel blends to improve dual-fuelled diesel engines performance and exhaust emissions. Fuel 2019, 236, 666–676. [Google Scholar] [CrossRef]
  14. Khiari, K.; Awad, S.; Loubar, K.; Tarabet, L.; Mahmoud, R.; Tazerout, M. Experimental investigation of pistacia lentiscus biodiesel as a fuel for direct injection diesel engine. Energy Convers. Manag. 2016, 108, 392–399. [Google Scholar] [CrossRef]
  15. Awad, S.; Paraschiv, M.; Varuvel, E.G.; Tazerout, M. Optimization of biodiesel production from animal fat residue in wastewater using response surface methodology. Bioresour. Technol. 2013, 129, 315–320. [Google Scholar] [CrossRef] [PubMed]
  16. Ashraful, A.M.; Masjuki, H.H.; Kalam, M.A.; Rizwanul Fattah, I.M.; Imtenan, S.; Shahir, S.A.; Mobarak, H.M. Production and comparison of fuel properties, engine performance, and emission characteristics of biodiesel from various non-edible vegetable oils: A review. Energy Convers. Manag. 2014, 80, 202–228. [Google Scholar] [CrossRef]
  17. Karthikeyan, S.; Prathima, A. Neochloris oleoabundans microalgae oil as a fuel for diesel engines. Energy Sources Part A: Recovery Util. Environ. Eff. 2017, 39, 606–612. [Google Scholar] [CrossRef]
  18. Karthikeyan, S.; Prathima, A. Microalgae biofuel with CeO2 nano additives as an eco-friendly fuel for CI engine. Energy Sources Part A: Recovery Util. Environ. Eff. 2017, 39, 1332–1338. [Google Scholar] [CrossRef]
  19. Karthikeyan, S.; Kalaimurugan, K.; Prathima, A.; Somasundaram, D. Novel microemulsion fuel additive Ce–Ru–O catalysts with algae biofuel on diesel engine testing. Energy Sources Part A: Recovery Util. Environ. Eff. 2018, 40, 630–637. [Google Scholar] [CrossRef]
  20. Vidhyaprakash, D.; Karthikeyan, S.; Periyasamy, M.; Kalaimurugan, K.; Navaneethasanthakumar, S. Positioning of two-Wheeled mobile robot to control wheelslip by using the wheel rotate planning technique. J. Sci. Ind. Res. 2019, 78, 879–884. [Google Scholar]
  21. Huzayyin, A.; Bawady, A.; Rady, M.; Dawood, A. Experimental evaluation of diesel engine performance and emission using blends of jojoba oil and diesel fuel. Energy Convers. Manag. 2004, 45, 2093–2112. [Google Scholar] [CrossRef]
  22. Soudagar, M.E.M.; Khan, H.M.; Khan, T.; Razzaq, L.; Asif, T.; Mujtaba, M.; Hussain, A.; Farooq, M.; Ahmed, W.; Shahapurkar, K. Experimental analysis of engine performance and exhaust pollutant on a single-cylinder diesel engine operated using moringa oleifera biodiesel. Appl. Sci. 2021, 11, 7071. [Google Scholar] [CrossRef]
  23. Zhang, Y.; Zhong, Y.; Wang, J.; Tan, D.; Zhang, Z.; Yang, D. Effects of different biodiesel-diesel blend fuel on combustion and emission characteristics of a diesel engine. Processes 2021, 9, 1984. [Google Scholar] [CrossRef]
  24. Pérez, A.; Mateos, D.; García, C.; Caraveo, C.; Montero, G.; Coronado, M.; Valdez, B. Quantitative Evaluation of the emissions of a transport engine operating with diesel-biodiesel. Energies 2020, 13, 3594. [Google Scholar] [CrossRef]
  25. Gautam, P.S.; Vishnoi, P.K.; Maheshwari, P.; Samant, T.S.; Gupta, V. Experimental analysis and theoretical validation of CI engine performance and combustion parameters using zero-dimensional mathematical model fuelled with biodiesel and diesel blends. In Proceedings of the IOP Conference Series: Materials Science and Engineering, Greater Noida, India, 20 February 2021; p. 012018. [Google Scholar]
  26. Hariram, V.; Bharathwaaj, R. Application of zero-dimensional thermodynamic model for predicting combustion parameters of CI engine fuelled with biodiesel-diesel blends. Alex. Eng. J. 2016, 55, 3345–3354. [Google Scholar] [CrossRef]
  27. Awad, S.; Varuvel, E.G.; Loubar, K.; Tazerout, M. Single zone combustion modeling of biodiesel from wastes in diesel engine. Fuel 2013, 106, 558–568. [Google Scholar] [CrossRef]
  28. Gogoi, T.; Baruah, D. A cycle simulation model for predicting the performance of a diesel engine fuelled by diesel and biodiesel blends. Energy 2010, 35, 1317–1323. [Google Scholar] [CrossRef]
  29. Nabi, M.N.; Rasul, M.; Gudimetla, P. Modelling and simulation of performance and combustion characteristics of diesel engine. Energy Procedia 2019, 160, 662–669. [Google Scholar] [CrossRef]
  30. Mustayen, A.; Wang, X.; Rasul, M.; Hamilton, J.; Negnevitsky, M. Theoretical investigation of combustion and performance analysis of diesel engine under low load conditions. In Proceedings of the IOP Conference Series: Earth and Environmental Science, Sanya, China, 8–10 July 2021; p. 012013. [Google Scholar]
  31. Chmela, F.G.; Pirker, G.H.; Wimmer, A. Zero-dimensional ROHR simulation for DI diesel engines–a generic approach. Energy Convers. Manag. 2007, 48, 2942–2950. [Google Scholar] [CrossRef]
  32. Ngayihi Abbe, C.V.; Nzengwa, R.; Danwe, R.; Ayissi, Z.M.; Obonou, M. A study on the 0D phenomenological model for diesel engine simulation: Application to combustion of Neem methyl esther biodiesel. Energy Convers. Manag. 2015, 89, 568–576. [Google Scholar] [CrossRef]
  33. Rezaei, R.; Eckert, P.; Seebode, J.; Behnk, K. Zero-Dimensional Modeling of Combustion and Heat Release Rate in DI Diesel Engines. SAE Int. J. Engines 2012, 5, 874–885. [Google Scholar] [CrossRef]
  34. Wolfer, H. Ignition lag in diesel engines. VDI-Forsch 1938, 392, 621-436.047. [Google Scholar]
  35. Watson, N.; Pilley, A.; Marzouk, M. A Combustion Correlation for Diesel Engine Simulation; 0148-7191; A Technical Paper; SAE International: Warrendale, PA, USA, 1980. [Google Scholar]
  36. Saravanan, S.; Nagarajan, G.; Sampath, S. A correlation for the ignition delay of a CI engine fuelled with diesel and biodiesel. Int. J. Green Energy 2014, 11, 542–557. [Google Scholar] [CrossRef]
  37. Assanis, D.N.; Filipi, Z.S.; Fiveland, S.B.; Syrimis, M. A predictive ignition delay correlation under steady-state and transient operation of a direct injection diesel engine. J. Eng. Gas Turbines Power 2003, 125, 450–457. [Google Scholar] [CrossRef]
  38. Hardenberg, H.; Hase, F. An empirical formula for computing the pressure rise delay of a fuel from its cetane number and from the relevant parameters of direct-injection diesel engines. SAE Trans. 1979, 1823–1834. [Google Scholar]
  39. Mustayen, A.; Wang, X.; Rasul, M.; Hamilton, J.; Negnevitsky, M. Thermodynamic analysis of diesel engine ignition delay under low load conditions. Energy Rep. 2022, 8, 495–501. [Google Scholar] [CrossRef]
  40. Ganapathy, T.; Gakkhar, R.; Murugesan, K. Influence of injection timing on performance, combustion and emission characteristics of Jatropha biodiesel engine. Appl. Energy 2011, 88, 4376–4386. [Google Scholar] [CrossRef]
  41. Mani, M.; Nagarajan, G. Influence of injection timing on performance, emission and combustion characteristics of a DI diesel engine running on waste plastic oil. Energy 2009, 34, 1617–1623. [Google Scholar] [CrossRef]
  42. Karthikeyan, S.; Periyasamy, M.; Prathima, A. Emission analysis of CI engine fueled by pilot dual fuel blends. Mater. Today Proc. 2020, 33, 3248–3253. [Google Scholar] [CrossRef]
  43. Karthikeyan, S.; Prathima, A.; Periyasamy, M.; Mahendran, G. Emission analysis of the diesel engine using Stoechospermum marginatum, brown marine algae with Al2O3 nano fluid. Mater. Today Proc. 2020, 33, 4047–4053. [Google Scholar] [CrossRef]
  44. Karthikeyan, S.; Periyasamy, M.; Prathima, A. Biodiesel from microalgae: Environmental aspects. Mater. Today Proc. 2020, 33, 3664–3667. [Google Scholar] [CrossRef]
  45. Prathima, A.; Karthikeyan, S.; Devi, K.R.; Usha, K.; Shanthi, M. Environmental effect of lubricity additives through dielectric molecular parameters. Mater. Today Proc. 2020, 33, 3658–3663. [Google Scholar] [CrossRef]
  46. Prathima, A.; Karthikeyan, S.; Mahalakshmi, S.; Thenappan, T. Environmental effect of ZOCO (Zro2/Ceo2) nano composite in methyl ester from canola oil through the performance and emission studies on IC engine. Mater. Today Proc. 2020, 33, 3203–3207. [Google Scholar] [CrossRef]
  47. Karthikeyan, S.; Periyasamy, M.; Prathima, A.; Yuvaraj, M. Agricultural tractor engine performance analysis using Stoechospermum marginatum microalgae biodiesel. Mater. Today Proc. 2020, 33, 3438–3442. [Google Scholar] [CrossRef]
  48. Karthikeyan, S.; Periyasamy, M.; Prathima, A.; Ajai, M. Effect of biosolar fuels and S. Marginatum algae biofuel on equivalence ratio in diesel engine with EGR. Mater. Today Proc. 2020, 33, 3443–3448. [Google Scholar] [CrossRef]
  49. Abbaszadehmosayebi, G.; Ganippa, L. Characterising Wiebe equation for heat release analysis based on combustion burn factor (Ci). Fuel 2014, 119, 301–307. [Google Scholar] [CrossRef]
  50. Heywood, J.B. Internal Combustion Engine Fundamentals; McGraw-Hill Education: New York, NY, USA, 2018. [Google Scholar]
  51. Hadjiconstantinou, N.G.; Simek, O. Constant-wall-temperature Nusselt number in micro and nano-channels. J. Heat Transf. 2002, 124, 356–364. [Google Scholar] [CrossRef] [Green Version]
  52. Thermodynamics and Fluid Mechanics Group; Annand, W. Heat transfer in the cylinders of reciprocating internal combustion engines. Proc. Inst. Mech. Eng. 1963, 177, 973–996. [Google Scholar] [CrossRef]
  53. Woschni, G. A Universally Applicable Equation for the Instantaneous Heat Transfer Coefficient in the Internal Combustion Engine; 0148-7191; SAE Technical paper; SAE International: Warrendale, PA, USA, 1967. [Google Scholar]
  54. Pirotais, F.; Bellettre, J.; Le Corre, O.; Tazerout, M.; De Pelsemaeker, G.; Guyonvarch, G. A Diesel Engine Thermal Transient Simulation: Coupling Between a Combustion Model and a Thermal Model; 0148-7191; SAE Technical Paper; SAE International: Warrendale, PA, USA, 2003. [Google Scholar]
  55. Yasar, H.; Soyhan, H.S.; Walmsley, H.; Head, B.; Sorusbay, C. Double-Wiebe function: An approach for single-zone HCCI engine modeling. Appl. Therm. Eng. 2008, 28, 1284–1290. [Google Scholar] [CrossRef]
  56. Kim, J.; Bae, C.; Kim, G. Simulation on the effect of the combustion parameters on the piston dynamics and engine performance using the Wiebe function in a free piston engine. Appl. Energy 2013, 107, 446–455. [Google Scholar] [CrossRef]
  57. Alkhulaifi, K.; Hamdalla, M. Ignition delay correlation for a direct injection diesel engine fuelled with automotive diesel and water diesel emulsion. Int. J. Chem. Mol. Eng. 2011, 5, 884–896. [Google Scholar]
  58. Fattah, I.R.; Kalam, M.; Masjuki, H.; Wakil, M. Biodiesel production, characterization, engine performance, and emission characteristics of Malaysian Alexandrian laurel oil. RSC Adv. 2014, 4, 17787–17796. [Google Scholar] [CrossRef]
  59. Al-Widyan, M.I.; Tashtoush, G.; Khdair, A.I. Briquettes of olive cake as a potential source of thermal energy. J. Solid Waste Technol. Manag. 2002, 28, 51–59. [Google Scholar]
  60. Nabi, M.N.; Rasul, M.G.; Anwar, M.; Mullins, B.J. Energy, exergy, performance, emission and combustion characteristics of diesel engine using new series of non-edible biodiesels. Renew. Energy 2019, 140, 647–657. [Google Scholar] [CrossRef]
  61. Aydin, H.; Bayindir, H. Performance and emission analysis of cottonseed oil methyl ester in a diesel engine. Renew. Energy 2010, 35, 588–592. [Google Scholar] [CrossRef]
  62. Ağbulut, Ü.; Sarıdemir, S.; Karagöz, M. Experimental investigation of fusel oil (isoamyl alcohol) and diesel blends in a CI engine. Fuel 2020, 267, 117042. [Google Scholar] [CrossRef]
  63. Rahman, M.; Rasul, M.G.; Hassan, N.M.S.; Azad, A.K.; Uddin, M. Effect of small proportion of butanol additive on the performance, emission, and combustion of Australian native first-and second-generation biodiesel in a diesel engine. Environ. Sci. Pollut. Res. 2017, 24, 22402–22413. [Google Scholar] [CrossRef] [PubMed]
  64. Bhuiya, M.; Rasul, M.; Khan, M.; Ashwath, N. Performance and Emission Characteristics of Binary Mixture of Poppy and Waste Cooking Biodiesel. Energy Procedia 2017, 110, 523–528. [Google Scholar] [CrossRef]
  65. Anwar, M.; Rasul, M.G.; Ashwath, N. A Systematic Multivariate Analysis of Carica papaya Biodiesel Blends and Their Interactive Effect on Performance. Energies 2018, 11, 2931. [Google Scholar] [CrossRef] [Green Version]
  66. Carraretto, C.; Macor, A.; Mirandola, A.; Stoppato, A.; Tonon, S. Biodiesel as alternative fuel: Experimental analysis and energetic evaluations. Energy 2004, 29, 2195–2211. [Google Scholar] [CrossRef]
  67. Liaquat, A.M.; Masjuki, H.H.; Kalam, M.A.; Varman, M.; Hazrat, M.A.; Shahabuddin, M.; Mofijur, M. Application of blend fuels in a diesel engine. Energy Procedia 2012, 14, 1124–1133. [Google Scholar] [CrossRef]
  68. Sajjad, H.; Masjuki, H.H.; Varman, M.; Kalam, M.A.; Arbab, M.I.; Imtenan, S.; Ashraful, A.M. Influence of gas-to-liquid (GTL) fuel in the blends of calophyllum inophyllum biodiesel and diesel: An analysis of combustion–performance–emission characteristics. Energy Convers. Manag. 2015, 97, 42–52. [Google Scholar] [CrossRef]
  69. Channapattana, S.; Kantharaj, C.; Shinde, V.; Pawar, A.A.; Kamble, P.G. Emissions and performance evaluation of DI CI-VCR engine fuelled with honne oil methyl ester/diesel blends. Energy Procedia 2015, 74, 281–288. [Google Scholar] [CrossRef]
  70. Ong, H.C.; Masjuki, H.; Mahlia, T.; Silitonga, A.; Chong, W.; Leong, K. Optimization of biodiesel production and engine performance from high free fatty acid Calophyllum inophyllum oil in CI diesel engine. Energy Convers. Manag. 2014, 81, 30–40. [Google Scholar] [CrossRef]
  71. Imdadul, H.; Masjuki, H.; Kalam, M.; Zulkifli, N.; Alabdulkarem, A.; Rashed, M.; Teoh, Y.; How, H. Higher alcohol–biodiesel–diesel blends: An approach for improving the performance, emission, and combustion of a light-duty diesel engine. Energy Convers. Manag. 2016, 111, 174–185. [Google Scholar] [CrossRef]
  72. Mofijur, M.; Masjuki, H.H.; Kalam, M.A.; Atabani, A.E. Evaluation of biodiesel blending, engine performance and emissions characteristics of Jatropha curcas methyl ester: Malaysian perspective. Energy 2013, 55, 879–887. [Google Scholar] [CrossRef]
  73. Anwar, M.; Rasul, M.; Ashwath, N. Combustion characteristics of an agricultural diesel engine fuelled with papaya and stone fruit biodiesel: A comparison. In Proceedings of the 2019 IEEE 2nd International Conference on Renewable Energy and Power Engineering (REPE), Toronto, Canada, 2–4 November 2019; pp. 26–31. [Google Scholar]
  74. Silitonga, A.; Masjuki, H.; Mahlia, T.; Ong, H.C.; Chong, W. Experimental study on performance and exhaust emissions of a diesel engine fuelled with Ceiba pentandra biodiesel blends. Energy Convers. Manag. 2013, 76, 828–836. [Google Scholar] [CrossRef]
  75. Ong, H.C.; Masjuki, H.; Mahlia, T.I.; Silitonga, A.; Chong, W.; Yusaf, T. Engine performance and emissions using Jatropha curcas, Ceiba pentandra and Calophyllum inophyllum biodiesel in a CI diesel engine. Energy 2014, 69, 427–445. [Google Scholar] [CrossRef]
  76. Tesfa, B.; Mishra, R.; Zhang, C.; Gu, F.; Ball, A. Combustion and performance characteristics of CI (compression ignition) engine running with biodiesel. Energy 2013, 51, 101–115. [Google Scholar] [CrossRef] [Green Version]
  77. Qi, D.H.; Chen, H.; Geng, L.M.; Bian, Y.Z. Experimental studies on the combustion characteristics and performance of a direct injection engine fueled with biodiesel/diesel blends. Energy Convers. Manag. 2010, 51, 2985–2992. [Google Scholar] [CrossRef]
  78. Anwar, M.; Rasul, M.G.; Ashwath, N. The synergistic effects of oxygenated additives on papaya biodiesel binary and ternary blends. Fuel 2019, 256, 115980. [Google Scholar] [CrossRef]
  79. Lyn, W.; Valdmanis, E. The Effects of Physical Factors on Ignition Delay; 0148-7191; SAE Technical Paper; SAE International: Warrendale, PA, USA, 1968. [Google Scholar]
  80. Sahoo, P.; Naik, S.; Das, L. Studies on biodiesel production technology from jatropha curcas and its performance in a CI engine. J. Agric. Eng. 2005, 42, 14–20. [Google Scholar]
  81. Shaafi, T.; Velraj, R. Influence of alumina nanoparticles, ethanol and isopropanol blend as additive with diesel–soybean biodiesel blend fuel: Combustion, engine performance and emissions. Renew. Energy 2015, 80, 655–663. [Google Scholar] [CrossRef]
  82. Mofijur, M.; Rasul, M.G.; Hyde, J. Recent developments on internal combustion engine performance and emissions fuelled with biodiesel-diesel-ethanol blends. Procedia Eng. 2015, 105, 658–664. [Google Scholar] [CrossRef]
  83. Buyukkaya, E. Effects of biodiesel on a DI diesel engine performance, emission and combustion characteristics. Fuel 2010, 89, 3099–3105. [Google Scholar] [CrossRef]
  84. Xing-Cai, L.; Jian-Guang, Y.; Wu-Gao, Z.; Zhen, H. Effect of cetane number improver on heat release rate and emissions of high speed diesel engine fueled with ethanol–diesel blend fuel. Fuel 2004, 83, 2013–2020. [Google Scholar] [CrossRef]
  85. Gumus, M.; Kasifoglu, S. Performance and emission evaluation of a compression ignition engine using a biodiesel (apricot seed kernel oil methyl ester) and its blends with diesel fuel. Biomass Bioenergy 2010, 34, 134–139. [Google Scholar] [CrossRef]
  86. Koçak, M.S.; Ileri, E.; Utlu, Z. Experimental study of emission parameters of biodiesel fuels obtained from canola, hazelnut, and waste cooking oils. Energy Fuels 2007, 21, 3622–3626. [Google Scholar] [CrossRef]
  87. Tse, H.; Leung, C.W.; Cheung, C.S. Investigation on the combustion characteristics and particulate emissions from a diesel engine fueled with diesel-biodiesel-ethanol blends. Energy 2015, 83, 343–350. [Google Scholar] [CrossRef]
  88. Godiganur, S.; Suryanarayana Murthy, C.; Reddy, R.P. Performance and emission characteristics of a Kirloskar HA394 diesel engine operated on fish oil methyl esters. Renew. Energy 2010, 35, 355–359. [Google Scholar] [CrossRef]
  89. Sharma, N.; Agarwal, A.K. Effect of fuel injection pressure and engine speed on performance, emissions, combustion, and particulate investigations of gasohols fuelled gasoline direct injection engine. J. Energy Resour. Technol. 2020, 142, 042201. [Google Scholar] [CrossRef]
  90. Murugesan, P.; Hoang, A.T.; Venkatesan, E.P.; Kumar, D.S.; Balasubramanian, D.; Le, A.T. Role of hydrogen in improving performance and emission characteristics of homogeneous charge compression ignition engine fueled with graphite oxide nanoparticle-added microalgae biodiesel/diesel blends. Int. J. Hydrog. Energy 2021, in press. [Google Scholar] [CrossRef]
  91. Rajak, U.; Ağbulut, Ü.; Veza, I.; Dasore, A.; Sarıdemir, S.; Verma, T.N. Numerical and experimental investigation of CI engine behaviours supported by zinc oxide nanomaterial along with diesel fuel. Energy 2022, 239, 122424. [Google Scholar] [CrossRef]
  92. Bakar, R.A.; Widudo; Kadirgama, K.; Ramasamy, D.; Yusaf, T.; Kamarulzaman, M.K.; Sivaraos; Aslfattahi, N.; Samylingam, L.; Alwayzy, S.H. Experimental analysis on the performance, combustion/emission characteristics of a DI diesel engine using hydrogen in dual fuel mode. Int. J. Hydrog. Energy 2022. [Google Scholar] [CrossRef]
  93. Zhang, Z.; Lv, J.; Xie, G.; Wang, S.; Ye, Y.; Huang, G.; Tan, D. Effect of assisted hydrogen on combustion and emission characteristics of a diesel engine fueled with biodiesel. Energy 2022, 254, 124269. [Google Scholar] [CrossRef]
  94. Anish, M.; Bency, P.; Jayaprabakar, J.; Joy, N.; Jayaprakash, V.; Sahaya Susmi, S.K.; Aravind Kumar, J.; Ansar, S.; Rezania, S. An evaluation of biosynthesized nanoparticles in biodiesel as an enhancement of a VCR diesel engine. Fuel 2022, 328, 125299. [Google Scholar] [CrossRef]
  95. Zhang, X.; Yang, R.; Anburajan, P.; Le, Q.V.; Alsehli, M.; Xia, C.; Brindhadevi, K. Assessment of hydrogen and nanoparticles blended biodiesel on the diesel engine performance and emission characteristics. Fuel 2022, 307, 121780. [Google Scholar] [CrossRef]
  96. Devaraj, A.; Nagappan, M.; Yogaraj, D.; Prakash, O.; Rao, Y.A.; Sharma, A. Influence of nano-additives on engine behaviour using diesel-biodiesel blend. Mater. Today Proc. 2022, 62, 2266–2270. [Google Scholar] [CrossRef]
  97. Abdallah, A.M.; Abdel-Rahman, A.A.; Elwardany, A.E. Analysis of the impact of different nanoparticle metal oxides as fuel additives in compression ignition engine performance. Energy Rep. 2020, 6, 99–105. [Google Scholar] [CrossRef]
  98. Dinesha, P.; Kumar, S.; Rosen, M.A. Effects of particle size of cerium oxide nanoparticles on the combustion behavior and exhaust emissions of a diesel engine powered by biodiesel/diesel blend. Biofuel Res. J. 2021, 8, 1374. [Google Scholar] [CrossRef]
  99. Kegl, T.; Kovač Kralj, A.; Kegl, B.; Kegl, M. Nanomaterials as fuel additives in diesel engines: A review of current state, opportunities, and challenges. Prog. Energy Combust. Sci. 2021, 83, 100897. [Google Scholar] [CrossRef]
  100. Kumar, S.; Dinesha, P.; Ajay, C.M.; Kabbur, P. Combined effect of oxygenated liquid and metal oxide nanoparticle fuel additives on the combustion characteristics of a biodiesel engine operated with higher blend percentages. Energy 2020, 197, 117194. [Google Scholar] [CrossRef]
  101. Atarod, P.; Khlaife, E.; Aghbashlo, M.; Tabatabaei, M.; Hoang, A.T.; Mobli, H.; Nadian, M.H.; Hosseinzadeh-Bandbafha, H.; Mohammadi, P.; Roodbar Shojaei, T.; et al. Soft computing-based modeling and emission control/reduction of a diesel engine fueled with carbon nanoparticle-dosed water/diesel emulsion fuel. J. Hazard. Mater. 2021, 407, 124369. [Google Scholar] [CrossRef] [PubMed]
Figure 1. Methodology of simulation process used in the current study.
Energies 15 06282 g001
Figure 2. Engine test-bed setup with schematic layout. (A) Experiment setup. (B) Schematic layout.
Energies 15 06282 g002
Figure 3. Comparison between simulation and experimental results of BP for diesel and JB blends at (a) 25%, (b) 50%, (c) 75% and (d) 100% loading conditions.
Energies 15 06282 g003
Figure 4. Comparison between simulation and experimental results of Torque for diesel and JB blends at (a) 25%, (b) 50%, (c) 75% and (d) 100% loading conditions.
Energies 15 06282 g004aEnergies 15 06282 g004b
Figure 5. Comparison between simulation and experimental results of BTE for diesel and JB blends at (a) 25%, (b) 50%, (c) 75% and (d) 100% loading conditions.
Energies 15 06282 g005
Figure 6. Comparison between simulation and experimental results of BSFC for diesel and JB blends at (a) 25%, (b) 50%, (c) 75% and (d) 100% loading conditions.
Energies 15 06282 g006aEnergies 15 06282 g006b
Figure 7. Comparison between simulation and experimental results of ID for diesel and JB blends at (a) 25%, (b) 50%, (c) 75% and (d) 100% loading conditions.
Energies 15 06282 g007
Figure 8. Variation in NOx with engine speeds for D100, JB5, JB10, and JB20 at (a) 25%, (b) 50%, (c) 75%, and (d) 100% loading operation.
Energies 15 06282 g008
Figure 9. Variation in CO with engine speeds for D100, JB5, JB10, and JB20 at (a) 25%, (b) 50%, (c) 75%, and (d) 100% loading operation.
Energies 15 06282 g009
Figure 10. Variation in HC with engine speeds for D100, JB5, JB10, and JB20 at (a) 25%, (b) 50%, (c) 75%, and (d) 100% loading operation.
Energies 15 06282 g010
Table 1. Comparison of findings performance and emissions using JB blends with diesel.
FeedstocksJojoba BlendsFindingsRef. Articles
Jojoba (JB) blends with standard dieselJB5, JB20
  • Less HC and CO emissions than standard diesel
[17,18,19]
JB5, JB10, JB20
  • BSFC increased slightly and NOx decreased at JB-diesel blends.
[21]
JB5, JB10, JB15, JB20
  • BTE increased with an increase in jojoba blends with diesel
  • BSFC is higher for high percentage of jojoba blending at high loads and speeds.
[42,43]
JB5, JB10, JB15, JB20
  • CO decreased for higher JB blends due to rapid production of HC.
[44,45,46]
JB5, JB10, JB15, JB20
  • HC decreased with an increase in JB blending due to abundant oxygen molecules at JB20.
[47,48]
Table 2. Engine operating conditions for model simulation.
Operation ParametersBoundary Conditions
Fuel injection timing16 deg. BTDC
Injection pressure (MPa)13.73
IVO17 deg. BTDC
IVC63 deg. ABDC
EVO51 deg. BTDC
EVC28 deg. ATDC
Inlet manifold temperature80 °C
Table 3. Test engine specifications.
ItemsSpecifications
Engine modelKubota V3300
Total displacement (L)3.318
Stroke (S)98 mm
Bore (B)110 mm
Connecting rod length170 mm
Combustion systemE-TVCS
Rated power output (kW/rpm)50.7/2600
Rated torque (Nm/rpm)230/1400
Compression ratio (CR)22.6:1
Table 4. Accuracy and uncertainty of the instruments used in the present study.
ParametersMeasurement AccuracyUncertainty (%)
Fuel flow±0.031 (L/h)±0.38
Temperature±1.1 °C±0.20
Engine speed±2.0 rpm±0.15
BP±0.031 kW±0.14
Torque±5.01 N/m±0.06
BSFC±4.05 g/kWh±2.02
BTE±4.02%±1.91
Table 5. Physico-chemical properties of diesel and jojoba (Simmondsia chinensis) biodiesel blends.
PropertiesMethod/StandardDieselJB5JB10JB20
Density (kg/m3)ASTM D4052832833.4834.5836.2
Kinematic viscosity (mm2/s)ASTM D4453.323.954.024.10
Acid value (mg KOH/g)ASTM D6640.050.170.180.20
Calorific value (MJ/kg)EN 1421345.6642.241.440.5
Oxidation stability (h)EN 1411239272420
Cetane numberASTM D68904853.362.671.4
Table 6. Comparison of simulation and experimental errors.
ParametersMin. ErrorLoad (%)Speed (rpm)Fuel TypeMax. ErrorLoad (%)Speed (rpm)Fuel Type
BP3.7%1002000D10015.3%252400JB10
Torque4.7%1001600JB519.2%251200JB10
BTE3.4%1002000D10018.3%251200JB10
BSFC4.2%1001400D10015.7%251200JB20
Table 7. Finding of emissions for JB blends and diesel fuels.
Emissions ParametersFindingsRef. Articles
Maximum Reduction in (%)Fuel Type
NOx10.25JB5 compared to JB10 and JB20[85,88]
CO7.75JB20 compared to JB5 and JB10[82,89]
HC6.65JB20 compared to JB5 and JB10[87]
Publisher’s Note: MDPI stays neutral with regard to jurisdictional claims in published maps and institutional affiliations.

