
CFD Simulation of Co-Planar Multi-Rotor Wind Turbine Aerodynamic Performance Based on ALM Method


1
College of Mechanics and Materials, Hohai University, No.8 West Focheng Road, Nanjing 210098, China
2
Cooperate Innovation Center for Coastal Development and Protection, No.1, Xikang Road, Nanjing 210098, China
3
Wind Turbine Structural Engineering Research Center of Jiangsu Province, Nanjing 211100, China
*
Author to whom correspondence should be addressed.
Energies 2022, 15(17), 6422; https://doi.org/10.3390/en15176422
Submission received: 12 July 2022
/
Revised: 30 August 2022
/
Accepted: 31 August 2022
/
Published: 2 September 2022
(This article belongs to the Special Issue Advanced Wind Energy Conversion Systems)
Abstract
:Considering requirements such as enhanced unit capacity, the geometric size of wind turbine blades has been increasing; this, in turn, results in a rapid increase in manufacturing costs. To this end, in this paper, we examine the aerodynamics of co-planar multi-rotor wind turbines to achieve higher unit capacity at a lower blade length. The multiple wind rotors are in the same plane with no overlaps. The ALM-LES method is used to investigate the interaction effect of the blade tip vortices, by revealing the regulation of aerodynamic performance and flow field characteristics of the multi-rotor wind turbines. The simulated results suggest an observable reduction in the blade tip vortices generated by blades located closely together, due to the breaking and absorption of the blade tip vortices by the two rotors. This results in increased aerodynamic performance and loads on the multi-rotor wind turbine. The influence between the blade tip vortex is mainly located in the range of 0.2 R from the blade tip, with this range leading to a significant increase in the lift coefficient. Thus, when the wind rotor spacing is 0.2 R, the interaction between the blade tip vortices is low.
1. Introduction
To date, research on wind turbine aerodynamic performance has generally focused on grid-connected horizontal axis wind turbines. Both increasing the capacity of a wind turbine and lengthening its blades are conducive to improving the wind energy harvesting ability of a single-rotor wind turbine (SRWT) [1]. However, these approaches may cause novel issues in manufacturing and maintenance, such as increased manufacturing costs and higher requirements for the material properties. Interactions between the aerodynamic performances of individual wind turbines are also a challenge for the development of multi-rotor wind turbines [2,3].
In light of the limitations of SRWTs, the multi-rotor wind turbine (MRWT) concept has begun to attract attention in the field of wind energy harvesting. Verma [4] has reviewed the development history of MRWTs. The earliest one appeared in Denmark in 1873, which consisted of a twin-rotor wind turbine with six blades per rotor [4]. Later, Percy H. Thomas presented a patent design for a 7500 kW two-rotor wind turbine, with each having two blades, through comprehensive consideration of the efficiency and cost [4]. Henk Lagerweij of Lagerwey Wind has constructed some MRWT prototypes to expand understanding of key issues in multi-wind turbine engineering, such as the MRWT yaw problem [5]. More recently, in 2016, Vestas has set up a four-rotor MRWT prototype in collaboration with the Technical University of Denmark, claiming the advantages of MRWT compared with SRWT [6].
In contrast to large-scale SRWTs, MRWTs consist of small- and medium-sized blades, thus presenting advantages such as long blade life, low weight, and fast speed. Moreover, various investigations have shown that MRWTs, with smaller blades, are capable of capturing more wind energy, compared with SRWTs. Laan et al. [7] have conducted a numerical study on the power production of a MRWT wind farm, indicating that the MRWT wind farm could generate 0.3–1.7% more electricity annually, when compared with an equivalent single-rotor wind farm. Störtenbecker et al. [8] have achieved optimal design of multi-rotor wind turbines and rapid calculation of different support structure designs by varying the number of rotors, space frame topology, space frame depth, and yaw bearing position. Zhao et al. [9] have conducted a study on the blade loads of multi-wind turbine wind power systems under wind shear conditions. Their analytical results demonstrated that the amplitude and frequency of load variation during blade rotation increases with both the blade size and wind shear coefficient; in this context, replacing a single large wind turbine with multiple small wind turbines can effectively reduce the effect of wind shear. Lu et al. [10,11] have investigated the power generation performance of a multi-rotor wind turbine-based wind power system. First, they examined the vibration characteristics of three wind turbine horizontal axis wind turbine towers. Then, they selected ten 2 kW horizontal axis wind turbines to form multi-rotor wind turbines, and compared the actual power generation performance with a 20 kW single wind turbine horizontal axis wind turbine system. Both their numerical and experimental results indicated that the power generation capacity of the multi-rotor wind turbine-based wind power system, using the rudder yaw method, was higher than that of the single wind turbine with active yaw.
Considering the complexity of multi-rotor turbine systems, the issue of their manufacturing and maintenance has been widely concerned. Jamieson and Branney have analyzed the support structure of a 20 MW multi-rotor wind turbine concept design and its possible weight. Their conceptual design, consisting of 45 small 440 kW wind turbines, was compared with four 5 MW and a single 20 MW design, showing that the 20 MW multi-rotor wind turbine offers significant cost advantages, in terms of reducing turbine and drive train costs [12]. Kale has roughly compared the advantages and disadvantages of various multi-rotor wind turbine technology routes, in terms of feasibility, reliability, and safety [13]. Verma has analyzed a 5 MW multi-rotor wind turbine consisting of three 1.66 MW turbines, and showed that the total system cost could be reduced by 13%, compared to a single-turbine 5 MW wind turbine [4]. Mate has studied a multi-rotor wind turbine support structure, and compared its cost with that of a 5 MW single-wind turbine in order to develop a design methodology for multi-rotor wind turbine support structures [14]. Jamieson [12,15] conducted many studies focused on the concept of large multi-rotor wind turbines. In particular, Jamieson has proposed the area–volume relationship, which indicates that multiple small wind turbines have better mass efficiency than a single large wind turbine under the same capacity conditions; moreover, the mass advantage of multiple wind turbines is reflected in both wind turbine and transmission components, which provides strong theoretical support for the technical route of multi-rotor wind turbines.
One of the most important factors in wind turbine design is aerodynamics. In particular, multiple wind turbine systems require more careful analysis of their aerodynamic characteristics, due to the influence of multiple turbines forming arrays on each other. Smulders et al. have performed wind tunnel tests with two adjacent turbines (no superposition), and found that the average power output of two turbines together was slightly higher than the sum of the power outputs of two individual turbines [16]. Analogously, Southwest Research Institute (SwRI) for Ocean Wind Energy Systems (OWES) wind tunnel tests of a 400 W seven-wind turbine found that a 2% blade size wind turbine clearance resulted in little or no blade interaction [17]. Yoshida and Goltenbott et al. [12,18] have analyzed the load and fatigue of a 14 MW multi-rotor wind turbine consisting of seven 2 MW wind turbines in different wind models, and concluded that special attention needs to be paid to the consistent decay constants of the wind model when designing large size multi-rotor wind turbines.
Despite the potential advantages of multi-rotor turbines, little is known about the complex interactions of the associated multi-rotor wakes, which occur immediately behind these turbines. Understanding of multi-rotor turbine wakes is of both practical and fundamental importance. Many researchers have studied the wake characteristics of multi-rotor wind turbines. Ghaisas et al. [19] have found that the wake of a multi-rotor turbine recovered faster and the turbulence intensity in the wake was less than that of a conventional turbine; furthermore, this difference was increased as the spacing between the tips of the rotors in the multi-rotor configuration increased. These differences are also sensitive to the thrust coefficients adopted for all rotors, with more pronounced differences under larger thrust coefficients. Speakman et al. [20] have studied the effect of wake steering on wind farm wake. A key finding of this analysis was that the divergent and crossed rotor configurations were able to produce a significantly larger wake expansion than the baseline, and generated much lower velocity deficits. Bastankhah et al. [21] have explored the effect of different geometric configurations on the multi-rotor turbine wake characteristics. The recovery rate of the multi-rotor turbine wake increased with an increase in rotor pitch, while the effects of rotor number and rotation direction on wake recovery were not significant. However, these studies used relatively coarse grids (i.e., up to 40 grid points over rotor diameter), which is not sufficient to accurately resolve the near wake flow structures.
In addition, some researchers have used the aeroelastic method to study the dynamic response of multi-rotor wind turbines. Ismaiel et al. [22] found that an additional rotor will increase the tower-top deflection, and the tower-base bending moment in the fore-aft direction will be more than doubled. As an extension to previous research conducted by the authors, ref. [23] found that the weight of the rotor is dominant over the fluctuating aerodynamic loads in the in-plane direction, while the deflection is highly affected by the turbulence in the out-of-plane direction. Filsoof et al. [24] analyzed the linear aeroelastic response of the DTU 30 MW tri-rotor wind turbine using a high-fidelity linear time-invariant aeroelastic model. The results show that the tri-rotor wind turbine does not have any aeroelastic instabilities. Ferede et al. [25] studied the nominal load at normal wind speed profile, load at fatigue normal turbulence and ultimate load at extreme turbulence for a 6 MW quad-rotor wind turbine. These researches used the classical blade element momentum (BEM) theory to calculate the aerodynamic forces of wind turbines, ignoring the tip vortex interactions between adjacent wind rotors. However, the blade tip vortex interaction is a key factor in the improvement of multi-rotor wind turbines aerodynamic performance [26].
The aerodynamic analysis of multi-rotor wind turbines is mainly performed using blade element momentum (BEM) theory combined with a wake model, the free vortex wake method (FVM), and computational fluid dynamics (CFD) approaches. BEM combined with the wake model and FVM has the advantage of being convenient and efficient, but lacks the ability to provide detailed information about the velocity field around the rotor [27,28]. To the contrary, CFD methods can provide detailed flow field information by solving the Navier–Stokes equations over the entire computational domain, including the interaction blade tip vortices of multi-rotor wind turbines. In CFD methods, large-eddy simulation (LES) is a numerical technique that resolves the large-scale flow motions with small-scale eddies through the use of sub-grid scale models [29]. Stevens et al. [30] applied LES to study the effect of wind turbine placement on power generation in a large wind farm. Ghasias et al. [31] used LES to demonstrate a faster wake recovery and lower wake turbulent kinetic energy for a MRWT as compared to an equivalent SRWT. It was hypothesized that a larger entrainment led to these effects, as the rotor perimeter to swept area ratio for a MRWT is twice that of a SRWT.
It is worth noting that LES imposes a large computational cost when solving wind turbine aerodynamic performance and wake flow problems [32]. To this end, a generic actuator approach for rotor modeling has been proposed, in order to reduce the computational cost, such as the actuator line method (ALM). In ALM, each blade is replaced by a line of force that rotates through the flow field. The reduced cost of the ALM makes LES a more applicable approach for turbulence modeling in the wind turbine wake simulation. The ALM is mostly based on the RANS solver, a method proposed by Sørensen and Shen [33]. Keck [34] and Ameur [35] have surveyed the wind turbine wake characteristics by combining a Reynolds-averaged turbulence RANS model with the actuation line model. In order to improve the solution regarding the turbulent properties of the flow field, Ivanell [36] has introduced a large eddy simulation method to deal with turbulence, which was combined with the actuation line method to analyze the development and stability problems of the wake structure for a single wind turbine. Some extended work regarding the utilization of the combined ALM-LES method to simulate the atmosphere boundary layer effect has been conducted by Lu and Porté-Agel [37], with turbulence modeled through a Lagrangian scale-dependent subgrid-scale (SGS) model. Hebbar et al. [38] has studied the effect of incoming turbulence on shear layer breakdown and the wake recovery effects of multi-rotor wind turbines using the ALM-LES method. Martínez-Tossas et al. [39] compared four large eddy simulation research codes and the effect of model coefficients on wake flow in actuator line based wind turbine modeling. The results show that for LES of wind turbines and wind farms using ALM, detailed implementation and extensive cross-validation between codes can produce highly reproducible predictions. Moreover, the characteristics of the inflow turbulence appear to be more important than the details of the subgrid-scale modeling employed in the wake.
To date, there have been a number of studies on the structure, aerodynamic performance, and wakes of multi-rotor wind turbines, but a lack of detailed studies on the tip vortex interactions between adjacent wind rotors should be noted. Many aerodynamic methods were trialed for the simulation of tip vortex interactions with high accuracy. We first considered Smoothed Particle Hydrodynamics (SPH) and the Lattice Boltzmann Method (LBM) particle method for aerodynamic performance simulation of multi-rotor turbines, but the convergence of the results was not good and the results were prone to oscillation. The BEM method is fast in calculation, but there is no relevant method to characterize the influence of tip vortices on each other. Therefore, none of the above-mentioned methods can be considered well-suited for the simulation. CFD simulation using full-size blade modeling requires detailed modeling of the blade surface and a large pre-processing effort. The mesh motion and multi-reference frame methods require the rotational domain to be set, which will overlap when several wind turbines are close to each other; at present, no solution has been found for this problem. In order to avoid these problems, the actuator line method with LES turbulence model was found to provide a suitable solution. The main structure of tip vortex and their interactions can be simulated well, as shown in this paper, with a reasonable setup.
In this study, the ALM-CFD method is used to study the interactions of the blade tip vortices of a co-planar multi-rotor wind turbine. The multi-rotor wind turbine is studied using structured meshing technology and the ALM-CFD method, and the relevant methods and settings are introduced in Section 2. The results and analysis are discussed in Section 3. Our conclusions are provided in Section 4. Overall, the regularity of the aerodynamic performance and flow field characteristics of co-planar multi-rotor wind turbines are revealed.
2. Method: ALM-CFD Simulation
2.1. Governing Equation and Turbulence Model
The CFD 3D simulation was carried out on the OpenFOAM software, which is a famous and widely adopted platform for computational fluid dynamics. In the simulation, both incompressible continuity and large eddy simulation were utilized. The development and characteristic features of the vortex system were captured using LES with a dynamic one-equation sub-grid scale model. The governing 3D spatial filtered incompressible Navier–Stokes equations can be formulated as [40]:
where denotes the forces on the wind turbine rotor calculated by the actuator line model; is the kinematic viscosity coefficient; the third term on the right-hand side of the momentum Equation (2), , is the so-called sub-grid scale stress, which represents the interactions between the unresolved scales of eddies; and denotes large-scale resolved part of .
As mentioned above, the presence of the wind turbine rotor was replaced by body forces, based on the actuator line model developed by Sørensen and Shen [33]. The ALM module is combined through the use of an unsteady incompressible solver. The time-varying turbine loads were modeled by a suitable distribution of body forces along the blade, determined under sectional inflow conditions and the interpolation of force coefficients from a lookup table of airfoil properties [41]. The body forces were distributed radially along the actuator lines. The local velocity of the blade element point was obtained using linear interpolation through the neighbor cells. Corrections for the tip loss were also applied. To smooth the distribution of the rotating forces and avoid numerical oscillations, Gaussian projection was employed to transform the line force into a volumetric force field, described as
where d is the distance between the cell-centered grid point and the point at the actuator line, and denotes the Gaussian width parameter to adjust the concentration of the load on the blade. Troldborg [42] has recommended setting , where is the grid cell length near the actuator line.
2.2. Computational Domain and Meshing
In 2000, the unsteady aerodynamics experiment Phase VI was conducted by the U.S. National Renewable Energy Laboratory (NREL) at the NASA Ames low-speed wind tunnel. This experiment was conducted to investigate the wind turbine aerodynamic characteristics under different operating conditions, such as yaw and pitch, by measuring the parameters of blade pressure, wind turbine power, and thrust, which have become a sample commonly used to verify wind turbine aerodynamic numerical calculation methods. The geometric inputs and the solver parameters of Phase VI are listed in Table 1.
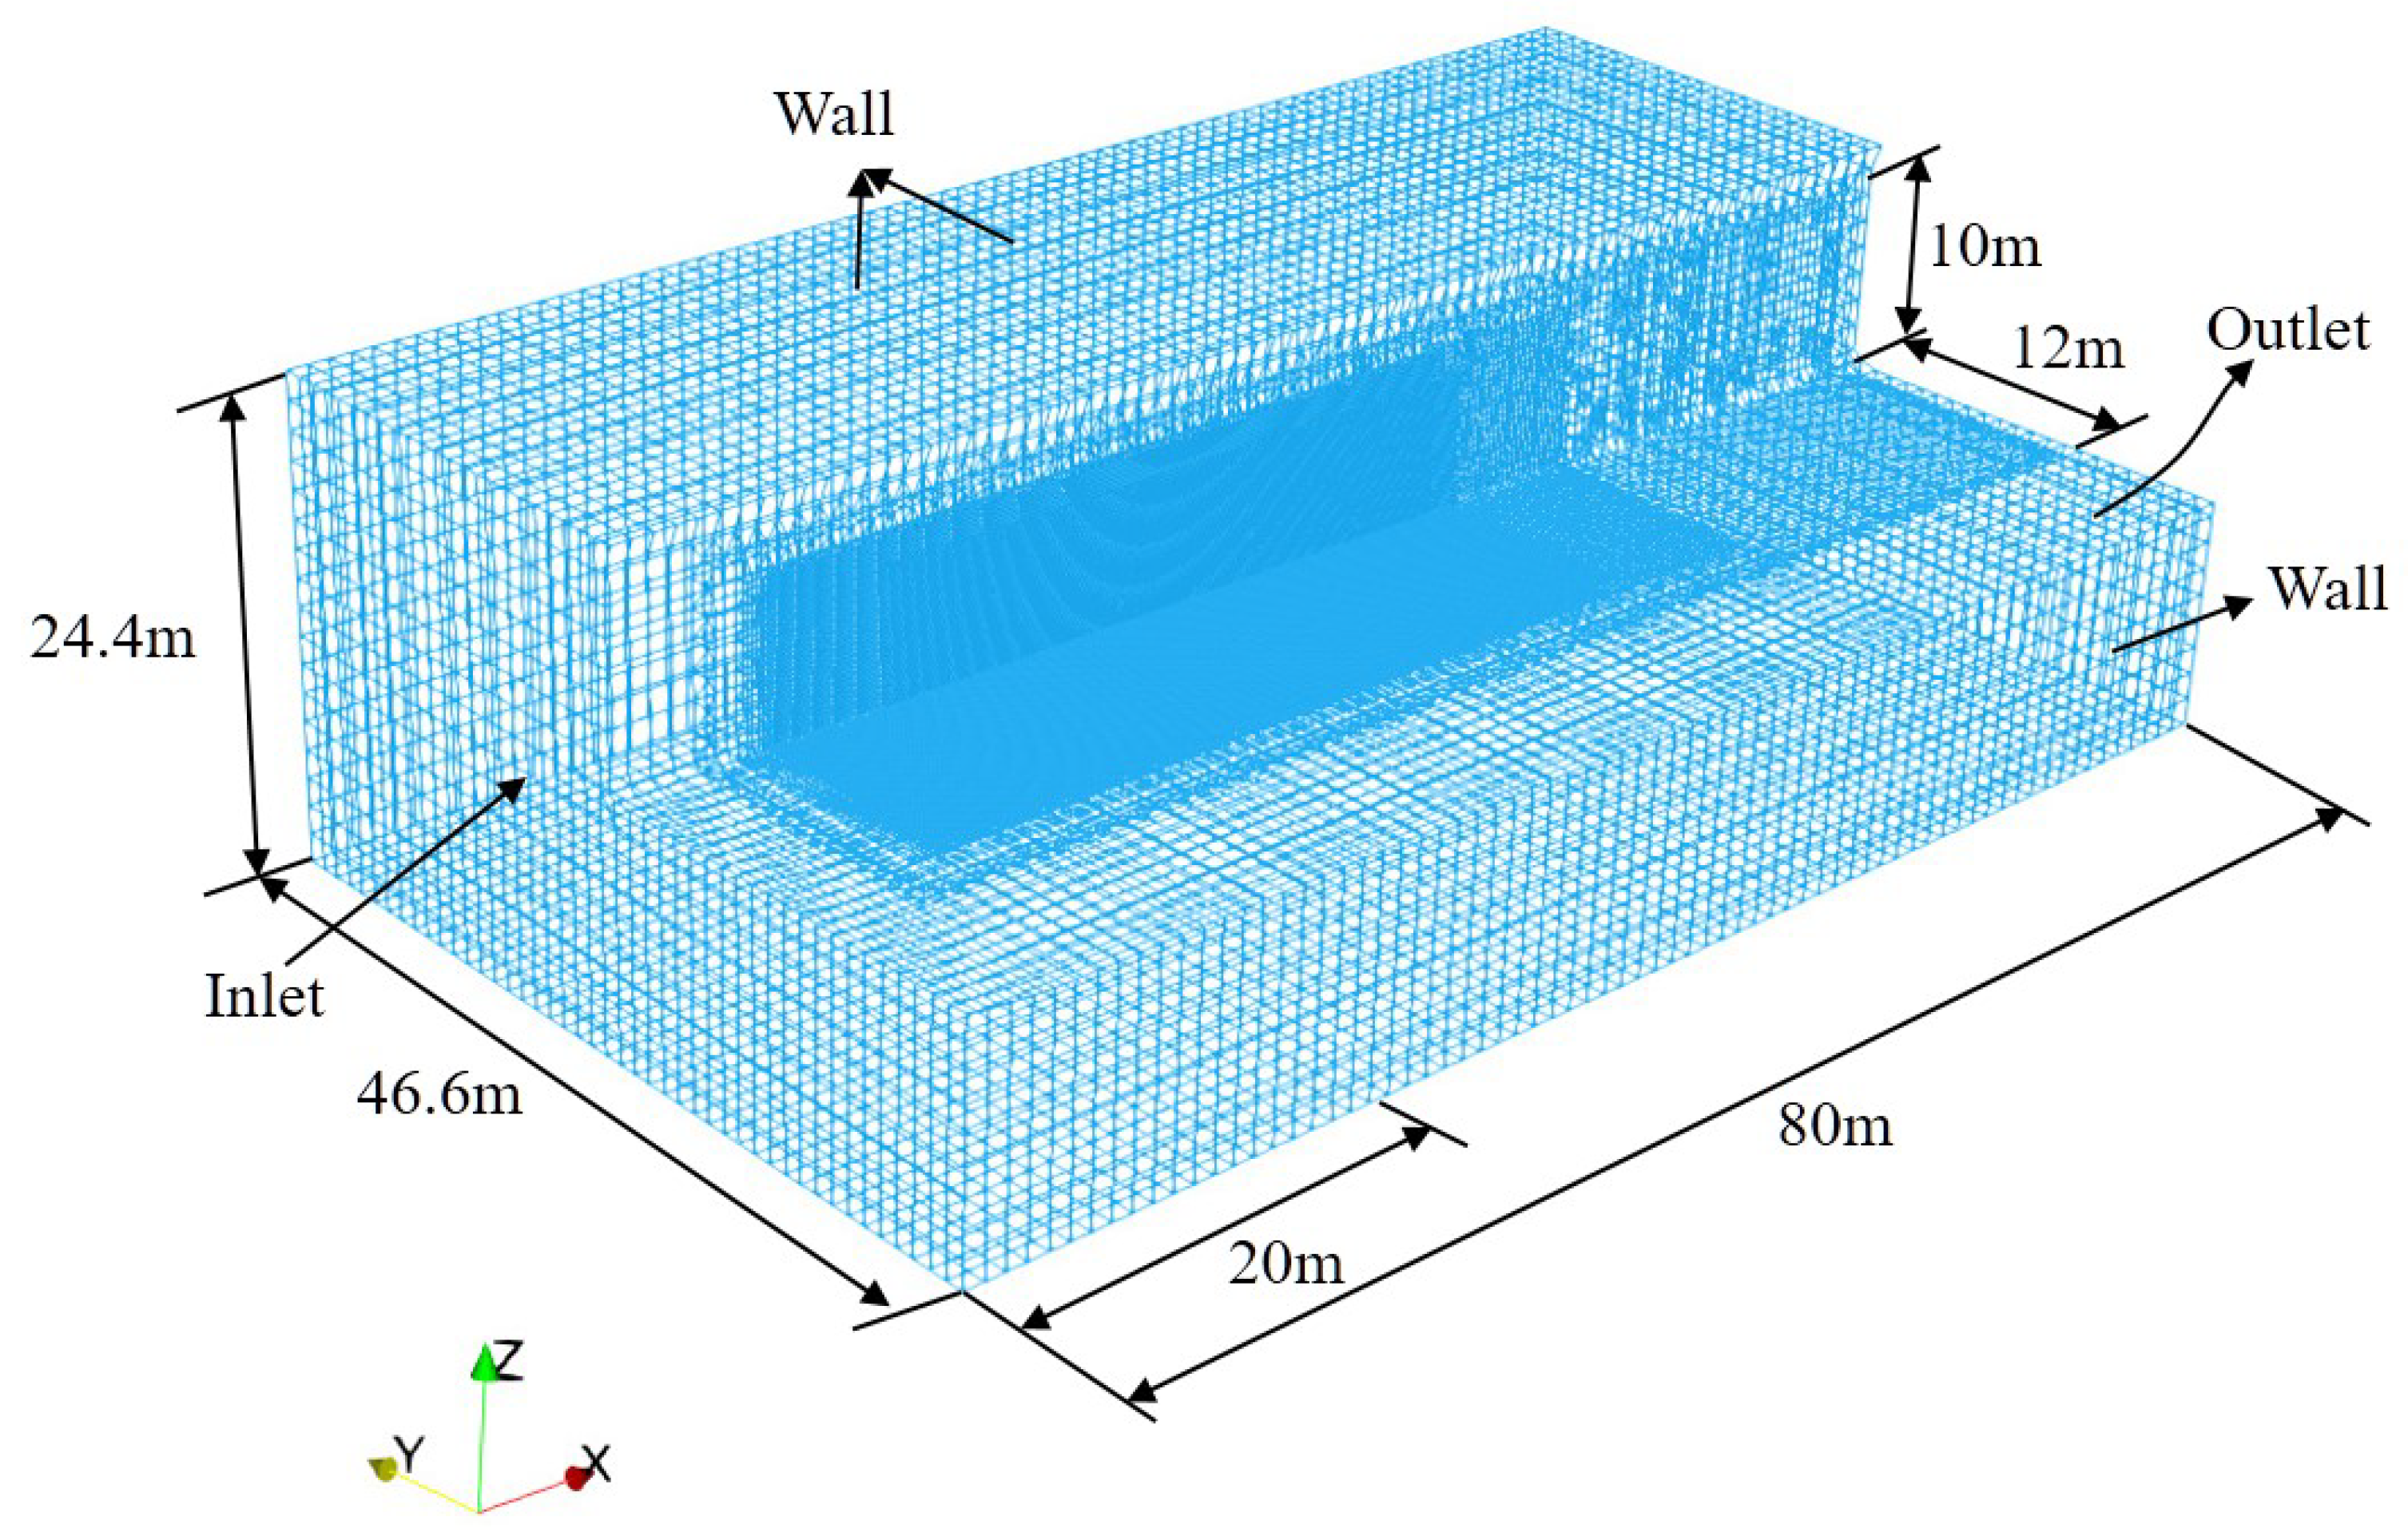
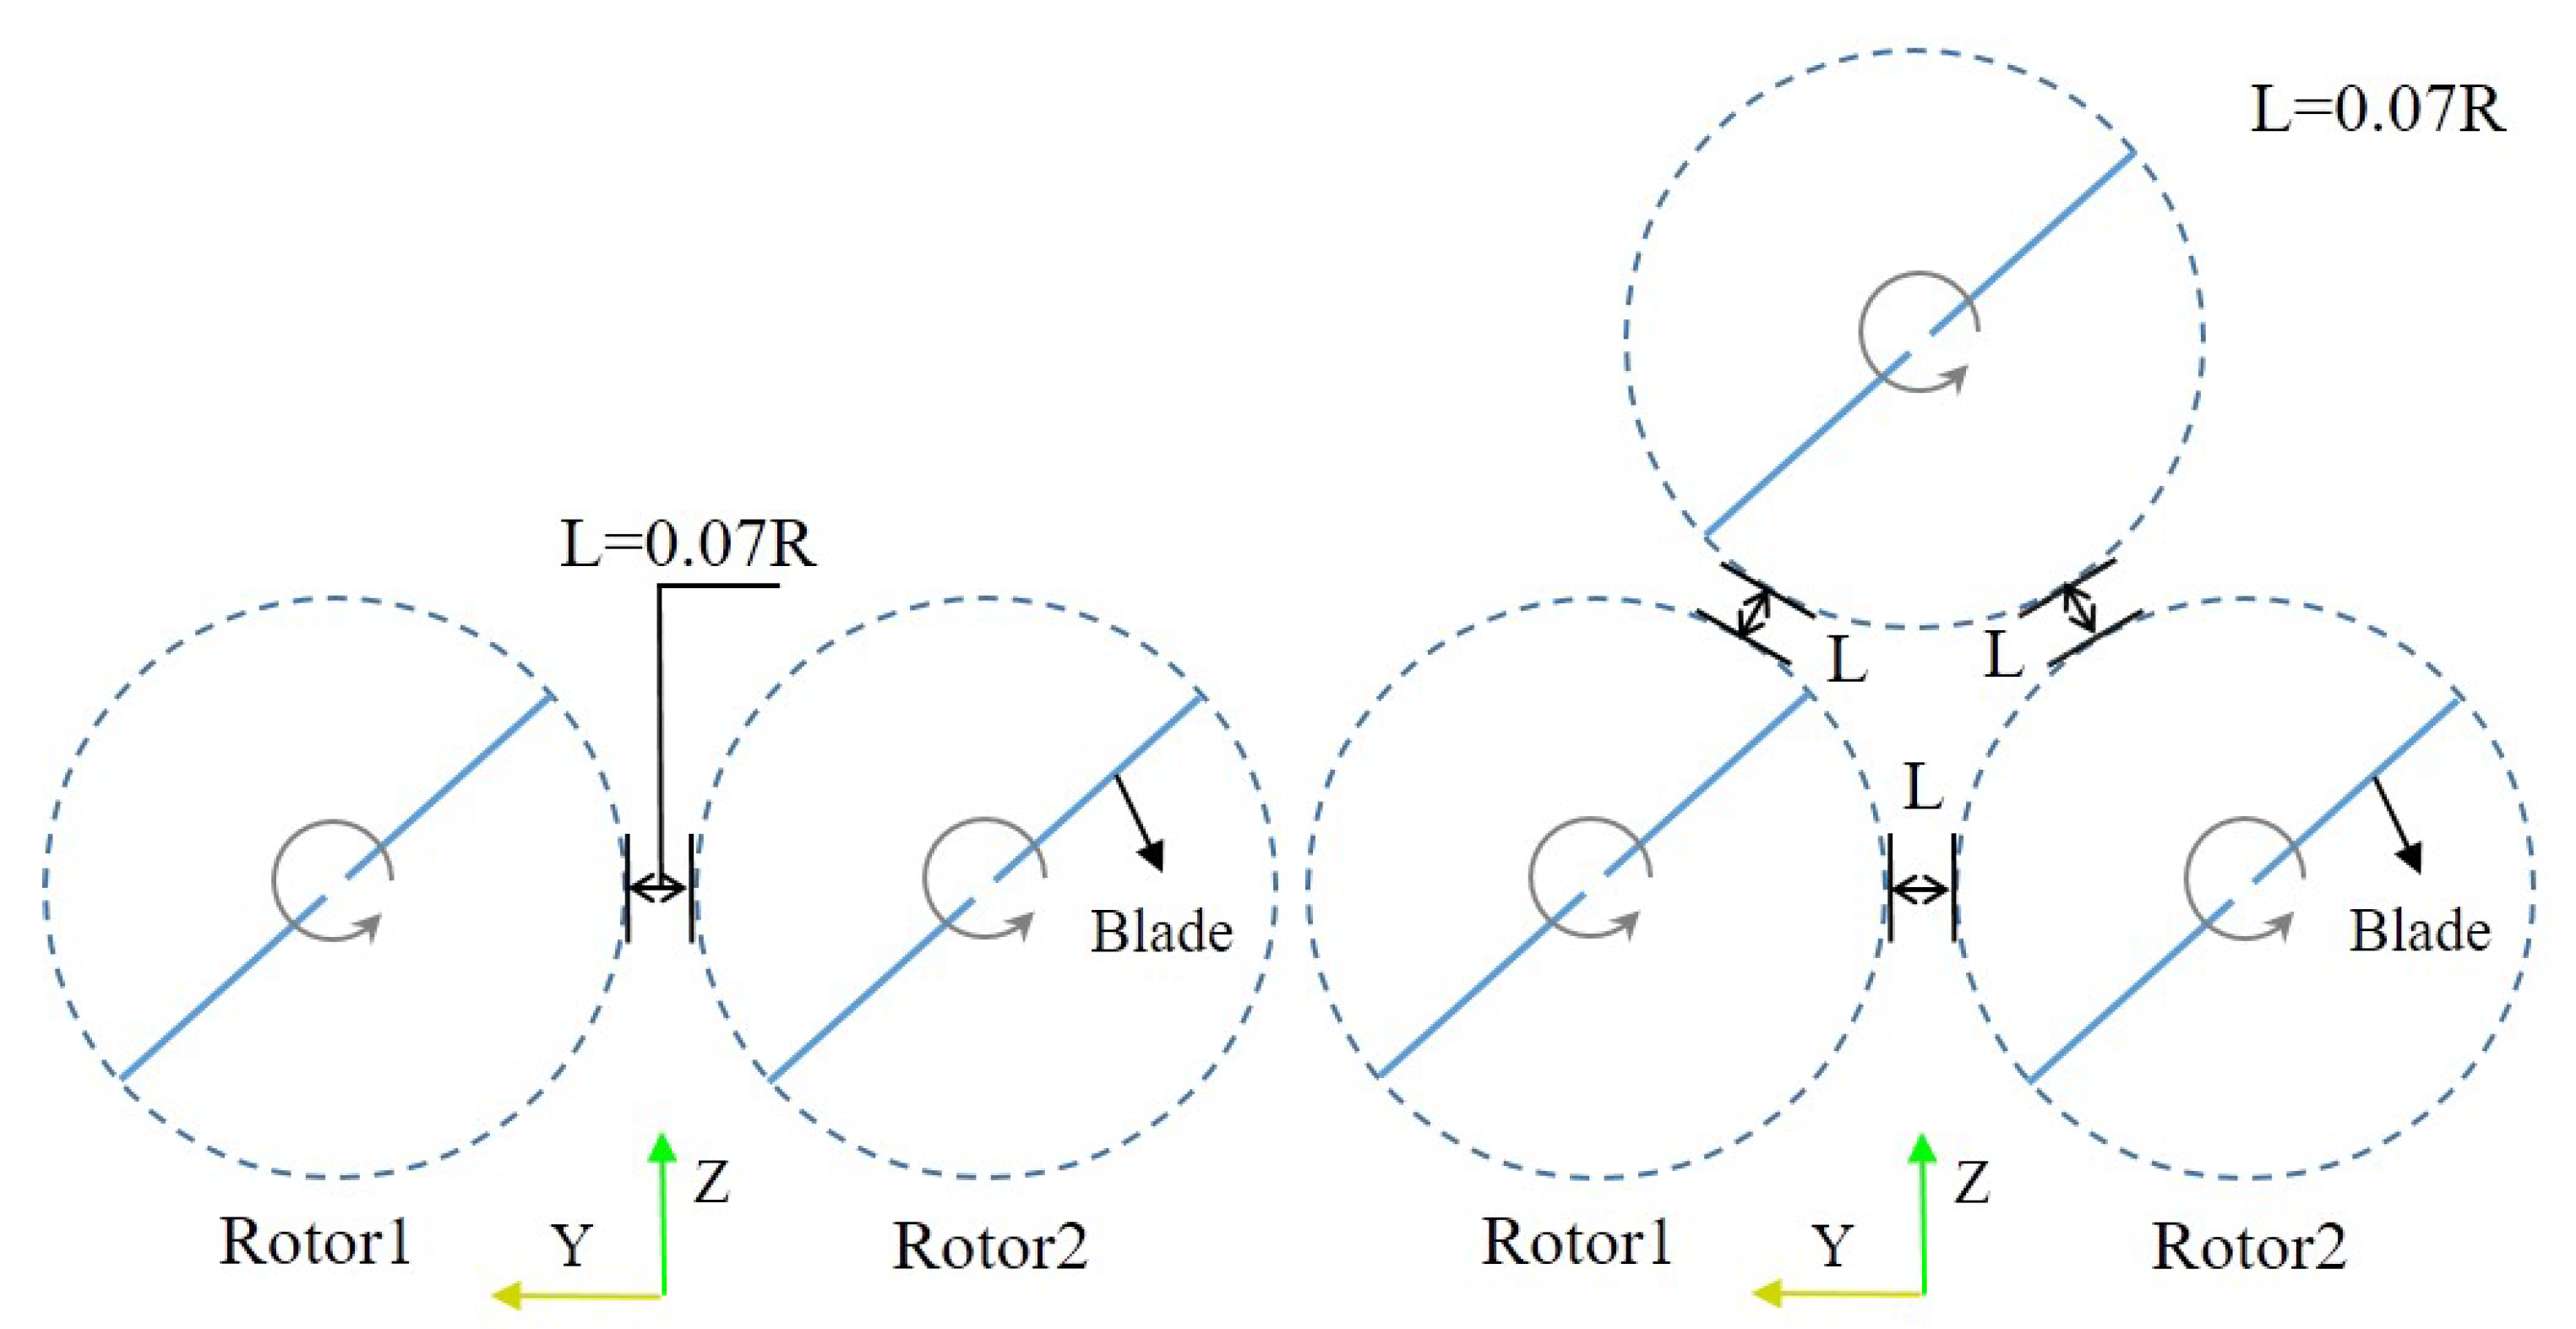
The aerodynamic performance of a single wind turbine was evaluated experimentally. The dimensions of the computational domain were 100 m × 36.6 m × 24.4 m, and the length of the wake flow area of the wind turbine was 80 m. The rotor center coordinates were (0, 0, 12.2 m), 20 m from the inlet, and the rotation plane was located at x = 0 m. Considering the influence of the wall surface on the calculation results for twin- and tri-rotor wind turbines, the length and width of the calculation domain were increased. The dimensions of the computational domain for the twin-rotor wind turbine were 80 m × 46.6 m × 24.4 m, as shown in Figure 1, while the dimensions of the computational domain for the tri-rotor wind turbine were 80 m × 46.6 m × 28.2 m. In order to calculate the wind turbine wake flow field accurately, the grid was refined in an area with width and height 24 m × 20 m and length ranging from −15 m to 55 m. In this study, we mainly consider the near-wake flow. Thus, the grid near the wind turbine was divided in a more detailed way. The computational domain consisted of hexahedral structured meshes. The wind rotors were placed in the same plane, with an outer contour distance of 0.07 R between rotors (a distance less than 0.1 R indicates that two rotors are very close under working conditions), and the rotation angle had no phase differences. The position relationships in the twin- and tri-rotor setups are shown in Figure 2.
The LES-SGS single-equation model was employed for the computation, which requires 360 time steps in one rotation cycle, with each time step being 0.002318 s, corresponding to a blade rotation azimuth of . The pressure–velocity coupling equation was solved by the PISO algorithm and the flow field was calculated in the second-order difference format.
2.3. Boundary Condition
The boundary conditions of computational domain were set as shown in Figure 1:
- Inlet (x = −20 m). The rectangular plane was set as the velocity-inlet boundary condition, which is upstream of the wind turbine. According to the wind tunnel experiment, this inlet wind velocity was set as 10 m/s, with turbulence intensity of 0.2% and temperature of 25 C.
- Outlet (x = 60 m). The rectangular plane downstream of the wind turbine was set as the free outflow boundary conditions.
- Wall. The side boundary (y = ±23.3 m), the top boundary (z = 24.4 m), and the bottom boundary (z = 0 m) were set as no-slip solid wall boundary conditions.
2.4. Model Validation and Grid Independence Analysis
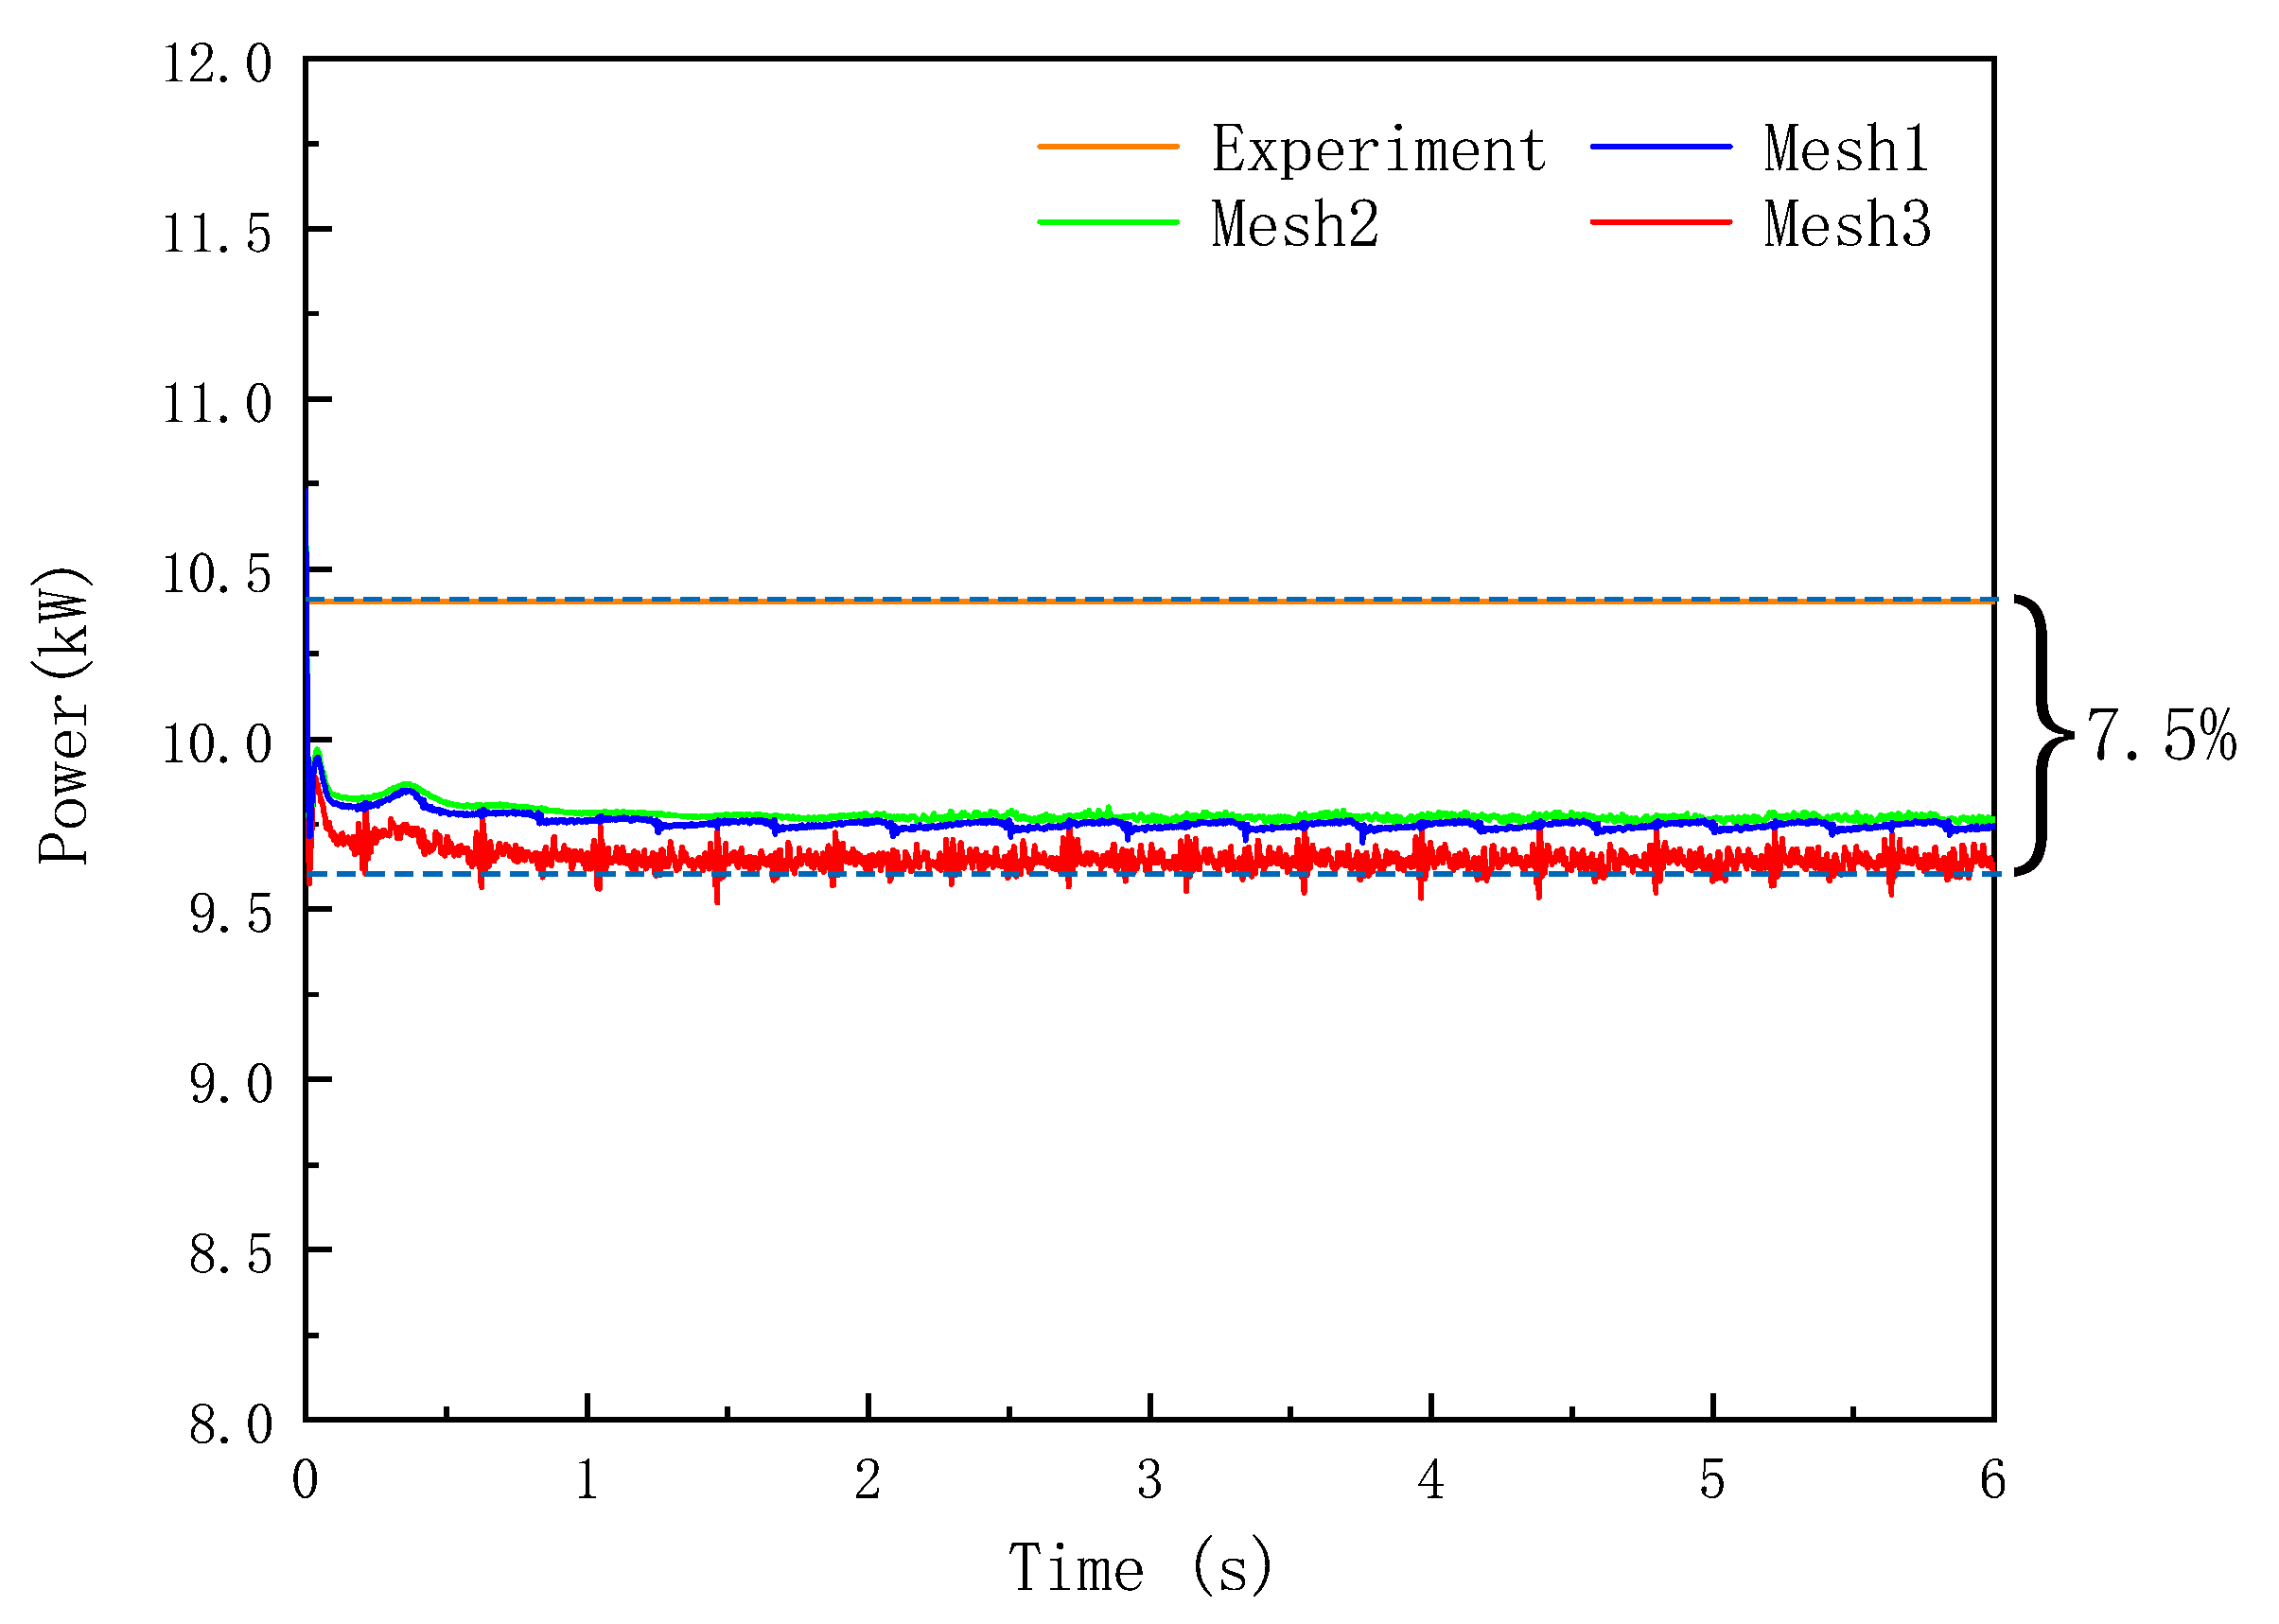
In order to verify the accuracy of the computational model, the aerodynamic performance of the phase VI wind turbine was first simulated. The calculation result is depicted in Figure 3, marked as a blue solid line for Mesh1. Three meshes were initialized, in order to validate the grid independence: Mesh3 with 900 million hexahedrons, Mesh2 with 1900 million hexahedrons, and Mesh1 with 2500 million hexahedrons. The average power with Mesh1 was 9.75 kW, within 6.3% of the experimental value of 10.4 kW. Therefore, the computational model was confirmed to satisfy the accuracy requirements. With this validated computational model, the aerodynamic performance of the phase VI wind turbine was simulated in the twin-rotor wind turbine calculation domain. The calculation results are presented in Figure 3, marked as green and red solid lines for Mesh2 and Mesh3, respectively. The average power with Mesh1, Mesh2, and Mesh3 was 9.75, 9.77, and 9.64 kW, respectively, all of which were within 7.5% of the experimental values. This comparison indicates that an increase in the computational domain width with the twin-rotor wind turbine had a small impact on the simulation results while still meeting the computational requirements.
Generally, using a finer grid makes the numerical results more accurate, but it also requires higher storage memory and a longer amount of time. Referring to Figure 3, the monitored power output did not change appreciably (maximum relative error was within 3%). In this paper, we study the tip vortex interactions between adjacent wind rotors, which requires observation of the vortex core structure in the near-wake. The mesh number of Mesh1 was larger, and the vortex core structure in the wake could be clearly identified. The minimum mesh size for Mesh1 was between 0.0625 and 0.067, leading to slight smoothing parameters . Therefore, the results and analysis below are based on Mesh1.
3. Results and Analysis
3.1. Near-Wake
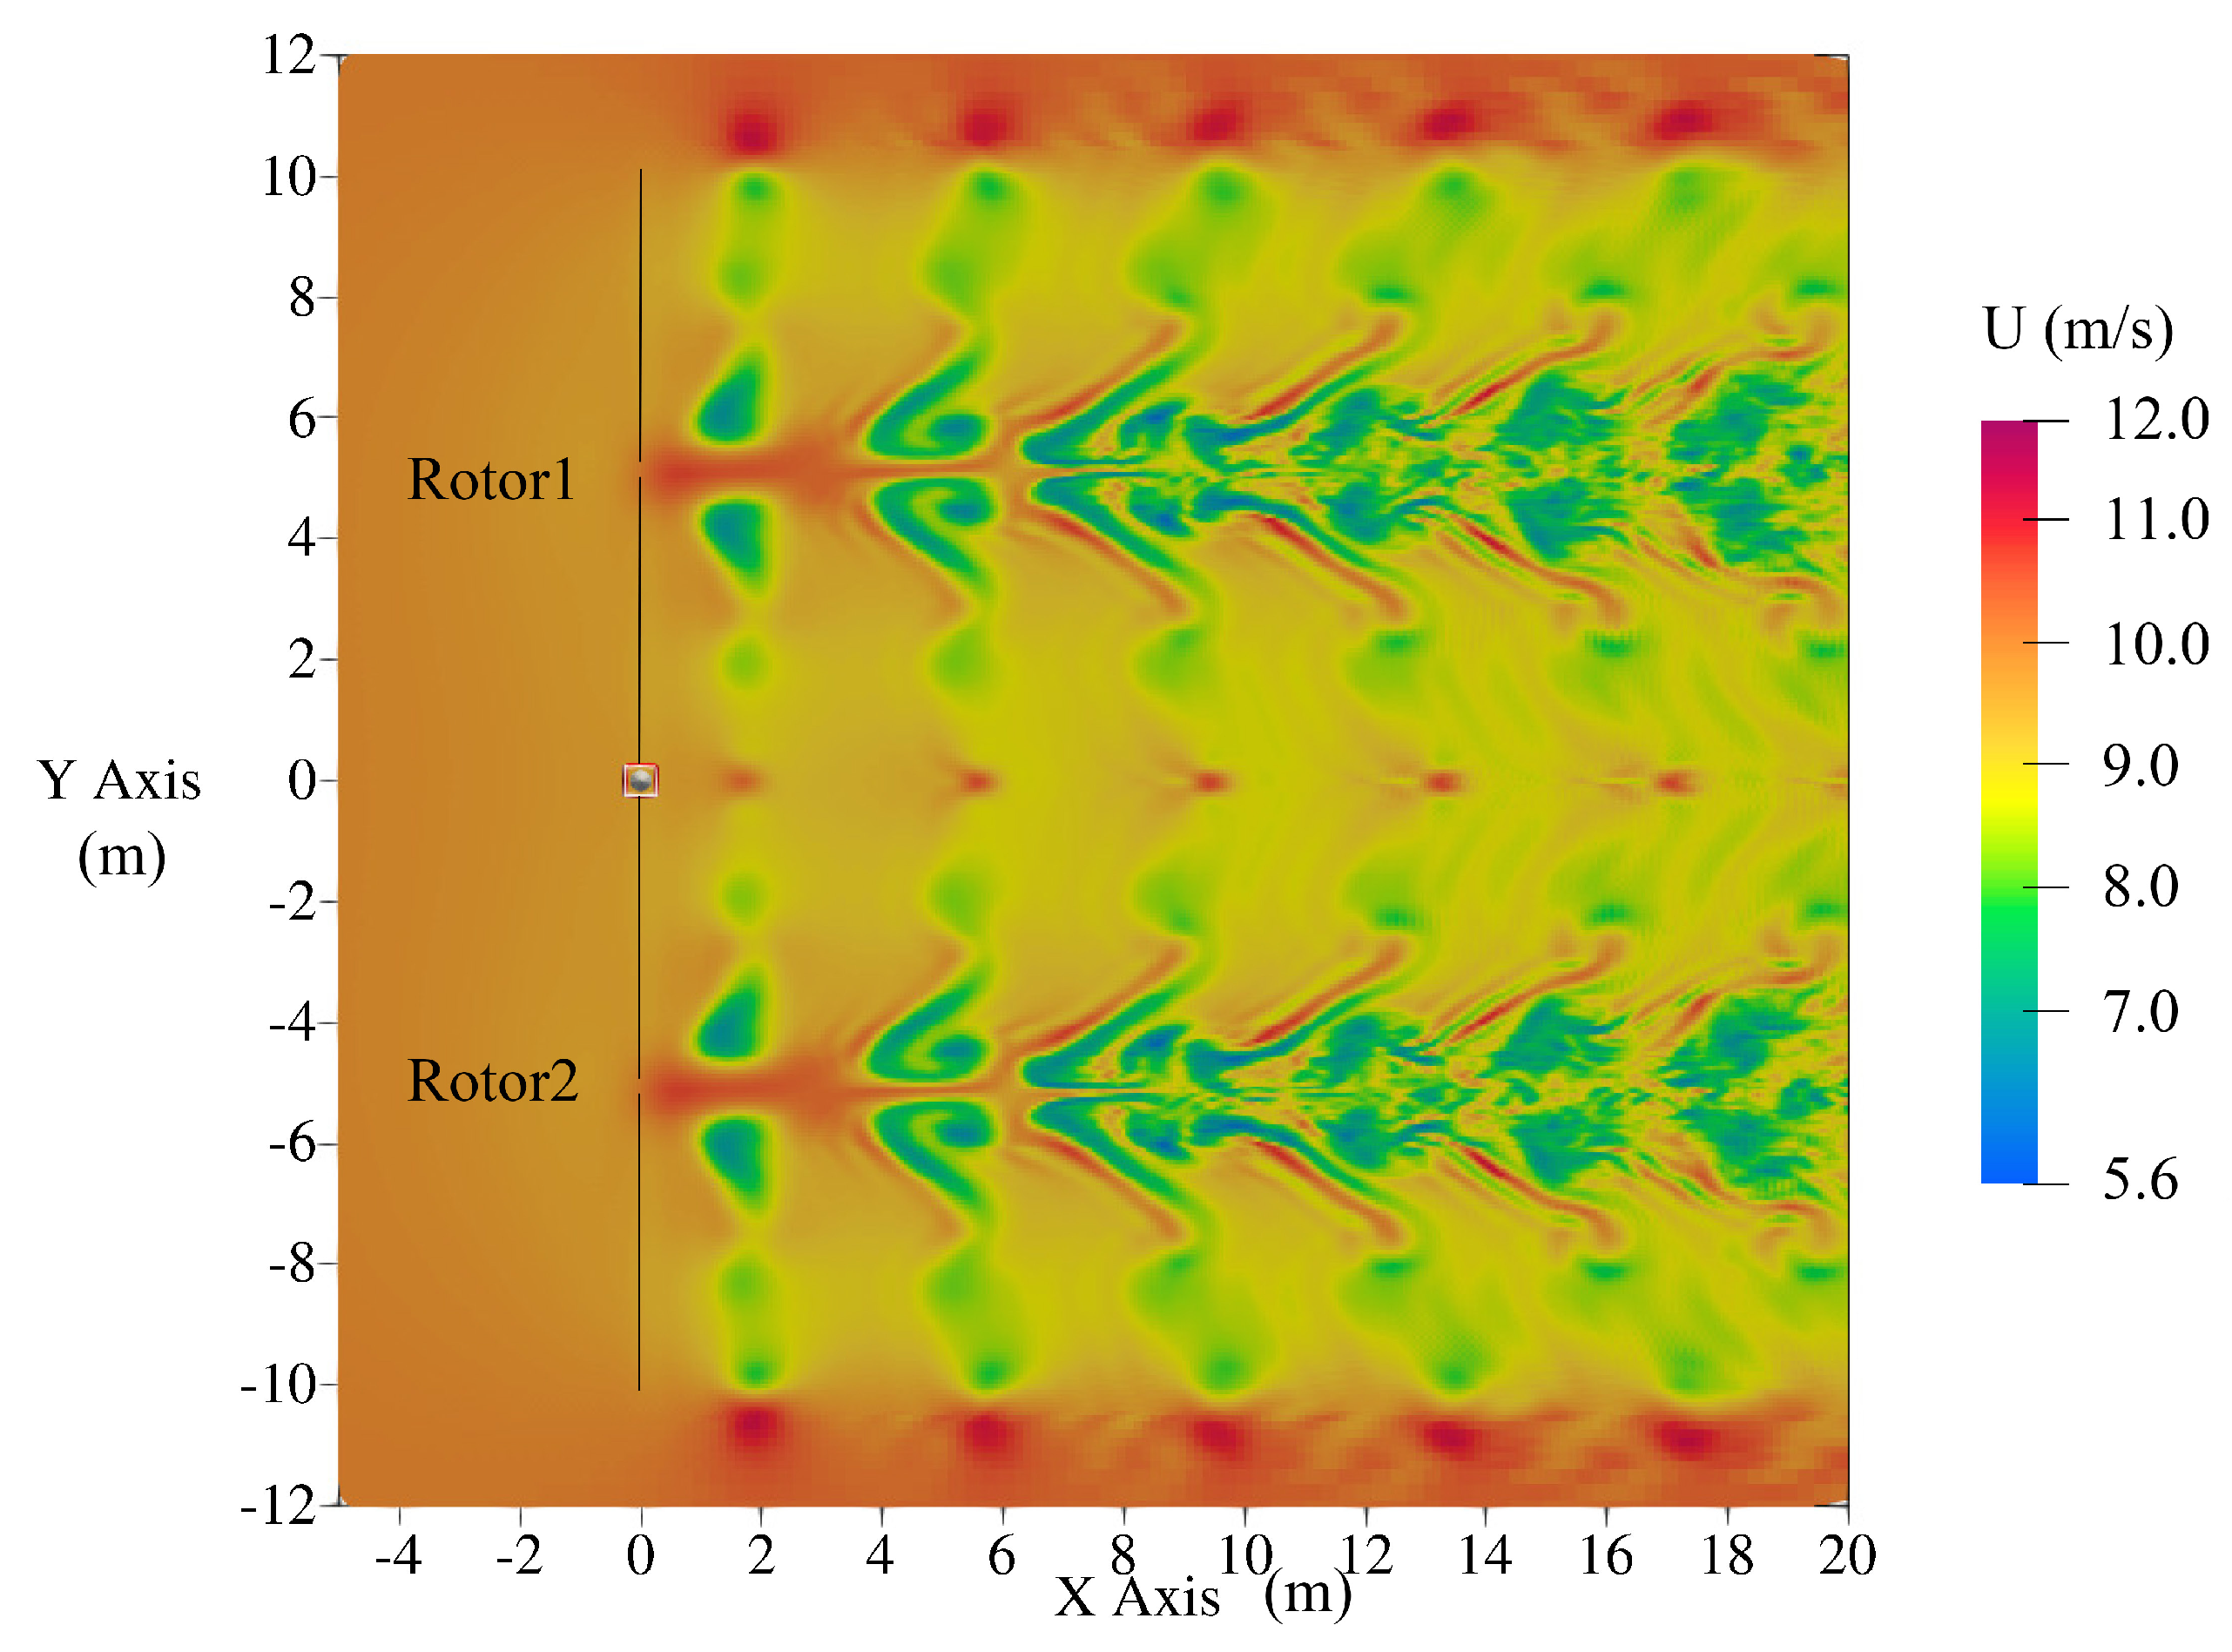
Figure 4 shows the velocity contour in the x–y plane of the near-wake of the twin-rotor wind turbine at z = 12.2 m (the wake is about 4 R). In the figure, a significant velocity loss can be observed after the wind flow passes the wind turbine, which gradually recovers as it moves away from the rotor. Due to part of the blades absorbing the largest aerodynamic energy, the largest velocity loss in the wake area is located in the rotor plane. The high-speed zone in the center part of the rotor results from negligence of the nacelle during the simulation; moreover, the compression of the fluid by the blade root and the sudden reduction in area also contributed to an increase in wind speed. On the upper and lower sides, due to the tip vortex, regular high speed zones also appeared.
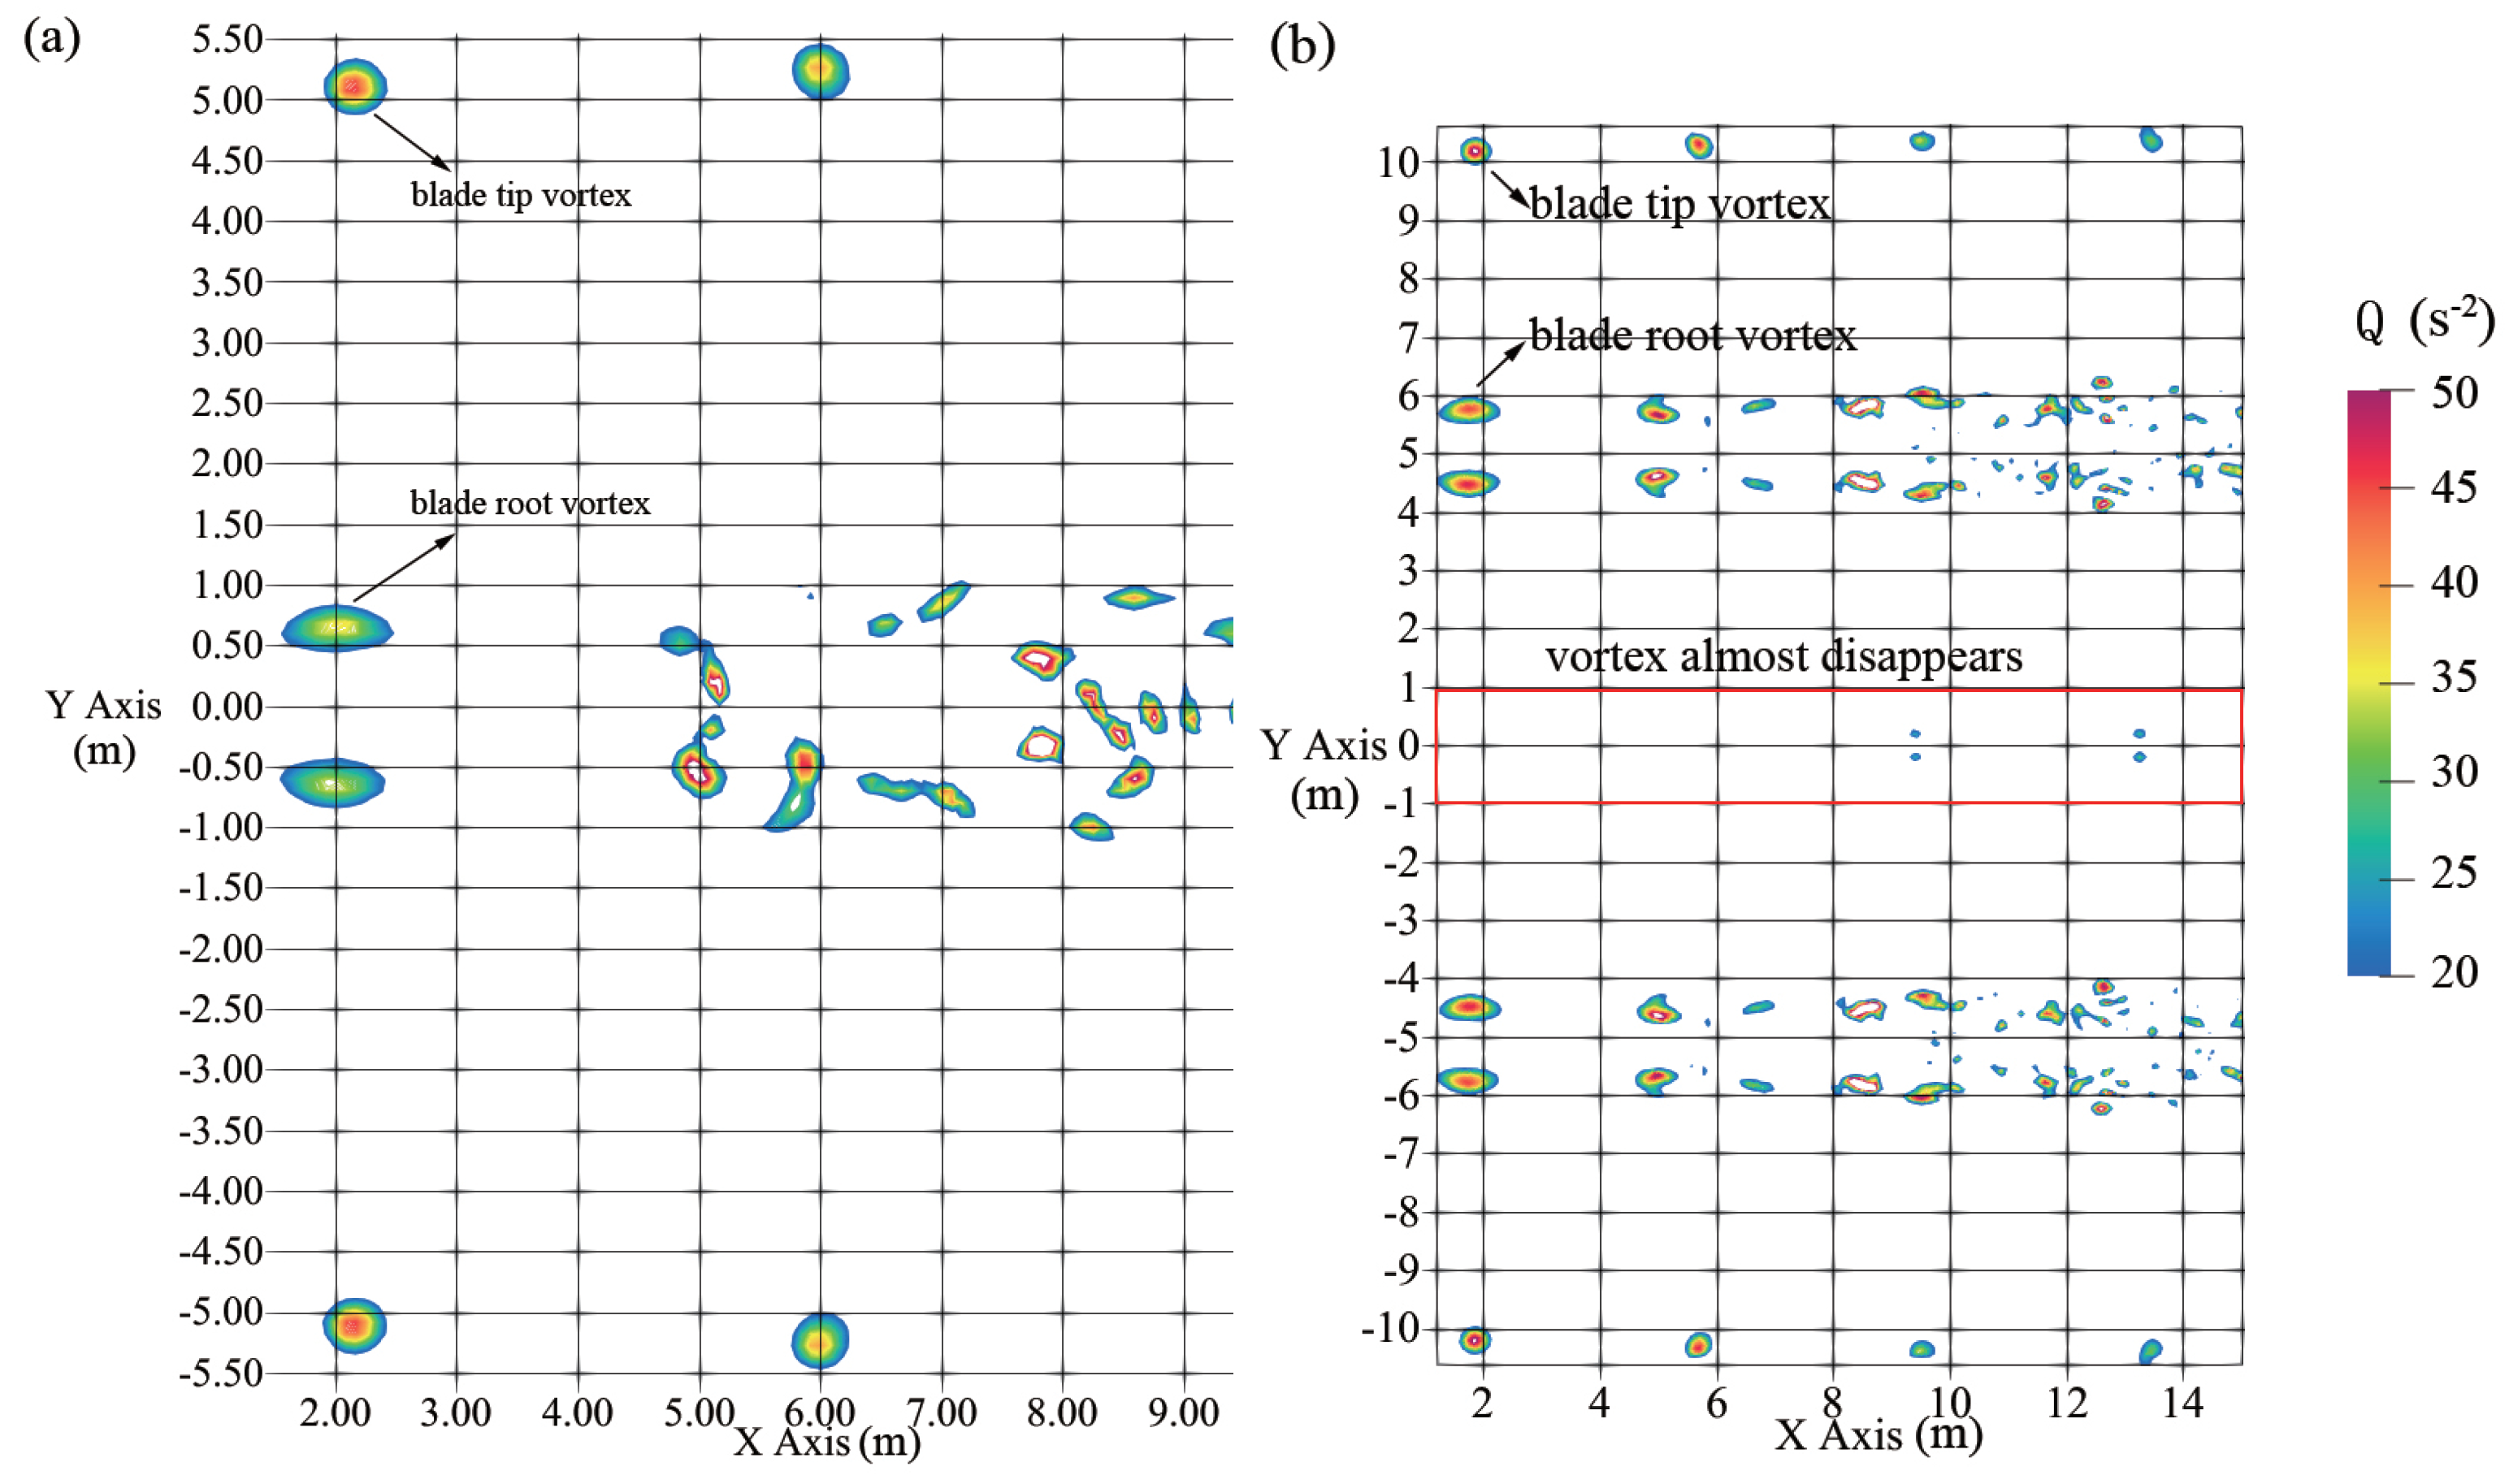
To improve the visibility of the blade tip vortices, the flow field was analyzed using the Q criterion. Figure 5 shows the vortex contour at z = 12.2 m with Q taking values ranging from 20 to 50. In the figure, the vortex core structure can be clearly observed. The vortex quantity in the rotor plane was the largest, mainly concentrated near the tip and root of the blade. During the progression of the blade tip vortex and root vortex after shedding from the blade, the intensity of vortex quantity at the center of the vortex nucleus became smaller, while the vortex nucleus gradually became larger. The reason for this vortex propagation is that fluid viscosity causes the fluid around the concentrated vortex to be involved into it, resulting in spreading of the concentrated vortex and an increase in the vortex radius. As the wake continued to progress downstream, the large-scale vortices broke up to form small-scale vortices. Comparing the results for the single-rotor wind turbine with those of the twin-rotor wind turbine, it can be seen that the single-rotor wind turbine led to obvious vortex generation at the tip of the blade, while the vortex in the middle part (near y = 0) of the twin-rotor wind turbine was significantly decreased.
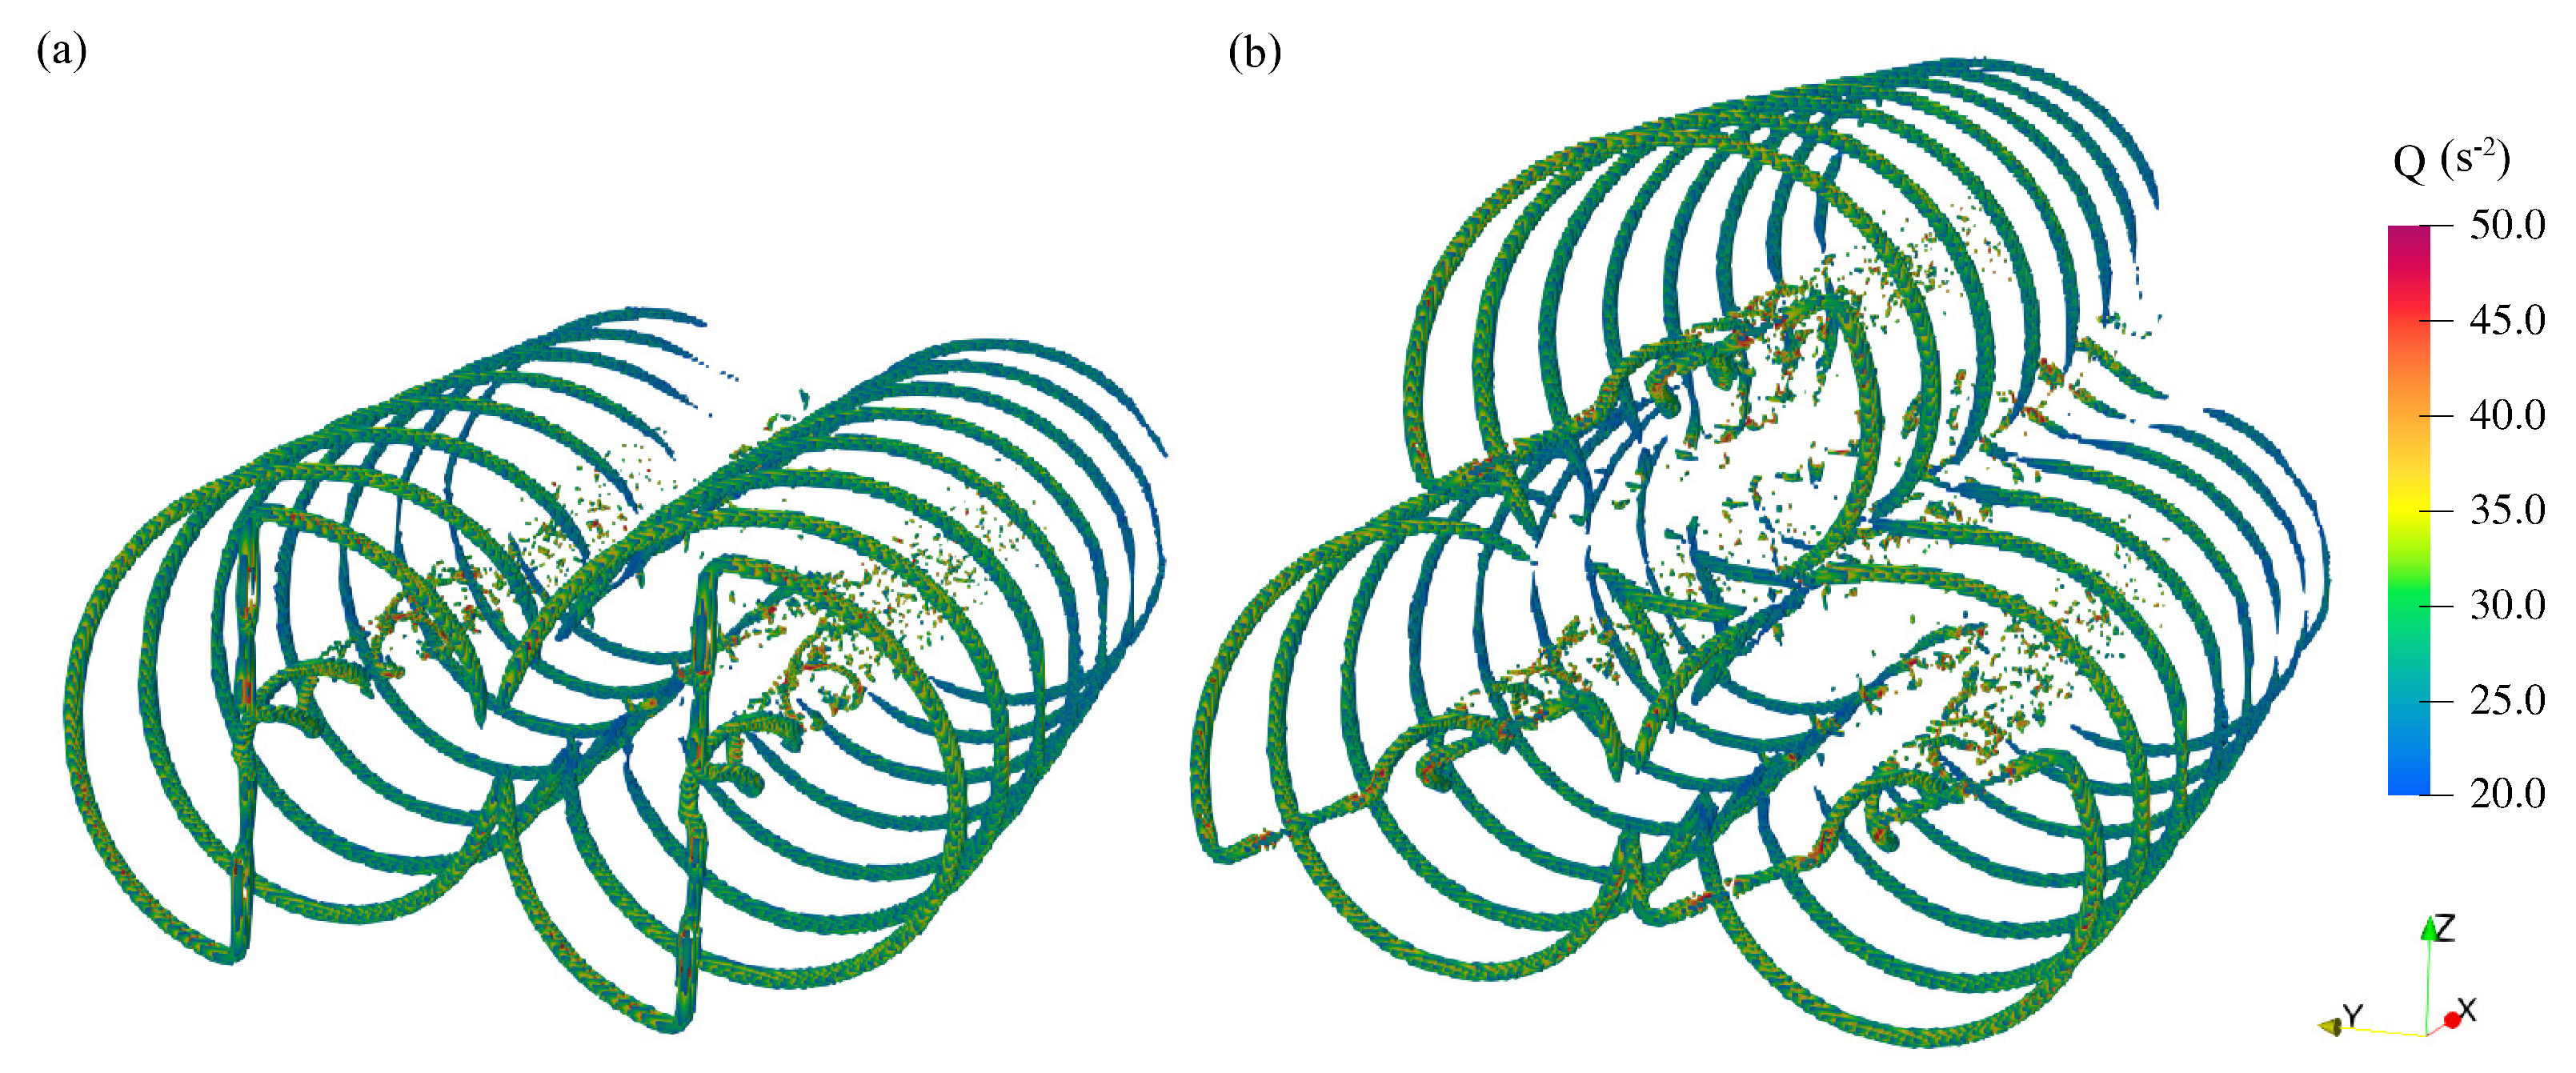
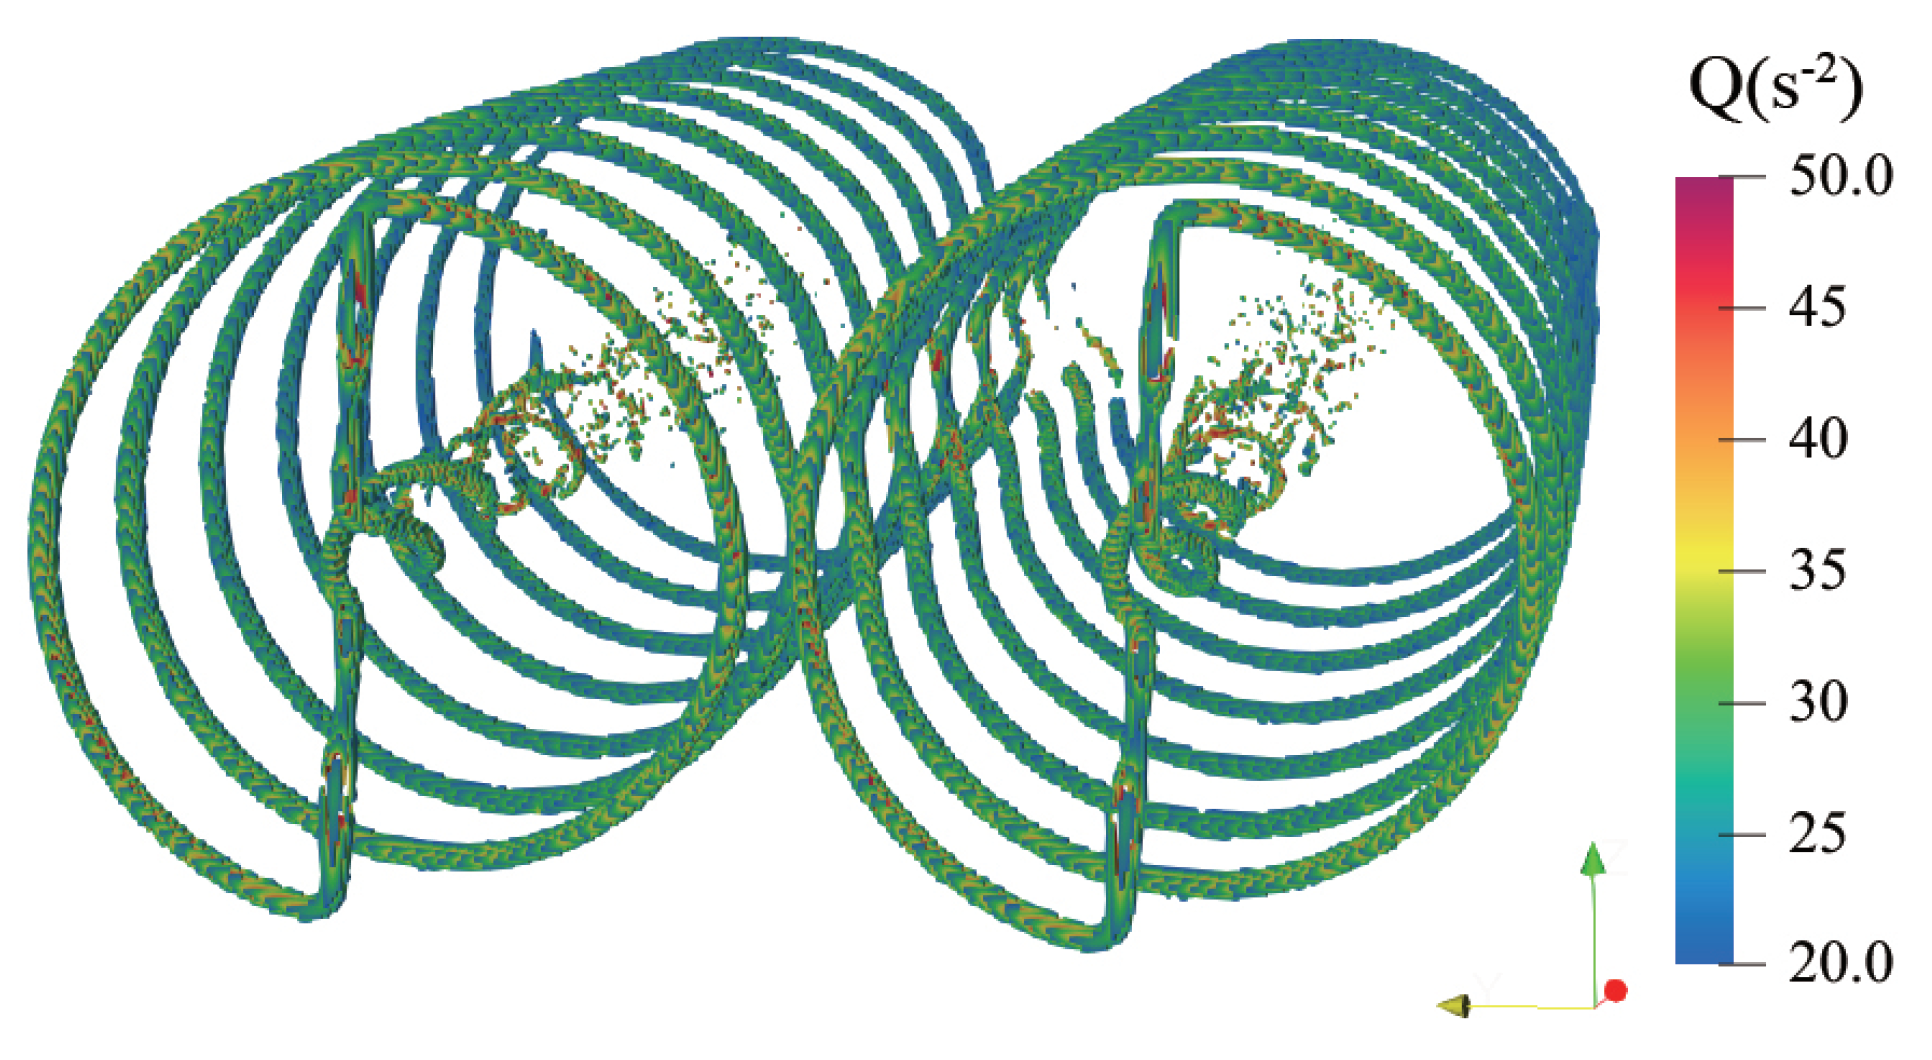
In order to show the development of the blade tip vortex in the wake flow more clearly, the 3D flow field was rendered. The wake vortex is shown in Figure 6, where the blade tip vortex and the blade root vortex with spiral-type structure can be clearly observed. In the figure, the blade tip vortex at Q = 20 to Q = 50 in the middle part of the twin-rotor wind turbine can be seen to almost disappear. A similar result can be seen with the tri-rotor wind turbine flow field.
3.2. Aerodynamic Performance
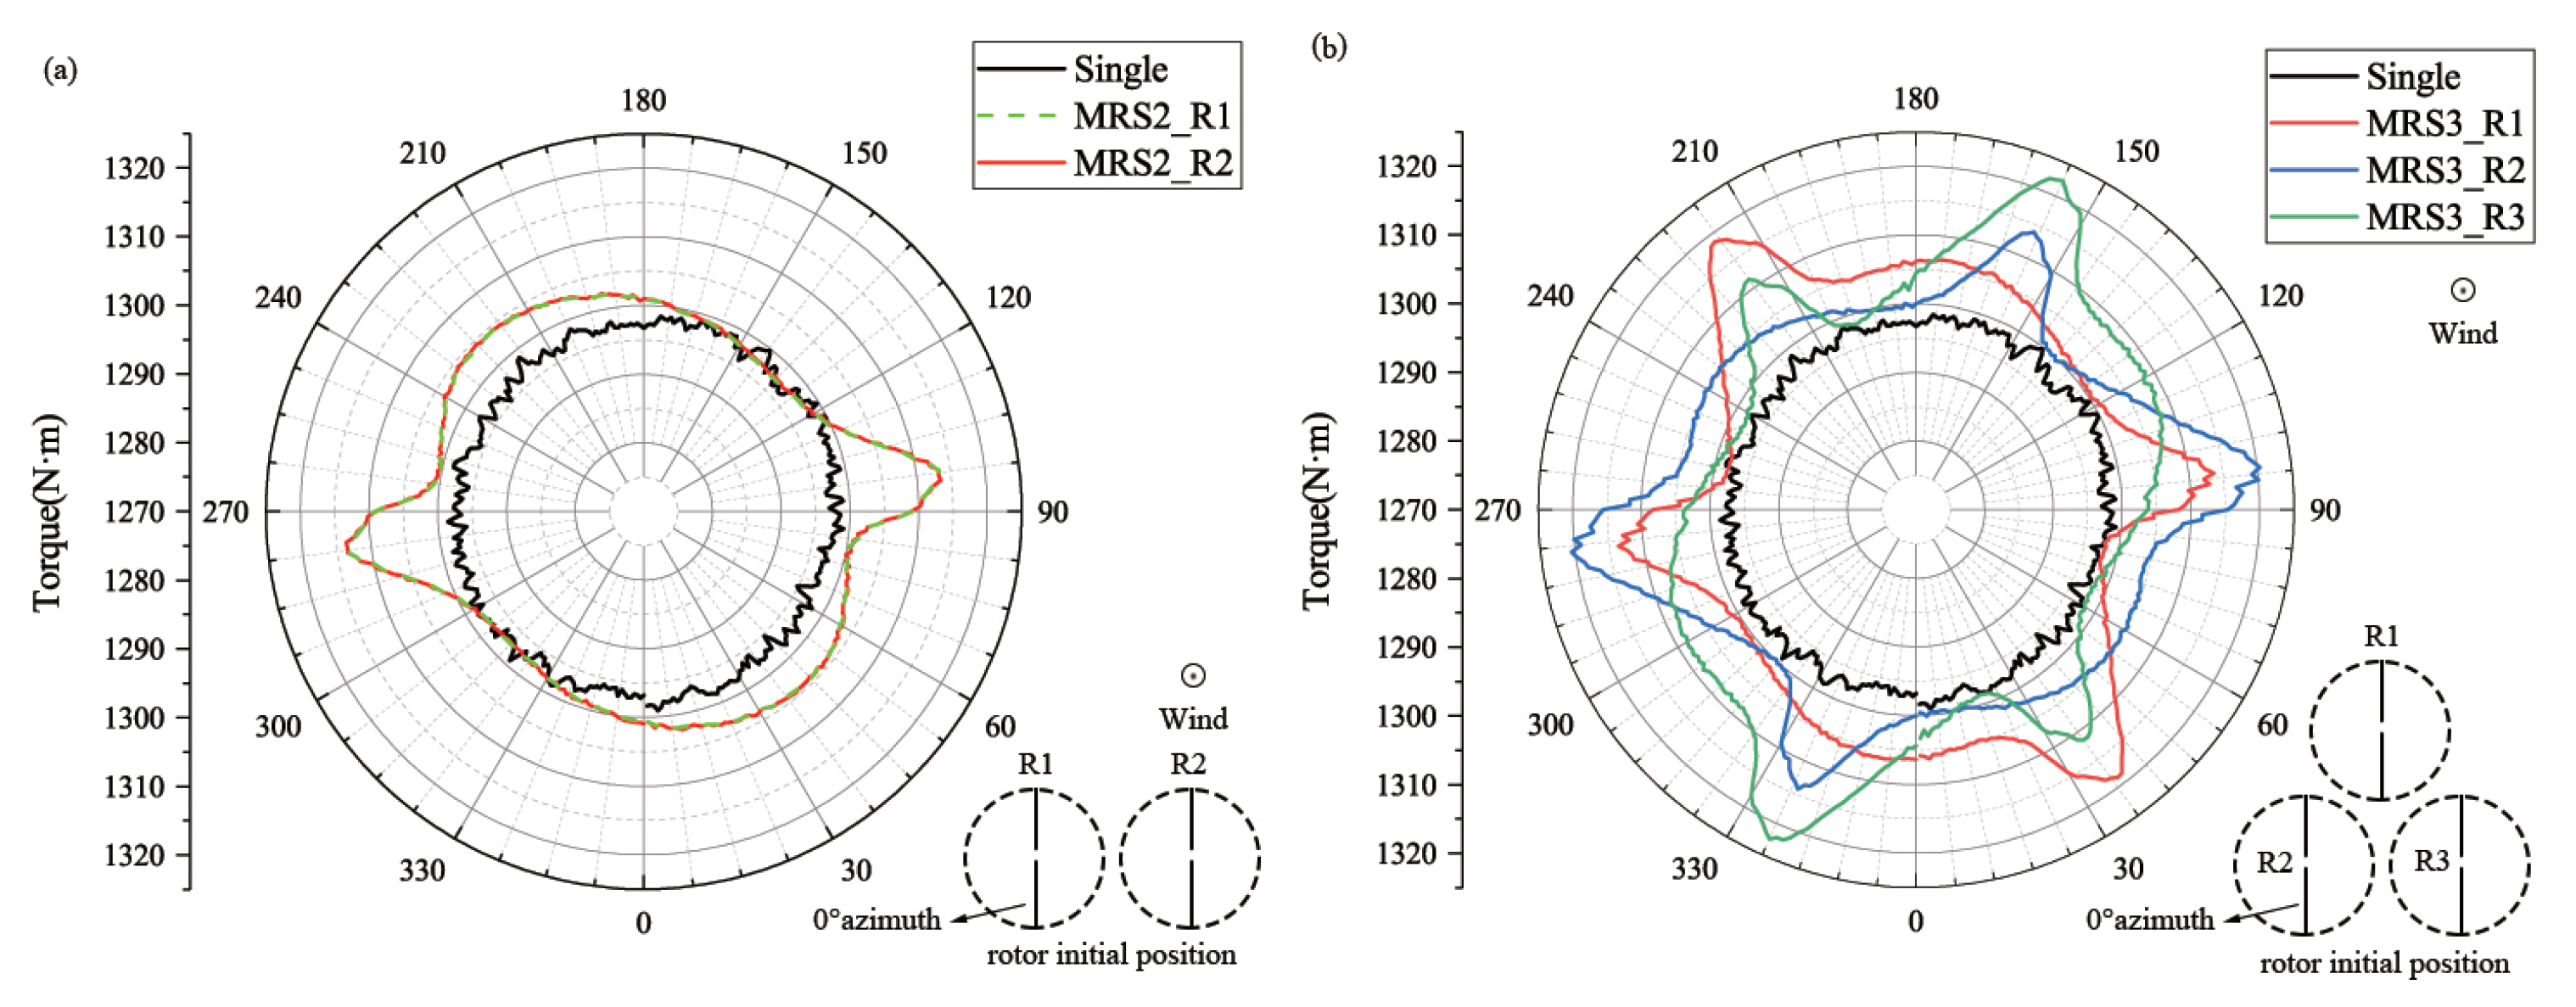
The torque variation patterns for the single-, twin-, and tri-rotor wind turbines with the rotor rotating over one week are shown in Figure 7. In the figure, Single represents single-rotor wind turbine, MRS2 represents the twin-rotor wind turbine, and R1∼R3 represents Rotor1∼Rotor3. Compared with the single-rotor wind turbine, the torque of the twin-rotor wind turbine had two peaks near and azimuth, with the maximum torque being enlarged by about 1.2%. Additionally, MRS3 had two more fluctuations in one rotation cycle of the individual wind turbine for the one extra rotor. In these conditions, the torque extremes occurred at the points where the rotating blades of the two wind turbines were close. Compared to the single-rotor wind turbine, the torque of the tri-rotor wind turbine was increased by 1.1% to 2.0%. Similar to MRS2, a slight increase in torque can be observed during each rotation cycle.
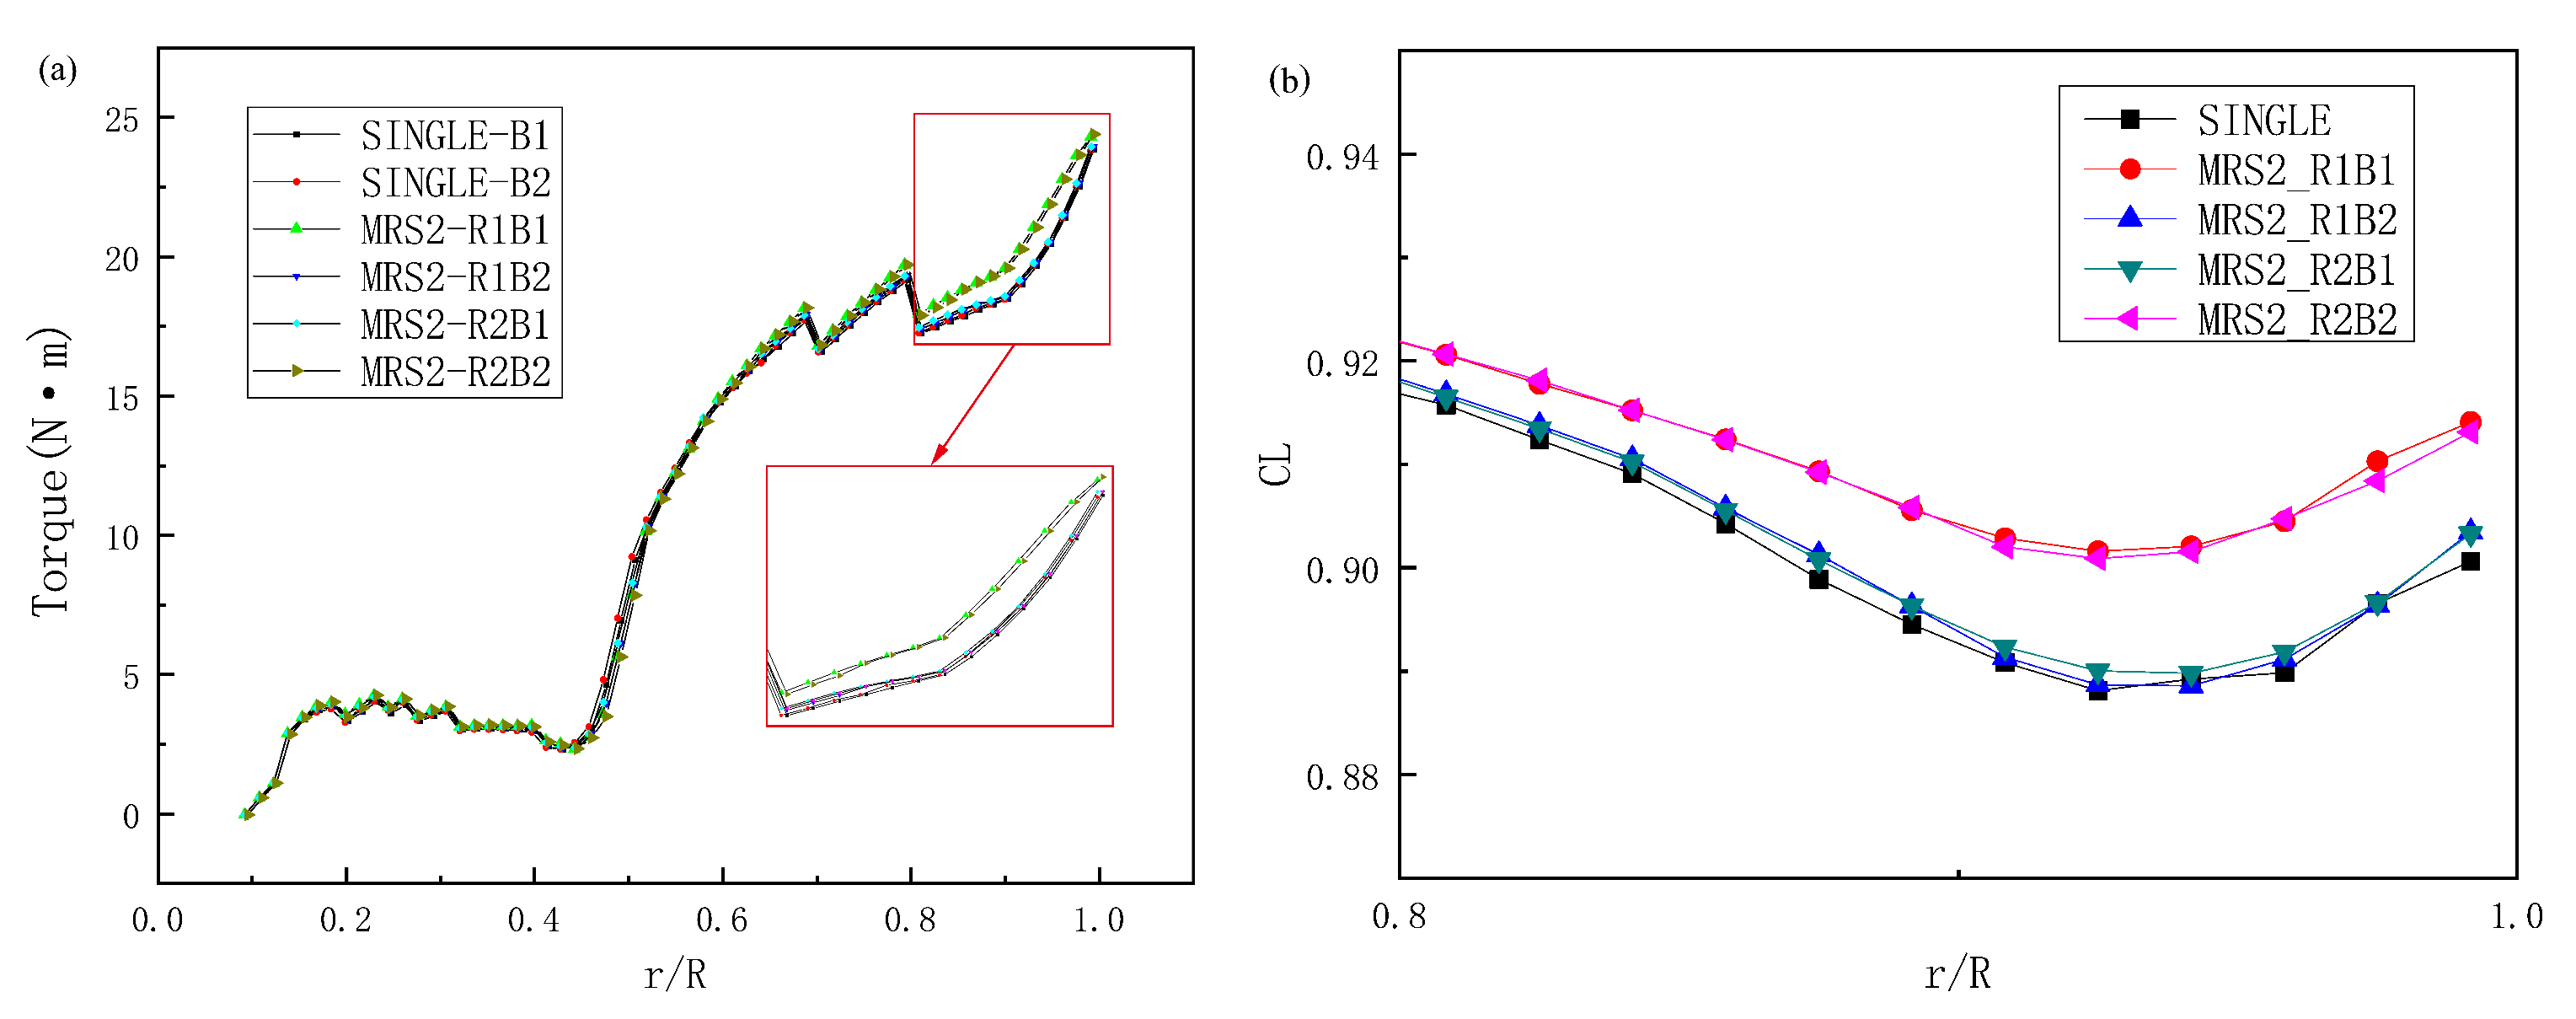
To clarify the source of this torque increase, torque values of the twin-rotor wind turbines at azimuth, along the blade spread and at each discrete point, were extracted, as exhibited in Figure 8a). In the figure, the torque can be seen to be enhanced at r/R = 0.8∼1, which is 0.2 R closer to the blade tip. The lift coefficients for the blade tip in this range are presented in Figure 8b). The coefficients of MRS2_R1B1 and MRS2_R2B2 had larger values than those of MRS2_R1B2 and MRS2_R2B1. This enhancement in aerodynamic performance near the tip at 0.2 R, combined with the near-wake analysis in Section 3.1, was reasonably attributed to the interaction of the blade tip vortices.
3.3. Aerodynamic Load Analysis
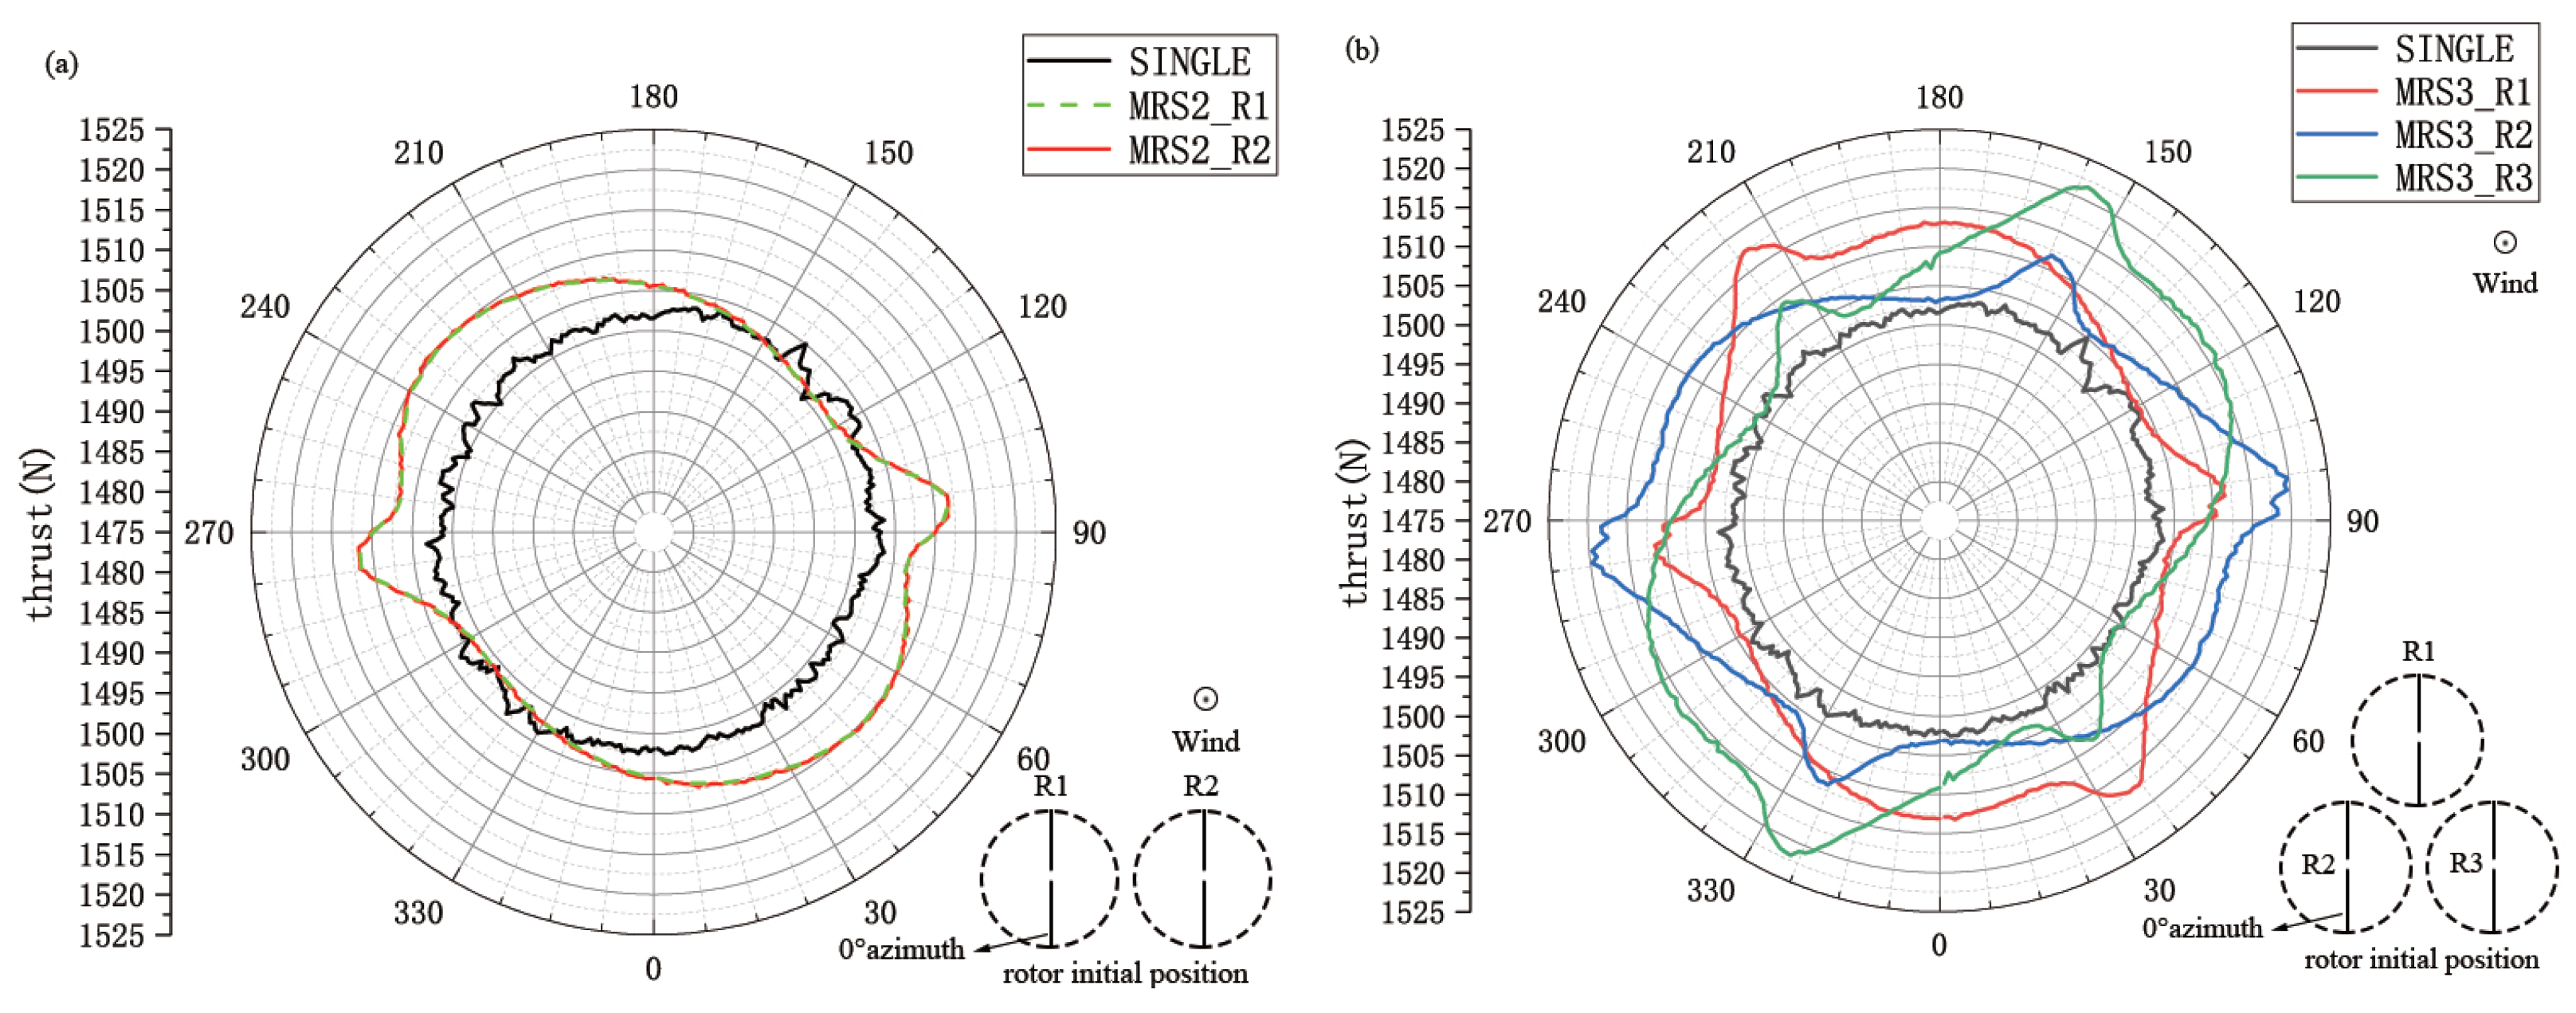
The thrust variation patterns of the single-, twin- and tri-rotor wind turbines with the rotor rotating over one week are shown in Figure 9. Compared with single-rotor wind turbine, the thrust of the twin-rotor wind turbine also had two peaks near and azimuth, with the maximum torque being enlarged by about 0.8%. The increase in thrust amplitude of the tri-rotor wind turbine was greater, with the maximum thrust being enlarged by about 1.7%; furthermore, there were four fluctuations within one week of rotor rotation. This means that, as the number of rotors increases, the risk of structural strength and fatigue damage also increases.
3.4. Effect of Rotor Spacing
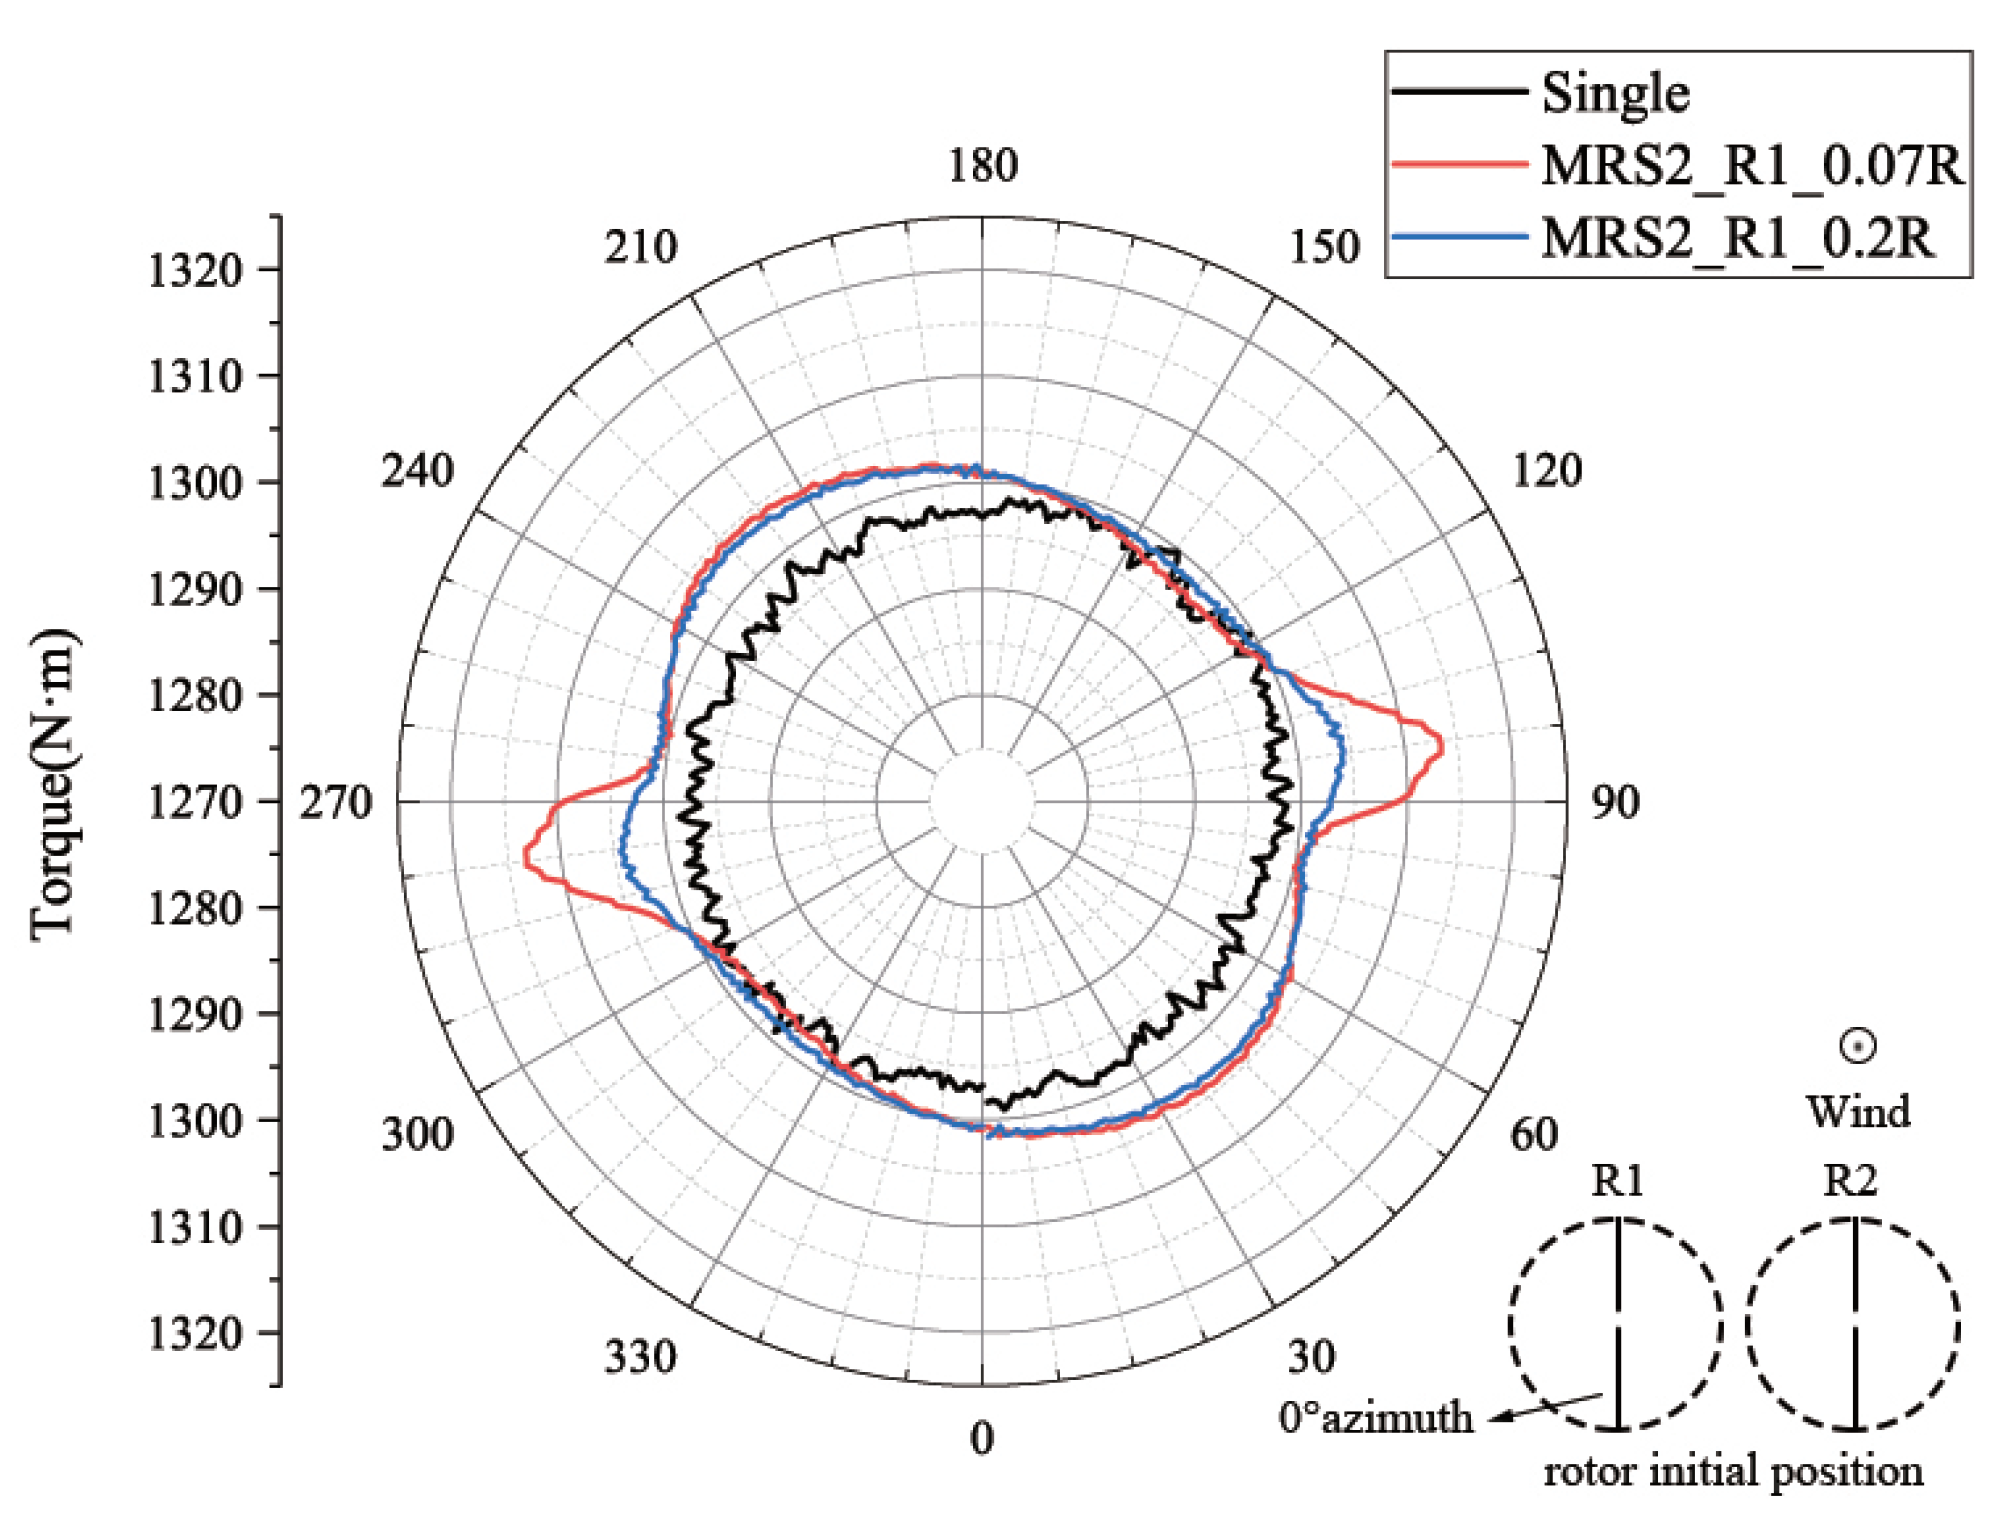
From the results of the previous analysis of the blade tip vortex, it could be calculated that the maximum spacing between the wind rotors where the blade tip vortex affects each other is 0.2 R. To verify this result, we designed the working condition with a rotor spacing of 0.2 R, in order to calculate the aerodynamic performance of the twin-rotor wind turbine. The near-wake result is shown in Figure 10. It can be seen, from the figure, that the wake presented a small interaction after the third week. Furthermore, the torque result is shown in Figure 11. Compared with the single-rotor wind turbine, there was a small increase in torque under the 0.2 R rotor spacing working condition, about 0.54%. The torque fluctuation for the rotor spacing of 0.2 R was lower, compared to the results with the rotor spacing at 0.07 R.
4. Conclusions
In this study, the aerodynamic behaviors of MRWTs were investigated using the ALM-LES method. Both twin- and tri-rotor cases were taken into account. The CFD simulation results indicated that the aerodynamic performance of MRWTs can be improved by using a regular blade size. Our detailed conclusions can be summarized as follows:
1. The local blade tip vortex generation in MRWTs can be reduced by considering the interaction of the blade tip vortices, resulting in an increase of wind turbine torque. The influence between the blade tip vortices is mainly located in the range of 0.2 R of the blade tip; this range led to a significant increase in the lift coefficient. When the wind rotor spacing was set at 0.2 R, the interaction between the blade tip vortices was small.
2. The simulation results suggest that, when multiple wind turbines are arranged in the same plane in close proximity (the closest distance between the blade tips at operation is about 0.07 R) with the same speed and initial azimuth, a rapid increase in torque (of 1% to 2%) can be observed at the closest azimuth between the two blades.
3. When two wind turbines in the same plane are arranged in close proximity, the fluctuation of the aerodynamic load can be increased, as attributed to the mutual influence of the vortices at the blade tips. With a growing number of rotors, the aerodynamic load fluctuation also increases, mainly concentrated in the close proximity of two blades. These aerodynamic load fluctuations will potentially put higher demands on the design and fatigue life of the multi-rotor wind turbine drive train. Therefore, the regulation operation needs to be paid attention to, in order to cope with this effect.
Author Contributions
Y.Z. and X.C. conceived and designed the simulation; Y.Z. did the simulation and post work; Y.Z. and S.L. analyzed the data; X.G. and Y.W. contributed reagents/materials/analysis tools; S.L. wrote the paper. All authors have read and agreed to the published version of the manuscript.
Funding
Postgraduate Research & Practice Innovation Program of Jiangsu Province (under Grant No. SJKY19_0430). Supported by the Fundamental Research Funds for the Central Universities (Grant No. 2018B48614). The first group of 2011 plan of China’s Jiangsu province (Grant No. [2013] 56).
Institutional Review Board Statement
Not applicable.
Informed Consent Statement
Not applicable.
Data Availability Statement
Not applicable.
Conflicts of Interest
We declare that we do not have any commercial or associative interest that represents a conflict of interest in connection with the work submitted.
References
- Shields, M.; Beiter, P.; Nunemaker, J.; Cooperman, A.; Duffy, P. Impacts of turbine and plant upsizing on the levelized cost of energy for offshore wind. Appl. Energy 2021, 298, 117189. [Google Scholar] [CrossRef]
- Jiang, Y.; Liu, S.; Zao, P.; Yu, Y.; Zou, L.; Liu, L.; Li, J. Experimental evaluation of a tree-shaped quad-rotor wind turbine on power output controllability and survival shutdown capability. Appl. Energy 2022, 309, 118350. [Google Scholar] [CrossRef]
- Göltenbott, U.; Ohya, Y.; Yoshida, S.; Jamieson, P. Aerodynamic interaction of diffuser augmented wind turbines in multi-rotor systems. Renew. Energy 2017, 112, 25–34. [Google Scholar] [CrossRef]
- Verma, P. Multi Rotor Wind Turbine Design and Cost Scaling. Master’s Thesis, University of Massachusetts Amherst, Amherst, MA, USA, 2013. [Google Scholar]
- Fingersh, L.; Hand, M.; Laxson, A. Wind Turbine Design Cost and Scaling Model; Technical Report; National Renewable Energy Lab. (NREL): Golden, CO, USA, 2006. [Google Scholar]
- Vestas Multi-Rotor Wind Turbine: 3 Blades Good, 12 Blades Better. 5 July 2006. Available online: https://cleantechnica.com/2016/07/05/vestas-multi-rotor-wind-turbine-3-blades-good-12-blades-better/ (accessed on 11 July 2022).
- van der Laan, M.; Abkar, M. Improved energy production of multi-rotor wind farms. J. Phys. Conf. Ser. 2019, 1256, 012011. [Google Scholar] [CrossRef]
- Störtenbecker, S.; Dalhoff, P.; Tamang, M.; Anselm, R. Simplified support structure design for multi-rotor wind turbine systems. Wind. Energy Sci. 2020, 5, 1121–1128. [Google Scholar] [CrossRef]
- Zhao, J.; Wang, Y.; Huang, Q.; Lu, L.; Zhu, L. The Blade Load Research of Multi-Rotor Wind Turbine in Wind Shear Follow. Acta Energiae Solaris Sin. 2014, 35, 1176–1182. [Google Scholar]
- Lu, L.P.; Wang, Y.P.; Huang, Q.W. Study on Tower Vibration Characteristic of 3-Rotor HAWT System. Appl. Mech. Mater. 2015, 724. [Google Scholar] [CrossRef]
- Lu, L.; Wang, Y.; Huang, Q.W. Mechanism design and parameter optimization for high-speed bag-taking device with cycloid trajectory. J. Mach. Des. 2015, 32, 70–74. [Google Scholar]
- Jamieson, P.; Branney, M. Multi-Rotors: A Solution to 20 MW and Beyond? Energy Procedia 2012, 24, 52–59. [Google Scholar] [CrossRef]
- Kale, S. Comprehensive Evaluation of Innovative Multi Rotor Wind Turbine Designs. Int. J. Mech. Eng. Educ. 2012, 3, 730–739. [Google Scholar]
- Mate, G. Development of a Support Structure for Multi-Rotor Wind Turbines. Master’s Thesis, University of Massachusetts Amherst, Amherst, MA, USA, 2014. [Google Scholar]
- Jamieson, P. Innovation in Wind Turbine Design; John Wiley & Sons: New York, NY, USA, 2018. [Google Scholar]
- Smulders, P.; Orbons, S.; Moes, C. Aerodynamic interaction between two wind rotors set next to each other in one plane. In Proceedings of the European Wind Energy Conference, Hamburg, Germany, 22–26 October 1984; pp. 529–533. [Google Scholar]
- Ransom, D.; Moore, J.; Heronemus-Pate, M. Performance of wind turbines in a closely spaced array. Renew. Energy World 2010, 2, 32–36. [Google Scholar]
- Yoshida, S.; Goltenbott, U.; Ohya, Y.; Jamieson, P. Coherence Effects on the Power and Tower Loads of a 7 × 2 MW Multi-Rotor Wind Turbine System. Energies 2016, 9, 742. [Google Scholar] [CrossRef]
- Ghaisas, N.S.; Ghate, A.S.; Lele, S.K. Effect of tip spacing, thrust coefficient and turbine spacing in multi-rotor wind turbines and farms. Wind. Energy Sci. 2020, 5, 51–72. [Google Scholar] [CrossRef]
- Speakman, G.A.; Abkar, M.; Martínez-Tossas, L.A.; Bastankhah, M. Wake steering of multirotor wind turbines. Wind Energy 2021, 24, 1294–1314. [Google Scholar] [CrossRef]
- Bastankhah, M.; Abkar, M. Multirotor wind turbine wakes. Phys. Fluids 2019, 31, 085106. [Google Scholar] [CrossRef]
- Ismaiel, A.; Yoshida, S. Aeroelastic Analysis for Side-Booms of a Coplanar Twin-Rotor Wind Turbine. Int. Rev. Aerosp. Eng. 2020, 13, 135–140. [Google Scholar] [CrossRef]
- Ismaiel, A.; Yoshida, S. Aeroelastic Analysis of a Coplanar Twin-Rotor Wind Turbine. Energies 2019, 12, 1881. [Google Scholar] [CrossRef]
- Filsoof, O.T.; Yde, A.; Bøttcher, P.; Zhang, X. On critical aeroelastic modes of a tri-rotor wind turbine. Int. J. Mech. Sci. 2021, 204, 106525. [Google Scholar] [CrossRef]
- Ferede, E.; Gandhi, F. Aeroelastic load analysis of a co-rotating quad-rotor wind turbine. Wind Energy 2022, 25, 450–467. [Google Scholar] [CrossRef]
- van der Laan, M.P.; Andersen, S.J.; Ramos García, N.; Angelou, N.; Pirrung, G.R.; Ott, S.; Sjöholm, M.; Sørensen, K.H.; Vianna Neto, J.X.; Kelly, M.; et al. Power curve and wake analyses of the Vestas multi-rotor demonstrator. Wind. Energy Sci. 2019, 4, 251–271. [Google Scholar] [CrossRef]
- Filsoof, O.T.; Hansen, M.H.; Yde, A.; Bøttcher, P.; Zhang, X. A novel methodology for analyzing modal dynamics of multi-rotor wind turbines. J. Sound Vib. 2021, 493, 115810. [Google Scholar] [CrossRef]
- Martín-San-Román, R.; Benito-Cia, P.; Azcona-Armendáriz, J.; Cuerva-Tejero, A. Validation of a free vortex filament wake module for the integrated simulation of multi-rotor wind turbines. Renew. Energy 2021, 179, 1706–1718. [Google Scholar] [CrossRef]
- Xie, C.; Wang, J.; E, W. Modeling subgrid-scale forces by spatial artificial neural networks in large eddy simulation of turbulence. Phys. Rev. Fluids 2020, 5, 054606. [Google Scholar] [CrossRef]
- Stevens, R.J.A.M.; Gayme, D.F.; Meneveau, C. Large eddy simulation studies of the effects of alignment and wind farm length. J. Renew. Sustain. Energy 2014, 6, 023105. [Google Scholar] [CrossRef] [Green Version]
- Ghaisas, N.S.; Ghate, A.S.; Lele, S.K. Large-eddy simulation study of multi-rotor wind turbines. In Journal of Physics: Conference Series; IOP Publishing: Bristol, UK, 2018; Volume 1037, p. 072021. [Google Scholar]
- Qian, Y.; Wang, T.; Yuan, Y.; Zhang, Y. Comparative study on wind turbine wakes using a modified partially-averaged Navier-Stokes method and large eddy simulation. Energy 2020, 206, 118147. [Google Scholar] [CrossRef]
- Sørensen, J.N.; Shen, W.Z. Numerical Modeling of Wind Turbine Wakes. J. Fluids Eng. 2002, 124, 393–399. [Google Scholar] [CrossRef]
- Keck, R.E. A numerical investigation of nacelle anemometry for a HAWT using actuator disc and line models in CFX. Renew. Energy 2012, 48, 72–84. [Google Scholar] [CrossRef]
- Ameur, K.; Masson, C. Effects of Wind Turbine Rotor Modelling on Nacelle Anemometry. Wind Eng. 2013, 37, 617–636. [Google Scholar] [CrossRef]
- Ivanell, S.; Sørensen, J.N.; Henningson, D. Numerical Computations of Wind Turbine Wakes. In Wind Energy; Peinke, J., Schaumann, P., Barth, S., Eds.; Springer: Berlin/Heidelberg, Germany, 2007; pp. 259–263. [Google Scholar]
- Lu, H.; Porté-Agel, F. Large-eddy simulation of a very large wind farm in a stable atmospheric boundary layer. Phys. Fluids 2011, 23, 065101. [Google Scholar] [CrossRef]
- Hebbar, U.; Rane, J.D.; Gandhi, F.; Sahni, O. Analysis of Interactional Aerodynamics in Multi-Rotor Wind Turbines using Large Eddy Simulations. In Proceedings of the AIAA Scitech 2020 Forum, Orlando, FL, USA, 6–10 January 2020; p. 1489. [Google Scholar] [CrossRef]
- Martínez-Tossas, L.A.; Churchfield, M.J.; Yilmaz, A.E.; Sarlak, H.; Johnson, P.L.; Sørensen, J.N.; Meyers, J.; Meneveau, C. Comparison of four large-eddy simulation research codes and effects of model coefficient and inflow turbulence in actuator-line-based wind turbine modeling. J. Renew. Sustain. Energy 2018, 10, 033301. [Google Scholar] [CrossRef]
- Qian, Y.; Wang, T. Large-eddy simulation of wind turbine wake and aerodynamic performance with actuator line method. J. Trans. Nanj. Univ. Aero. Astro. 2016, 33, 26–36. [Google Scholar]
- Duque, E.P.; Burklund, M.D.; Johnson, W. Navier-Stokes and comprehensive analysis performance predictions of the NREL phase VI experiment. J. Sol. Energy Eng. 2003, 125, 457–467. [Google Scholar] [CrossRef]
- Troldborg, N.; Larsen, G.C.; Madsen, H.A.; Hansen, K.S.; Sørensen, J.N.; Mikkelsen, R. Numerical simulations of wake interaction between two wind turbines at various inflow conditions. Wind Energy 2011, 14, 859–876. [Google Scholar] [CrossRef]
Figure 1.
Illustration of the computational domain.

Figure 2.
Layout diagram of co-planar twin- and tri-rotor wind turbine setups.

Figure 3.
Comparison of simulation and experimental results.

Figure 4.
Velocity contour in the x-y plane of the twin-rotor turbine near the wake at z = 12.2 m.

Figure 5.
The vortex contour at z = 12.2 m: (a) Single-rotor; and (b) twin-rotors.

Figure 6.
Near-wake: (a) Twin-rotors; and (b) tri-rotors.

Figure 7.
Torque–Azimuth angle: (a) Twin-rotor; and (b) tri-rotor wind turbine.

Figure 8.
Comparison of torque and CL of single- and twin-rotor wind turbines in blade spreading direction: (a) Torque; and (b) CL.
Figure 8.
Comparison of torque and CL of single- and twin-rotor wind turbines in blade spreading direction: (a) Torque; and (b) CL.

Figure 9.
Thrust–Azimuth angle: (a) Twin-rotor; and (b) tri-rotor wind turbine.

Figure 10.
Near-wake with rotor spacing of 0.2 R.

Figure 11.
Torque–Azimuth Angle.


Table 1.
Parameters of phase VI [40].
Table 1.
Parameters of phase VI [40].
| Parameter | Phase VI Rotor |
|---|---|
| Number of blades | 2 |
| Rotor radius/m | 5.029 |
| Rated rotate speed/(r · min) | 72 |
| Time step/s | 0.002318 |
| Number of actuator points | 60 |
Publisher’s Note: MDPI stays neutral with regard to jurisdictional claims in published maps and institutional affiliations. |
© 2022 by the authors. Licensee MDPI, Basel, Switzerland. This article is an open access article distributed under the terms and conditions of the Creative Commons Attribution (CC BY) license (https://creativecommons.org/licenses/by/4.0/).
Share and Cite
MDPI and ACS Style
Zhang, Y.; Cai, X.; Lin, S.; Wang, Y.; Guo, X. CFD Simulation of Co-Planar Multi-Rotor Wind Turbine Aerodynamic Performance Based on ALM Method. Energies 2022, 15, 6422. https://doi.org/10.3390/en15176422
AMA Style
Zhang Y, Cai X, Lin S, Wang Y, Guo X. CFD Simulation of Co-Planar Multi-Rotor Wind Turbine Aerodynamic Performance Based on ALM Method. Energies. 2022; 15(17):6422. https://doi.org/10.3390/en15176422
Chicago/Turabian StyleZhang, Yuan, Xin Cai, Shifa Lin, Yazhou Wang, and Xingwen Guo. 2022. "CFD Simulation of Co-Planar Multi-Rotor Wind Turbine Aerodynamic Performance Based on ALM Method" Energies 15, no. 17: 6422. https://doi.org/10.3390/en15176422
Note that from the first issue of 2016, this journal uses article numbers instead of page numbers. See further details here.