1. Introduction
Client load profiles describe client behavior, which is fundamental for electricity supply companies, because by using this data the companies can estimate when and at what time their clients require electric energy [
1]. This information is useful for both the planning and operation of electrical networks, optimizing the electrical systems [
2,
3]. With the arrival of smart meters (SM), electricity companies obtain more information on their customers’ consumption profiles, which is an advantage compared to previous years [
2]. From this new information provided by the SM, it is possible to characterize the consumption curves of clients for any specific day, through obtaining energy measurements every 15 min, which implies a total of 96 measurements per day for each client. The study data were obtained using the Aclara/Waion instrument with the Trilliant RPMA communication, according to the Chilean standard sampling time of 15 min for these data.
The presence of distributed generation (DG) in some of the clients of the system under study impacts the behavior of the load profiles, which is relevant and interesting to analyze [
4]. However, these types of customers are not considered in this work due to the low number of them in the available database [
5].
The purpose of this work is to analyze non-residential customer load profiles, grouping and classifying them to identify their typical profiles. These results are important because the associated company can identify the consumption profiles of its customers, update them, and contemplate the new consumption profile characteristics, which are closely related to the current energy demand. Thus, this paper contributes to the field of identifying and categorizing different customers’ behavior to optimize electric company resources and, therefore, carry out proper planning and operation of the distribution lines.
2. Related Work
Distribution companies take advantage of knowing their customers’ behavior, because they optimize decisions to keep energy flowing to customers within the limits of voltage amplitude and frequency [
3,
6]. In [
7], the authors propose an algorithm to identify typical consumption patterns in electricity customers, in order to classify them according to their consumption profile. Data mining is employed to process the collected information and eliminate the incorrect data, to obtain only the relevant information for electric energy management. The authors in [
8] propose creating subcategories within the same main category of customers (e.g., industrial, commercial, among others), in addition to proposing the consideration of the curve’s average for typical days of the year (e.g., working days, Saturdays, holidays, or Sundays). In [
9], the authors apply the K-means methodology to classify consumption profiles, considering valid samples of customers, and giving a range between 0% and 10% of missing data. In [
10], the authors propose a new client grouping method, known as “affinity propagation” (AP), which groups the client load data and generates new typical load profiles (TLP). The AP methodology does not need a predefined number of clusters (groups), as it is a deterministic iterative method. AP takes advantage of the pairwise similarity between data points and a set of preference measures. Indices are also used to determine the number of clusters to group. The indices used are: Silhouette, Calinski–Harabasz, Davis–Bouldin, Dunn index, WCBCR, and CDI [
11,
12]. Thus, this work considers the contributions given by several authors, already analyzed, but with the aim to be applied in a specific case study of customers connected to the Chilean SAESA electric distribution energy company. Furthermore, the results display important information to optimize the decisions taken in both areas: economical and technical.
3. Load Profile
A load profile is defined as a curve that represents the power consumption of a particular customer as a function of time, which can be daily, weekly, monthly, or even annually. Electric power distribution companies consider different categories of customers based on their consumption curve, the most typical of which are residential, commercial, industrial, and retail. Each of the customers specified above have different behaviors, since these depend specifically on their operating cycles in activities and power requirements. The consumption profile depends on various factors, for example, the consumption habits of the users, socioeconomic levels, sociocultural aspects, the climate of the region, the productive sector, and the size of the company, among others [
13,
14]. The significant growth that the incorporation of energy sources near consumption centers or distributed generation (DG) has had, such as the penetration of the electric vehicle (EV), storage equipment (batteries), air conditioning systems, and smart appliances, has caused changes in the consumption patterns of practically all customers connected to distribution networks [
8]. This new energy scenario, which has become more dynamic, means that electricity distribution companies must have a system that allows them to know, with greater certainty, the consumption profiles of their clients, in order to optimize the operation and planning of their electrical infrastructure.
4. Present Load Profile in the Distribution Company
The consumption data provided by the distribution company, SASEA Group S.A., for the 934 customers in the period from January to December 2019, allow the identification and classification of the current consumption profiles of customers connected to their distribution networks. These data are compared with the historical profiles that the company has used for its planning and operations for the electrical network.
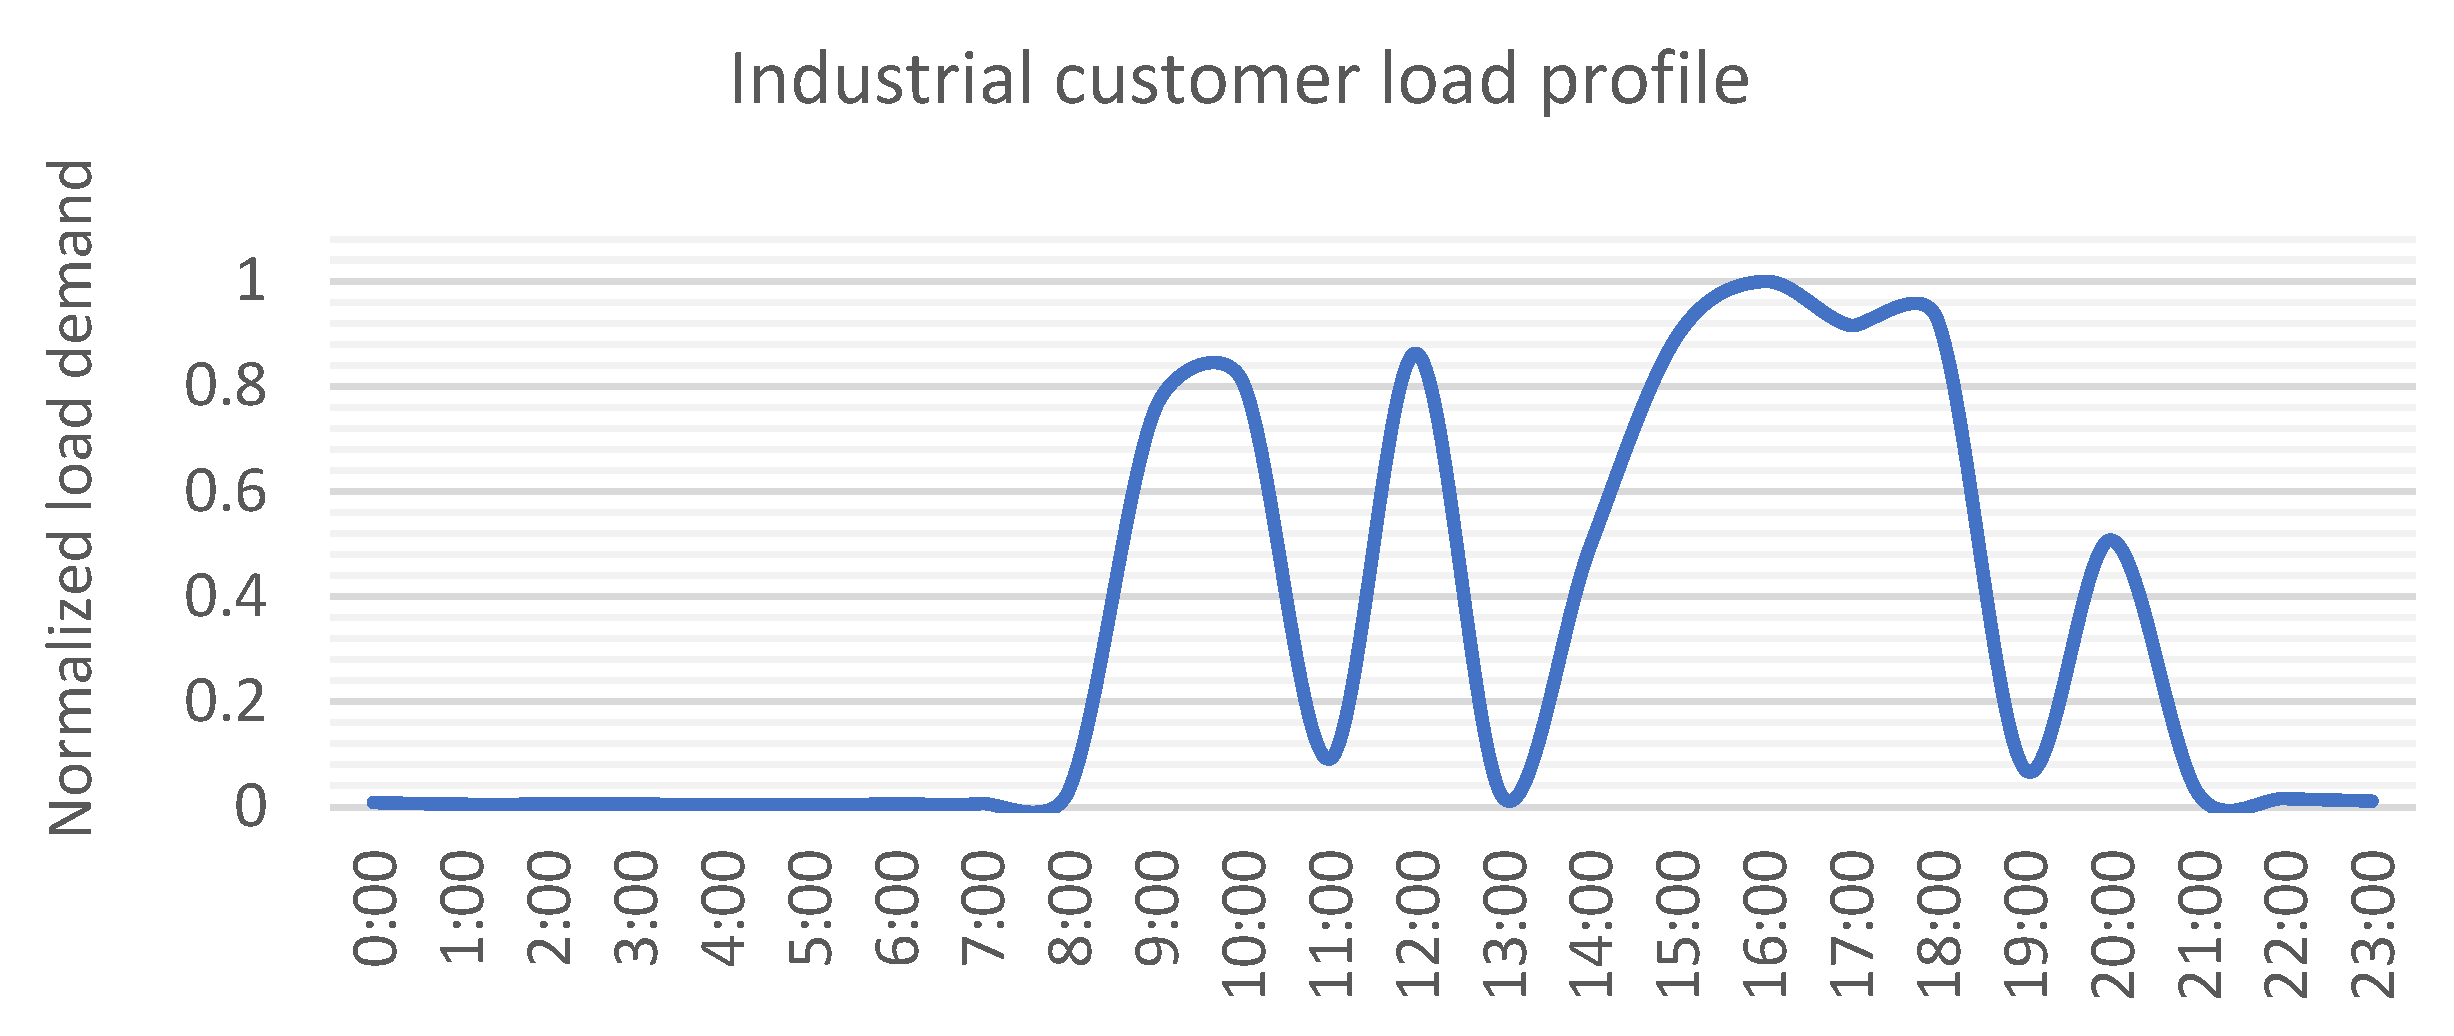
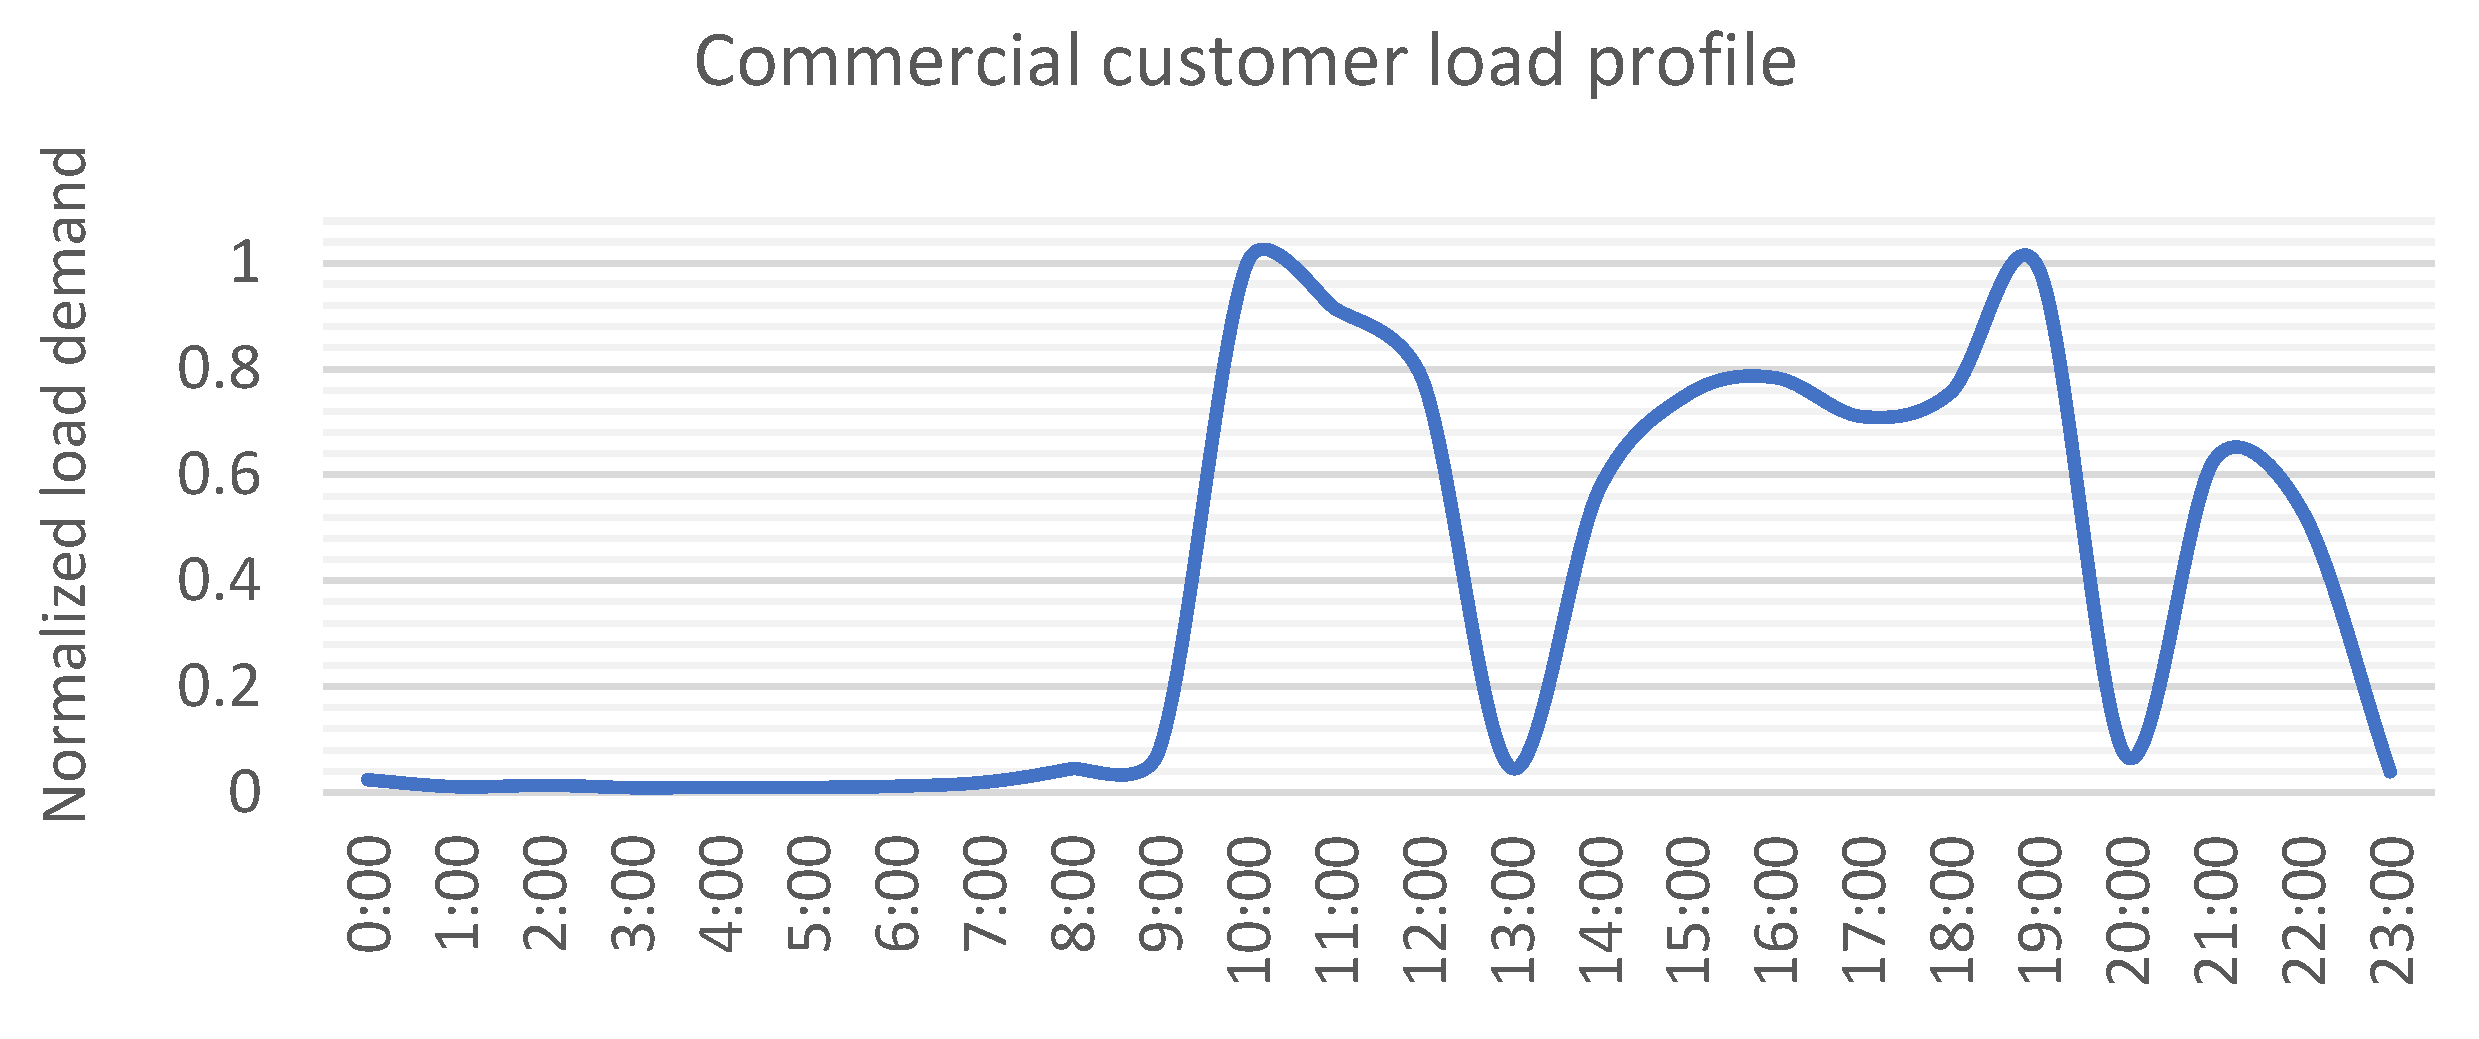
Figure 1 and
Figure 2 represent the actual consumption profiles that the company considers for industrial and commercial customers, respectively. These profiles were obtained by modeling some data that the company previously acquired from customers. It highlights the fact that, considering the entire year, there is only one characteristic profile for each client, unlike what is presented in this methodology, which presents more than one characteristic profile for different typical days of the year.
5. Data Set
The data used in this work are provided by the SAESA Group S.A. company. This company has around 6700 clients with smart meters installed, among which there are also clients who present DG installations. The information collected by smart meters corresponds to measurements with intervals of 15 min (as standardized in Chile), saving active and reactive energy, and considering the injections and consumption by customers. In addition, complementary information is available such as: commune, contracted rate, connected power, economic activity, and constant of amplification. For this work, the two types of information (consumption and contract) described above are provided: Excel spreadsheets with the energy measurements of the clients, and an Excel spreadsheet with the complementary data of each client. The information to be used is treated confidentially and anonymously by the authors.
6. Methodology and Applications
The study follows the steps mentioned below.
6.1. Information Notation
To simplify the notation of each client and period in each situation, the following notation is defined:
Client type
I1: Industrial client with installed power ≤ 10 kW.
I2: Industrial client with installed power > 10 kW.
C1: Commercial client with installed power ≤ 10 kW.
C2: Commercial client with installed power >10 kW.
Trimester
TI: Trimester 1 (January to March).
T2: Trimester 2 (April to June).
T3: Trimester 3 (July to September).
T4: Trimester 4 (October to December).
Type of day
D: Sunday or holiday.
L: Working day.
S: Saturday.
6.2. Client Selection
The clients selected for this analysis are those classified as non-residential, these being commercial and industrial. As the first criterion to determine which ones will be considered in the analysis, a minimum of 80% valid pulses are established for each period under study, leaving a total of 960 clients to analyze, which are separated into 853 commercial clients and 107 industrial clients. Subsequently, those clients that have measurements with null average curves, that is, zero value for the entire measurement range [
8], measurements with negative values, and also those that have less than 20 different values in the measurement intervals for each typical day, are not considered for this analysis [
9]. Finally, valid clients are those who have at least one typical day profile for each quarter under study [
8]. It is decided not to consider all those customers who have special rates, because they could have unusual consumption behaviors that distort the analysis. Given that, in the database, there are clients with installed power less than 10 kW, and what is expected for a non-residential client is that their installed power is greater than 10 kW, it is decided to divide this analysis according to the installed power, being 10 kW, which is the threshold determined by each group. Thus, in view of the threshold of 10 kW, differences between the behavior of customers under this differentiation criterion can be found.
Table 1 summarizes the categories and number of clients considered under these conditions.
6.3. Selection of Study Variable
Considering that the data delivered corresponded to energy measurements (active), Equation (1) is used to obtain the active powers for each 15 min block, with this value representing the demand of each client in the period obtained:
where P
a corresponds to the active demand in the 15 min interval required by the customer in kW, E
d is the active energy consumed by the customer in kWh, E
r is the active energy injected by the customer into the grid in kWh, and
cte is the amplification constant for each measurement according to the meter used. The number 4 that appears in the equation is obtained by rearranging the variables, considering that the pulses of 15 min correspond to ¼ of an hour. All transformations and calculations are carried out using the Power Bi platform.
6.4. Typical Days Considered
Typical days are defined for the period under study, considering a data range of one year for smart measurements. Taking as a reference what is proposed by [
8], it is decided to divide the year into 4 periods, that is, summer, autumn, winter, and spring, considering 3 typical days for each season, these being: working day, Saturday, and Sunday or holiday. In summary, 12 typical days are analyzed for this study, which are detailed in
Table 2.
To obtain the typical curves of each client, the Power Bi platform is used again. In this platform, all the databases from the customer measurements are joined, visualized, and used to generate the average curves for each customer according to the typical day under study.
6.5. Modeling the Average Consumption Curves
In this stage, the average customer demand profiles are generated and displayed, which are obtained by averaging the measurement curves in real time, for each typical day considered.
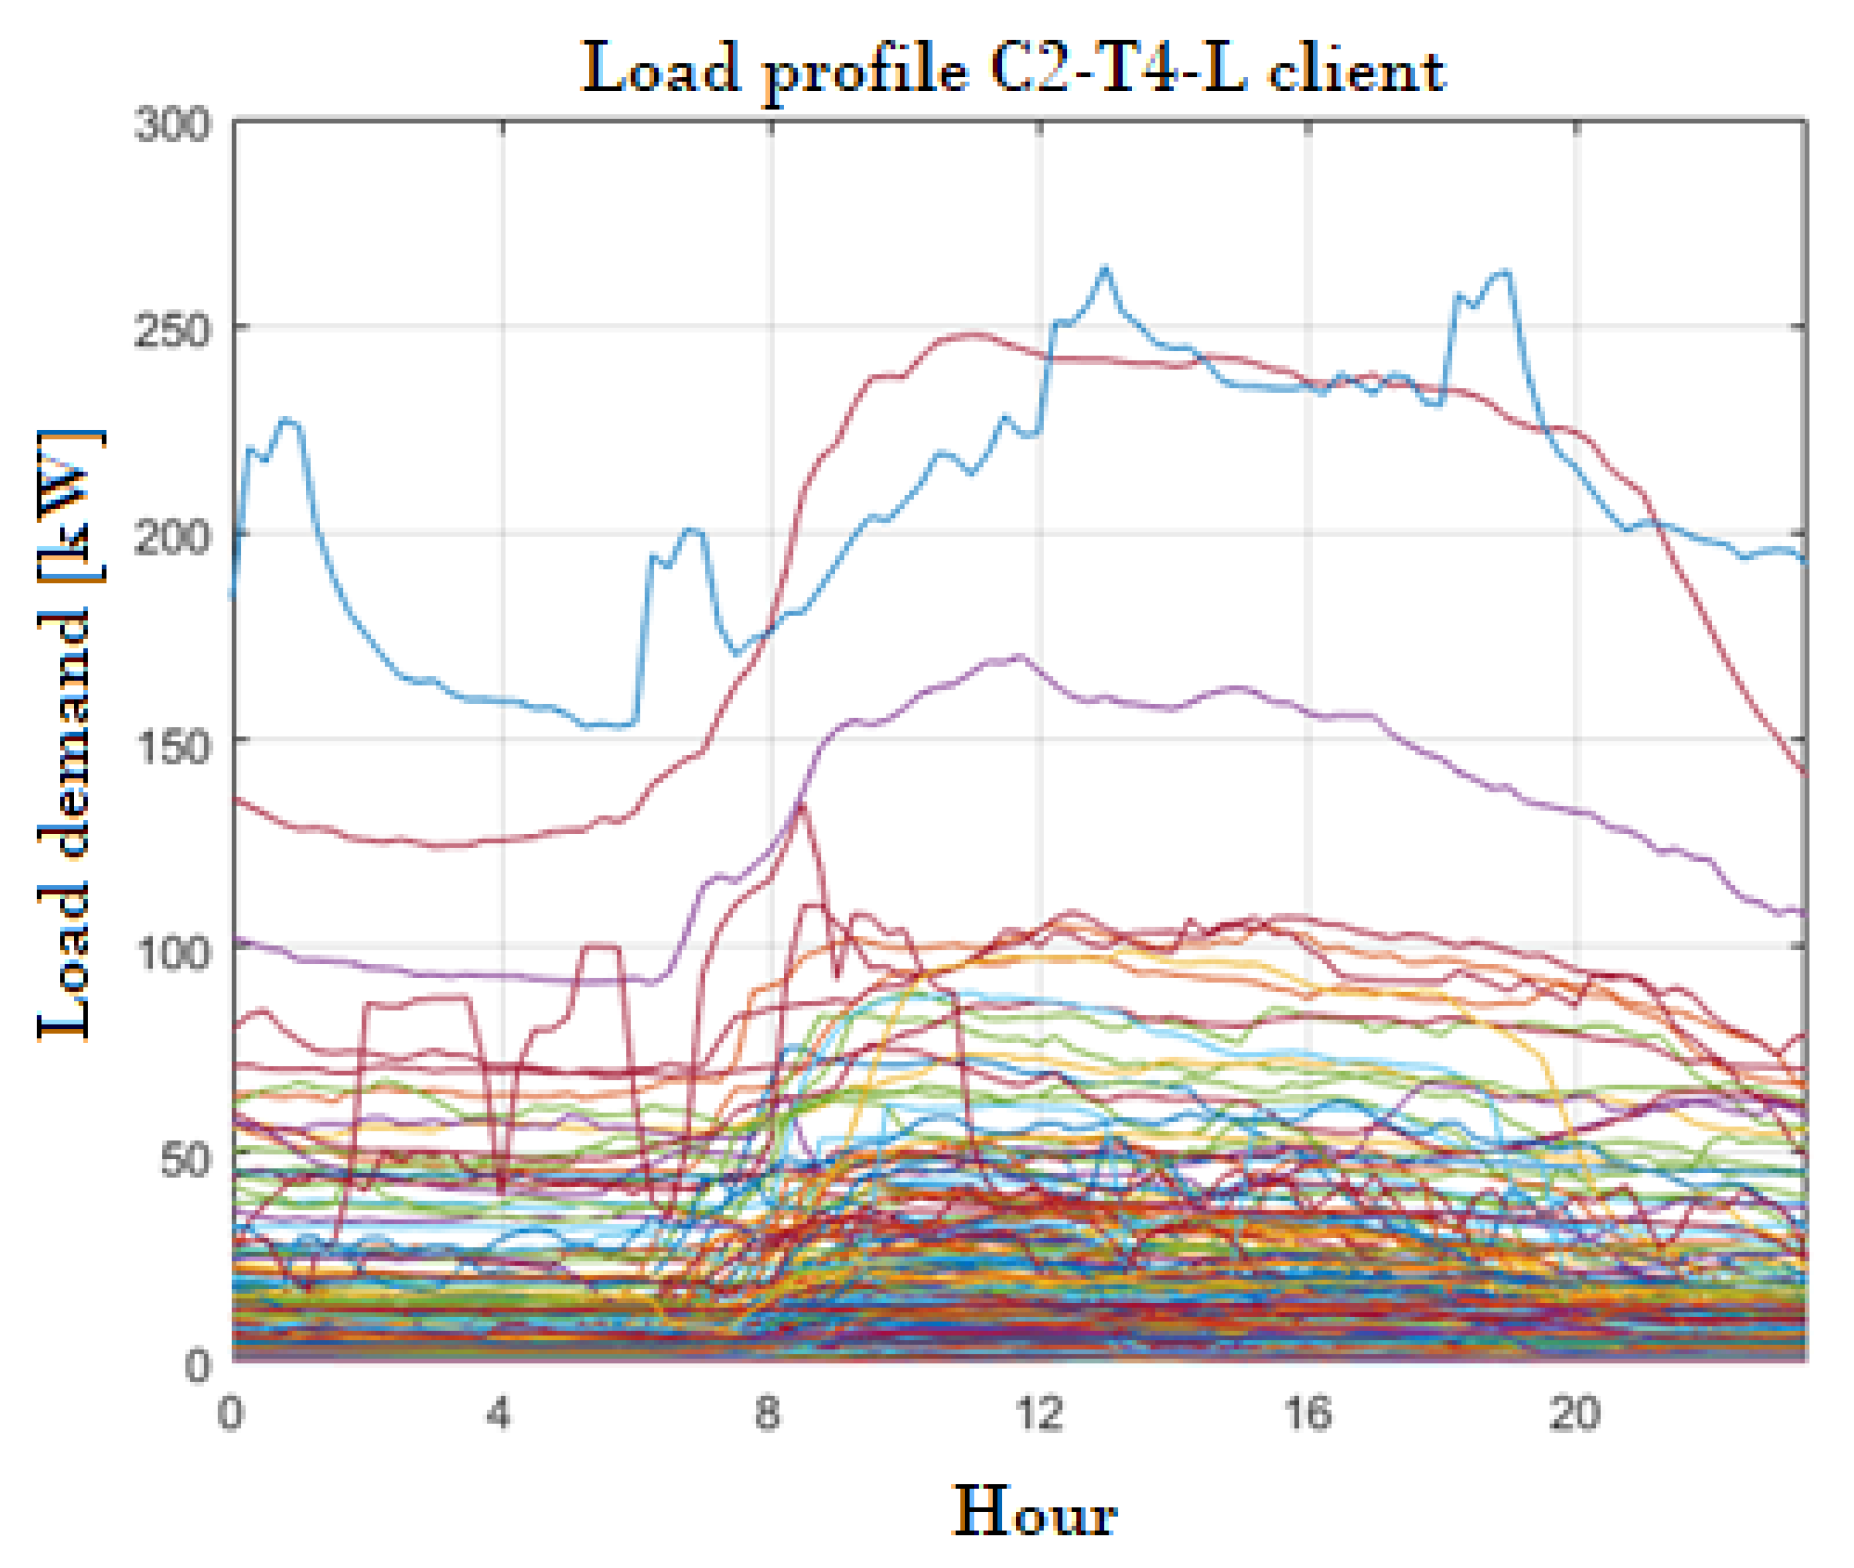
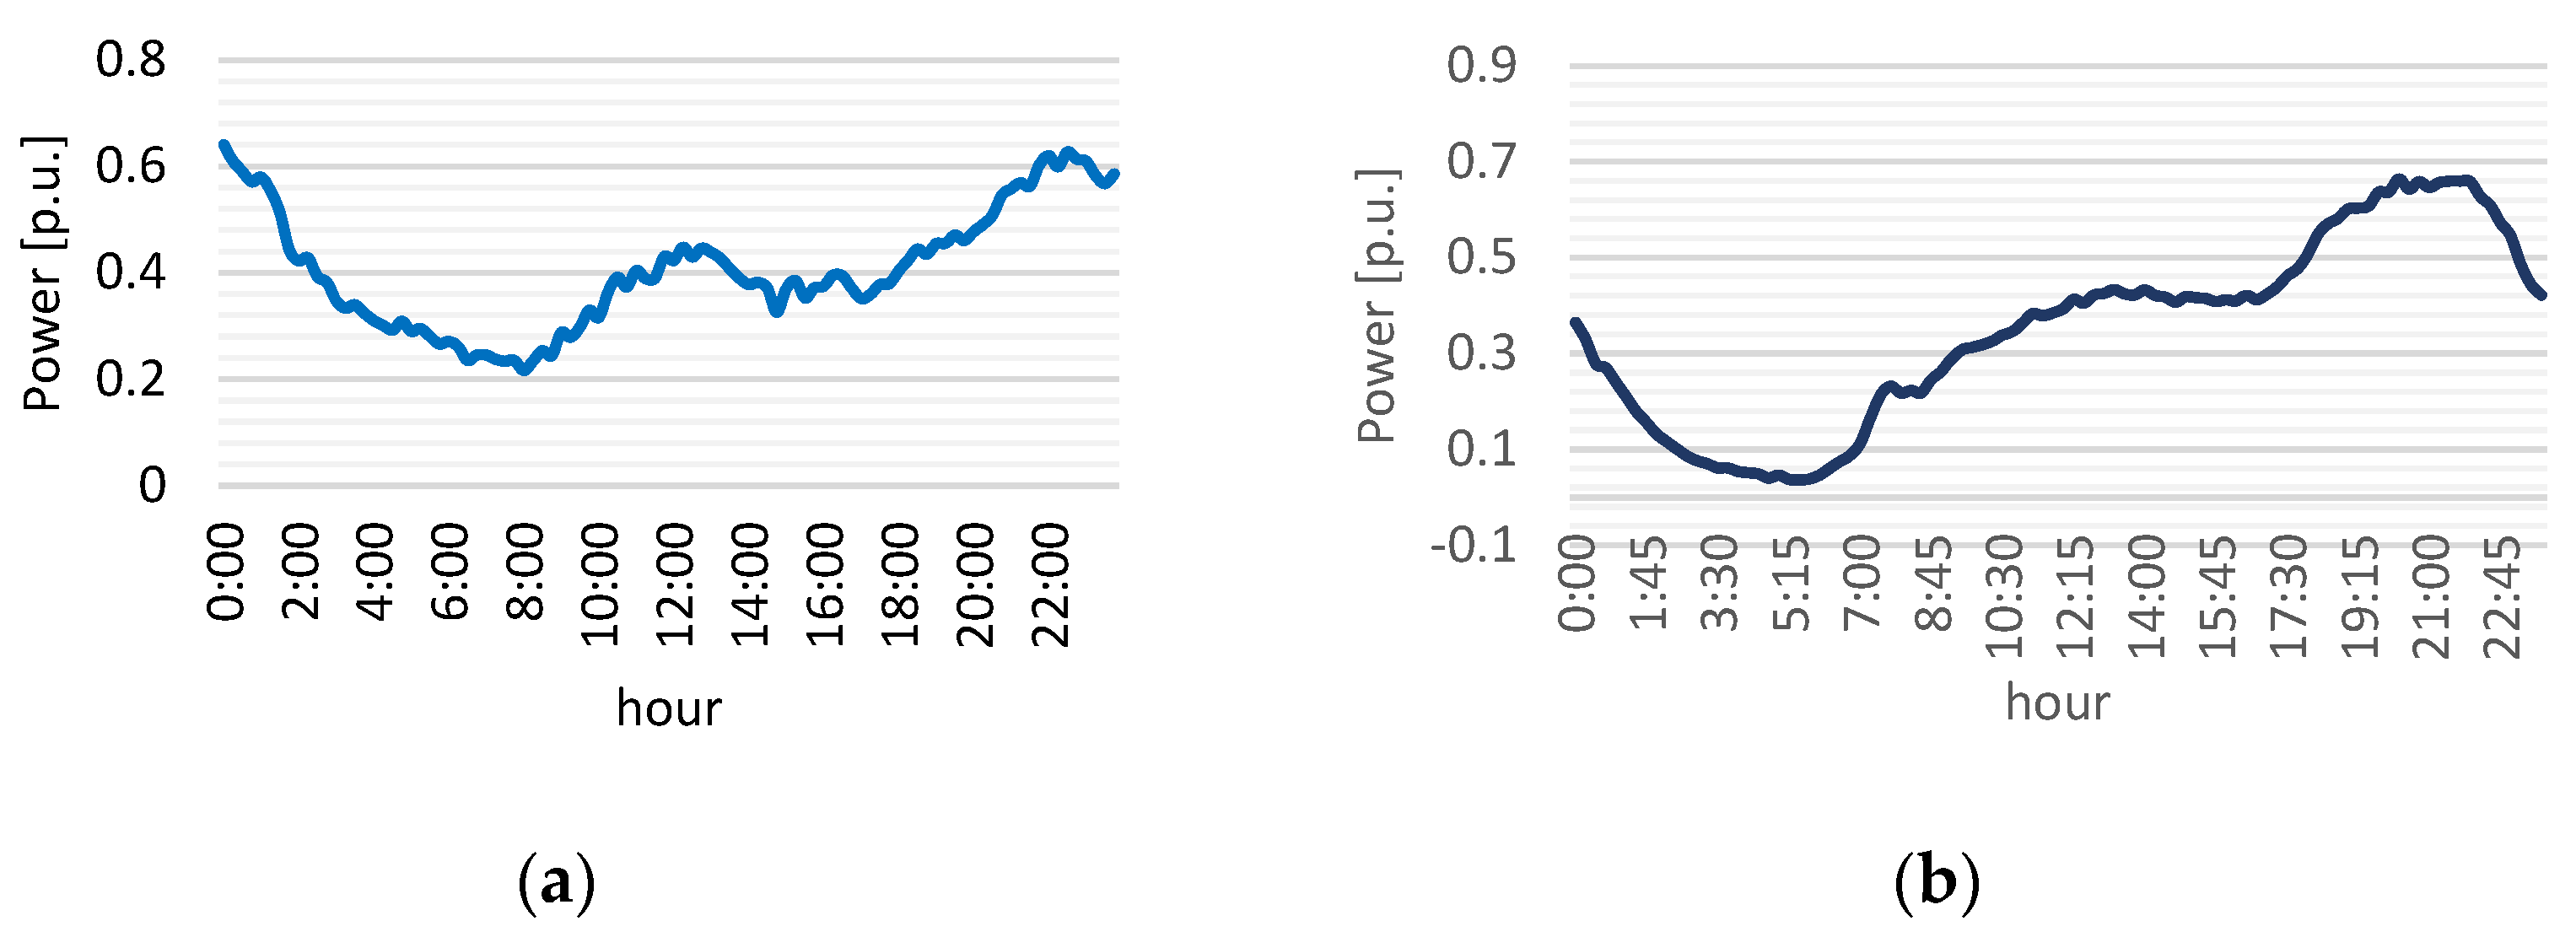
Figure 3 shows the set of representative profiles of commercial customers with installed power greater than 10 kW, considered in this work. These profiles correspond to a business day in the fourth quarter of 2019, with real demand and normalized demand, respectively.
6.6. Normalization of Average Curves
For the analysis of the load profiles, and their subsequent classification, it is necessary that all customer curves are normalized in order to achieve a set of comparable curves. Considering that the relevant characteristic of the analysis is the shape of the curve, no attention is paid to the curve magnitudes; therefore, it is decided to normalize the data in order to obtain measurements in the interval between 0 and 1. To achieve this mathematical transformation, the Min–Max transformation shown in [
13] is used, programmed in Matlab
®.
6.7. Determining the Number of Groups for Clustering
To determine the optimal number of clusters (k) in each analyzed case, typical validation indices are used in the clustering work to determine the number of groups that gives the best results. The employed indices in this stage are: Silhouette index, Davies–Bouldin index, Calinski–Harabasz index, and a variation of the root mean square error (RMSE) index, created to previously evaluate the best performance of k [
8]. The range of k is fixed in the interval between 1 and 5.
Table 3 and
Table 4 summarize the values obtained for k, for industrial and commercial customers, respectively.
6.8. Clustering of Curves Using K-Means
The average consumption profiles for each client, and considering the typical days to be studied, are grouped using the K-means algorithm [
13], using a city block distance as a measure of similarity.
Figure 4 shows the client clustering results obtained, the three groups obtained, and the characteristic centroid of each group. The centroids of each group are marked in blue in each grouping figure.
7. Results
According to the results obtained, using K-means, six profiles are obtained for non-residential clients. The data are segmented into two macro categories: customers with installed power less than or equal to 10 kW, and customers with installed power greater than 10 kW. This separation is performed to identify differences between these types of customers. The results obtained are shown in
Figure 5,
Figure 6,
Figure 7,
Figure 8,
Figure 9 and
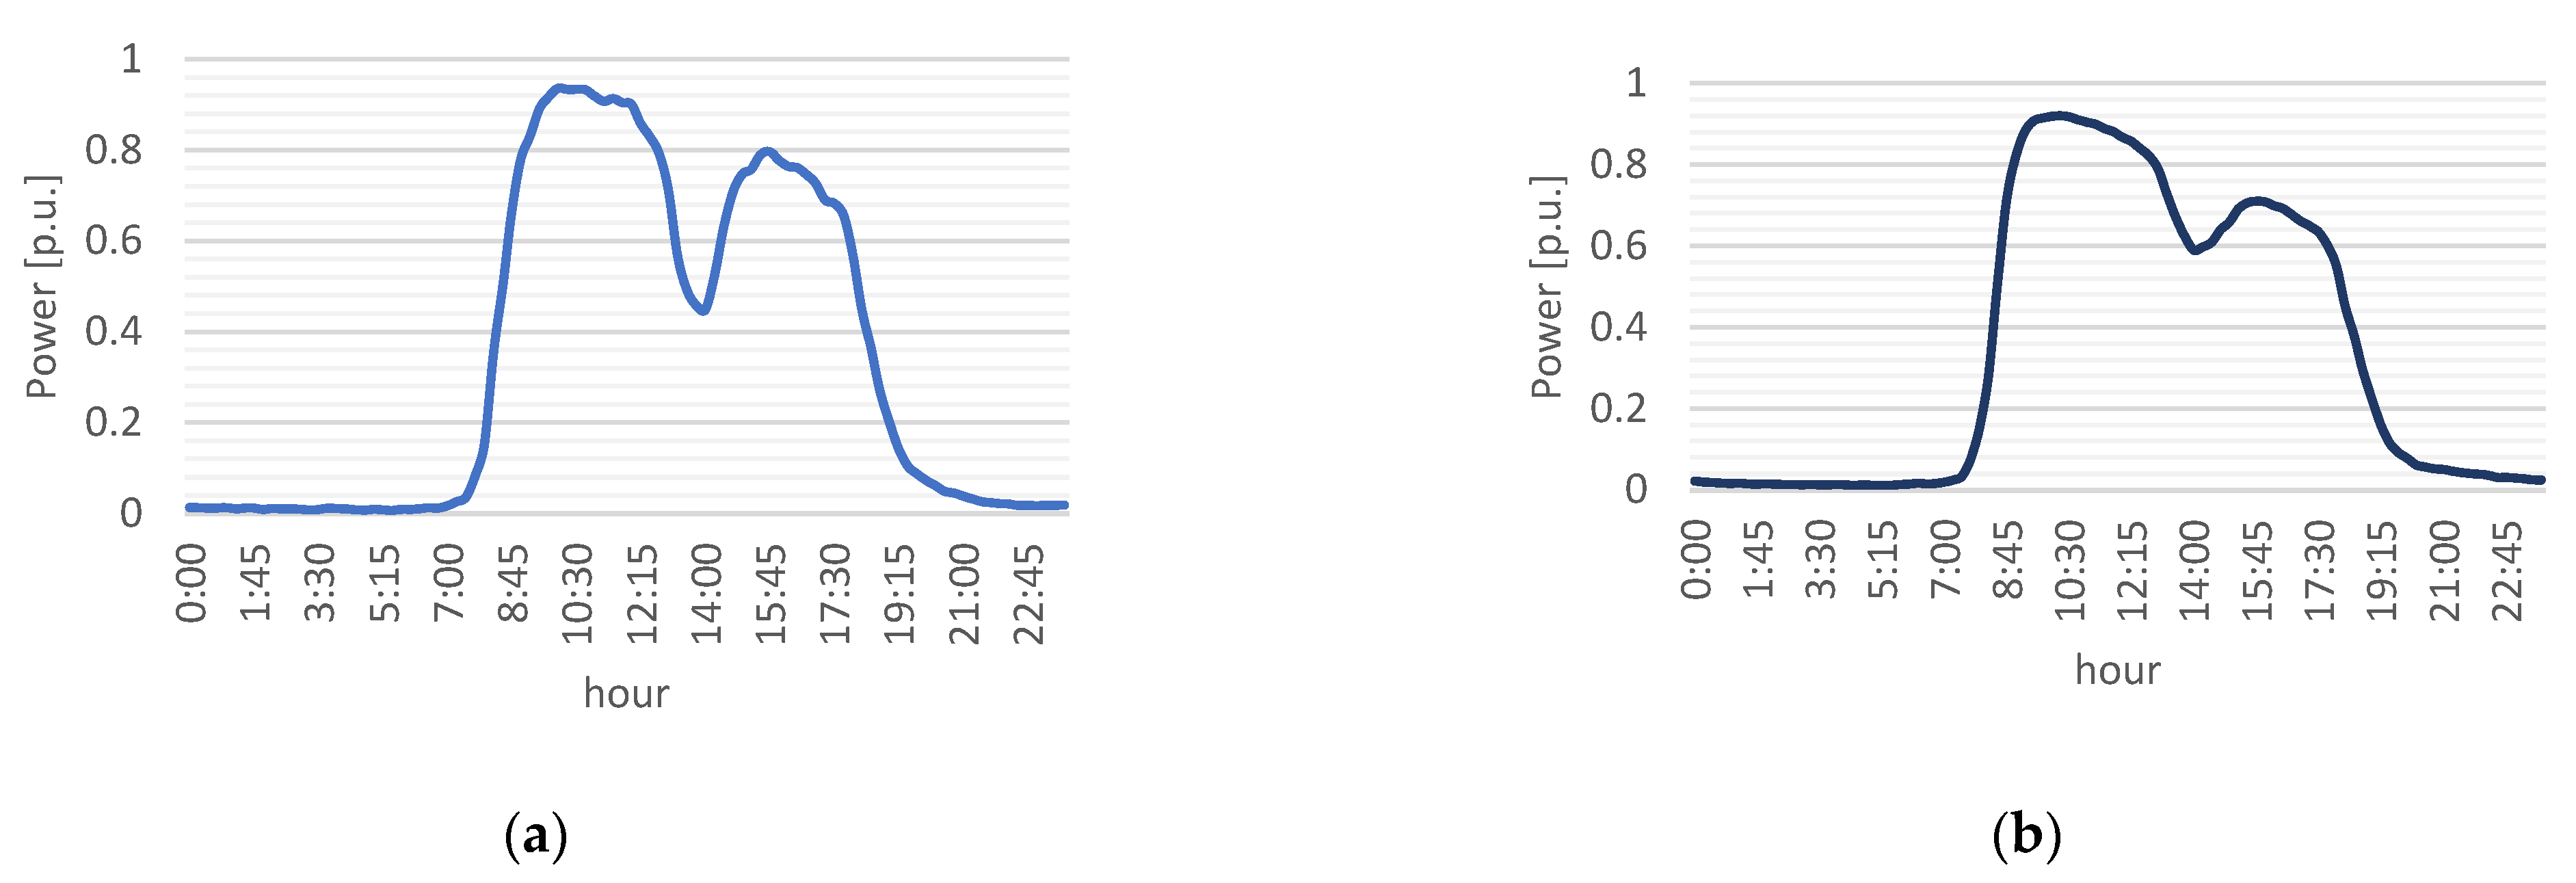
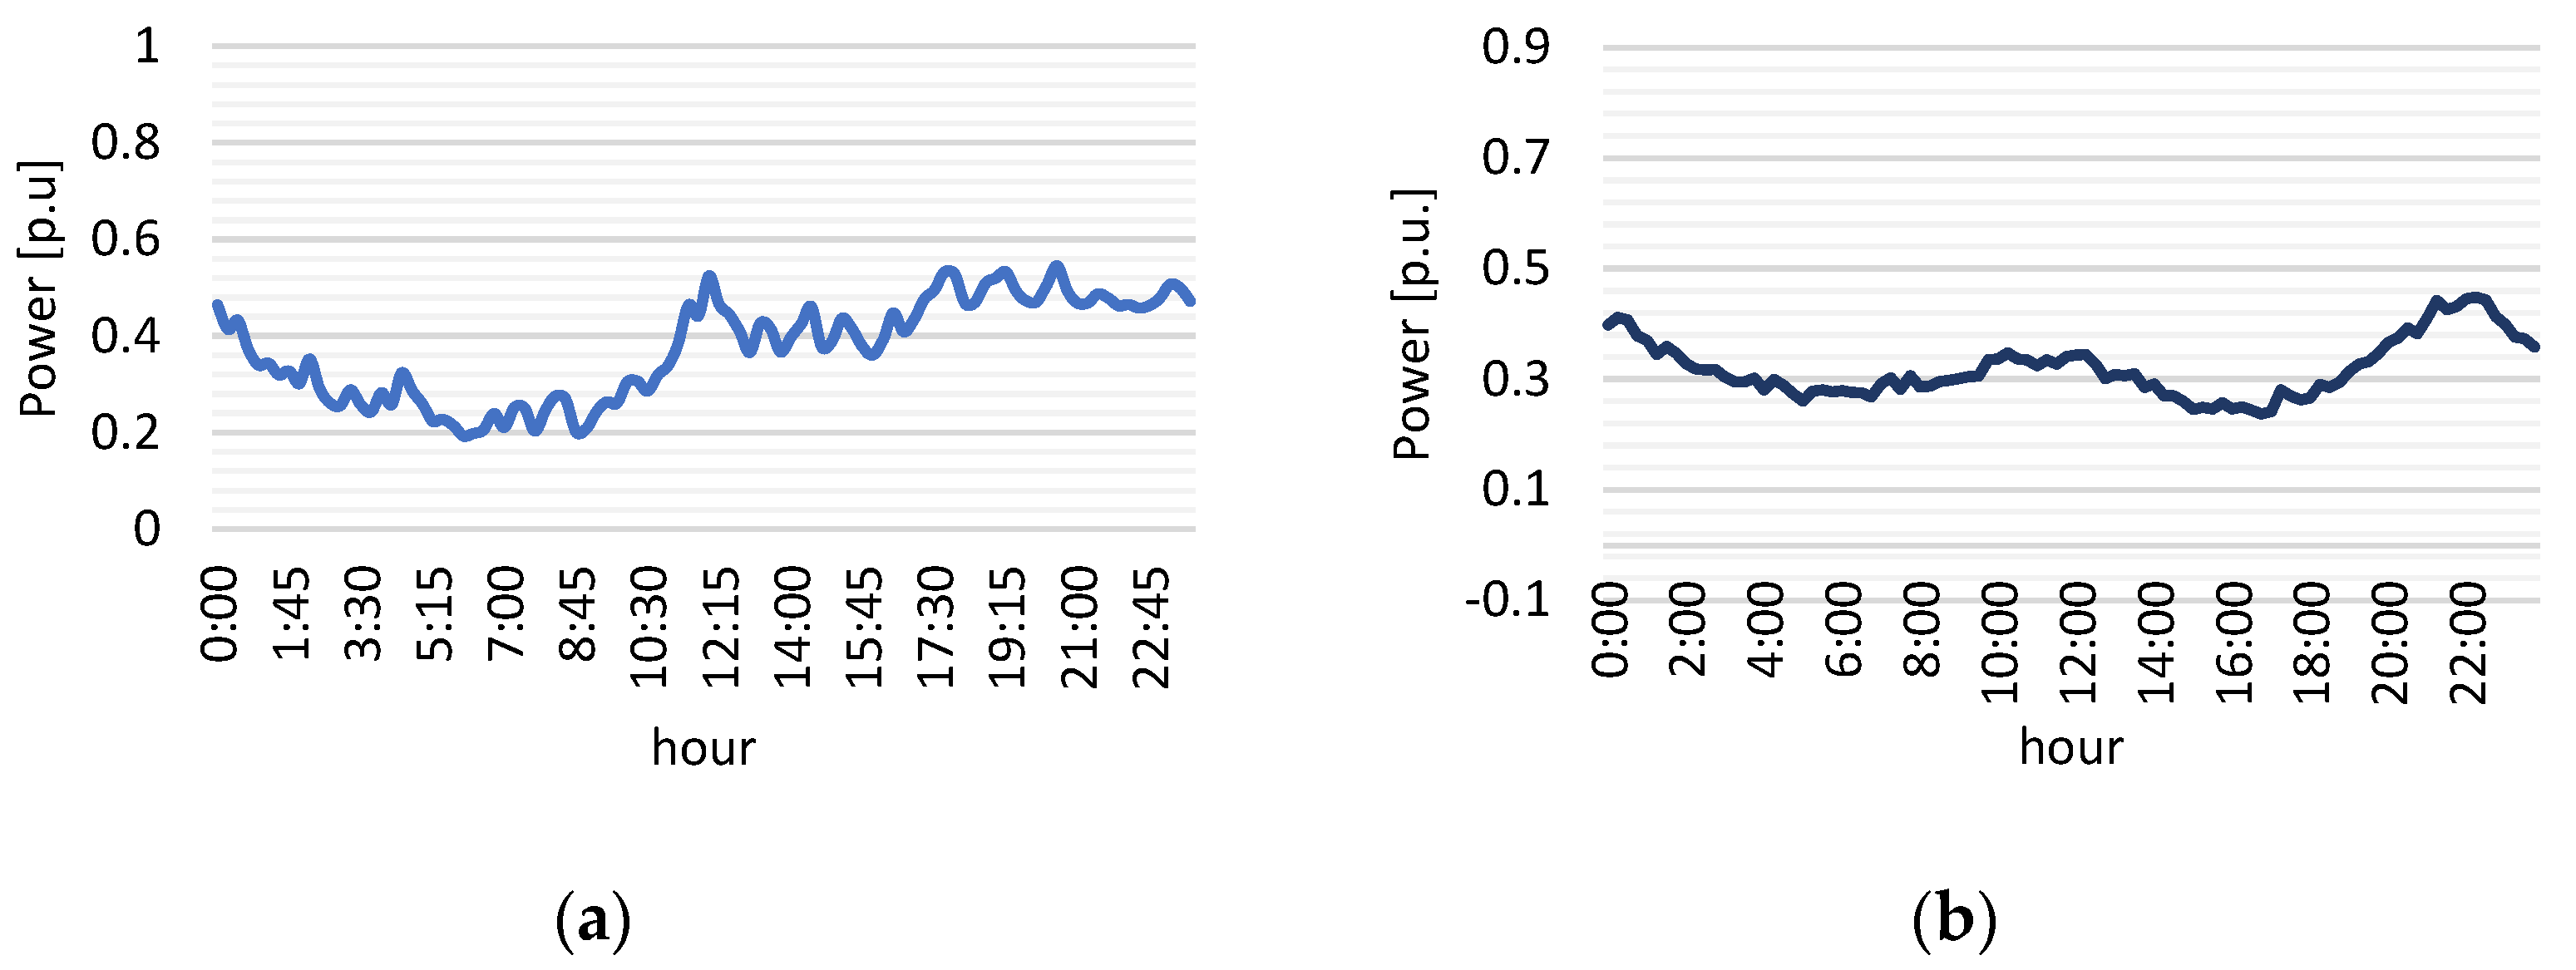
Figure 10. To facilitate the comparison of the curves, on the left side is the figure corresponding to the industrial customer, while on the right side is the one corresponding to the commercial customer. The M-type profile (
Figure 5) represents a well-defined working day, with two moments of high demand, separated by lunchtime when the demand decreases. During the hours when there are less processes or work, the demand decreases by 33% in commercial clients and by 50% in industrial clients.
The Mount-type profile (industrial client) (
Figure 6) represents a working day with a more constant behavior during most of the day, starting at 08:00 h and having peaks in demand around noon. Unlike the M-type profile, this profile does not suffer a decrease in demand at midday, which implies that they are industries or businesses that have active processes throughout the working day.
The U-type profile,
Figure 7, represents an unusual behavior, more similar to the consumption profile of public lighting, because it shows high consumption at night and low consumption during the typical working day. This profile represents evidence of high levels of night demand due to lighting and/or security systems.
The Residential-type profile (
Figure 8) shows a behavior that is not expected in non-residential customers since the form of consumption is similar to that expected in a residential customer, so it could be suggested as a hypothesis that these customers are purely residential, but they are classified as industrial or commercial for some specific reason or error in the database. Approximately 30% of the industrial clients presented this type of profile, while in the commercial clients the percentage was 35% (the percentages correspond to the total number of clients with installed power less than or equal to 10 kW).
The Slim mount profile (
Figure 9) represents an expected behavior in non-residential clients, where a half-day work shift is observed, reaching its peak value at approximately 12:00 h, and then decreasing its demand until the end of working hours (4:00 p.m. for industrial clients, and 6:00 p.m. for commercial clients).
The “W-type profile” (
Figure 10) represents a demand with similar values during the day, which does not show a noticeable change in customer demand. Possibly, this profile groups clients with different and irregular behaviors, which are represented by the curve obtained.
Table 5 summarizes the results obtained, in percentages, including the calculated variance values, for the profiles obtained for customers with installed power greater than 10 kW.
8. Comments and Conclusions
The contribution of this work is to find new consumption profiles for non-residential customers, of the SAESA Group S.A. Company, considered in this study. It can be said that there is more than one profile that represents industrial and commercial clients during the different typical days considered. It can be noted, from the recorded data, that seven behavior curves of non-residential customers are identified that allow the optimization of both the planning and the operation of the electrical infrastructure, which is based on assuming a single typical behavior, in various conditions, such as over-sized or under-sized infrastructure, with all of the costs that this implies. In some identified profiles, there is a similarity in both commercial and industrial clients.
According to the results, behaviors similar to those of a residential customer are observed in non-residential customers with installed power less than or equal to 10 kW, which allows us to deduce that these customers are misallocated to this category and are residential customers.
The M-type profile, obtained for the working day, is the profile that is most representative of the analyzed clients, reaching 71.44% in industrial clients and 51.6% in commercial clients. It is also highlighted that these profiles always present a lower variance compared to the rest of the profiles obtained, having a value of 0.0304 and 0.0307, respectively.
Separating the analysis of customer profiles into typical days (Sundays and holidays, business days, and Saturdays) is relevant since, from the results, it is demonstrated that the profiles vary considerably between each day under study. Consequently, this segmentation is necessary since it allows distribution companies to know the different behaviors of a customer during the week.
Finally, it can be stated that customer behavior is varied, which implies that a single profile cannot correctly represent a category of non-residential customers and, therefore, cannot obtain a close approximation of customers’ behaviors which will allow companies to optimize and plan the management and operation of the distribution lines. Nonetheless, the aforementioned can also be extended to other companies, as well as other countries, thus improving the distribution lines’ capacities by properly managing the electric energy flow.
9. Future Work
A direction for future work is to consider the effect of the COVID-19 pandemic on load profiles during 2020 and 2021, given that, because of health measures, both the commercial and industrial sectors have seen their operating hours and energy requirements alter. This would mean a modification in the load profiles of these clients.
Another proposal is to apply the same methodology, segmenting customers only according to the contracted rates, and not according to the commercial–industrial label.
Finally, analyzing and developing new profiles of customer behavior considering those with distributed generation is a potential topic of future study, because the database available for this work does not have the measurements for this type of customer. It is expected that the presence of this modality will imply a change in the shape of the consumption profiles.
Author Contributions
The authors of the paper contributed to the development in the following ways: L.G.-S., conceptualization, formal analysis, investigation, and methodology; J.S.M.-A., data curation, formal analysis, and writing—original draft; F.U.-V., formal analysis; D.C., validation, methodology, and investigation; V.E., validation and writing—review and editing; J.R., methodology, formal analysis, and writing—review and editing; C.M., data curation, funding acquisition, and supervision. All authors have read and agreed to the published version of the manuscript.
Funding
The authors wish to acknowledge the financial support given by the Company SAESA Group S.A.
Institutional Review Board Statement
Not applicable.
Informed Consent Statement
Not applicable.
Data Availability Statement
The data presented in this study are available on request from the corresponding author. The data are not publicly available due to containing confidential information of the SAESA Group company and its clients.
Acknowledgments
The data presented in this study are available on request from the corresponding author. The data are not publicly available due to contains confidential information of the company SAESA and its clients. Finally, the authors wish to thank the support from the Universidad de Concepción and the Universidad del Bío-Bío through projects 2060119 IF/R and 2160180 GI/EF-UBB.
Conflicts of Interest
The authors declare no conflict of interest.
References
- Fan, Y.; Mengnuo, D.; Pei, G.; Zhang, Z.; Yingying, L.; Xiao, W. The Influence on Distribution Network Planning and Investment Strategy of Power Grid Corp Under Electric Power System Reform. In Proceedings of the 2018 China International Conference on Electricity Distribution (CICED), Tianjin, China, 17–19 September 2018; pp. 2426–2430. [Google Scholar]
- Luan, W.; Peng, J.; Maras, M.; Lo, J.; Harapnuk, B. Smart Meter Data Analytics for Distribution Network Connectivity Verification. IEEE Trans. Smart Grid 2015, 6, 1964–1971. [Google Scholar] [CrossRef]
- Keane, A.; Ochoa, L.F.; Borges, C.L.T.; Ault, G.W.; Alarcon-Rodriguez, A.D.; Currie, R.A.F.; Pilo, F.; Dent, C.; Harrison, G.P. State-of-the-Art Techniques and Challenges Ahead for Distributed Generation Planning and Optimization. IEEE Trans. Power Syst. 2013, 28, 1493–1502. [Google Scholar] [CrossRef]
- Mak, S.T. Smart meters serving as synchro-sensors for Smart Distribution Grid applications. In Proceedings of the 2011 IEEE Power and Energy Society General Meeting, Detroit, MI, USA, 24–28 July 2011; pp. 1–3. [Google Scholar]
- Yassine, A.; Nazari Shirehjini, A.A.; Shirmohammadi, S. Smart Meters Big Data: Game Theoretic Model for Fair Data Sharing in Deregulated Smart Grids. IEEE Access 2015, 3, 2743–2754. [Google Scholar] [CrossRef]
- Andrei, N.L.; Tanasiev, V.; Sanduleac, M.; Badea, A. Smart metering platform as a solution for data analysis. In Proceedings of the 2017 International Conference on ENERGY and ENVIRONMENT (CIEM), Bucharest, Romania, 19–20 October 2017; pp. 495–499. [Google Scholar]
- Sinitsyna, K.; Petrochenkov, A.; Krause, B. Identification of Electric Power Consumption Patterns in Relation to Standard Load Profiles. In Proceedings of the 2019 IEEE International Conference on Computational Science and Engineering (CSE) and IEEE International Conference on Embedded and Ubiquitous Computing (EUC), New York, NY, USA, 1–3 August 2019; pp. 30–35. [Google Scholar]
- Pilo, F.; Pisano, G.; Troncia, M. Updated Typical Daily Load Profiles for LV Distribution Networks Customers. In Proceedings of the 2019 1st International Conference on Energy Transition in the Mediterranean Area (SyNERGY MED), Cagliari, Italy, 28–30 May 2019; pp. 1–6. [Google Scholar]
- Davarzani, S.; Pisica, I.; Taylor, G.A. Study of missing meter data impact on domestic load profiles clustering and characterization. In Proceedings of the 2016 51st International Universities Power Engineering Conference (UPEC), Coimbra, Portugal, 6–9 September 2016; pp. 1–6. [Google Scholar]
- Zarabie, A.K.; Lashkarbolooki, S.; Das, S.; Jhala, K.; Pahwa, A. Load Profile Based Electricity Consumer Clustering Using Affinity Propagation. In Proceedings of the 2019 IEEE International Conference on Electro Information Technology (EIT), Brookings, SD, USA, 20–22 May 2019; pp. 474–478. [Google Scholar]
- Ochoa, D.S.; Gonzalez, E.P.; Rodriguez, R.C. Characterization of the demand for electric energy considering the integration of distributed energy resources. In Proceedings of the 2019 FISE-IEEE/CIGRE Conference—Living the energy Transition (FISE/CIGRE), Medellin, Colombia, 4–6 December 2019; pp. 1–5. [Google Scholar]
- Gil González, W.J.; Mora Flórez, J.J.; Pérez Londoño, S.M. Análisis del procesamiento de los datos de entrada para un localizador de fallas en sistemas de distribución. Rev. Tecnura 2014, 18, 64. [Google Scholar] [CrossRef]
- Marrero, L.; Carrizo, D.; García-Santander, L.; Ulloa-Vásquez, F. Uso de algoritmo K-means para clasificar perfiles de clientes con datos de medidores inteligentes de consumo eléctrico: Un caso de estudio. Ingeniare. Rev. Chil. Ing. 2021, 29, 778–787. [Google Scholar] [CrossRef]
- Jangid, B.; Mathruria, P.; Gupta, V. Load Profile Segmentation of Various Load Categories using Clustering. In Proceedings of the 2021 IEEE 2nd International Conference On Electrical Power and Energy Systems (ICEPES), Bhopal, India, 10–11 December 2021; pp. 1–6. [Google Scholar]
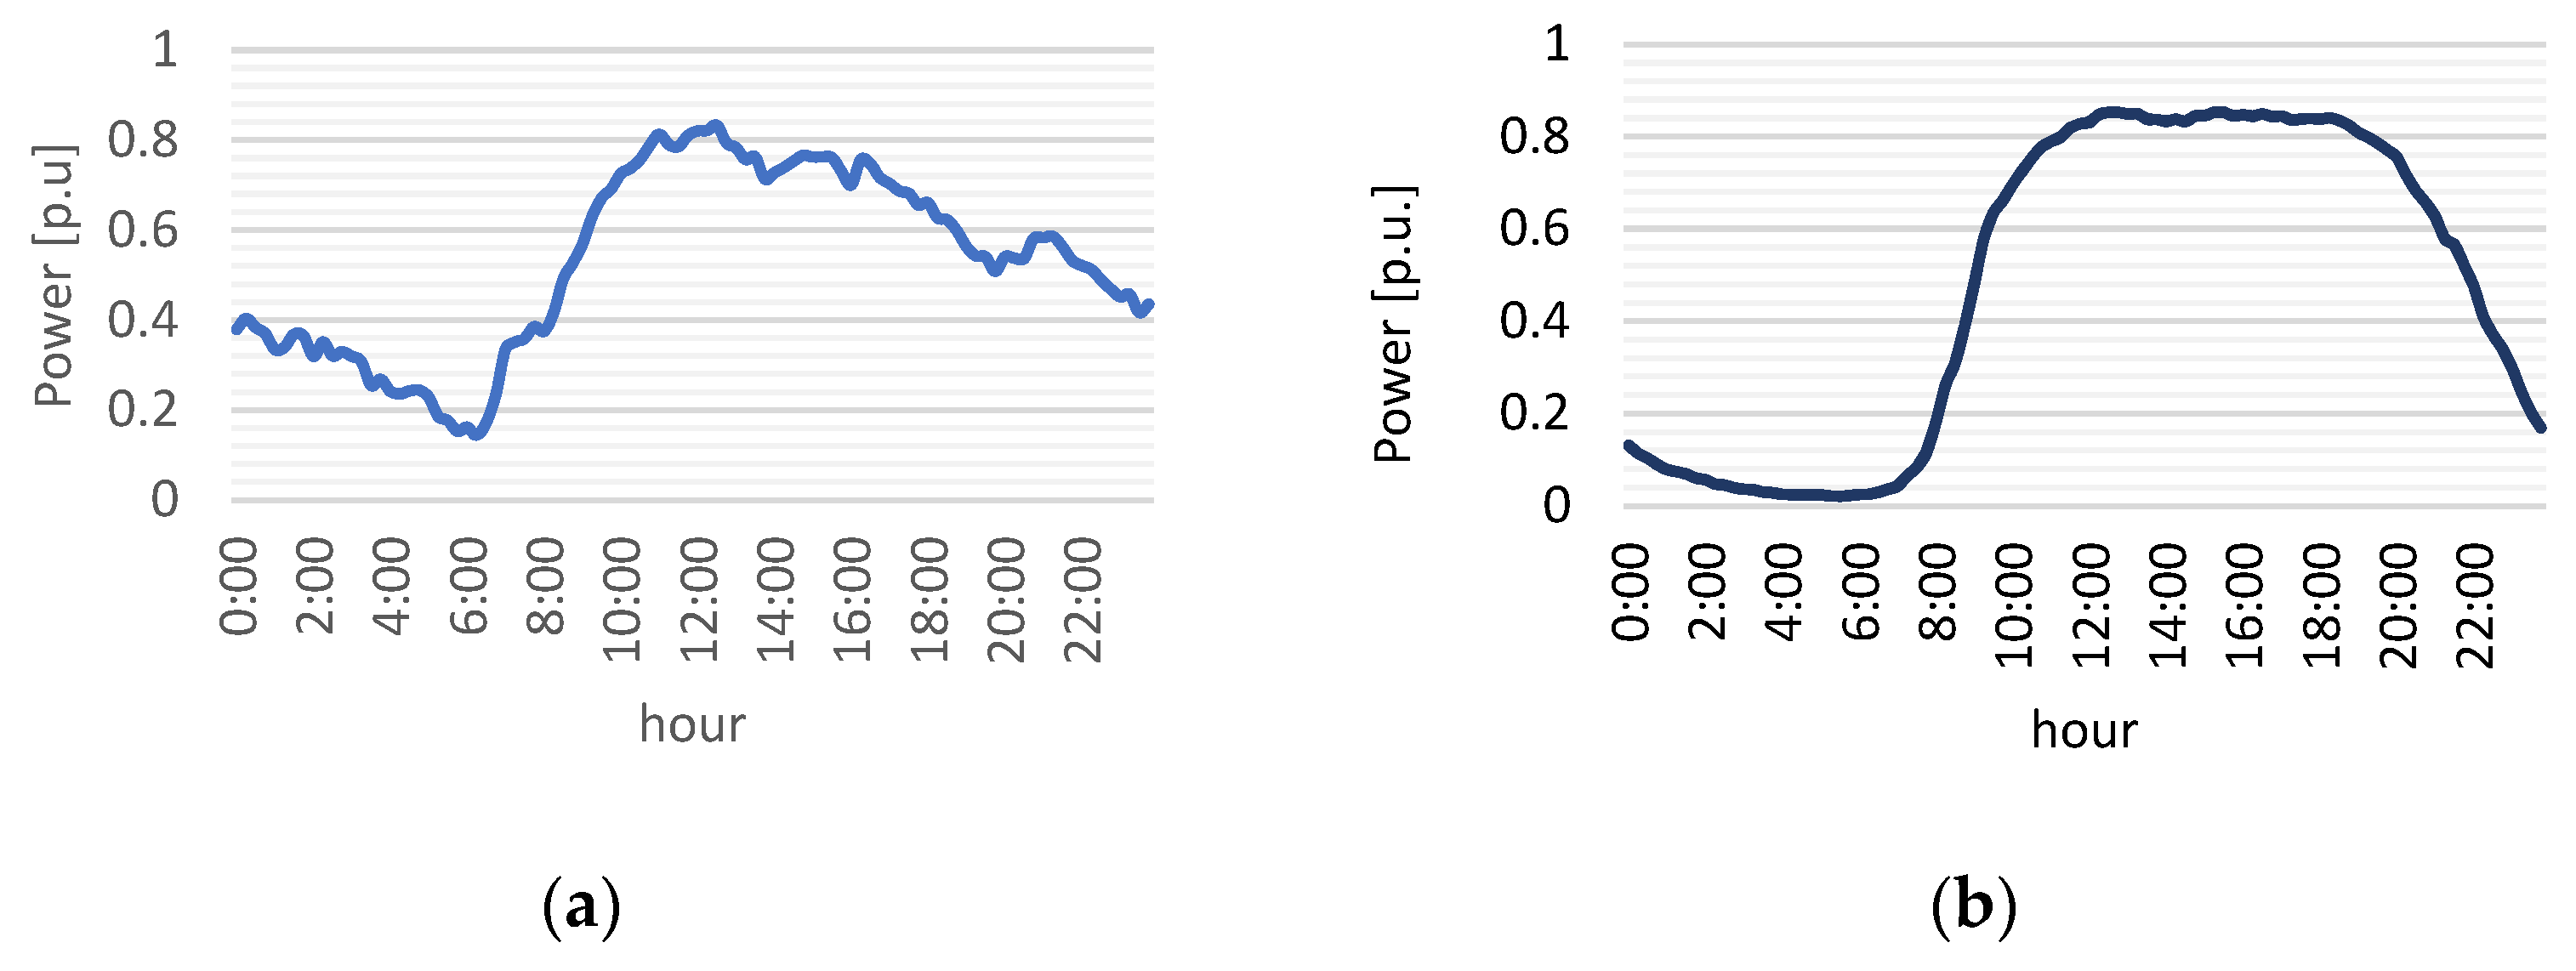
Figure 1.
Standardized characteristic load profile of an industrial customer, according to company records (own elaboration).
Figure 1.
Standardized characteristic load profile of an industrial customer, according to company records (own elaboration).
Figure 2.
Standardized characteristic load profile of a commercial customer, according to company records (own elaboration).
Figure 2.
Standardized characteristic load profile of a commercial customer, according to company records (own elaboration).
Figure 3.
Commercial customer load profiles (not grouped).
Figure 3.
Commercial customer load profiles (not grouped).
Figure 4.
Groups obtained through K-means clustering for commercial customers with installed power greater than 10 kW, business day of summer. (a) Group 1, (b) Group 2, and (c) Group 3.
Figure 4.
Groups obtained through K-means clustering for commercial customers with installed power greater than 10 kW, business day of summer. (a) Group 1, (b) Group 2, and (c) Group 3.
Figure 5.
“M-type profile” obtained in industrial clients I1 and I2 (L) and commercial clients C1 and C2 (L). (a) The left curve corresponds to an industrial customer, and (b) the right curve corresponds to a commercial customer.
Figure 5.
“M-type profile” obtained in industrial clients I1 and I2 (L) and commercial clients C1 and C2 (L). (a) The left curve corresponds to an industrial customer, and (b) the right curve corresponds to a commercial customer.
Figure 6.
“Mount-type profile” obtained in industrial clients I2 (L) and commercial clients C1 and C2 (L-S-D). (a) The left curve corresponds to an industrial customer, and (b) the right curve corresponds to a commercial customer.
Figure 6.
“Mount-type profile” obtained in industrial clients I2 (L) and commercial clients C1 and C2 (L-S-D). (a) The left curve corresponds to an industrial customer, and (b) the right curve corresponds to a commercial customer.
Figure 7.
“U-type profile” obtained in industrial clients I1 and I2 (L-S-D) and commercial clients C1 and C2 (L-S-D). (a) The left curve corresponds to an industrial customer, and (b) the right curve corresponds to a commercial customer.
Figure 7.
“U-type profile” obtained in industrial clients I1 and I2 (L-S-D) and commercial clients C1 and C2 (L-S-D). (a) The left curve corresponds to an industrial customer, and (b) the right curve corresponds to a commercial customer.
Figure 8.
“Residential type profile” obtained in industrial clients I1 (L-S-D) and commercial clients C1 (L-S-D). (a) The left curve corresponds to an industrial customer, and (b) the right curve corresponds to a commercial customer.
Figure 8.
“Residential type profile” obtained in industrial clients I1 (L-S-D) and commercial clients C1 (L-S-D). (a) The left curve corresponds to an industrial customer, and (b) the right curve corresponds to a commercial customer.
Figure 9.
“Slim mount profile” obtained in industrial clients I1 and I2 (S) and in commercial clients C2 (S). (a) The left curve corresponds to an industrial customer, and (b) the right curve corresponds to a commercial customer.
Figure 9.
“Slim mount profile” obtained in industrial clients I1 and I2 (S) and in commercial clients C2 (S). (a) The left curve corresponds to an industrial customer, and (b) the right curve corresponds to a commercial customer.
Figure 10.
“W-type profile” obtained in industrial clients I1 (D) and commercial clients C2 (D). (a) The left curve corresponds to an industrial customer, and (b) the right curve corresponds to a commercial customer.
Figure 10.
“W-type profile” obtained in industrial clients I1 (D) and commercial clients C2 (D). (a) The left curve corresponds to an industrial customer, and (b) the right curve corresponds to a commercial customer.
Table 1.
Clients considered in the study, according to the 10 kW criterion.
Table 1.
Clients considered in the study, according to the 10 kW criterion.
| Category | Customers with Installed Power Less than or Equal to 10 kW | Customers with Installed Power Greater than 10 kW |
|---|
| Industrial | 58 | 42 |
| Commercial | 399 | 435 |
| Total amount | 457 | 477 |
Table 2.
Typical days considered by season.
Table 2.
Typical days considered by season.
| Season | Typical Days Considered |
|---|
| Summer (trimester 1) | Working day, Saturday, Sunday, or holiday |
| Autumn (trimester 2) | Working day, Saturday, Sunday, or holiday |
| Winter (trimester 3) | Working day, Saturday, Sunday, or holiday |
| Spring (trimester 4) | Working day, Saturday, Sunday, or holiday |
Table 3.
Optimal number of groups (k) for typical days per quarter, in industrial customers.
Table 3.
Optimal number of groups (k) for typical days per quarter, in industrial customers.
| Type of Day | Customers with Installed Power Less than or Equal to 10 kW | Customers with Installed Power Greater than 10 kW |
|---|
| Trimester | Trimester |
|---|
| 1 | 2 | 3 | 4 | 1 | 2 | 3 | 4 |
|---|
| Sunday or holiday | 3 | 3 | 3 | 3 | 2 | 3 | 2 | 2 |
| Working day | 2 | 2 | 2 | 2 | 3 | 3 | 3 | 3 |
| Saturday | 2 | 2 | 2 | 2 | 3 | 3 | 3 | 3 |
Table 4.
Optimal number of groups (k) for typical days per quarter, in commercial customers.
Table 4.
Optimal number of groups (k) for typical days per quarter, in commercial customers.
| Type of Day | Customers with Installed Power Less than or Equal to 10 kW | Customers with Installed Power Greater than 10 kW |
|---|
| Trimester | Trimester |
|---|
| 1 | 2 | 3 | 4 | 1 | 2 | 3 | 4 |
|---|
| Sunday or holiday | 2 | 2 | 2 | 2 | 3 | 3 | 3 | 3 |
| Working day | 2 | 2 | 2 | 2 | 3 | 3 | 3 | 3 |
| Saturday | 3 | 3 | 3 | 3 | 3 | 3 | 3 | 3 |
Table 5.
Results obtained for the clients considered in the study with installed power greater than 10 kW.
Table 5.
Results obtained for the clients considered in the study with installed power greater than 10 kW.
| Type of Day | Type of Curve | Commercial Clients (%) | Average Variance | Industrial Clients (%) | Average Variance |
|---|
| Working day | M | 51.6 | 0.0307 | 71.44 | 0.0304 |
| Mount | 32 | 0.0415 | 21.65 | 0.0552 |
| U | 16.4 | 0.640 | 6.91 | 0.0381 |
| Saturday | Slim mount | 35.5 | 0.0463 | 43.73 | 0.0403 |
| Mount | 35.3 | 0.0469 | 38.95 | 0.0622 |
| U | 29.2 | 0.0558 | 17.32 | 0.0461 |
| Sunday or holiday | U | 31.3 | 0.0341 | 35.31 | 0.0503 |
| Mount | 34.4 | 0.0561 | 54.67 | 0.0663 |
| W | 34.4 | 0.0641 | 10.02 | 0.0602 |
| Publisher’s Note: MDPI stays neutral with regard to jurisdictional claims in published maps and institutional affiliations. |
© 2022 by the authors. Licensee MDPI, Basel, Switzerland. This article is an open access article distributed under the terms and conditions of the Creative Commons Attribution (CC BY) license (https://creativecommons.org/licenses/by/4.0/).

 ,
, 


