
Investigation of Effects of Different High Voltage Types on Dielectric Strength of Insulating Liquids


1
Department of Electrical and Electronic Engineering, Istanbul University-Cerrahpaşa, 34320 Istanbul, Turkey
2
Institute of Electrical Power Engineering, Lodz University of Technology, 90-537 Lodz, Poland
*
Author to whom correspondence should be addressed.
Energies 2022, 15(21), 8116; https://doi.org/10.3390/en15218116
Submission received: 6 October 2022
/
Revised: 25 October 2022
/
Accepted: 26 October 2022
/
Published: 31 October 2022
(This article belongs to the Special Issue Design and Optimization of Power Transformer Diagnostics)
Abstract
:Liquid dielectrics are different from each other, but are used to perform the same tasks in high-voltage electrical equipment, especially transformers. In similar conditions, the insulation performance of transformer oils under different types of voltage will provide dielectric resistance. In this study, three different dielectric liquids applied in transformers, namely mineral oil, natural ester and synthetic ester, were tested. Tests under AC and negative DC voltage were performed at electrode gaps of 2.5 mm, 2 mm and 1 mm using disk and VDE type electrodes as per ASTM D1816-84A and ASTM D877-87 standards, respectively. In turn, the impulse voltage tests were performed under an electrode configuration suggested by the IEC 60897 standard. The current data of 500 ms prior to breakdown under AC electrical field stress was decomposed using the empirical mode decomposition (EMD) and variational mode decomposition (VMD) methods. These analyses were conducted before the full electrical breakdown. Although synthetic ester has the highest dielectric strength under AC and negative DC electrical field stress, mineral oil has been assessed to be the most resistant liquid dielectric at lightning impulse voltages. In addition, stabilization of mineral oil under AC and negative DC voltage was also seen to be good with the help of calculated standard deviation values. However, synthetic ester has a significant advantage, especially in terms of dielectric performance, over mineral oil in spite of the stability of mineral oil. This indicates that liquid dielectric selection for transformers must be carried out as a combined evaluation of multiple parameters.
1. Introduction
Electrical and thermal constraints significantly affect the operating conditions of an electrical machine. Transformers, the main source of energy supply for most of the equipment used in industry, are also exposed to such stresses throughout their operating life [1,2]. The insulating materials in a high-voltage transformer work under a serious electrical field. For liquid dielectrics, commonly used for insulation and cooling in transformers, the electrical field exposure is one of the most significant types of stress. Due to the local high electric stress, partial discharges (PDs) may occur in the liquid dielectric materials and eventually may cause a complete electrical breakdown of the whole insulating system of the transformer [3,4]. This condition, which leads to severe energy shortages, must be well analyzed, and periodic maintenance carried out without setbacks. Otherwise, it will cause serious financial losses as the power to industrial equipment will be cut off. One of the best ways to avoid transformer failure is to choose the right liquid insulator for the planned conditions of transformer operation. There are many types of liquid dielectrics on the market. However, the healthy operating life of a transformer depends largely on the choice of insulating liquid, both from the viewpoint of high dielectric strength as well as the thermal properties of the liquid [5,6]. In general, mineral oils are offered as the cheapest solution for isolation in transformers, with well-recognized properties in terms of the dielectric strength provided. However, synthetic and natural esters are chosen more and more often due to their biodegradability and better aging behavior than mineral oils [7,8,9].
Transformers are exposed to high electrical field stresses with different characteristics throughout their operating life. These stresses vary depending on the time specific to the type of voltage. One of the most affected components in transformer insulating systems is the liquid dielectric material. Independently of the use of mineral oil, natural ester or synthetic ester in the transformer, these liquids may lose their dielectric properties under AC, DC and lightning impulse voltages (LIVs) [5,6,7,8,9,10,11].
In general, when comparing the liquids under the different voltage stresses, opposite results have been obtained between the AC and LI voltages. This means that in terms of AC voltage, there are no big differences between the liquids, no matter which type of electrode arrangement is applied. When mushroom electrodes are considered, the value of AC breakdown voltage (AC BDV) is at least higher than 60 kV, but this value is often higher than 70 kV. For example, in [12], the ester liquids and mineral oil were compared statistically by applying Gaussian and Weibull distributions to analyze 100 measurement results for AC BDV. The analysis showed a strong similarity between the liquids, such that all may be considered capable of use as transformer liquid insulation. Similarly, in [13], the authors found that, in a quasi-uniform electric field (sphere electrodes with a 2.5 mm gap), the differences between the liquids were minimal; the synthetic ester had an AC-BDV intermediate between those of the natural esters and mineral oils tested in the studies. The same observations were noticed in [14]. However, the data on the influence of moisture on AC BDV, commonly quoted when comparing esters and mineral oils, presented higher resistance of the esters to moisture content in their volume [15]. In turn, in [16], the benefits of using esters were shown in terms of the influence of conducting particles on the AC-BDV. In an electrode system consisting of two parallel plane electrodes with a 10 mm gap, it was found that the conductive particles significantly reduced the AC BDV, but this reduction was more visible in the case of mineral oil; under the higher viscosity of ester liquids, the motion of the conductive particles is slower than in mineral oil, and this results in higher dielectric strength of esters. When comparing DC stress, the results were slightly comparable to those obtained for AC voltage. There were no obvious differences in terms of DC BDV between esters and mineral oil when a uniform field was considered. However, when a point-to-sphere electrode arrangement was analyzed, mineral oil was characterized by higher DC-BDV for both voltage polarities and independently of the considered electrode gaps [17,18].
For LI BDV, a wide range of study results of comparative nature were presented in [19]. The authors found that mineral oil had a slightly higher value of LI BDV independently of the voltage polarity (quasi uniform field represented by sphere–sphere gap). A reduction of 15% was noticed in the case of esters. In turn, when the 1% breakdown probability was compared, the results were more favorable for ester liquids. The 1% LI-BDVs for esters were 153.1 kV and 151.0 kV for synthetic ester and natural ester, respectively, which were only slightly lower than the corresponding 1% LIBDV for mineral oil (156.7 kV).
Analyzing a non-uniform field in [20], the authors assessed esters and mineral oil based on the IEC 60897 standard [21]. They noticed similar values of LI-BDV for the liquids considered, with small deviations in favor of the esters at a positive polarity and in favor of the mineral oil at negative polarity. In another work [22], the results were compared in terms of a point–sphere electrode system and 5 and 10 cm electrode gaps. The LI voltage applied to the electrode setup was 0.5/1400 µs. Comparing the results for esters with those for mineral oil indicated worse ester behavior. While for the 5 cm gap and positive polarity, the differences were not high, for the 10 cm gap and a positive polarity with both gaps at negative polarity, the differences between esters and mineral oil reached 50 kV.
A summary of LI BDV for a variety of gaps in a point–plane electrode setup was presented in [23]. The conclusion was that as the electrode gap increases, the differences between esters and mineral oil are larger, obviously in favor of mineral oil.
From the above, it may be difficult to definitively state whether ester liquids are similar to mineral oil in terms of dielectric strength, in general. Depending on the types of voltage applied and types of electrode systems used in experimental studies, the conclusions are different. For uniform fields, ester liquids may be treated as liquids with dielectric properties similar to those of mineral oil; however, in a non-uniform electric fields, the conclusions are not so optimistic; ester liquids show some negative traits, especially for larger electrode gaps.
Because the liquid dielectrics community still awaits results showing changes in the dielectric properties of the new liquids when considering the influence of different factors [24,25], in this study, the authors propose an examination of three different liquids under three different types of electrical stresses. The following liquids, mineral oil, natural ester and synthetic ester, were tested under AC, negative DC and negative LI voltages. The AC and negative DC voltage experiments used the electrodes suggested by the ASTM D1816-84A and ASTM D877-87 standards [26,27] to demonstrate the specificity of the impact of electric field distribution on the behavior of the liquid dielectrics tested. Since the LIV-based tests were original in nature, the relevant test procedure was borrowed from the IEC 60897 standard [21]. As a supplement to the typical AC BDV measurements, the current signal data obtained during those measurements were decomposed using the variational mode decomposition (VMD) method. In addition, in order to achieve a more precise comparison, analyses were performed using empirical mode decomposition to decompose from high-frequency components to low-frequency components, exactly the opposite of VMD.
2. Materials and Methods
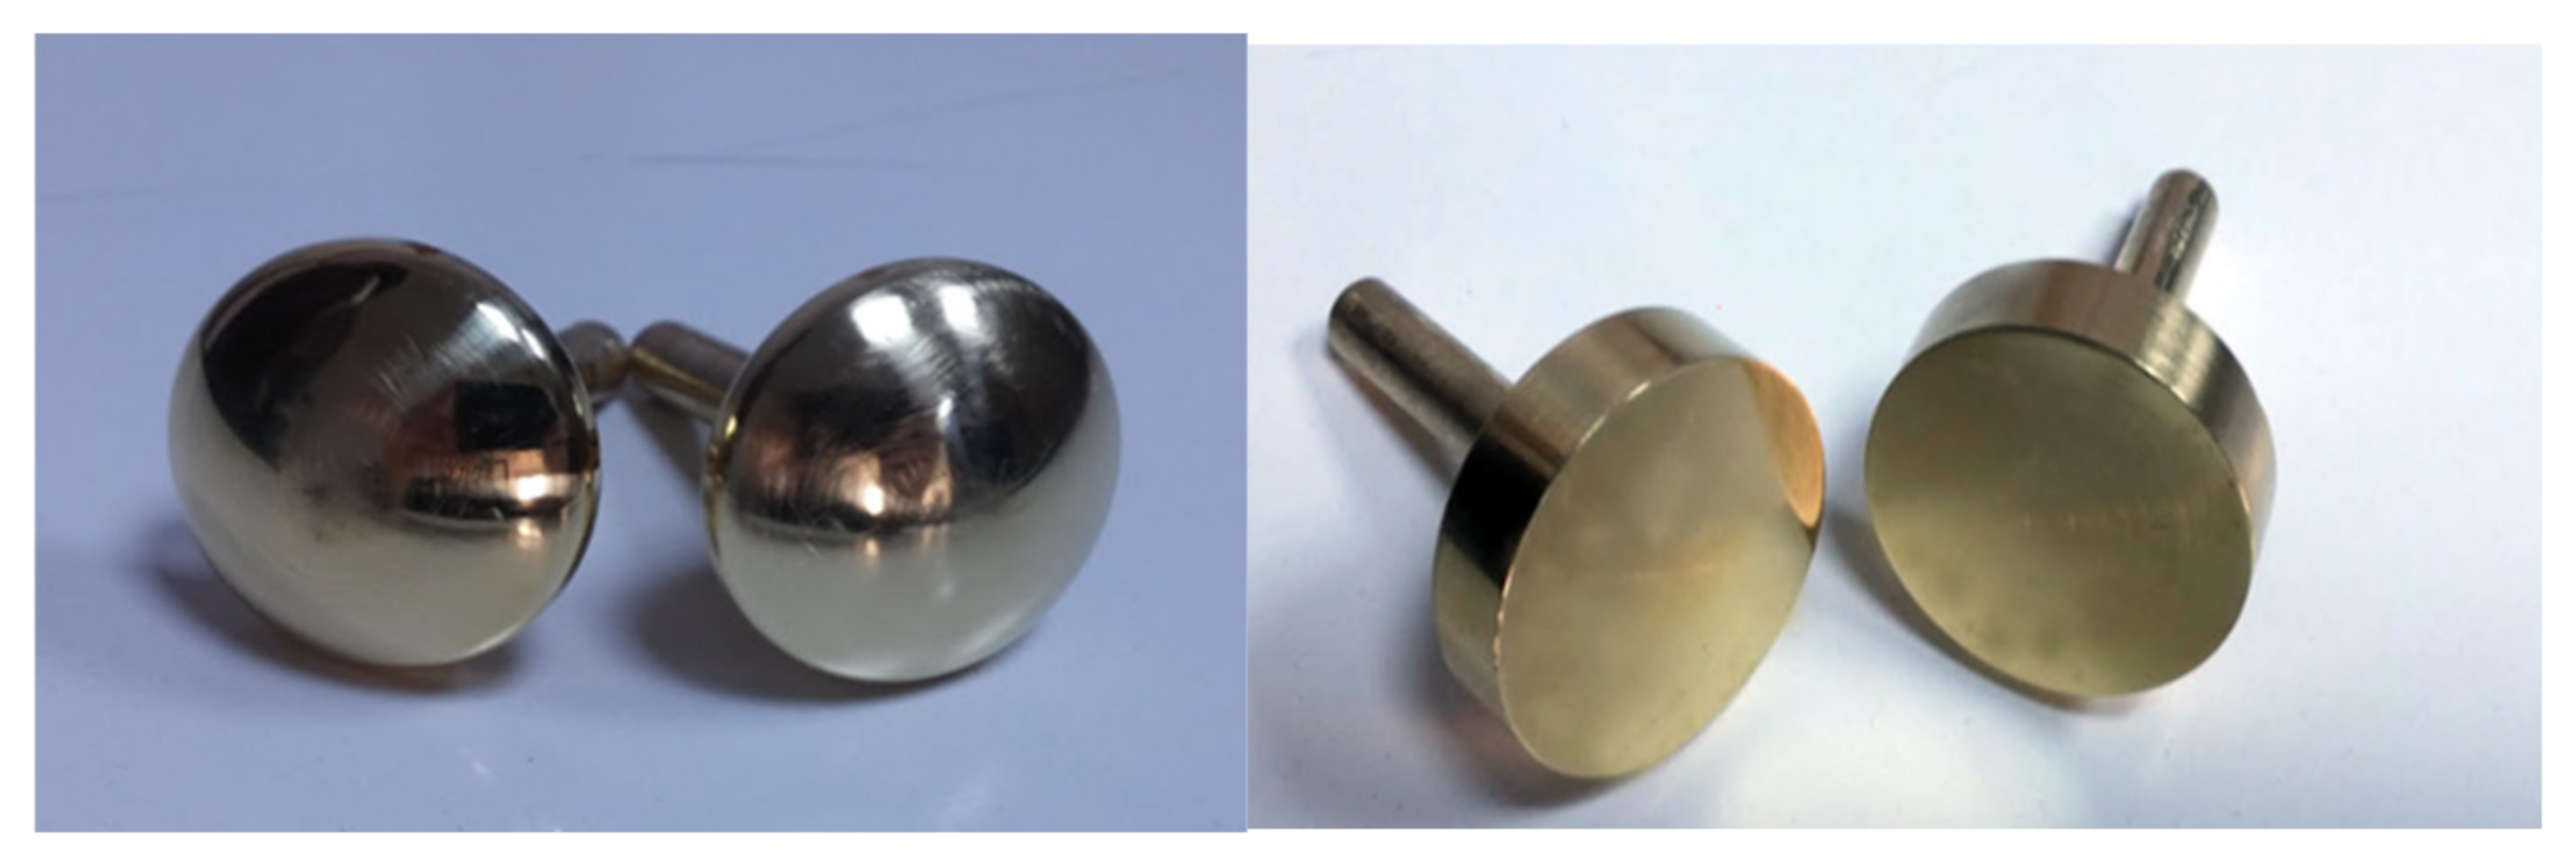
As was mentioned above, AC voltage tests were performed according to the ASTM D1816-84a and ASTM D877-87 standards. Disc and VDE type (mushroom) electrodes, both made of brass material, were used within the scope of these standards. An actual view is presented in Figure 1. The disc electrode had a diameter of 36 mm and a thickness of 1 cm. To mount the electrodes facing each other on the electrode assembly, supportive rods 8 mm in diameter and 4 cm long were attached as supports from the center of the disc. The curve at which the cap/mushroom point of the VDE electrode begins to form had a radius of 4 mm. The vertical height of the mushroom was 36 mm in diameter, and also, the distance from the middle of the back point to the tip of the head was 13 mm.
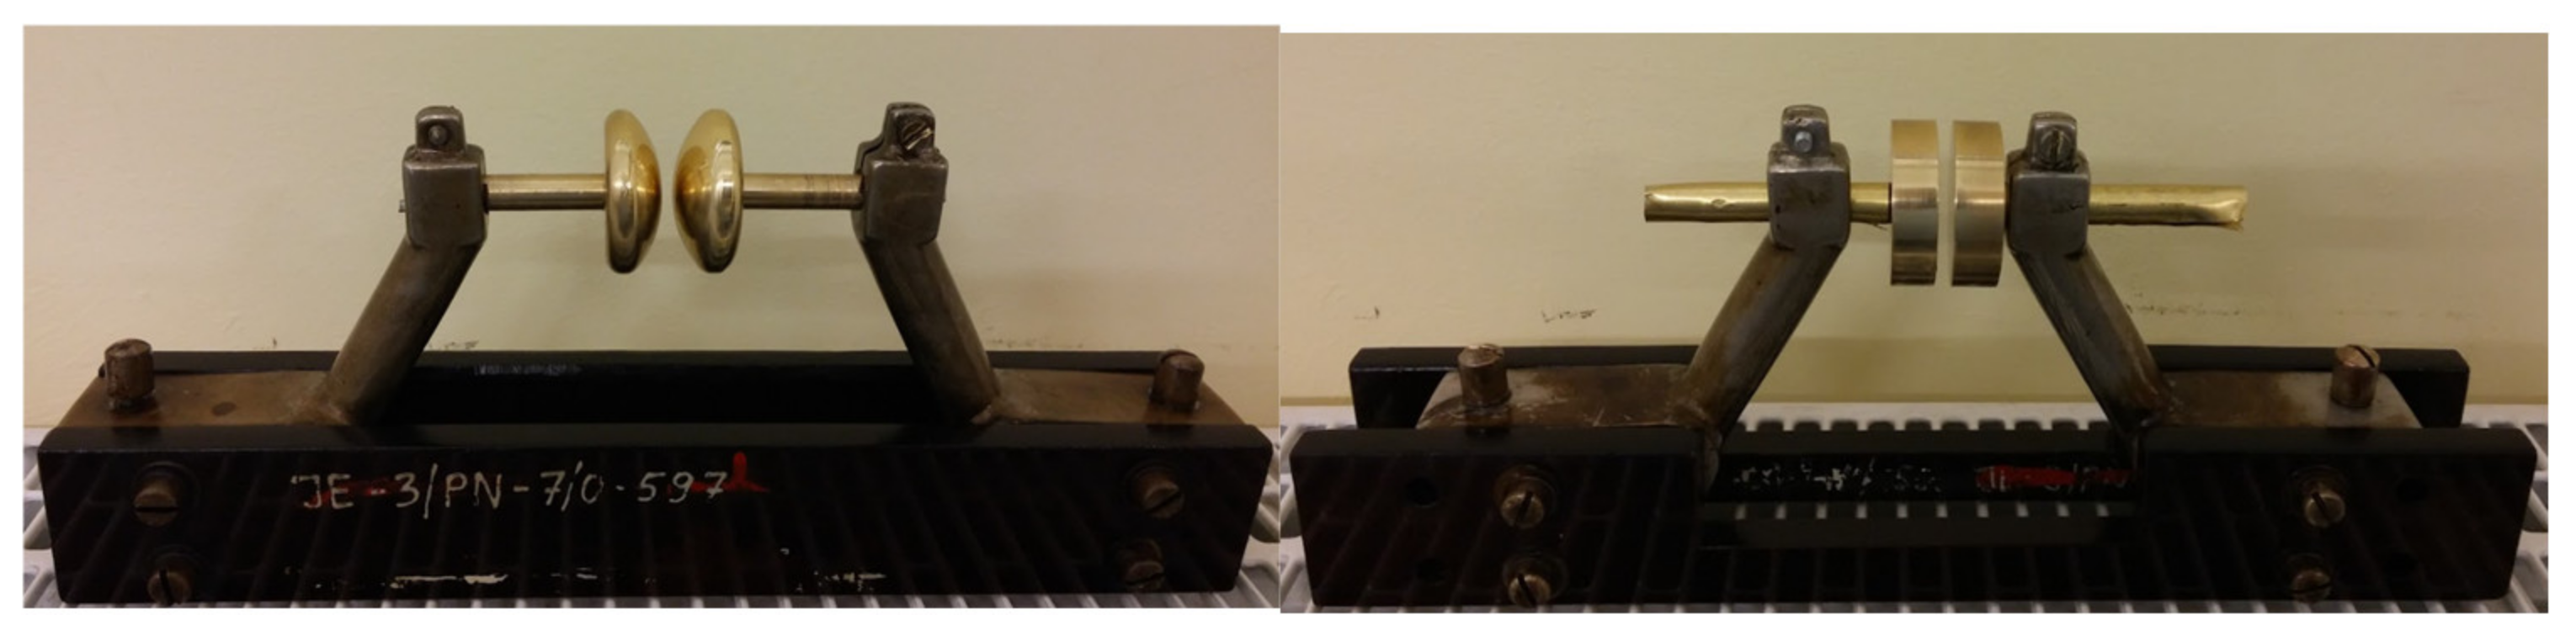
The electrodes were fixed with the help of an electrode mounting apparatus on a wooden base, and the electrode holder points were made of steel material (Figure 2). The test cell was made of borosilicate material and had dimensions of 200 × 100 × 142 mm and a thickness of 4 mm. During the experiments, 2 liters of transformer oil were filled into the test cell.
In AC and negative DC experiments, tests were carried out with 2.5 mm, 2 mm and 1 mm electrode gaps. These precise gaps were adaptively adjusted thanks to special-made electrode holders. A testing transformer with a nominal power of 10 kVA and a turn ratio of 230 V/100 kV was used to generate AC high voltage. The voltage was measured using an HV capacitive divider. In turn, the negative DC voltage was generated using the same laboratory equipment, but with a connection to a high-voltage circuit with high-voltage rectifier. In addition, a second divider was applied for measuring DC voltage.
The voltage rise rate was adjusted to 0.5 kV/s for the VDE electrode arrangement and 3 kV/s for the disc electrode, as required by the above-mentioned standards. In both cases, an automatic increment function was applied with the help of a control unit integrated with the testing transformer and voltage divider. This system was used in the same way for the AC and negative DC voltage experiments. In addition, current data were collected from a 215 Ω resistor connected to the primary winding of the transformer. The flowing current was measured with a high-sensitivity BNC cable by means of a digital phosphor oscilloscope (Tektronix DPO3054) with a 500 MHz bandwidth and 2.5 GS/s sampling rate. The data were recorded with a USB memory disc and then transferred to the computer.
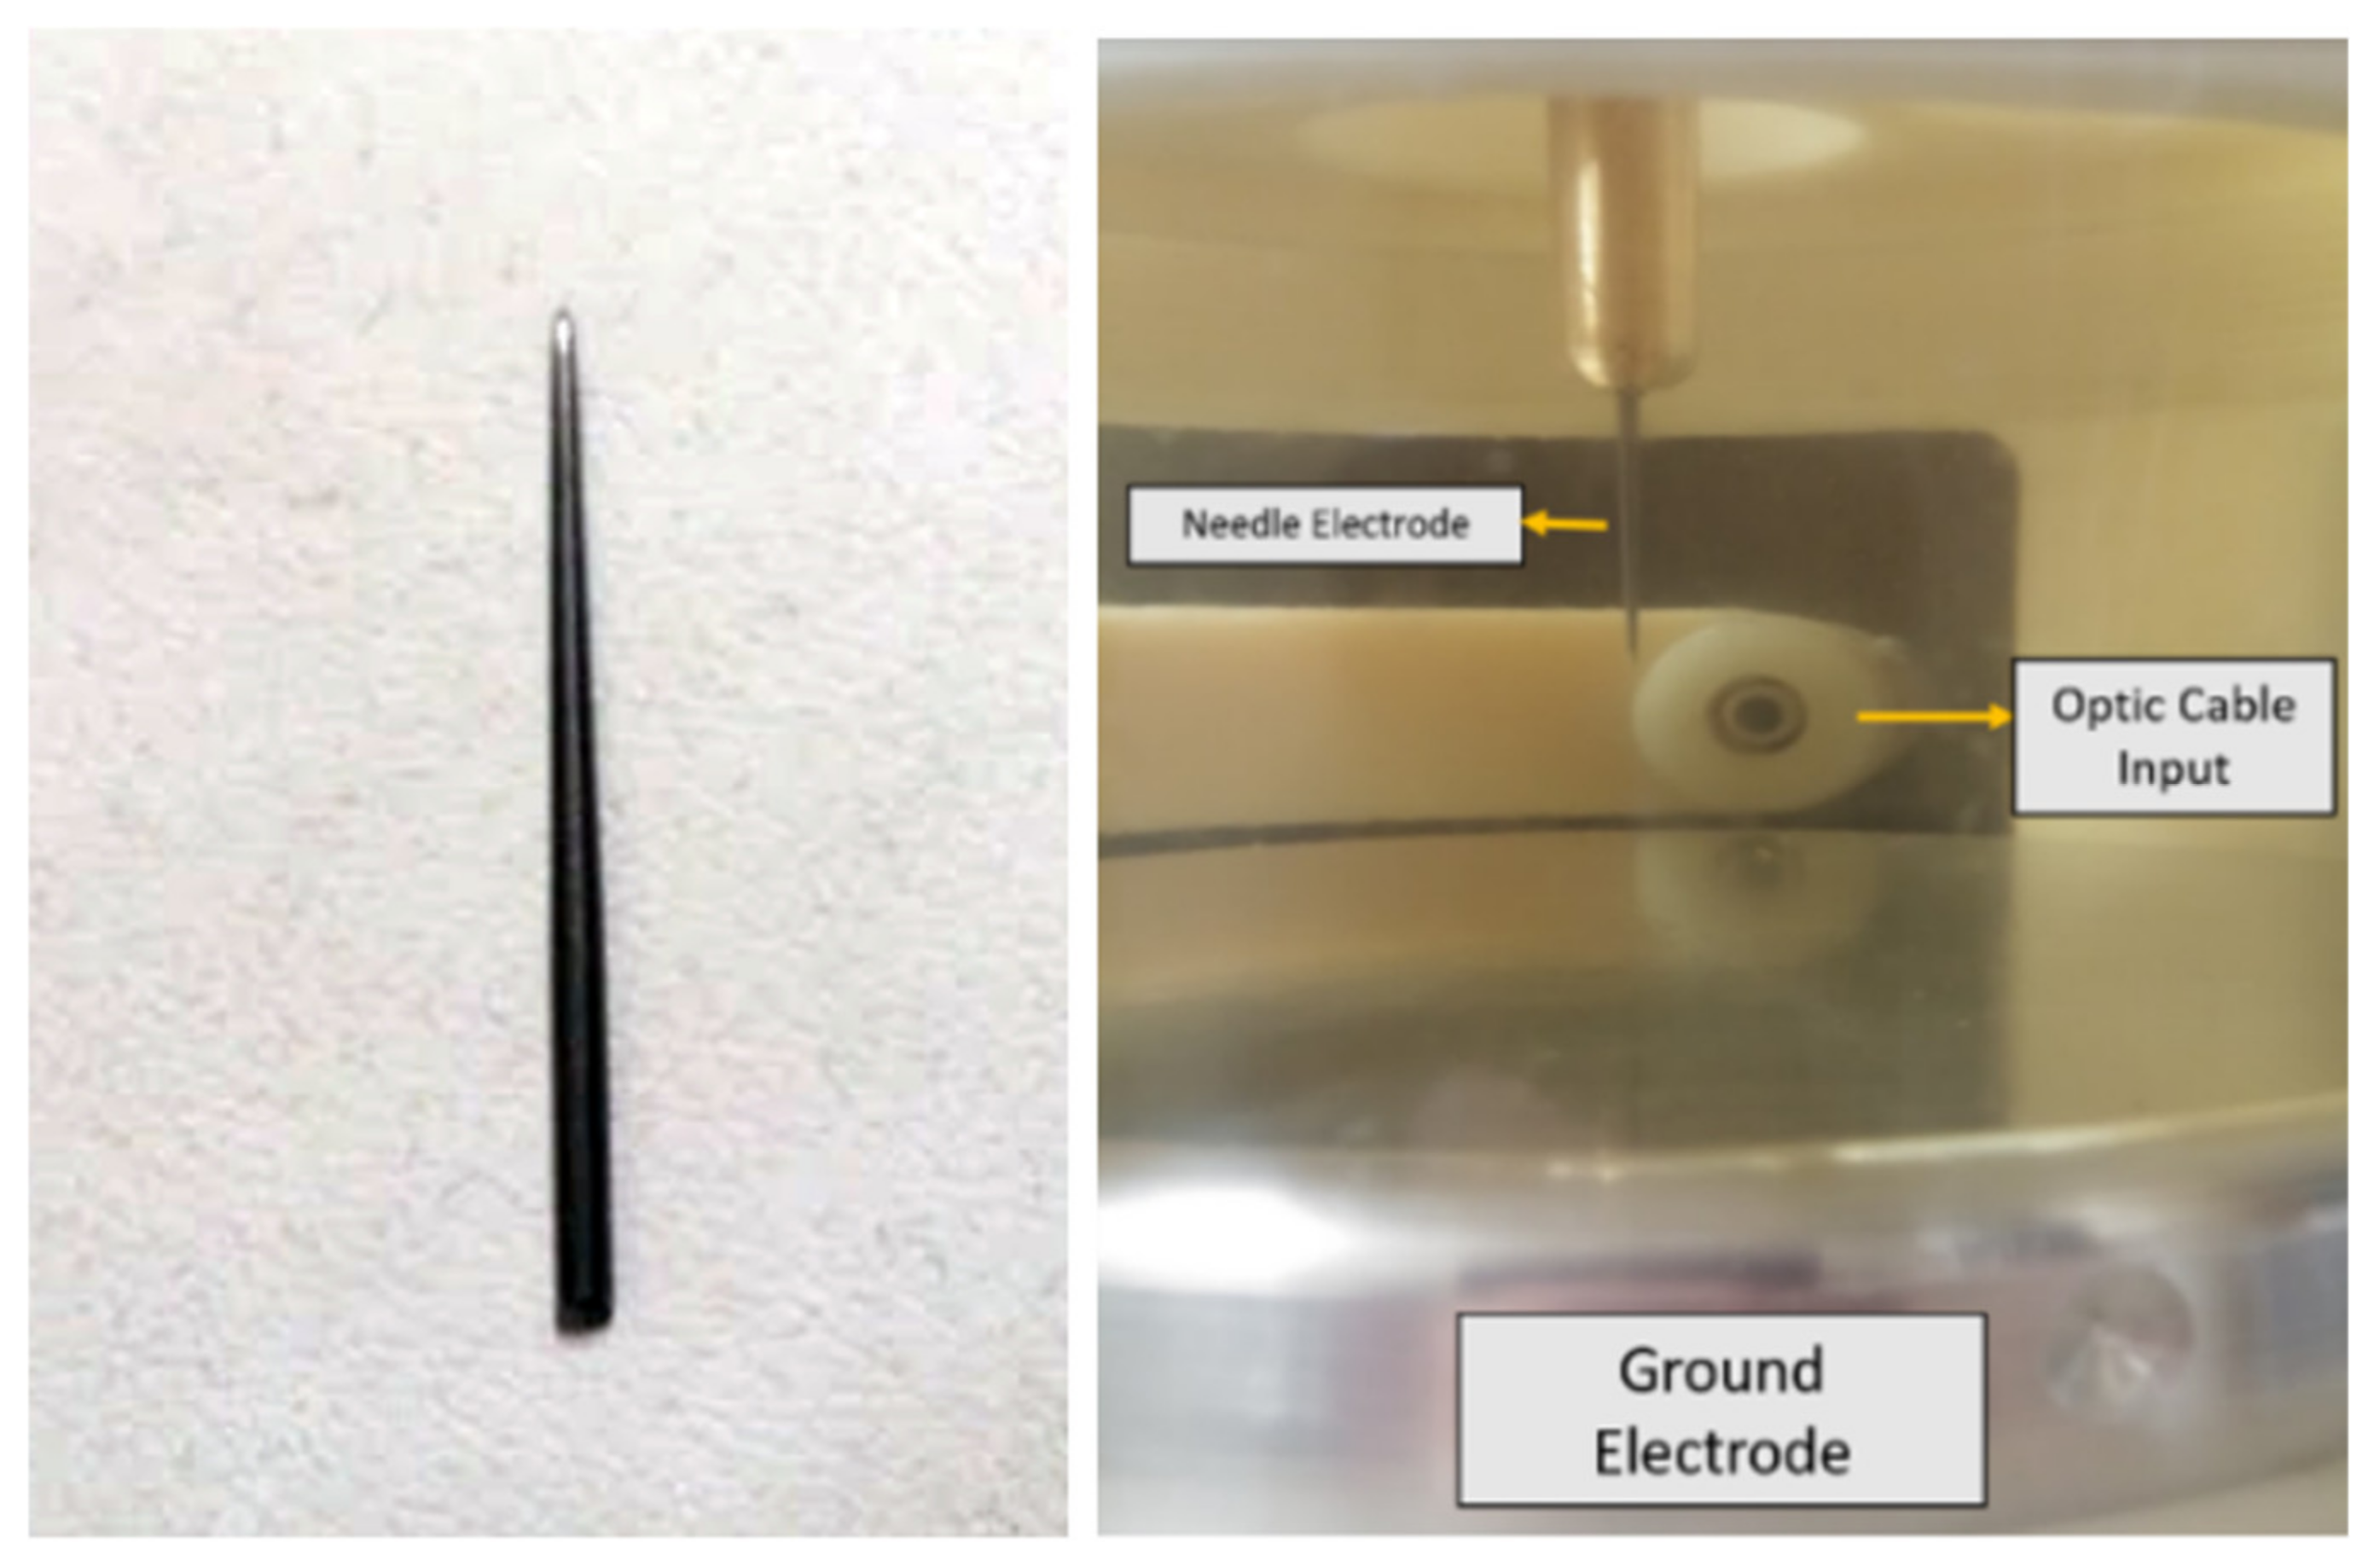
In the LIV tests, a point–plane electrode arrangement was used, an electrode configuration typically applied in such studies. The impulse voltage was obtained through a six-stage Marx generator with maximum voltage of 500 kV and an energy level of 2.2 kJ. The impulse voltage provided the 1.2/50 µs negative standard lightning impulse. The needle electrode had a length of 4 cm and a radius of curvature of 50 µm and was made of wolfram. The grounded electrode was cylindrical with a diameter of 13 cm and a thickness of 2 cm. The distance between the two electrodes was adjusted to be 25 mm based partially on the IEC 60897 standard. Actual views of the needle electrode and electrode arrangement placed inside the test cell are presented in Figure 3.
In the LI tests, the impulse voltage was measured with a peak voltmeter device over a resistive voltage divider of ratio equal to 1000. In addition, the light emitted by discharge was also measured with a high-sensitivity optical instrument (photomultiplier). All measurements were made on the same oscilloscope via BNC cable. All experiments were carried out at the High Voltage Laboratory of the Lodz University of Technology Institute of Electrical Power Engineering.
The liquids tested were commercially available products, representative of the given liquid types. Their fundamental parameters, taken from the datasheets of the products, are listed in Table 1. The liquids were verified initially in terms of moisture content, measured using the Karl Fischer method, to avoid a potential influence from moisture on the actual dielectric properties. The results for measured moisture content were 14 ppm, 42 pm and 46 ppm, respectively, for the mineral oil, natural ester and synthetic ester.
3. Results and Discussion
3.1. AC Voltage Experiments
AC high-voltage stress experiments were repeated 5 times for each electrode gap. The arithmetic mean of the breakdown voltages (BDVs), which were measured in each of the 5 repetitions, was calculated as shown in Equation (1), and the AC BDV value of each test liquid was obtained.
where is breakdown voltage, is the breakdown voltage at the repetition.
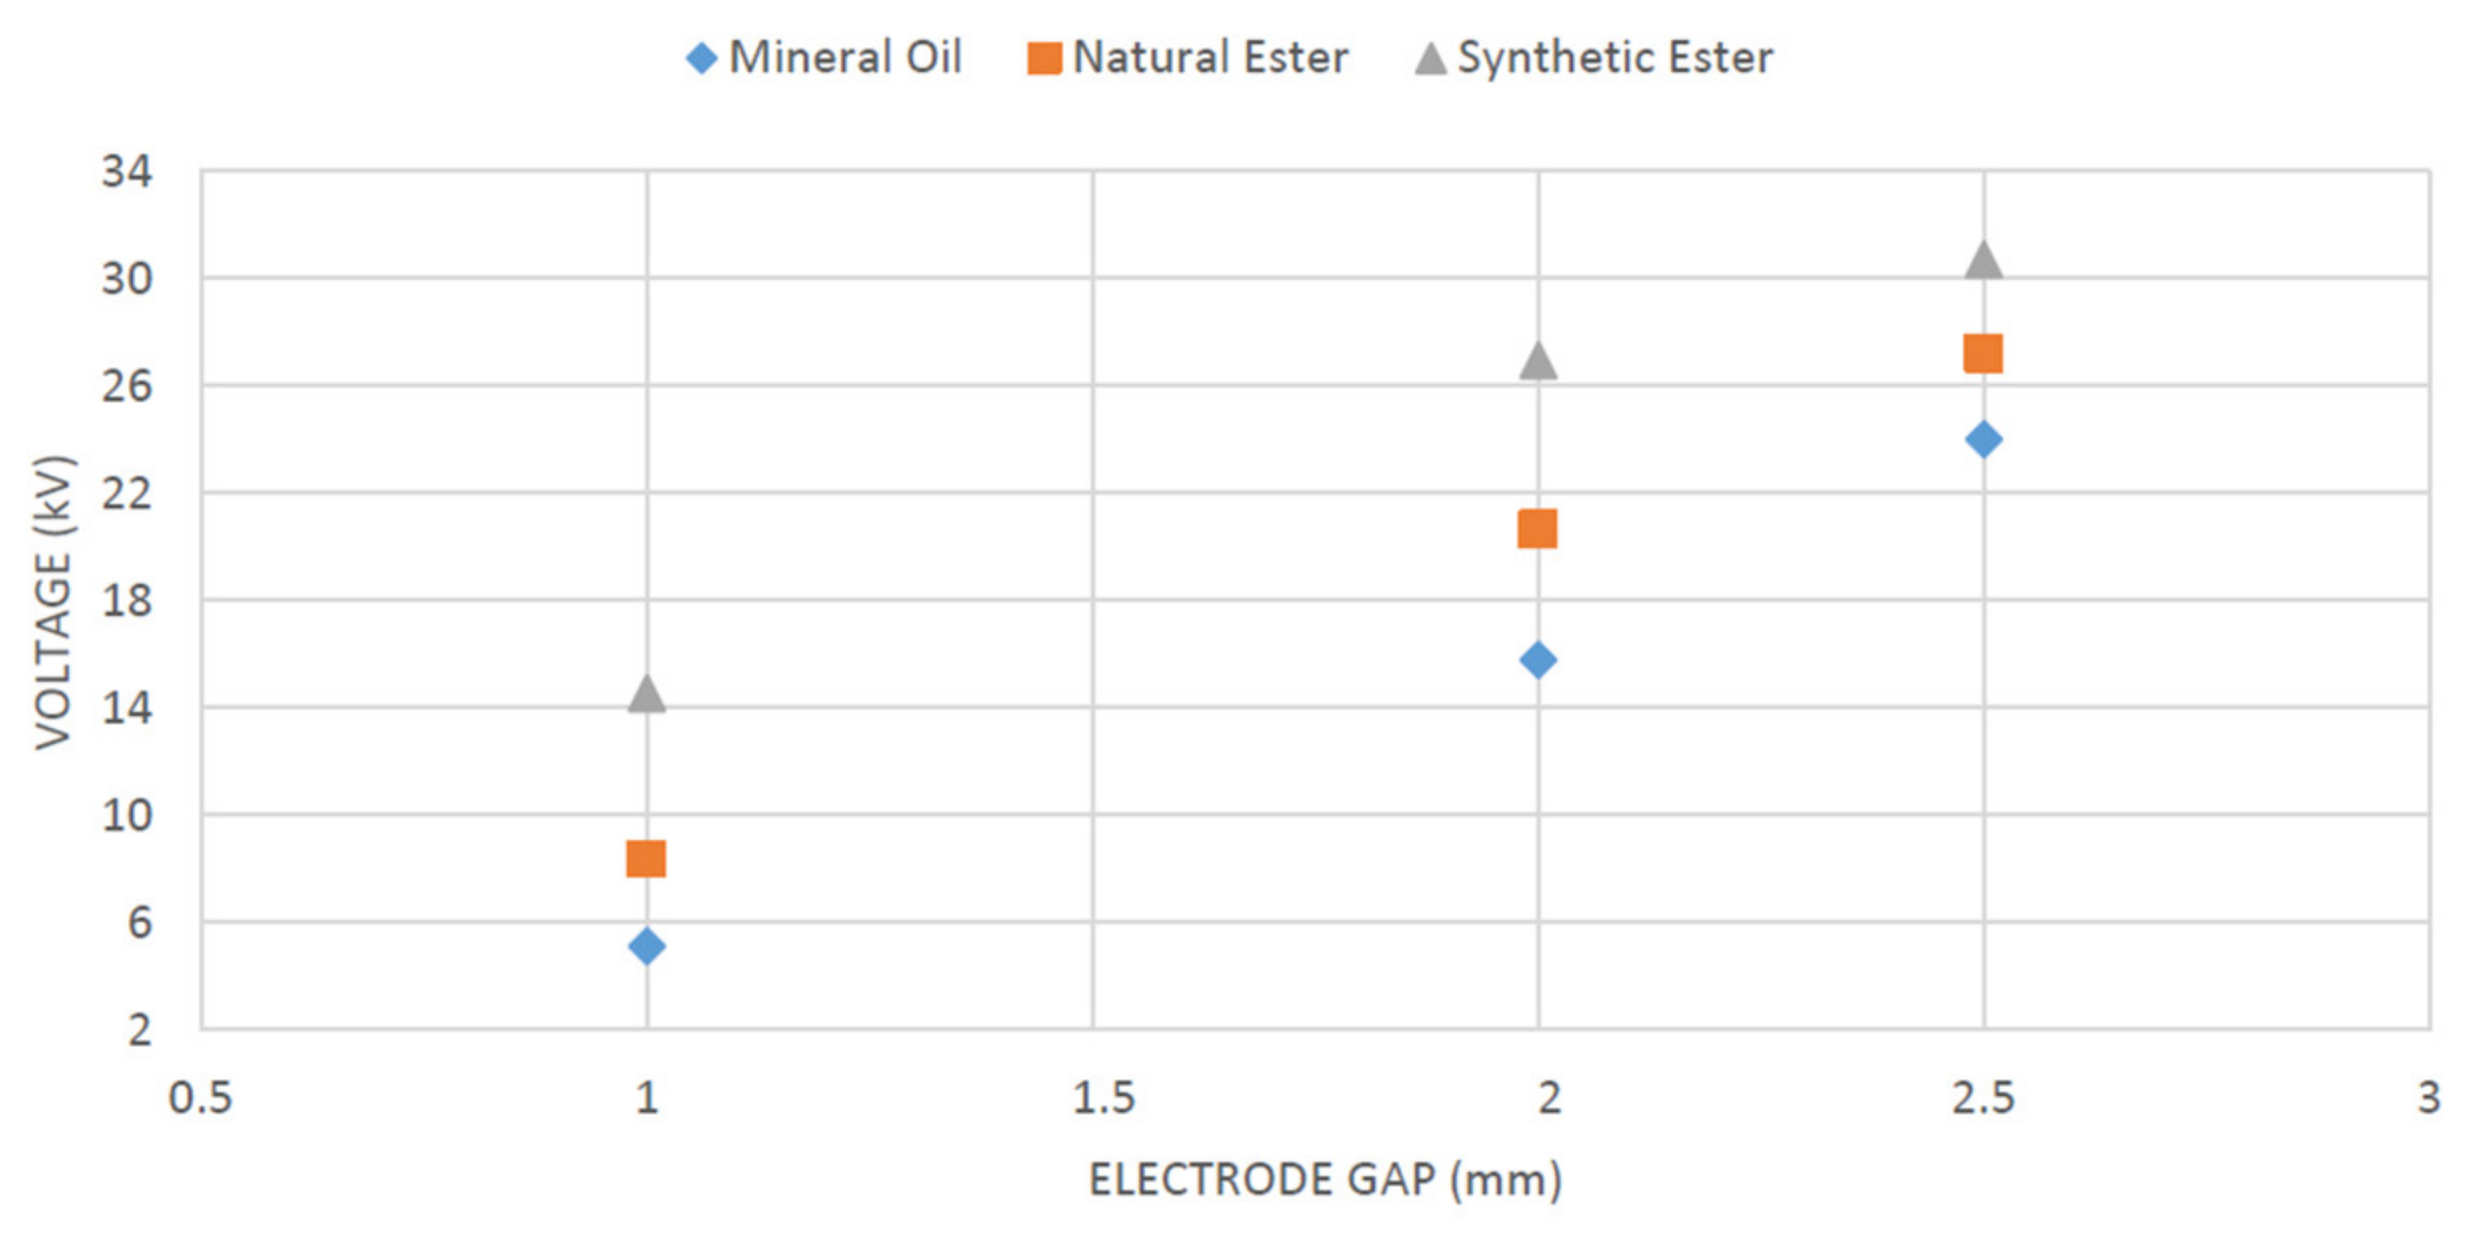
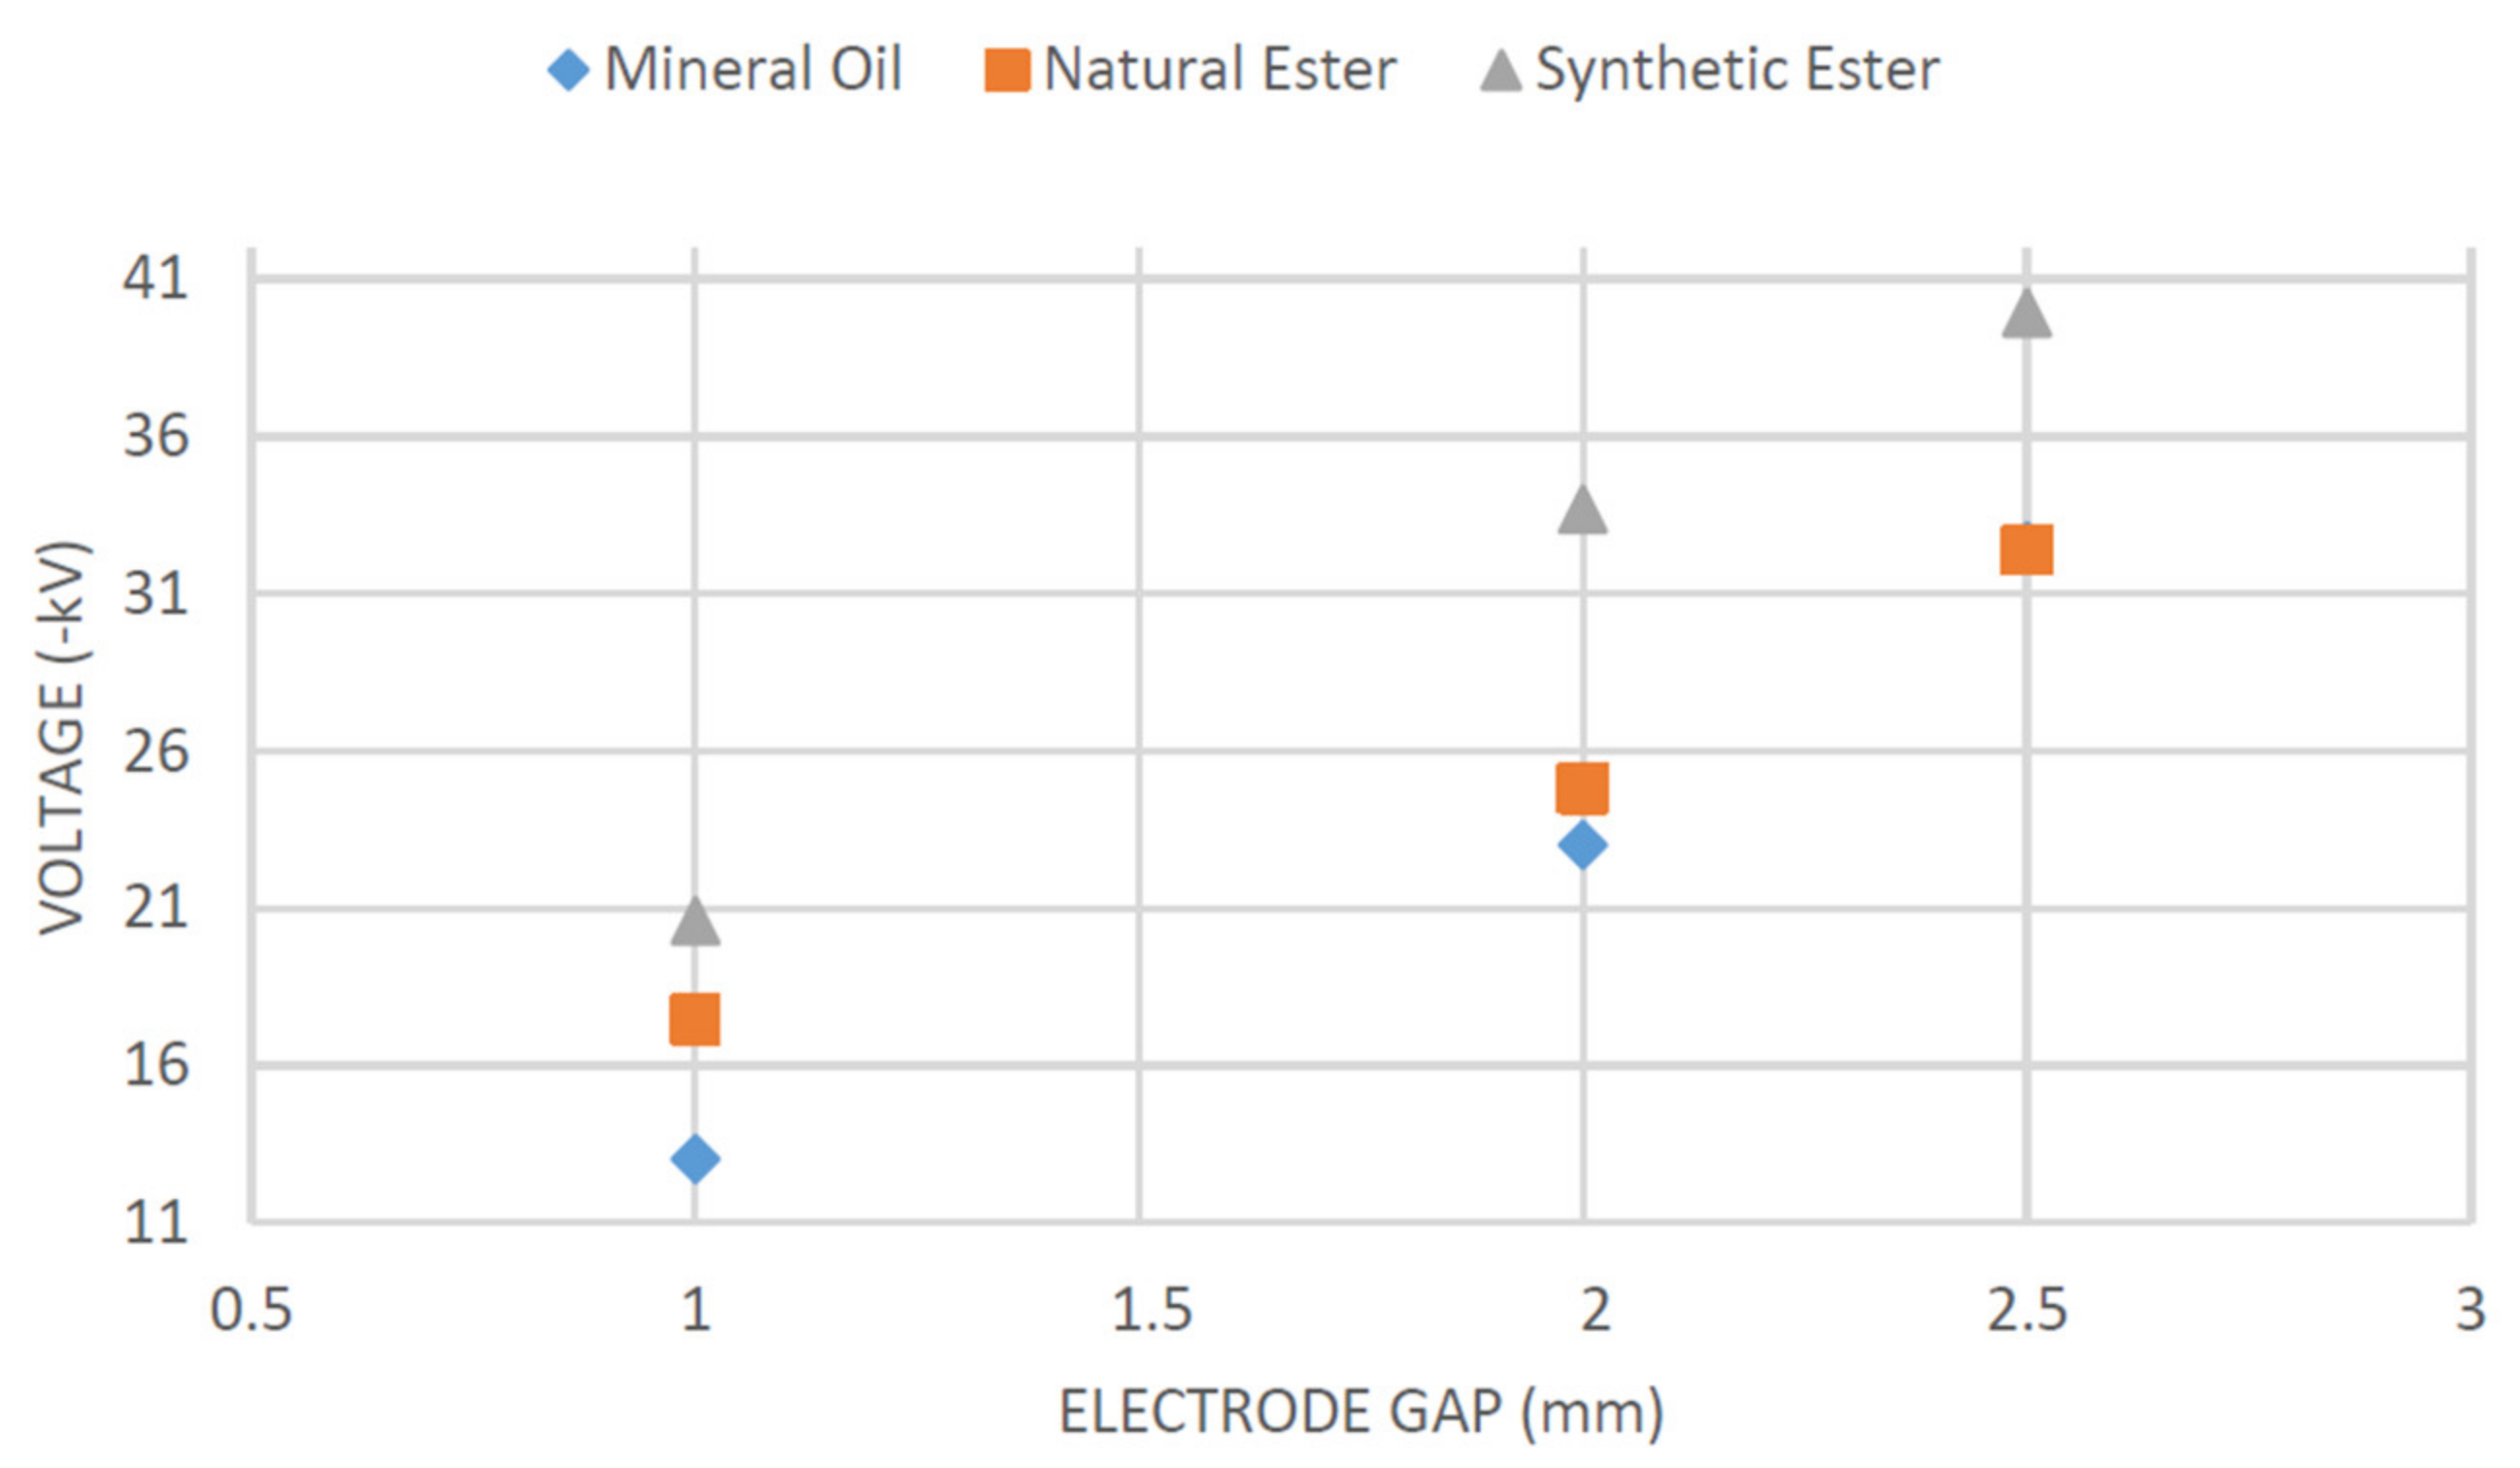
In experiments performed with mineral oil in the VDE electrode arrangement, AC breakdown voltages were measured as 23.64 kV, 21.28 kV and 15.36 kV at the 2.5 mm, 2 mm and 1 mm electrode gaps, respectively. It was observed that the breakdown voltage value decreased as the distance between electrodes decreased. For the BDV, a drop of 9.98% was observed when the electrode gap was 2 mm, and of 27.81% at the 1 mm electrode gap. The AC breakdown voltages of natural ester at the 2.5 mm, 2 mm and 1 mm electrode gaps were measured as 33.24 kV, 30.7 kV and 16.18 kV, respectively. It is known that the dielectric resistance of synthetic ester is higher than that of other liquids. In the experiment, the AC breakdown voltage for this liquid was measured as 43.84 kV, 32.02 kV and 18.76 kV at the 2.5 mm, 2 mm and 1 mm electrode gaps, respectively. The synthetic ester stood out as a liquid insulator with the highest breakdown voltages and the best dielectric performance. However, at the lowest electrode gap, the BDV difference between the liquids gradually decreased. Synthetic ester had a higher breakdown voltage of 3.4 kV compared to mineral oil and 2.58 kV compared to natural ester when the distance between electrodes was 1 mm. A summary of the AC breakdown voltages for all liquids considered under the two electrode arrangements is shown in Table 2. A graph showing the BDVs under the VDE electrode configuration is presented in Figure 4.
As can be seen, the larger the electrode gaps, the wider the measured differences in AC BDV between the liquids, while this value narrowed between the liquids as the electrode gap decreased in the VDE electrode system. After the first electron break off under high voltage stress, ionization, which is the first step in the full discharge process, begins. Electrons travel very quickly to reach the opposite electrode by colliding swiftly with neutral atoms and form a conductive bridge. However, if the distance is short, avalanche formation and the conductor bridge take place in a shorter time [28,29].
The disc electrode was structurally different from the mushroom electrode, having a geometric structure with flat surfaces. Electric field lines were formed at the same distance on the faces of the two electrodes facing each other. In conclusion, the ratio of the diameter to the electrode gap was the same everywhere and greater than 10-fold. In this case, the electric field was anticipated to be more uniform at the disk electrode. Therefore, higher breakdown voltages were expected to be measured. However, in the experiments, it was observed that the results were different from the expectations in general. In the experiments carried out with mineral oil in the disk electrode arrangement, the AC breakdown voltage was measured as 24 kV, 15.78 kV and 5.12 kV at the 2.5 mm, 2 mm and 1 mm electrode gaps, respectively. The BDV of mineral oil was slightly higher under the disc electrode configuration at the widest electrode gap compared to that under the VDE electrode system. Mineral oil appears to perform well in a uniform electric field with a high electrode gap. When the breakdown voltage was compared with that obtained with the VDE electrode, it was seen that the difference was greatest with the narrowest electrode gap. The AC breakdown voltages of natural ester at the 2.5 mm, 2 mm and 1 mm electrode gaps were measured as 27.2 kV, 20.64 kV and 8.36 kV under the disc electrode arrangement. Natural ester showed a different dielectric behavior compared to mineral oil. The BDV decreased at all electrode gaps, and the difference with mineral oil at the narrowest electrode gap was reduced. The natural ester had a significantly lower breakdown voltage than in the case with the VDE electrode arrangement as the electrode gap decreased. The measured isolation resistance of the synthetic ester was higher than that of the other liquids under the VDE electrode configuration. The AC breakdown voltages for this liquid with the disc electrode system were measured as 30.7 kV, 26.94 kV and 14.54 kV at the 2.5 mm, 2 mm and 1 mm electrode gaps, respectively. When using a disc electrode, the oil with the highest breakdown voltage was the synthetic ester liquid. The graph in Figure 5 summarizes the AC breakdown voltages of all oils under the disc electrode system configuration.
Mineral oil showed better performance under the disc electrode configuration at the larger electrode gaps. In all other cases, all liquids had lower breakdown voltages under the disc electrode arrangement. The largest difference was measured for the synthetic ester at the 2.5 mm electrode gap. In addition, the numerical values of the differences between the breakdown voltages of the oils at all electrode gaps under the disc electrode system showed more stable behavior. This was due to the fact that a more uniform electric field was obtained when the disc electrode setup was used. Although the disc electrodes created a more uniform electric field, the edge area responsible for the so-called edge effect caused a reduction in the breakdown voltage by increasing the local electric field stress around the mentioned edges. The breakdown voltage differences between the two electrode arrangements can provide information in terms of dielectric performance. However, the standard deviations (s) in the standards followed in the experiments must be calculated. The formulas used for calculation of the standard deviation are shown in Equation (2) for the ASTM D1816-84a standard and in Equation (3) for the ASTM D877-87 standard.
The standard deviation values calculated using these equations are shown in Table 3. As long as the value according to both standards did not exceed 0.15 too much, it was assumed that the tests were performed properly. These calculated values are listed in Table 4.
As can be clearly seen from Table 3, the standard deviation values dropped as the electrode gaps decreased in general. The exact opposite situation occurred for mineral oil under the VDE electrode arrangement. Therefore, this means that the ionization and subsequent electron movements of the mineral oil were dissimilar. Synthetic ester liquid had the largest standard deviation values. Higher voltage levels were achieved in the experiments with this oil. In repeated full-discharge processes, the differences between the numerical values of the BDVs were larger in comparison to those of the other two oils. This is why the standard deviations were large for the synthetic ester. The values in Table 4 show the required ratios, which are a clue for the stabilization of the oils’ behaviors, according to the ASTM standards. If these ratios had smaller values, it would mean that the respective oil exhibited more stable behavior in repeated experiments. Mineral oil, when tested with the 2.5 mm and 2 mm electrode gaps, and natural ester liquid with the 1 mm electrode gap showed more stable behavior under the VDE electrode arrangement. This was also an indication/determinant of why the mineral oil had the worst isolation durability at the minimum gap under this electrode configuration. In the disc electrode system, the values only for the natural ester liquid showed a decreasing tendency as the electrode gap decreased. This can be interpreted as meaning that the sharp corner effect was less for the natural ester. The values in Table 3 and Table 4 reveal whether the tested oil will exhibit stable behavior or not under high electric field stress. The determination of which oil is superior in terms of dielectric performance can be understood by examining the breakdown voltages. However, considering the operating voltage of the transformer to be used, the stability of the oils is also important for liquid dielectric selection.
3.2. Negative DC Voltage Experiments
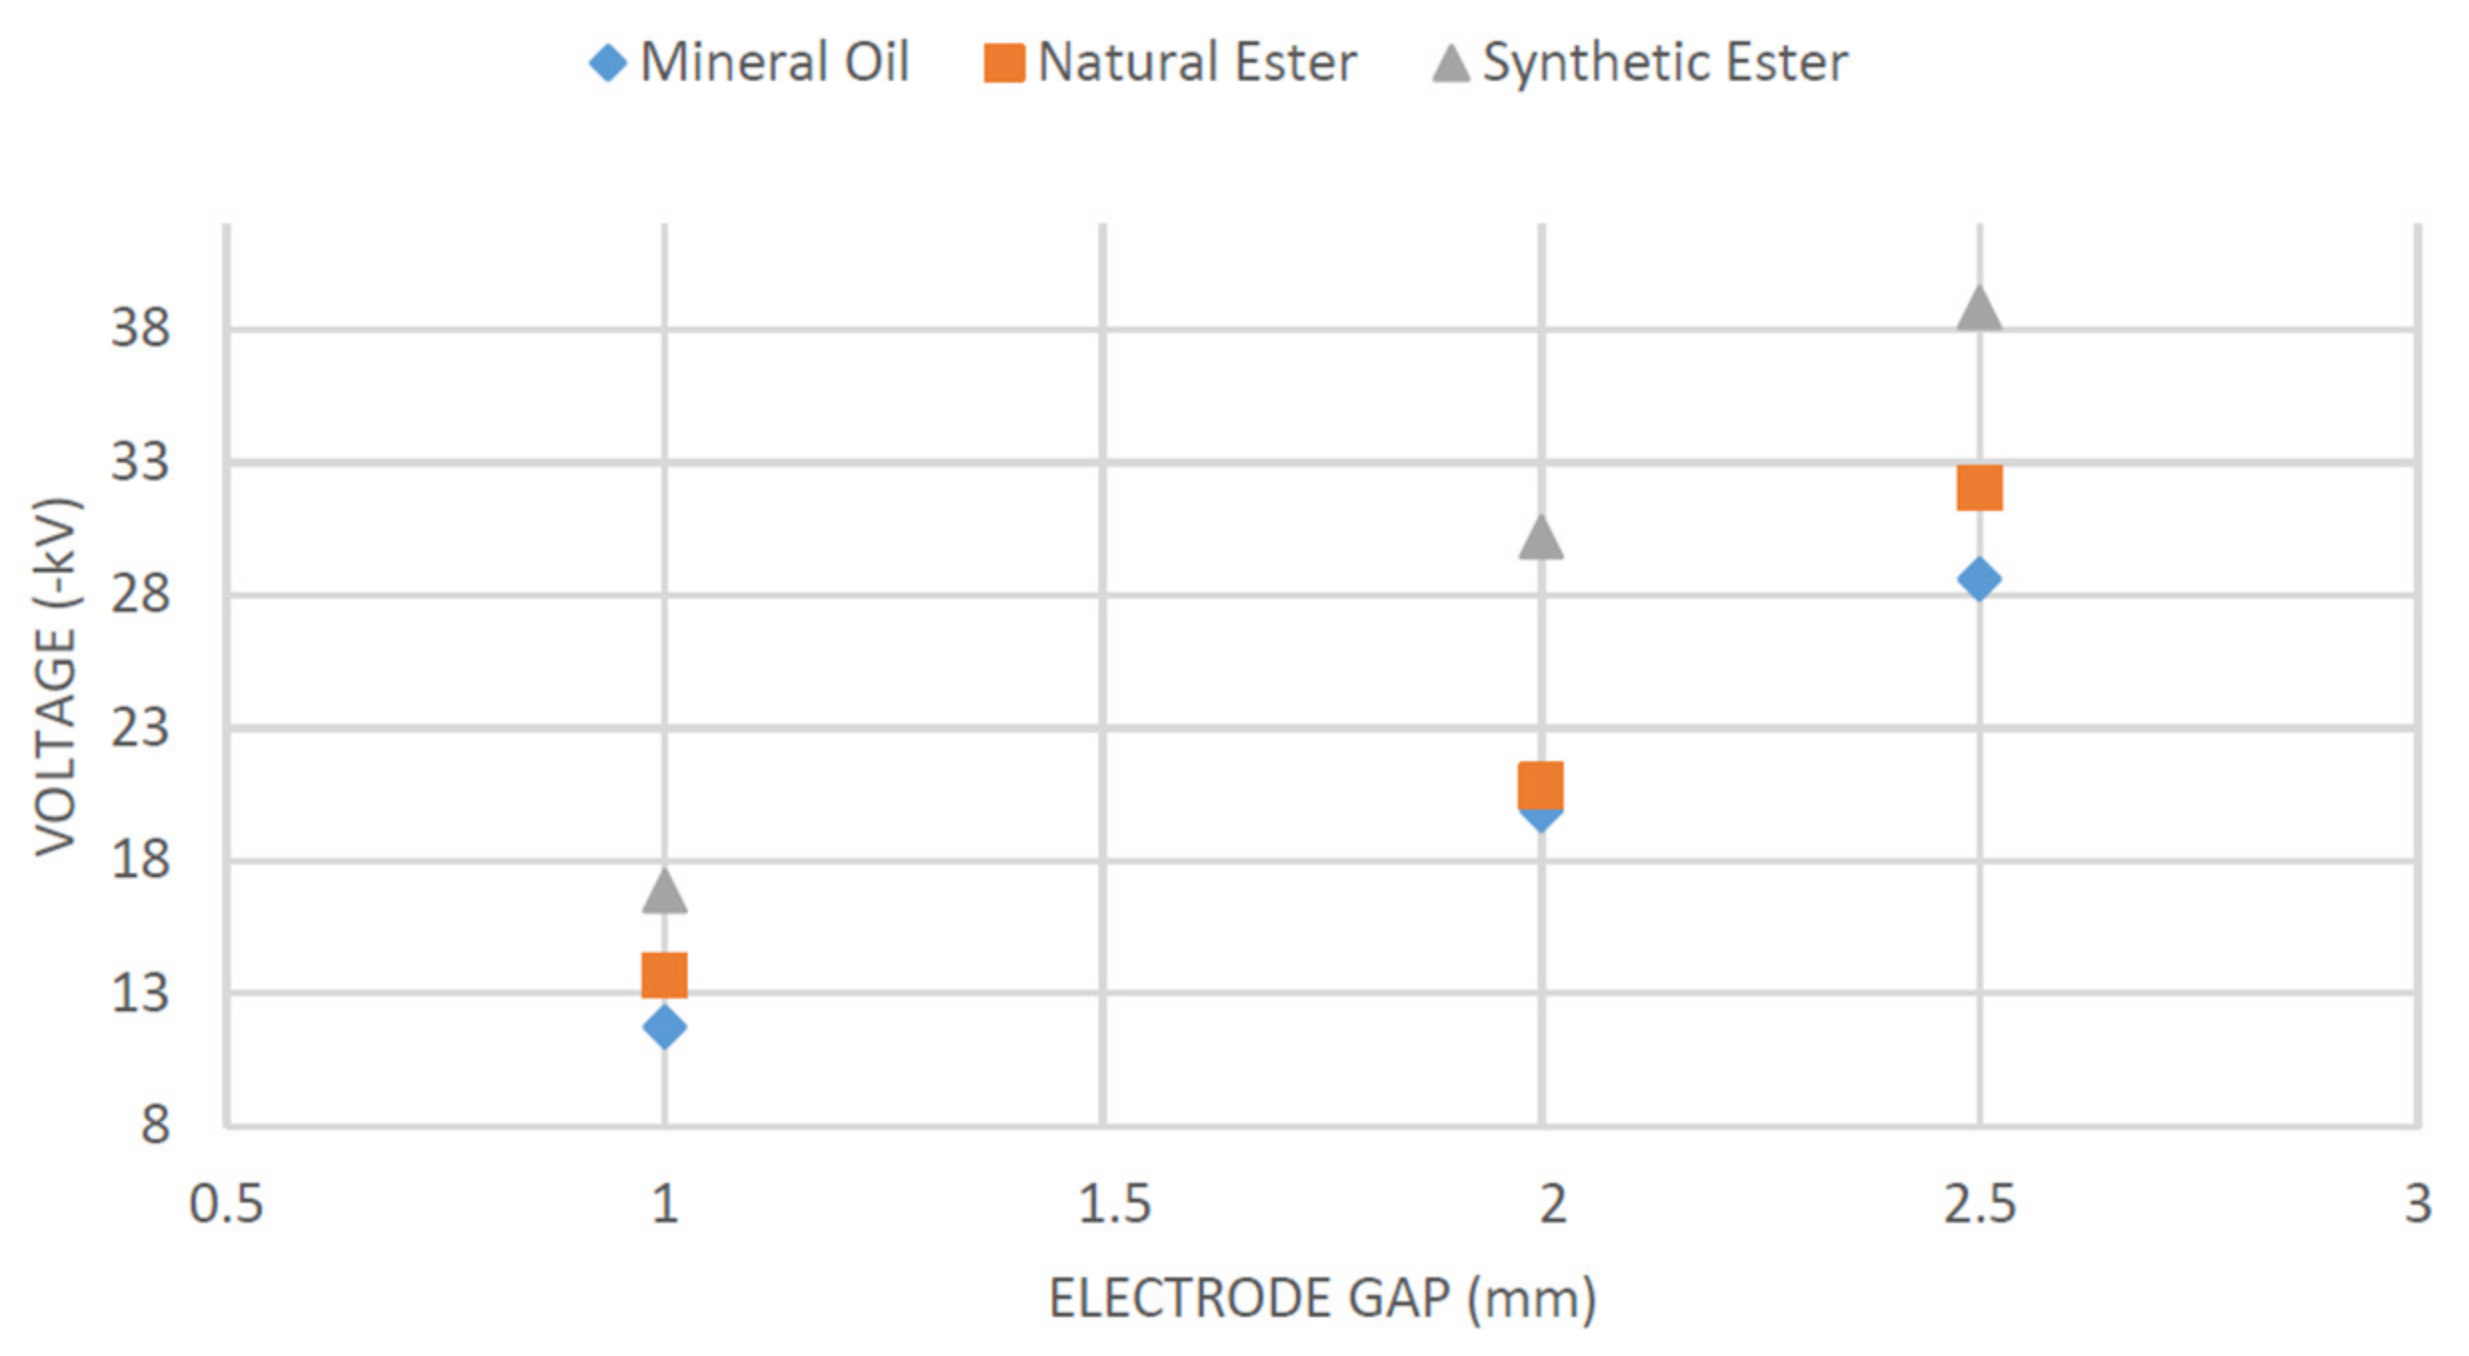
For the DC voltage experimental studies, the tests were carried out with the same electrode configurations as used in the AC tests. The voltage rise ratio per second according to the ASTM D1816-84a and ASTM D877-87 standards was applied in the same way. In the experiments with positive DC voltage, the breakdown voltages were observed to be in ranges similar to the AC breakdown voltages. Therefore, the experiments were carried out under only negative DC voltage. Thus, this provided an opportunity to investigate the breakdown voltage behavior under negative electric field stress, where the first ionization starts in any insulator. Table 5 lists the breakdown voltages of the three different liquid dielectric materials under negative direct voltage stress in accordance with both standards. The BDVs in the table are the arithmetic means of the voltage values obtained from five test repetitions. In addition, graphs comparing the breakdown voltages between the tested oils are given in Figure 6 and Figure 7.
To obtain a more meaningful comparison of negative DC breakdown voltage values with their AC high-voltage counterparts, the absolute values should be taken into account. Otherwise, since the values are negative, the lowest absolute value of breakdown voltage will correspond to the highest value. In this case, a more accurate examination can be impossible. Under the VDE electrode system, mineral oil appeared to have better dielectric performance in DC voltage tests when the electrode gaps were wider. Although the negative DC BDVs for the natural ester liquid at the 2.5 mm and 1 mm electrode gaps were closely similar to their corresponding values under AC voltage, worse dielectric performance was observed under negative DC voltage at the 2 mm gap. Synthetic ester liquid, on the other hand, had a lower breakdown voltage value under negative DC voltage in the VDE electrode arrangement at only the 2.5 mm electrode gap.
With the disc electrode arrangement, all oils had better dielectric strength under negative DC voltage at the 1 mm and 2.5 mm gaps, which were the minimum and maximum electrode gaps. Mineral oil and synthetic ester liquid at the 2 mm electrode gap had higher breakdown voltages under negative DC high-voltage stress, while for natural ester liquid, the corresponding value was almost the same as its AC breakdown voltage at that gap.
The numerical differences in breakdown voltages between mineral oil and natural ester in the VDE electrode system under negative DC voltage were diminished by increasing the electrode gap. In the AC voltage tests, as stated, the mineral oil has such breakdown voltage values that were similar to each other in five test repetitions. Since the DC voltage did not change with time and had a constant polarity only during application, the mineral oil increased its dielectric performance more than did natural ester liquid when the electrode gap was increased. With the increasing electrode gap in the VDE electrode arrangement, the breakdown voltage of the synthetic ester liquid showed an increasing behavior compared to the other oils. This behavior showed the same trend in the disc electrode system. Table 6 shows the numerical differences in breakdown voltage between the VDE and disc electrode systems under negative DC voltage. Similarly, the differences between the breakdown voltages are listed in Table 7 by comparing them with those under the AC voltage. These differences were calculated based on the absolute values of the negative DC breakdown voltages.
As can be seen from Table 6, the liquid dielectrics had higher breakdown voltages under negative DC voltage in the VDE electrode arrangement. However, the breakdown voltage differences between two electrode arrangements were generally larger under AC voltage. The ionization process was more stable under the voltage with a single polarity and constant value depending on time. Under AC voltage, ionization generally starts in negative polarity, and a fully conductive path between the electrodes occurs in positive polarity. The most important factor causing breakdown is the ongoing ionization process. Under AC voltage, the oils repaired themselves easily when exposed to continually changing polarity at a specific frequency, as a function of time. Because the self-recovering degree and behavior are different between oils, it resulted in larger BDV differences between the two electrode configurations in the AC voltage tests. Since the negative DC voltage had only one polarity, a continuous and faster ionization took place in the oils. This situation was the same for both electrode systems. Therefore, the measured differences between the breakdown voltages were smaller values. As seen in Table 7, lower BDVs were recorded in the AC voltage experiments under the disc electrode arrangement. The reason for the higher breakdown voltage measurements with the disc electrode system under negative DC voltage was due to the fact that the sharp corner effect has less influence at constant voltage. In addition, a single-polarity constant voltage created a more uniform electric field between the opposing surfaces of the discs.
The standard deviation values in Table 8 were calculated by taking the absolute values of the negative DC breakdown voltages and using the formulas in Equations (2) and (3). In addition, the values giving information about the stable states of the oils are listed in Table 9.
In the disc electrode arrangement, except for the 1 mm electrode gap, the standard deviation values decreased as the gap decreased, as was the case under AC voltage. These values for synthetic ester liquid in the VDE electrode system showed a decreasing trend under negative DC voltage. In the other oils, there was a behavior that changed according to the electrode gap. Under this voltage type, the standard deviation usually had higher values in the disc electrode configuration. The stability of the mineral oil in the VDE electrode arrangement was negatively affected under constant direct voltage at the 2.5 mm gap. For this oil, similar values were seen at the other two electrode gaps, as calculated under AC voltage. In the same electrode arrangement, the stability of the synthetic ester liquid was the most negatively affected among the liquid dielectrics. In the disc electrode system, the measured BDVs of the oils were higher under negative direct voltage. However, it was observed that the stable states of the oils changed in a disruptive way, especially at the 1 mm electrode gap. In repetitions of the experiments at the minimum gap, similar values of breakdown voltages were observed for natural ester liquid. Therefore, the stability of natural ester liquid at the 1 mm gap was better than that of the other oils. From this point of view, the dielectric performance of the oils should be evaluated by how much they maintain their stable state as well as their breakdown voltage values.
4. Current Signal Decomposition Methods
At the operating frequency of 50 Hz, current signals were obtained depending on time over the resistance in the primary winding of the testing transformer. The waveforms of the current signals had the property of a time-dependent with increasing trend according to voltage rising speed of both ASTM standards. This provided us with the ability to follow the process causing the electrical breakdown more closely with the help of separating the signals into narrower time intervals. The measured current signals were decomposed using empirical mode decomposition (EMD) and variational mode decomposition (VMD) methods. Although EMD is a well-known method, VMD stands out as a new signal decomposition approach that has become popular in recent years. In both methods, the selected signal should change over a period of time in order to achieve more effective decomposition.
Using the EMD method, after the peaks in the upper and lower parts of the signal were detected, upper and lower curvatures were produced to achieve cubic interpolation at these points [30]. After calculating automatically, the average between the two curvatures, a signal with amplitude and modulation, was extracted as a result of many cycles for intrinsic mode function (IMF) calculation. An IMF is a function in which the upper and lower envelopes are symmetric, and the number of zero-crossings and the number of extremes are equal or differ at most by one.
An signal was decomposed according to Equation (4) in the EMD method afterwards [31].
denotes the amplitude- and frequency-modulated signal, and is the residual value as a result of the decomposition. is a quantity dependent on the phase angle (Equation (5)).
represents the instantaneous positive amplitude magnitude of the frequency-dependent signal resulting from modulation, and is the instantaneous phase. Since a frequency-dependent decomposition is carried out, the instantaneous frequency value is much smaller than the instantaneous phase value, but it is obtained from the time-dependent derivation of this phase value. EMD decomposition continues until the residual value become a monotonic function. No more IMFs are produced after this state is reached. The termination criterion for the predefined threshold value is determined by the normalized standard difference (NSD) (Equation (6)) [31].
where represents the IMF values at each step. When performing a signal decomposition in the EMD method, it is mandatory to have a stopping criterion based on interpolation. This situation has a component that have to constantly renews itself. In order to eliminate such problems, new signal decomposition methods have started to be used. Recently, the collective bandwidth of the modes was minimized [32] thanks to the VMD method, which has adaptively instant optimization [33,34]. In the VMD method, the input signal is reconstructed by combining the modulated signals that are divided into frequency and amplitude parts. EMD decomposes the signal from high frequency to low frequency, while VMD does the opposite. In this method, the signal is decomposed into M modes. All modes are intensified in their own center frequencies. In Equation (7), the mathematical expression of VMD is shown when the input signal is applied [35].
Here, represents the input signal, represents each decomposition mode, and is the center frequency. In the following stages, the Lagrange multiplier and the penalty term are effectuated (Equation (8)).
where is dual slop, is Dirac distribution and represents Lagrangian multiplier. In this way, the calculations are repeated by switching to a new step in each iteration. Calculations in the frequency domain result in mode decomposition in variational with the help of Parseval/Plancherel Fourier isometry and Hermitian symmetry (Equation (9)).
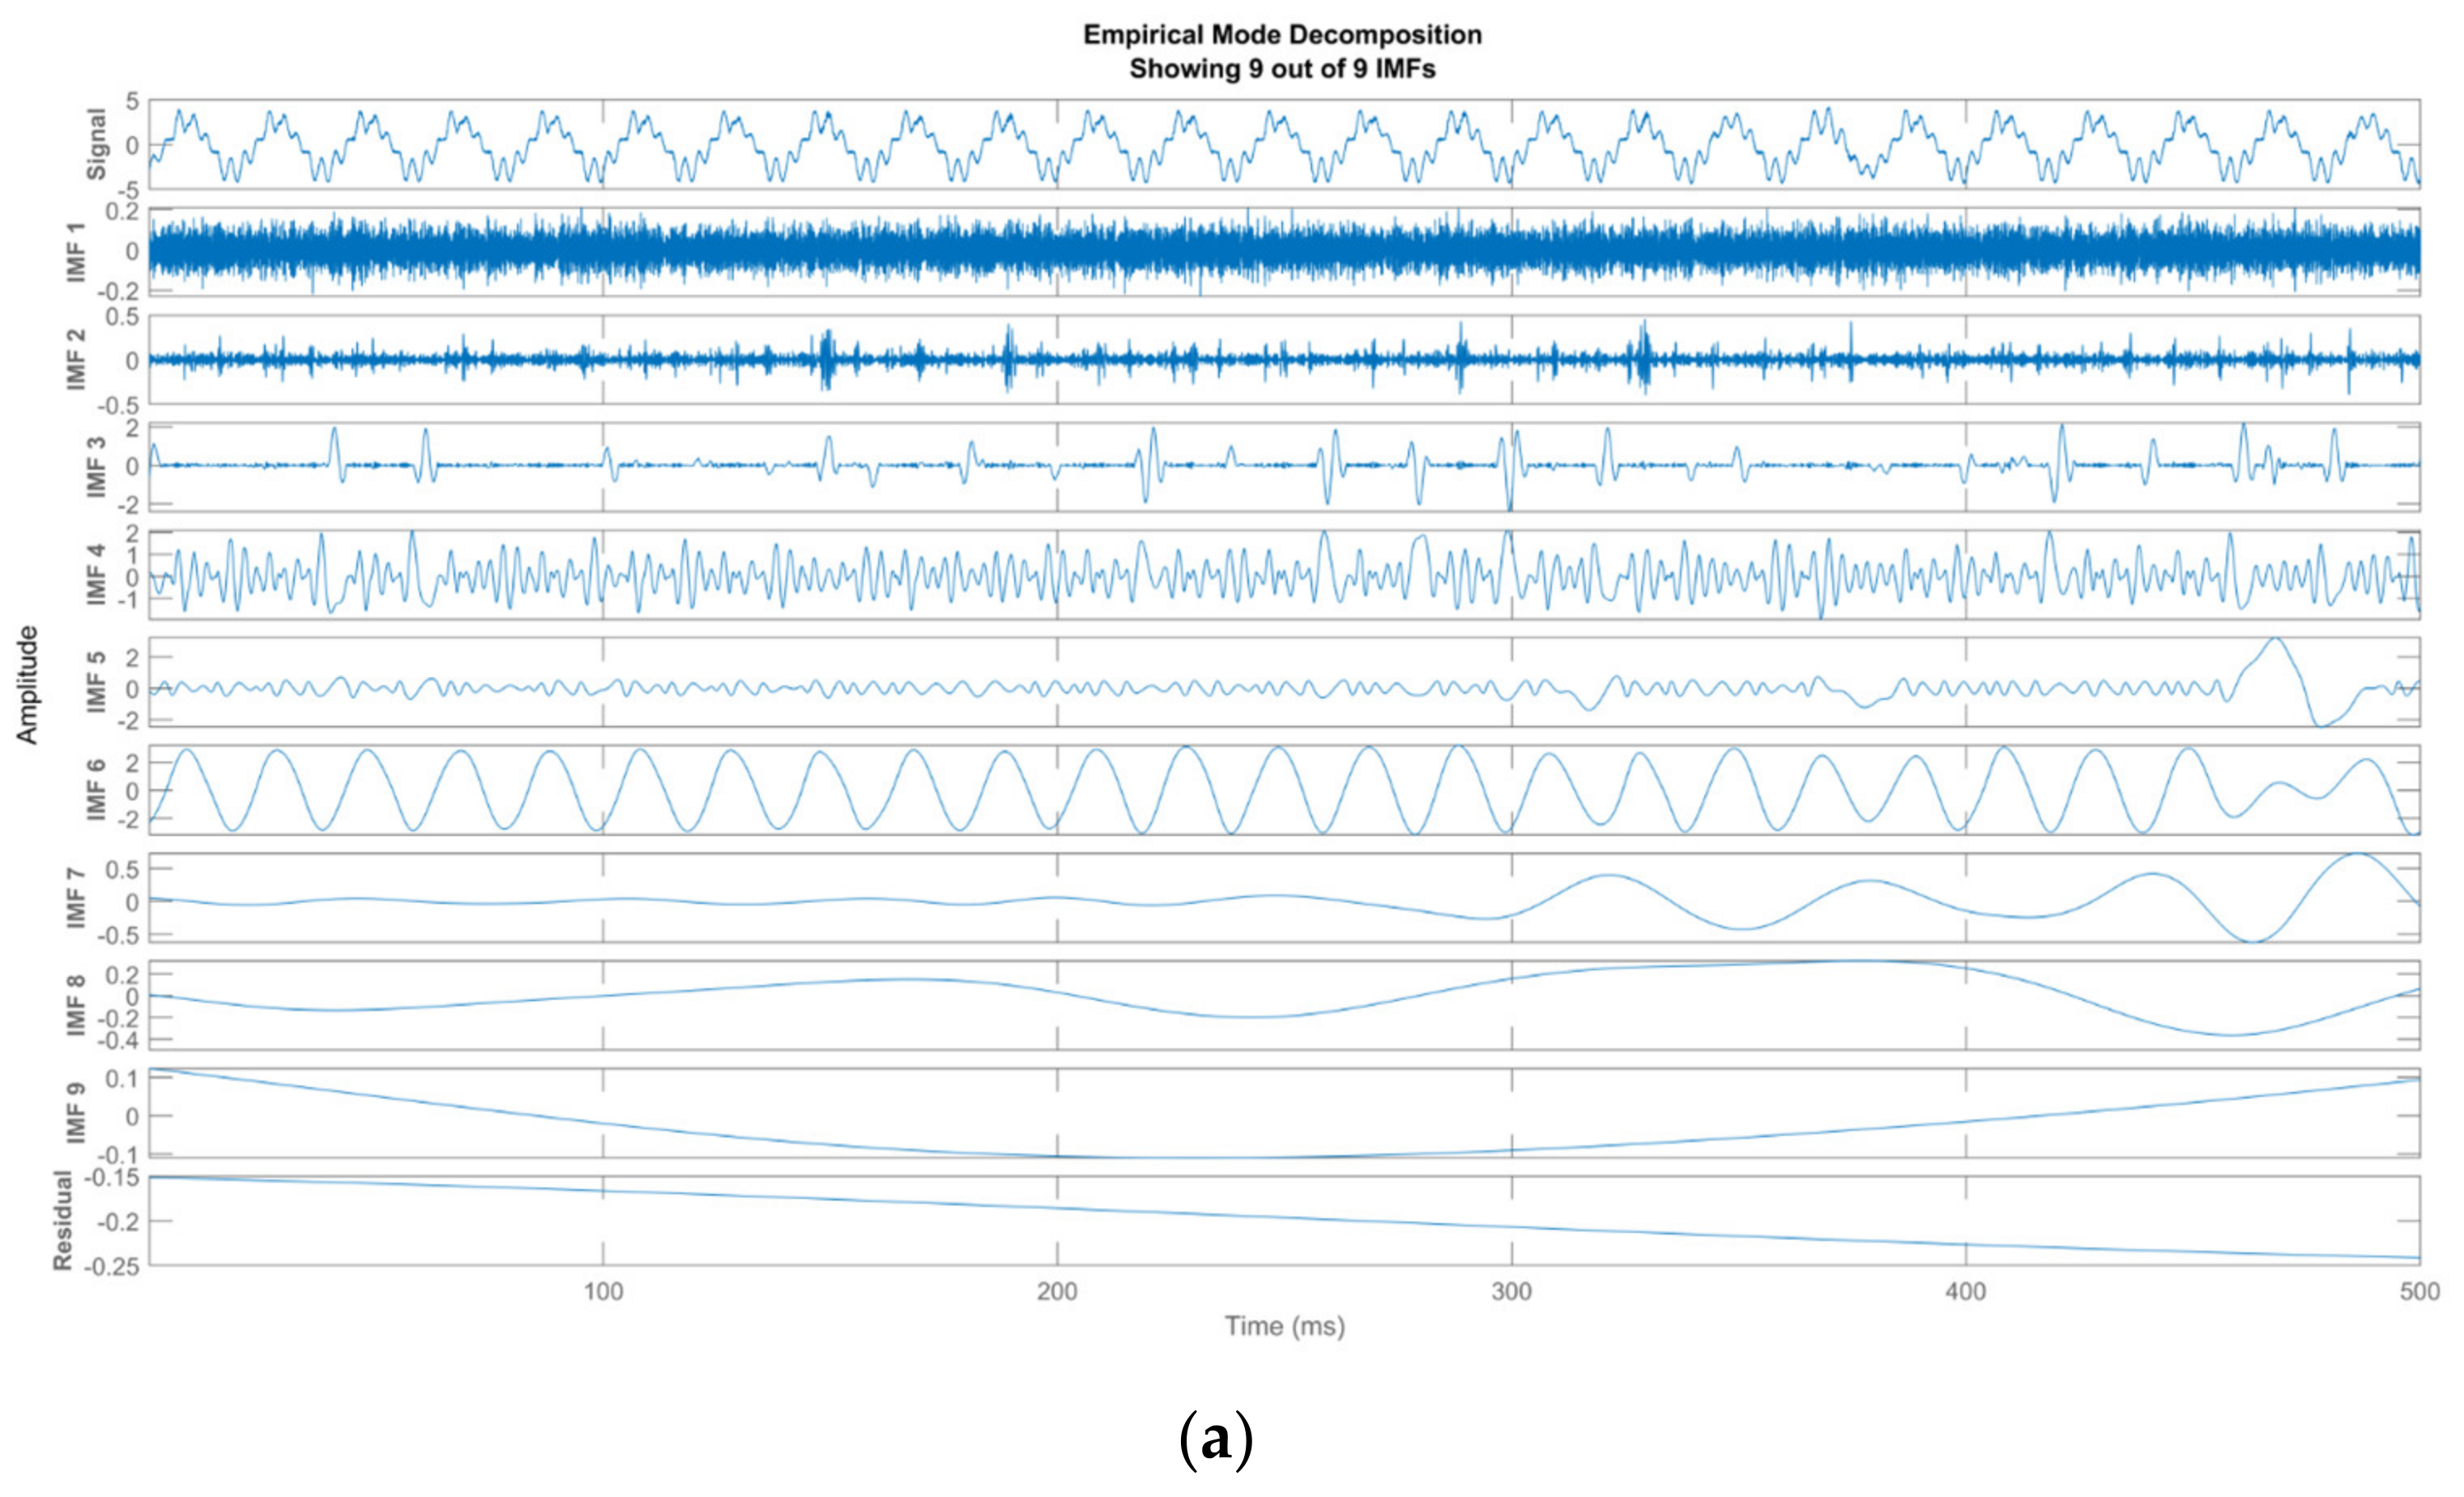
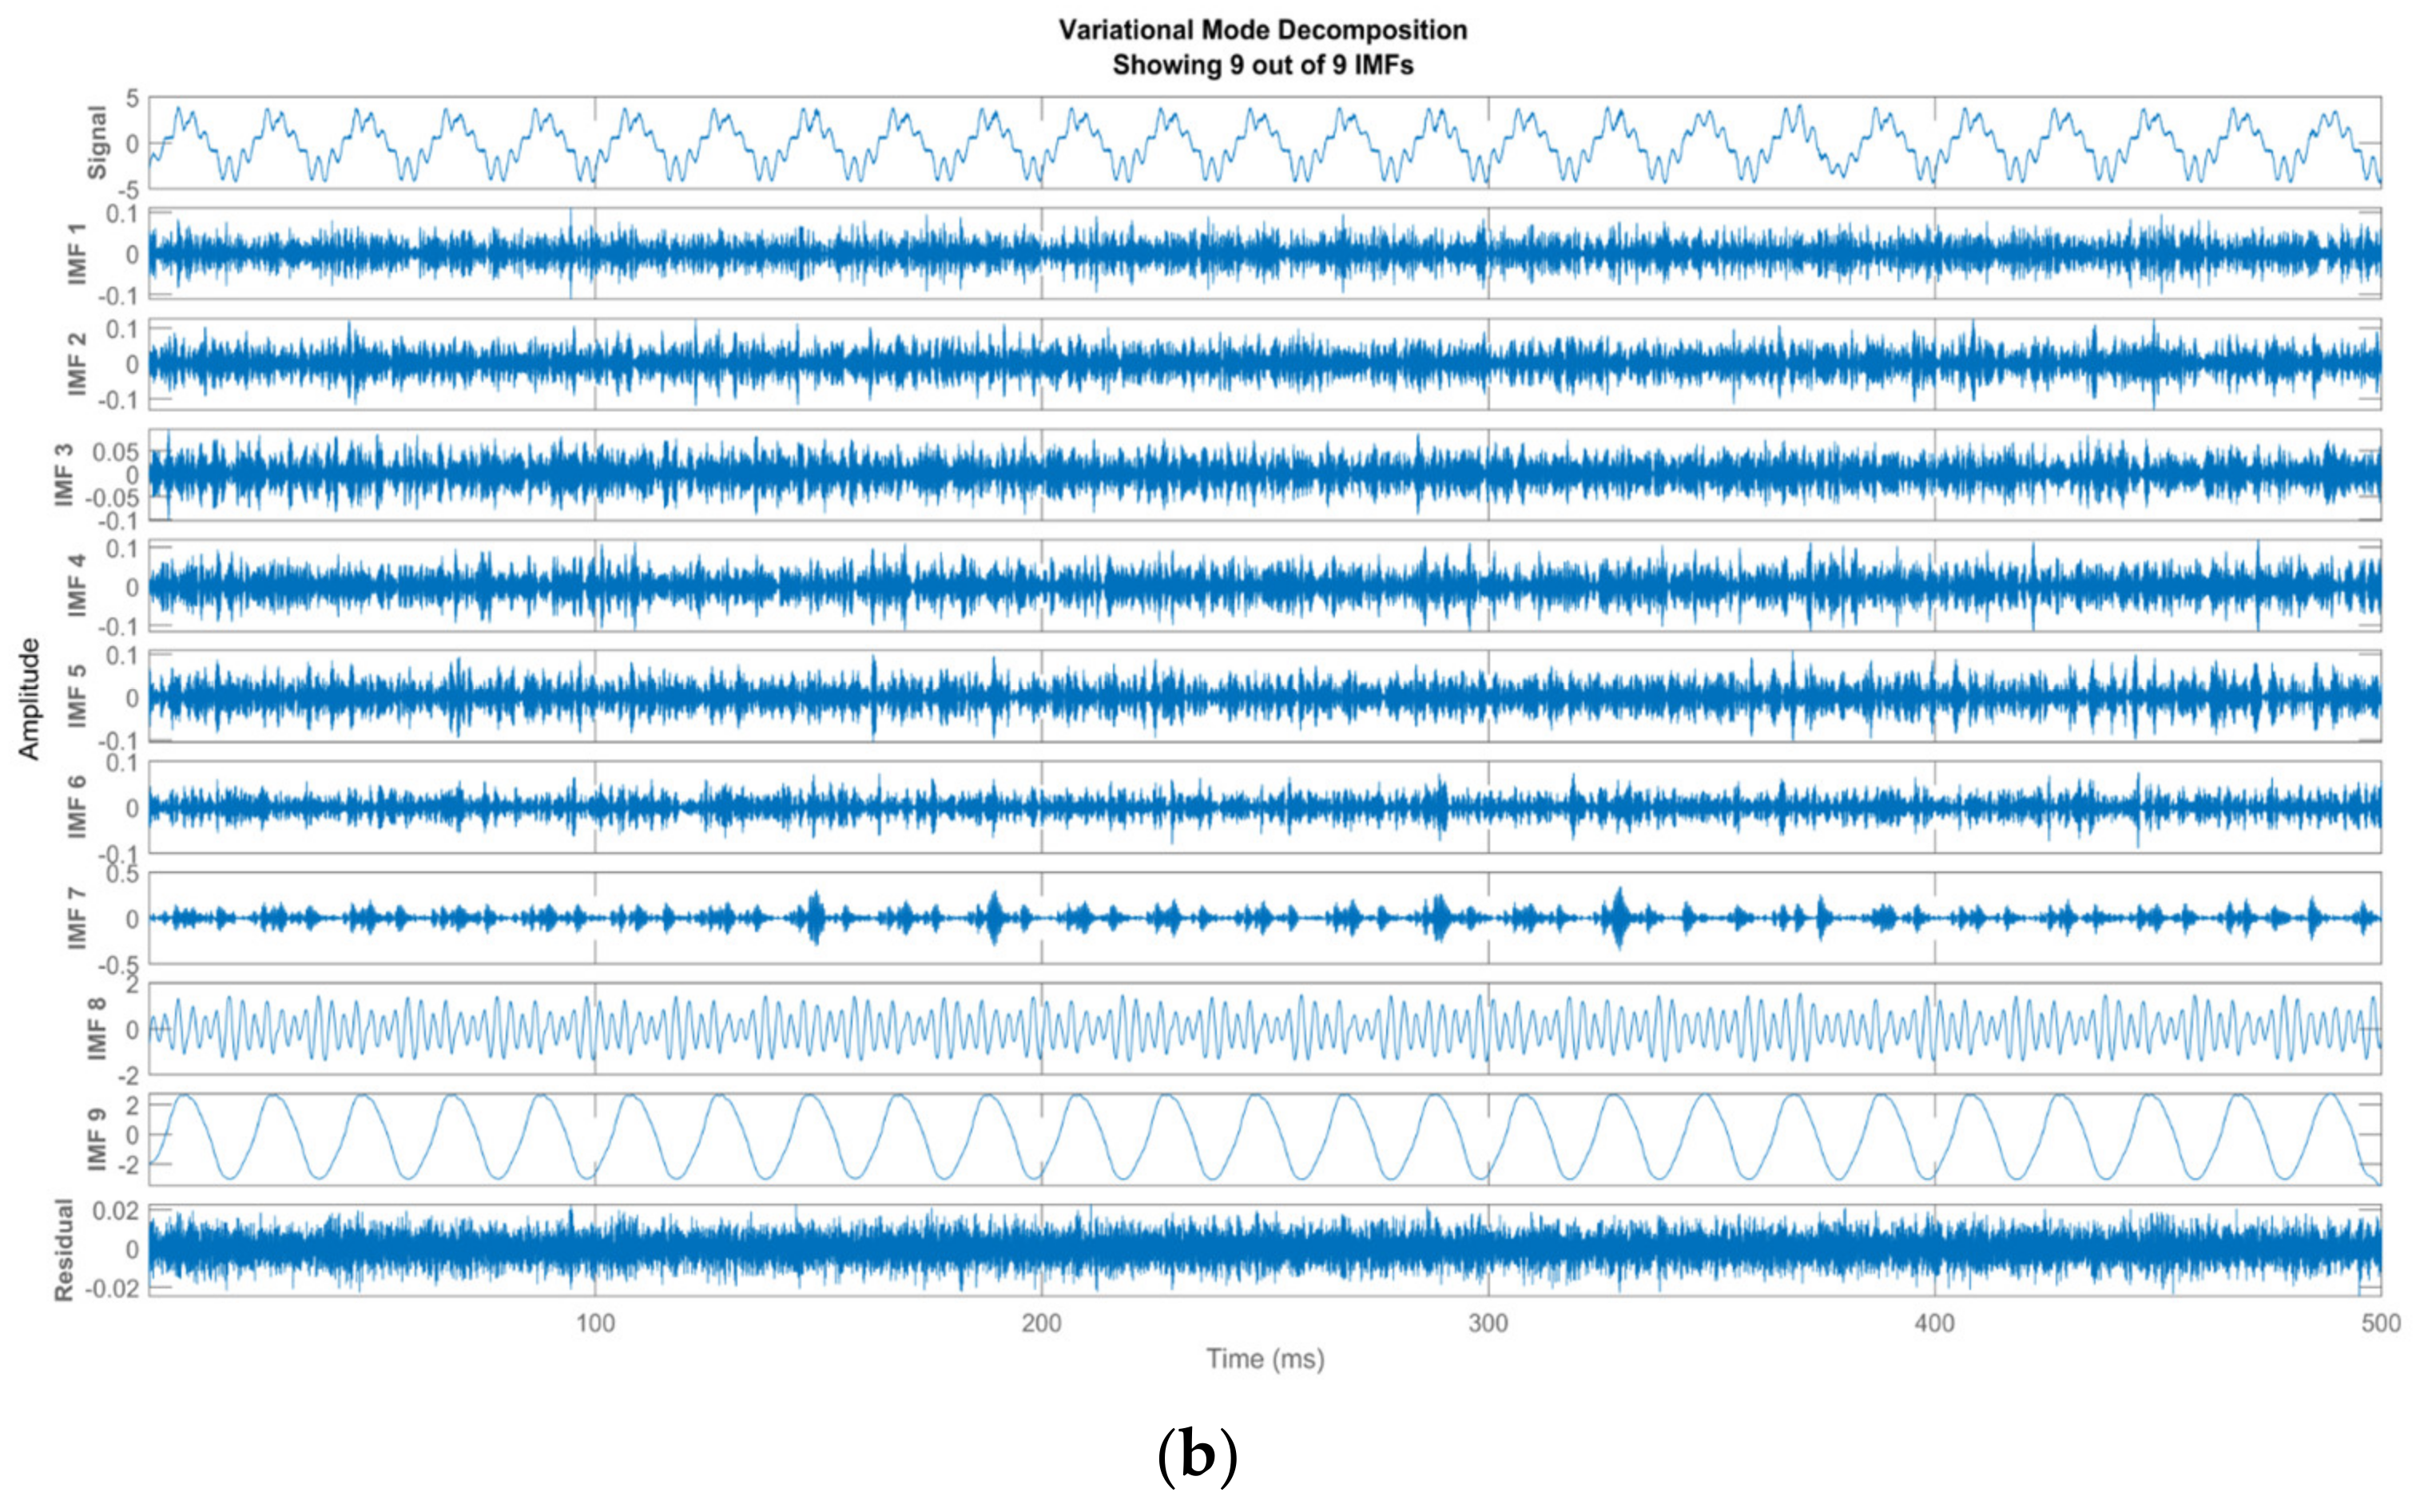
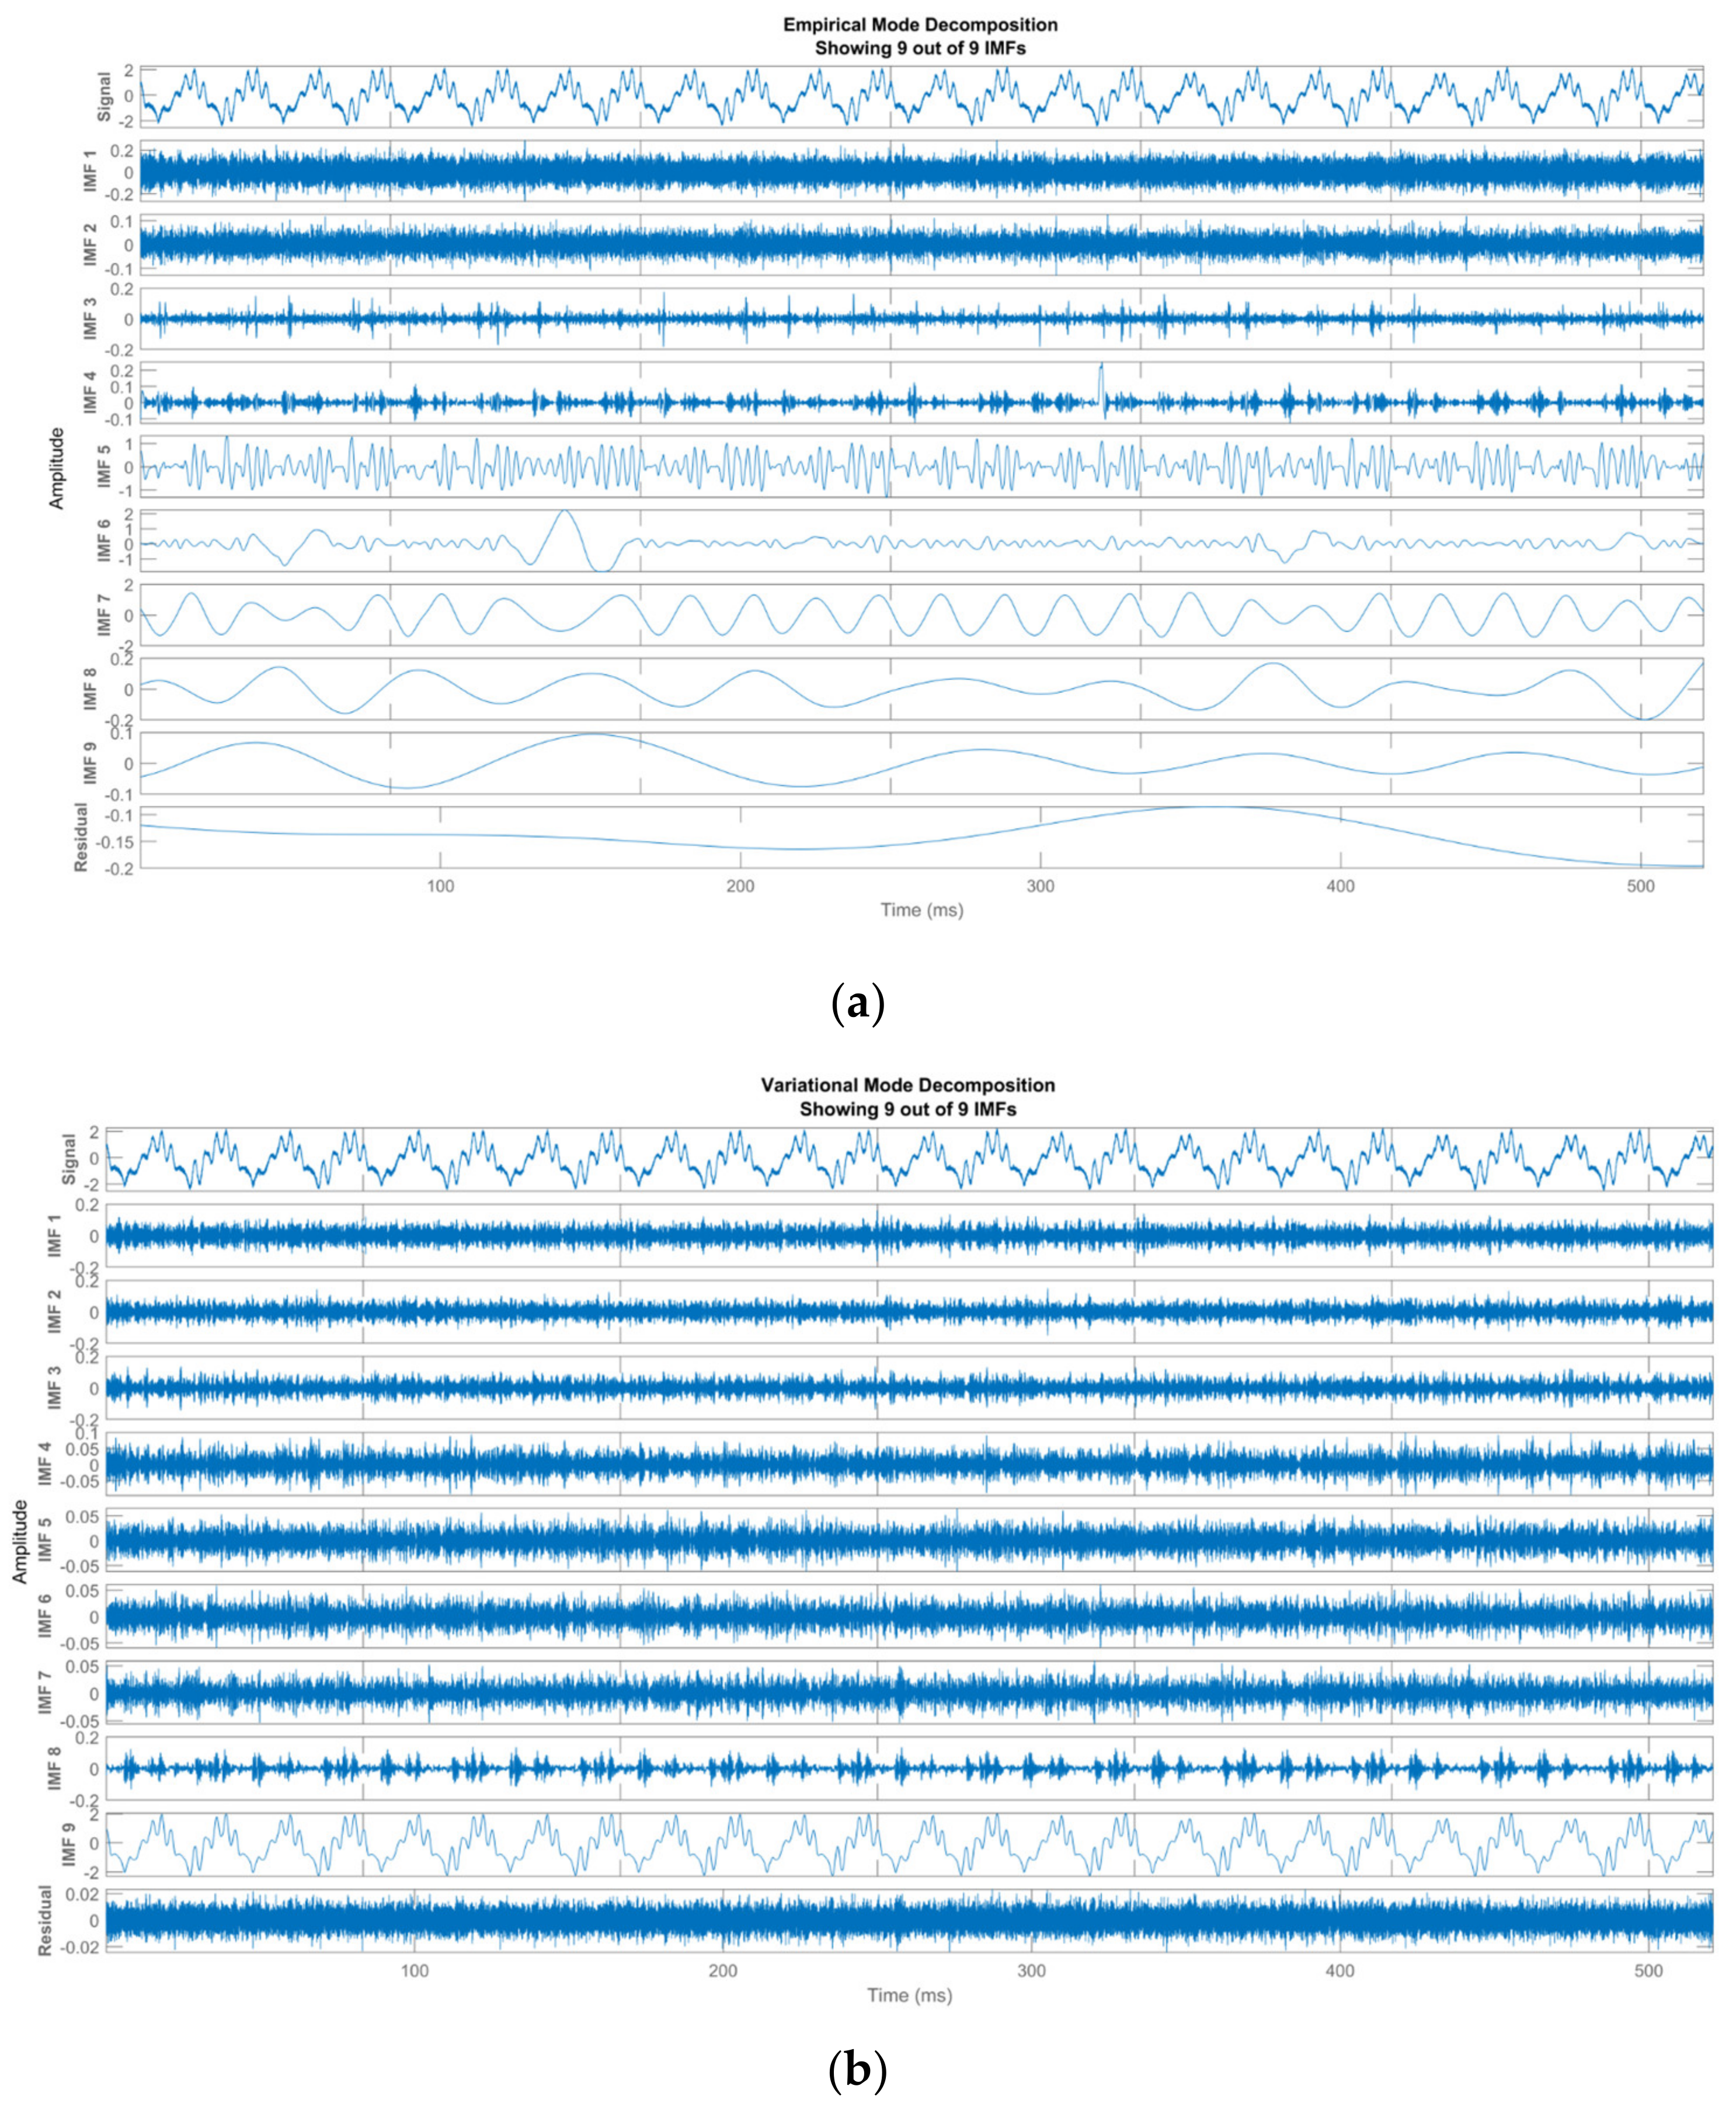
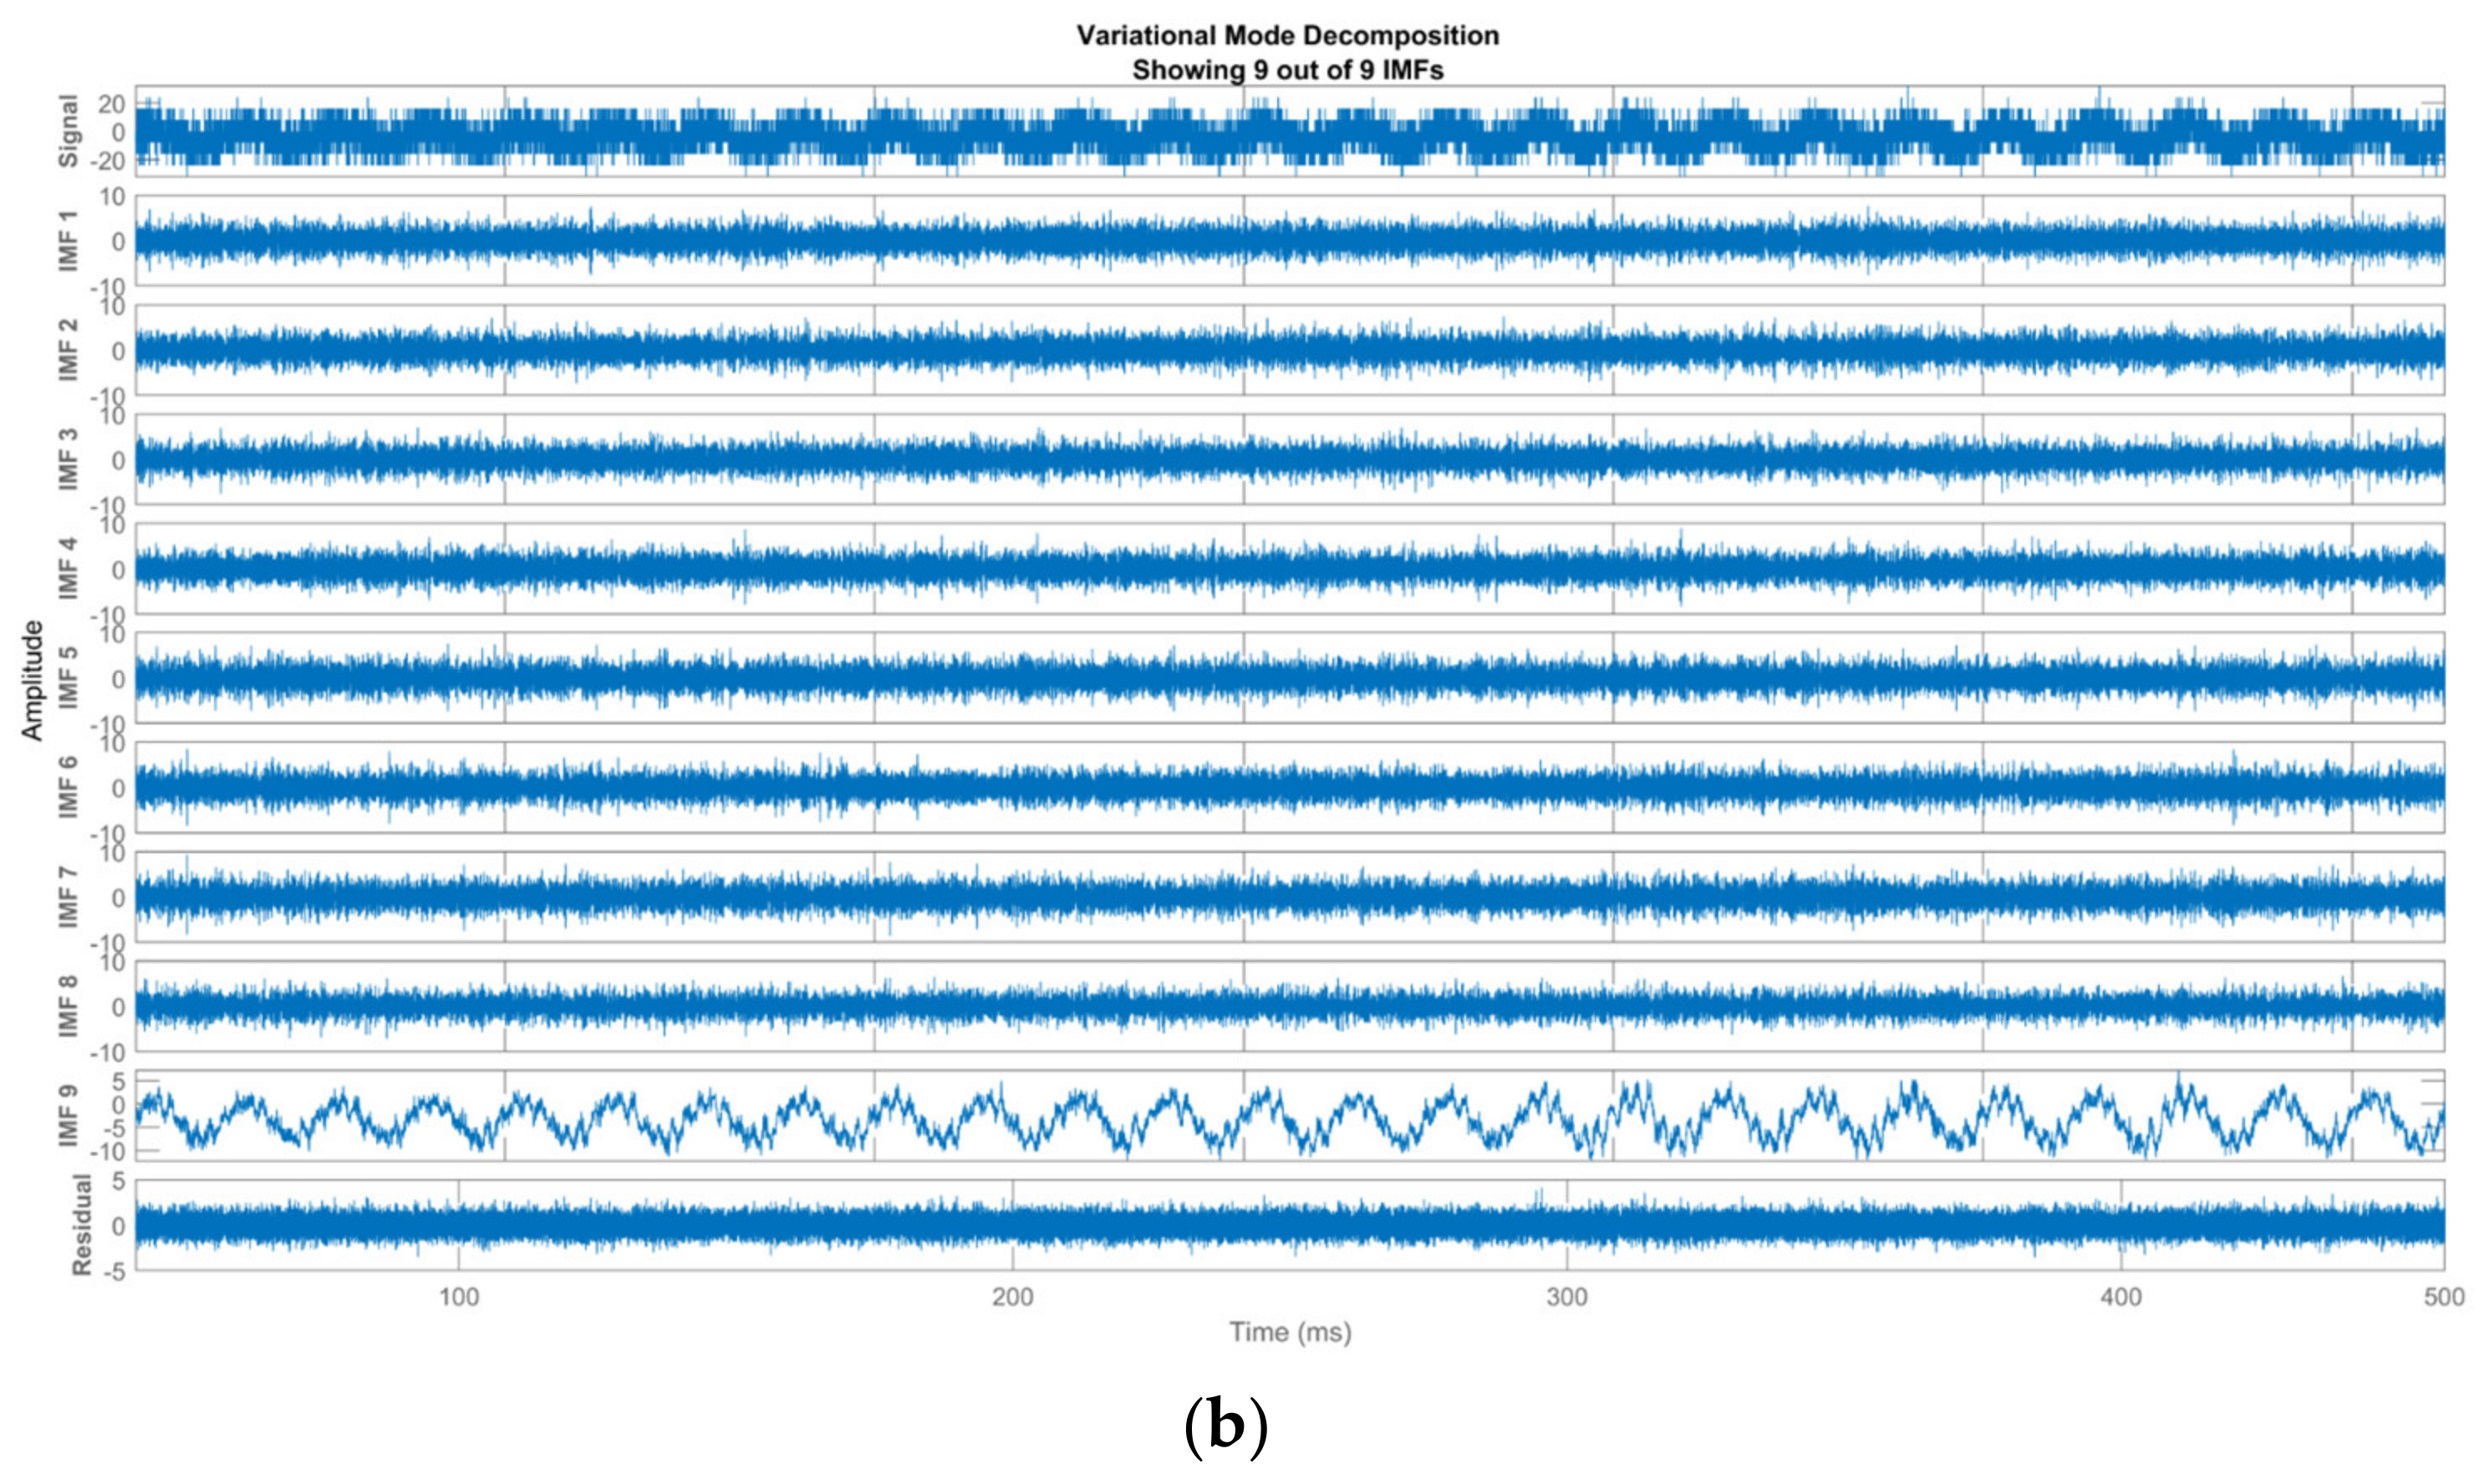
Therefore, the decomposition of modes around the center frequency is completed. In both methods, the modes have different information within themselves while being decomposed. In this way, the electrical breakdown process can be interpreted by analyzing the current signals using these two methods. It is known that the discharges at high frequencies decrease as the electrode gap increases. In addition, since synthetic ester liquid had the best insulation characteristics in general, the probability of seeing disruptive points or sections in the current waveform components of this oil were not high. Therefore, signal decompositions were applied at the electrode gaps where the most durable oil had the highest breakdown voltage and the worst performing oil in terms of durability had the lowest breakdown voltage. Within the scope of both standards, the voltage rising rate was applied at certain voltage amounts per second. In the evaluation and observation of the IMFs that would occur during the decomposition of the signal corresponding to the voltage increase, the isolation characteristic could not be revealed. Therefore, signals with a duration of 500 ms just before the moment of breakdown were used in the decompositions. In Figure 8 and Figure 9, the decompositions of synthetic ester liquid with the methods of both the VDE and disc electrode configurations at the 2.5 mm electrode gap are given, respectively.
When Figure 8 and Figure 9 are examined, IMF 5 and IMF 6 modes give clues about electrical breakdown in EMD decomposition. The high number of noisy and deformed points in the waveforms of the signals in these modes indicates that the oil was broken down at an earlier voltage level. For synthetic ester liquid, the breakdown voltage level at in VDE electrode arrangement was higher. This can be clearly seen in the IMF 5 and IMF 6 mode signals in the EMD decomposition. In particular, the fact that the IMF 6 signal had an almost clean sine waveform indicates that this oil was suddenly fully discharged at a higher voltage level. It is understood from this situation that the sharp corner effect of the disc electrode will cause more discharge. The spherical curvature structure of the VDE electrode induces less discharge and was a factor influencing the oil’s higher breakdown voltage.
When the current signals for synthetic ester in both electrode configurations were decomposed by the VMD method, there appeared to be a difference in IMF modes and signal shapes that provided clues about the breakdown. As the IMF 8 and IMF 9 signals were compared for both electrode systems, the effect of high discharges at the disc electrodes could be clearly seen. The IMF 9 signal at the VDE electrode had no noise or disruption. However, although there was a sine waveform in the IMF 9 signal in the disc electrode arrangement, the signal showed a distorted structure. This situation could be interpreted as an indication that the oil would be broken down in a shorter time.
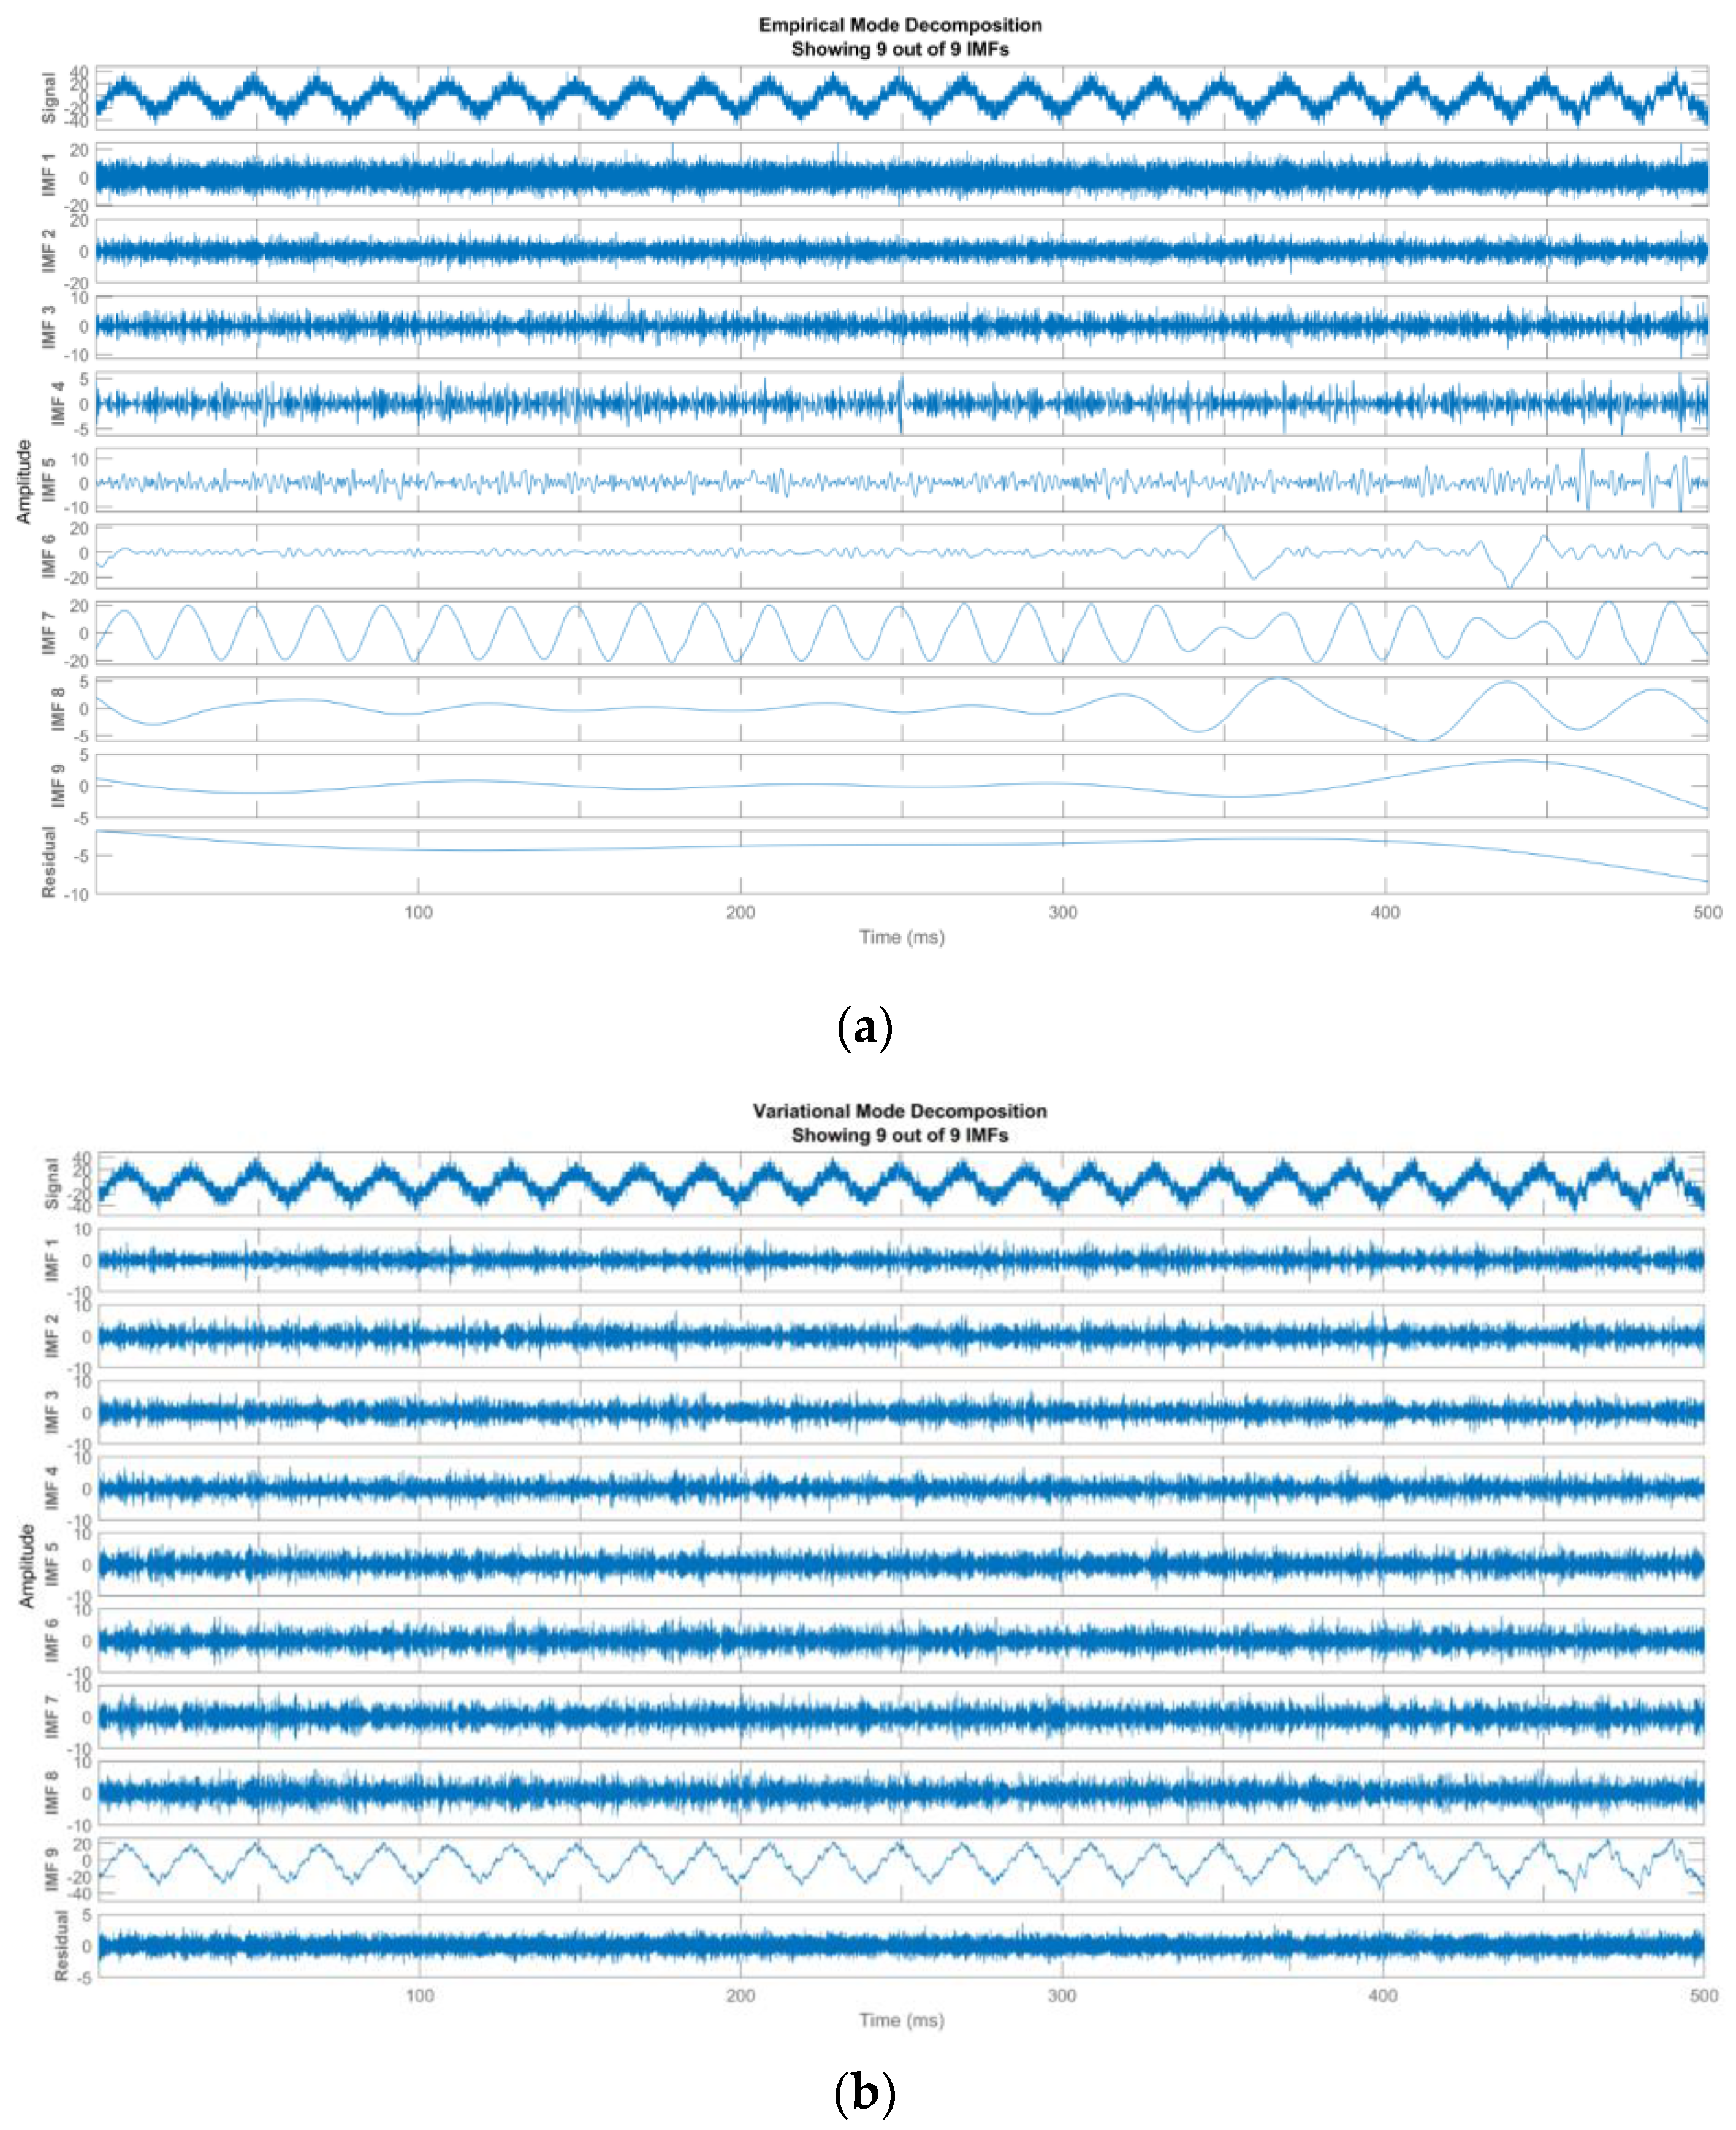
It can be clearly seen from Table 2 that natural ester breaks down under lower AC voltages than synthetic ester. The decomposition signals produced by the EMD and VMD methods for the current signals of natural ester at the 2 mm electrode gap under both electrode arrangements are shown in Figure 10 and Figure 11.
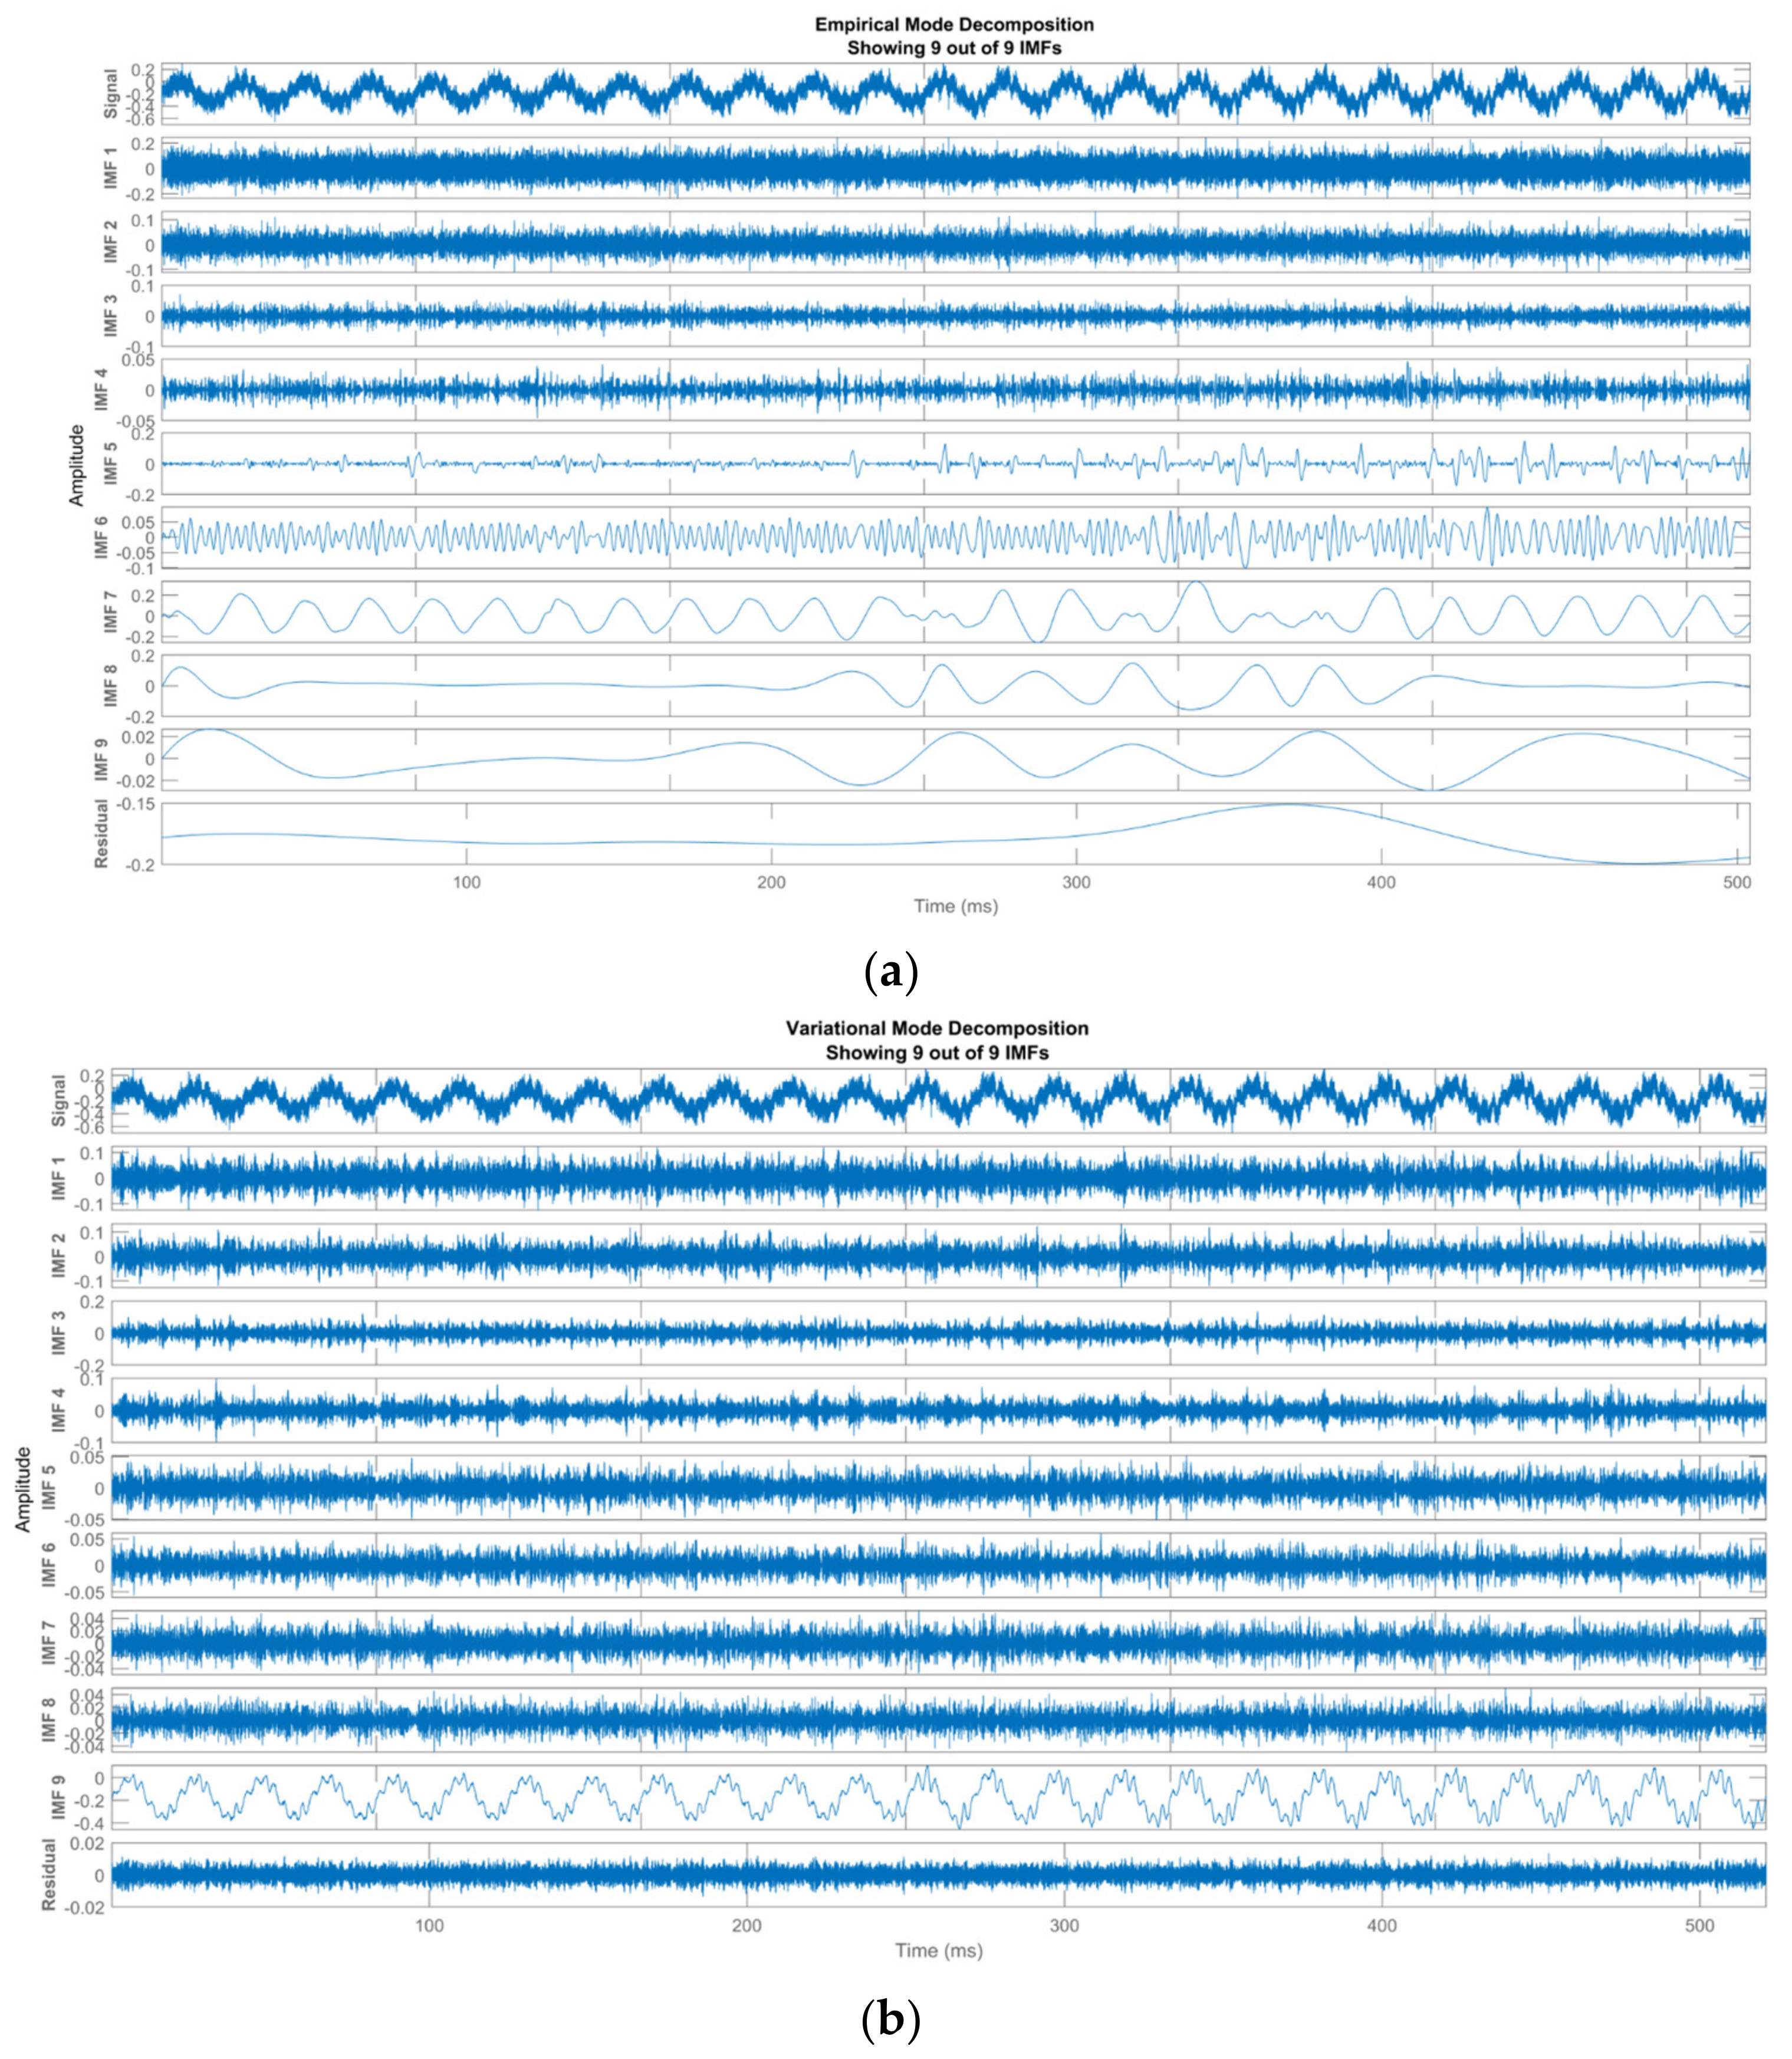
EMD separation finished earlier under the disc electrode arrangement, as can be clearly seen in Figure 10 and Figure 11. Especially in the waveforms of the IMF 6 and IMF 7 modes, it is clear that there was less noise in the experiments using the disc electrodes. This situation highlights a feature different from that of the synthetic ester liquid. As a result, less noise in the EMD decomposition of the natural ester revealed that the insulation characteristic of this oil is not the same as that of synthetic ester. Decomposition with the VMD method demonstrated that the IMF 8 mode had a more decomposed waveform under the VDE electrode arrangement. This situation revealed that the discharges affecting the distortion were less at low frequencies. It also provided us with the insight that the natural ester liquid had a lower breakdown voltage under the disc electrode configuration. Mineral oil was determined to be the liquid dielectric with the worst insulating characteristics, according to the results of the experiments with both electrode systems. Signal decomposition of this oil at the minimum electrode gap is shown in Figure 12 and Figure 13.
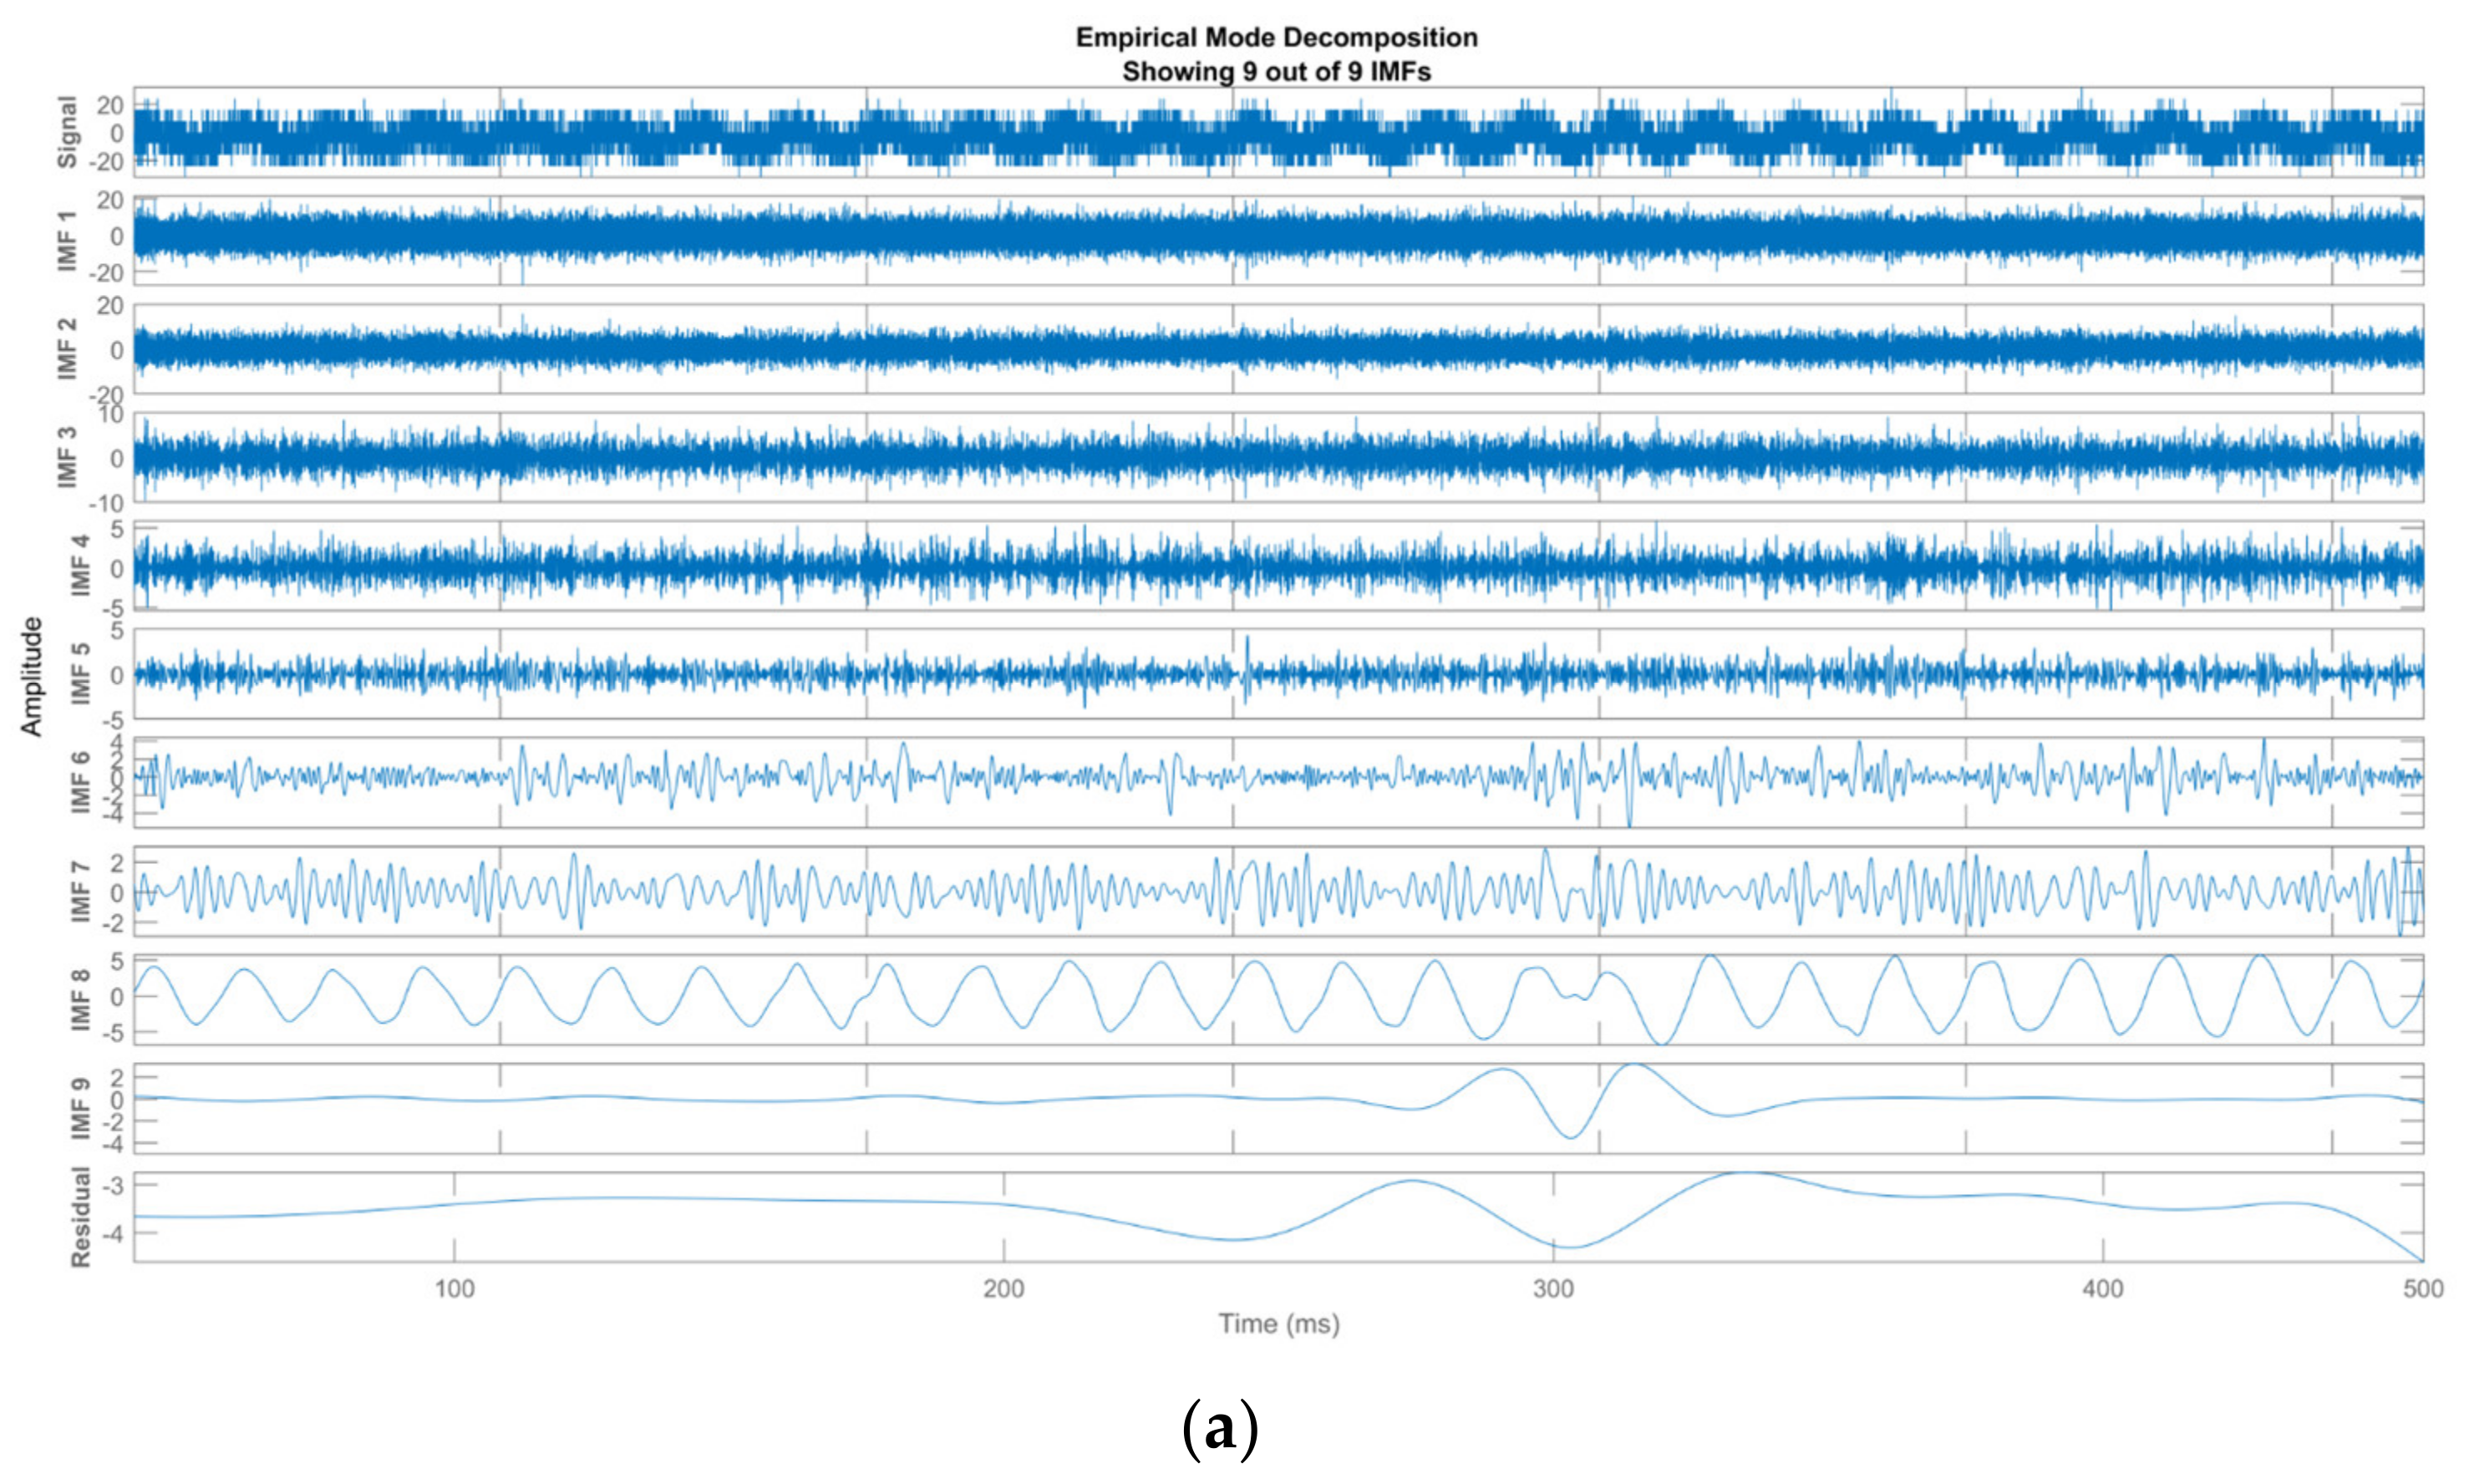
In the current signal decomposition of mineral oil by the EMD method, it was observed that there were more parasitic points in the waveforms of the IMF 5, IMF 6 and IMF 7 modes in the disk electrode system. This indicated that the oil was fully discharged at lower voltage under increased electric field stress. VMD decomposition did not reveal a complete difference between the two electrode configurations because there was too much discharge at the 1 mm electrode gap. Only IMF 9 appeared to have a cleaner sine wave in the VDE electrode system. This indicated that the electrode structure had a feature that eliminated discharges.
5. Lightning Impulse Voltage Experiments
An impulse voltage with negative polarity was implemented in the experimental setup. The peak value of the impulse voltage was measured using a peak voltmeter over the resistive voltage divider at the output of the generator. Impulse signal waveforms were recorded with the help of an oscilloscope. In each measurement, the light emitted during the discharge process in the test cell was registered using a photomultiplier-based method. A Hamamatsu R1925A model photomultiplier with a spectral response range of 300–850 nm was used. This precise measurement was performed with a fiber optic cable comprising 37 individual fibers. The applied impulse voltage increment rate value was 5 kV. After each impulse application, a time delay or waiting time of 1 min was applied before the increasing the voltage to the next level, as required by [21]. Reliable results were obtained when the impulse was applied at least four times before the breakdown occurred. Five measuring procedures were performed, and the signals of voltage and light were recorded for each. After a breakdown occurred, we waited for 30 min before continuing with the measurements. Thirty minutes was the optimum time for the oil to recover and be ready for the next test.
From the above, the breakdown voltage calculations in the LI tests were made by taking the arithmetic mean of five BDVs collected from five measuring procedures. In addition, the standard deviations (Equation (10)) of the breakdown voltages obtained from these experiments, median values and error calculations (Equation (11)), according to the mean, were also calculated. Time to Breakdown (TtB), which is an additional numerical value that does not give precise information about the dielectric strength of the liquid but does inform about liquid resistance to impulse stress, was also a focus of the LI-based studies. The evaluation of TtB is vital, because the impulse voltage occurs in a very short time. Additionally, when dividing the TtB by the constant 25 mm interelectrode gap, it is possible to calculate the discharge propagation velocity. By taking the average of the values obtained from the five repeated experiments, the values measured and calculated as a result of the impulse voltage tests were as listed in Table 10.
As can be clearly seen from Table 10, the most durable liquid dielectric was mineral oil. Even though mineral oil had the lowest breakdown voltage in the AC and DC voltage tests, it was more resistant to possible impulse voltage than the esters, which confirmed what is known in the literature [19,20,22,23]. In this particular case of impulse voltage, the behavior of mineral oil could be assumed to occur in a manner opposite to its dielectric performance as measured under AC and DC voltages. As a result of this approach, both the synthetic ester and natural ester had to be broken down under impulse voltage at the lowest electric field stress. In the results obtained, however, just as measured in the AC and DC voltage tests, the insulation performance of the synthetic ester was higher than that of the natural ester. Although natural ester had the lowest breakdown voltage under the LIV, it was observed to have similar BDVs in all of the test repetitions when both the error and standard deviation values were taken into account. Thus, the consistency of the results was high in case of the natural ester. In turn, by analyzing the breakdown voltages measured in all test repetitions, the stability of the synthetic ester was found to be the lowest in the AC tests. It was recognized to exhibit similar behavior in the impulse voltage experiments, with the highest standard deviation and error values.
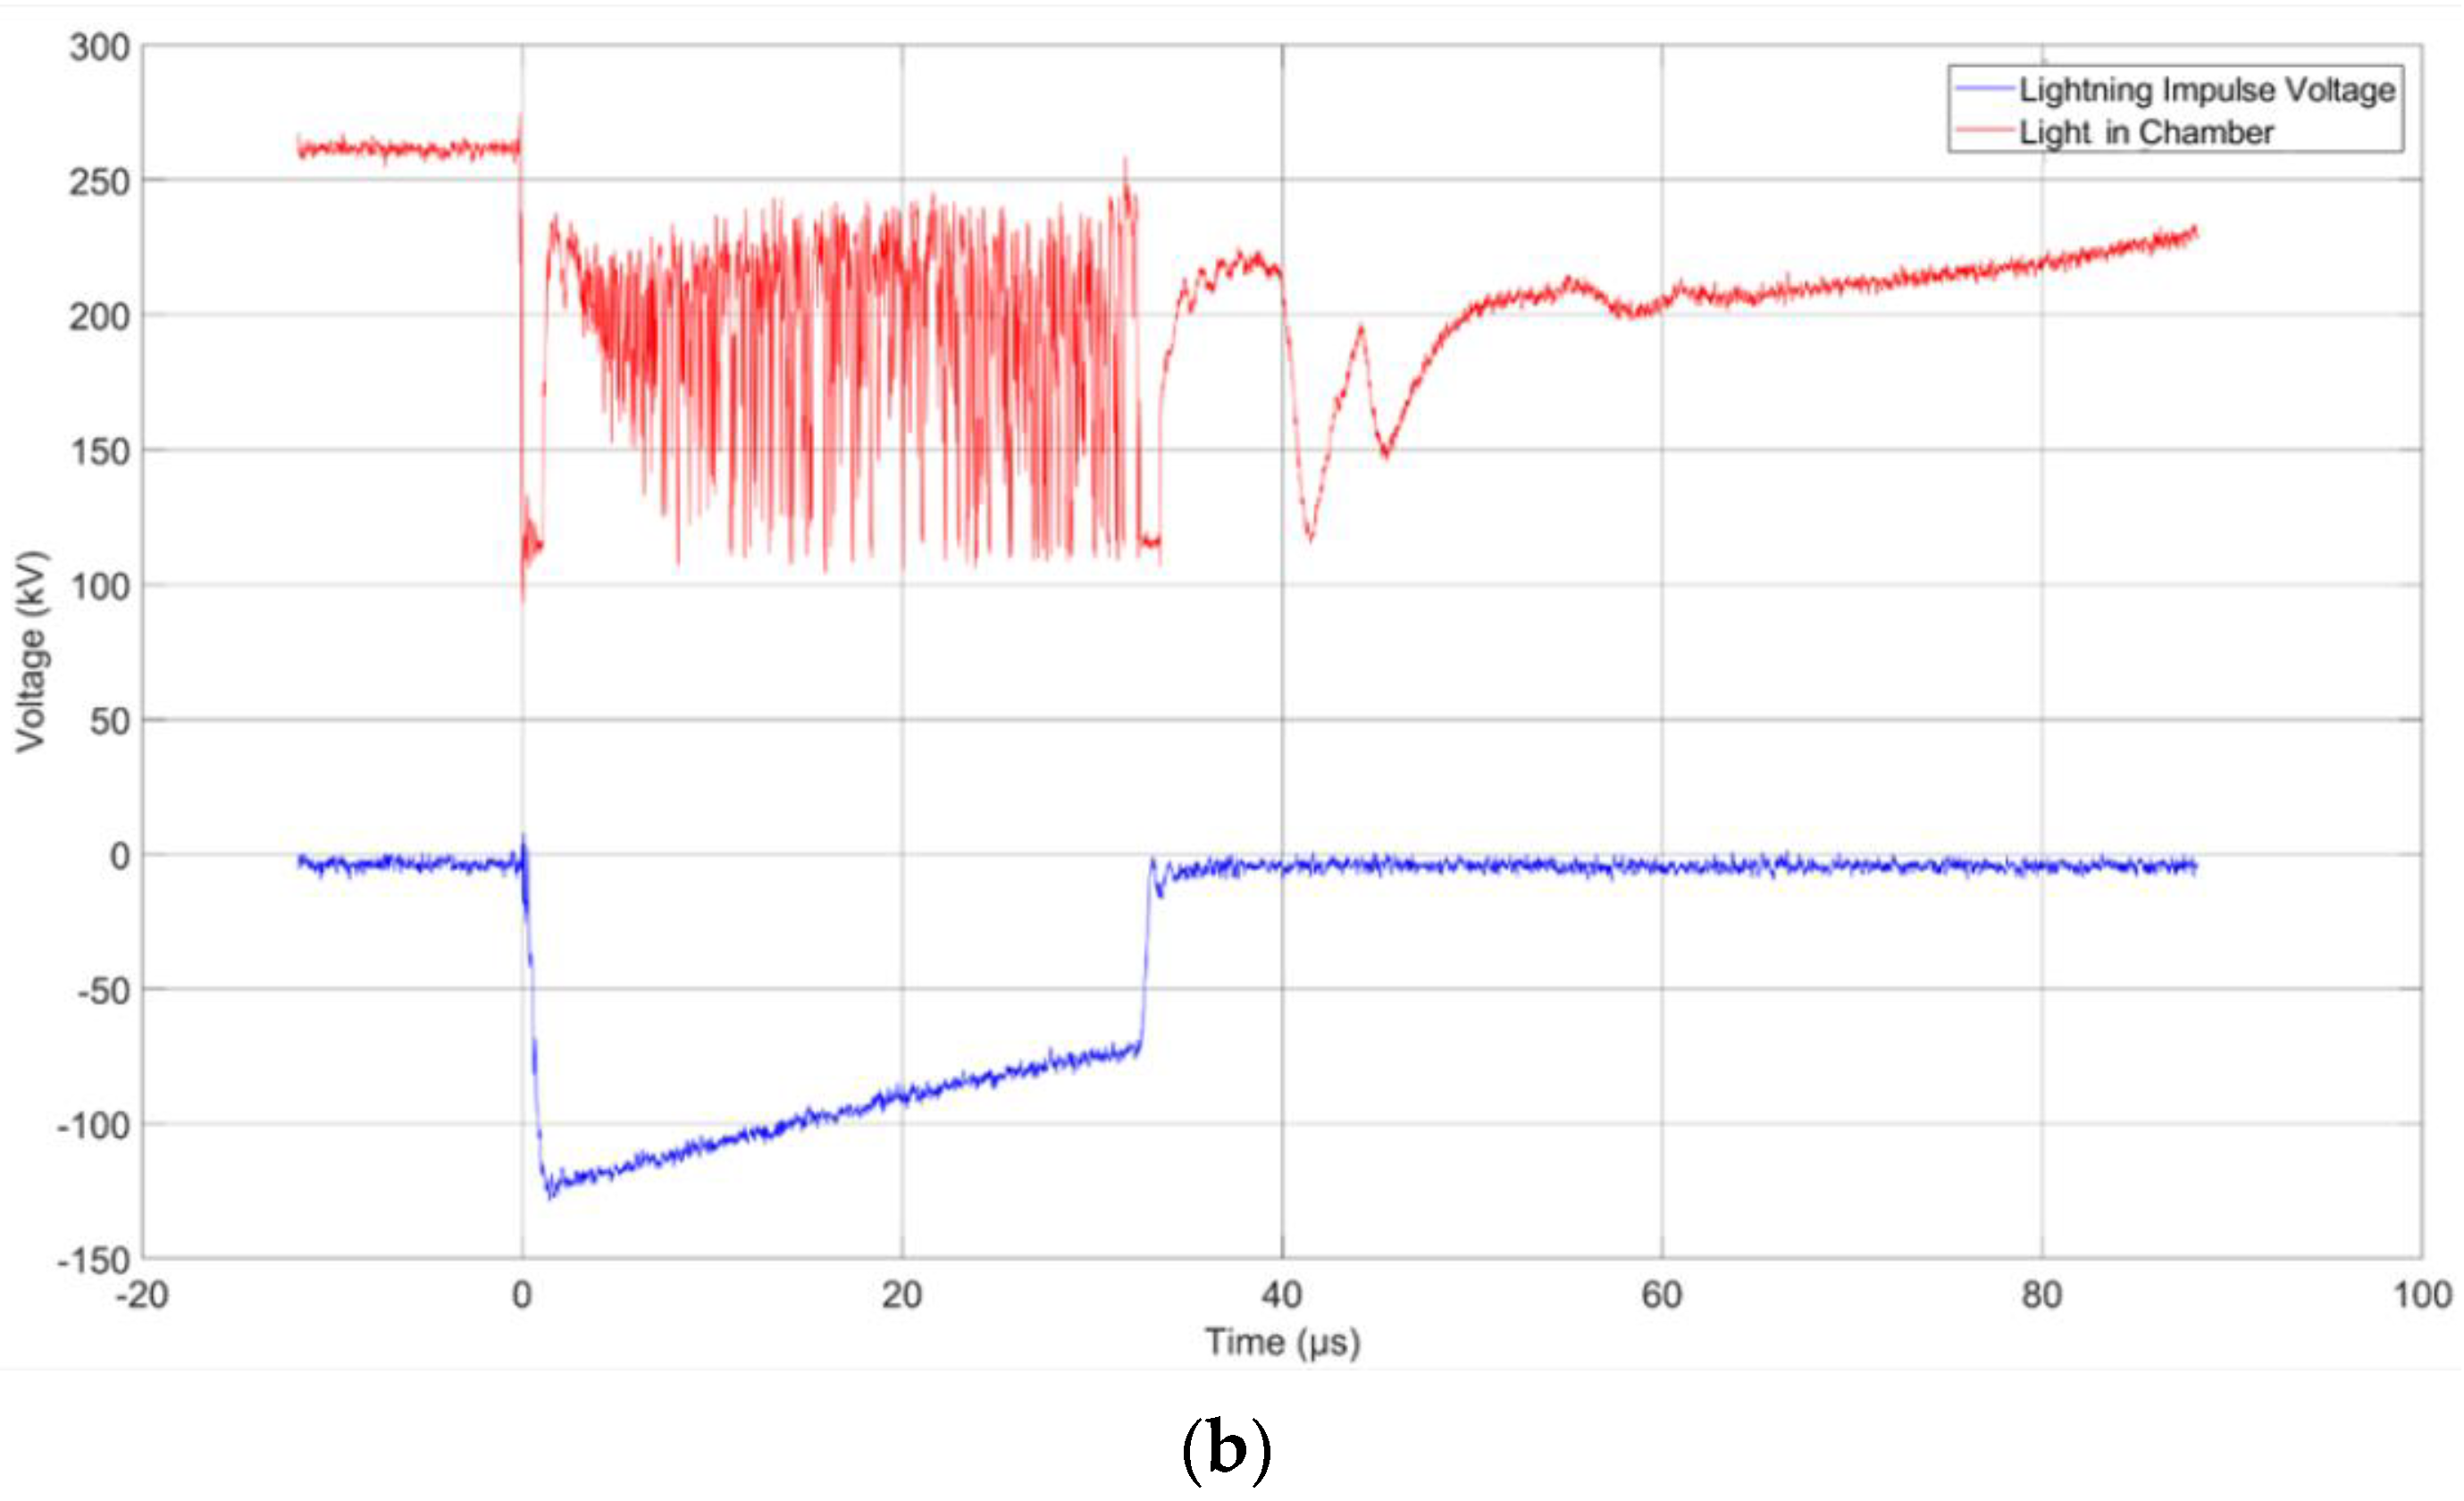
The shortest TtB and slowest propagation velocity value for the synthetic ester could be an indication that this liquid may be treated as a good insulator when stressed with lightning impulse voltages. However, it was characterized by a much lower BDV than that of mineral oil. The fact that the discharge took longer to reach the ground electrode demonstrates that the discharge had a branched and wide structure. It also showed that there were more disruptive and peak points in the impulse voltage and light signals. Still, it is important to remember that lower propagation velocity means that a lower BDV is measured. Examining these signals for each liquid and the values in Table 10 allowed the opportunity to perform a combined evaluation of the performance of the liquids under LIV. Figure 14 shows the measured waveforms for the mineral oil in and outside the electrical breakdown states.
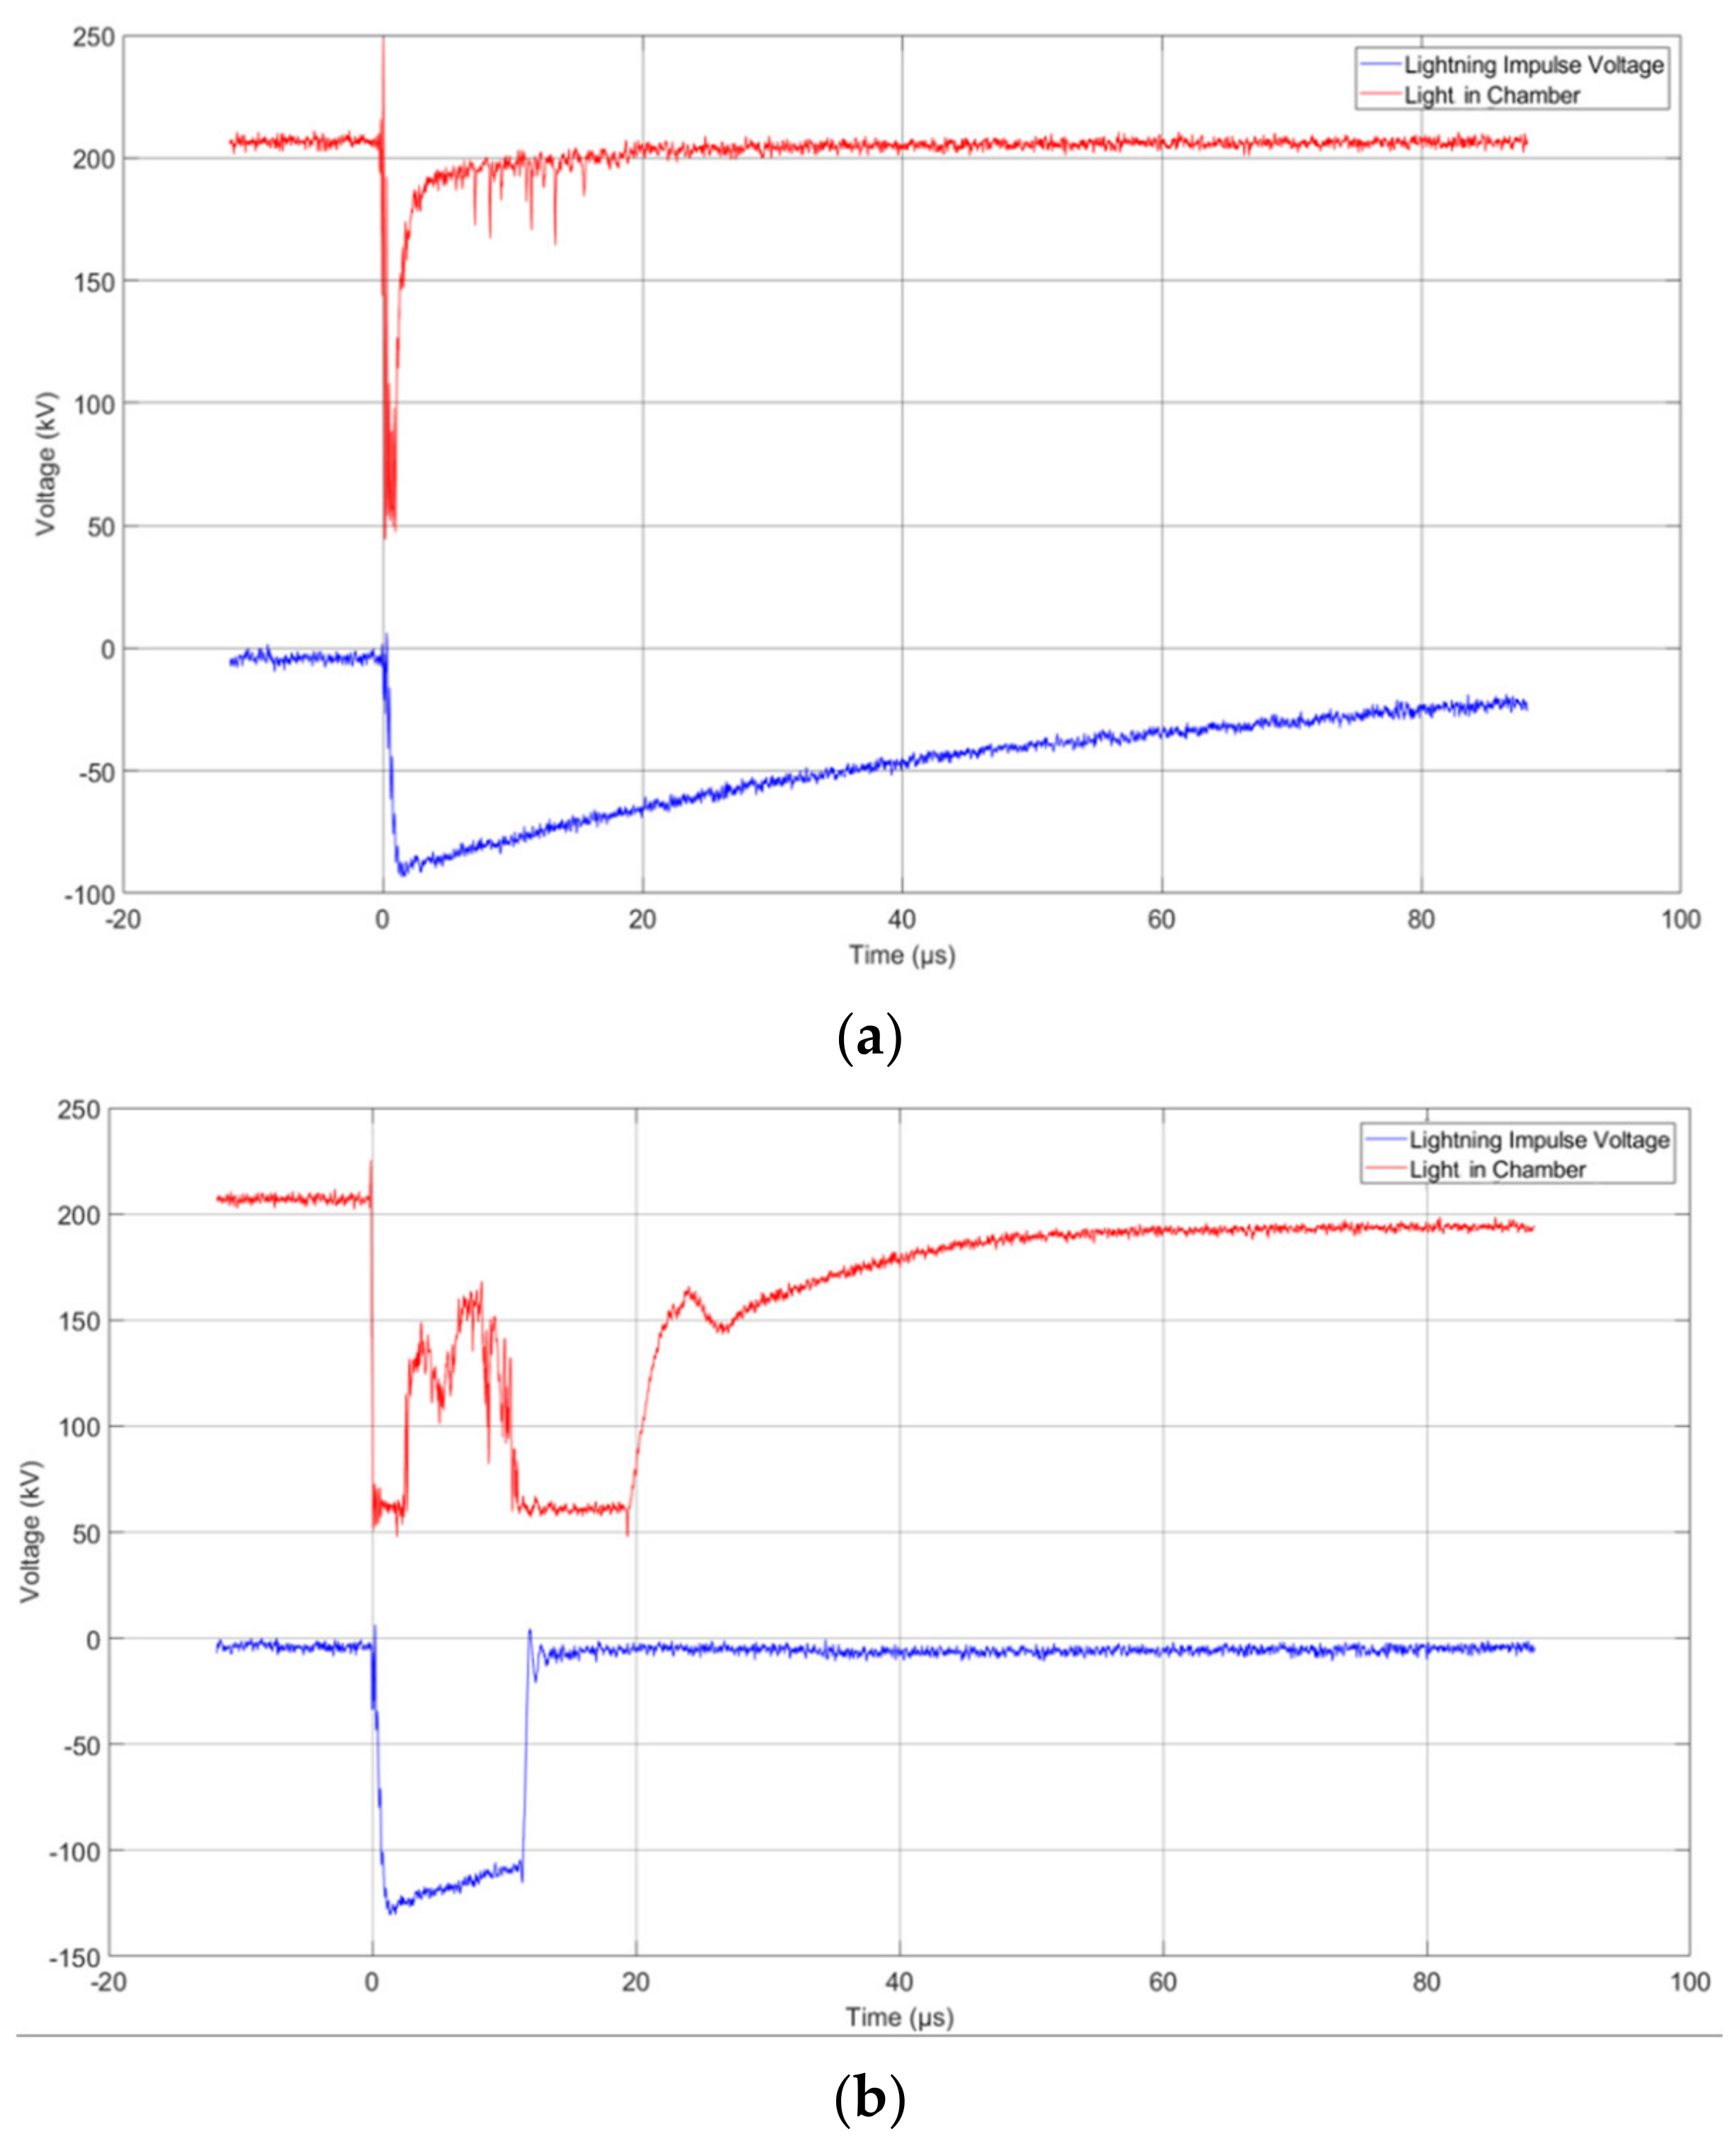
The red waveform in Figure 14 is the result of measurement of the illumination/shining inside the test cell with the use of a photomultiplier. During the lightning measurement, the oscilloscope voltdiv value was 2 V, and the voltdiv value of the impulse voltage (blue waveforms in Figure 14) measured with the help of the resistive voltage divider was 50 V; this, however, represents a 1000:1 voltage ratio of the divider, so 1 V is equal to 1 kV in a real circuit. Measurements were recorded with a sampling frequency of 100 MHz These values from the oscilloscope were the same in the graphs concerning all of the liquids tested.
As can be seen in Figure 14b, the tail time of the LIV was quite long when the breakdown occurred. In addition, after 2.43 µs, the measured lightning voltage was observed to rebound in amplitude during the breakdown in mineral oil. This situation lasted for approximately 8 µs, then the resistance of the oil to the voltage stress ended. After this event, the breakdown was completed, and a conductive path was formed between the the electrodes. This is an indication that the mineral oil has an ability that it quickly tried to recover itself to eliminate the effect of breakdown while during fully discharging. In addition, although mineral oil had a higher breakdown voltage, there were not many disruptive points in the pulse waveforms.
Figure 15 shows the measured waveforms of natural ester under LIV.
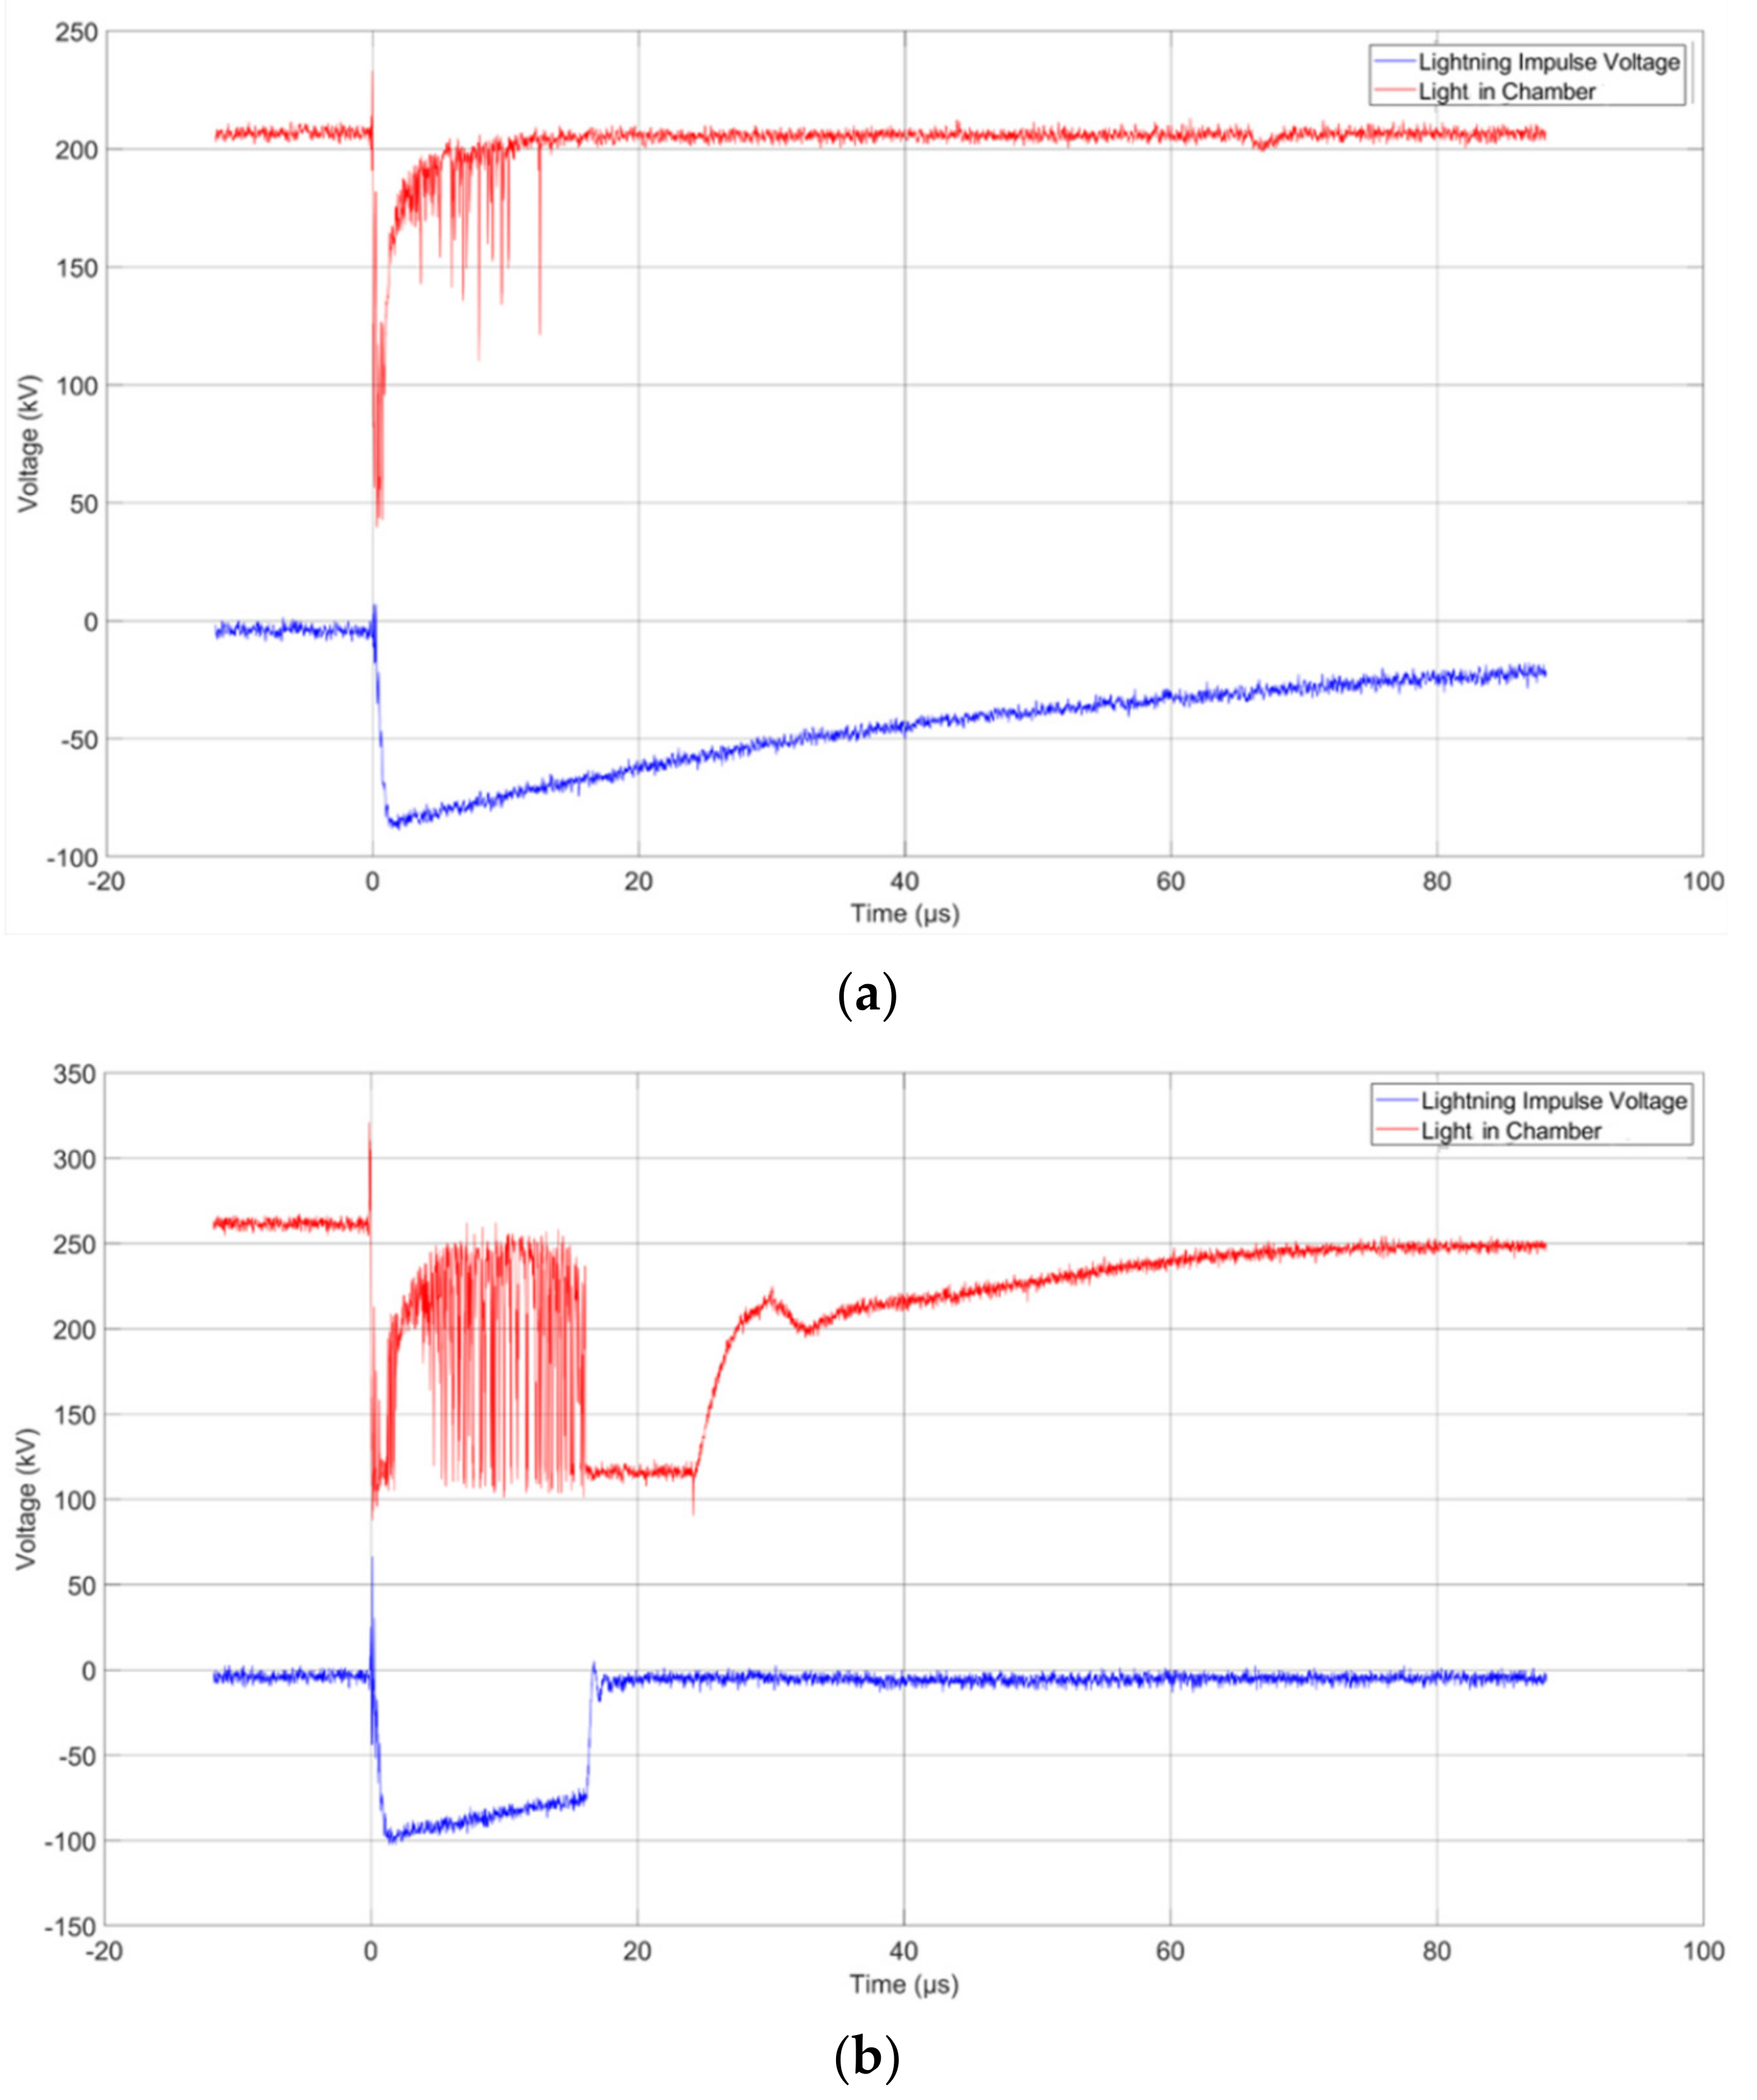
When the impulse voltage and light waveforms of the natural ester were examined, it was observed that there were more degradative and peak points in the light signal without breakdown compared to the mineral oil. These types of peaks were greater both in number and amplitude. This indicates that there was more discharge in the natural ester. A peak point not seen in the mineral oil was detected at the point where the impulse voltage signal started at the time of breakdown for the natural ester. Although the TtB value of the ester was normally lower than that of mineral oil, more discharges were due to the its characteristic behavior under LIV. In particular, intense disruptive peaks between 1.75 µs and 15.95 µs in the light signal significantly reduced the insulation resistance of this liquid. It is clearly seen in Figure 15 that this was the reason why the natural ester liquid was the weakest dielectric under LI stress.
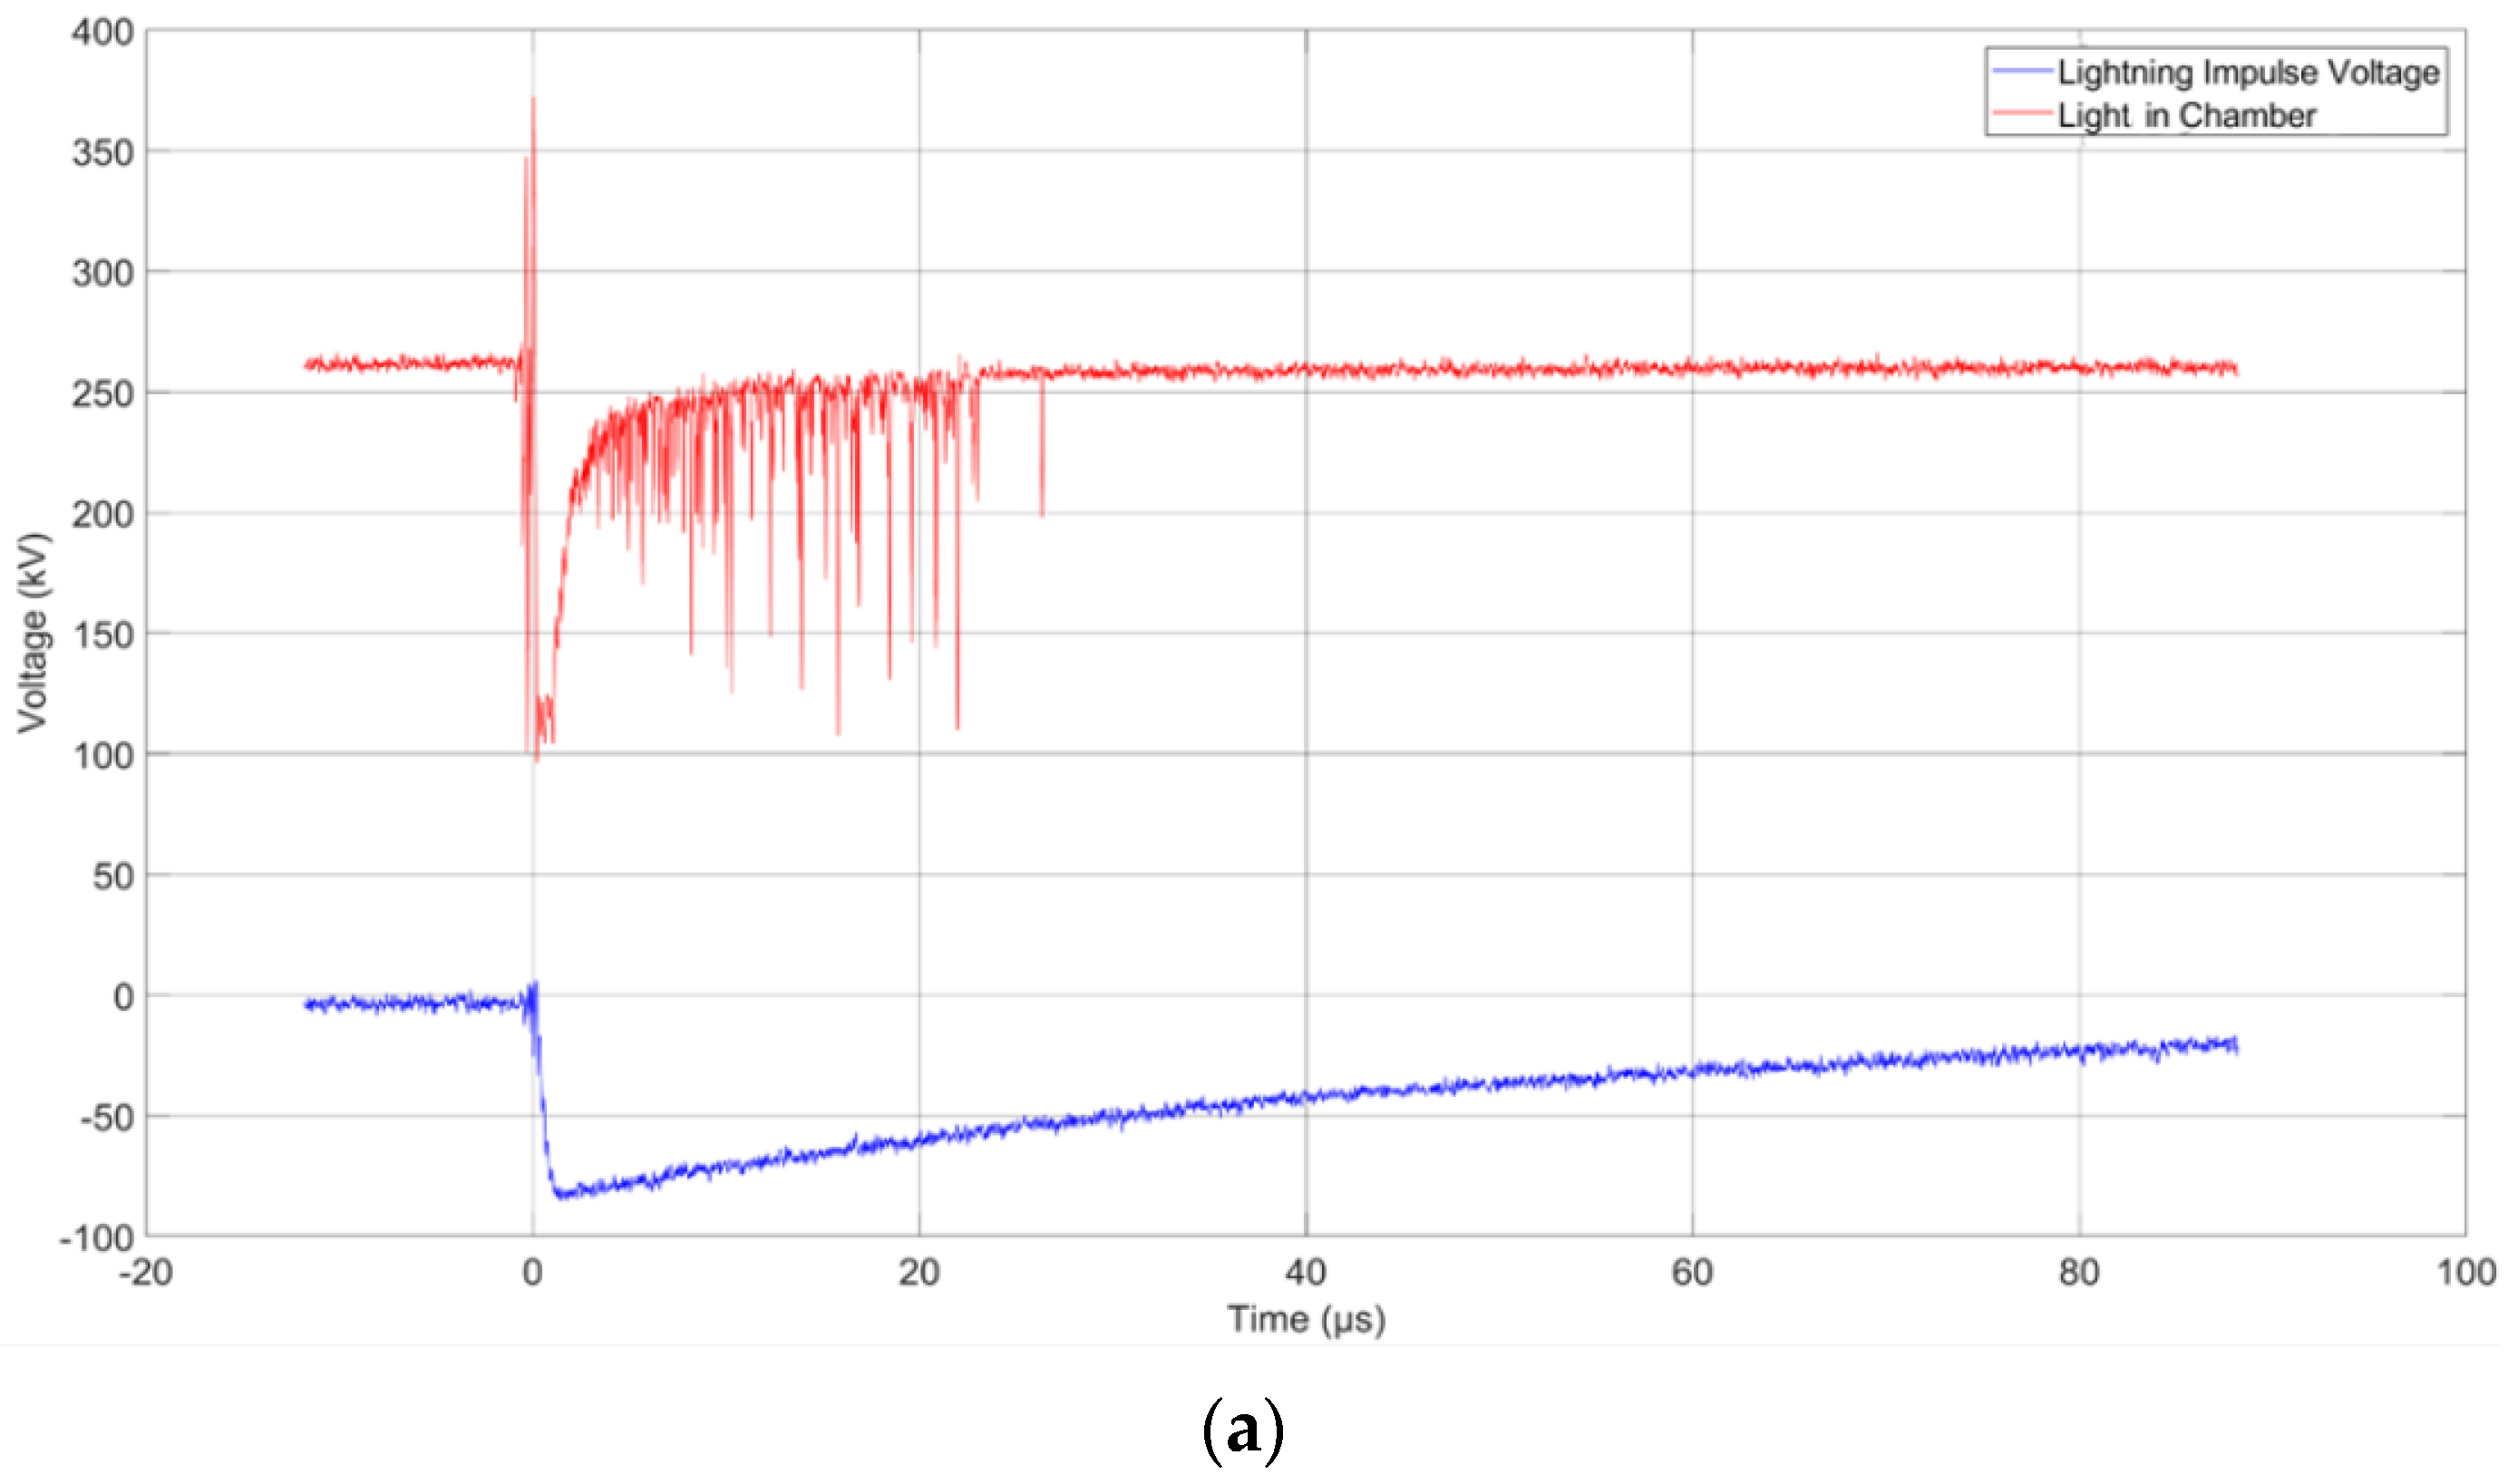
The waveforms for the synthetic ester with and without breakdown state are given in Figure 16.
The measured waveforms of the synthetic ester liquid had the most noisy and disruptive points. The synthetic ester liquid had a TtB value showing that it needed 74.94% more time than mineral oil and 100.64% more time than natural ester to complete its electrical breakdown. In addition, the synthetic ester had a spreading rate approximately 2.4 times slower than that of the other two liquids. The characteristic increase in branched discharge channels was because of their slower propagation. Although the synthetic ester had more disruptive points in the light signal, its dielectric strength was better than that of natural ester. The light signal had difficulty in returning to its natural position, especially in the case of electrical breakdown, and large discharges were observed that were not seen in the other two liquids.
6. Conclusions
The selection of suitable liquid dielectrics for transformers is vital. The place where the transformer will be installed and its electrical characteristics significantly affect this choice. Considering that dielectric liquids have different production processes and chemical properties, examination of their electrical parameters is one of the most critical steps in this selection. The fact that transformers operate under AC voltage in normal conditions does not mean that they are not exposed to different voltage types during their operating life. In this study, electrical tests of mineral oil, natural ester and synthetic ester, which are widely used in transformers, were carried out. The liquids used in the tests came out of the same production chain for each liquid separately. Therefore, the fact that the liquid had the same properties in every detail was very important for a healthy comparison of the results of these tests. In this study, AC, negative DC and lightning impulse voltage tests were carried out in laboratories with the same environmental conditions. AC and negative DC voltage tests were performed at the same electrode gaps using the same electrode configurations, following the ASTM D1816-84a and ASTM D877-87 standards. The negative polarity impulse voltage tests were carried out within the scope of the IEC 60897 standard. As a result of all of these tests, the following conclusions were reached:
- -
- Higher breakdown voltages were measured with the VDE electrode arrangement under AC voltage, although the voltage rising speed in this electrode configuration was much lower (0.5 kV/s) than in the disc electrode configuration (3 kV/s). In the VDE-based electrode configuration, the decrease in the electrode gap also reduced the breakdown voltage differences between the liquids. Synthetic ester was measured as the liquid with the best dielectric strength at all electrode gaps. The breakdown voltage of mineral oil at the smallest electrode gap was only 0.82 kV, lower than that of natural ester. Such a small difference indicates that mineral oil has insulation performance similar to that of natural ester liquid at small gaps where transformer windings are closest to each other.
- -
- In the disc electrode arrangement, the mineral oil showed better insulation resistance, although not very high, at the 2.5 mm electrode gap. In this electrode configuration, a high amount of ionization due to the sharp corner effect reduced the breakdown voltages of all liquids. The difference was measured in the tendency toward maximum breakdown stress reduction at 1 mm for mineral oil, 2 mm for natural ester liquid and 2.5 mm for synthetic ester liquid. However, the differences between the breakdown stresses of the liquids were more stable in comparison to those observed with the VDE electrode system.
- -
- The standard deviation values obtained from the breakdown voltages of the oils through five repetitions under AC voltage provided information about the stable states of the oils. Accordingly, the breakdown voltage levels were close to each other in each repetition, showing that the behavior of the test liquid was easier to predict. In the VDE electrode arrangement, the highest stability in terms of breakdown voltage was observed in mineral oil between test repetitions at wide electrode gaps.
- -
- In the negative DC experiments, the breakdown voltages of the liquids at the 2.5 mm electrode gap were measured at similar levels with the two different electrode configurations. This type of voltage reduced the sharp corner effect of the disc electrode at wide electrode gaps. Especially with this electrode arrangement, mineral oil and synthetic ester liquid increased their insulation performance at all electrode gaps. Considering the calculated standard deviation values, the stability of the liquids changed adversely at the 1 mm electrode gap.
- -
- Significant differences emerged in the decomposition of current signals during the 500 ms interval before the moment of breakdown under AC voltage using the EMD and VMD methods. The fact that the IMF 5 and IMF 6 modes were noiseless in the EMD method at the 2.5 mm electrode gap revealed that the tested oil had a higher breakdown voltage. For this gap, this was an important finding for an accurate examination that the IMF 8 mode in the VMD decomposition, which is contained noise points, can be determined as a clue to electrical breakdown. The early end of EMD decomposition at the 2 mm gap was an indication that that oil had a lower breakdown voltage. The very noisy waveforms of IMF 5, IMF 6 and IMF 7 as a result of EMD at the 1 mm electrode gap demonstrated that there were a high number of discharges and ionizations in a very short distance.
- -
- The higher breakdown voltage of mineral oil in the impulse voltage tests was quite the opposite from the results obtained from the experiments using the AC and negative DC voltages, but in accordance with reports in the literature. The fact that mineral oil had fewer peaks and interference points in the light waveforms than the other two liquids may mean that it has higher insulation resistance. However, it should be taken into account also that all three liquids may be characterized by different light absorption coefficients, which will be a scope for future works by the authors. Thus, when the impulse voltage is taken into consideration, the ester-based transformer application must be treated with special care. In addition, the higher number of light pulses registered in esters indicated that they are less resistant against impulse voltage stress.
As a result of all measurements and calculations made within the scope of this paper, it was clearly shown that when assessing dielectric liquids from the viewpoint of voltage stresses, evaluating only the AC breakdown voltage is not the only correct method for the selection of a liquid for a transformer. When making that choice, which is much more complicated, it is important to examine the dielectric performance of the liquids under all stresses likely to occur. Choosing the right liquid dielectric as a result of a combined evaluation is the most important way to ensure maximum efficiency from the transformer.
Author Contributions
Conceptualization, A.E., P.R. and F.A.; methodology, A.E., P.R. and F.A.; software, F.A.; validation, A.E., P.R. and F.A.; formal analysis, F.A.; investigation, F.A.; resources, A.E., P.R. and F.A.; data curation, F.A.; writing—original draft preparation, F.A.; writing—review and editing, A.E. and P.R.; visualization, F.A.; supervision, A.E. and P.R.; project administration, A.E. and P.R.; funding acquisition, A.E. All authors have read and agreed to the published version of the manuscript.
Funding
This work was supported by the Istanbul University-Cerrahpaşa Scientific Research Projects Unit with the Project Code FDK-2021-36036. The authors would like to thank the Istanbul University-Cerrahpaşa Research Fund for this financial support.
Data Availability Statement
Not applicable.
Conflicts of Interest
The authors declare no conflict of interest.
References
- Tenbohlen, S.; Coenen, S.; Djamali, M.; Müller, A.; Samimi, M.; Siegel, M. Diagnostic Measurements for Power Transformers. Energies 2016, 9, 347. [Google Scholar] [CrossRef]
- Piotrowski, T.; Rozga, P.; Kozak, R. Comparative analysis of the results of diagnostic measurements with an internal inspection of oil-filled power transformers. Energies 2019, 12, 2155. [Google Scholar] [CrossRef] [Green Version]
- Kunicki, M.; Cichon, A.; Borucki, S. Measurements on partial discharge in on-site operating power transformer: A case study. IET Gener. Transm. Distrib. 2018, 12, 2487–2495. [Google Scholar] [CrossRef]
- Florkowski, M.; Kuniewski, M.; Zydroń, P. Measurements and Analysis of Partial Discharges at HVDC Voltage with AC Components. Energies 2022, 15, 2510. [Google Scholar] [CrossRef]
- Fofana, I. 50 years of development of insulating liquids. IEEE Electr. Insul. Mag. 2013, 29, 13–25. [Google Scholar] [CrossRef]
- Mahanta, D.K.; Laskar, S. Electrical insulating liquid: A review. J. Adv. Dielectr. 2017, 7, 1730001-1–1730001-9. [Google Scholar] [CrossRef] [Green Version]
- Rao, U.M.; Fofana, I.; Jaya, T.; Rodriguez-Celis, E.M.; Jalbert, J.; Picher, P. Alternative Dielectric Fluids for Transformer Insulation System: Progress, Challenges, and Future Prospects. IEEE Access 2019, 7, 184552–184571. [Google Scholar]
- Rozga, P.; Beroual, A.; Przybylek, P.; Jaroszewski, M.; Strzelecki, K. A review on synthetic ester liquids for transformer applications. Energies 2020, 13, 6429. [Google Scholar] [CrossRef]
- Shen, Z.; Wang, F.; Wang, Z.; Li, J. A critical review of plant-based insulating fluids for transformer: 30 years of development. Renew. Sustain. Energy Rev. 2021, 41, 110783. [Google Scholar] [CrossRef]
- Mahmud, S.; Chen, G.; Golosnoy, I.; Wilson, G.; Jarman, P. Experimental studies of influence of DC and AC electric fields on bridging in contaminated transformer oil. IEEE Trans. Dielectr. Electr. Insul. 2015, 22, 152–160. [Google Scholar] [CrossRef] [Green Version]
- Rozga, P.; Stanek, M.; Pasternak, B. Characteristics of Negative Streamer Development in Ester Liquids and Mineral Oil in a Point-to-Sphere Electrode System with a Pressboard Barrier. Energies 2018, 11, 1088. [Google Scholar] [CrossRef]
- Martin, D.; Wang, Z.D. Statistical analysis of the AC breakdown voltages of ester based transformer oils. IEEE Trans. Dielectr. Electr. Insul. 2008, 15, 1044–1050. [Google Scholar] [CrossRef]
- Dang, V.-H.; Beroual, A.; Perrier, C. Comparative study of statistical breakdown in mineral, synthetic and natural ester liquids under AC voltage. IEEE Trans. Dielectr. Electr. Insul. 2012, 19, 1508–1513. [Google Scholar] [CrossRef]
- Reffas, A.; Moulai, H.; Béroual, A. Comparison of dielectric properties of olive oil, mineral oil, and other natural and synthetic ester liquids under AC and lightning impulse stresses. IEEE Trans. Dielectr. Electr. Insul. 2018, 25, 1822–1830. [Google Scholar] [CrossRef]
- Working Group A2.35. Experiences in Service with New Insulating Liquids; CIGRE Brochure 436; CIGRE: Paris, France, 2011. [Google Scholar]
- Wang, X.; Wang, Z.; Noakhes, J. Motion of conductive particles and the effect on AC breakdown strengths of esters. In Proceedings of the 2011 IEEE International Conference on Dielectric Liquids, Trondheim, Norway, 26–30 June 2011. [Google Scholar]
- Beroual, A.; Khaled, U.; Noah, P.S.M.; Sitorus, H. Comparative Study of Breakdown Voltage of Mineral, Synthetic and Natural Oils and Based Mineral Oil Mixtures under AC and DC Voltages. Energies 2017, 10, 511. [Google Scholar] [CrossRef]
- Xiang, J.; Liu, Q.; Wang, Z.D. Streamer characteristic and breakdown in a mineral oil and a synthetic ester liquid under DC voltage. IEEE Trans. Dielectr. Electr. Insul. 2018, 25, 1636–1643. [Google Scholar] [CrossRef] [Green Version]
- Liu, Q.; Wang, Z.D. Breakdown and withstand strengths of ester transformer liquids in a quasi-uniform field under impulse voltages. IEEE Trans. Dielectr. Electr. Insul. 2013, 20, 571–579. [Google Scholar] [CrossRef]
- Rozga, P.; Stanek, M.; Rapp, K. Lightning properties of selected insulating synthetic esters and mineral oil in point-to-sphere electrode system. IEEE Trans. Dielectr. Electr. Insul. 2018, 25, 1699–1705. [Google Scholar] [CrossRef]
- IEC 60897:1987; Methods for the Determination of the Lightning Breakdown Voltage of Insulating Liquids. International Electrotechnical Commission: Geneva, Switzerland, 1987.
- Ngoc, M.N.; Lesaint, O.; Bonifaci, N.; Denat, A.; Hassanzadeh, M. A comparison of breakdown properties of natural and synthetic esters at high voltage. In Proceedings of the 2010 Annual Report Conference on Electrical Insulation and Dielectic Phenomena, West Lafayette, IN, USA, 17–20 October 2010. [Google Scholar]
- Liu, Q.; Wang, Z.D. Streamer characteristic and breakdown in synthetic and natural ester transformer liquids under standard lightning impulse voltage. IEEE Trans. Dielectr. Electr. Insul. 2011, 18, 285–294. [Google Scholar] [CrossRef]
- Dombek, G.; Nadolny, Z.; Przybylek, P.; Lopatkiewicz, R.; Marcinkowska, A.; Druzynski, L.; Boczar, T.; Tomczewski, A. Effect of Moisture on the Thermal Conductivity of Cellulose and Aramid Paper Impregnated with Various Dielectric Liquids. Energies 2020, 13, 4433. [Google Scholar] [CrossRef]
- Rao, U.M.; Fofana, I.; Rozga, P.; Beroual, A.; Malde, J.; Martin, R.; Wang, F.; Casserly, E.; Pompili, M.; Calcara, L.; et al. Next Generation Insulating Liquids. Prepared by the International working Group of IEEE DEIS Technical Committee on Liquid Dielectrics. In Proceedings of the 2022 IEEE 21st International Conference on Dielectric Liquids (ICDL), Sevilla, Spain, 29 May 2022–2 June 2022; pp. 1–4. [Google Scholar]
- ASTM D1816-04; Standard Test Method for Dielectric Breakdown Voltage of Insulating Liquids Using VDE Electrodes. ASTM: Washington, DC, USA, 2012.
- ASTM D877-87; Standard Test Method for Dielectric Breakdown Voltage of Insulating Liquids Using Disk Electrodes. ASTM: Washington, DC, USA, 1995.
- Kuffel, E.; Zaengl, W.S.; Kuffel, J. High Voltage Engineering Fundamentals; Newnes/Butterworth-Heinemann: Oxford, UK, 2000. [Google Scholar]
- Malik, N.H.; Al-Arainy, A.A.; Qureshi, M.J. Electrical Insulation in Power Systems; CRC Press: Boca Raton, FL, USA, 2018. [Google Scholar]
- Maji, U.; Pal, S. Empirical mode decomposition vs. variational mode decomposition on ECG signal processing: A comparative study. In Proceedings of the 2016 International Conference on Advances in Computing, Communications and Informatics, ICACCI 2016, Jaipur, India, 21–24 September 2016; pp. 1129–1134. [Google Scholar]
- Rehman, N.U.; Aftab, H. Multivariate Variational Mode Decomposition. IEEE Trans. Signal Process. 2019, 67, 6039–6052. [Google Scholar] [CrossRef]
- Hadiyoso, S.; Dewi, E.M.; Wijayanto, I. Comparison of EMD, VMD and EEMD Methods in Respiration Wave Extraction Based on PPG Waves. J. Phys. Conf. Ser. 2019, 1577, 012040. [Google Scholar] [CrossRef]
- Maji, U.; Mitra, M.; Pal, S. Detection and characterisation of QRS complex in VMD domain. In Proceedings of the Michael Faraday IET International Summit, Kolkata, India, 12–13 September 2015; CP683. pp. 586–590. [Google Scholar]
- Maji, U.; Pal, S.; Majumder, S. Estimation of arrhythmia episode using variational mode decomposition technique. In Proceedings of the IEEE Instrumentation and Measurement Technology Conference, Pisa, Italy, 11–14 May 2015; pp. 767–772. [Google Scholar]
- Wang, Y.; Liu, F.; Jiang, Z.; He, S.; Mo, Q. Complex variational mode decomposition for signal processing applications. Mech. Syst. Signal Process. 2017, 86, 75–85. [Google Scholar] [CrossRef]
Figure 1.
VDE (left) and disc (right) electrodes used in experiment.

Figure 2.
Electrode holder assemblies (left—VDE, right—disc electrode).

Figure 3.
Actual view of needle electrode (left) and electrode setup placed inside the test cell (right).
Figure 3.
Actual view of needle electrode (left) and electrode setup placed inside the test cell (right).

Figure 4.
AC BDV—VDE type electrodes.

Figure 5.
AC BDV—disc type electrodes.

Figure 6.
Negative DC BDV—VDE type electrodes.

Figure 7.
Negative DC BDV—disc type electrodes.

Figure 8.
EMD (a) and VMD (b) decomposition of synthetic ester liquid current signal under VDE electrode arrangement (d = 2.5 mm).
Figure 8.
EMD (a) and VMD (b) decomposition of synthetic ester liquid current signal under VDE electrode arrangement (d = 2.5 mm).


Figure 9.
EMD (a) and VMD (b) decomposition of synthetic ester liquid current signal under disc electrode arrangement (d = 2.5 mm).
Figure 9.
EMD (a) and VMD (b) decomposition of synthetic ester liquid current signal under disc electrode arrangement (d = 2.5 mm).

Figure 10.
EMD (a) and VMD (b) decomposition of natural ester liquid current signal under VDE electrode arrangement (d = 2 mm).
Figure 10.
EMD (a) and VMD (b) decomposition of natural ester liquid current signal under VDE electrode arrangement (d = 2 mm).

Figure 11.
EMD (a) and VMD (b) decomposition of natural ester liquid current signal under disc electrode arrangement (d = 2 mm).
Figure 11.
EMD (a) and VMD (b) decomposition of natural ester liquid current signal under disc electrode arrangement (d = 2 mm).

Figure 12.
EMD (a) and VMD (b) decomposition of mineral oil current signal under VDE electrode arrangement (d = 1 mm).
Figure 12.
EMD (a) and VMD (b) decomposition of mineral oil current signal under VDE electrode arrangement (d = 1 mm).

Figure 13.
EMD (a) and VMD (b) decomposition of mineral oil current signal under disc electrode arrangement (d = 1 mm).
Figure 13.
EMD (a) and VMD (b) decomposition of mineral oil current signal under disc electrode arrangement (d = 1 mm).


Figure 14.
Examples of voltage and light waveforms collected during LI tests in mineral oil: (a) without breakdown, (b) when breakdown occurs.
Figure 14.
Examples of voltage and light waveforms collected during LI tests in mineral oil: (a) without breakdown, (b) when breakdown occurs.

Figure 15.
Examples of voltage and light waveforms collected during LI tests in natural ester: (a) without breakdown, (b) when breakdown occurs.
Figure 15.
Examples of voltage and light waveforms collected during LI tests in natural ester: (a) without breakdown, (b) when breakdown occurs.

Figure 16.
Examples of voltage and light waveforms collected during LI tests in synthetic ester: (a) without breakdown, (b) when breakdown occurs.
Figure 16.
Examples of voltage and light waveforms collected during LI tests in synthetic ester: (a) without breakdown, (b) when breakdown occurs.


Table 1.
Fundamental parameters of the liquid tested.
| Parameter/Unit | Mineral Oil | Natural Ester | Synthetic Ester |
|---|---|---|---|
| Electrical permittivity | 2.2 | 3.1 | 3.2 |
| Dielectric dissipation factor at 90 °C | 0.001 | 0.027 | 0.007 |
| Viscosity at 40 °C/[mm2/s] | 9.5 | 37 | 28 |
| Density at 20 °C/[g/cm3] | 0.87 | 0.92 | 0.97 |
| Flash Point/[°C] | 150 | 350 | 260 |
| Pour Point/[°C] | −51 | −31 | −60 |
Table 2.
AC BDV values.
| Electrode Type | Gap (mm) | Mineral Oil | Natural Ester | Synthetic Ester |
|---|---|---|---|---|
| VDE | 2.5 | 23.64 | 33.24 | 43.84 |
| 2 | 21.28 | 30.7 | 32.02 | |
| 1 | 15.36 | 16.18 | 18.76 | |
| Disc | 2.5 | 24 | 27.2 | 30.7 |
| 2 | 15.78 | 20.64 | 26.94 | |
| 1 | 5.12 | 8.36 | 14.54 |
Table 3.
Standard deviations for AC BDV test results.
| Electrode Type | Gap (mm) | Mineral Oil | Natural Ester | Synthetic Ester |
|---|---|---|---|---|
| VDE | 2.5 | 1.24 | 2.17 | 8.25 |
| 2 | 1.98 | 3.23 | 4.83 | |
| 1 | 1.93 | 0.74 | 1.77 | |
| Disc | 2.5 | 1.73 | 3.79 | 3.49 |
| 2 | 2.32 | 2.68 | 1.28 | |
| 1 | 0.52 | 1.03 | 0.74 |
Table 4.
Standard deviation/BDV () for AC BDV test results.
| Electrode Type | Gap [mm] | Mineral Oil | Natural Ester | Synthetic Ester |
|---|---|---|---|---|
| VDE | 2.5 | 0.052 | 0.065 | 0.188 |
| 2 | 0.093 | 0.105 | 0.150 | |
| 1 | 0.125 | 0.045 | 0.094 | |
| Disc | 2.5 | 0.072 | 0.139 | 0.113 |
| 2 | 0.146 | 0.129 | 0.047 | |
| 1 | 0.102 | 0.122 | 0.051 |
Table 5.
Negative DC BDV values.
| Electrode Type | Gap (mm) | Mineral Oil | Natural Ester | Synthetic Ester |
|---|---|---|---|---|
| VDE | 2.5 | 32.5 | 32.38 | 39.92 |
| 2 | 23 | 24.8 | 33.68 | |
| 1 | 13.02 | 17.46 | 20.602 | |
| Disc | 2.5 | 28.6 | 32.04 | 38.82 |
| 2 | 19.9 | 20.82 | 30.2 | |
| 1 | 11.74 | 13.66 | 16.86 |
Table 6.
Difference in negative DC BDV comparing electrode types (VDEBDV—DISCBDV).
| Gap (mm) | Mineral Oil | Natural Ester | Synthetic Ester |
|---|---|---|---|
| 2.5 | 3.9 | 0.34 | 1.1 |
| 2 | 3.1 | 3.98 | 3.48 |
| 1 | 1.28 | 3.8 | 3.742 |
| 2.5 | 3.9 | 0.34 | 1.1 |
| 2 | 3.1 | 3.98 | 3.48 |
| 1 | 1.28 | 3.8 | 3.742 |
Table 7.
Difference in BDV comparing AC and DC voltage (DCBDV—ACBDV).
| Electrode Type | Gap (mm) | Mineral Oil | Natural Ester | Synthetic Ester |
|---|---|---|---|---|
| VDE | 2.5 | 8.86 | −0.86 | −3.92 |
| 2 | 1.72 | −5.9 | 1.66 | |
| 1 | −2.34 | 1.28 | 1.842 | |
| Disc | 2.5 | 4.6 | 4.84 | 8.12 |
| 2 | 4.12 | 0.18 | 3.26 | |
| 1 | 6.62 | 5.3 | 2.32 |
Table 8.
Standard deviations for negative DC BDV test results.
| Electrode Type | Gap (mm) | Mineral Oil | Natural Ester | Synthetic Ester |
|---|---|---|---|---|
| VDE | 2.5 | 6.00 | 2.36 | 8.08 |
| 2 | 2.12 | 1.78 | 2.14 | |
| 1 | 1.58 | 1.05 | 0.47 | |
| Disc | 2.5 | 6.37 | 3.13 | 8.64 |
| 2 | 1.26 | 1.72 | 4.04 | |
| 1 | 3.42 | 3.42 | 3.89 |
Table 9.
Standard deviation/BDV () for negative DC BDV test results.
| Electrode Type | Gap (mm) | Mineral Oil | Natural Ester | Synthetic Ester |
|---|---|---|---|---|
| VDE | 2.5 | 0.18 | 0.07 | 0.20 |
| 2 | 0.09 | 0.07 | 0.06 | |
| 1 | 0.12 | 0.06 | 0.23 | |
| Disc | 2.5 | 0.22 | 0.10 | 0.22 |
| 2 | 0.06 | 0.08 | 0.13 | |
| 1 | 0.29 | 0.25 | 0.23 |
Table 10.
Characteristic values describing LI-based tests.
| Electrode Type | Mineral Oil | Natural Ester | Synthetic Ester |
|---|---|---|---|
| LI BDV average value [kV] | 131.0 | 90.4 | 100.1 |
| Standard deviation [kV] | 12.2 | 4.3 | 13.7 |
| Standard error of mean | 5.4 | 1.9 | 6.1 |
| Median [kV] | 124.6 | 92.5 | 107.3 |
| TtB [µs] | 19.6 | 17.1 | 34.3 |
| Propagation velocity [mm/µs] | 1.8 | 1.9 | 0.7 |
Publisher’s Note: MDPI stays neutral with regard to jurisdictional claims in published maps and institutional affiliations. |
© 2022 by the authors. Licensee MDPI, Basel, Switzerland. This article is an open access article distributed under the terms and conditions of the Creative Commons Attribution (CC BY) license (https://creativecommons.org/licenses/by/4.0/).
Share and Cite
MDPI and ACS Style
Atalar, F.; Ersoy, A.; Rozga, P. Investigation of Effects of Different High Voltage Types on Dielectric Strength of Insulating Liquids. Energies 2022, 15, 8116. https://doi.org/10.3390/en15218116
AMA Style
Atalar F, Ersoy A, Rozga P. Investigation of Effects of Different High Voltage Types on Dielectric Strength of Insulating Liquids. Energies. 2022; 15(21):8116. https://doi.org/10.3390/en15218116
Chicago/Turabian StyleAtalar, Fatih, Aysel Ersoy, and Pawel Rozga. 2022. "Investigation of Effects of Different High Voltage Types on Dielectric Strength of Insulating Liquids" Energies 15, no. 21: 8116. https://doi.org/10.3390/en15218116
Note that from the first issue of 2016, this journal uses article numbers instead of page numbers. See further details here.