
Analysis of Heat Flow for In Vitro Culture Monitored by Impedance Measurement

1
Faculty of Electrical Engineering and Computer Science, Lublin University of Technology, Ul. Nadbystrzycka 38a, 20-618 Lublin, Poland
2
Łukasiewicz Research Network—Institute of Microelectronics and Photonics, Al. Lotników 32/46, 02-668 Warsaw, Poland
*
Author to whom correspondence should be addressed.
Energies 2022, 15(21), 8231; https://doi.org/10.3390/en15218231
Submission received: 28 September 2022
/
Revised: 28 October 2022
/
Accepted: 30 October 2022
/
Published: 4 November 2022
(This article belongs to the Section F: Electrical Engineering)
Abstract
:The paper proposes an innovative method of using microheaters for research on cells in vitro. A method of local heating of a single culture well, compatible with an Electric Cell-substrate Impedance (ECIS) system is presented. A microheater and culture well system for cell culture was modelled. Electrical and thermal simulation of the system under operating conditions was carried out. Correct distribution of heat was observed at the site of the cell culture suspension in the medium, while not affecting the conditions in adjacent wells. As part of the experiment, a heating element of nichrome (NiCr) was created using the magnetron sputtering process. Electrical and thermal measurements of the manufactured device were carried out. It has been shown that it is possible to establish the desired temperature over the long term. In addition, the structures made were characterised by work stability, precision in maintaining the right temperature, and the possibility of being controlled with high accuracy. There is a problem with the precise and reproducible carrying out of a cell culture experiment that differs only in the process temperature. In this work, a technique for increasing the temperature locally, in a single culture well, in a medium containing eight such wells was proposed and analyzed. The use of this method will allow avoidance of the impact of potential changes in parameters other than temperature on the culture. That may occur when comparing cells grown at different temperatures by means of the ECIS (Electric Cell-substrate Impedance) method.
1. Introduction
Heating and temperature control play an important role in science and industry. In the past, metal blocks were used as a heating elements. The high-volume requirement for the metal layer made that expensive and bulky. Moreover, they consumed enormous amounts of power and took up a lot of space, which limited their portability and the integratability of the heater in many applications. These problems have been solved with the advent of micro- and nanotechnology. In recent years, research on the miniaturisation and mobility of devices has appeared in virtually all industries. In the case of heating, the miniaturisation of the heating device reduces energy consumption and weight, improves thermal response, and enables integration with other sensors or microflow components. Today’s microheaters usually have the form of a thin-film resistive track with thicknesses in the range of ~0.1–100 µm. The key benefits of the micro scale system are small volume, system miniaturisation, automation, and economy. They offer faster response times, higher temperatures with precise control, and allow for autonomous (battery) operation. They are the basis of most BioMEMS (Biological Micro-Electro-Mechanical System) and LoC (Lab-on-a-Chip) devices, as most bioanalyses involve fluid response in real-time diagnostic applications [1,2].
A microheater is a miniaturised heating system that generates heat by passing an electric current, either by ultrasonic heating or by radiation. The temperature of a microheater depends on many physical factors including electrical, mechanical, and thermal ones, as well as the properties of the material used and the geometric structures. In recent years, thin film micro heaters have become a broad area of research [3,4] and play a pivotal role in the operation of devices, such as thermal flow sensors [5,6], gas sensors in microelectromechanical systems (MEMS) [7], detection of liquefied petroleum gas (LPG) [8], detection of trace amounts of explosives [9], thermal generation microchannel electricity [10], physical properties measurements (thermo-diffusion) [11], and environmental temperature control for small-scale chemical and biological processes [12]. Microheaters are widely used in wearable appliances, biological, chemical, or electrical applications, as well as mining and even space applications. Thermal effects are crucial in determining the behaviour of biological microsystems. The development of miniaturised devices for cell culture and DNA amplification leads to the rapid diagnosis of viruses and improves PoCT (Point-of-Care Testing). In addition, it ensures the availability of pathogen detection techniques and equipment in resource-limited clinical settings in underdeveloped and developing countries. The advancement and optimisation of microdevices play an important role in shaping the nature of basic biological research and the medical industry [6,13].
In cell culture, maintaining a certain temperature for a longer period of time is essential for better replication of biological cells. A typical temperature at which zoonotic cells are cultured in vitro is 37 °C ± 0.5 °C. In many cases, tests can be conducted at room temperature or even much lower (e.g., 4 °C) [14]. When studies are conducted that require comparing the results of cell development at different temperatures, e.g., reflecting the behaviour of cells during fever, the temperature is 2–3 °C higher [15]. This type of work makes it possible to assess, for example, the reaction of infected cells to the administered drug with simultaneous fever in relation to cells that are at the temperature of a healthy organism. Such tests allow one to assess whether taking medications to reduce fever is appropriate while taking the tested medicament. The situation is similar when simulating a cooled organism. In this case, the set temperature may be a few degrees lower.
The problem with precise measurements of biological samples for changing temperatures is the reproducibility of the culture conditions. In the case of in vitro culture, the cells are kept in a climatic chamber in which the desired temperature and the appropriate gas concentration are maintained. In a situation where the culture of the same cells should be compared in the same growth phase and under identical environmental conditions, differing only in temperature, the following treatments can be used:
- changing (raising/lowering) the temperature for a certain period of time during the same culture and comparing the results of the observations before and after the temperature change [16]. The advantages of this technique are identical environmental conditions (the atmosphere in the climatic chamber) and the use of exactly the same cells at a different temperature. On the other hand, the disadvantage of this method is the comparison of the same cells, but at different times of the culture—older cells are compared with younger ones.
- carrying out a complete culture cycle for the same cells at different temperatures. The advantage of this technique is that you can compare the results at the same growth times. The disadvantage is that the cells taken for cultivation are compared several days after each other, and for this reason, their life cycles may differ [17,18]. The solution to this problem may be the parallel cultivation in two different climate chambers of cells collected for cultivation in the same phase [19]. However, in such a solution, there may be a difference in environmental parameters (humidity, gas concentrations) between the chambers.
The method of local heating of individual wells, in which the cell culture is carried out, proposed in this article, is a solution that allows for a comparison of the results of cultures differing only in temperature. The proposed approaches to investigate the present problem will allow one to compare the results of in vitro culture of cells collected in the same phase, grown in the same climatic chamber, i.e., with identical environmental conditions, differing only in temperature. For this purpose, a microheater with a size fully covering the measurement zone electrodes should be used. Its control parameters should provide adequate heating power so that the cells in a given well are at an increased temperature and, at the same time, do not change the thermal conditions in adjacent wells. The proposed solution concerns the monitoring of cell cultures using the matrices of the ECIS system (Electric Cell-substrate Impedance). It can be used in the cases where cells form a monolayer at the bottom of the well. The analysis of changes takes place by measuring electrical parameters, including changes in impedance, resistance (the real part of impedance), and capacitance (the imaginary part of impedance). Temperature will be an additional parameter supporting the observation and comparison of cell cultures. There is a strong correlation between a temperature change of even a single degree and cell adhesion, which results in measurable impedance values. It confirms the effectiveness of the use of the ECIS method in the study of cell culture at different temperatures.
2. Materials and Methods
2.1. Electric Cell-Substrate Impedance Sensing
The classic method of monitoring cell culture as well as individual cells is to observe them using optical instruments. A breakthrough in the field of in vitro research, however, was the measurement of cell impedance in real-time ECIS. It is a non-invasive in vitro method that allows the analysis of cell activity based on their structure, morphology, and ability to reproduce, divide, or translocate. It was developed in 1984 by Dr. Giaever and Dr. Keese, founders of Applied BioPhysics [20,21]. It is an interesting alternative to medical experiments conducted with the use of microscopes, which consist of observing cell changes caused by the passage of time or external stimuli [22].
The in vitro method of measuring cell impedance in real-time is to monitor electrical changes induced by cellular activity related to their structure and morphology and their ability to divide, move, and many other behaviours guided by the cytoskeleton. Examples of observed changes include cell proliferation and apoptosis. The ECIS system allows one to define, inter alia, the life course of the cells, the complete development and propagation cycle until the culture is fully confluent, as well as the contracting of various reagents. Currently, this technique is used, among others, for determining the invasive nature of cancer cells, substance toxicity, and drug testing. In the future, it may also contribute to extending the capabilities of many currently used medical applications. The advantage of the ECIS system is its ability to monitor cell culture in real time, which is often challenging, as many mammalian cells are highly sensitive to their environment, and a change from suboptimal temperature, pH, or other conditions can lead to rapid cell death.
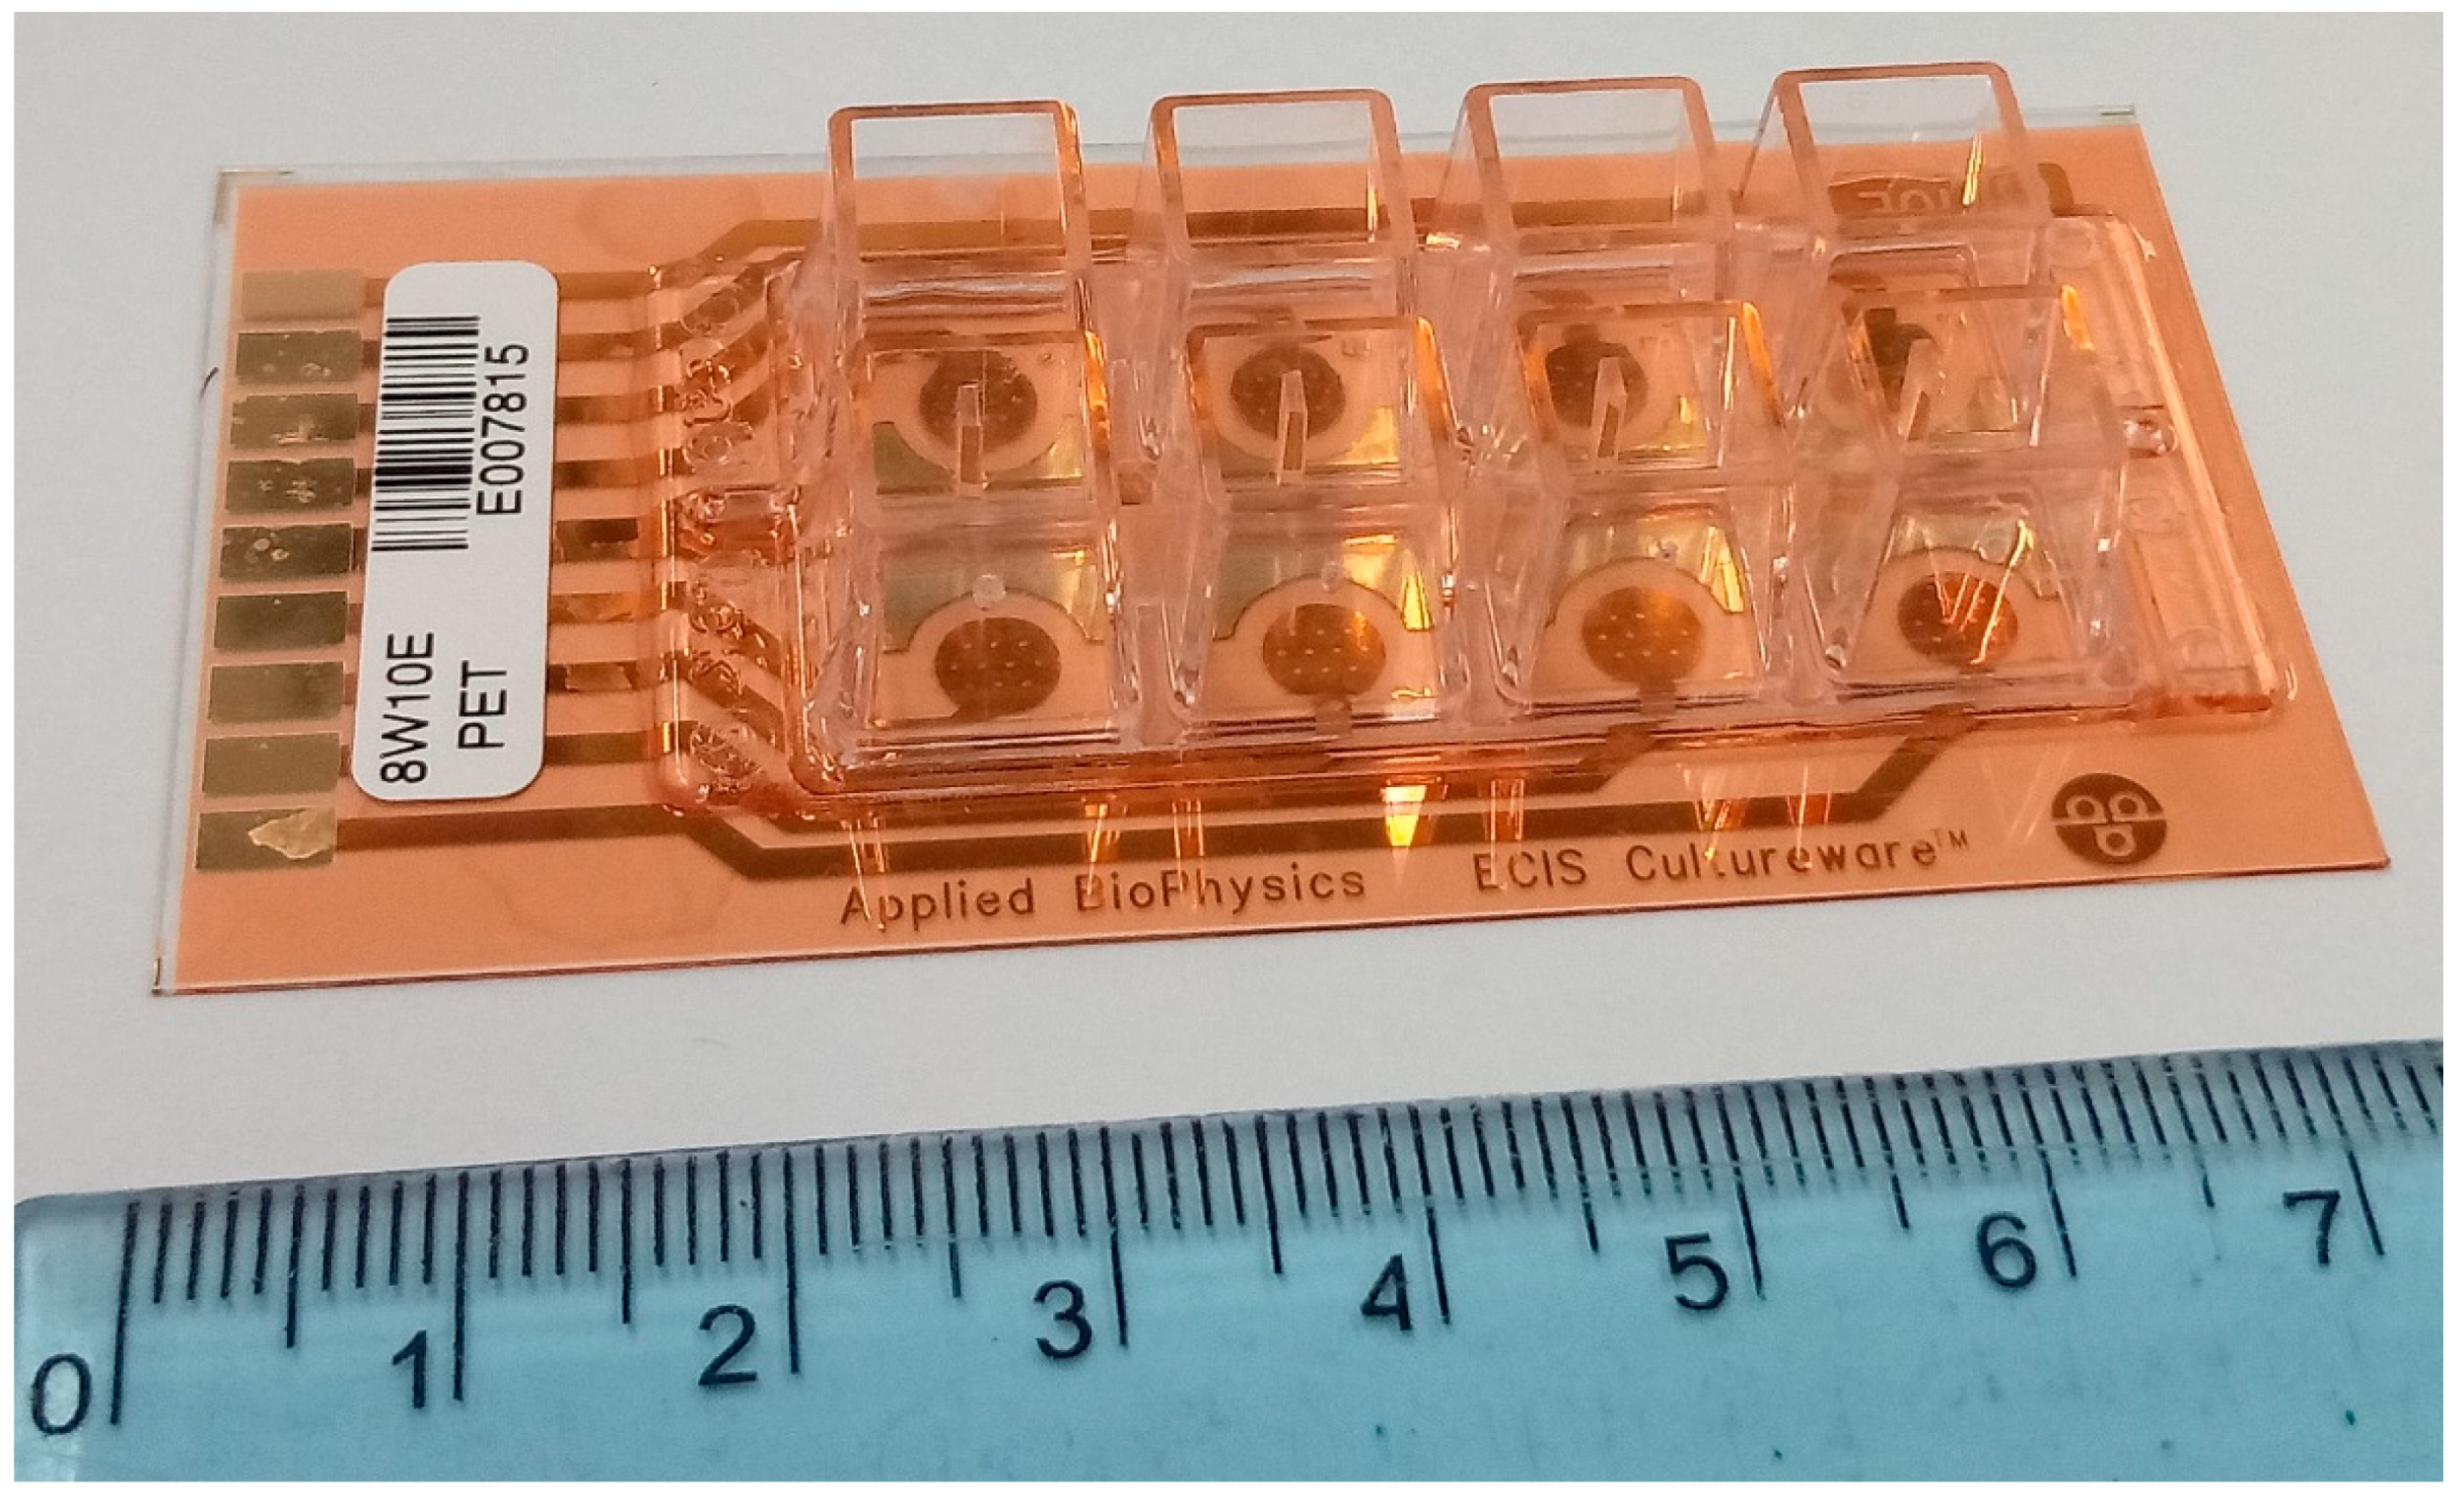
In impedance measurements, the circuit is excited with a frequency-dependent signal and the response of the circuit is measured. When measuring bioimpedance, attention is focused on the cell-substrate system. The development and migration of cells significantly impede the flow of electricity. By spreading, usually asynchronously, the cells cover the surface of the electrodes on the test substrate (Figure 1). This causes a gradual increase in the value of the measured impedance, which is a direct physical feature that characterizes the electric resistance and capacitance of cells adhered to the electrodes. The capacitance comes mostly from the double layer of the phospholipid cell membrane, while the resistance comes from the cytoplasm as well as the adhesion protein between the cells and the electrodes. The heart of the measurement system is a small gold or platinum electrode on the test substrate at the bottom of the cell culture vessel. Often, there is an additional insulating polymer on the metal layer, which limits the contact area of the electrode with the culture, which translates into monitoring of changes in the measured parameters for a smaller number of cells [23].
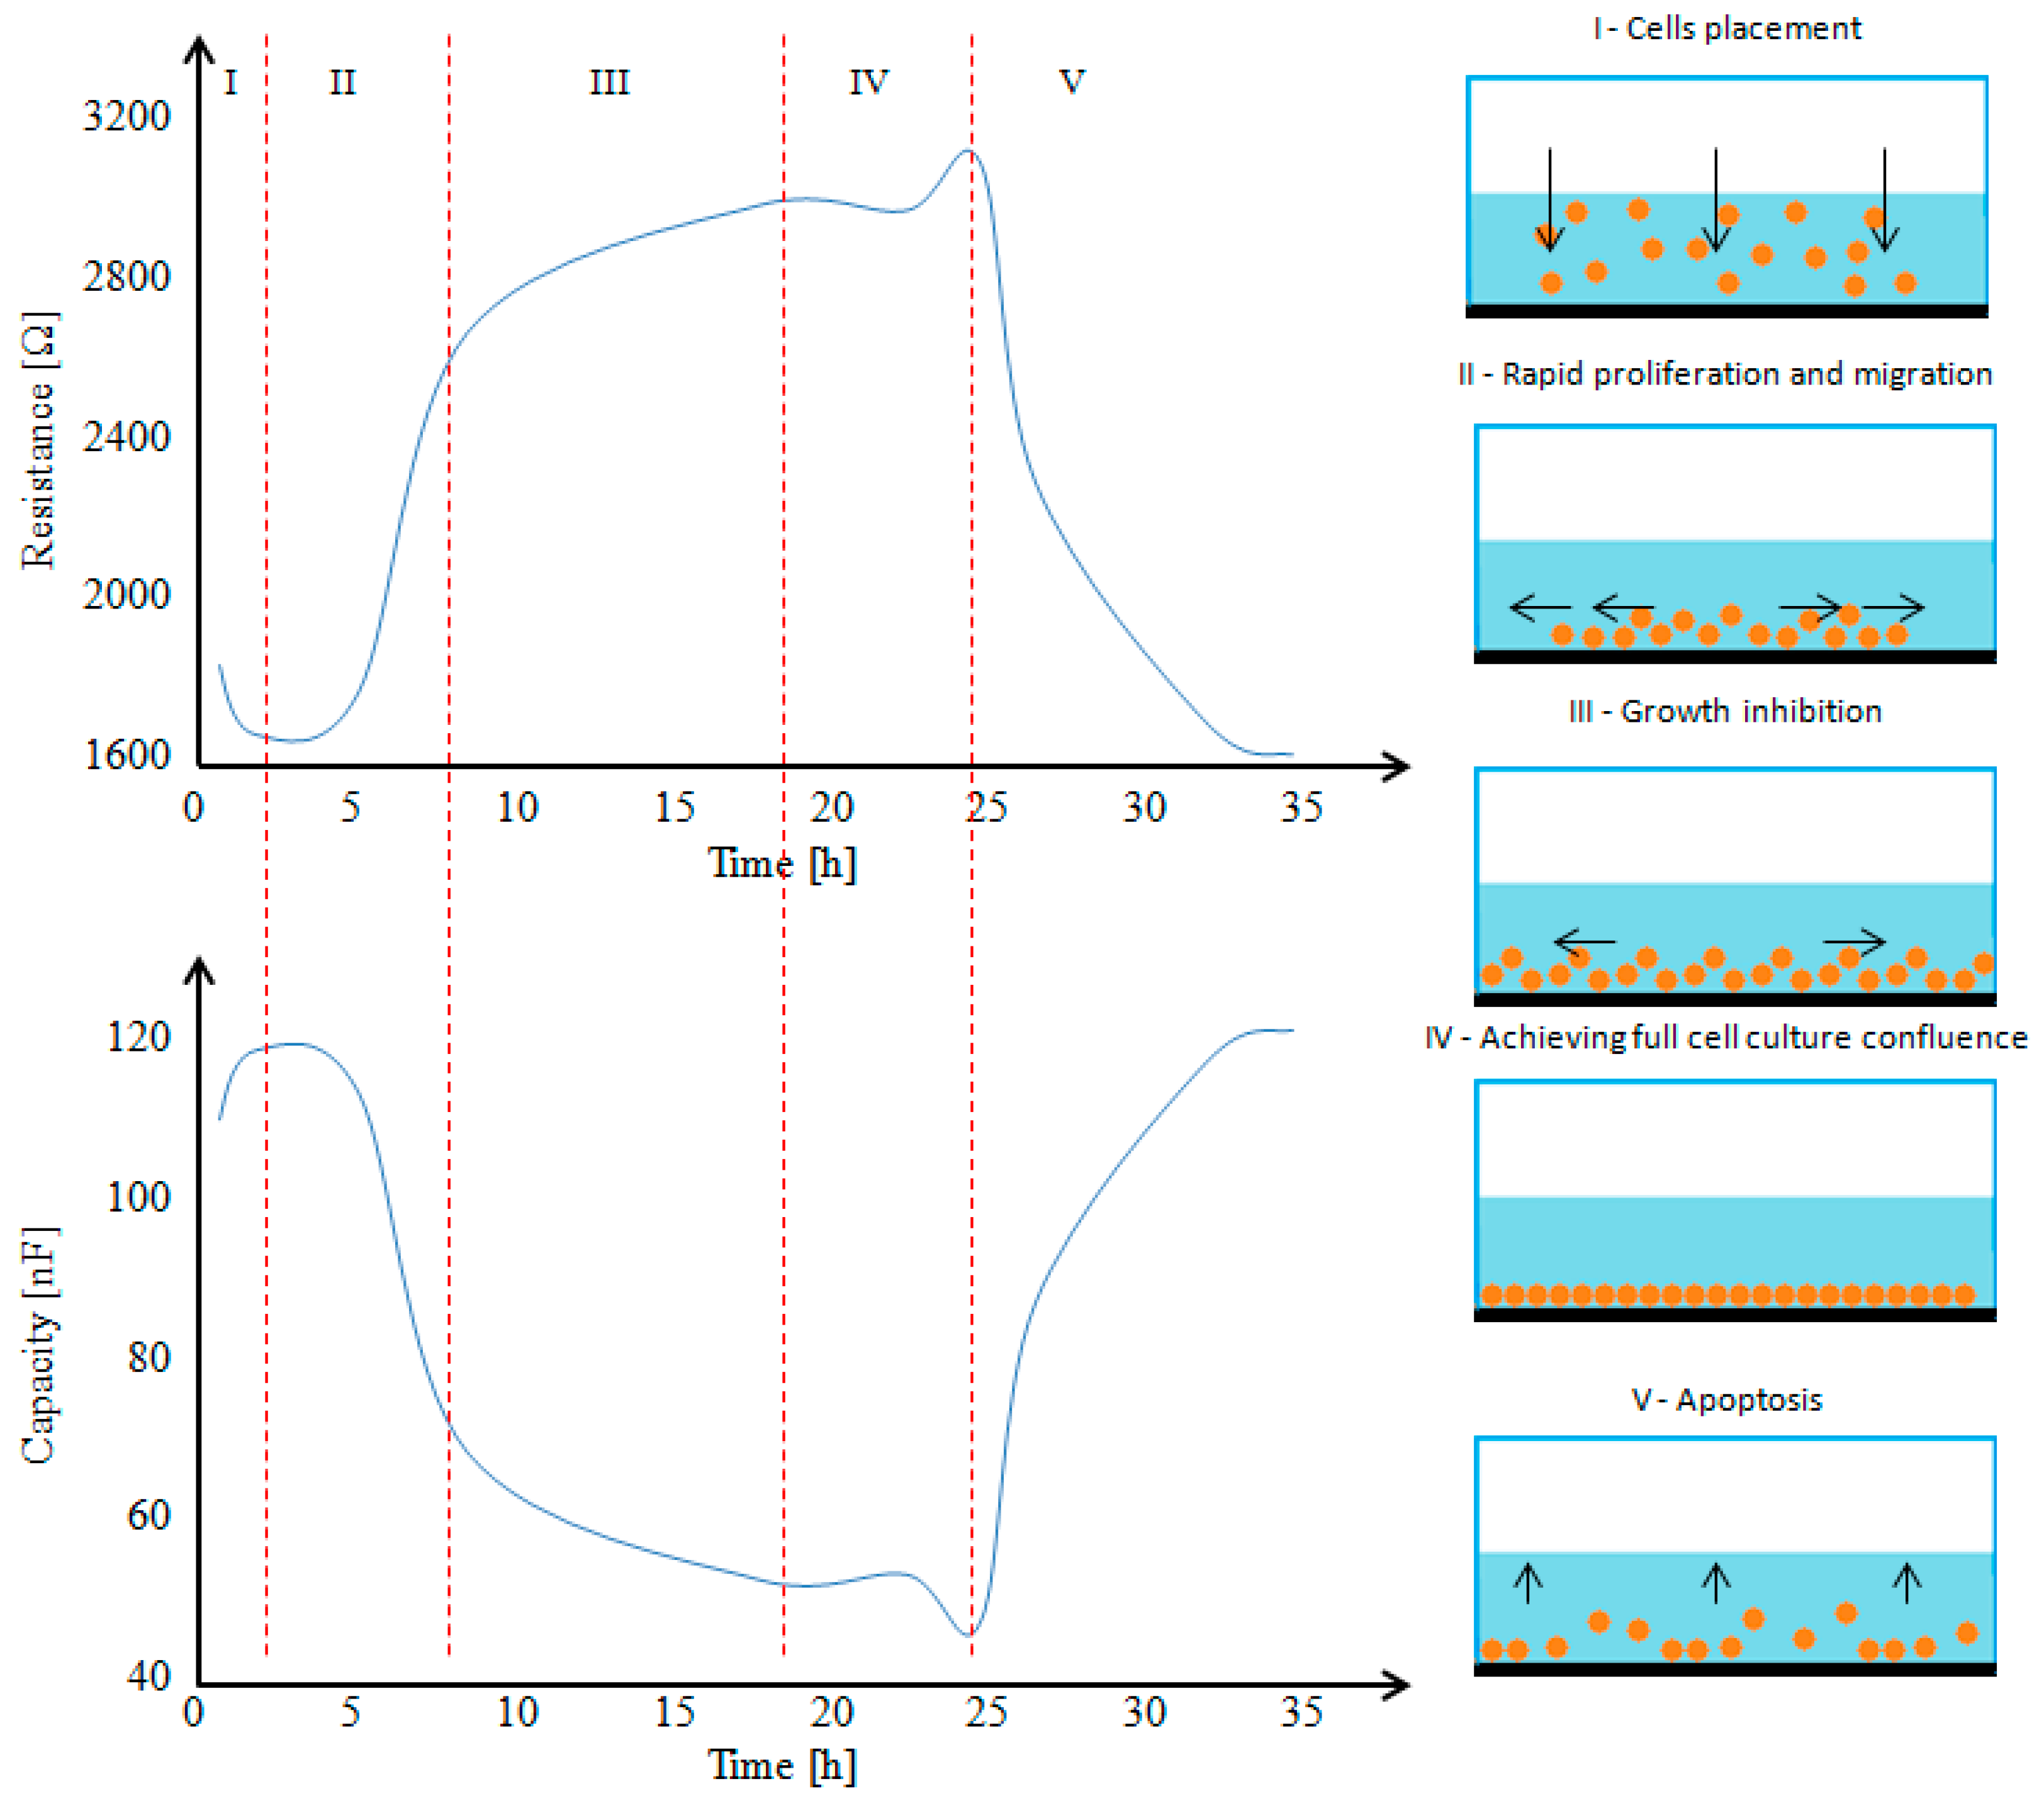
The measurement is made by supplying an alternating current, usually less than 1 mA, that flows through the cells. At frequencies below 2 kHz, a significant part of the current flows through the intercellular spaces, providing information about the adhesion of cells to the substrate. The use of a higher frequency signal (~40 kHz) causes the current to flow directly through the cell membrane. As a result, information about the extent of coverage of the electrodes by the cells is obtained. The maximum response for impedance, resistance, and capacity for cell cultures is likely to occur at different frequencies. By default, the optimal frequencies are resistance (R) at 4 kHz, impedance (Z) at 16 kHz, and capacity (C) at 64 kHz. The optimal frequencies may also be obtained empirically by examining the data at each frequency. The duration of the experiment depends on the user and can last from a few seconds to several days. Figure 2 shows the typical results of the measured resistance and capacity of the standard life cycle of zoonotic fibroblasts with the phases marked: insertion of cells into the well (I), multiplication (II), stabilisation (III), and death (IV) [24,25,26,27,28,29].
The multiplication of the culture blocks the current flow through the electrodes and, thus, increases the measured resistance with a simultaneous decrease in the value of the capacity. After some time, cell stabilisation takes place, in which only the displacement of the cell culture takes place on the surface of the electrodes of the capacitor, causing a slight release of free spaces thereon. This results in slight fluctuations in the measured values. In the last phase of the cycle, the electrode capacity value increases, and the resistance value decreases. This is due to the death of the cell culture and loss of adhesion properties to the substrate. Cells and electrodes can be considered as an electric circuit composed of a parallel connected resistor and capacitor and, thus, can be considered as a simple mathematical model [30].
2.2. Microheater Technology
The analysis of the local heating of the sample and the heat transfer in the microheater and culture well system with the medium system is important. This is due to the possibility of interpreting the results obtained from a single measurement cycle for cells from the same culture, in an identical growth phase, grown under identical environmental conditions (except temperature). Therefore, any changes to the higher/lower temperature well will mean that the parameter was influenced by the temperature and not by other factors.
The design and material of the microheater play key roles in ensuring low energy consumption, low thermal mass, and effective temperature uniformity throughout the device and increased thermal insulation from the environment. Additionally, the resistance is very dependent on the physical dimensions of the microheater. Reducing the thickness of the heating resistor increases its resistance, which leads to a decrease in power consumption and heating temperature [31,32,33,34].
The most commonly used materials for microcircuits are platinum (Pt), gold (Au), silver (Ag), titanium (Ti), and nichrome (NiCr). In addition, microgenerators made of nickel (Ni), tungsten (W), aluminium (Al), copper (Cu), graphene, carbon nanotubes (CNT), titanium nitride (TiN), gallium nitride (GaN), gallium arsenide (GaAs), DilverP1 (Ni/Co/Fe alloy), polysilicon (Poly-Si), and many other metal alloys [32]. Platinum is an ideal material for a heater and temperature sensor, as it has high electrical conductivity, good specific heat capacity, low energy consumption, and high heating and temperature sensing rates. At the same time, the resistivity changes linearly with temperature. It also has the properties of being a ductile, dense, noble, and least reactive metal. However, this material cannot always be used effectively due to the high cost of the material [35] and the poor adhesion to the glass substrate. For this reason, a layer of chromium or titanium is additionally deposited before the platinum is deposited to increase its adhesion to the substrate [36,37,38].
The electrical resistance of the heating element should be high compared with the resistance of the contact fields so that effective heating occurs on the heating resistor. Comparing the materials Pt, Au, Ag, and NiCr as heating elements, NiCr is defined as the more suitable material due to its higher electrical resistance (1.0−1.5 × 10⁻⁶ Ωm), high thermal conductivity (11.3 W m−1 K−1), near-zero temperature coefficient of resistance (TCR), high temperature stability, and high resistance to oxidation. Additionally, it does not require an additional adhesive layer, which makes the cost effectiveness of the microheater higher [3,39]. Nichrome with 80% nickel and 20% chromium by weight is used in most ICs where high reliability, high resistivity, low noise, and good power dissipation are required. Due to its melting point of approximately 1400 °C, high oxidation resistance, and high temperature stability, this material is often used as a heating element in many devices [40,41,42,43].
The resistance of the microheater is given by [3]
where R is the resistance at the same temperature at which ρ is specified, ρ is the resistivity of the material, l is the length of the resistor, and A is the cross-section area (width × thickness).
A planar resistor should be used for the use of a microheater in the ECIS measurement system. This will allow a minimum (near zero) distance between the cell culture array and the heater plane. It will also allow for the use of the original slot for attaching the test substrate found in the commercial equipment of the ECIS system. The aim of the research was to create a microheater that can raise the temperature value by several degrees Celsius and keep this value stable over a longer period of time.
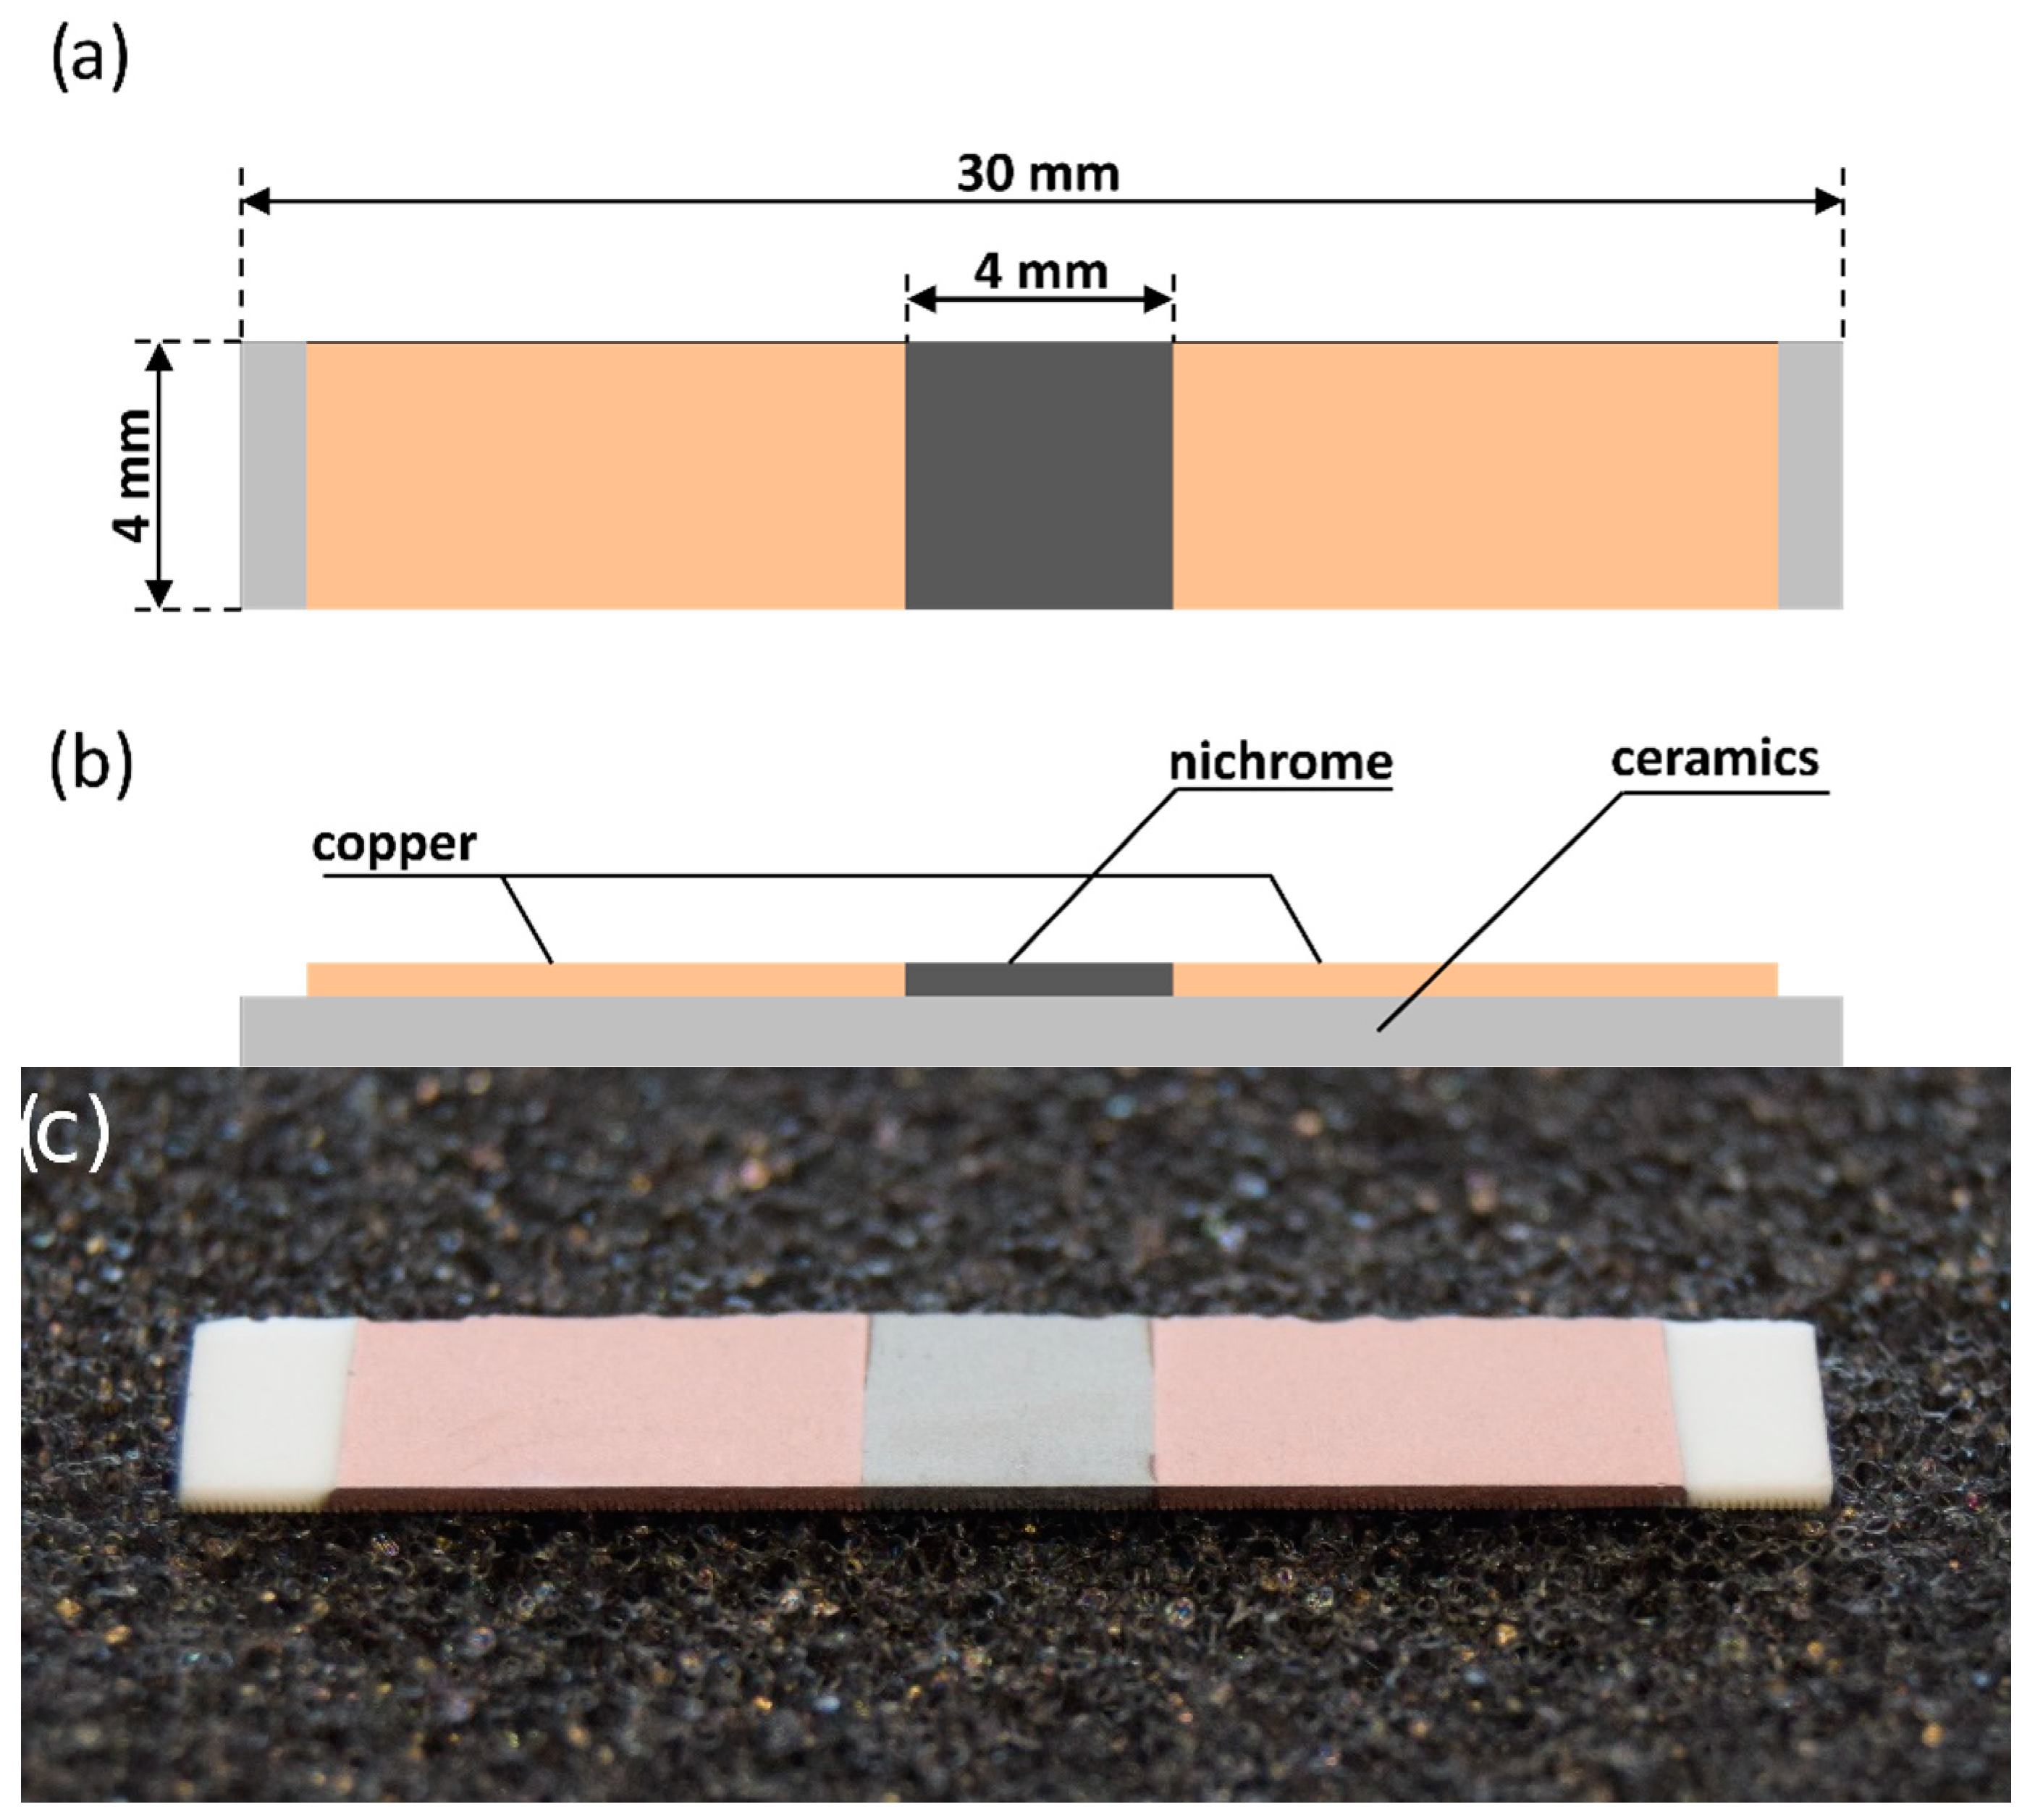
The base of the microgenerators was a plate made of alumina ceramics 635 μm thick, 30 mm long, and 5 mm wide. The thin-film heating element was produced directly on the substrate by means of two layers: copper and nichrome. The dimensions of the resistive area are 4 × 4 mm2. The thickness of the nichrome layer was approximately 250 nm. A copper layer with a thickness of approximately 390 nm was used as a metallisation, enabling the making of wire electrical connections (Figure 3).
Magnetron sputtering was used as one of the deposition techniques to make NiCr and Cu layers. This is one of the PVD (physical vapour deposition) methods that consists of applying a vapour of ionized material to the substrate by spraying the material source (target) with inert gas ions in a magnetic field. For the effective course of the deposition process, it is necessary to create an appropriate vacuum inside the station beforehand by pumping out the gas from its volume. The bond between the coating and the substrate is adhesive and largely depends on the cleanliness of the substrate. In the sputtering process, by applying a voltage between the substrate and the target, the kinetic energy of the bombarding inert gas molecules causes the material atoms to be physically knocked out of the target surface and then deposited on the substrate surface. In most cases, the deposition of a new layer takes place in three stages:
- -
- formation of vapours of the applied material,
- -
- transport of vapours to the ground,
- -
- vapour condensation on the substrate and further coating growth.
3. Results
3.1. Model and Simulations
In order to understand the phenomena and mechanisms of energy transport in the microheater and culture well system during local heating, a three-dimensional model of the system was developed in parallel with the technological work. Despite the small number of components, the local heating system is quite complicated in thermal analysis. This is due to the small size, the need for precise control of the operating temperature in the entire volume of the system, and the variability of the parameters of individual layers as a function of temperature. Additionally, in the analysis process, it is necessary to take into account the heat exchange with the environment through radiation and convection. Such a model was developed in the CoventorWare® integrated programming environment, dedicated to multi-domain micro- and nanostructure modelling as well as electrical, mechanical, thermal, electrostatic, piezoelectric, and microfluidic simulations, as well as their combinations, e.g., thermomechanical.
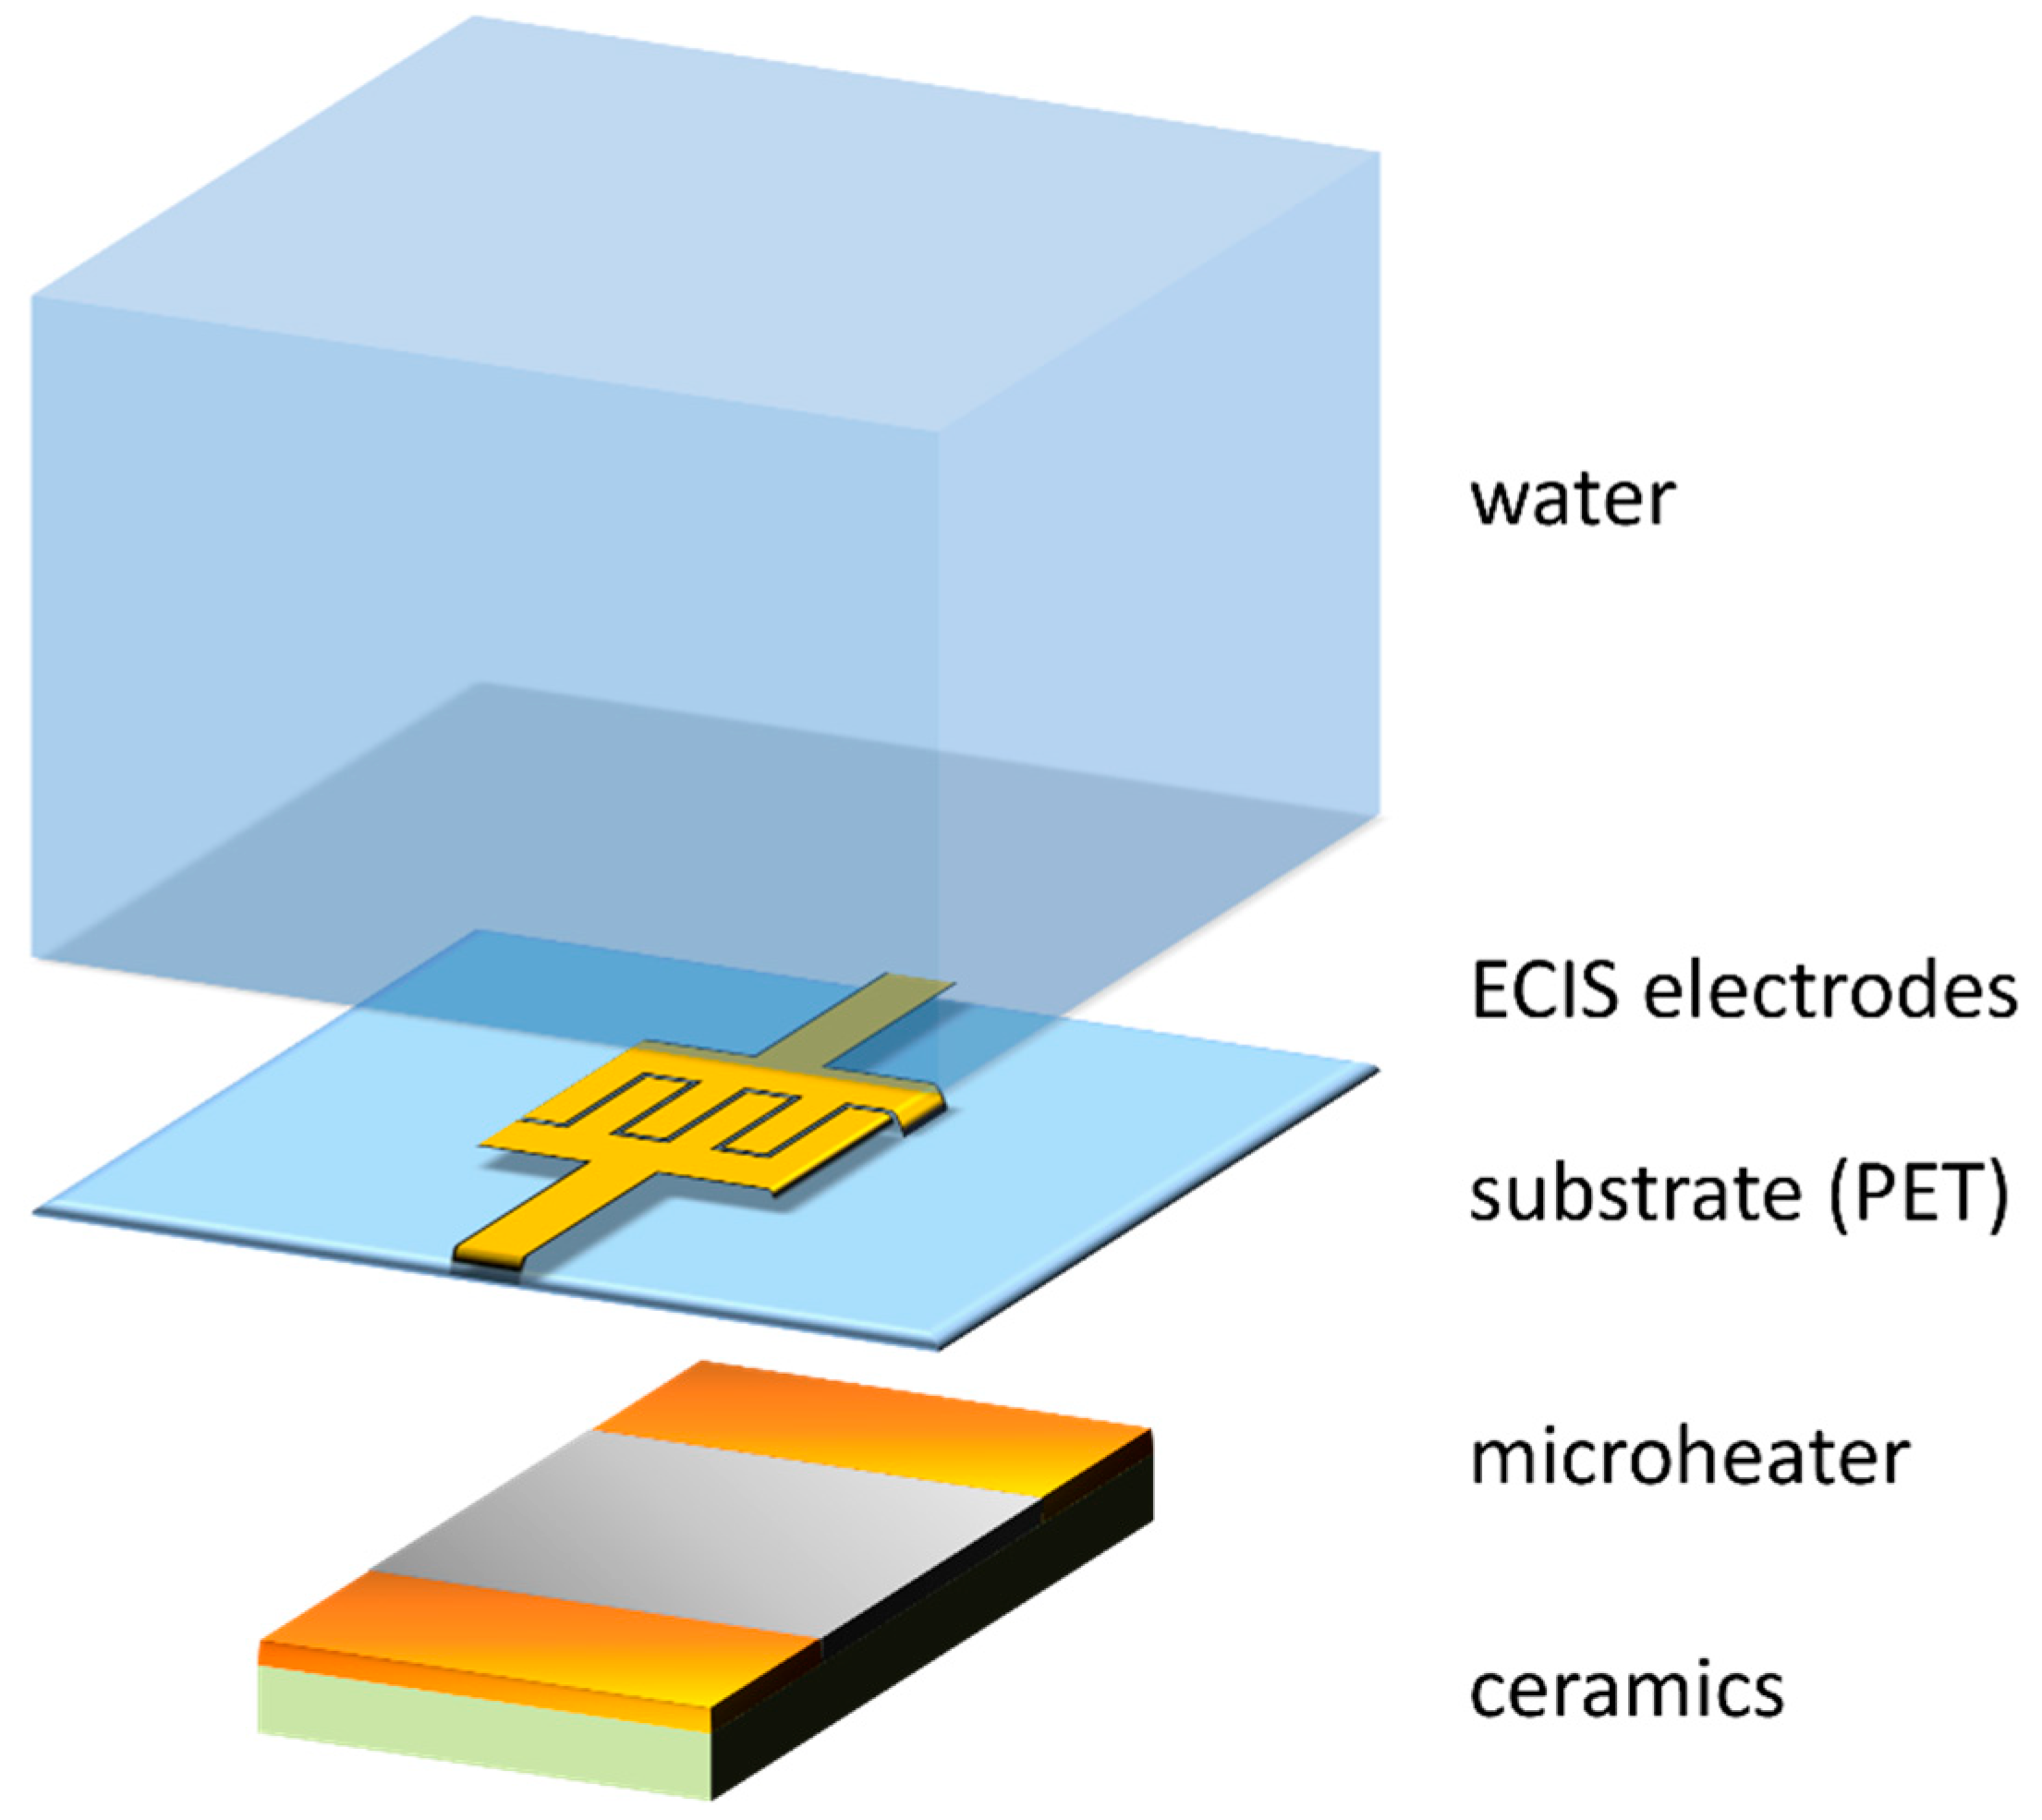
The heater model included a nichrome layer, copper contact pads, and a ceramic substrate. The culture well filled with water with the capacitor electrodes was modelled using the following materials: PET and water, the parameters of which were available in the CoventorWare® material base (Figure 4). The heat source was modelled by forcing the current flow by setting the appropriate value of the electric voltage at the copper electrodes [44].
A model of the microheater and culture well system was designed, created, and analysed using CoventorWare® software. The model consisted of appropriate layers of materials: ceramics, NiCr (nichrome), PET (polyethylene terephthalate), Au (gold), and water. The model was part of a complete real structure which consisted of an 8-well array. A NiCr layer with a thickness of 250 nm was used as a microheater. The electrodes consisted of a 50 nm thick layer of gold as the area where the impedance was measured. The thermal parameters of water were used to simulate the environment closest to the medium in which the cells were grown. The applied thermal parameters of the materials are shown in Table 1.
FEM simulations (finite element method) allow the avoidance of the costly and time-consuming technological process of creating real structures [45]. The Analyzer MemMech containing the mechanical, thermomechanical, electrothermal, piezoresistive, and piezoelectric solver was used to perform the simulations. The electrothermal solver was selected, which was used to calculate potential distribution, followed by the thermal solver to compute temperature changes resulting from Joule heating. This was due to the strong correlation between the electric current and the temperature in the supply devices. The flow of electricity through the metallisation heats it up and releases heat to a specific environment. This is related to material properties such as resistivity and thermal conductivity. MemMech solves the coupled conservation of electrical charge and balance of thermal energy equations to compute the steady-state potential and temperature fields. These equations are:
Conservation of electrical charge equation:
Balance of thermal energy equation:
where σ is the electrical conductivity, T is temperature, V is the potential (voltage), and k is the thermal conductivity. The source term for the thermal equation is the Joule heating resulting from the current flow in the resistor. To complete the problem formulation, boundary conditions are needed for both the electrical and thermal problems.
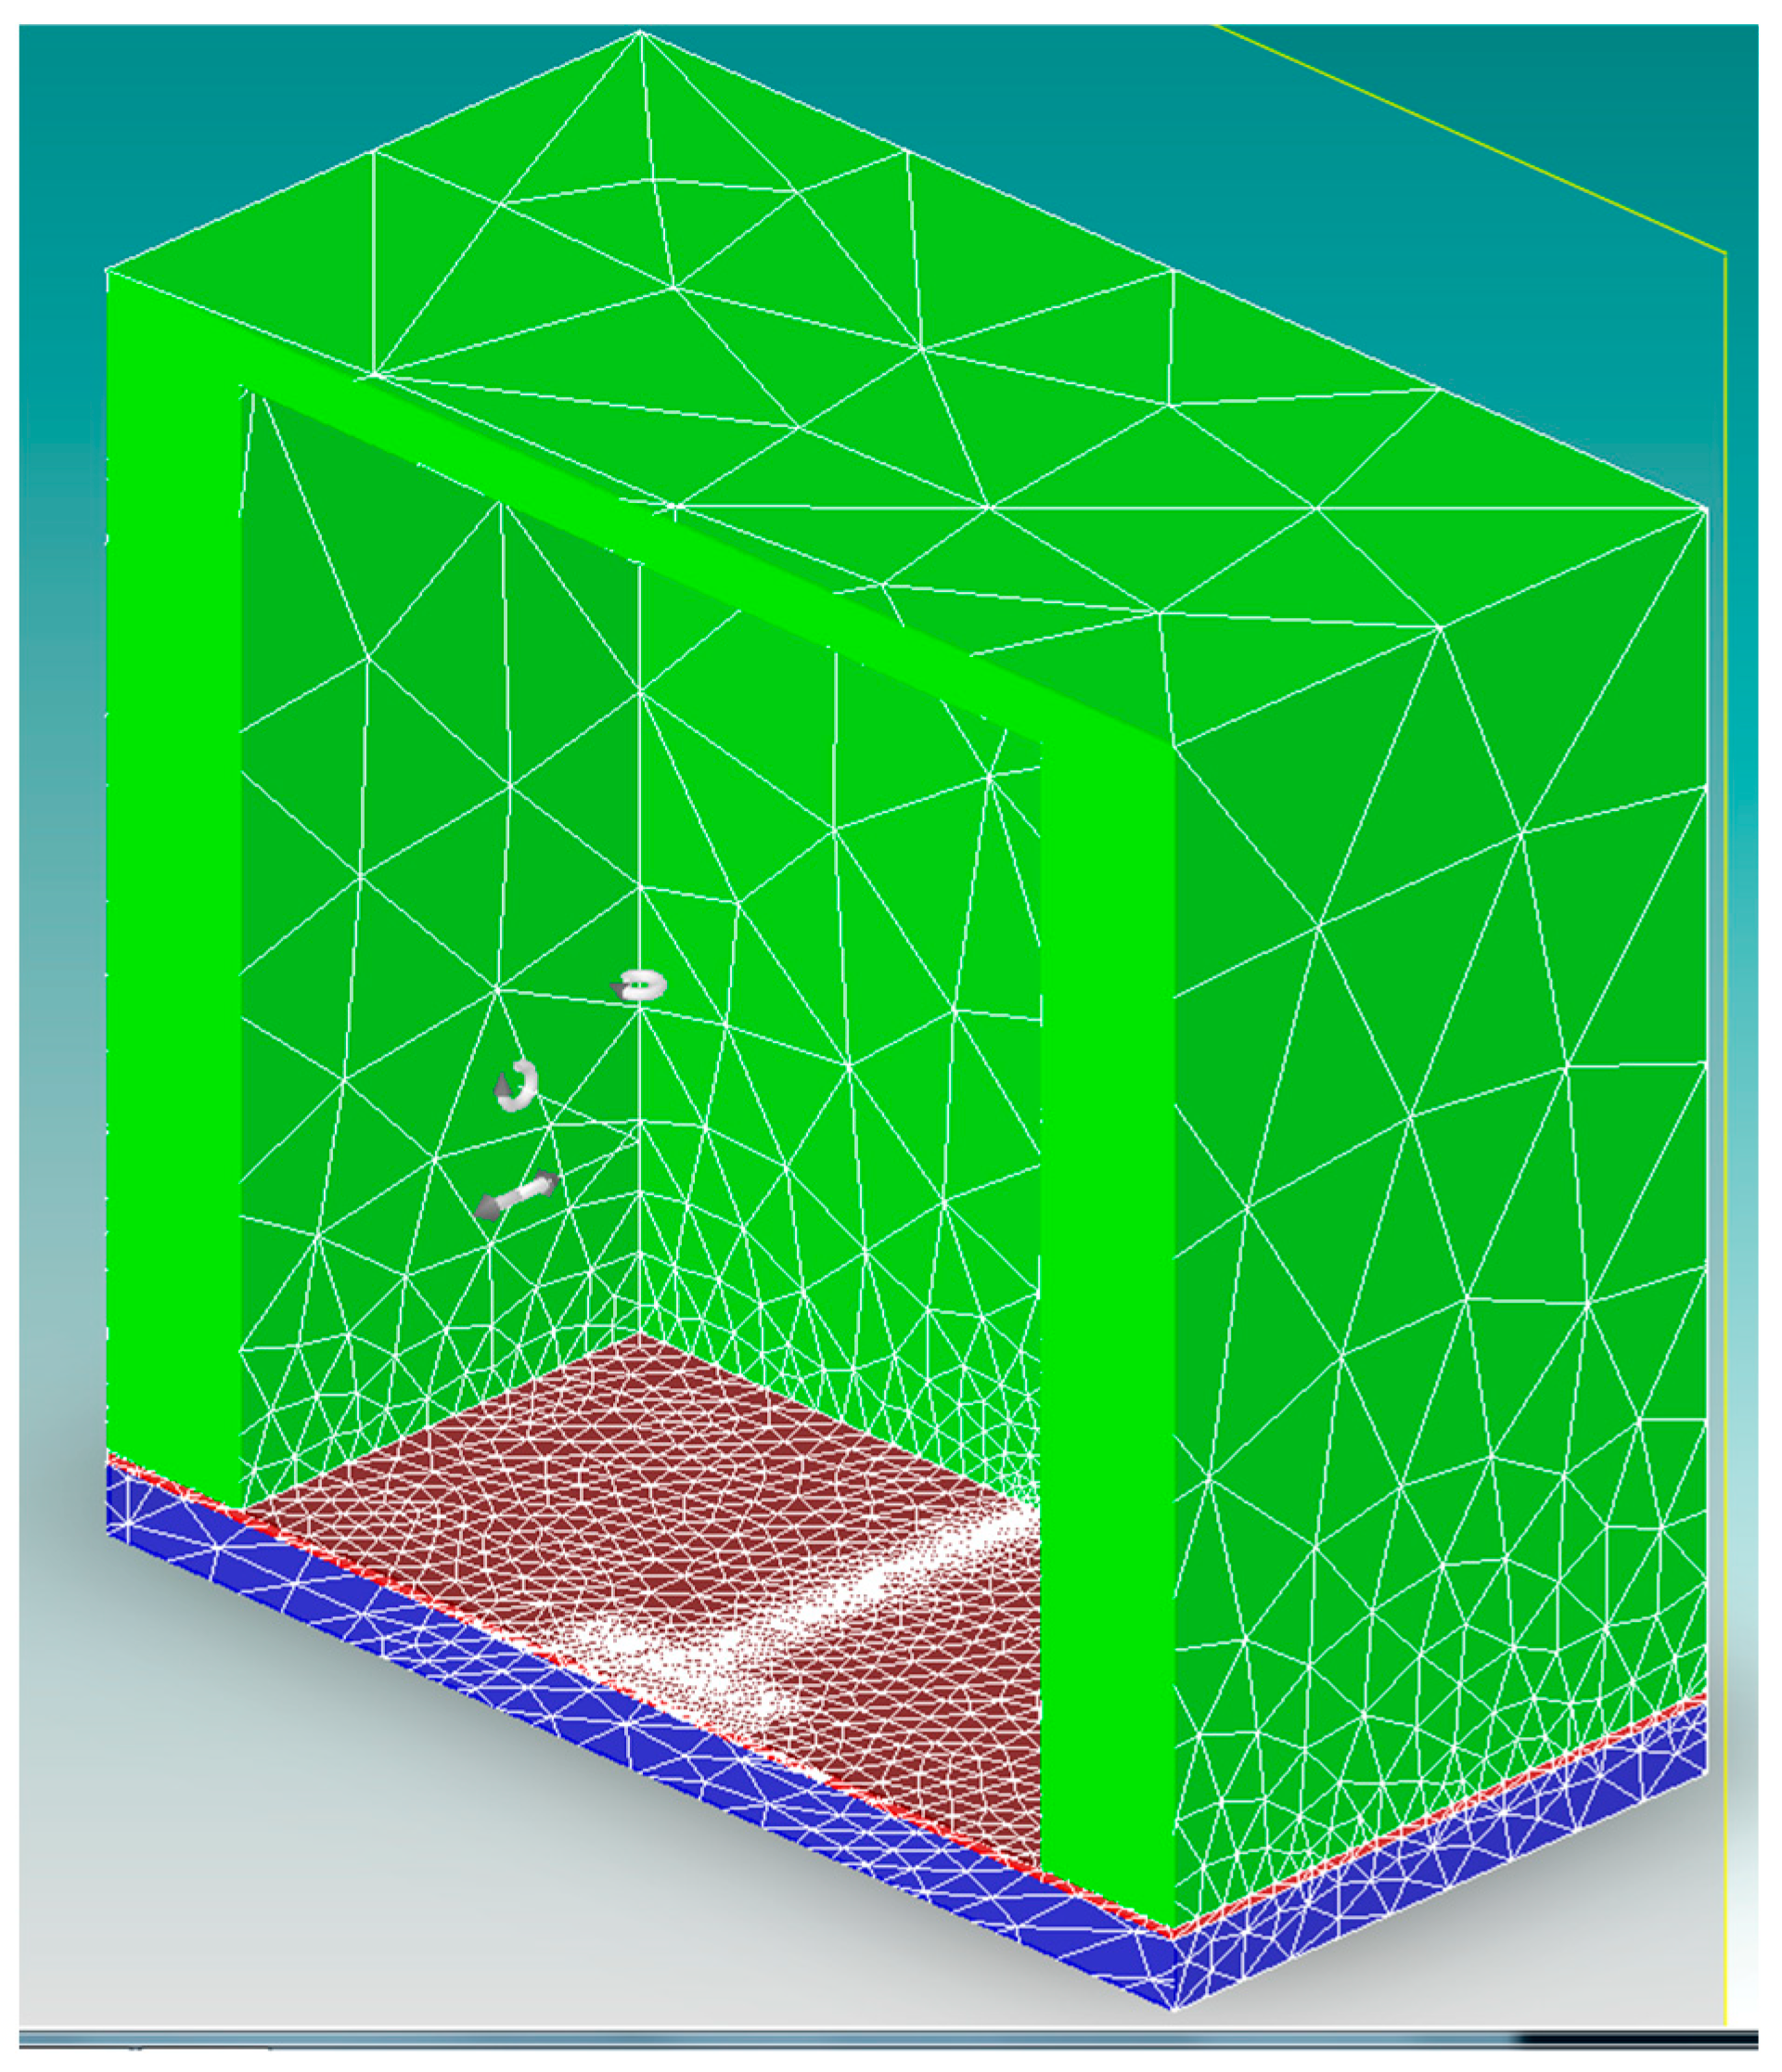
For the boundary condition, the external surface temperature of the model was set to 310.15 K. This corresponds to the temperature in the climatic chamber in which the zoonotic cells are usually grown. The thermal conductivity coefficients for all materials used in the model were also used. This allowed for simulation of the model, taking into account the convection of heat between the layers at the appropriate level. It was also necessary to apply the electrical boundary conditions. At the ends of the copper electrodes, an electric potential difference (1.12 V) was established, forcing the current flow of a given value to obtain the assumed temperature on the surface of the substrate at the site of cell monolayer formation. In order to ensure a good simulation precision, the most detailed mesh was set on the microheater layer and the least on the water layer (Figure 5). The tetrahedral solver was used to generate the mesh. Tetrahedral meshing is carried out by Delaunay surface meshing, followed by octree and moving front volume meshing algorithms. The selection of the mesh density was preceded by the performance of many simulations for increasingly denser meshes. The adopted mesh size resulted from obtaining small temperature differences in relation to the values obtained in subsequent iterations.
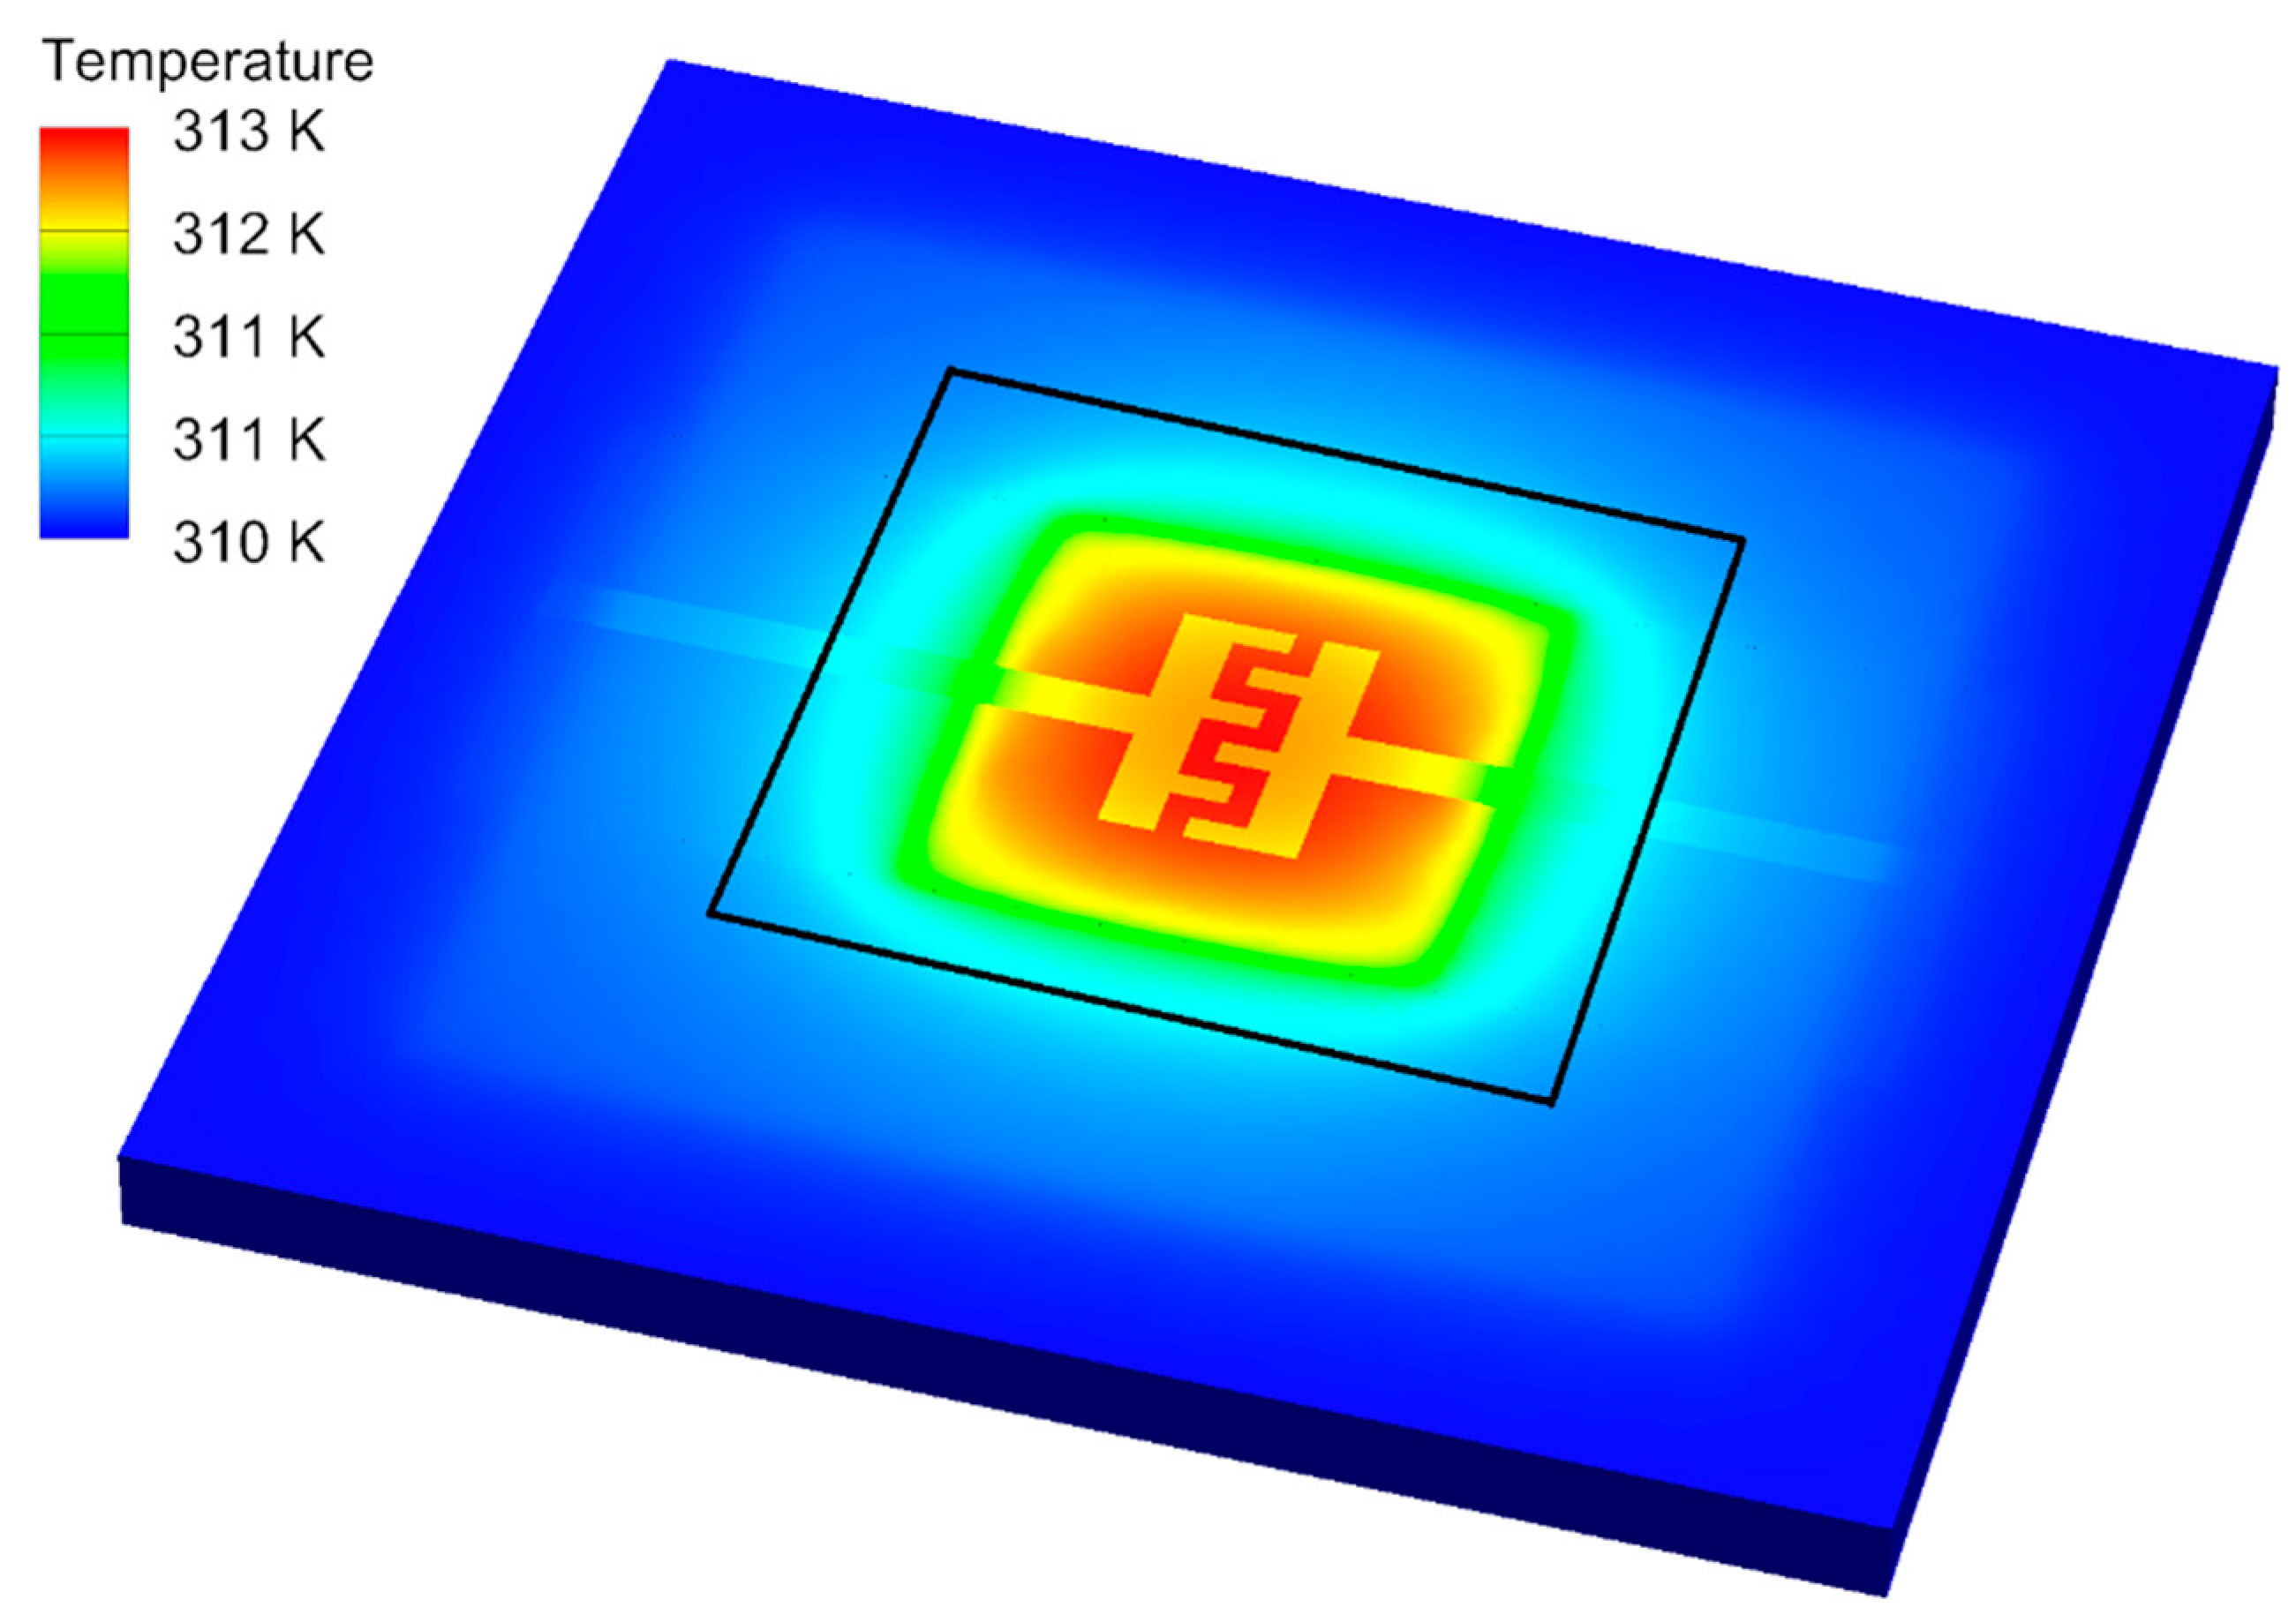
The obtained results of the analysis of the local heating system showed a high compliance of the simulation model with the measurements of real structures. Figure 6 shows the temperature distribution for a system with a microheater. There is a visible increase in temperature directly above the heater and, at the same time, a slight increase in temperature at the walls of the well (below 1 °C). This means that the heat generated from the microheater is dissipated in the volume of water, and at the walls of the well, it is received from the environment of the climatic chamber and does not affect the neighbouring cultures. In order to study the temperature distribution directly over the heater, a layer of water was hidden in the simulation results (Figure 7). This made it possible to visualise the operation of the system, in particular at the site of cell monolayer formation during cultivation. According to the simulation results, the heater generates a relatively uniform temperature over the entire surface with the measuring electrodes. Therefore, the temperature gradient at the periphery should not affect the measured parameters. The possible influence on the temperature drop caused by heat transfer through the cell layer was not considered in the simulations.
3.2. Electrical and Thermal Measurements of the Microheater
The manufactured microheaters were characterised as independent elements and, in the local heating system of a liquid sample (water), placed in the breeding well. Before performing the proper characterisation of the local heating system of the culture cells, the changes of the heater resistance as a function of temperature were tested. There were no significant (measurable) differences in R values for the temperature range of 21–80 °C. The heater resistance was 55.417 Ω. Measurements were made using a Keysight 34410A meter, the accuracy of which, at this measurement value for the four-wire resistance method, was ±(0.01% of reading + 0.004% of range).
Thermal measurements were carried out in a climatic chamber at a constant temperature of 37 °C. The experiment consisted of delivering different power levels to the heater for 1 h. The substrate containing the microheater was placed directly under the measuring matrix used in the ECIS system. During the process, measurement of resistance with a Pt100 temperature sensor was conducted. During the measurements, the sensor was placed in the center of the well above the measuring electrodes of the ECIS system, i.e., in the zone where changes in electrical parameters are monitored during breeding. In order to eliminate the occurrence of an air gap between the elements, mechanical pressure on the adjacent surfaces was applied. In the case of cell culture studies, the problem of creating a gap between the heater and the substrate should be eliminated by using mechanical pressure and thermal dielectric paste. After this time, the measuring system turned off the heater’s power and, for another 30 min, monitored the temperature of the system returning to the initial temperature. The power levels were determined at the start of the measurement, determined on the basis of the resistance value at room temperature. The heater’s power supply was assumed for a power in the range of 10–100 mW and converted into the value of the supply voltage, taking into account the heater resistance R = 55,417 Ω according to the formula:
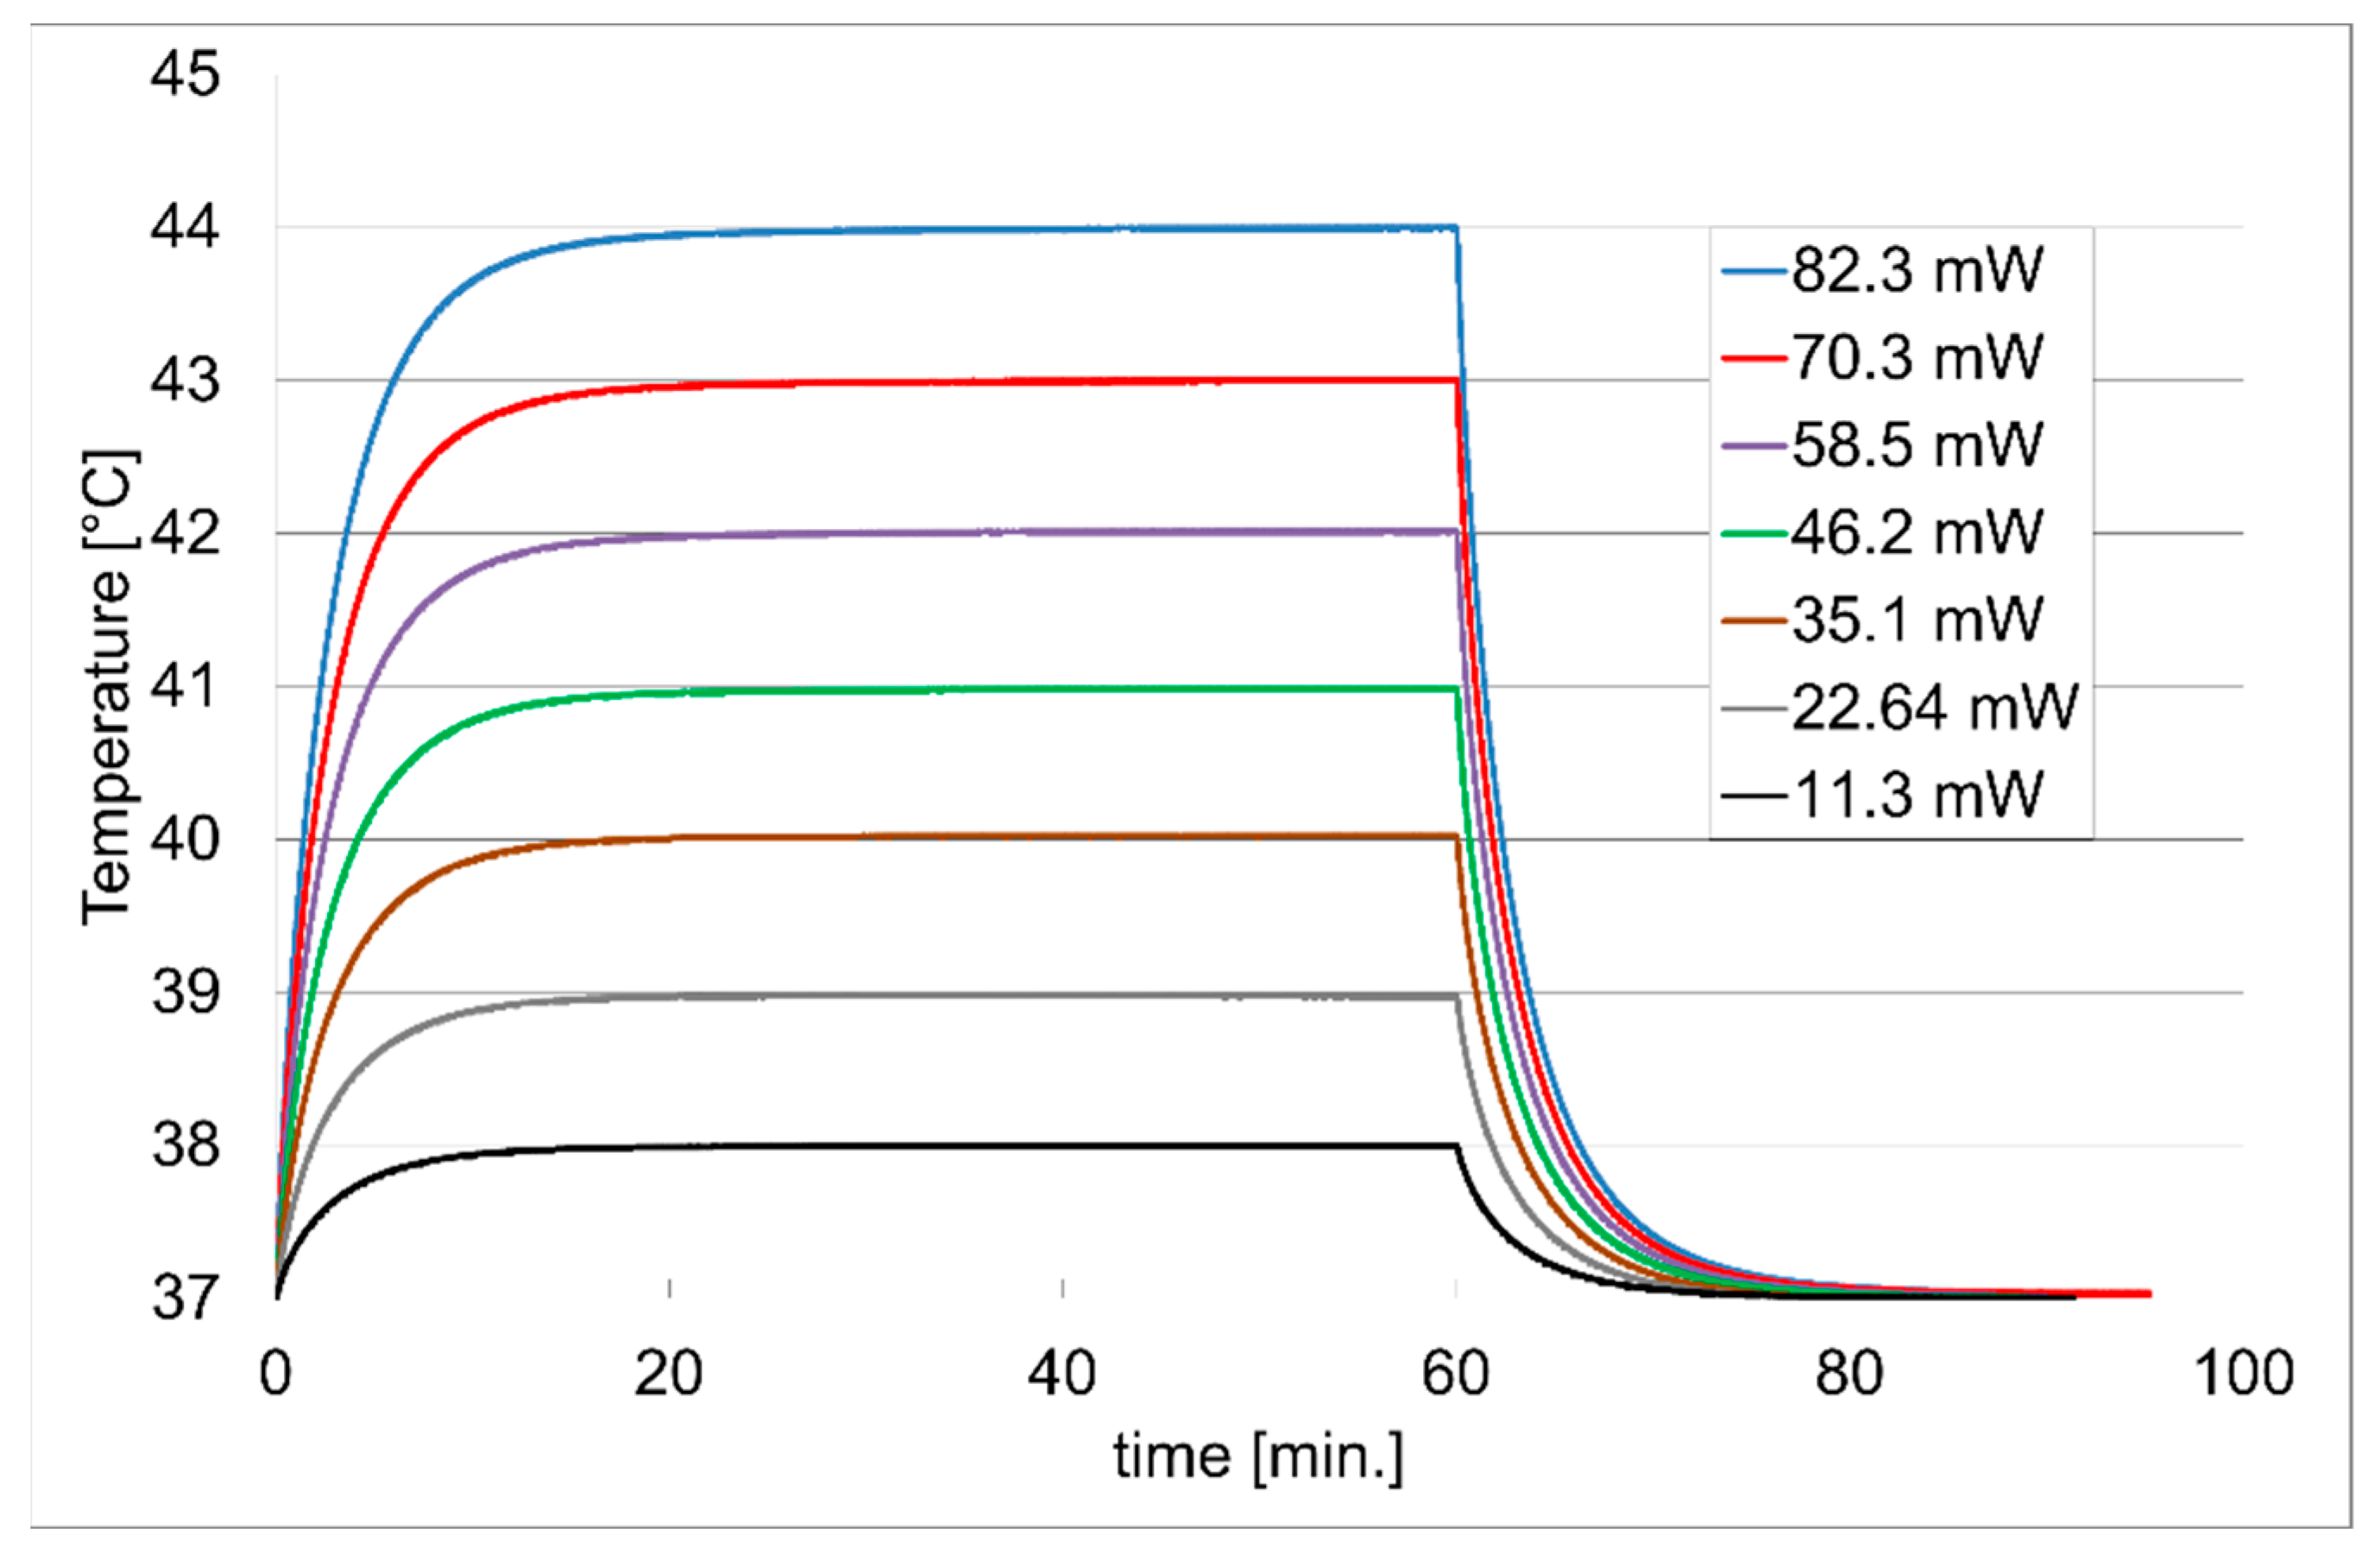
Then, power values for specific temperature values (38–44 °C, 1 °C steps) were read from the characteristics and measurements of temperature values were made as a function of time (Figure 8). The selection of supply voltages was based on experimental results. The next series of measurements were carried out after the heater had fully cooled down to 37 °C.
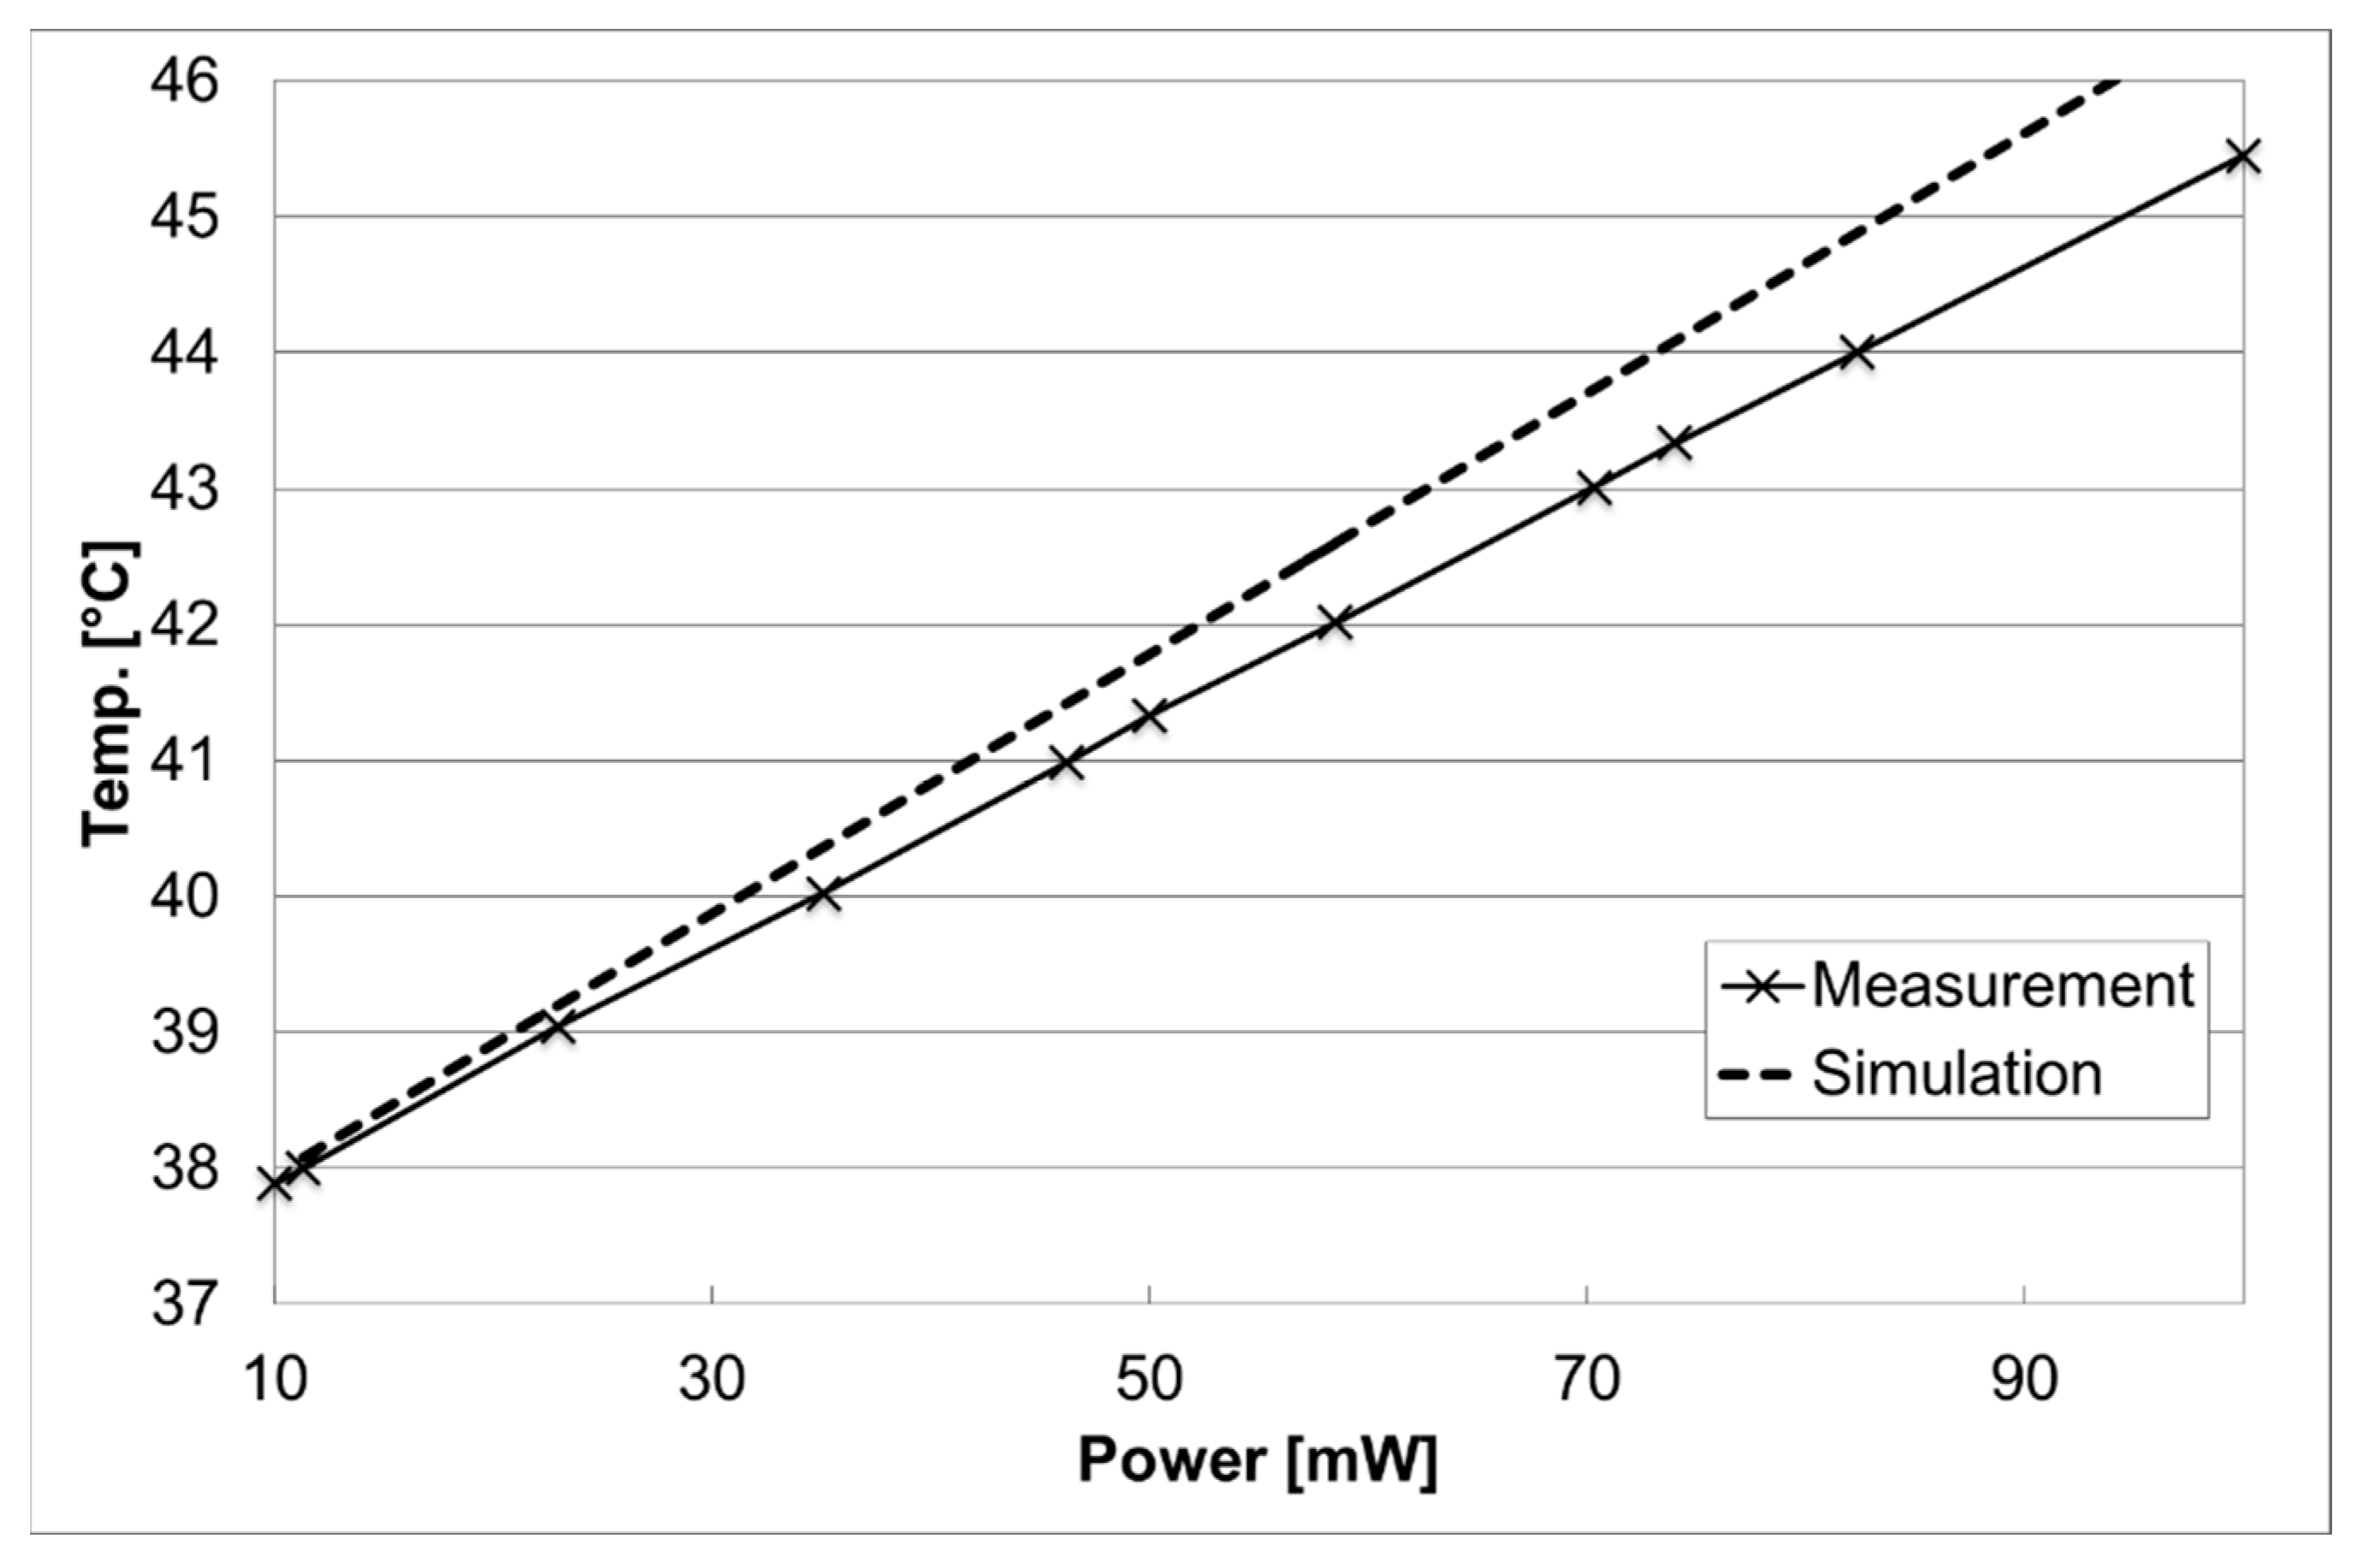
Then, the results obtained from the measurements were compared with the values calculated from the simulation of the microheater and culture well system. In the temperature range of 37–40 °C, the differences were insignificant. At higher temperatures, the spread of values increased between the simulation and the actual system (Figure 9). The system model has been optimized so that the thermal parameters of the simulation and the actual structure at the set power of 11.3 mW (38 °C) were as close as possible. The optimization was performed by changing thermal conductivity (11.3 W∙m−1∙K−1) and electrical conductivity (9.048 × 10⁵ S∙m−1) of the NiCr layer, as it was assumed that the obtained layer could have a slightly different composition and purity than the source material. In the model used, the key element was to determine the temperature distribution in the microheater–culture well system. More specifically, examining the temperature value at the location of the measuring electrodes and the dissipation of the set power in the water. At temperatures higher than those expected in cell culture applications (>40 °C), where cells may die, the model needs to be refined. This would require additional measurements of the heater structure, which will be performed in further stages of the work.
4. Conclusions
In local heating systems of a small liquid sample (0.8 mL), the energy transfer is conditioned by many parameters, which complicates the numerical analysis. The comparison of the results of the experiment with the results of the numerical analysis showed that the process of designing the microheater system for the breeding wells must take into account the heated object. The proposed method of local heating of the culture well would allow parallel studies to be carried out at different temperatures during the in vitro development of cells in adjacent wells. This is the optimal approach because it affects only a specific group of the tested cells, without causing changes in the control sample.
The advantages of the microheater made in the thin-layer nichrome technology are its low cost and simple structure. The achieved desired temperature values are completely safe for the analysed microheater structure, without causing any thermal damage. There were no significant changes in parameters during repeated heating cycles.
Placing the heating device under the substrate with measuring electrodes reduces the potential impact of the materials used for its construction on the tested cell culture. The control of the microheater was repeatable and hassle-free. It can be assumed that it is possible to reproduce the measured parameters under real cell culture conditions. The power supplied to the system is so large that it is able to locally raise the temperature in the well to the required value, directly in the place where the cell monolayer is formed. At the same time, the heat dissipates in the water and radiates from the walls of the well, which makes them close to the temperature in the climatic chamber (approx. 37 °C). Thus, the heat generated from the microheater does not increase the temperature in the adjacent wells.
Due to its small size, the microheater can be used in the commercial ECIS measuring system. During standard research, it can extend its capabilities by analysing the behaviour of a biological system grown at various temperatures.
The results from single cultures may differ slightly and uniquely with a small number of experiments; therefore, carrying out the cultivation with temperature changes, even several times, will be unrepeatable and unrepresentative. Consequently, relatively many cultures would have to be compared to produce performance statistics.
If additional optical observation of cultured cell cultures is used, only upright microscopy can be used. However, background complications from existing electrodes at the bottom of the well are possible.
Current times require looking for new solutions in the possibility of conducting low-cost and, at the same time, safe POC research. The use of local heating of cells during in vitro studies could help to better simulate the symptoms of various diseases. Moreover, the observation of cellular changes under controlled temperature conditions may enable testing the effect of new preparations, including reduction of high body temperature or neutralisation of infected cells.
The presented method of using technology in the field of microelectronics enables the measurement and maintenance of a specific temperature value in non-standard applications. The interdisciplinary nature of the experiments allows the described research methods to be applied in many new areas of science. This contributes to the creation of new devices based on an innovative approach to research problems.
The simplest design of the heater, in which the technological mask is in the form of a square, was used to increase the temperature in the well. In further stages of research, it is planned to make other designs of the heating resistor and to compare the fibroblast cell cultures for the temperature range 37–40 °C.
Author Contributions
Conceptualization, A.K. and D.Z.; methodology, A.K.; software, T.B.; validation, M.D.; formal analysis, D.Z., A.K. and M.D.; resources, M.D.; writing—original draft preparation, A.K.; writing—review and editing, T.B. and D.Z.; visualization, A.K. All authors have read and agreed to the published version of the manuscript.
Funding
This work was supported in part by the Lublin University of Technology under Grant FD-20/EE-2/311.
Institutional Review Board Statement
Not applicable.
Informed Consent Statement
Not applicable.
Data Availability Statement
Not applicable.
Acknowledgments
Thanks to the Chairman of the Scientific Discipline Council of Automatic Control, Electronics and Electrical Engineering of the Lublin University of Technology, Piotr Kisała, for financing the costs related to the publication of this work.
Conflicts of Interest
The authors declare no conflict of interest.
References
- Zhang, L.; Ding, B.; Chen, Q.; Feng, Q.; Lin, L.; Sun, J. Point-of-care-testing of nucleic acids by microfluidics. TrAC Trends Anal. Chem. 2017, 94, 106–116. [Google Scholar] [CrossRef]
- Azizipour, N.; Avazpour, R.; Rosenzweig, D.H.; Sawan, M.; Ajji, A. Evolution of Biochip Technology: A Review from Lab-on-a-Chip to Organ-on-a-Chip. Micromachines 2020, 11, 599. [Google Scholar] [CrossRef] [PubMed]
- Jeroish, Z.E.; Bhuvaneshwari, K.S.; Samsuri, F.; Narayanamurthy, V. Microheater: Material, design, fabrication, temperature control, and applications—A role in COVID-19. Biomed. Microdevices 2022, 24, 3. [Google Scholar] [CrossRef] [PubMed]
- Spruit, R.G.; Tijn Van Omme, J.; Ghatkesar, M.K.; Hugo Pérez Garza, H. A review on development and optimization of microheaters for high-temperature in situ studies. J. Microelectromech. Syst. 2017, 26, 1165–1182. [Google Scholar] [CrossRef]
- Ejeian, F.; Azadi, S.; Razmjou, A.; Orooji, Y.; Kottapalli, A.; Ebrahimi Warkiani, M.; Asadnia, M. Design and applications of MEMS flow sensors: A review. Sens. Actuators A Phys. 2019, 295, 483–502. [Google Scholar] [CrossRef]
- Kulkarni, M.B.; Goel, S. Recent advancements in integrated microthermofluidic systems for biochemical and biomedical applications—A review. Sens. Actuators A Phys. 2022, 341, 113590. [Google Scholar] [CrossRef]
- Paun, C.; Tomescu, R.; Cristea, D.; Ionescu, O.; Parvulescu, C. Design, fabrication and characterization of a micro-heater for metasurface-based gas sensors. In Proceedings of the 2020 International Semiconductor Conference (CAS), Sinaia, Romania, 7–9 October 2020; pp. 31–34. [Google Scholar] [CrossRef]
- Bagga, S.; Akhtar, J.; Mishra, S. Preeti Fabrication of coplanar microheater platform for LPG sensing applications. Microsyst. Technol. 2019, 26, 731–738. [Google Scholar] [CrossRef]
- Ricci, P.P.; Gregory, O.J. Free-standing, thin-film sensors for the trace detection of explosives. Sci. Rep. 2021, 11, 6623. [Google Scholar] [CrossRef]
- Rezania, A.; Rosendahl, L.A. Thermal effect of a thermoelectric generator on parallel microchannel heat sink. Energy 2012, 37, 220–227. [Google Scholar] [CrossRef]
- Oh, D.W. Thermal Property Measurement of Nanofluid Droplets with Temperature Gradients. Energies 2020, 13, 244. [Google Scholar] [CrossRef] [Green Version]
- Hernandez, C.A.; Beni, V.; Osma, J.F. Fully Automated Microsystem for Unmediated Electrochemical Characterization, Visualization and Monitoring of Bacteria on Solid Media; E. coli K-12: A Case Study. Biosensors 2019, 9, 131. [Google Scholar] [CrossRef] [PubMed] [Green Version]
- Jain, A.; Goodson, K.E. Thermal microdevices for biological and biomedical applications. J. Therm. Biol. 2011, 36, 209–218. [Google Scholar] [CrossRef]
- Curtis, T.M.; Collins, A.M.; Gerlach, B.D.; Brennan, L.M.; Widder, M.W.; van der Schalie, W.H.; Vo, N.T.K.; Bols, N.C. Suitability of invertebrate and vertebrate cells in a portable impedance-based toxicity sensor: Temperature mediated impacts on long-term survival. Toxicol. Vitr. 2013, 27, 2061–2066. [Google Scholar] [CrossRef]
- Pennington, M.R.; Van de Walle, G.R. Electric Cell-Substrate Impedance Sensing to Monitor Viral Growth and Study Cellular Responses to Infection with Alphaherpesviruses in Real Time. mSphere 2017, 2, 39–56. [Google Scholar] [CrossRef] [PubMed] [Green Version]
- Guiseppi-Elie, A.; Koch, L.; Finley, S.H.; Wnek, G.E. The effect of temperature on the impedimetric response of bioreceptor hosting hydrogels. Biosens. Bioelectron. 2011, 26, 2275–2280. [Google Scholar] [CrossRef] [PubMed]
- Campbell, C.E.; Laane, M.M.; Haugarvoll, E.; Giaever, I. Monitoring viral-induced cell death using electric cell-substrate impedance sensing. Biosens. Bioelectron. 2007, 23, 536–542. [Google Scholar] [CrossRef] [PubMed]
- Lo, C.-M.; Ferrier, J. Impedance analysis of fibroblastic cell layers measured by electric cell-substrate impedance sensing. Phys. Rev. E 1998, 57, 6982. [Google Scholar] [CrossRef]
- Xie, X.; Liu, R.; Xu, Y.; Wang, L.; Lan, Z.; Chen, W.; Liu, H.; Lu, Y.; Cheng, J. In vitro hyperthermia studied in a continuous manner using electric impedance sensing. RSC Adv. 2015, 5, 62007–62016. [Google Scholar] [CrossRef]
- Giaever, I.; Keese, C.R. Monitoring fibroblast behavior in tissue culture with an applied electric field. Proc. Natl. Acad. Sci. USA 1984, 81, 3761–3764. [Google Scholar] [CrossRef]
- Giaever, I.; Keese, C.R. A morphological biosensor for mammalian cells. Nature 1993, 366, 591–592. [Google Scholar] [CrossRef]
- Xu, Y.; Xie, X.; Duan, Y.; Wang, L.; Cheng, Z.; Cheng, J. A review of impedance measurements of whole cells. Biosens. Bioelectron. 2016, 77, 824–836. [Google Scholar] [CrossRef] [PubMed]
- Wilczyńska, A.; Kociubiński, A.; Zarzeczny, D.; Szypulski, M.; Pigoń, D.; Małecka-Massalska, T.; Prendecka-Wróbel, M. Monitoring vital functions of A-375 melanoma cell cultures via thin-film nickel capacitors. Eng. Biomater. 2020, 157, 10–14. [Google Scholar] [CrossRef]
- Kociubiński, A.; Zarzeczny, D.; Szypulski, M.; Wilczyńska, A.; Pigoń, D.; Małecka-Massalska, T. Monika Prendecka Real-time monitoring of cell cultures with nickel comb capacitors. Inform. Autom. Pomiary Gospod. Ochr. Śr. 2020, 10, 32–35. [Google Scholar] [CrossRef]
- Liao, H.Y.; Huang, C.C.; Chao, S.C.; Chiang, C.P.; Tang, B.H.; Lee, S.P.; Wang, J.K. Real-Time Monitoring the Cytotoxic Effect of Andrographolide on Human Oral Epidermoid Carcinoma Cells. Biosensors 2022, 12, 304. [Google Scholar] [CrossRef] [PubMed]
- Hung, Y.H.; Chiu, W.C.; Fuh, S.R.; Lai, Y.T.; Tung, T.H.; Huang, C.C.; Lo, C.M. ECIS Based Electric Fence Method for Measurement of Human Keratinocyte Migration on Different Substrates. Biosensors 2022, 12, 293. [Google Scholar] [CrossRef] [PubMed]
- Ebrahim, A.S.; Kani, H.; Carion, T.W.; Berger, E. Functional optimization of electric cell-substrate impedance sensing (ECIS) using human corneal epithelial cells. Res. Sq. 2022, 12, 14126. [Google Scholar] [CrossRef]
- Navas, A.; A, M.N. Electric Cell-Substrate Impedance Sensing (ECIS) for Analyzing the Effect of Environmental Pollutants—A Study of Diesel Exhaust Nanoparticles. J. Environ. Sci. Public Health 2022, 6, 189–203. [Google Scholar] [CrossRef]
- Kociubiński, A. Electric cell-substrate impedance sensing in biocompatibility research. J. Electr. Bioimpedance 2021, 12, 163–168. [Google Scholar] [CrossRef]
- Xiaoa, C.; Luong, J.H.T. A simple mathematical model for electric cell-substrate impedance sensing with extended applications. Biosens. Bioelectron. 2010, 25, 1774–1780. [Google Scholar] [CrossRef]
- Khanna, V.K.; Prasad, M.; Dwivedi, V.K.; Shekhar, C.; Pankaj, A.C.; Basu, J. Design and electro-thermal simulation of a polysilicon microheater on a suspended membrane for use in gas sensing. IJPAP 2007, 45, 332–335. [Google Scholar]
- Scorzoni, A.; Caputo, D.; Petrucci, G.; Placidi, P.; Zampolli, S.; De Cesare, G.; Tavernelli, M.; Nascetti, A. Design and experimental characterization of thin film heaters on glass substrate for Lab-on-Chip applications. Sens. Actuators A Phys. 2015, 229, 203–210. [Google Scholar] [CrossRef]
- Hwang, W.J.; Shin, K.S.; Roh, J.H.; Lee, D.S.; Choa, S.H. Development of Micro-Heaters with Optimized Temperature Compensation Design for Gas Sensors. Sensors 2011, 11, 2580–2591. [Google Scholar] [CrossRef] [Green Version]
- Prasad, M.; Yadav, R.P.; Sahula, V.; Khanna, V.K. Design and Simulation of Double-spiral Shape Micro-heater for Gas Sensing Applications. Sen. Transducers J. 2011, 129, 135–141. Available online: https://www.sensorsportal.com/HTML/DIGEST/P_817.htm (accessed on 2 September 2022).
- Zarzeczny, D.A. Selection of metals in biomems applications. In Photonics Applications in Astronomy, Communications, Industry, and High-Energy Physics Experiments; SPIE: Philadelphia, PA, USA, 2019; Volume 111762P, pp. 802–807. [Google Scholar] [CrossRef]
- Chang, W.-Y.; Hsihe, Y.-S. Multilayer microheater based on glass substrate using MEMS technology. Microelectron. Eng. 2016, 149, 25–30. [Google Scholar] [CrossRef]
- Deekla, P.; Phatthanakun, R.; Sujitjorn, S.; Chomnawang, N. Al Microheater and Ni Temperature Sensor Set based-on Photolithography with Closed-Loop Control. Int. J. Electr. Comput. Eng. 2015, 5, 849–858. [Google Scholar] [CrossRef]
- Li, X.; Huang, Y.; Chen, X.; Xu, X.; Xiao, D. Electro-thermal analysis of an Al–Ti multilayer thin film microheater for MEMS thruster application. Microsyst. Technol. 2018, 24, 2409–2417. [Google Scholar] [CrossRef]
- Zarzeczny, D. Increasing the cost-effectiveness of in vitro research through the use of titanium in the device for measuring the electrical parameters of cells. Inform. Autom. Pomiary Gospod. Ochr. Śr. 2021, 11, 62–66. [Google Scholar] [CrossRef]
- Kim, Y.; Choi, H.; Kwon, S.; Lee, S.; Kang, H.; Choi, W. Thermal Analysis of Energy Storage Capacity According to Thickness of Nickel/Chromium Alloy Layer. Energies 2021, 14, 3217. [Google Scholar] [CrossRef]
- Petley, V.; Sathishkumar, S.; Thulasi Raman, K.H.; Rao, G.M.; Chandrasekhar, U. Microstructural and mechanical characteristics of Ni–Cr thin films. Mater. Res. Bull. 2015, 66, 59–64. [Google Scholar] [CrossRef]
- Vinayak, S.; Vyas, H.P.; Vankar, V.D. Microstructure and electrical characteristics of Ni–Cr thin films. Thin Solid Films 2007, 515, 7109–7116. [Google Scholar] [CrossRef]
- Kazi, I.H.; Wild, P.M.; Moore, T.N.; Sayer, M. Characterization of sputtered nichrome (Ni–Cr 80/20 wt.%) films for strain gauge applications. Thin Solid Films 2006, 515, 2602–2606. [Google Scholar] [CrossRef]
- Lizak, T.; Szypulski, M.; Zarzeczny, D.; Muzyka, K.; Kociubiński, A. Modeling and simulation of nichrome microheater on polycarbonate substrate. In Proceedings of the Photonics Applications in Astronomy, Communications, Industry, and High-Energy Physics Experiments, Wilga, Poland, 3–10 June 2018; SPIE: Philadelphia, PA, USA, 2018; Volume 10808, p. 124. [Google Scholar]
- Ortloff, D.; Schmidt, T.; Hahn, K.; Bieniek, T.; Janczyk, G.; Brück, R. MEMS Product Engineering. In MEMS Product Engineering; Springer: Berlin/Heidelberg, Germany, 2014; pp. 53–83. [Google Scholar] [CrossRef]
Figure 1.
In vitro cell culture medium with electrodes and wells used in the ECIS measurement system.
Figure 1.
In vitro cell culture medium with electrodes and wells used in the ECIS measurement system.

Figure 2.
The expected nature of changes in the measured resistance for 4 kHz and capacitance for 64 kHz. As the measured value of the resistance increases, the value of the measured capacitance value decreases. In the first phase, cells are placed in the well with the medium (arrows indicate cell movement) (I). Then, cells at a dynamic pace migrate along the surface of the bottom of the container, multiplying (II). After this stage, cell growth (III) slows down, after which the cells occupy the entire bottom of the container, reaching full confluence and forming a monolayer (IV). The last stage of the life cycle of cells is their death and loss of contact with the substrate (V).

Figure 3.
Diagram of a microheater: top view (a), cross-section (b), and a photo of the manufactured device (c).
Figure 3.
Diagram of a microheater: top view (a), cross-section (b), and a photo of the manufactured device (c).

Figure 4.
Structure of the cultureware well array with NiCr microheater.

Figure 5.
Distribution of the generated mesh on the model of the microheater–culture system (cross-section).
Figure 5.
Distribution of the generated mesh on the model of the microheater–culture system (cross-section).

Figure 6.
Culture well with the heater active area marked (a) and simulation results of the temperature distribution in the cross-section of the well with capacitor electrodes for the power dissipated from the microheater of 22.6 mW in a steady state (b).
Figure 6.
Culture well with the heater active area marked (a) and simulation results of the temperature distribution in the cross-section of the well with capacitor electrodes for the power dissipated from the microheater of 22.6 mW in a steady state (b).

Figure 7.
Model of the microheater–culture system with electrodes (with the area of the well marked) and a visible temperature distribution on the substrate in a steady state, after hiding the water layer for the power dissipated from the microheater of 22.64 mW.
Figure 7.
Model of the microheater–culture system with electrodes (with the area of the well marked) and a visible temperature distribution on the substrate in a steady state, after hiding the water layer for the power dissipated from the microheater of 22.64 mW.

Figure 8.
Characteristics for successive temperatures on the electrodes of the capacitor depending on the heating time. After 60 min, the power to the heaters is turned off and the temperature is measured during the return to the initial state (37 °C).
Figure 8.
Characteristics for successive temperatures on the electrodes of the capacitor depending on the heating time. After 60 min, the power to the heaters is turned off and the temperature is measured during the return to the initial state (37 °C).

Figure 9.
Characteristics of the temperature on the electrodes of the capacitor depending on the power of the microheater in the range of 10–100 mW for the measured values and the values from the simulation of the system.
Figure 9.
Characteristics of the temperature on the electrodes of the capacitor depending on the power of the microheater in the range of 10–100 mW for the measured values and the values from the simulation of the system.


Table 1.
Physical properties of the materials.
| Material | Thermal Conductivity [pW/µm∙K] | Specific Heat [pJ/kg∙K] |
|---|---|---|
| PET | 2.1 × 10⁵ | 1.2 × 10¹⁵ |
| NiCr | 1.13 × 10⁷ | 4.5 × 10¹⁴ |
| Au | 2.97 × 10⁸ | 1.287 × 10¹⁴ |
| H2O | 5.9 × 10⁵ | 4.18 × 10¹⁵ |
Publisher’s Note: MDPI stays neutral with regard to jurisdictional claims in published maps and institutional affiliations. |
© 2022 by the authors. Licensee MDPI, Basel, Switzerland. This article is an open access article distributed under the terms and conditions of the Creative Commons Attribution (CC BY) license (https://creativecommons.org/licenses/by/4.0/).
Share and Cite
MDPI and ACS Style
Kociubiński, A.; Zarzeczny, D.; Duk, M.; Bieniek, T. Analysis of Heat Flow for In Vitro Culture Monitored by Impedance Measurement. Energies 2022, 15, 8231. https://doi.org/10.3390/en15218231
AMA Style
Kociubiński A, Zarzeczny D, Duk M, Bieniek T. Analysis of Heat Flow for In Vitro Culture Monitored by Impedance Measurement. Energies. 2022; 15(21):8231. https://doi.org/10.3390/en15218231
Chicago/Turabian StyleKociubiński, Andrzej, Dawid Zarzeczny, Mariusz Duk, and Tomasz Bieniek. 2022. "Analysis of Heat Flow for In Vitro Culture Monitored by Impedance Measurement" Energies 15, no. 21: 8231. https://doi.org/10.3390/en15218231
Note that from the first issue of 2016, this journal uses article numbers instead of page numbers. See further details here.