Article

Experimental Rock Characterisation of Upper Pannonian Sandstones from Szentes Geothermal Field, Hungary

1
Institute of Geography and Earth Sciences, University of Pécs, 7624 Pécs, Hungary
2
Geochem Geological and Environmental Research, Consultancy and Service Ltd., 7673 Kővágószőlős, Hungary
3
GFZ German Research Centre for Geosciences, Telegrafenberg, 14473 Potsdam, Germany
4
Mecsekérc Ltd., 7633 Pécs, Hungary
5
Environmental Analytical and Geoanalytical Research Group, SzRC, University of Pécs, 7624 Pécs, Hungary
*
Author to whom correspondence should be addressed.
Energies 2022, 15(23), 9136; https://doi.org/10.3390/en15239136
Submission received: 4 October 2022 / Revised: 16 November 2022 / Accepted: 25 November 2022 / Published: 2 December 2022
(This article belongs to the Special Issue The Advancement of Geothermal Energy Utilisation by New Developments)

Abstract

:
The Upper Pannonian (UP) sandstone formation has been utilised for thermal water production in Hungary for several decades. Although sustainable utilisation requires the reinjection of cooled geothermal brine into the host rock, only a fraction of the used water is reinjected in the country. UP sandstone formation is reported to exhibit low injectivity, making reinjection challenging, and its petrophysical properties are poorly known, which increases uncertainty in designing operational parameters. The goal of the study is to provide experimental data and to gain a better understanding of formation characteristics that control injectivity and productivity issues in Upper Pannonian sandstone layers. Petrographical characterisation and petrophysical laboratory experiments are conducted on cores retrieved from two wells drilled in the framework of an R&D project at the depth of between 1750 m and 2000 m. The experiments, such as grain density, porosity, permeability, and ultrasonic velocity, as well as thin section, grain size distribution, XRD, and SEM analyses, are used to determine Petrophysical Rock Types (PRT) that share distinct hydraulic (flow zone indicator, FZI) and petrophysical characteristics. These are used to identify well intervals with lower potential for injectivity issues. The results imply that fines migration due to formation erosion is one of the key processes that must be better understood and controlled in order to mitigate injectivity issues at the study area. Future investigation should include numerical and experimental characterisation of formation damage, including water–rock interaction tests, critical flow velocity measurements, and fines migration analysis under reservoir conditions.

1. Introduction

The Upper Pannonian (UP) sandstone formation in Hungary has been utilised for thermal water production, especially in the Szentes Geothermal Field, for over 60 years [1]. Although sustainable utilisation requires the reinjection of cooled geothermal brine into the host rock, less than 10% of all geothermal wells have been used as reinjection wells in the country [1]. This is linked to economic constraints posed by high-pressure injection technology employed by the oil and gas industry, as well as several unsuccessful reinjection operations in Pannonian sandstone formations [2,3,4].
Several underlying mechanisms were proposed that might cause reinjection issues, but no effective mitigation strategy has been developed yet [5]. Markó et al. [6] have recently proposed a methodology for the systematic identification of potential reasons for the low injectivity of sandstone aquifers with suggested methods for eliminating them. According to this study, possible processes that limit reinjection can occur in the near borehole area, or be related to reservoir or regional scale hydraulics. At borehole scale, local clogging processes such as particle migration, e.g., sand production due to formation damage [7,8,9], and mineral precipitation, e.g., scaling [10,11], as well as microbial activity, e.g., biofilm formation [12,13], are possible. At reservoir scale, inadequate performance may be associated with limited reservoir extent [14] and low permeability as well as reservoir performance [15]. At regional scale, the potential presence of an overpressured zone may be considered [16,17]. The injection problems may arise from a combination of these processes as well. Using the workflow proposed by Markó et al. [6], Brehme et al. [18] report on the successful implementation of this approach in a geothermal well at a depth of approx. 2000 m near Mezőberény in the Békés Basin, South-East Hungary. They conclude that low injectivity of Újfalu Formation sandstone rock is associated with low reservoir permeability and the precipitation of carbonates, iron, and manganese minerals. Injectivity enhancement is achieved by the combination of tailored hydraulic and chemical stimulation.
Besides investigating possible sources for reduced injectivity, a major challenge in planning field operations is the limited availability of petrophysical properties for UP sandstone formations [18,19,20,21]. Willems et al. [20] have recently proposed a methodology for filling this data gap based on laboratory tests conducted on Újfalu Formation core fragments from two legacy wells in the Békés Basin and subsequent numerical flow simulation. The experiments include petrographic methods, such as thin-section and X-ray Diffraction (XRD) analysis, and petrophysical techniques including helium gas porosimetry and X-ray Computed Tomography (X-CT) imaging, as well as numerical flow simulation for determining permeability indirectly. Although the applicability of upscaling these results for reservoir scale studies is limited by the very small number of core fragments analysed, i.e., solely three samples, this is enhanced by numerical flow simulation for determining permeability indirectly.
Despite the previous efforts and proposed workflows discussed above, geothermal doublets drilled in UP sandstone formations still experience injection problems. Therefore, there is a need for better understanding of both formation characteristics and the underlying mechanisms resulting in low injectivity in order to develop effective mitigation strategies. The research and development (R&D) project “Development of a well completion technology for sustainable and cost-effective reinjection of thermal water” aims at the multiscale characterisation of UP sandstone formations and development of a targeted methodology for maintaining or enhancing the injectivity of geothermal wells with a focus on the Szentes Geothermal Field in Hungary [18]. The project includes a series of laboratory experiments, the drilling of new wells targeted at these formations including geophysical logging and hydraulic investigations, and the recompletion of an existing well for reinjection for Frac&Pack stimulation. We note that the construction of the well SZT-1 and the recompletion technology for the existing well SZT-VIII (also referred to as K-666) are presented in Farkas et al. 2022 [15] in detail.
In this paper, we present the results of the laboratory experiments UP sandstone samples in the framework of the R&D project. In this study, we focus on the core scale and microscale features of the investigated samples in order to give an insight into the petrophysical and petrological characteristics of UP sandstone rocks. The laboratory investigation includes petrographic characterisation, such as thin section, grain size distribution, XRD and scanning electron microscope (SEM) analyses, and petrophysical experiments, i.e., grain density, helium gas porosity, and permeability, as well as ultrasonic wave velocity measurements. The possibility of conducting these tests on several cores retrieved from newly drilled exploration wells allows extending the limited public dataset on mineralogical and petrophysical characteristics of UP sandstones. Furthermore, the analyses may contribute to the understanding of characteristics that control decline in injectivity or productivity in UP unconsolidated sandstone reservoir. We apply the Petrophysical Rock Typing (PRT) technique, which allows classifying rocks that share similar hydraulic and petrophysical properties for identifying well intervals with lower potential for injectivity problems.
This paper is structured as follows: in Section 2, the Szentes Geothermal Field is presented. In Section 3, the experimental methods are described. In Section 4, the petrographic and petrophysical results are presented. In the same section, the results are compared; their applicability and suggestions for future work are also discussed. In Section 5, conclusions are drawn.

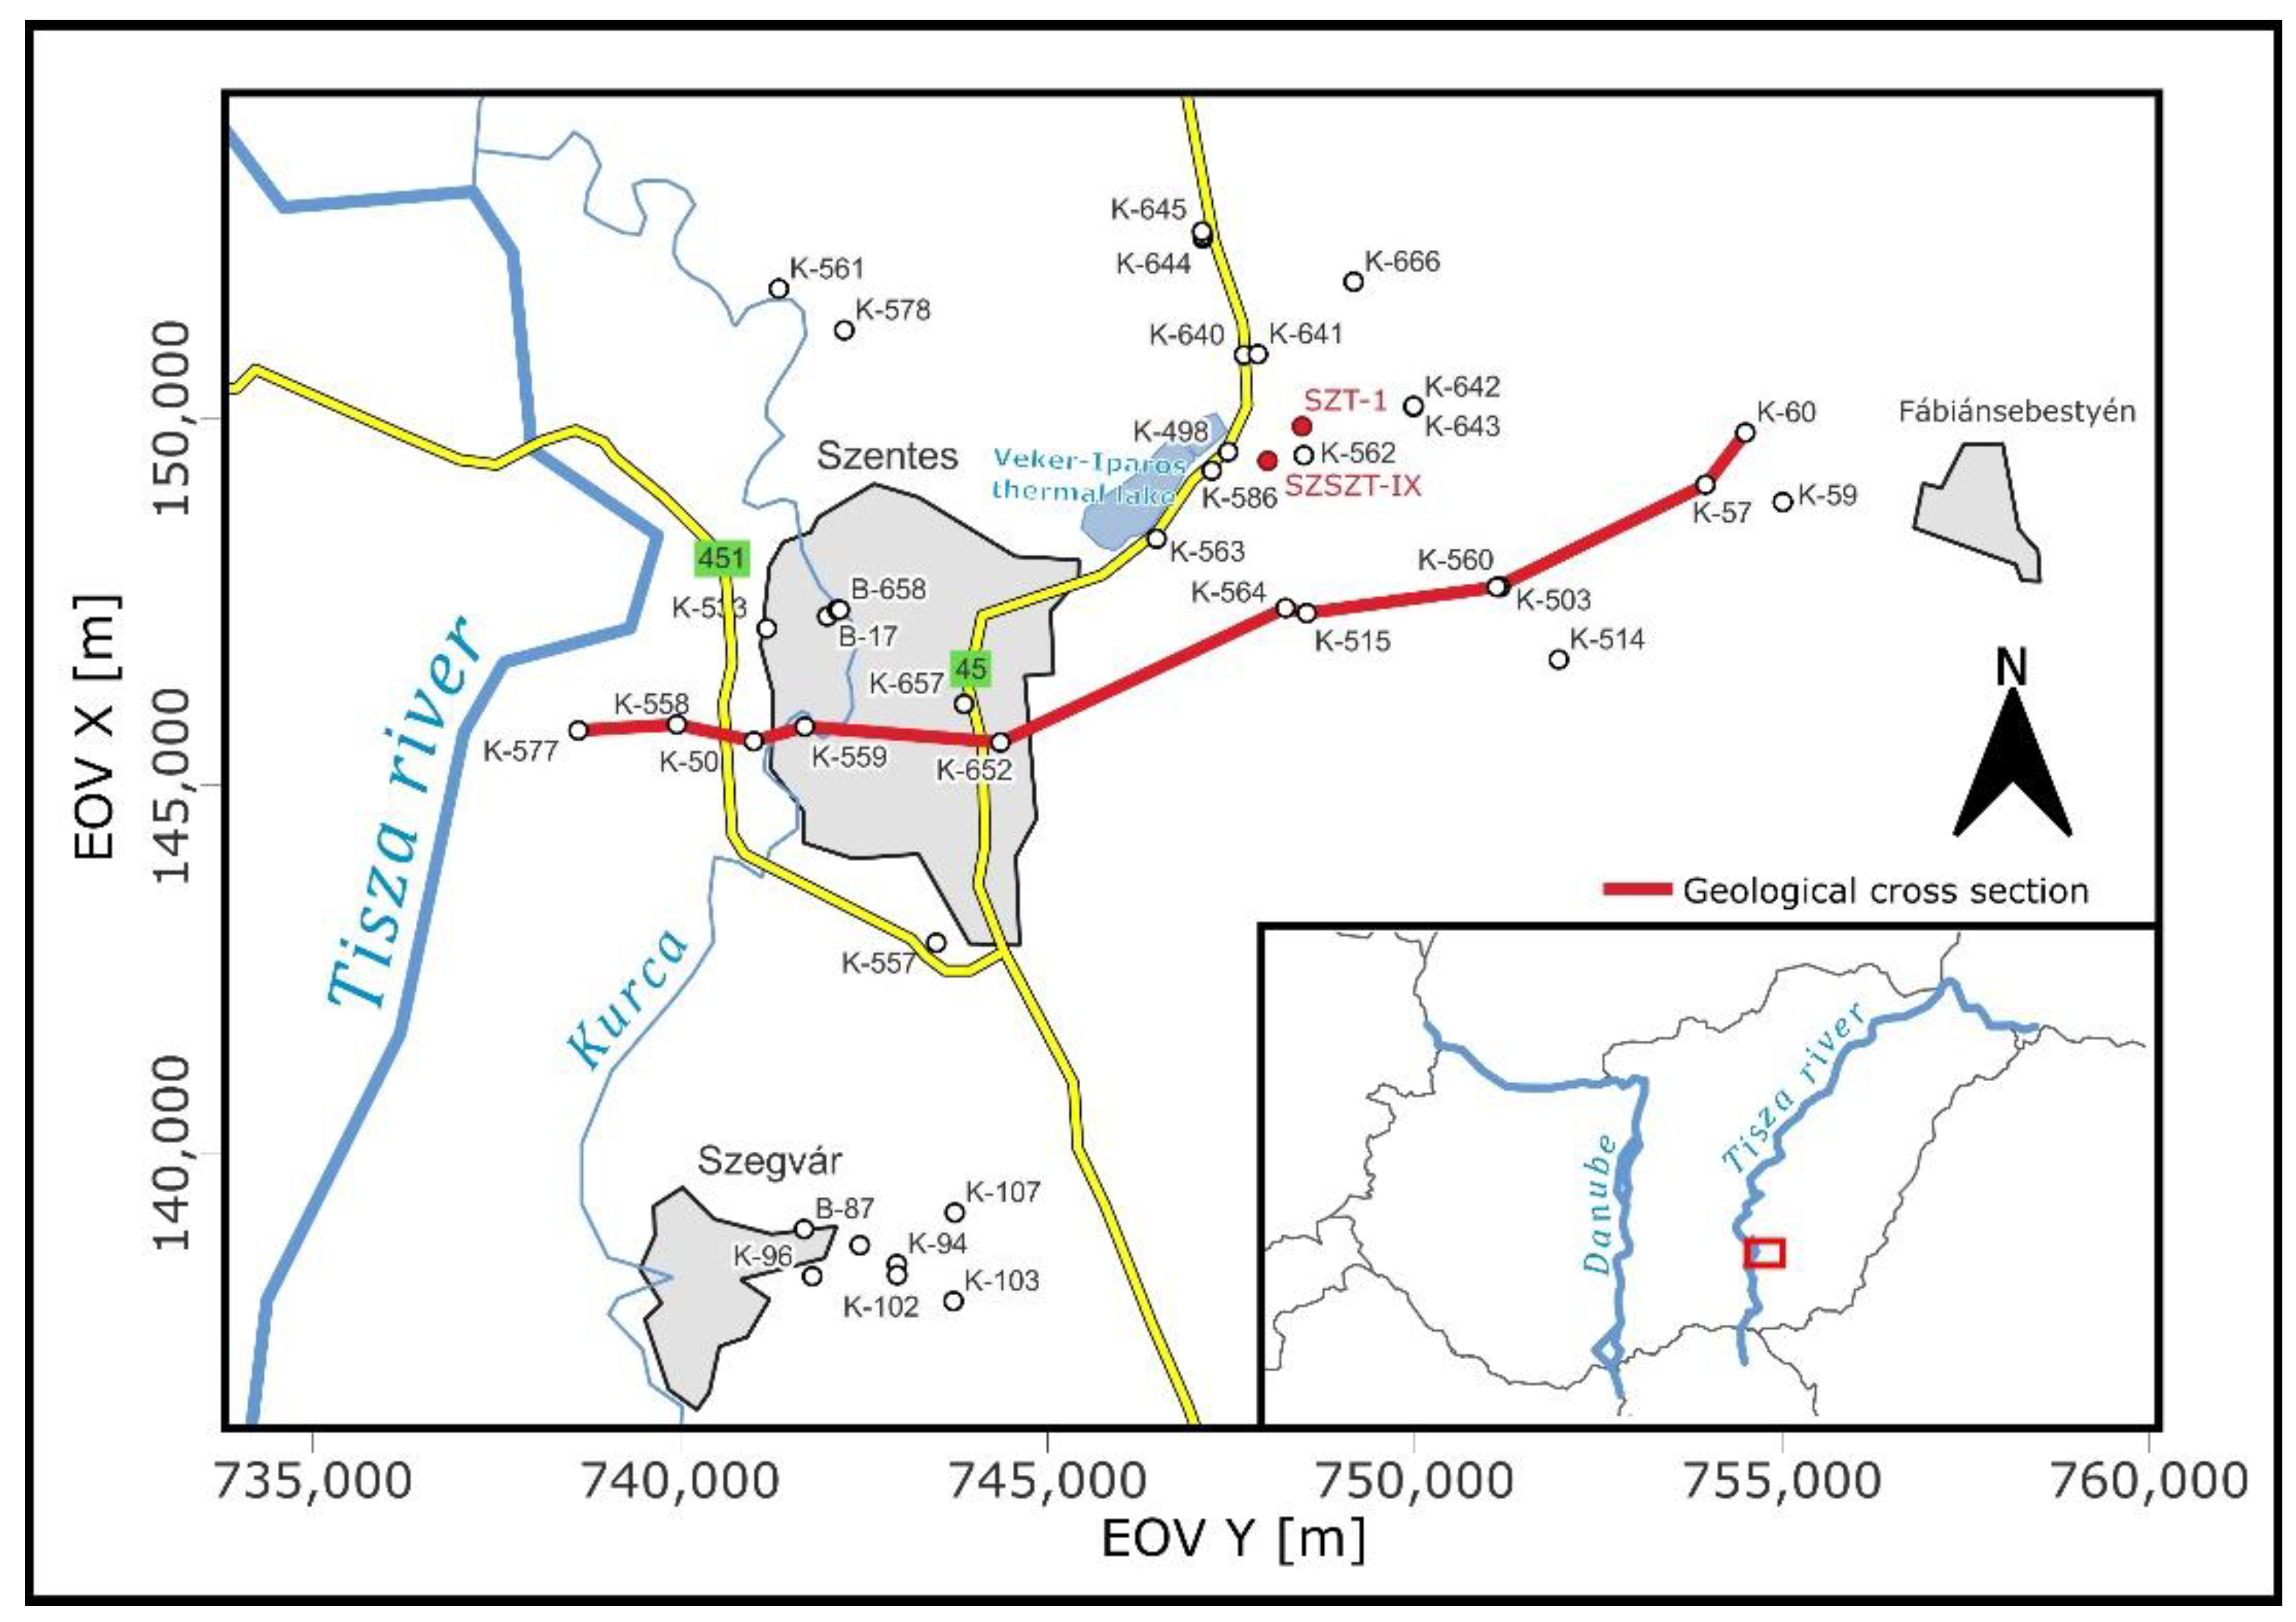
2. Szentes Geothermal Field

2.1. Field History

The Szentes Geothermal Field is located in South-East Hungary on the left bank of the Tisza river (Figure 1). It is one of the most intensively utilised geothermal areas in Hungary, with 40 active wells producing more than 5.5 million m3 of hot water per year [1]. The produced thermal water is utilised for district heating and balneology, as well as for agricultural purposes. All the produced water is discharged in surface water [3].
The latest study on the production history of the Szentes Geothermal Field is published by Bálint and Szanyi 2015 [1], who provide an in-depth overview of field development and hydraulic characteristics, such as production history of the wells based on previous hydraulic test reports [22,23,24] and the latest hydraulic test campaign, conducted in 20 wells between 2009 and 2010 [2]. They point out that continuous production over decades without reinjection results in a significant drop in production rate, i.e., approx. 7.6 million m3/year in 1971–1972 vs. 5.5 million m3/year in 2009–2010, and a pressure drop of 1.5 to 4 bar with respect to hydrostatic pressure, both factors contributing to the decline in injectivity of the doublet.

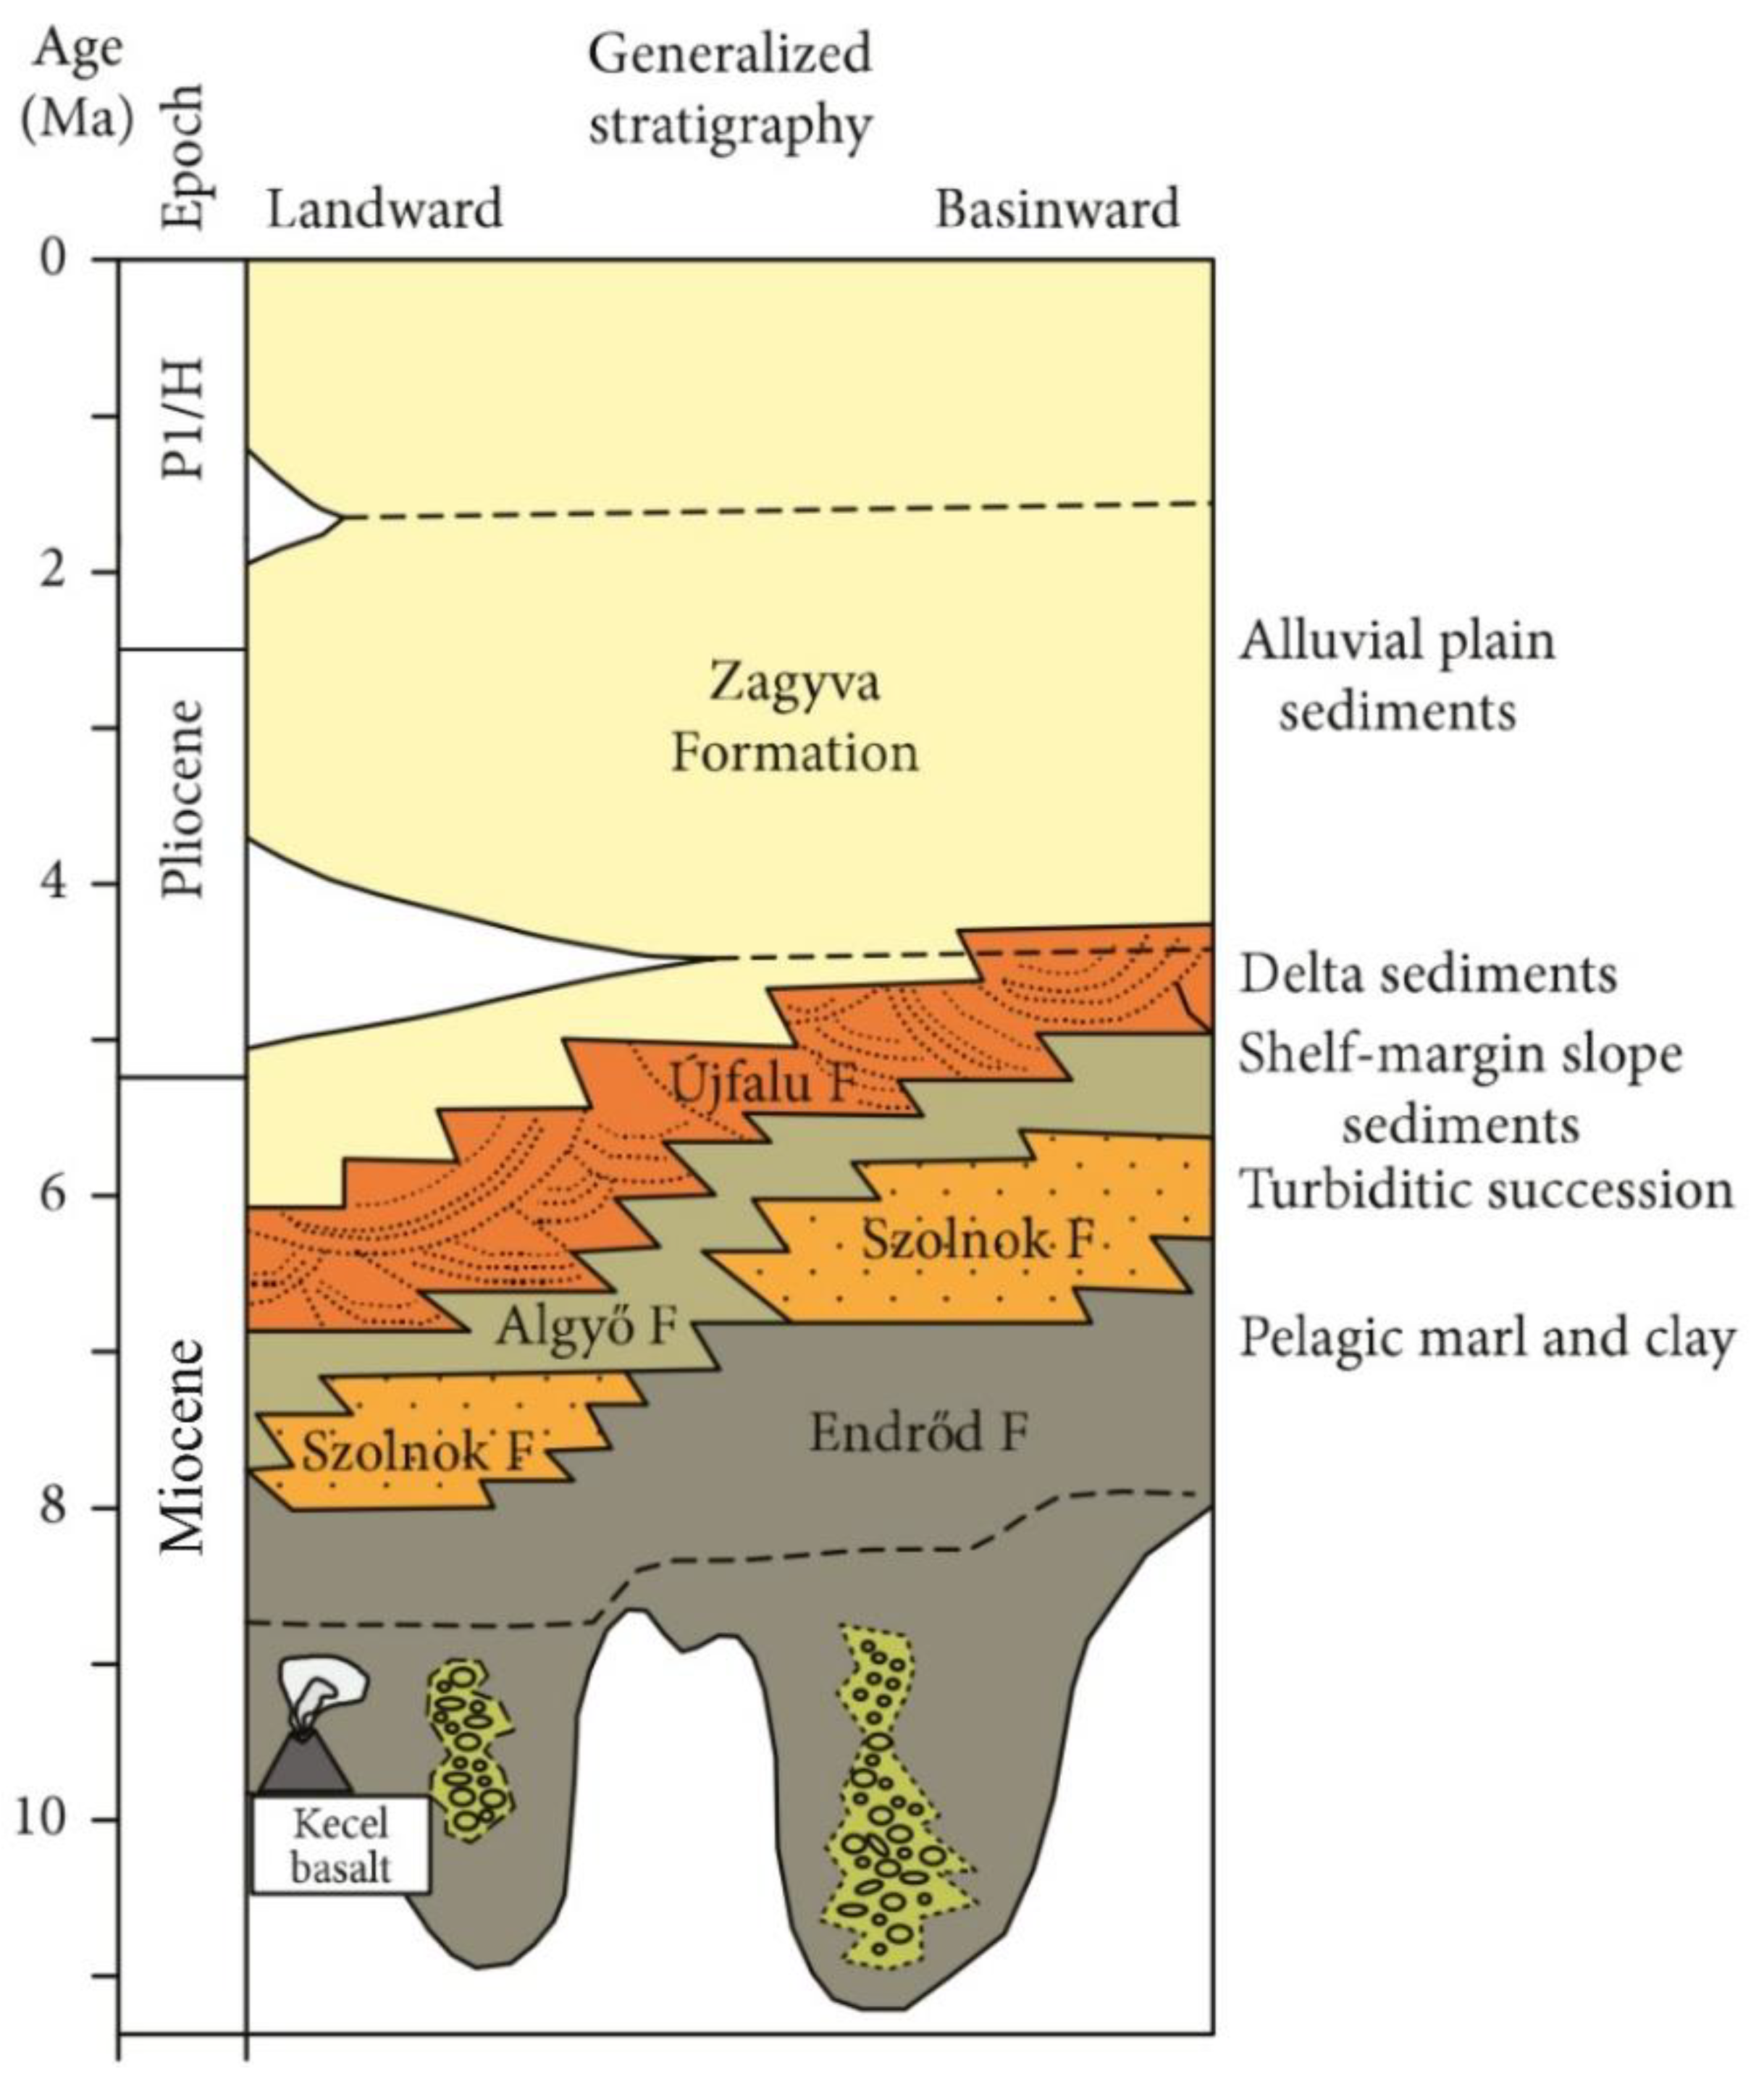
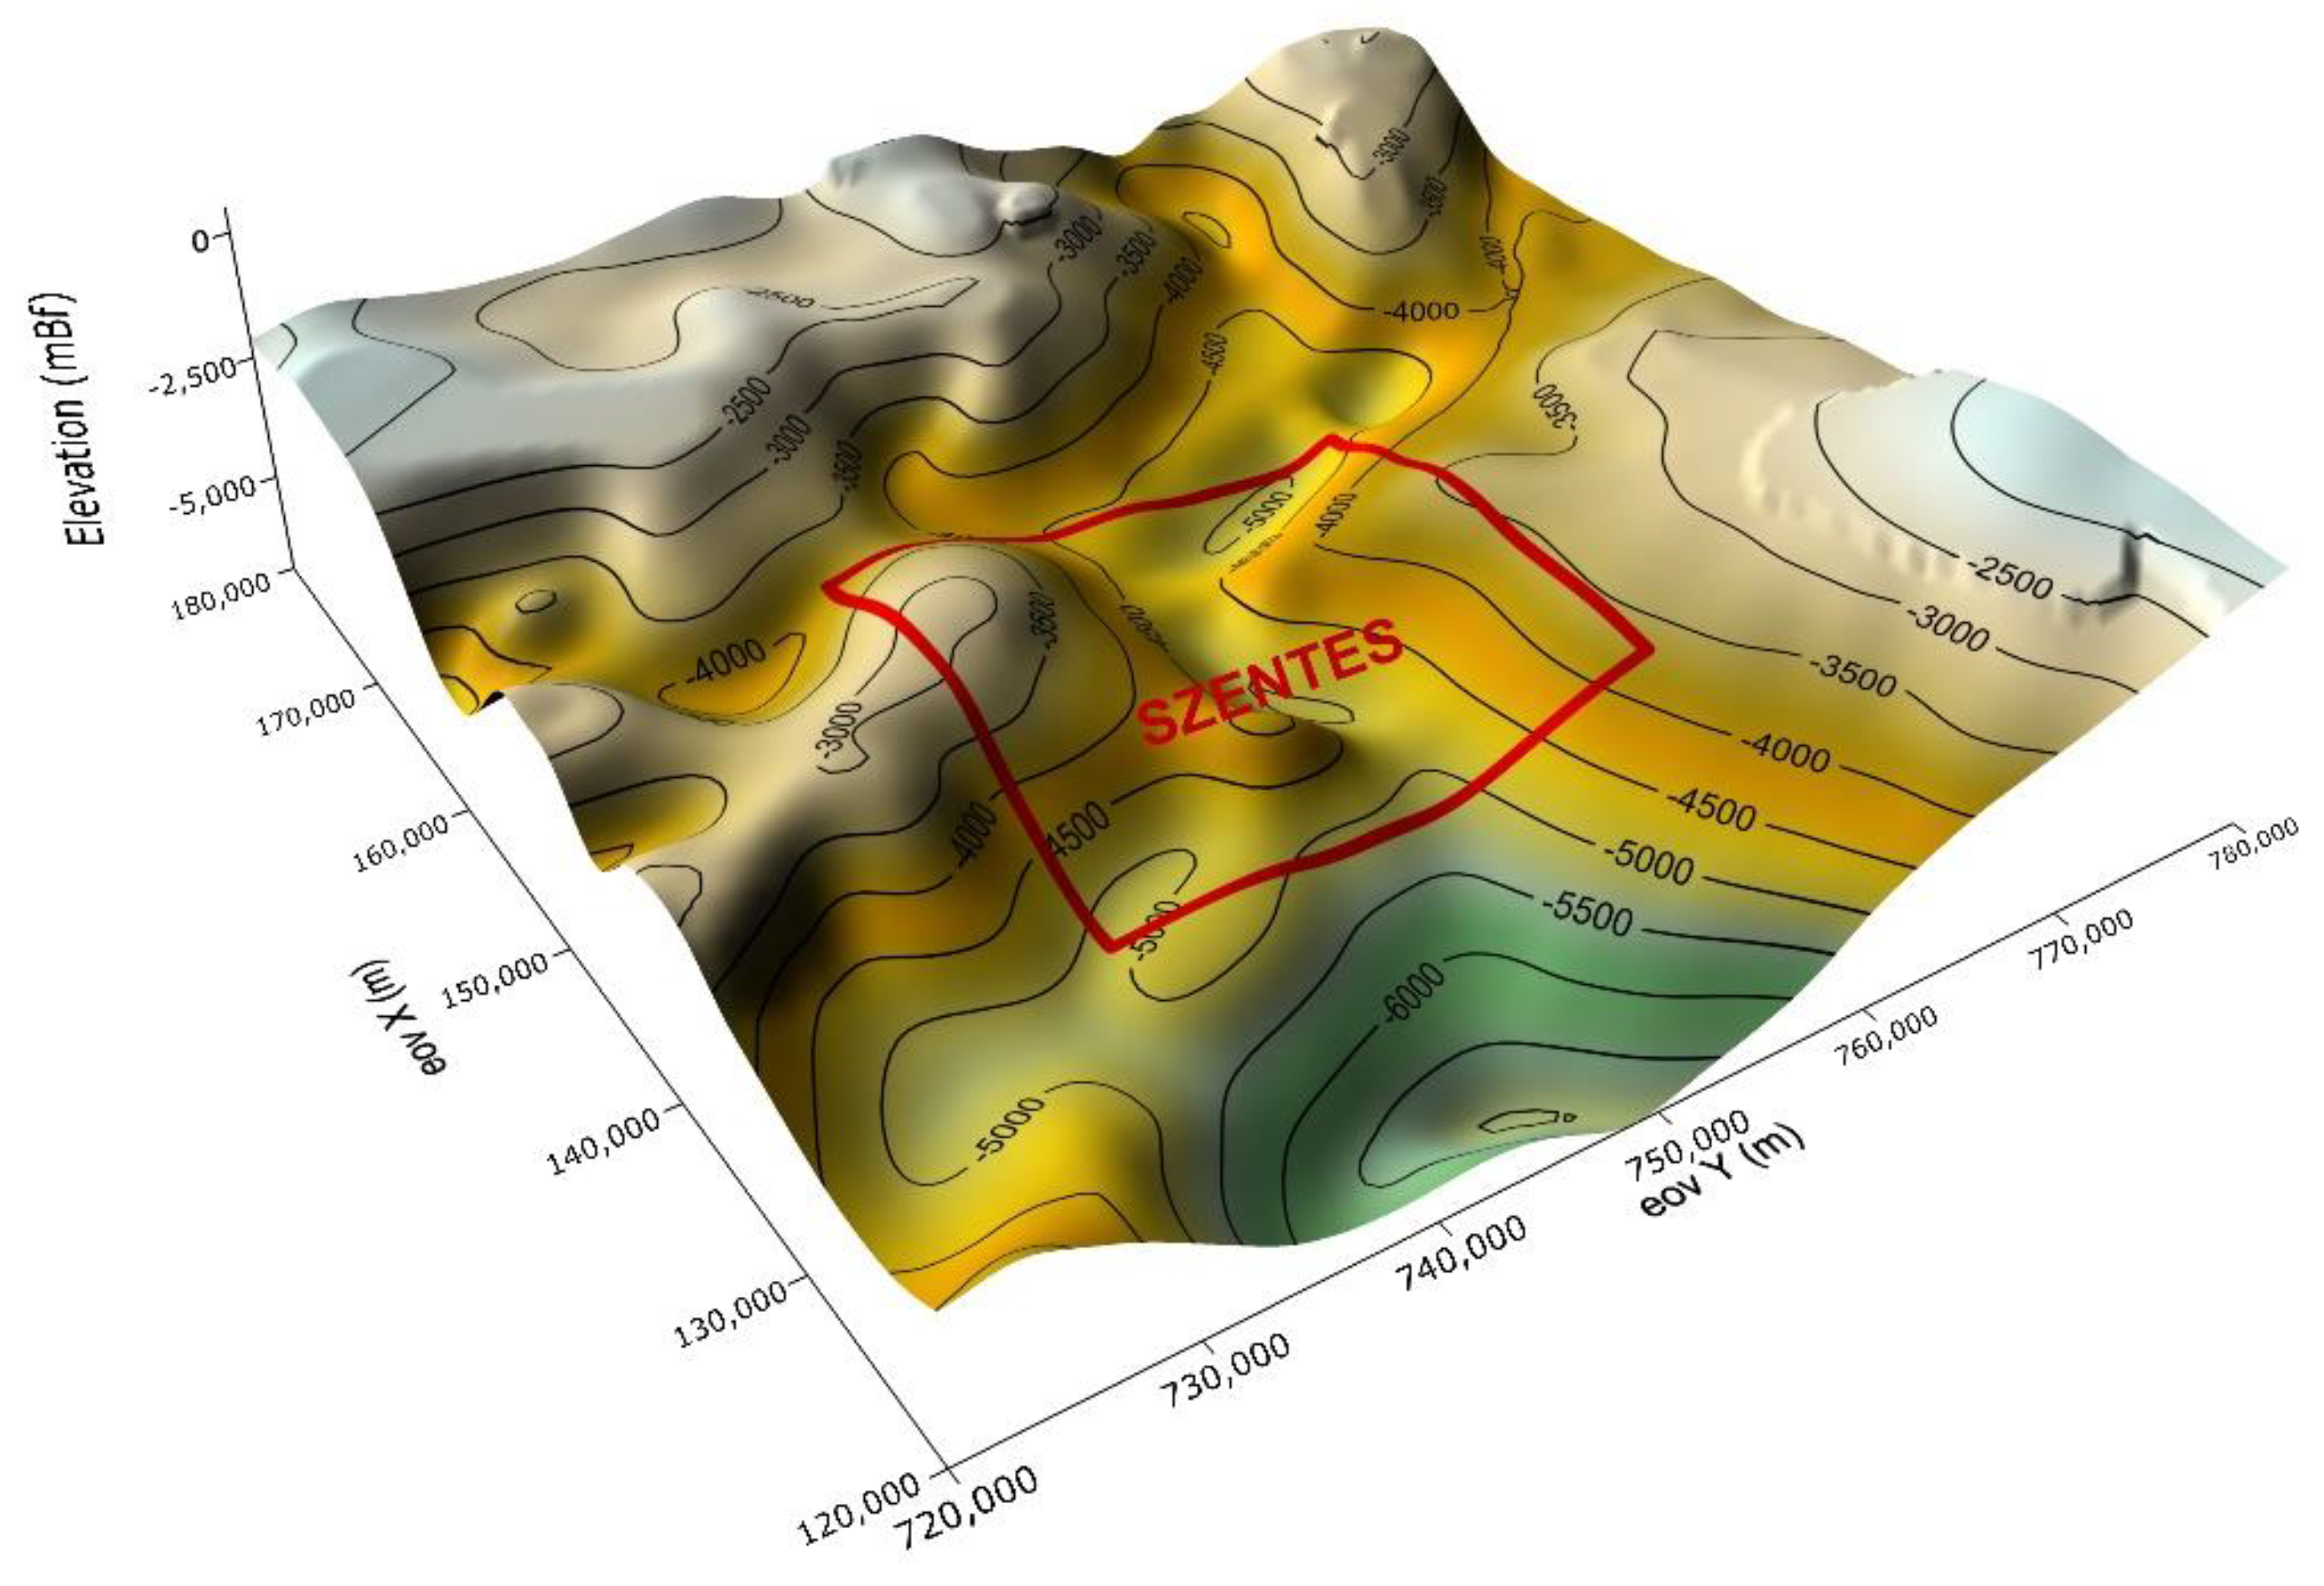
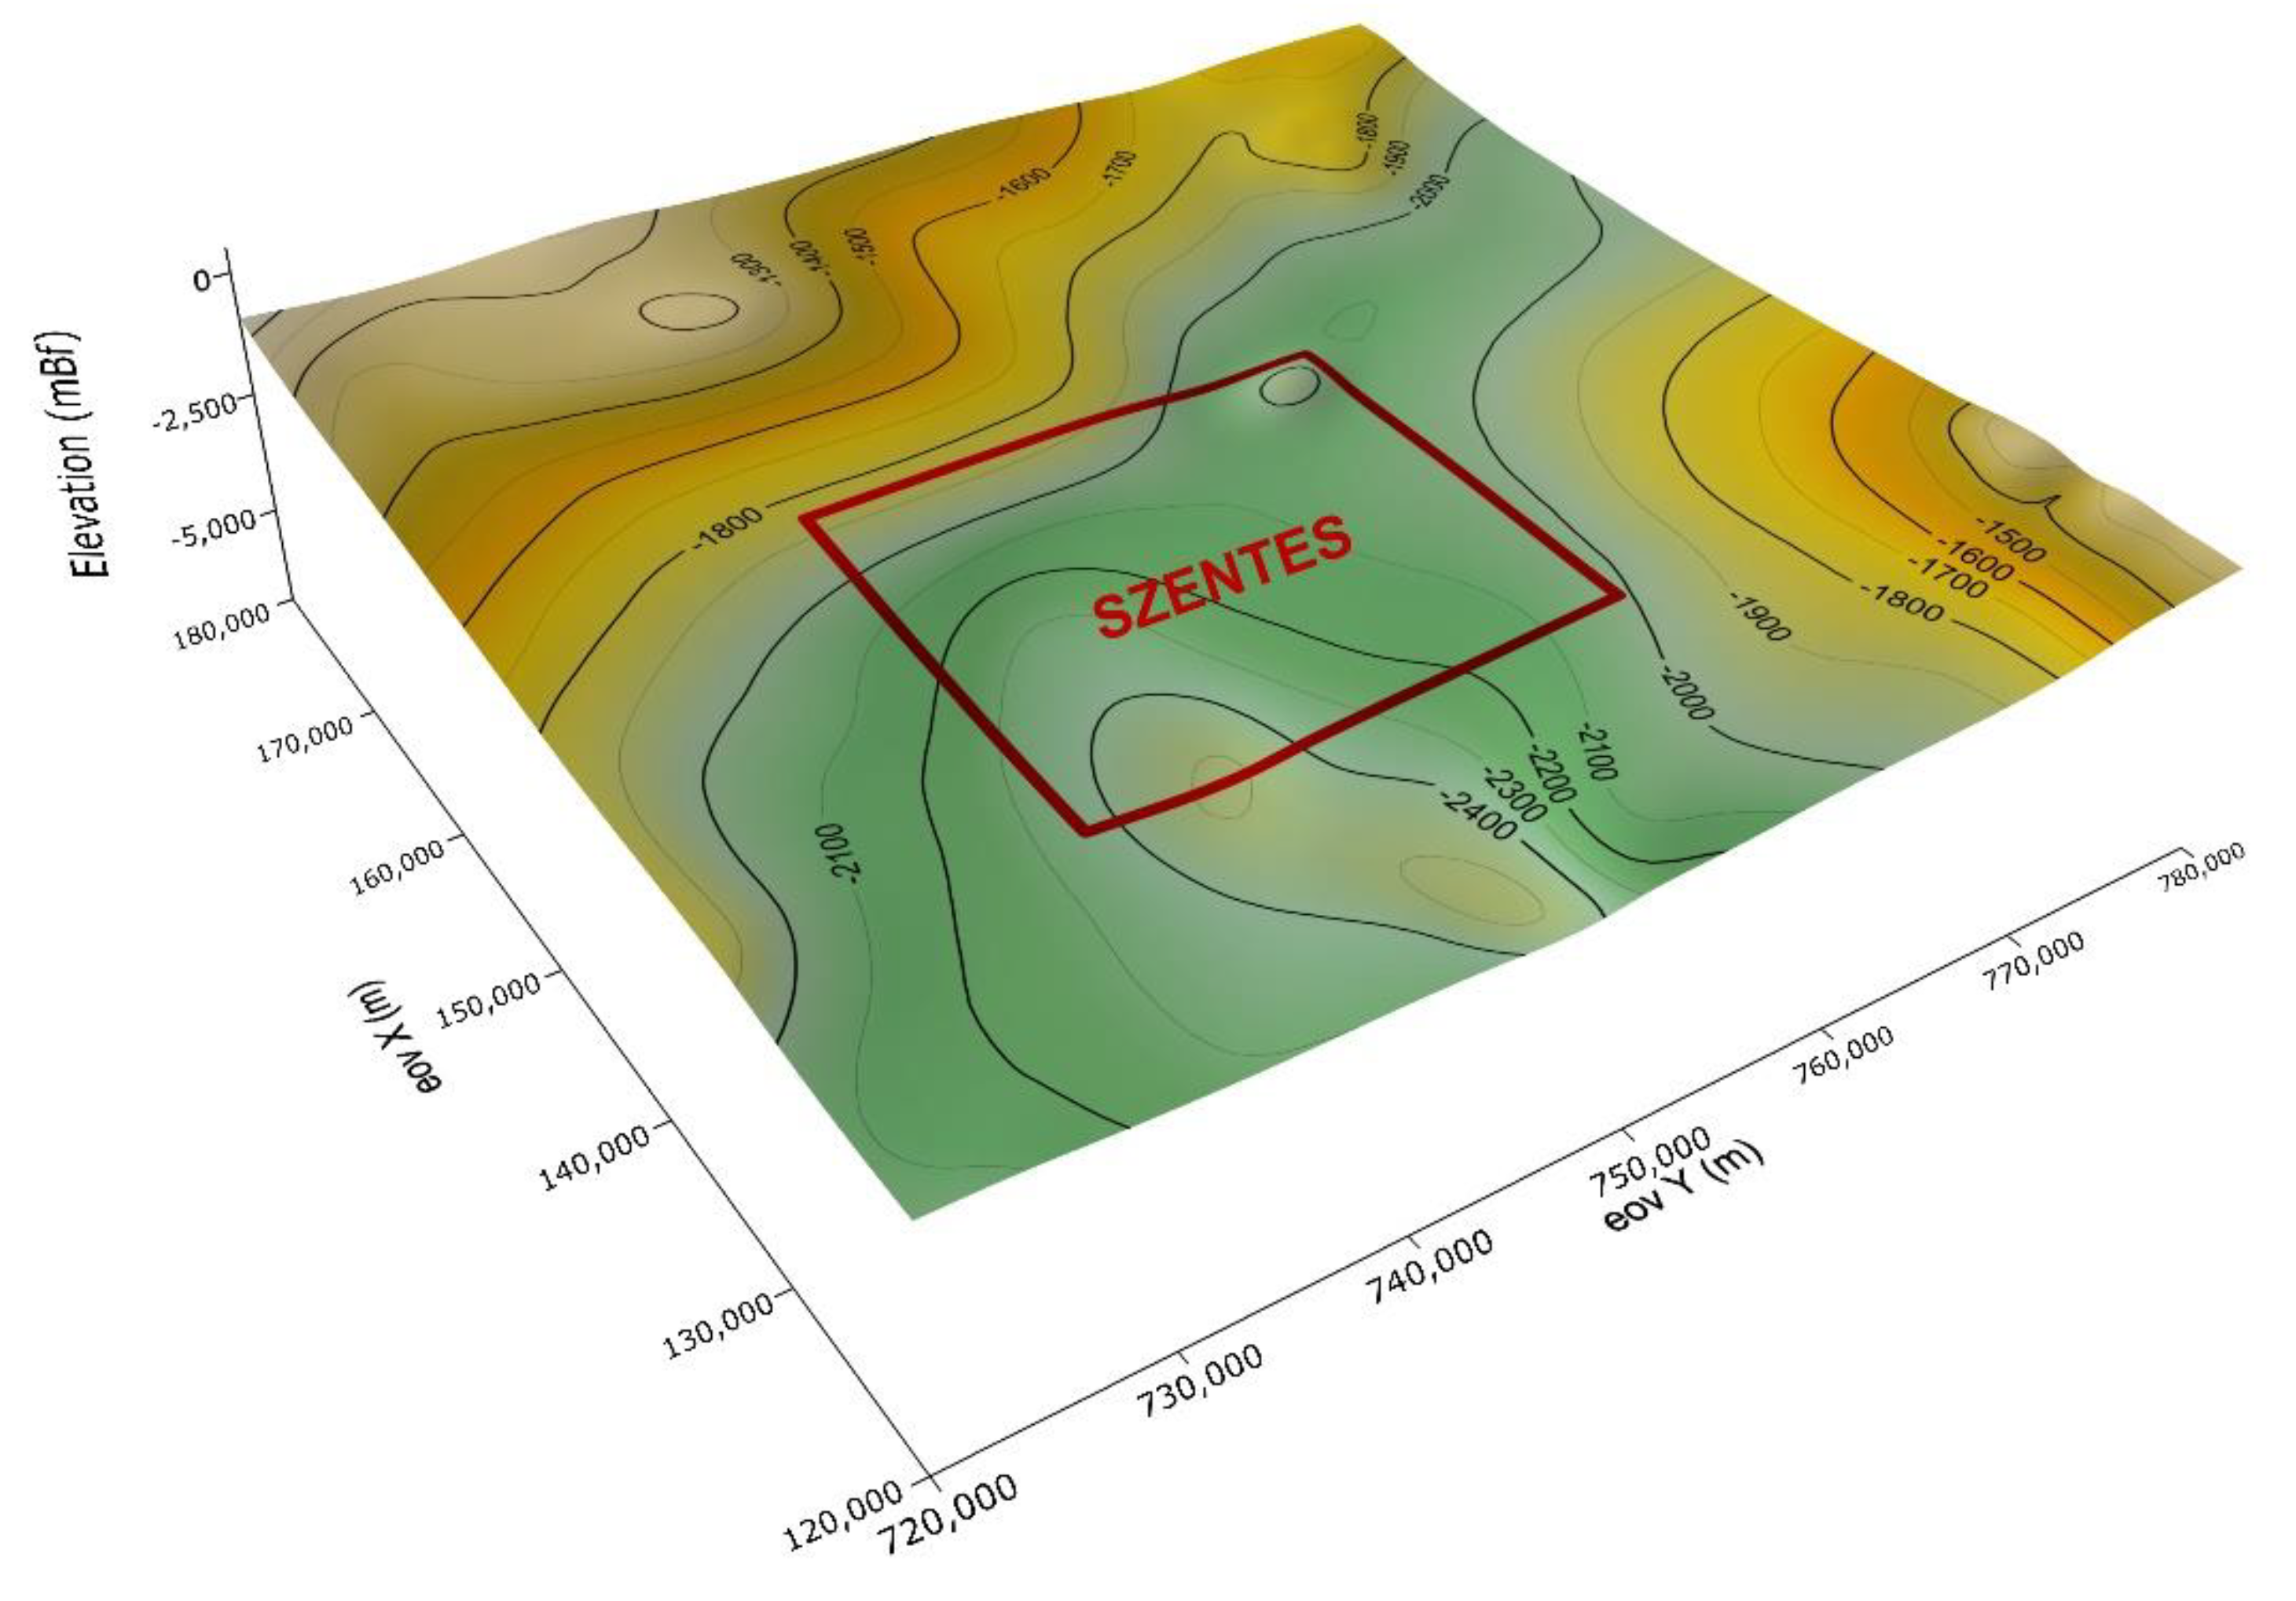
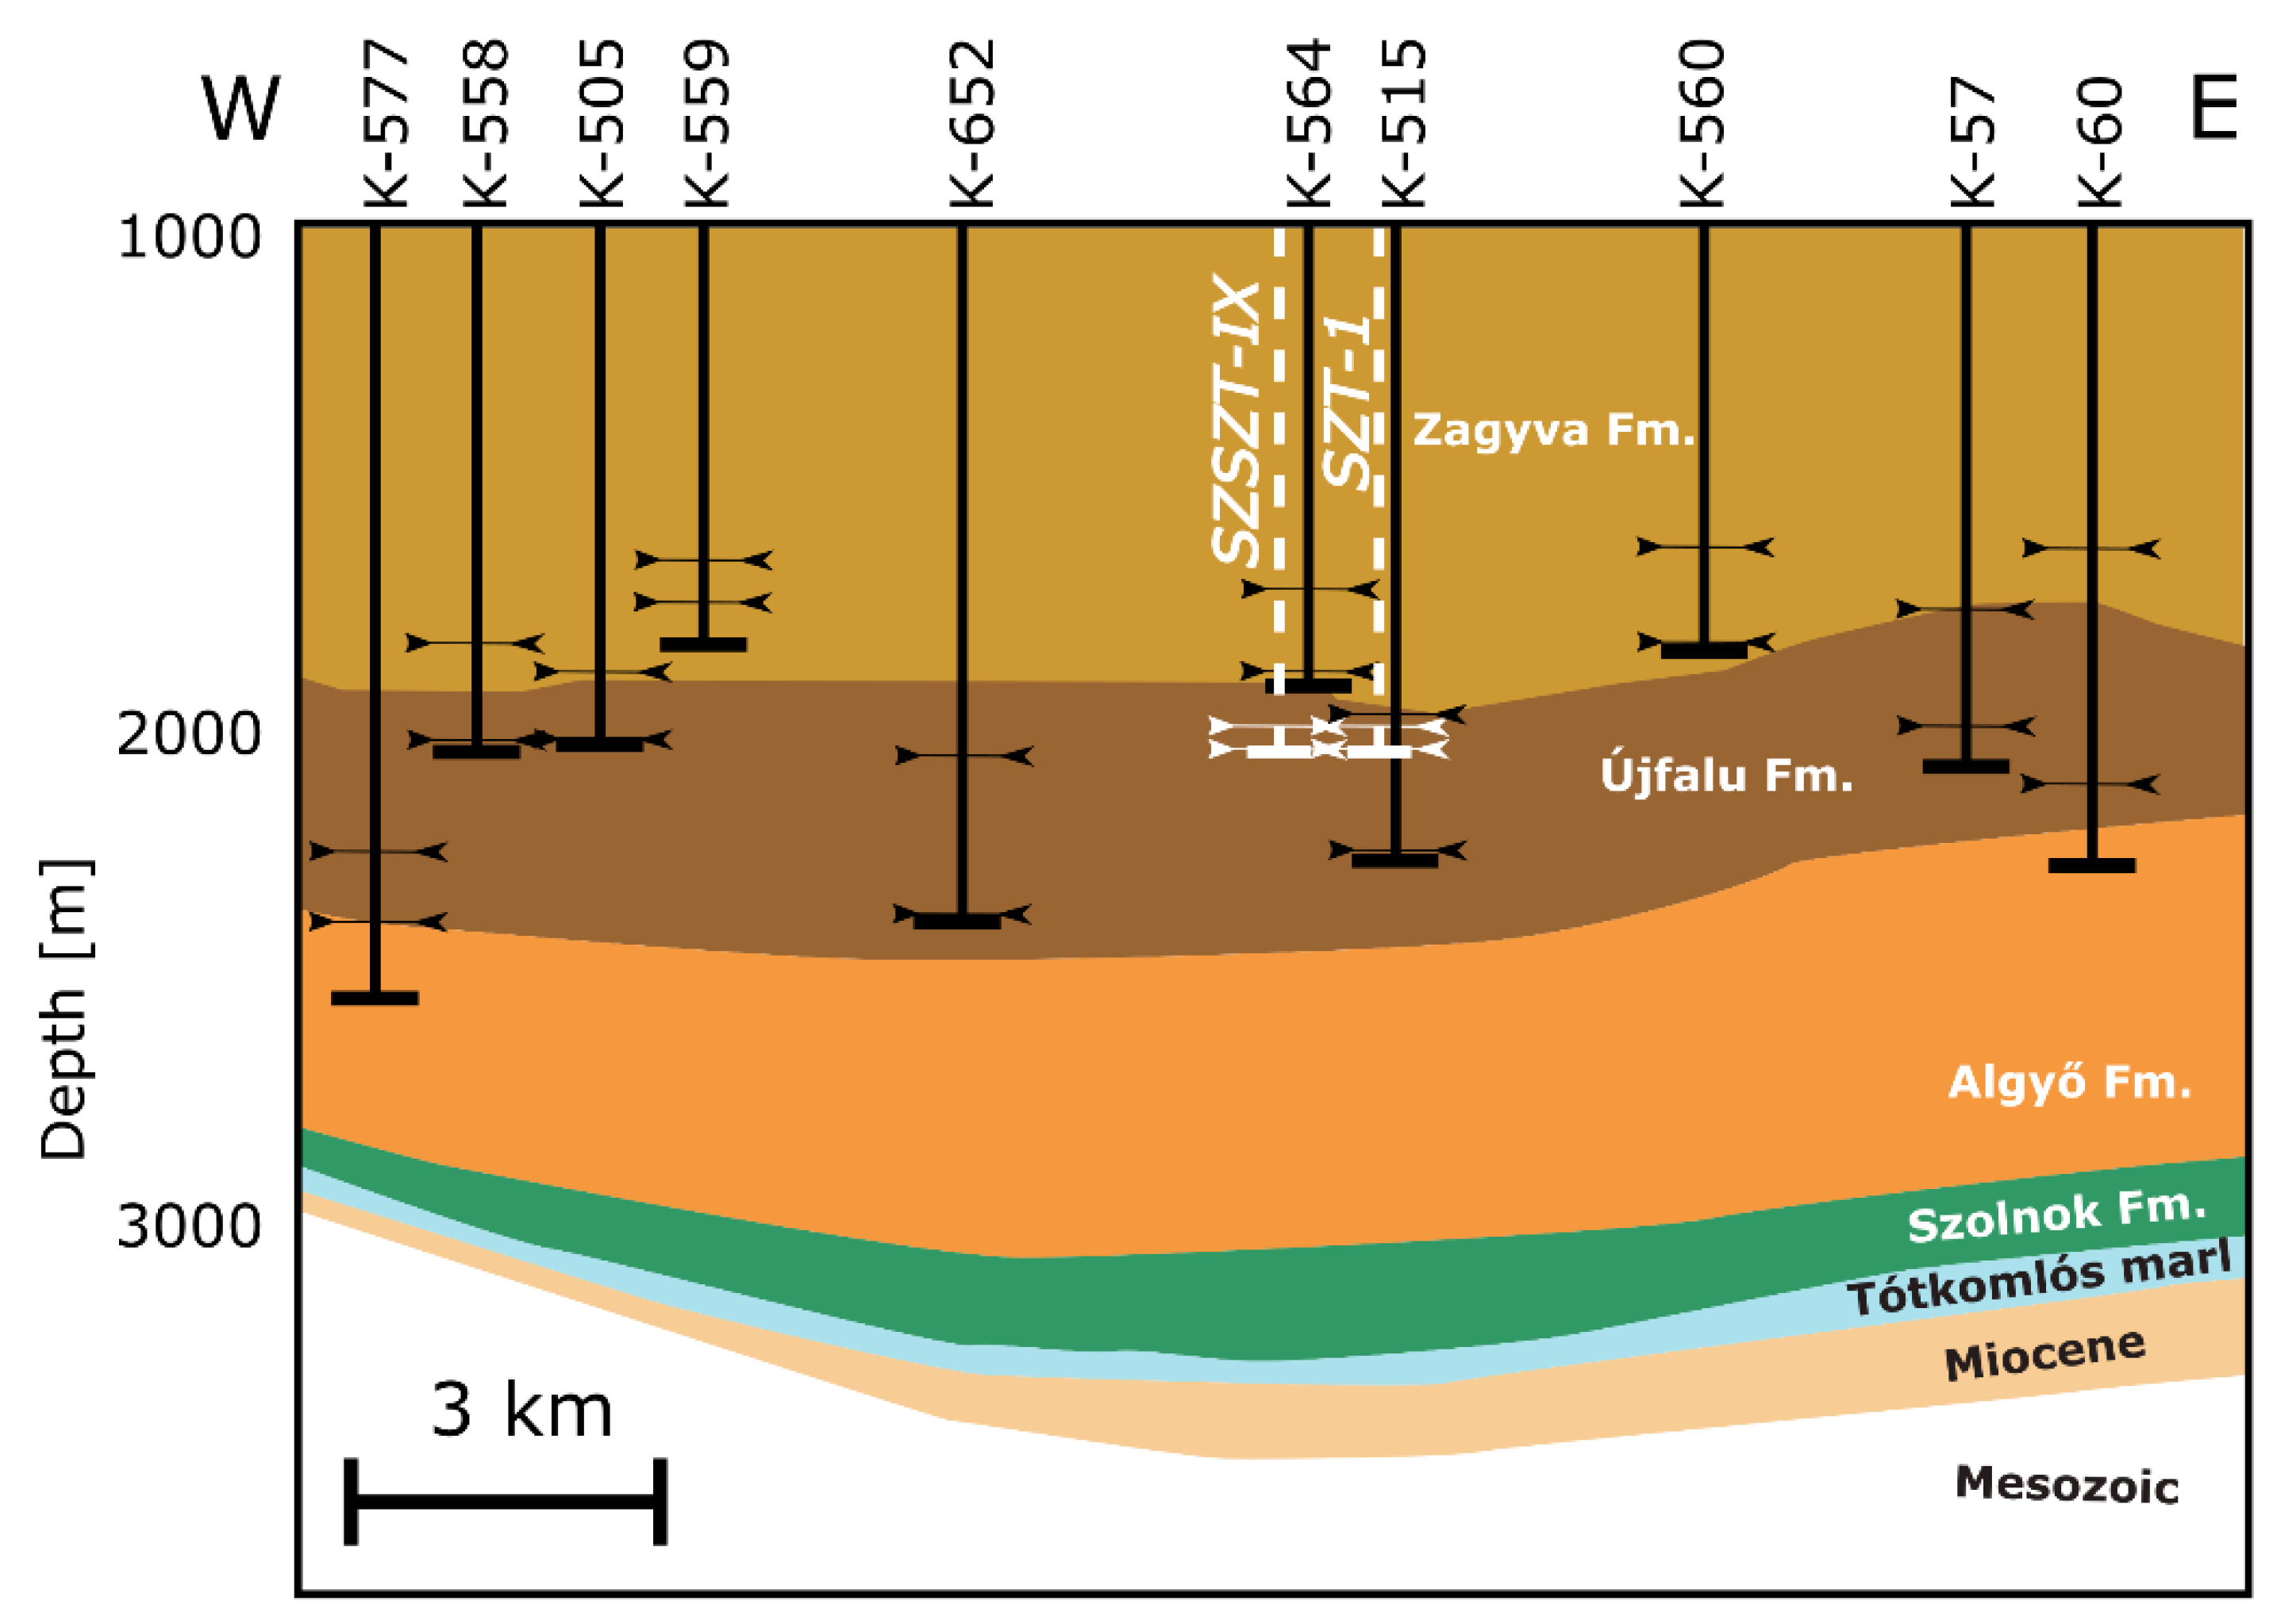
2.2. Geological Setting

The area is part of the northern wedging of Makó Trough, where the depth of the Pre-Neogene basement ranges in depth from 3000 to 5000 m [1,25]. The generalised chrono- and lithostratigraphy of the study area is shown in Figure 2 and the depth map of the basement top is illustrated in Figure 3. Basin subsidence began in the Miocene, with the highest rate in the Pannonian (Late Miocene to Pliocene), resulting in sediment deposition with a thickness of more than 4000 m. Lower Pannonian (LP) sandstone formations, i.e., Endrőd Fm., Szolnok Fm., and Algyő Fm., are characterised by clay–marl and very fine-grained powdered quartz layers. The lower part of the Upper Pannonian (UP) sandstone formations is characterised as sandstone with clay–aleurite streaks or laminae as a result of deposition in delta plain, moor, and smaller bay environments. The upper 300–400 m of these sandstone layers are described as loose, poorly consolidated sandstone. The top of the Pannonian sandstone formations in the study area is between 2000 and 2500 m, where lower elevations are located towards Szegvár, south from Szentes (Figure 4). The UP sandstone layers are covered by Pliocene and Pleistocene sediments (Figure 2). We note that, according to the latest stratigraphic nomenclature, the Zagyva and Újfalu Fms. are referred to as Transdanubian Formation Group, and the Algyő, Szolnok, and Endrőd Fms., as well as Tótkomlós marl, are referred to as Alföld Formation Group [26]. For the sake of clarity, we use the term UP sandstone formation as lithofacies associations of Zagyva and Újfalu Fms. in this paper.
In most of the geothermal wells at the Szentes Geothermal Field, the production intervals are perforated in the Újfalu Fm. (Section 2.3); thus, we focus on this rock formation. The formation is composed of fine and medium sandstone intercalated by thin marl and siltstone layers. Sandstone bodies are of estuary bar, delta branch riverbed filling, and crevasse splay origin. The intercalating layers are associated with oxbow lake environment [25].

2.3. Geothermal Reservoir Characterisation

Based on production history and well test analysis of the 40 active wells in the Szentes Geothermal Field, three aquifer layer groups can be defined [1]. Most of the wells have a completion with production intervals in the Újfalu Fm. A stratigraphic cross-section across the study area with wells and their production intervals is shown in Figure 5. The upper aquifer layer group, level A, consists of wells having a completion with production intervals in the Újfalu and Zagyva Fms. between the depth of 1500 and 1800 m with an average permeability of 1500 mD. The middle aquifer layer group, level B, includes wells with production intervals between the depth of 1800 and 2000 m, mainly in Újfalu and partly in Zagyva Fm. Rock, with an average permeability of 500 mD. The lower aquifer layer group, level C, includes wells below the depth of 2000 m entirely in Újfalu Fm. with an average permeability varying between 1000 and 2000 mD. Thermal water production is dominated by wells screened in level B. A summary of 14 wells including well ID, location coordinates in the Hungarian national projection system (EOV), drilling year, depth, screening, and production rate, as well as bottom-hole temperature, is presented in Table 1.

3. Sample Collection and Experimental Methods

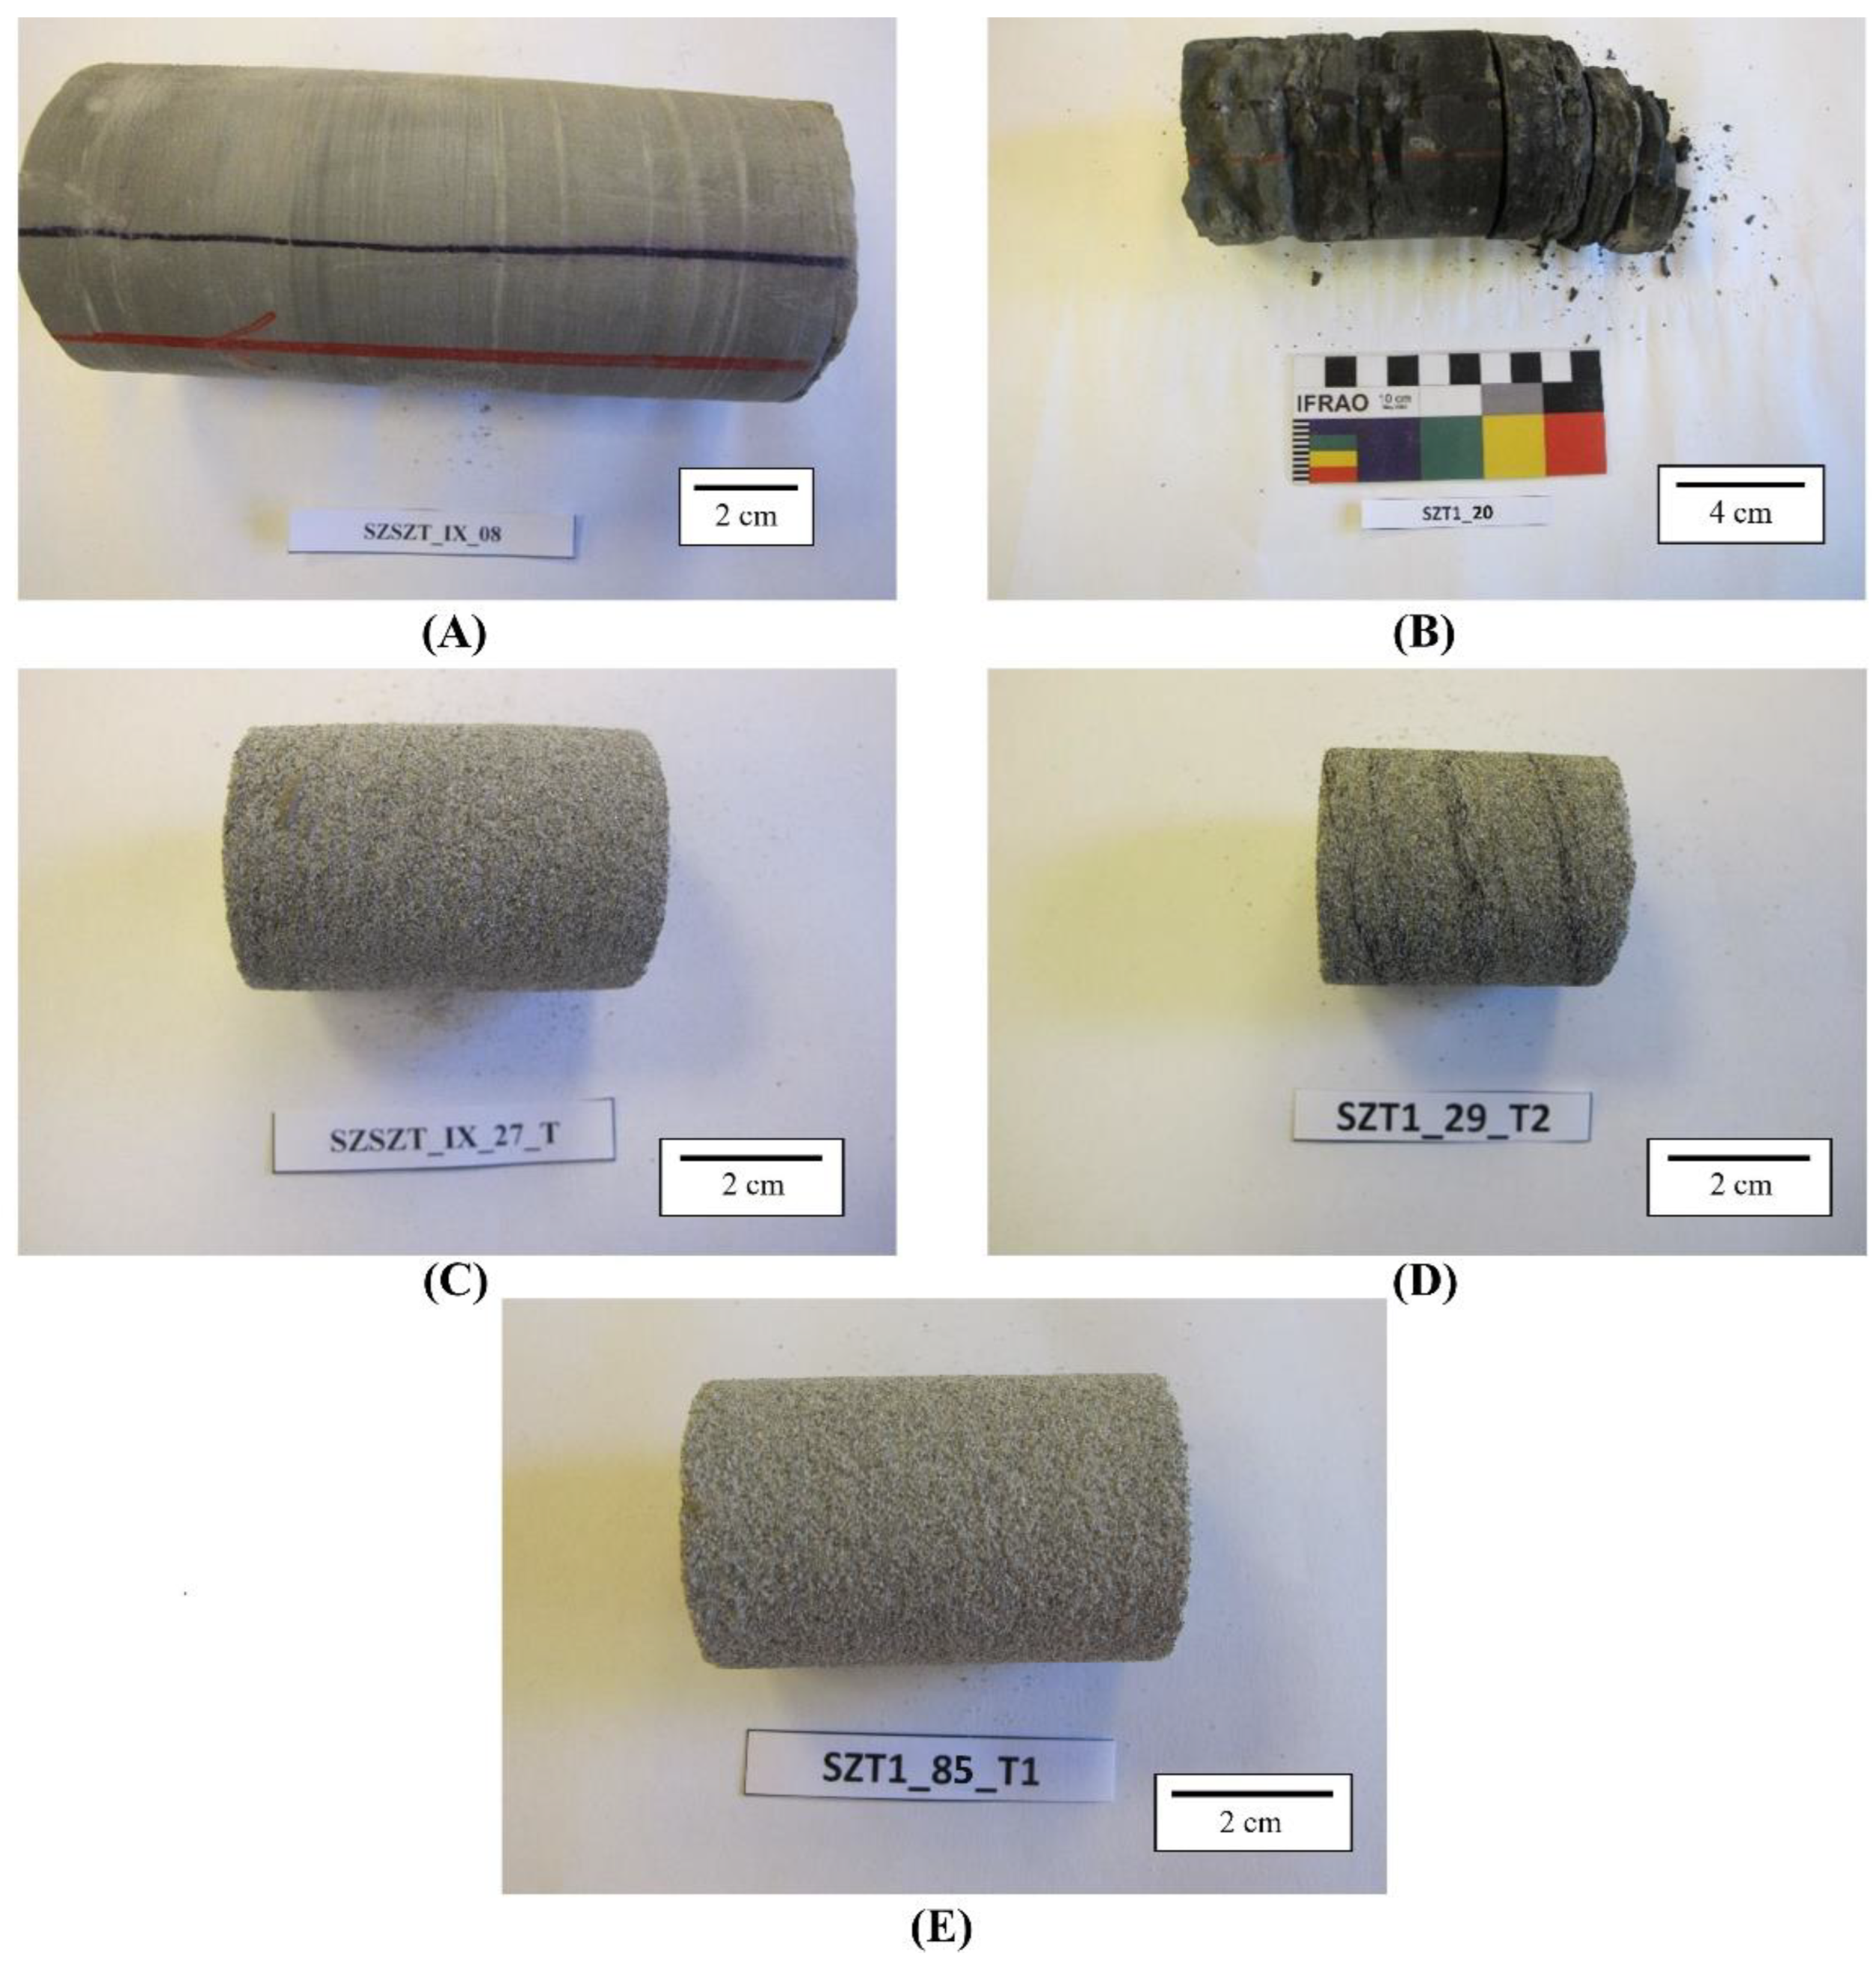
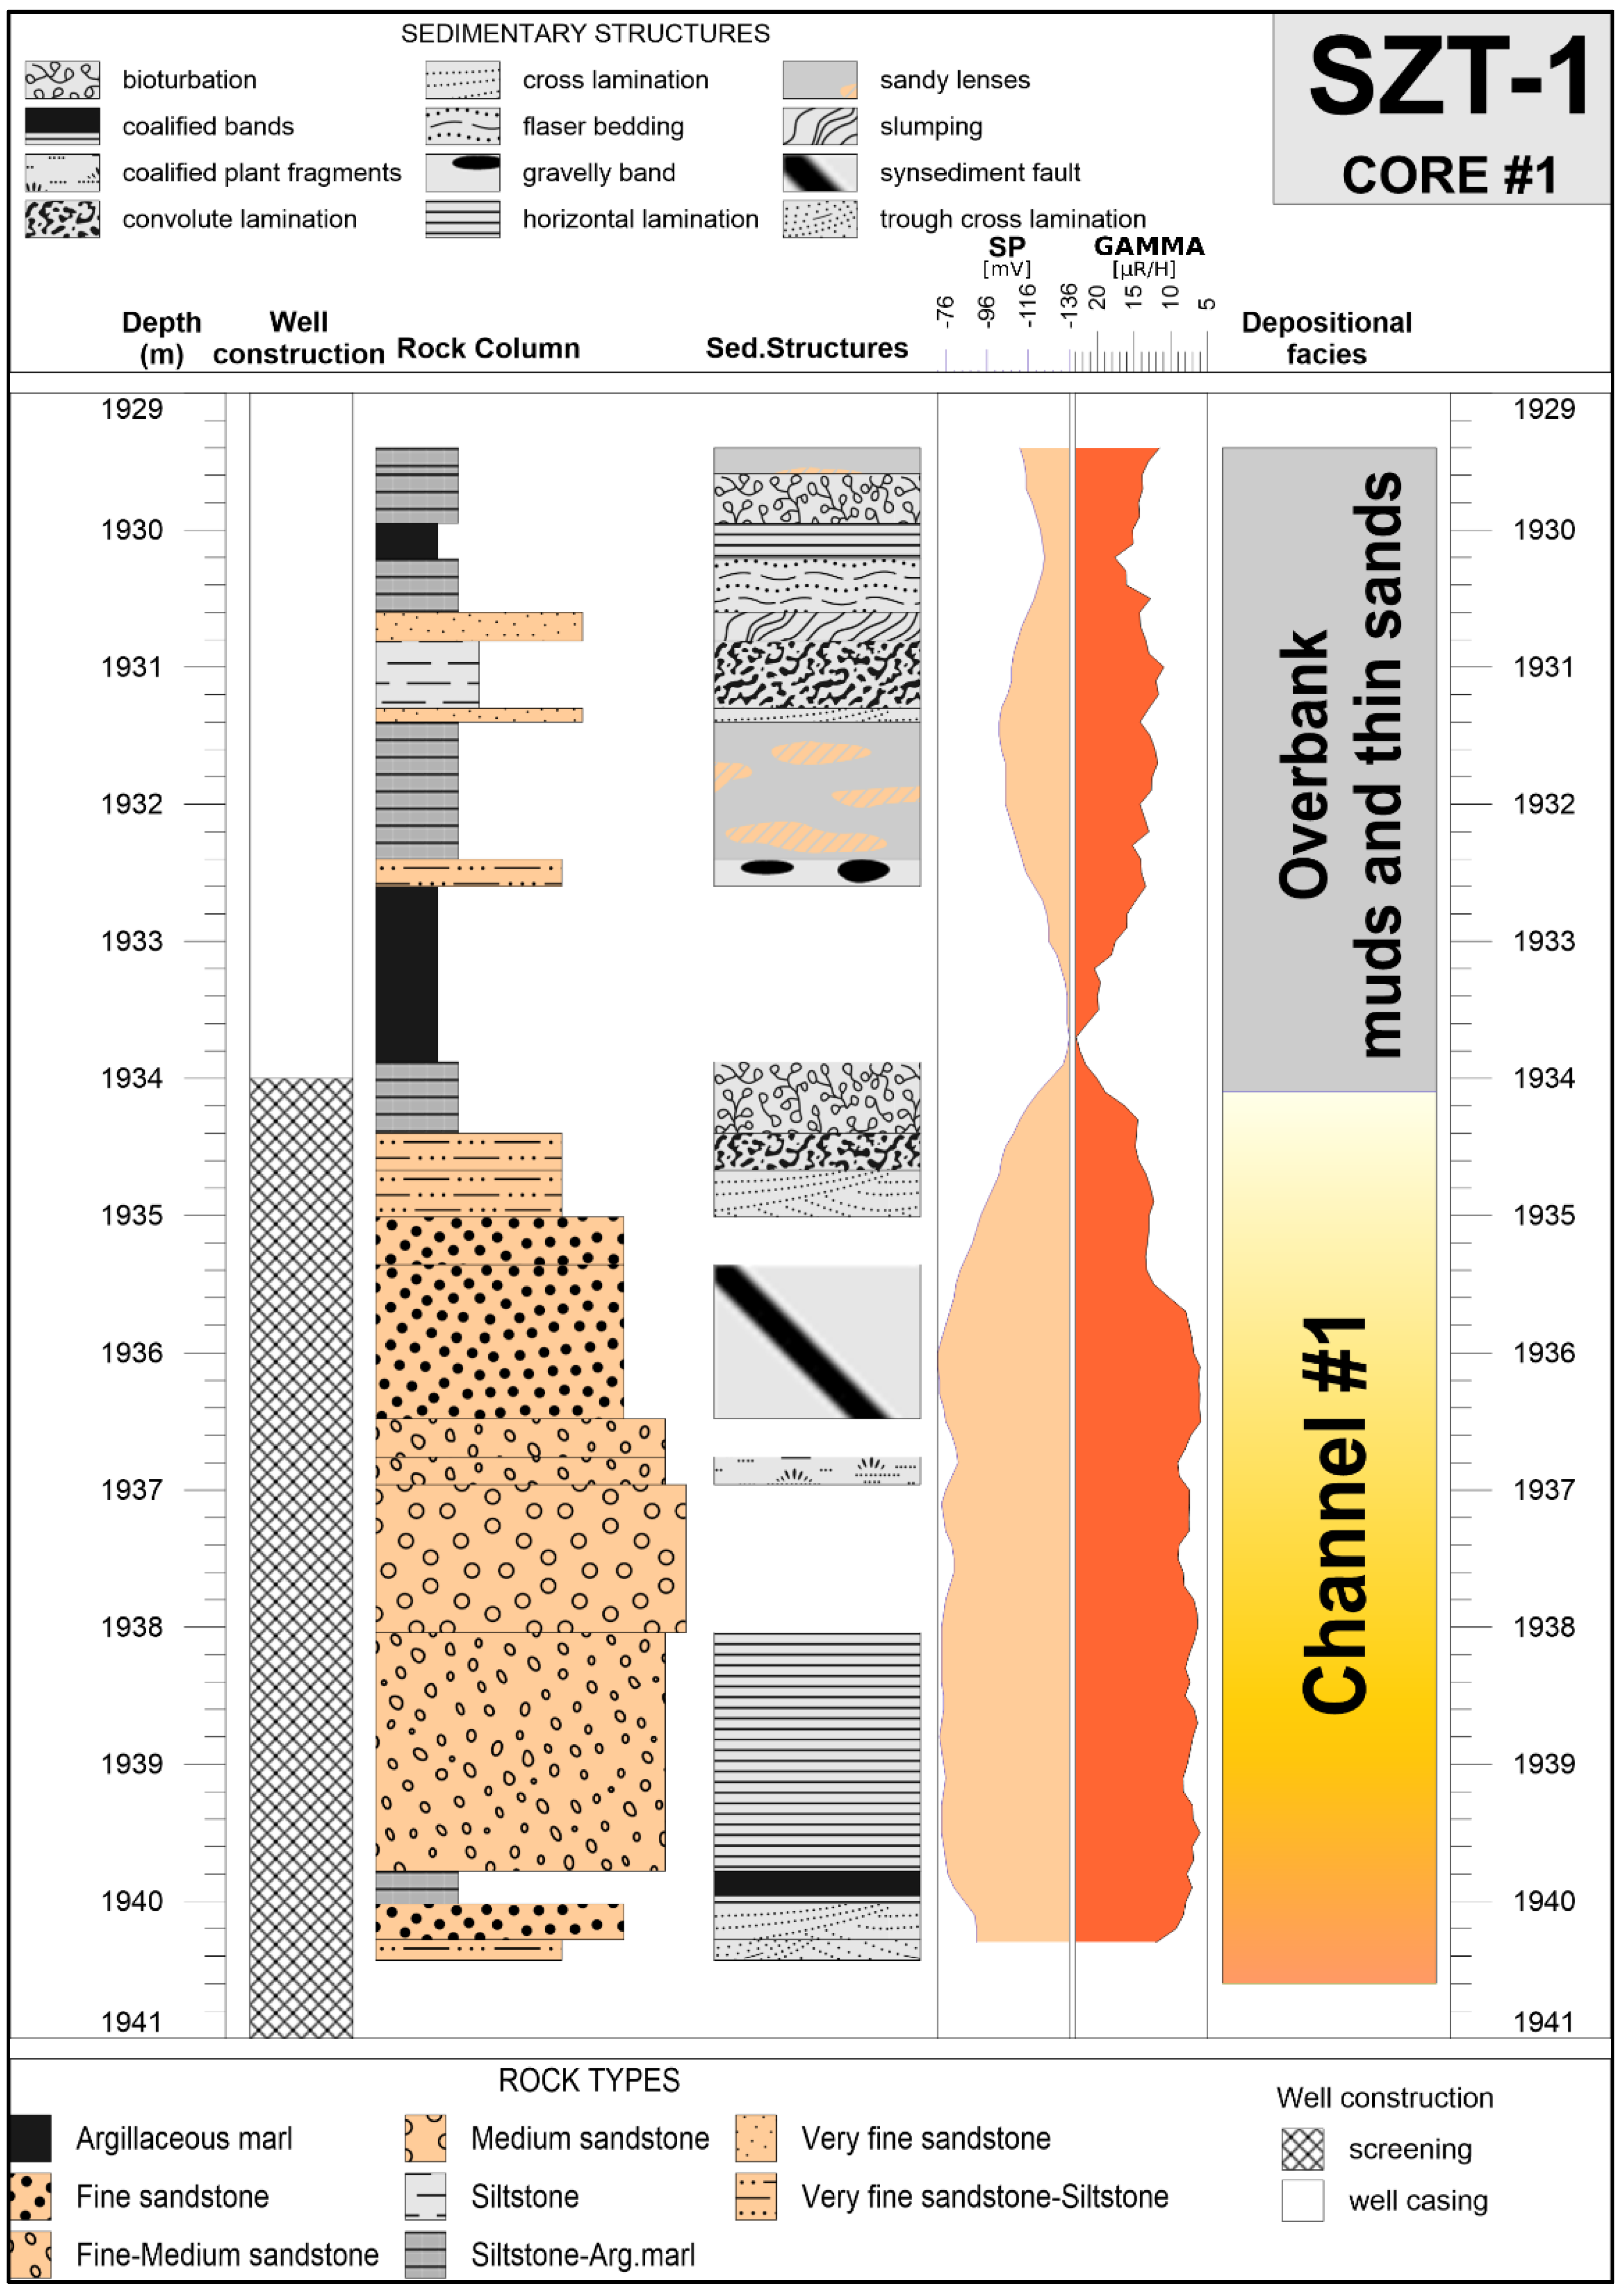
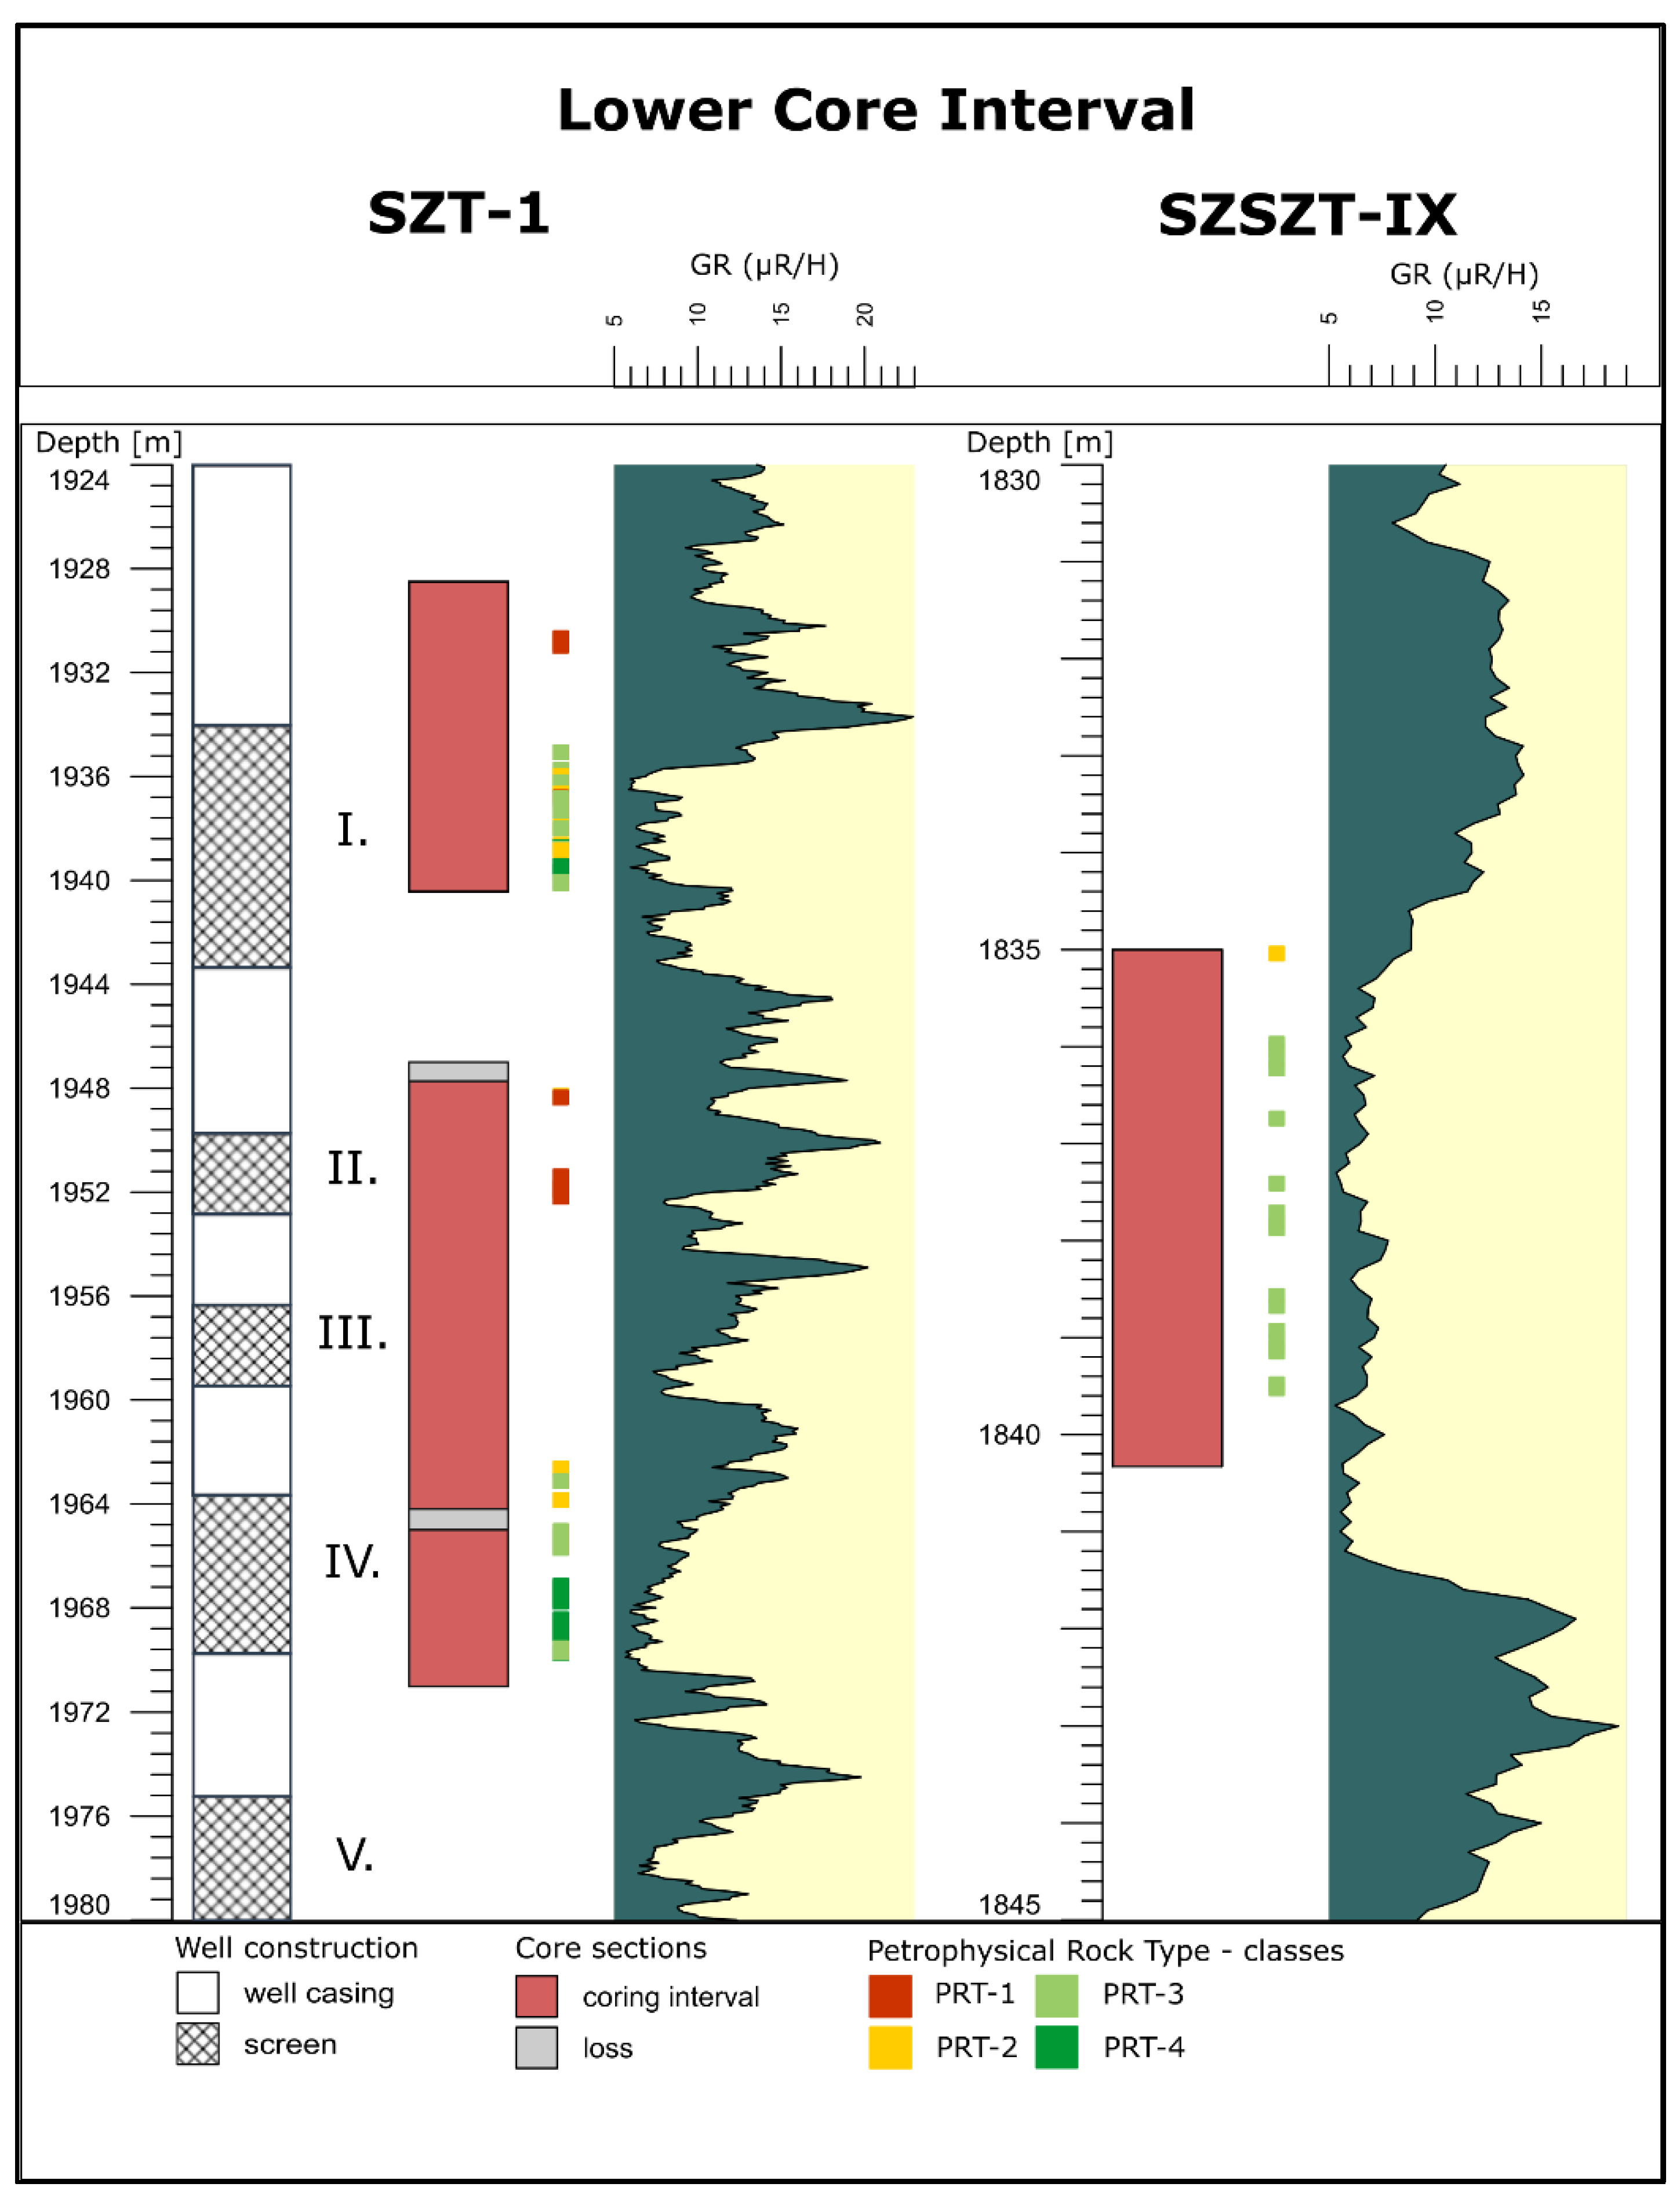
3.1. Core Sample Collection and Description

In the framework of this R&D project, two vertical exploration wells, referred to as “SZT-1” and “SZSZT-IX”, were drilled in Szentes in 2020 to retrieve core samples for laboratory experiments and to conduct a long-term reinjection test at well SZT-1. The coring intervals were determined based on the stratigraphy of the offset wells, K-564 and K-515, and the seismic interpretation of the study area reported by Bereczki et al. 2020 [29]. Cores were collected between approximately 1740 m and 1970 m depth in order to penetrate level B Újfalu sandstone layers approximated from the nearest offset wells, K-564 and K-515. Table 2 summarises the main parameters of the wells. Figure 6 shows that the total length of collected samples is equal to 52.17 m with an average core recovery rate of 85 % from the two boreholes.
After core retrieval and documentation (Figure 6), the logged samples were packed in cling film in order to preserve their moisture content. These were transported in wooden boxes to the laboratory.
Light grey, very fine-fine grained, poorly cemented, micaceous sandstone is the most common rock type in the investigated depth intervals. It is carbonate cemented very well in some places. Very fine-fine grained sandstone usually appears above fine-medium grained and medium-coarse grained sandstone and below very fine grained sandstone, with siltstone forming fining upward sequences. Coarsening upward sandstone sequences also appear in the strata. The sandstones consist of quartz, feldspar, carbonate rock debris, mica, and clay minerals (mainly kaolinite and illite), as well as coalified plant fragments. Siltstone, argillaceous marl, and coaly argillaceous marl appear between the sequences, which is a hint toward a low-energy environment. Based on the depositional environments, several sedimentary structures can be observed in the cores, as shown in Figure 7.
Figure 8 illustrates representative identified depositional facies in well SZT-1 showing typical channel–overbank sequence of a meandering channel based on analysis of sedimentary structures of core samples and the shape of the GR well log. For more details of the stratigraphical model of the Upper Pannonian sandstone sequence in the study area, the reader is referred to [30].

3.2. Sample Preparation

Grain density, porosity, permeability, and ultrasonic wave velocity measurements were carried out on cylindrical rock samples. The plugs were drilled with a diameter of 1.5”, both parallel and perpendicular to the core axis. After the drilling procedure, samples were saw-cut and the end faces of the samples were carefully polished with a grinder machine to reach the desired parallelism in accordance with ASTM and ISRM standards [31,32].
The plugs were dried at a temperature of 60 °C to preserve the chemically bound water in the lattice of clay minerals and then were stored in a desiccator between each measurement. In order to prevent sample contamination, coupling media were not used for ultrasonic velocity measurements.
Grain size distribution measurements, thin section analysis, XRD, and SEM measurements were carried out on the remaining rock slabs of the plug samples. To reduce the charging effect in the case of SEM imaging, the test specimens were coated with gold.

3.3. Laboratory Experiment Methods

First, thin sections of 15 samples from borehole SZSZT-IX were analysed. After that, petrophysical measurements, including grain density, porosity, permeability, and ultrasonic measurements, were performed on the 1.5” plug samples. Grain size distribution was measured on the remaining rock slices after slabbing the plug samples.
Based on the petrophysical data processing results, representative samples of Petrophysical Rock Types (Section “Petrophysical Rock Typing”) were selected according to stratified sampling strategy [33] for further petrographic analysis, including SEM and XRD, to investigate textural features.
The applied methods are presented based on their nature in subsequent Section 3.3.1 and Section 3.3.2.

3.3.1. Petrographical Characterisation

The thin sections of the samples were analysed with a Carl Zeiss polarized light microscope using plane-polarized and cross-polarized light. These were evaluated based on grain size, sorting, roundness, and mineral composition.
Grain size distribution was measured by laser diffraction method using Cilas 1180 device. The filter cake was carefully removed from the core surfaces. The samples were disaggregated using distilled water. Prior to measurement, each sample was ultrasonicated for 180 s under stirring conditions and also during the measurement in order to ensure sample dispersion. This measurement was performed at least 3 times on a sample.
The XRD patterns on the sandstone samples were collected using Cu-Kα radiation (40 kV, 15 mA) with a Rigaku MiniFlex 600 (Rigaku, Tokyo, Japan). Scans were made at room temperature from 5 to 70° 2θ, with a step of 0.02/s. XRD scans were evaluated for quantitative phase composition using a full profile fit procedure. The total amount of identified (crystalline) phases is taken as 100%. Due to the unknown proportion of amorphous components, the phase percentages reflect only relative abundances. The measurement uncertainties are ±1%, due to the precise sample preparation and measurement.
SEM imaging was conducted with a Jeol JSM-IT500HR (Jeol, Tokyo, Japan) instrument. Measurements were performed in a high vacuum chamber with a beam voltage of 5.0 kV.

3.3.2. Petrophysical Experiments

Grain Density

Matrix volume was measured by a Quantachrome Pentapyc 5200e (PPY-30T) instrument. This test follows the principle of the Boyle–Mariotte Law. A known amount of He flows through on a given pressure from the reference cell with VR volume to the sample chamber. The volume of the sample chamber (VC) is determined by calibration of the instrument with stainless steel reference spheres at a given temperature before the measurement. Seven measurements were carried out on each sample but the average grain volume was calculated from the last five values. Measurements were performed in a tempered thermostat at a constant temperature of 25 °C. For grain density calculation, the weight of the sample was measured by an analytical balance with 0.1 mg accuracy. The bulk volume and porosity of the plugs were calculated from geometrical data of 3D scanning.

Porosity and Permeability

He gas porosity and permeability under reservoir pressure conditions were measured by Vinci Technologies COREVAL-700 gas permeameter. The plug samples were measured after He pycnometry. The plugs were held in an isostatic core holder during the tests. The applied confining pressure was 210 bar for each sample at lab temperature. The method used for determining porosity in this case is called “Boyle’s Law Single Cell Method for direct void volume measurement” [34]. He gas permeability was based on “Transient pressure technique for gases: Pressure-Falloff, Axial Gas Flow measurements” [34]. This technique has a useful permeability range of 0.001 to 5000 mD. The measured gas permeability was corrected for the Klinkenberg effect to obtain water permeability.
We note that several historical permeability data for similar formation sandstone rock are available in [35,36]. However, these present only a compilation of datasets instead of original experimental data. For more details on these data, we refer to Willems et al. [20].

Ultrasonic Velocity

The ultrasonic velocity of compressional and shear waves was measured by SRL A1000 instruments using a pulse-transmission technique [31,32]. In this case, two transducers were placed on the end faces of the samples. The frequency of the transducers used for measurements was centered around 1 MHz, both for compressional and shear waves. Travel times for velocity data were determined with „first-break” record using a modified Akaike Information Criterion algorithm [37].

Experimental Setup for Porosity, Permeability, and Ultrasonic Velocity Measurements

Samples were put into a high-pressure isostatic core holder for porosity, permeability, and ultrasonic velocity measurements to mimic in situ reservoir pressure conditions. The applied pressure was calculated using the equation for linear poroelasticity [38]:
P e f f = S L α P p
where Peff is the effective pressure, SL is the uniform lithostatic stress, α is Biot’s coefficent, and Pp is pore pressure. Since α is not known for UP sandstone formation, α is estimated to be equal to 1 as a conservative approximation for drained deformation condition. All respective laboratory tests were conducted at SL = 210 bar based on the calculated weight of the overburden acting on the cored sections of the wells. Since the depth difference between the deepest and shallowest cored interval is approx. 230 m, the stress difference arising from depth difference is negligible.

3.3.3. Data Processing

Petrophysical Rock Typing

Rock typing can be defined as dividing the reservoir into distinct units with characteristic petrophysical and flow characteristics [39]. Core-based Petrophysical Rock Typing methods can be classified into three separate categories:
  • Methods that utilise permeability–porosity relationship and connate water saturation to some extent, excluding the so-called cut-off based methods [40];
  • Methods that are based on capillary pressure data (or J-function) and measured R35, e.g., Winland’s R35 method, where R35 is the calculated pore-throat radius at 35% mercury saturation from a mercury-injection capillary pressure test [41];
  • Methods that rely on formation zone index (FZI), which is a modification of Kozeny–Carman equation, and its derivates, e.g., the spontaneous imbibition rate-driven method of FZI [42].
According to [41,42,43], the most widely used PRT methods for the classification of clastic reservoirs are Winland’s R35 method [44] and FZI-based techniques [45]. The FZI method has the advantage over the other two methods in that it allows the correlation between the micro-scale attributes and macro-scale parameters, i.e., porosity and permeability, based on the theoretical model. On the other hand, further approaches, such as Winland’s R35 method, are based on empirical relationships. Since connate water saturation is unknown and no mercury intrusion porosimetry was conducted on all of the samples, we apply the FZI-based PRT technique.
According to Amaefule et al. [45], FZI-technique, Petrophysical Rock Typing (PRT) is based on grouping samples by FZI values that describe both the storage capacity (porosity) and fluid flow capacity (permeability) of the reservoir rock. This approach entails the clustering of different lithofacies of similar internal textural grain–pore compositions and petrophysical properties [46].
FZI is calculated from Reservoir Quality Index (RQI) in µ m and normalized porosity (φZ) using the formulas below [47]:
FZI = RQI φ Z
RQI = 0.0314 k φ e
φ Z = φ e 1 φ e
where
  • φ e —effective fractional porosity is the ratio between pore volume and grain volume
  • k—permeability in mD

Statistical Methods

In order to reduce non-normality of the dataset, permeability and grain size data were transformed to a logarithmic scale. In the case of He permeability, a base ten logarithm of the values was used. Grain size data were transformed to phi scale as proposed by Krumbein with the following formula [48]:
φ = l o g 2 d g
where dg is grain diameter in mm unit.
In order to test the normality of the variables, Shapiro–Wilk tests were performed.
A Kruskal–Wallis non-parametric hypothesis test was used to investigate statistical differences between samples according to the horizontal and vertical orientation. The null hypothesis of the test is that the mean ranks of the groups are the same [49].
Petrophysical Rock Typing is based on clustering samples into groups based on their FZI values. In order to find these, mixture analysis was performed which estimates the parameters of at least two normal distributions by maximum likelihood approach in PAST software. The FZI values are divided into classes with normal distribution as a result of the non-hierarchical clustering method [50]. The optimal number of Petrophysical Rock Types was determined by Akaike Information Criterion [51]. A minimum value of AIC indicates the number of groups that produces the best fit without overfitting [50].
For statistical data analysis, IBM SPSS Statistics 29 [52] and PAST 4 data package [50] were used. For each identified PRT group, descriptive statistical parameters were calculated.
We note that the descriptive statistical properties of petrophysical parameters as well as textural petrographic properties, i.e., grain density, grain diameter, clay, and silt, as well as sand content, are discussed jointly in Section 4.2.

4. Results and Discussion

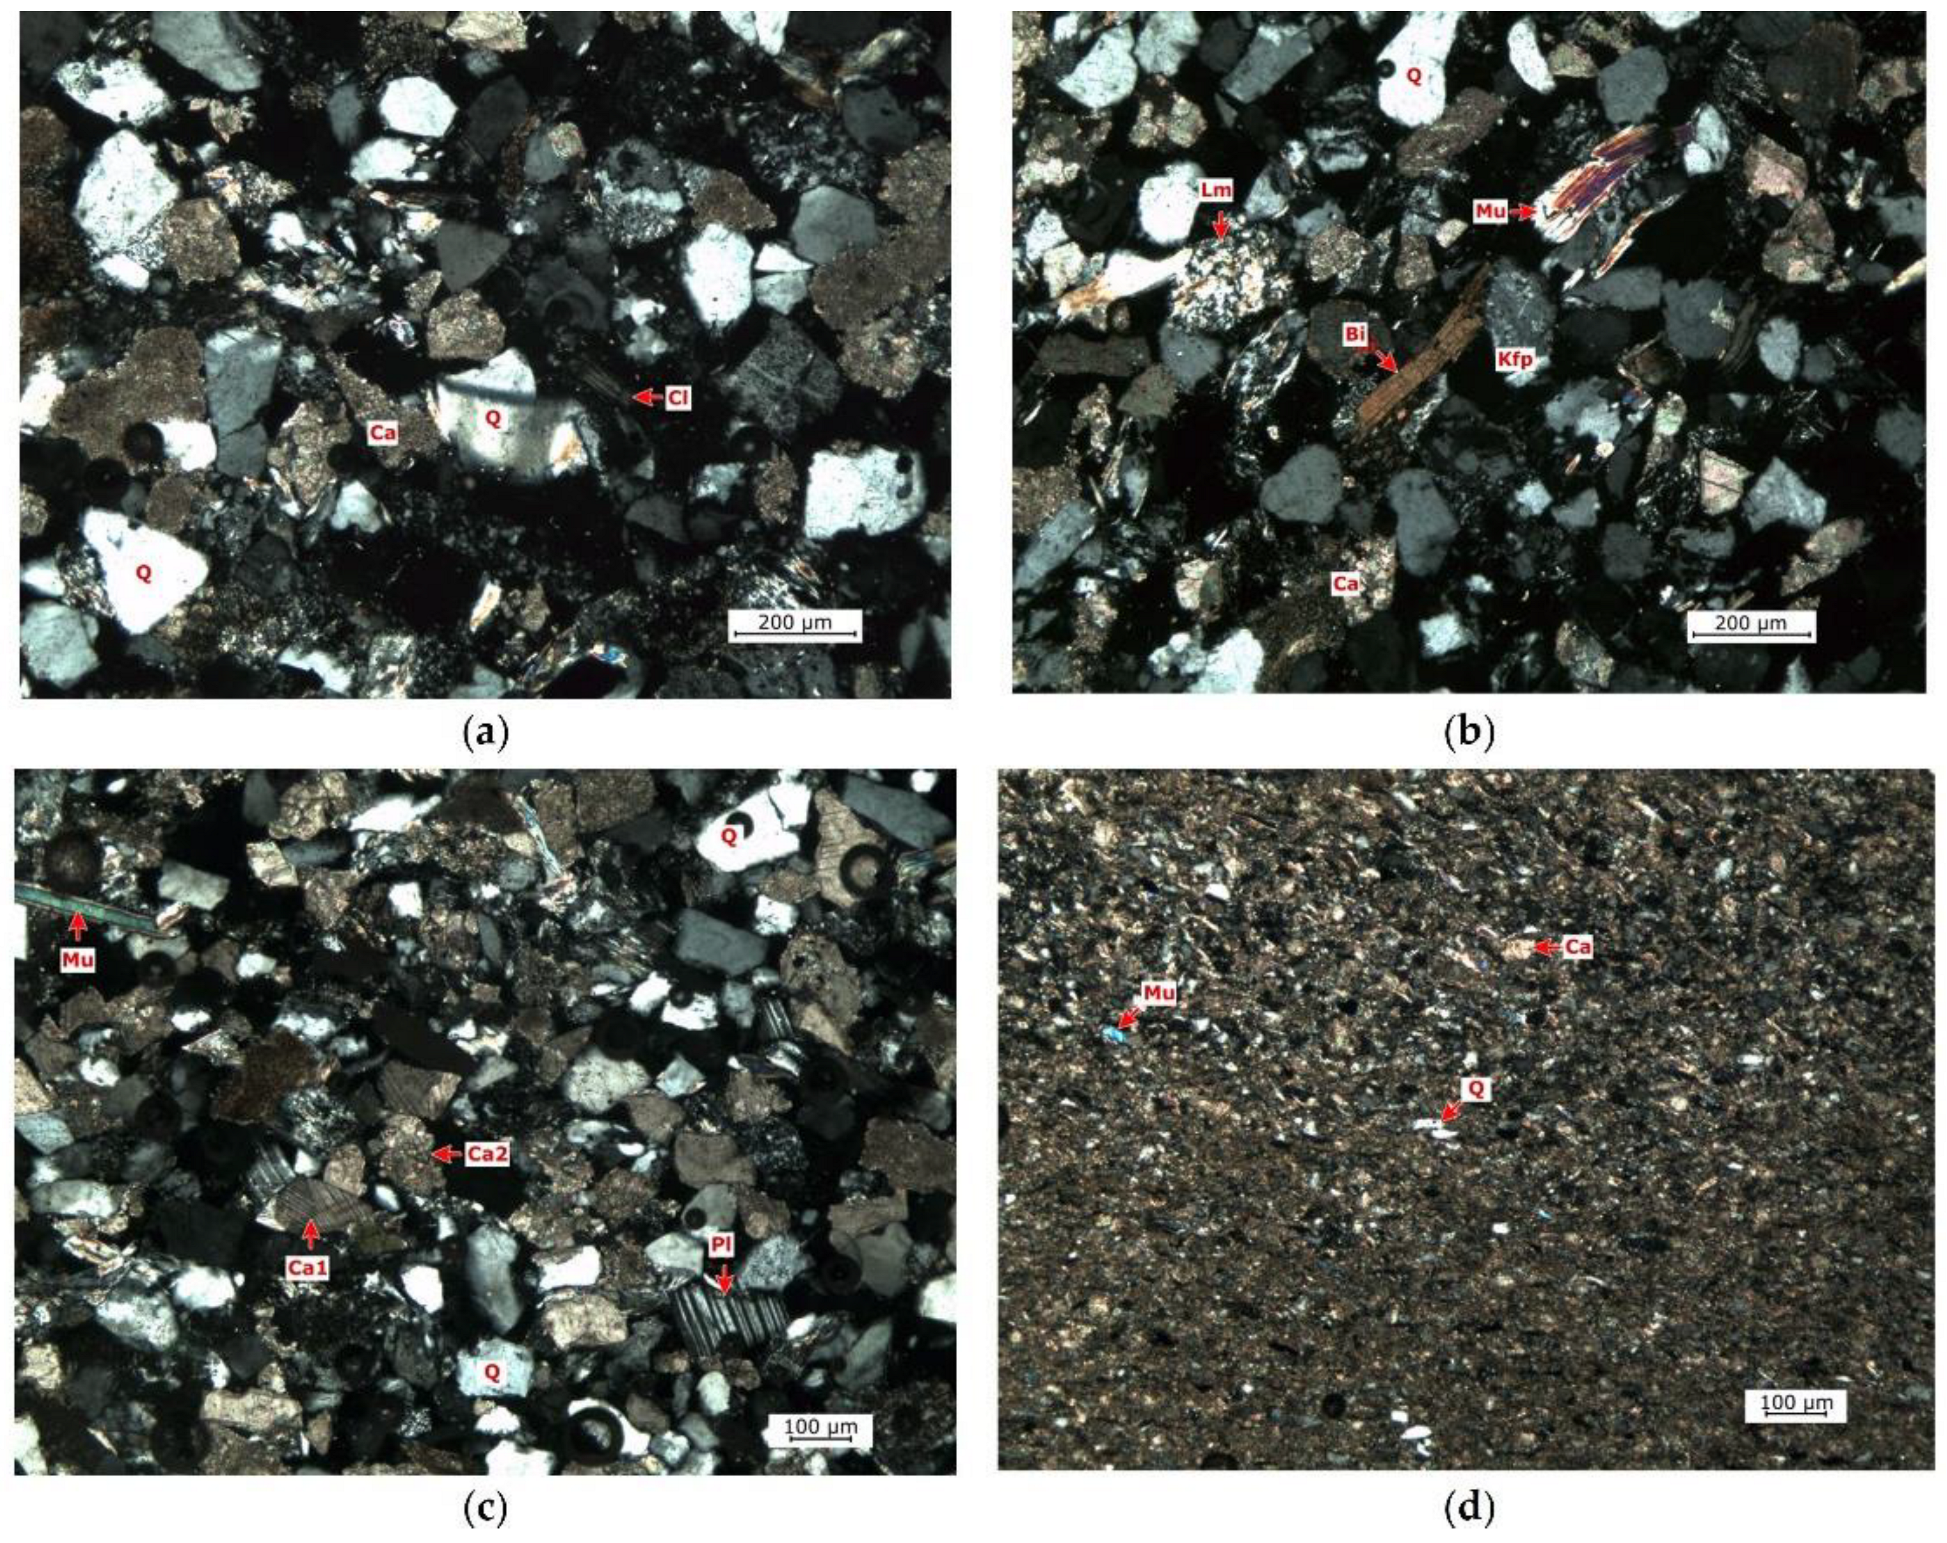
4.1. Pre-Petrophysical Thin Section Analysis

The thin section analysis reveals that the grey-light grey sandstones are characterised by well to very well-sorted grains (Figure 9). The grain size ranges from very fine to medium, but dominantly fine, and the grains are subangular to very angular, with low sphericity in morphology. It mainly consists of quartz, feldspar (K-feldspar, plagioclase), mica (muscovite, chloritized biotite), and carbonates with minor grenades and opaque minerals (coalified plant fragments, hematite), as well as zircon, apatite staurolite, and tourmaline as accessory (Figure 9). The sandstones are mainly poorly cemented by carbonates (calcite, dolomite) and clay minerals (sericite, montmorillonite, kaolinite, and illite). The micritic calcite cement occurs only in patches and narrow bands. Weak textural orientation is observed which is reflected by the presence of oriented mica plates.
The dark grey argillaceous marl and siltstone appear as massive units and as alternations of marl and siltstone laminae. In fine grained marls and siltstones, the amount of mica is significant. The darkish colour is the result of an increased amount of coaly plant fragments and clay minerals.

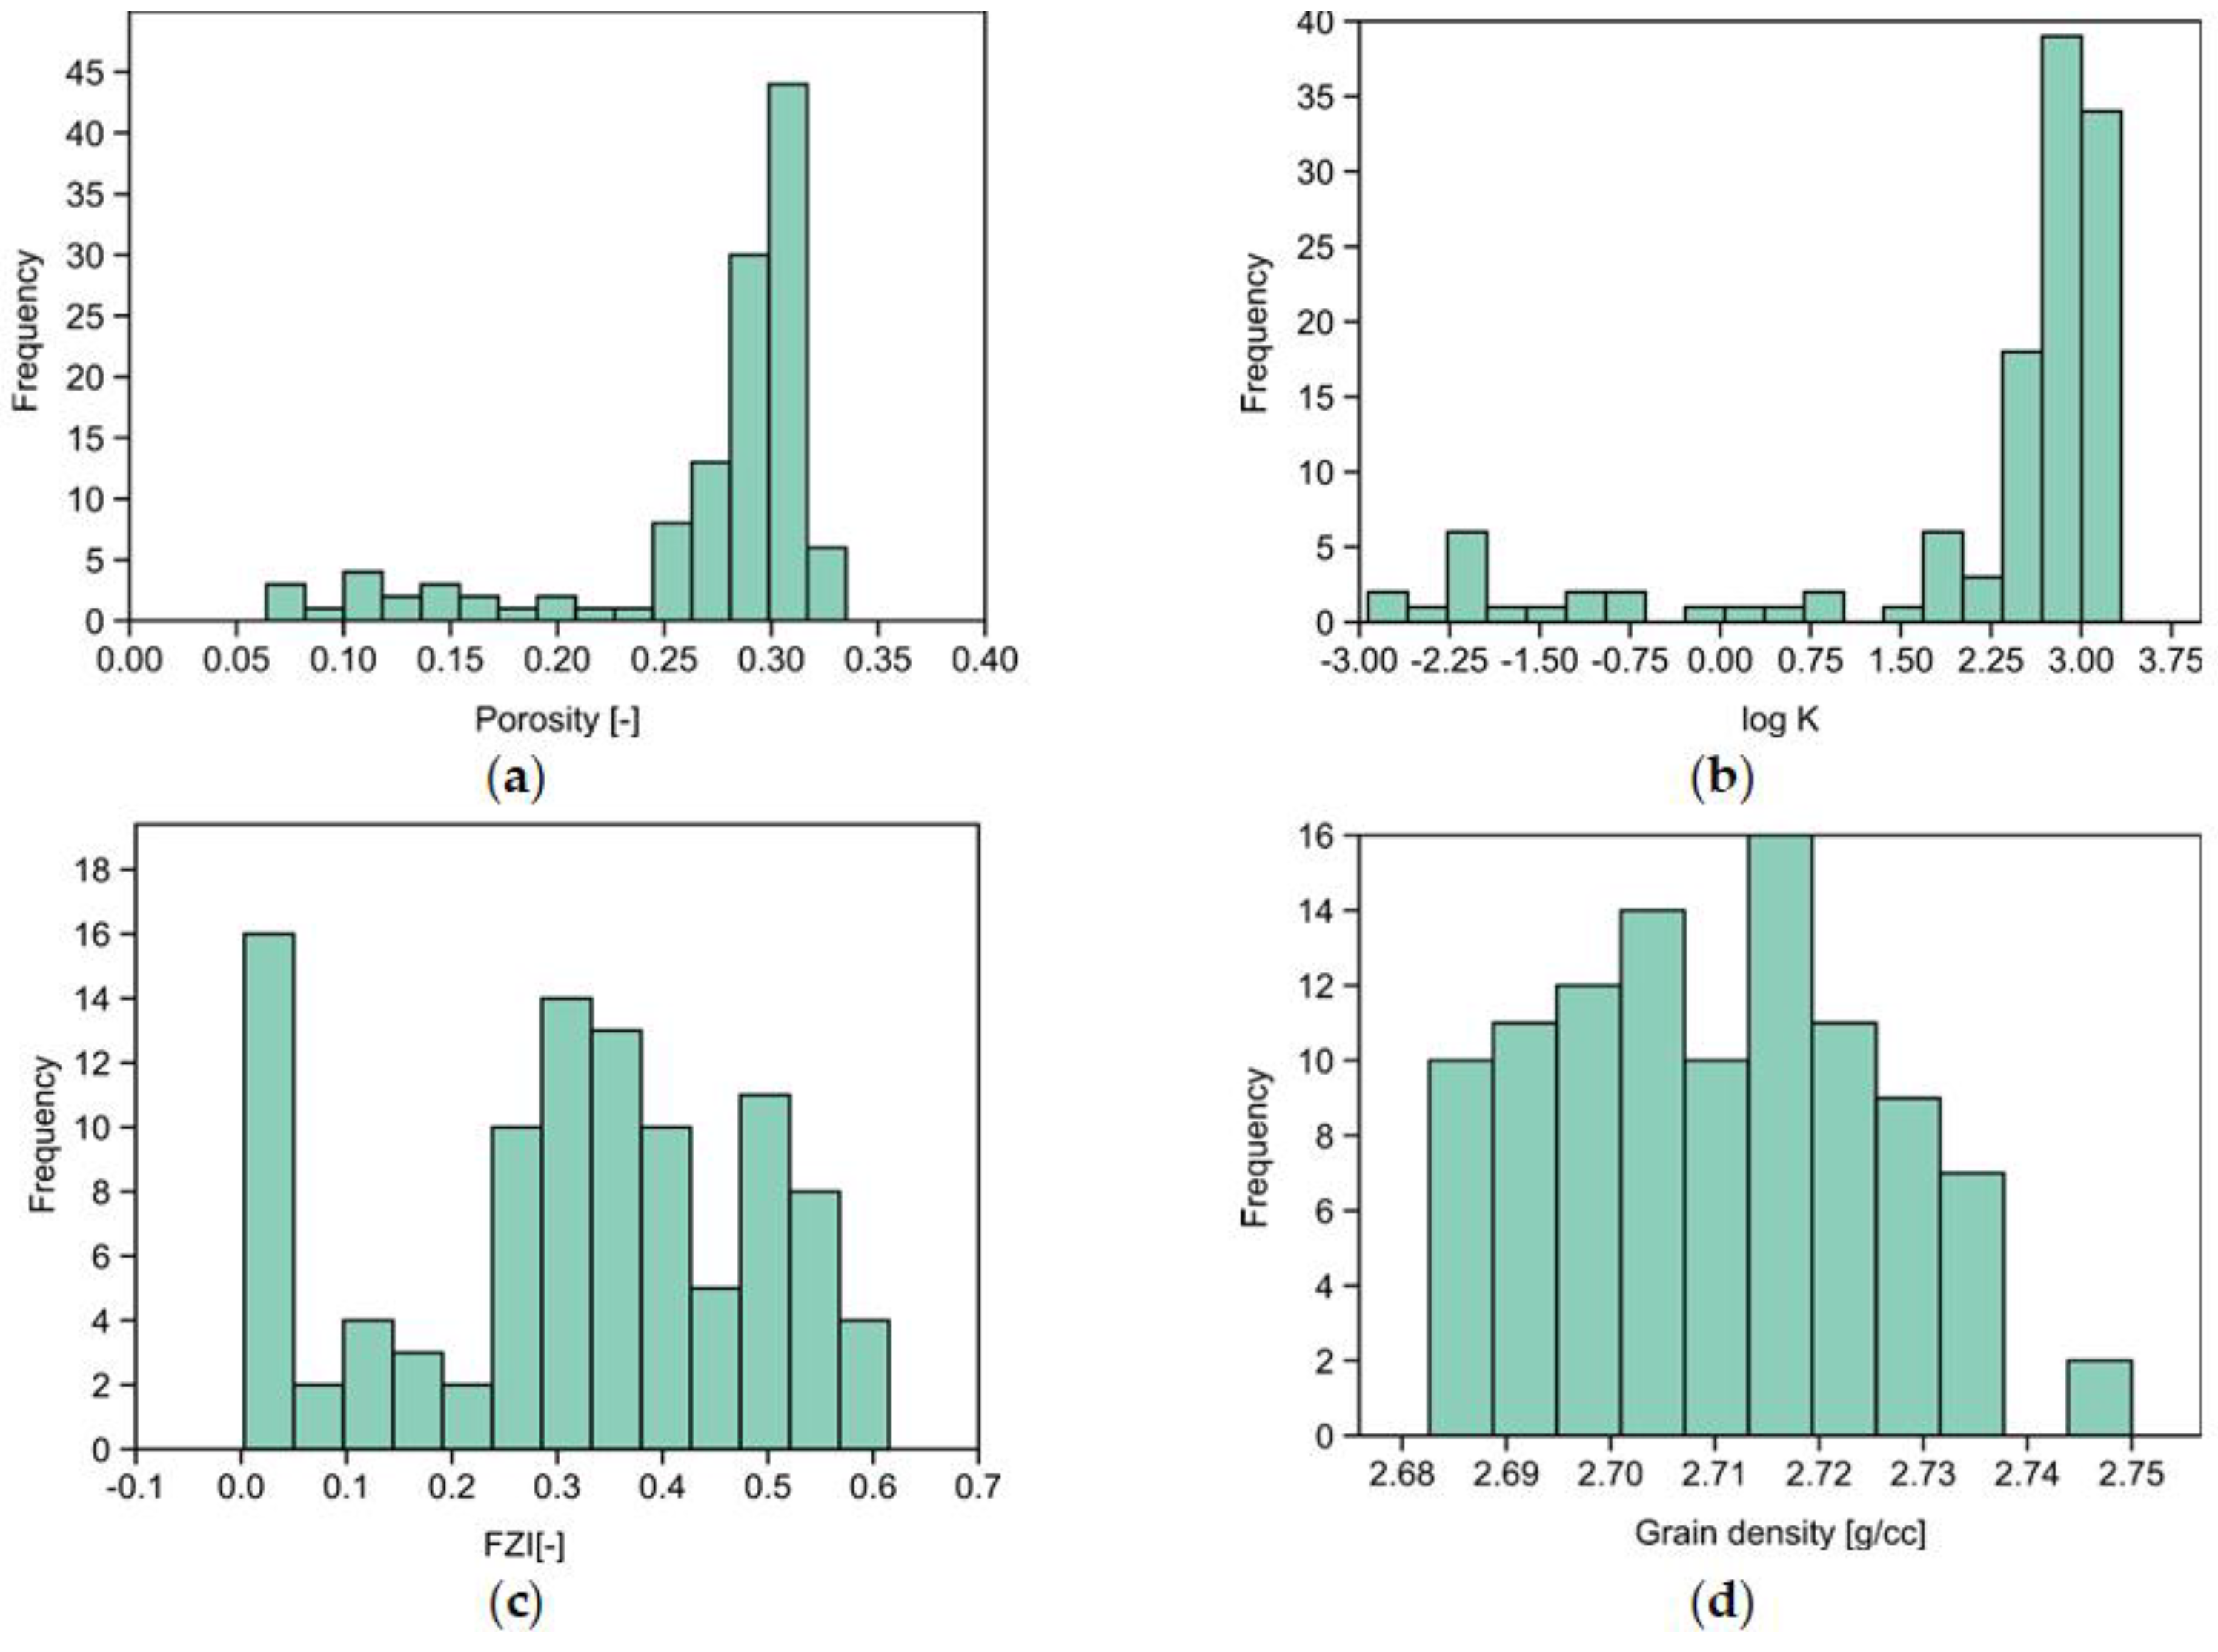
4.2. Petrophysical Measurement and Analysis Results

Table 3 summarises the descriptive statistical parameters of measured petrophysical parameters regarding their mean, median, standard deviation, and minimum and maximum values based on 121 samples. Since these characteristics may be biased by other factors, e.g., sampling location, rock fabric, and heterogeneity, these are classified on an unsupervised basis to reveal possible correlations. Figure 10 shows the histograms of porosity, permeability, and the calculated FZI values. These histograms exhibit multimodal distributions.
We tested the dependence of porosity and permeability on sample orientation (horizontal and vertical) using a Kruskal–Wallis non-parametric hypothesis test. The test results indicate that these parameters are independent of orientation. Therefore, Petrophysical Rock Typing was applied to the whole dataset with no respect to sample orientation.
Based on unsupervised clustering of FZI values, samples were classified into four different groups (Figure 11), where group 1 has the lowest FZI and group 4 has the largest one. These groups of samples are interpreted as Petrophysical Rock Types (PRT) that share similar reservoir characteristics.

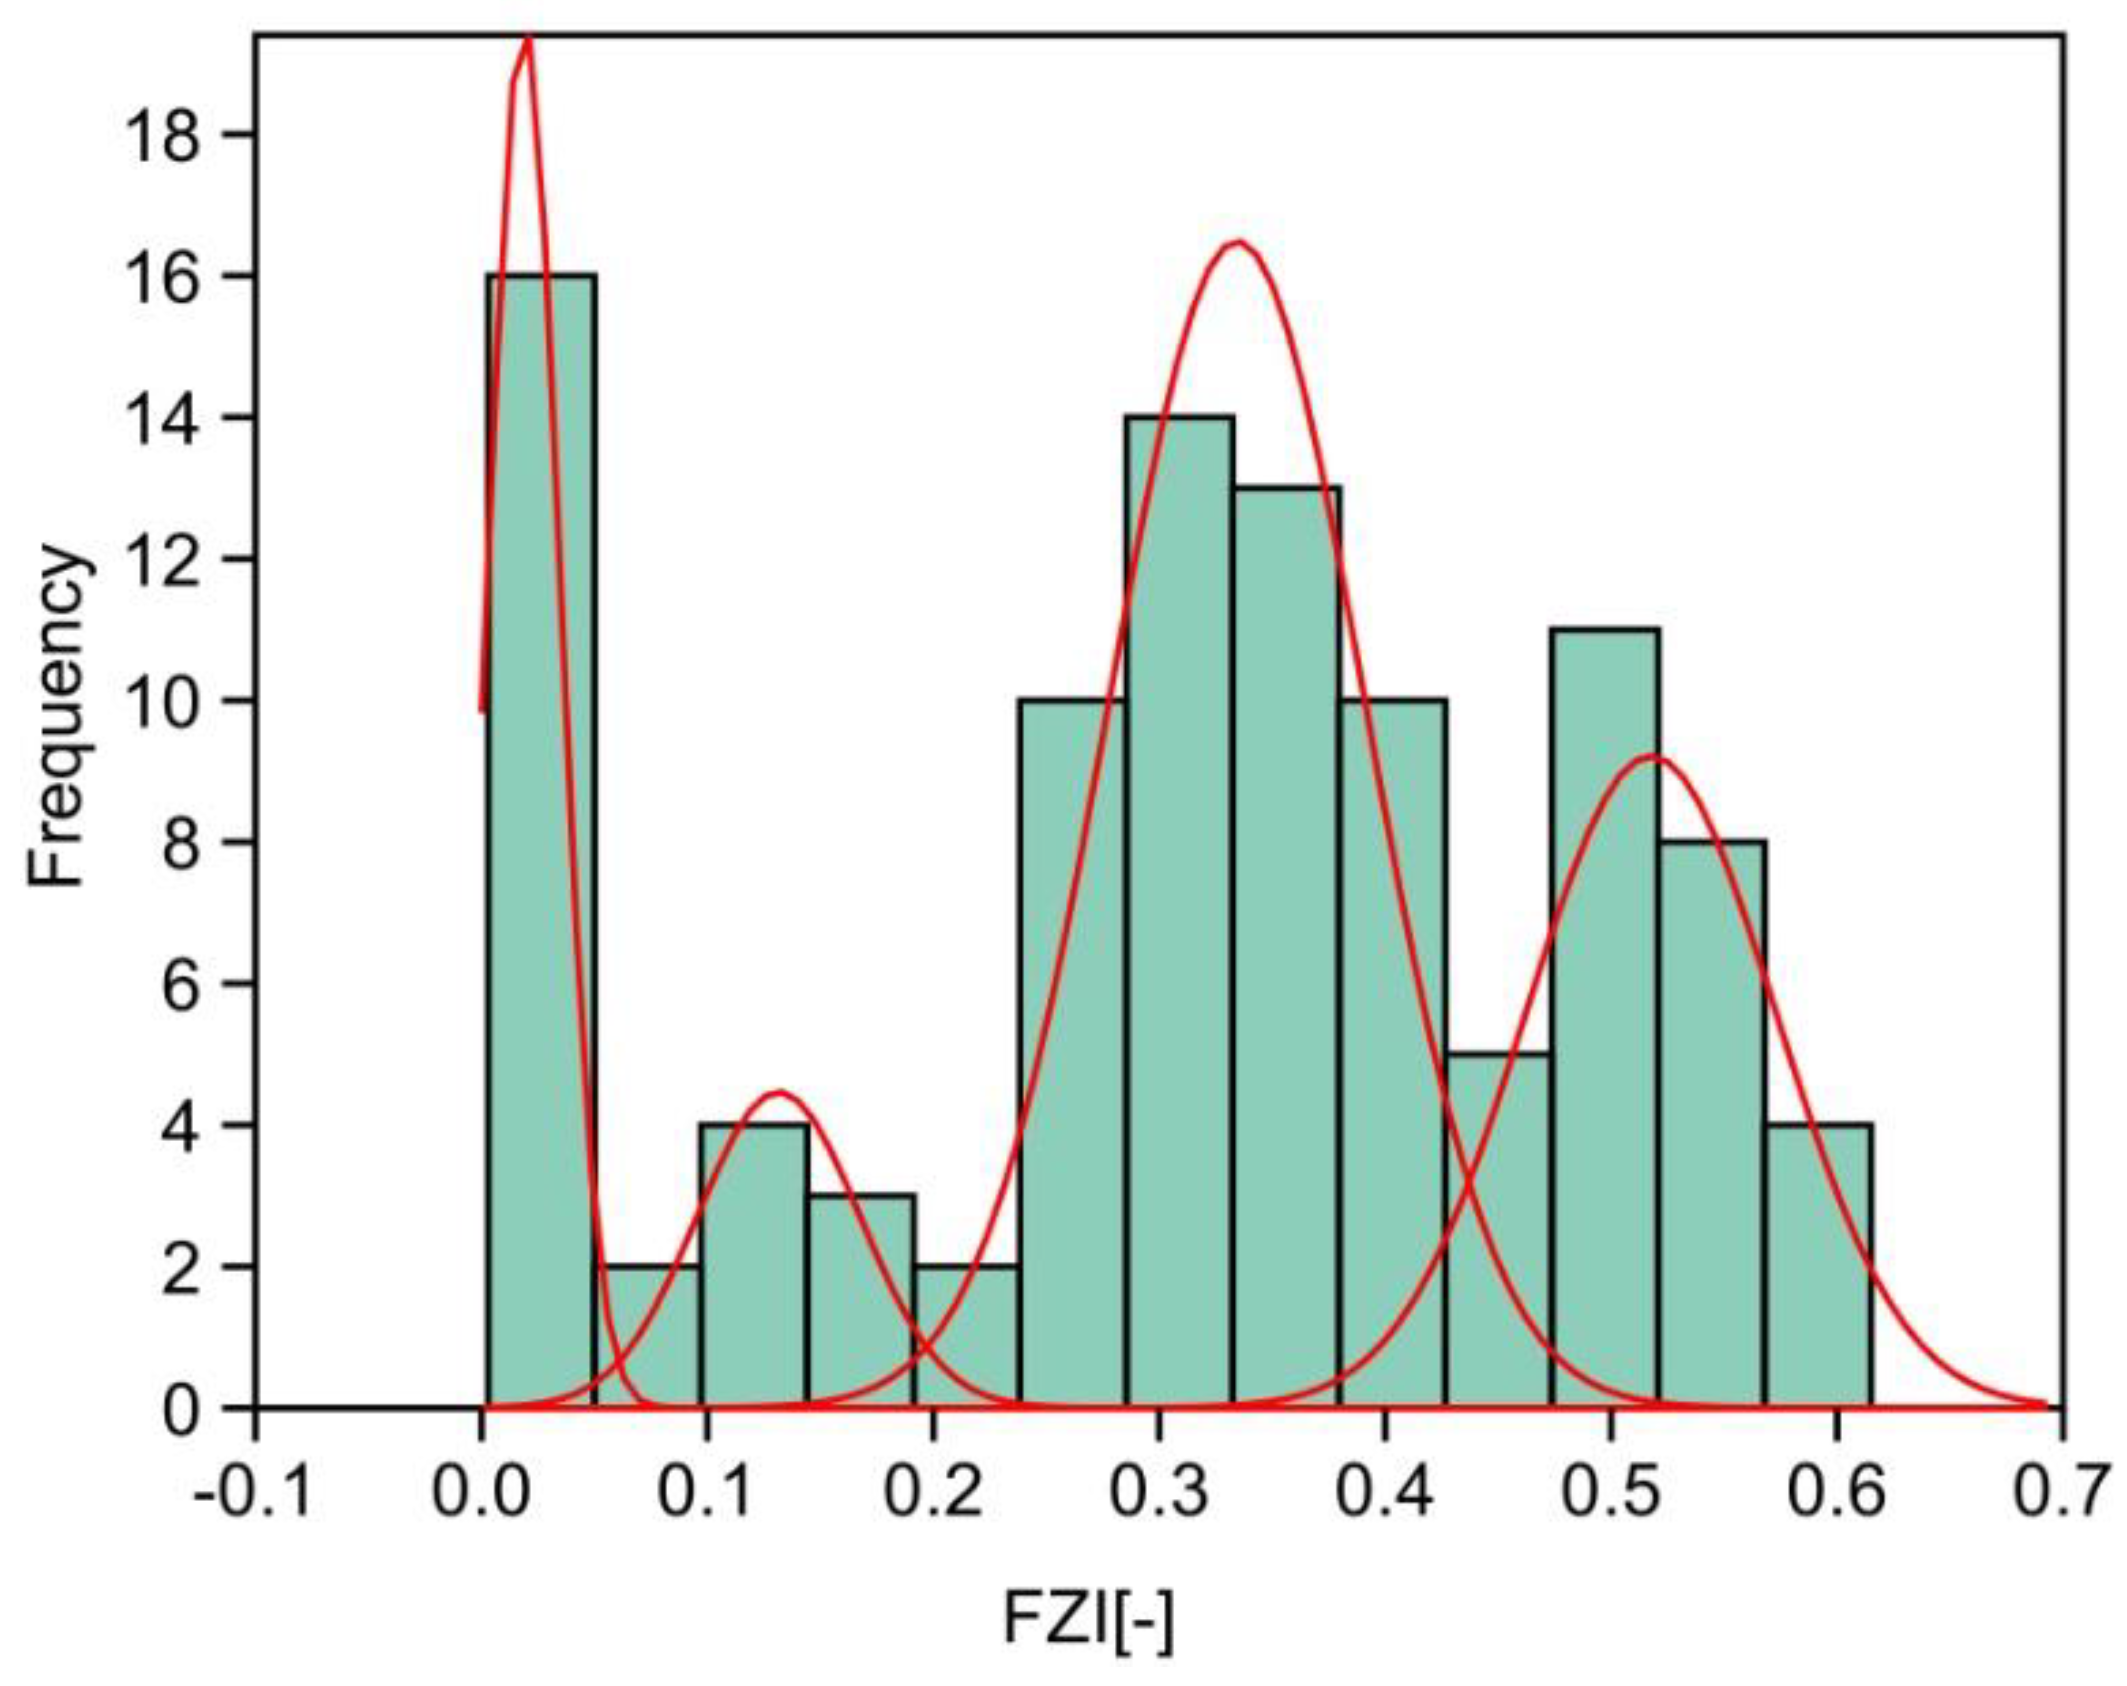
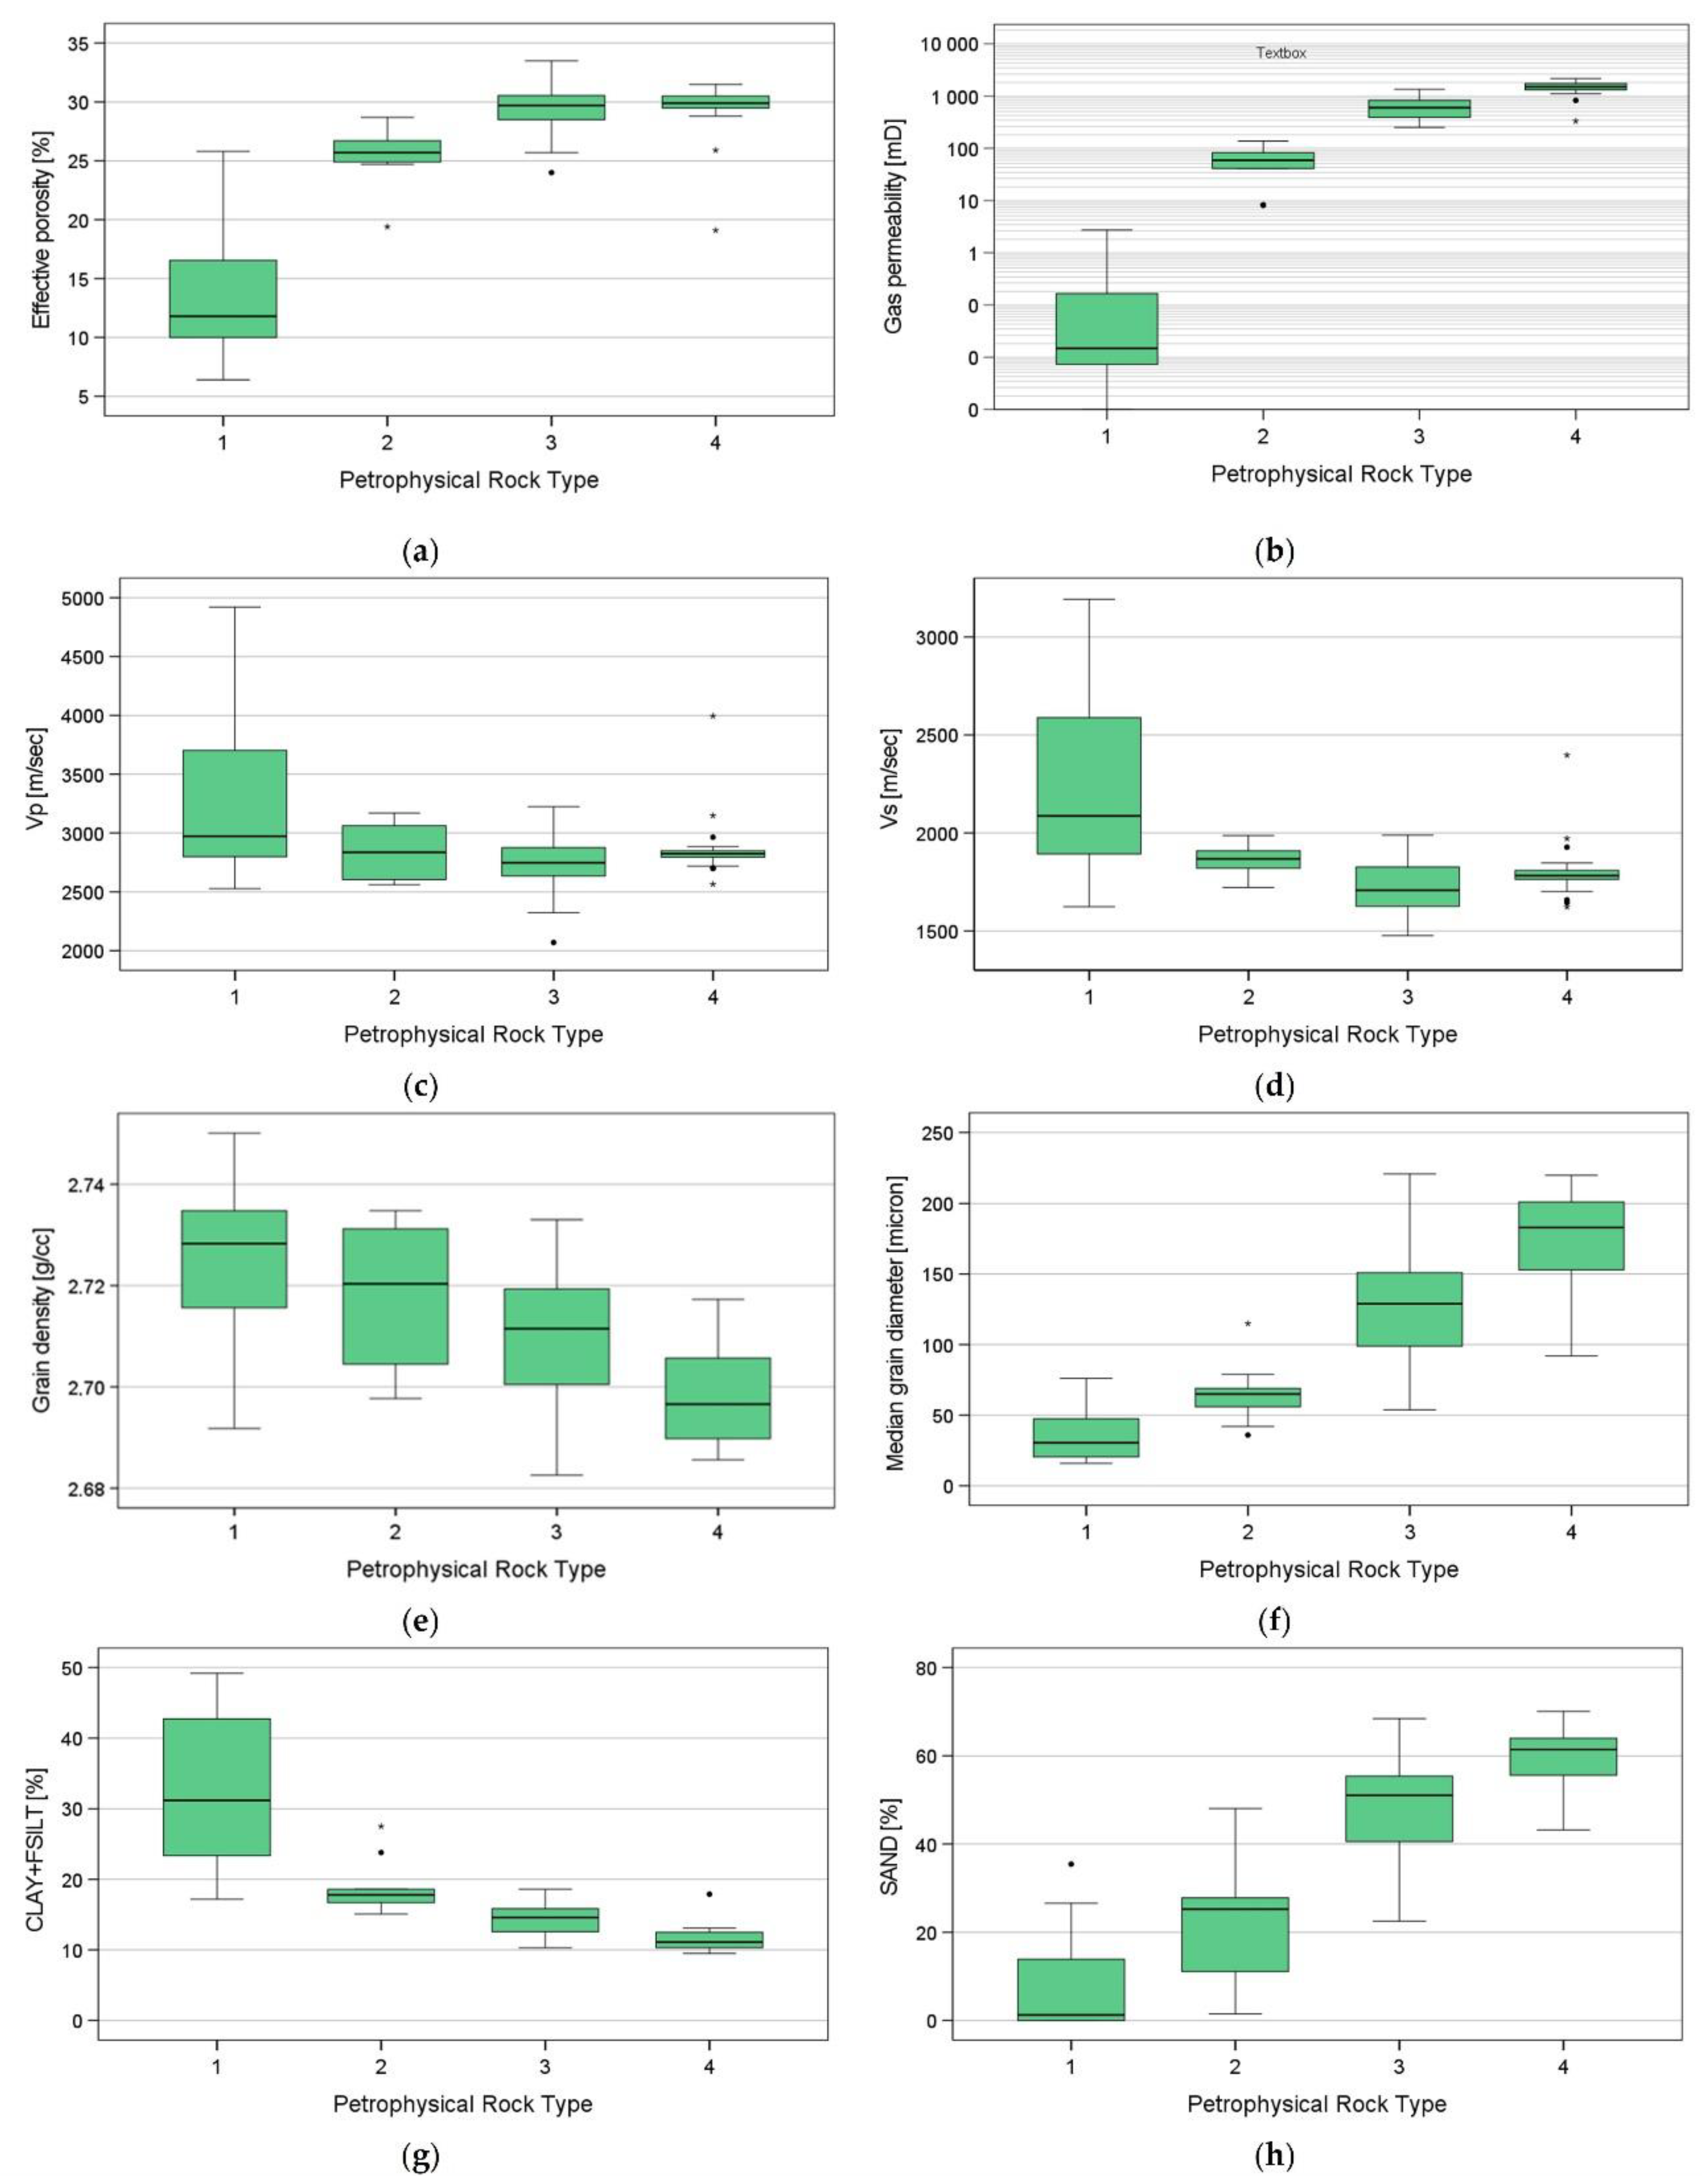
4.3. Characterisation of Petrophysical Rock Types

Figure 12 shows the box plots of petrophysical and textural parameters for each classified PRT group. The descriptive statistics for each identified PRT are summarised in Table 4. The figure shows that almost all tested parameters exhibit a clear dependence on the PRT group, i.e., FZI value. However, the dependence is moderate for ultrasonic wave velocities. Furthermore, higher PRT is associated with higher porosity and permeability as well as grain diameter and sand content, but with lower grain density. Regarding porosity and permeability, a clear distinction is visible between PRT 1 and PRT 2, i.e., mean porosity of 11 % versus 26%, as well as 1>> mD versus 90 mD. On the other hand, PRT 3 and 4 exhibit only a slight difference with respect to porosity. The difference between these FZI values, therefore, is associated with permeability contrast.
Regarding textural parameters, larger PRT values show an inverse relationship with grain density and clay content, as well as larger median grain size. Generally, smaller PRT values can be associated with clay and clayey appearance, while PRT 3 and PRT 4 resemble sandstone characteristics.

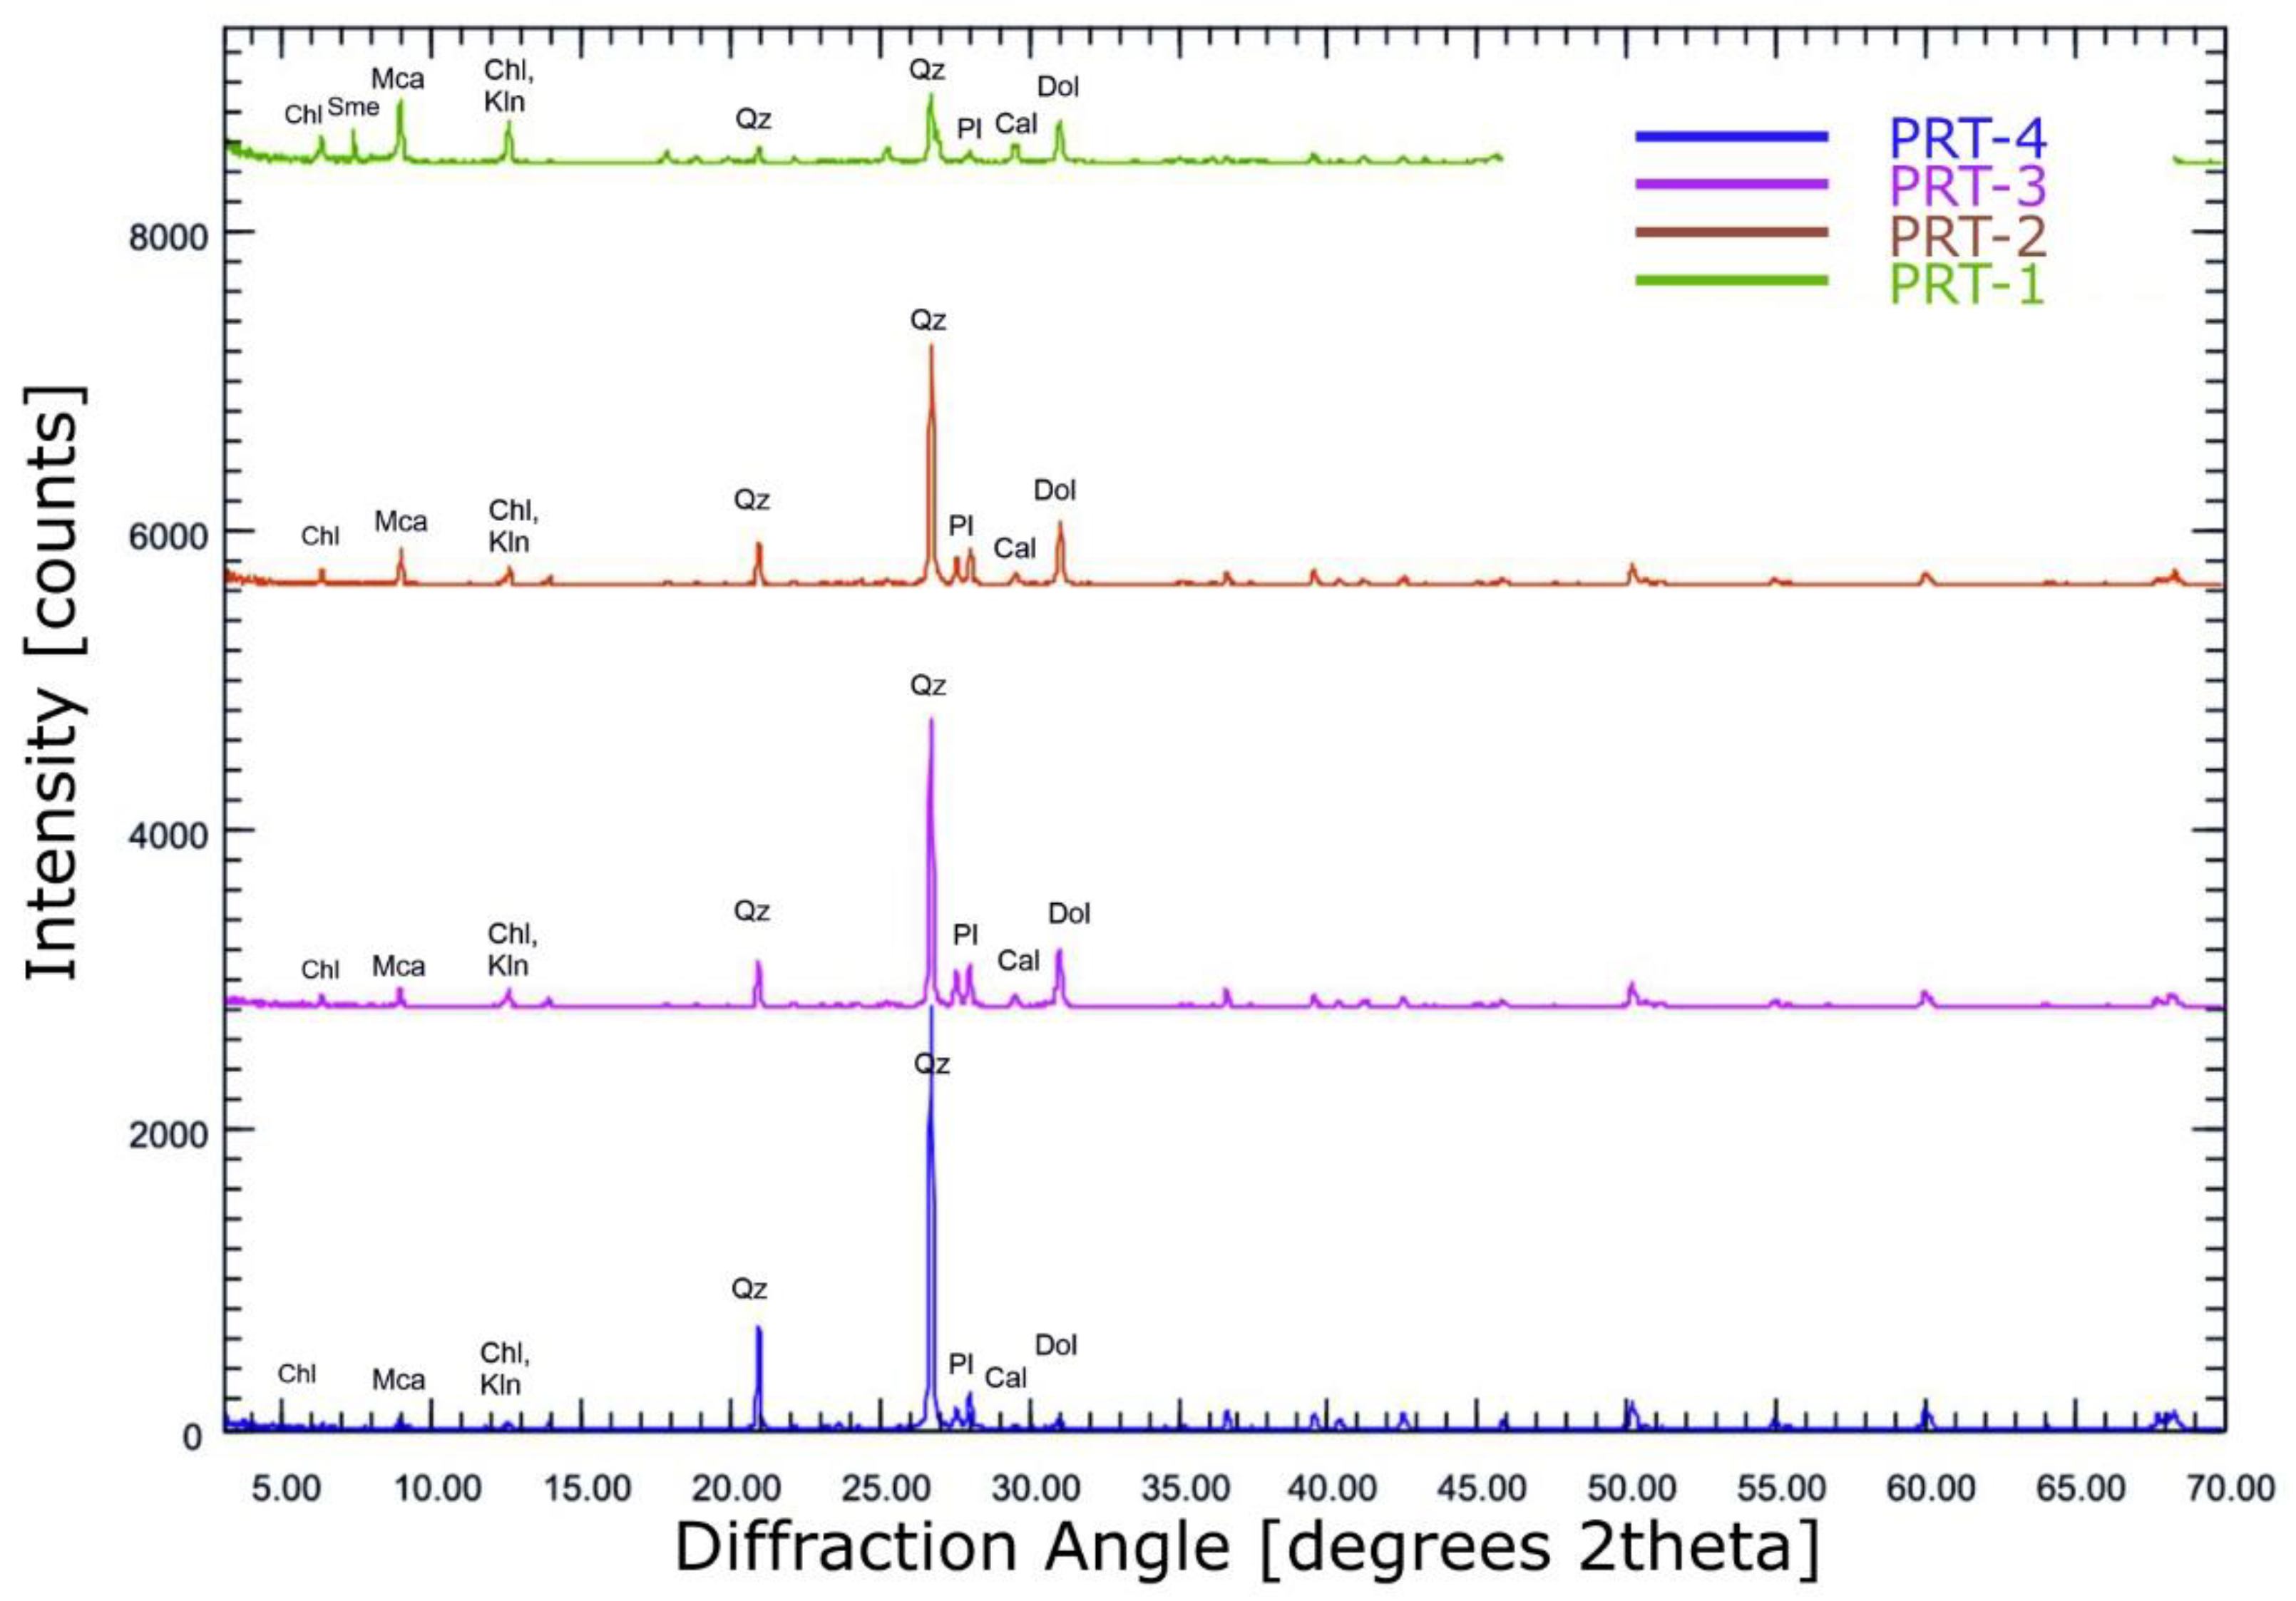
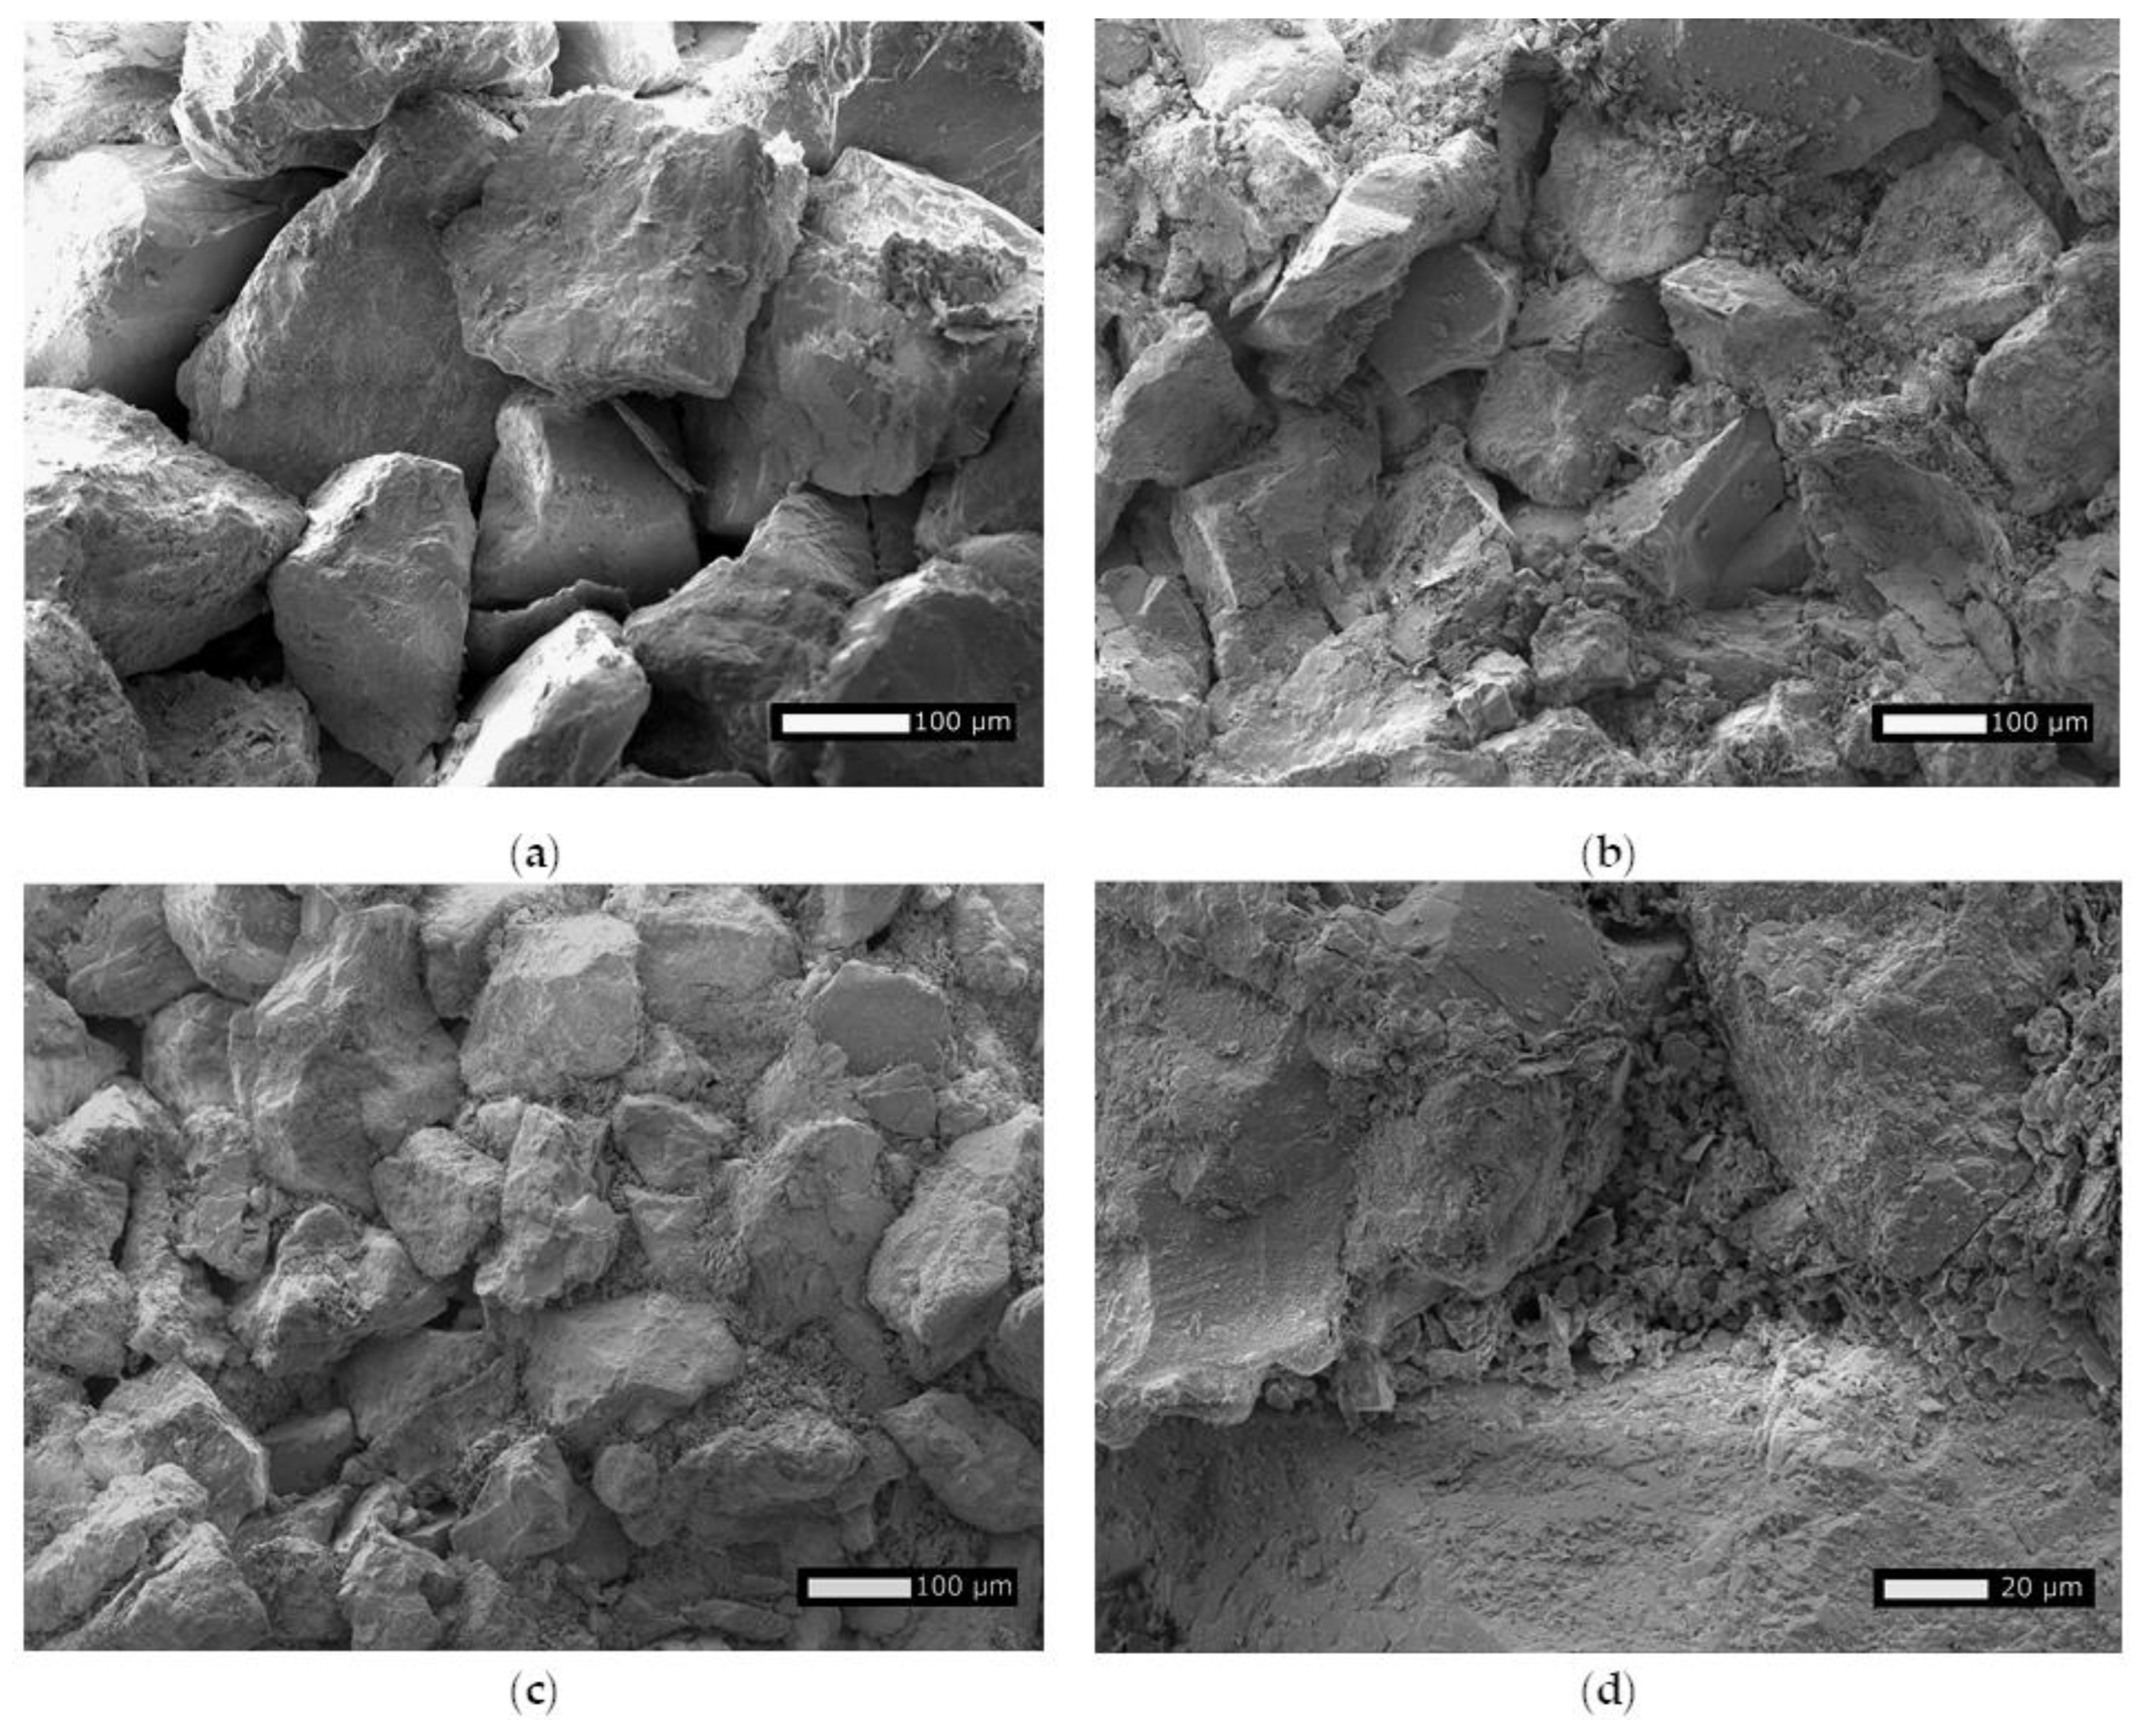
4.4. SEM and XRD Analysis of Petrophysical Rock Types

The results of XRD mineralogical analysis indicate that the amount of quartz does not vary between different Petrophysical Rock Types. The number of carbonate minerals (including calcite and dolomite) and phyllosilicates (montmorillonite, kaolinite, and muscovite) decreases with increasing PRT group number (Figure 13).
Scanning electron microscope analysis confirms that Petrophysical Rock Types characterised by higher FZI have a bigger average grain size (Figure 14a–c). Tangential (point) contacts of sandstone grains indicate a low level of compaction. With decreasing grain size, a higher amount of clay minerals can be observed. Authigenic clay minerals derived from weathered feldspars can reduce the initial porosity and permeability due to blocking of pore throats (Figure 14d).

4.5. Discussion

Based on the laboratory results, the petrophysical parameters, i.e., porosity and permeability, can be related to textural parameters, i.e., grain size, and clay and sand content. The textural characteristics show that primary rock textural features are not disturbed, which is a hint towards a low level of diagenetic processes, such as compaction, mineralization, and cementation. Therefore, the petrophysical properties, including Petrophysical Rock Types (PRT), can be associated with the depositional processes and textural features of the samples.
Table 4 shows that samples belonging to PRT-4 classes exhibit the highest porosity, approx. 30%, and a mean permeability of approx. 1400 mD. These sandstones can be described as clean sands with large grain size and low clay and fine silt content, approx. 10%. Sandstone samples of the PRT-3 group also show a high porosity of approx. 30%, but a lower permeability, around 650 mD. The petrographical analysis of the core samples from this class indicates smaller grain size and higher clay content. Moreover, clay content can be associated with authigenic clay minerals that are grown due to the weathering of feldspars. These clay minerals can not only reduce permeability, but they can be a potential source for fines migration eventually leading to injectivity decline. Samples assigned with PRT classes 2 and 1 show much lower mean permeability, 60 mD and 0.36 mD, as well as porosity, 25 and 13 %, and sand content compared to the previous classes. Consequently, rock samples of PRT classes 1 and 2 are more inclined to fines migration than the other classes.
These findings can be applied to field scale to make recommendations for selecting screen intervals with low potential for fines migration prior to injection or production operation. Figure 15 shows the screen intervals I to V, core sections, and the PRTs, as well as gamma ray (GR) logs of the lower sampling intervals in wells SZT-1 and SZSZT-IX (Table 2).
In well SZT-1, three out of five perforation intervals are sampled by cores. In well SZSZT-IX, core intervals are located above the perforated intervals. Regarding well SZT-1, perforation interval I of 9 m length is dominated by PRT-3 classes with few PRT-2 samples. Perforation interval II with a length of 3 m shows samples with PRT-4 class and perforation interval IV of 6 m length is associated with samples from PRT-3 and 4 classes. According to this comparison, perforation interval IV is the best candidate for sustainable reinjection. Regarding screen intervals III and V, III is less preferred due to its short zone length of 3 m, while screen interval V can be also a good candidate for reinjection operation based on the shape of the GR log.
Concerning well SZSZT-IX, it can be noted that the core interval between 1835 and 1840 m implies ideal conditions for reinjection or production operation with lower potential for injectivity or productivity problems, as the interval is associated with samples of PRT-3 classes.
Regarding processes resulting in injectivity or productivity decline in Upper Pan-nonian sandstone reservoirs, in other reservoirs with similar geological settings in Hungary, further possible mechanisms are considered as well. These may include clogging due to water–rock interaction, lack of continuous flow paths in the reservoir, and biofilm production ([6,11,20]). The investigation of these processes should be the focus of future research. Nonetheless, Szanyi et al. [3] report that in the Szeged geothermal system, in the proximity of Szentes Geothermal Field, productivity issues related to fines migration occur frequently, which may be treated by production with high flow rates.
We note that the application of the proposed methodology on GR logs for uncored intervals in both wells using machine learning techniques (e.g., [42,43]) is a subject of future research. It must be also pointed out that in our study, temperature differences between cold injection water and hot reservoir fluid during reinjection are not considered. We expect that introducing this effect may play an important role in coupled hydro-mechanical processes in wellbores drilled in unconsolidated reservoirs, e.g., fines migration due to formation damage, since fluid density and viscosity are strongly controlled by temperature [53]. The numerical study conducted by Zhang et al. 2022 [54] shows that hydraulic gradient is one of the major controlling parameters in fines production. Thus, the investigation of coupled thermal-hydraulic-mechanical analysis of near-wellbore fines migration should be the focus of future investigation.

5. Conclusions

In this study, we conducted a series of petrographical and petrophysical laboratory experiments on 121 samples of Upper Pannonian sandstone formation obtained from two exploration wells at the Szentes Geothermal Field. The goal of the study is to provide experimental data and to gain a better understanding of the formation characteristics that control injectivity and productivity issues in Upper Pannonian sandstone layers.
Based on hydro-mechanical properties of the tested rock samples, these can be classified into four representative Petrophysical Rock Types that share distinct petrophysical, textural, and hydraulic characteristics, i.e., two with higher clay content and two with higher sand content. Although sand layers are ideal for reinjection operations, one of the sandy rock types is characterised by the presence of authigenic clay that may migrate during fluid flow, resulting in injectivity decline. Consequently, the proposed methodology can be applied for identifying sand intervals with lower potential for formation damage.
The results imply that fines migration due to formation erosion is one of the key processes that must be better understood and controlled in order to mitigate injectivity issues related to the unconsolidated Upper Pannonian sandstone reservoir at Szentes Geothermal Field. However, other processes, such as mineral precipitation due to water–rock interaction processes and microbial activity, may be also considered.
Future investigation should include experimental characterisation of formation damage, including water–rock interaction tests, critical flow velocity measurements, and fines migration analysis under reservoir conditions. Furthermore, temperature effects arising from the injection of cold water into hot formation should be also studied in detail, e.g., in terms of a coupled thermal-hydraulic-mechanical numerical analysis of fines migration in wellbores in unconsolidated reservoirs.

Author Contributions

Conceptualization, writing—original draft preparation, formal analysis, investigation, data curation, P.K., Z.V. and M.P.F.; investigation, G.K., P.Á., P.M., M.K. and A.F.S.; formal analysis, investigation, review, M.P.F., F.F. and J.K. All authors have read and agreed to the published version of the manuscript.

Funding

This publication was prepared by the first author with the professional support of the Doctoral Student Scholarship Program of the Co-operative Doctoral Program of the Ministry of Innovation and Technology financed from the National Research, Development, and Innovation Fund, grant number: KDP-13-1/PALY-2021-1015027. This research was funded by the Hungarian National Research, Development, and Innovation Office (NKFIH), grant number: GINOP-2.2.1-15-2017-00102.

Data Availability Statement

Not applicable.

Acknowledgments

The authors would like to thank Péter Szabó for his technical support during SEM imaging and Béla Gadó for the preparation of Figure 1. We are grateful to the reviewers for their insightful comments.

Conflicts of Interest

The authors declare no conflict of interest.

References

  1. Bálint, A.; Szanyi, J. A Half Century of Reservoir Property Changes in the Szentes Geothermal Field, Hungary. Cent. Eur. Geol. 2015, 58, 28–49. [Google Scholar] [CrossRef] [Green Version]
  2. Szanyi, J.; Kovács, B. Utilization of Geothermal Systems in South-East Hungary. Geothermics 2010, 39, 357–364. [Google Scholar] [CrossRef]
  3. Szanyi, J.; Nádor, A.; Madarász, T. A Geotermikus Energia Kutatása És Hasznosítása Magyarországon Az Elmúlt 150 Év Tükrében (Geothermal Energy Exploration and Utilization in Hungary in the Past 150 Years). Földt. Közl. 2021, 151, 79. [Google Scholar] [CrossRef]
  4. Szőcs, T.; Rman, N.; Rotár-Szalkai, Á.; Tóth, G.; Lapanje, A.; Černák, R.; Nádor, A. The Upper Pannonian Thermal Aquifer: Cross Border Cooperation as an Essential Step to Transboundary Groundwater Management. J. Hydrol. Reg. Stud. 2018, 20, 128–144. [Google Scholar] [CrossRef]
  5. Toth, A. Hungarian country update 2010–2014. In Proceedings of the World Geothermal Congress, Melbourne, Australia, 19–25 April 2015. [Google Scholar]
  6. Markó, Á.; Mádl-Szőnyi, J.; Brehme, M. Injection Related Issues of a Doublet System in a Sandstone Aquifer—A Generalized Concept to Understand and Avoid Problem Sources in Geothermal Systems. Geothermics 2021, 97, 102234. [Google Scholar] [CrossRef]
  7. Szanyi, J.; Medgyes, T.; Kóbor, B.; Tari, C.; Balint, A. Experiences with geothermal water injection into porous aquifers. Tech. Poszuk. Geol. 2014, 53, 3–18. [Google Scholar]
  8. Seibt, P.; Kellner, T. Practical Experience in the Reinjection of Cooled Thermal Waters Back into Sandstone Reservoirs. Geothermics 2003, 32, 733–741. [Google Scholar] [CrossRef]
  9. Ungemach, P. Reinjection of Cooled Geothermal Brines into Sandstone Reservoirs. Geothermics 2003, 32, 743–761. [Google Scholar] [CrossRef]
  10. Boch, R.; Leis, A.; Haslinger, E.; Goldbrunner, J.E.; Mittermayr, F.; Fröschl, H.; Hippler, D.; Dietzel, M. Scale-Fragment Formation Impairing Geothermal Energy Production: Interacting H2S Corrosion and CaCO3 Crystal Growth. Geotherm Energy 2017, 5, 4. [Google Scholar] [CrossRef] [Green Version]
  11. Varga, A.; Bozsó, G.; Garaguly, I.; Raucsik, B.; Bencsik, A.; Kóbor, B. Cements, Waters, and Scales: An Integrated Study of the Szeged Geothermal Systems (SE Hungary) to Characterize Natural Environmental Conditions of the Thermal Aquifer. Geofluids 2019, 2019, 4863814. [Google Scholar] [CrossRef] [Green Version]
  12. Szanyi, J.; Medgyes, T.; Kóbor, B.; Pál-Molnár, E. Technologies of Injection into Sandstone Reservoirs: Best Practices, Case Studies; Institute of Geosciences, University of Szeged, GeoLitera: Szeged, Hungary, 2015; ISBN 978-963-306-370-5. [Google Scholar]
  13. Osvald, M.; Maróti, G.; Pap, B.; Szanyi, J. Biofilm Forming Bacteria during Thermal Water Reinjection. Geofluids 2017, 2017, 9231056. [Google Scholar] [CrossRef]
  14. Renard, P.; Glenz, D.; Mejias, M. Understanding Diagnostic Plots for Well-Test Interpretation. Hydrogeol. J. 2009, 17, 589–600. [Google Scholar] [CrossRef] [Green Version]
  15. Farkas, M.P.; Magyar, G.; Hofmann, H.; Zimmermann, G. The construction of tailored reinjection well with gravel pack completion and the recompletion of existing well for reinjection using Frac & Pack technology. Presented at the Final Conference of the GINOP-2.2.1 Project, Pécs, Hungary, 27 October 2022. [Google Scholar]
  16. Mádl-Szőnyi, J.; Simon, S. Involvement of Preliminary Regional Fluid Pressure Evaluation into the Reconnaissance Geothermal Exploration—Example of an Overpressured and Gravity-Driven Basin. Geothermics 2016, 60, 156–174. [Google Scholar] [CrossRef]
  17. Mádlné Szőnyi, J. Felszínalatti Vízáramlások Mintázata Fedetlen és Kapcsolódó Fedett Karbonátos Víztartó Rendszerekben a Budai-Termálkarszt Tágabb Környezetéenek Példéján. Ph.D. Thesis, Hungarian Academy of Sciences, ELTE, Budapest, Hungary, 2020. [Google Scholar]
  18. Brehme, M.; Zimmermann, G.; Weinzierl, W.; Aldaz, S.; Markó, Á.; Thiem, S.; Huenges, E. Deliverable [D 4.1]: Report on Hydraulic, Thermal and Chemical Parameters, before and after Stimulation. WP [4]: Demonstration of Combined Hydraulic-Thermal-Chemical Treatments in Sandstones, Carbonatic Rocks and Granites; Report for the European Union H2020 Project “Demonstration of Soft Stimulation Treatments of Geothermal Reservoirs” (DESTRESS), Helmholtz Centre Potsdam, Potsdam, Germany. 2021. Available online: http://www.destress-h2020.eu/en/what-we-do/wp4/ (accessed on 16 August 2022).
  19. Koroncz, P.; Fedor, F.; Vizhányó, Z.; Kuncz, M.; Ács, P.; Fedor-Szász, A.; Farkas, M.; Sendula, E.; Pernyeszi, T.; Magyar, G.; et al. Laboratory R&D related to the development of technology for water re-injection in poorly consolidated Upper Pannonian rocks. In Proceedings of the European Geothermal Congress, Berlin, Germany, 17–21 October 2022. [Google Scholar]
  20. Willems, C.; Cheng, C.; Watson, S.; Minto, J.; Williams, A.; Walls, D.; Milsch, H.; Burnside, N.; Westaway, R. Permeability and Mineralogy of the Újfalu Formation, Hungary, from Production Tests and Experimental Rock Characterization: Implications for Geothermal Heat Projects. Energies 2021, 14, 4332. [Google Scholar] [CrossRef]
  21. Horváth, J.; Koroncz, P.; Fedor, F.; Hlatki, M. Petrophysical and geomechanical analysis of Upper Pannonian unconsolidated sandstones. In Civil Engineering and Rock Mechanics; Török, Á., Görög, P., Vásárhelyi, B., Eds.; Hantken: Budapest, Hungary, 2013; pp. 229–240. (In Hungarian) [Google Scholar]
  22. Bélteky, L.; Budai, L.; Kassai, L.; Konyor, L.; Korim, K.; Mayerszky, B.; Szpiriev, B. Különleges Geotermikus Adottságaink Kiaknázási Lehetőségeinek Vizsgálata; 7. Számú Kiegészítés: Szentes és Környékén Mélyített Hévízkutak Vizsgálata Egymásrahatás és Vízkészletszámítás Szempontjából (Investigation of Exploitation of Hungarian Geothermal Energy; Addition No. 7. Investigation of Thermal Wells in the Surroundings of Szentes); Manuscript; Research Institute of Water Management: Szeged, Hungary, 1970; 99p. (In Hungarian) [Google Scholar]
  23. Korim, K.; Liebe, P. A szentesi hévíztároló rendszer (The Szentes Geothermal Field). Vízügyi Közlemények 1973, 55, 290–311. (In Hungarian) [Google Scholar]
  24. Korim, K. A szentesi hévízmező feltárásának és termelésének három évtizedes története (Three decades of research and utilization in the Szentes Geothermal Field). Bányászati Kohászati Lapok 1991, 124, 179–184. (In Hungarian) [Google Scholar]
  25. Szanyi, J. Felső-Pannon Korú Rétegek Mélységének Meghatározása Magfúrás Kijelölése Szempontjából a GINOP-2.2.1-15-2015-00102 Azonosítójú Projekthez (Determining the Depths of Upper Pannonian Sediments for Core Sampling); Project Report; Institute of Geosciences, University of Szeged: Szeged, Hungary, 2020; 15p. (In Hungarian) [Google Scholar]
  26. Babinszki, E. (Ed.) Magyarország Litosztratigráfiai Egységeinek Leírása II. Kainozoos Képződmények (Litostratigraphic Units of Hungary II. Cainozoic Formations); Szabályozott Tevékenységek Felügyeleti Hatósága: Budapest, Hungary, 2022. (In press) [Google Scholar]
  27. Sztanó, O.; Szafián, P.; Magyar, I.; Horányi, A.; Bada, G.; Hughes, D.W.; Hoyer, D.L.; Wallis, R.J. Aggradation and Progradation Controlled Clinothems and Deep-Water Sand Delivery Model in the Neogene Lake Pannon, Makó Trough, Pannonian Basin, SE Hungary. Glob. Planet. Chang. 2013, 103, 149–167. [Google Scholar] [CrossRef]
  28. Juhász, G. A Szentesi Geotermikus Mező Regionális Geológiai Modellje (Regional Geological Model of the Szentes Geothermal Field); Magyar Szénhidrogénipari Kutató-Fejlesztő Intézet: Százhalombatta, Hungary, 1989; 34p. (In Hungarian) [Google Scholar]
  29. Bereczki, L.; Zilahi-Sebess, L.; Markos, G.; Kemény, M.; Takács, E. Szentes Környéki Geotermikus Visszasajtoló Kutak Környezetének Vizsgálata 2D Szeizmikus Szelvények Alapján (Investigation of the Szentes Geothermal Wells Based on 2D Seismic Sections); Project Report 2020; Mining and Geological Survey of Hungary: Budapest, Hungary, 2020. (In Hungarian) [Google Scholar]
  30. Castro, C.; Geiger, J. Stratigraphical model of the Upper Pannonian sequence in the Szentes Region. Presented at the Final Conference of the GINOP-2.2.1 Project, Pécs, Hungary, 27 October 2022. [Google Scholar]
  31. ASTM D 2845; Standard Test Method for Laboratory Determination of Pulse Velocities and Ultrasonic Elastic Constants of Rock. ASTM: West Conshohocken, PA, USA, 2000; Volume 04.08. Available online: https://www.astm.org/d2845-00.html (accessed on 23 September 2022).
  32. Aydin, A. Upgraded ISRM Suggested Method for Determining Sound Velocity by Ultrasonic Pulse Transmission Technique. Rock Mech. Rock Eng. 2014, 47, 255–259. [Google Scholar] [CrossRef]
  33. EPA (U.S. Environmental Protection Agency). Guidance on Choosing a Sampling Design for Environmental Data Collection. EPA/240/R-02/005; Office of Environmental Information: Washington, DC, USA, 2002; p. 20460.
  34. API RP40—American Petroleum Institute. Recommended Practices for Core Analysis; API Publishing Services: Washington, DC, USA, 1998. [Google Scholar]
  35. Spencer, C.W.; Szalay, Á.; Tatár, É. Abnormal pressure and hydrocarbon migration in the Békés Basin. In Basin Analysis in Petroleum Exploration: A Case Study from the Békés Basin, Hungary; Teleki, P.G., Mattick, R.E., Kokai, J., Eds.; Kluwer: Dordrecht, The Netherlands, 1994; pp. 201–219. [Google Scholar]
  36. Almási, I. Petroleum Hydrogeology of the Great Hungarian Plain, Eastern Pannonian Basin, Hungary. Ph.D. Thesis, University of Alberta, Edmonton, AB, Canada, 2001; p. 312. [Google Scholar]
  37. Koroncz, P.; Fedor, F. Experimental investigation of stress-dependent petrophysical behaviour of reservoir rocks. In Proceedings of the 8th Croatian-Hungarian and 19th Hungarian Geomathematical Congress, Trakošćan, Croatia, 26–28 May 2016. [Google Scholar]
  38. Zang, A.; Stephansson, O. Stress Field of the Earth’s Crust, 1st ed.; Springer: Dordrecht, Netherlands, 2010; pp. 198–245. [Google Scholar]
  39. Hearn, C.L.; Ebanks, W.J.; Tye, R.S.; Ranganathan, V. Geological Factors Influencing Reservoir Performance of the Hartzog Draw Field, Wyoming. J. Pet. Technol. 1984, 36, 1335–1344. [Google Scholar] [CrossRef]
  40. Kadkhodaie-Ilkhchi, A.; Kadkhodaie-Ilkhchi, R. A Review of Reservoir Rock Typing Methods in Carbonate Reservoirs: Relation between Geological, Seismic, and Reservoir Rock Types. IJOGST 2018, 7, 13–35. [Google Scholar] [CrossRef]
  41. Guo, G.; Diaz, M.A.; Paz, F.; Smalley, J.; Waninger, E.A. Rock Typing as an Effective Tool for Permeability and Water-Saturation Modeling: A Case Study in a Clastic Reservoir in the Oriente Basin. SPE Reserv. Eval. Eng. 2007, 10, 730–739. [Google Scholar] [CrossRef]
  42. Mohammadian, E.; Kheirollahi, M.; Liu, B.; Ostadhassan, M.; Sabet, M. A Case Study of Petrophysical Rock Typing and Permeability Prediction Using Machine Learning in a Heterogenous Carbonate Reservoir in Iran. Sci. Rep. 2022, 12, 4505. [Google Scholar] [CrossRef]
  43. Man, H.Q.; Hien, D.H.; Thong, K.D.; Dung, B.V.; Hoa, N.M.; Hoa, T.K.; Kieu, N.V.; Ngoc, P.Q. Hydraulic Flow Unit Classification and Prediction Using Machine Learning Techniques: A Case Study from the Nam Con Son Basin, Offshore Vietnam. Energies 2021, 14, 7714. [Google Scholar] [CrossRef]
  44. Kolodzie, S. Analysis of Pore Throat Size and Use of the Waxman-Smits Equation to Determine Ooip in Spindle Field, Colorado. In All Days; SPE: Dallas, TX, USA, 1980; p. SPE-9382-MS. [Google Scholar] [CrossRef]
  45. Amaefule, J.O.; Altunbay, M.; Tiab, D.; Kersey, D.G.; Keelan, D.K. Enhanced Reservoir Description: Using Core and Log Data to Identify Hydraulic (Flow) Units and Predict Permeability in Uncored Intervals/Wells. In All Days; SPE: Houston, TX, USA, 1993; p. SPE-26436-MS. [Google Scholar] [CrossRef]
  46. Ebanks, W.J., Jr. Flow Unit Concept-Integrated Approach to Reservoir Description for Engineering Projects. AAPG Bull. 1987, 71, 551–552. [Google Scholar]
  47. Sharifi-Yazdi, M.; Rahimpour-Bonab, H.; Nazemi, M.; Tavakoli, V.; Gharechelou, S. Diagenetic Impacts on Hydraulic Flow Unit Properties: Insight from the Jurassic Carbonate Upper Arab Formation in the Persian Gulf. J. Petrol. Explor. Prod. Technol. 2020, 10, 1783–1802. [Google Scholar] [CrossRef] [Green Version]
  48. Krumbein, W.C. The Probable Error of Sampling Sediments for Mechanical Analysis. Am. J. Sci. 1934, s5–27, 204–214. [Google Scholar] [CrossRef]
  49. McDonald, J.H. Handbook of Biological Statistics, 3rd ed.; Sparky House Publishing: Baltimore, MD, USA, 2014. [Google Scholar]
  50. Hammer, O. PAST—PAleontological Statistics, Version 2.17. Reference Manual. Natural History Museum, University of Oslo: Oslo, Norway, 2012. Available online: https://www.yumpu.com/en/document/view/4573945/past-paleontological-statistics-version-217-reference-manual(accessed on 28 November 2012).
  51. Akaike, H. Information theory and an extension of the maximum likelihood principle. In Proceedings of the 2nd International Symposium on Information Theory, Tsahkadsor, Armenia, USSR, 2–8 September 1971; Petrov, B.N., Csáki, F., Eds.; Akadémiai Kiadó: Budapest, Hungary; pp. 267–281. [Google Scholar]
  52. IBM Corp. IBM SPSS Statistics for Windows, Version 28.0; Armonk: New York, NY, USA, 2021.
  53. Zhou, S.; Sun, F. Sand Production Management for Unconsolidated Sandstone Reservoirs; Wiley: Singapore, 2016. [Google Scholar]
  54. Zhang, F.; Wang, T.; Liu, F.; Peng, M.; Bate, B.; Wang, P. Hydro-mechanical coupled analysis of near-wellbore fines migration from unconsolidated reservoirs. Acta Geotech. 2022, 17, 3535–3551. [Google Scholar] [CrossRef]
Figure 1. Location of the study area in Hungary, showing the active producing geothermal wells at the Szentes Geothermal Field. The wells “SZT-1” and “SZSZT-IX” (well IDs in red) were drilled in the framework of this study. The geological cross-section illustrates the stratigraphy of the study area in Section 2.3.
Energies 15 09136 g001
Figure 2. Generalised chrono- and lithostratigraphy of the Miocene–Holocene deposits in the study area simplified after [27]. Abbreviations: Pl = Pleistocene; H = Holocene [11].
Energies 15 09136 g002
Figure 3. Depth map of Pre-Neogene basement top around Szentes study area (red rectangle) [25].
Energies 15 09136 g003
Figure 4. Depth map of Upper Pannonian formation top around Szentes study area (red rectangle) [25].
Energies 15 09136 g004
Figure 5. Stratigraphic cross-section across the study area with wells and their production (screen) interval. The section path illustrated is in Figure 1. The wells “SZT-1” and “SZSZT-IX” were drilled within the framework of this study (modified after [1,28]).
Energies 15 09136 g005
Figure 6. Upper Pannonian sandstone core retrieved from well “SZT-1” at depth interval of 1970.7–1971.3 m.
Energies 15 09136 g006
Figure 7. Sedimentary structures identified in the core samples. (A) SZSZT_IX_08: Horizontal and of very fine sandy siltstone; (B) SZT1_20: Horizontal bedded coaly argillaceous marl and clayey coal; (C) SZSZT_IX_27_T: Structureless fine-medium grained sandstone with clay intraclasts; (D) SZT1_29_T2: Coalified plant fragment laminae in fine-medium grained sandstone according to the bedding direction; (E) SZT1_85_T1: Structureless medium-coarse grained sandstone.
Energies 15 09136 g007
Figure 8. Representative lithofacies characterisation of core samples collected from well SZT-1 (modified after [30]).
Energies 15 09136 g008
Figure 9. Photomicrographs of samples X. (a): chlorite grain in sandstone, (b): biotite, muscovite, and K-feldspar crystals in sandstone and metamorphic rock fragments, (c): fragmented micrite, fiber sparite, and plagioclase crystals in very fine-grained sandstone, (d): aleurite layer boundaries.
Energies 15 09136 g009
Figure 10. Histograms of (a) petrophysical parameters porosity, (b) logarithm of permeability (log K), (c) Flow Zone Indicator (FZI), and (d) grain density.
Energies 15 09136 g010
Figure 11. Clustering of Petrophysical Rock Types based on the histogram of Flow Zone Indicator (FZI). Based on the four modes of the histogram (red curve), four distinct Petrophysical Rock Types (PRT) can be classified.
Energies 15 09136 g011
Figure 12. Boxplots showing distribution of different physical and textural parameters: (a) porosity, (b) gas permeability, (c,d) compressional (vp) and shear wave velocity (vs), (e) grain density, (f) median grain diameter, (g) clay and fine silt content, (h) sand content. Black dots and * show the outlier data points.
Energies 15 09136 g012
Figure 13. XRD patterns of four Upper Pannonian sandstone samples based on Petrophysical Rock Typing (PRT). Sample numbers correspond to relevant PRT group number. Chl—chlorite; Sme—smectite; Kln—kaolinite; Mca—mica; Qz—quartz; Pl—plagioclase; Cal—calcite; Dol—dolomite. The intensity scale is the same for all patterns.
Energies 15 09136 g013
Figure 14. Scanning electron microscopy (SEM) images of samples from different Petrophysical Rock Types (PRT) groups in the same resolution: (a) PRT-4; (b) PRT-3; (c) PRT-2; and (d) shows a pore throat that is entirely filled with authigenic smectite in a sample from PRT-2.
Energies 15 09136 g014
Figure 15. Comparison of screen intervals (I to V), core sections, gamma ray (GR) logs, as well as Petrophysical Rock Typing (PRT) classes of wells SZT-1 and SZSZT-IX.
Energies 15 09136 g015
Table 1. Characteristics of wells close to “SZT-1” and “SZSZT-IX” located in Szentes (based on Bálint and Szanyi [1]).
Local Well IDNational Well IDEOV Y (m)EOV X (m)Drilling YearDepth
(m)
Production Interval (m)Bottom-Hole Temperature
(°C)
Production Rate (m3/year)
SZT-IK-498747,458149,539196419951800–197585154,860
SZT-IIK-562747,489149,493197018001640–179382150,850
SZT-IIIK-563746,484148,355197019921678–193678170,150
SZT-IVK-586747,234149,283197223032060–223596178,604
SZT-V/1K-640747,855150,857197922402040–221094134,800
SZT-V/2K-641747,800150,800197920001785–199384155,100
SZT-VI/1K-642749,981150,148197823982046–225597172,500
SZT-VI/2K-643749,982151,063197819981694–198986189,000
SZT-VII/1K-644747,112152,442197922572053–220596156,900
SZT-VII/2K-639747,111152,480197918061534–175476174,300
SZT-VII/3K-645747,101152,539198019981800–199880194,100
SZT-VIIIK-666749,166151,854198823002004–214390128,900
AL/1K-561741,347151,764196920501801–201985256,000
AL/2K-578742,231151,198197124012135–240194256,000
Table 2. Well parameters and coring properties of boreholes SZT-1 and SZSZT-IX.
Local Well IDSZT-1SZSZT-IX
National Well IDK-712K-707
EOV Y (m)748,464747,995
EOV X (m)149,886149,416
Drilling year20202020
Total depth—MD (m)20002009.2
Bottom-holetemperature (°C)92.888.0
Screen intervals (m)Top1934.01932.4
Bottom1981.41997.3
Coring intervals1Top1740 m1742.5 m
Bottom1749.25 m1755.38 m
2Top1930 m1835 m
Bottom1972.5 m1840.33 m
Average core recovery85.2%85.1%
Table 3. Descriptive statistical values of 121 tested petrophysical and textural parameters.
ParameterUnitMeanMedianStd. DeviationMinimumMaximum
Depth (RHO)(m)1882193893.517411971
Grain density (RHO_grain)(g/cm3)2.7102.7090.0152.6832.750
Porosity (PHI)(-)0.270.290.060.060.34
Permeability (K_Klink)(mD)6985965990.0012157
FZI(-)0.3150.3320.1760.0030.615
P-wave velocity (VP)(m/sec)2878282341620704921
S-wave velocity (VS)(m/sec)1840179128414773193
Median grain diameter (d50)(micron)1191245616221
Clay + fine silt content (CLAY+FSILT)(%)16.914.78.29.549.2
Sand content (SAND)(%)42.349.720.90.070.1
Table 4. Descriptive statistical values of each identified petrophysical rock type (PRT). The analysed parameters are defined in Table 3.
Statistical
Parameter
PRTRHO_grainPHIK_KlinkFZIVPVSd50CLAY+FSILTSAND
[g/cc][%][mD][-][m/sec][m/sec][micron][%][%]
Mean12.72513.340.360.017334722643632.07.8
22.71825.4861.90.131284018676518.922.5
32.70929.536490.3402746172012814.348.3
42.69829.4614990.5272862180517311.559.9
Std. Deviation10.0155.300.770.0157634561910.711.7
20.0132.4339.90.04422277223.813.4
30.0141.702830.055213127371.811.5
40.0092.424190.048258144331.76.6
Publisher’s Note: MDPI stays neutral with regard to jurisdictional claims in published maps and institutional affiliations.

