
A Resilient Prosumer Model for Microgrid Communities with High PV Penetration
by
 , ,
, ,
Kihembo Samuel Mumbere
1,
Yutaka Sasaki
1,*,
Naoto Yorino
1,2,
Yoshifumi Zoka
1,
Yoshiki Tanioka
3 and
Ahmed Bedawy
1,4 1
Electric Power and Energy Systems Laboratory, Graduate School of Advanced Science and Engineering, Hiroshima University, 1-4-1 Kagamiyama, Higashihiroshima 739-8527, Japan
2
National Institute of Technology (KOSEN), Kure College, 2-2-11 Agaminami, Kure 737-8506, Japan
3
Chudenko Co., 6-12 Koamicho, Naka-ku, Hiroshima 730-0855, Japan
4
Faculty of Engineering, South Valley University, Qena 83523, Egypt
*
Author to whom correspondence should be addressed.
Energies 2023, 16(2), 621; https://doi.org/10.3390/en16020621
Submission received: 1 December 2022
/
Revised: 22 December 2022
/
Accepted: 27 December 2022
/
Published: 4 January 2023
(This article belongs to the Special Issue Next-Generation Energy Systems: Towards Sustainable and Resilient Microgrids)
Abstract
:Worldwide energy shortages and the green energy revolution have triggered an increase in the penetration of standalone microgrids. However, they have limited generation capacity and are wasteful when excess generated energy is curtailed. This presents an opportunity for the coordinated operation of multiple prosumer microgrids that absorb this waste to enhance their resiliency and reliability. This paper proposes a reliable prosumer model with an inbuilt energy management system (EMS) simulator that considers the mentioned deficiencies for constructing resilient interconnected prosumer microgrids. The EMS simulator operates in a real-time dynamic environment to coordinate the prosumer components and performs flexible switching for (1) prioritizing critical load by shedding the non-critical load and (2) meeting load demand locally or from other interconnected prosumers. The EMS simulator maintains energy balance by setting limits for the battery energy storage system (BESS) to preserve energy during low generation and performs real-time monitoring. The novelty of this model lies in its simplicity and flexibility, which allows interconnected prosumer microgrids to operate in cooperation without the need for communication. The proposed model is evaluated in a post-disaster off-grid scenario using a single-phase average value model that considers reasonable computation time. The simulation results of the proposed system indicate the preservation of stored energy while maintaining critical resources beyond three days of poor weather conditions.
1. Introduction
1.1. Background and Motivation
The drive towards net-zero carbon emissions remains an important goal for governments worldwide. Recent statistics shared in [1,2,3,4] indicate the growth of renewable technologies globally, both as standalone entities that produce and consume energy (prosumers) and as small-scale shared energy sources such as photovoltaic (PV) power generations, often termed distributed energy resources (DERs). The authors attribute this progress to the reduced costs of production driven by market growth and the adoption of supportive policies.
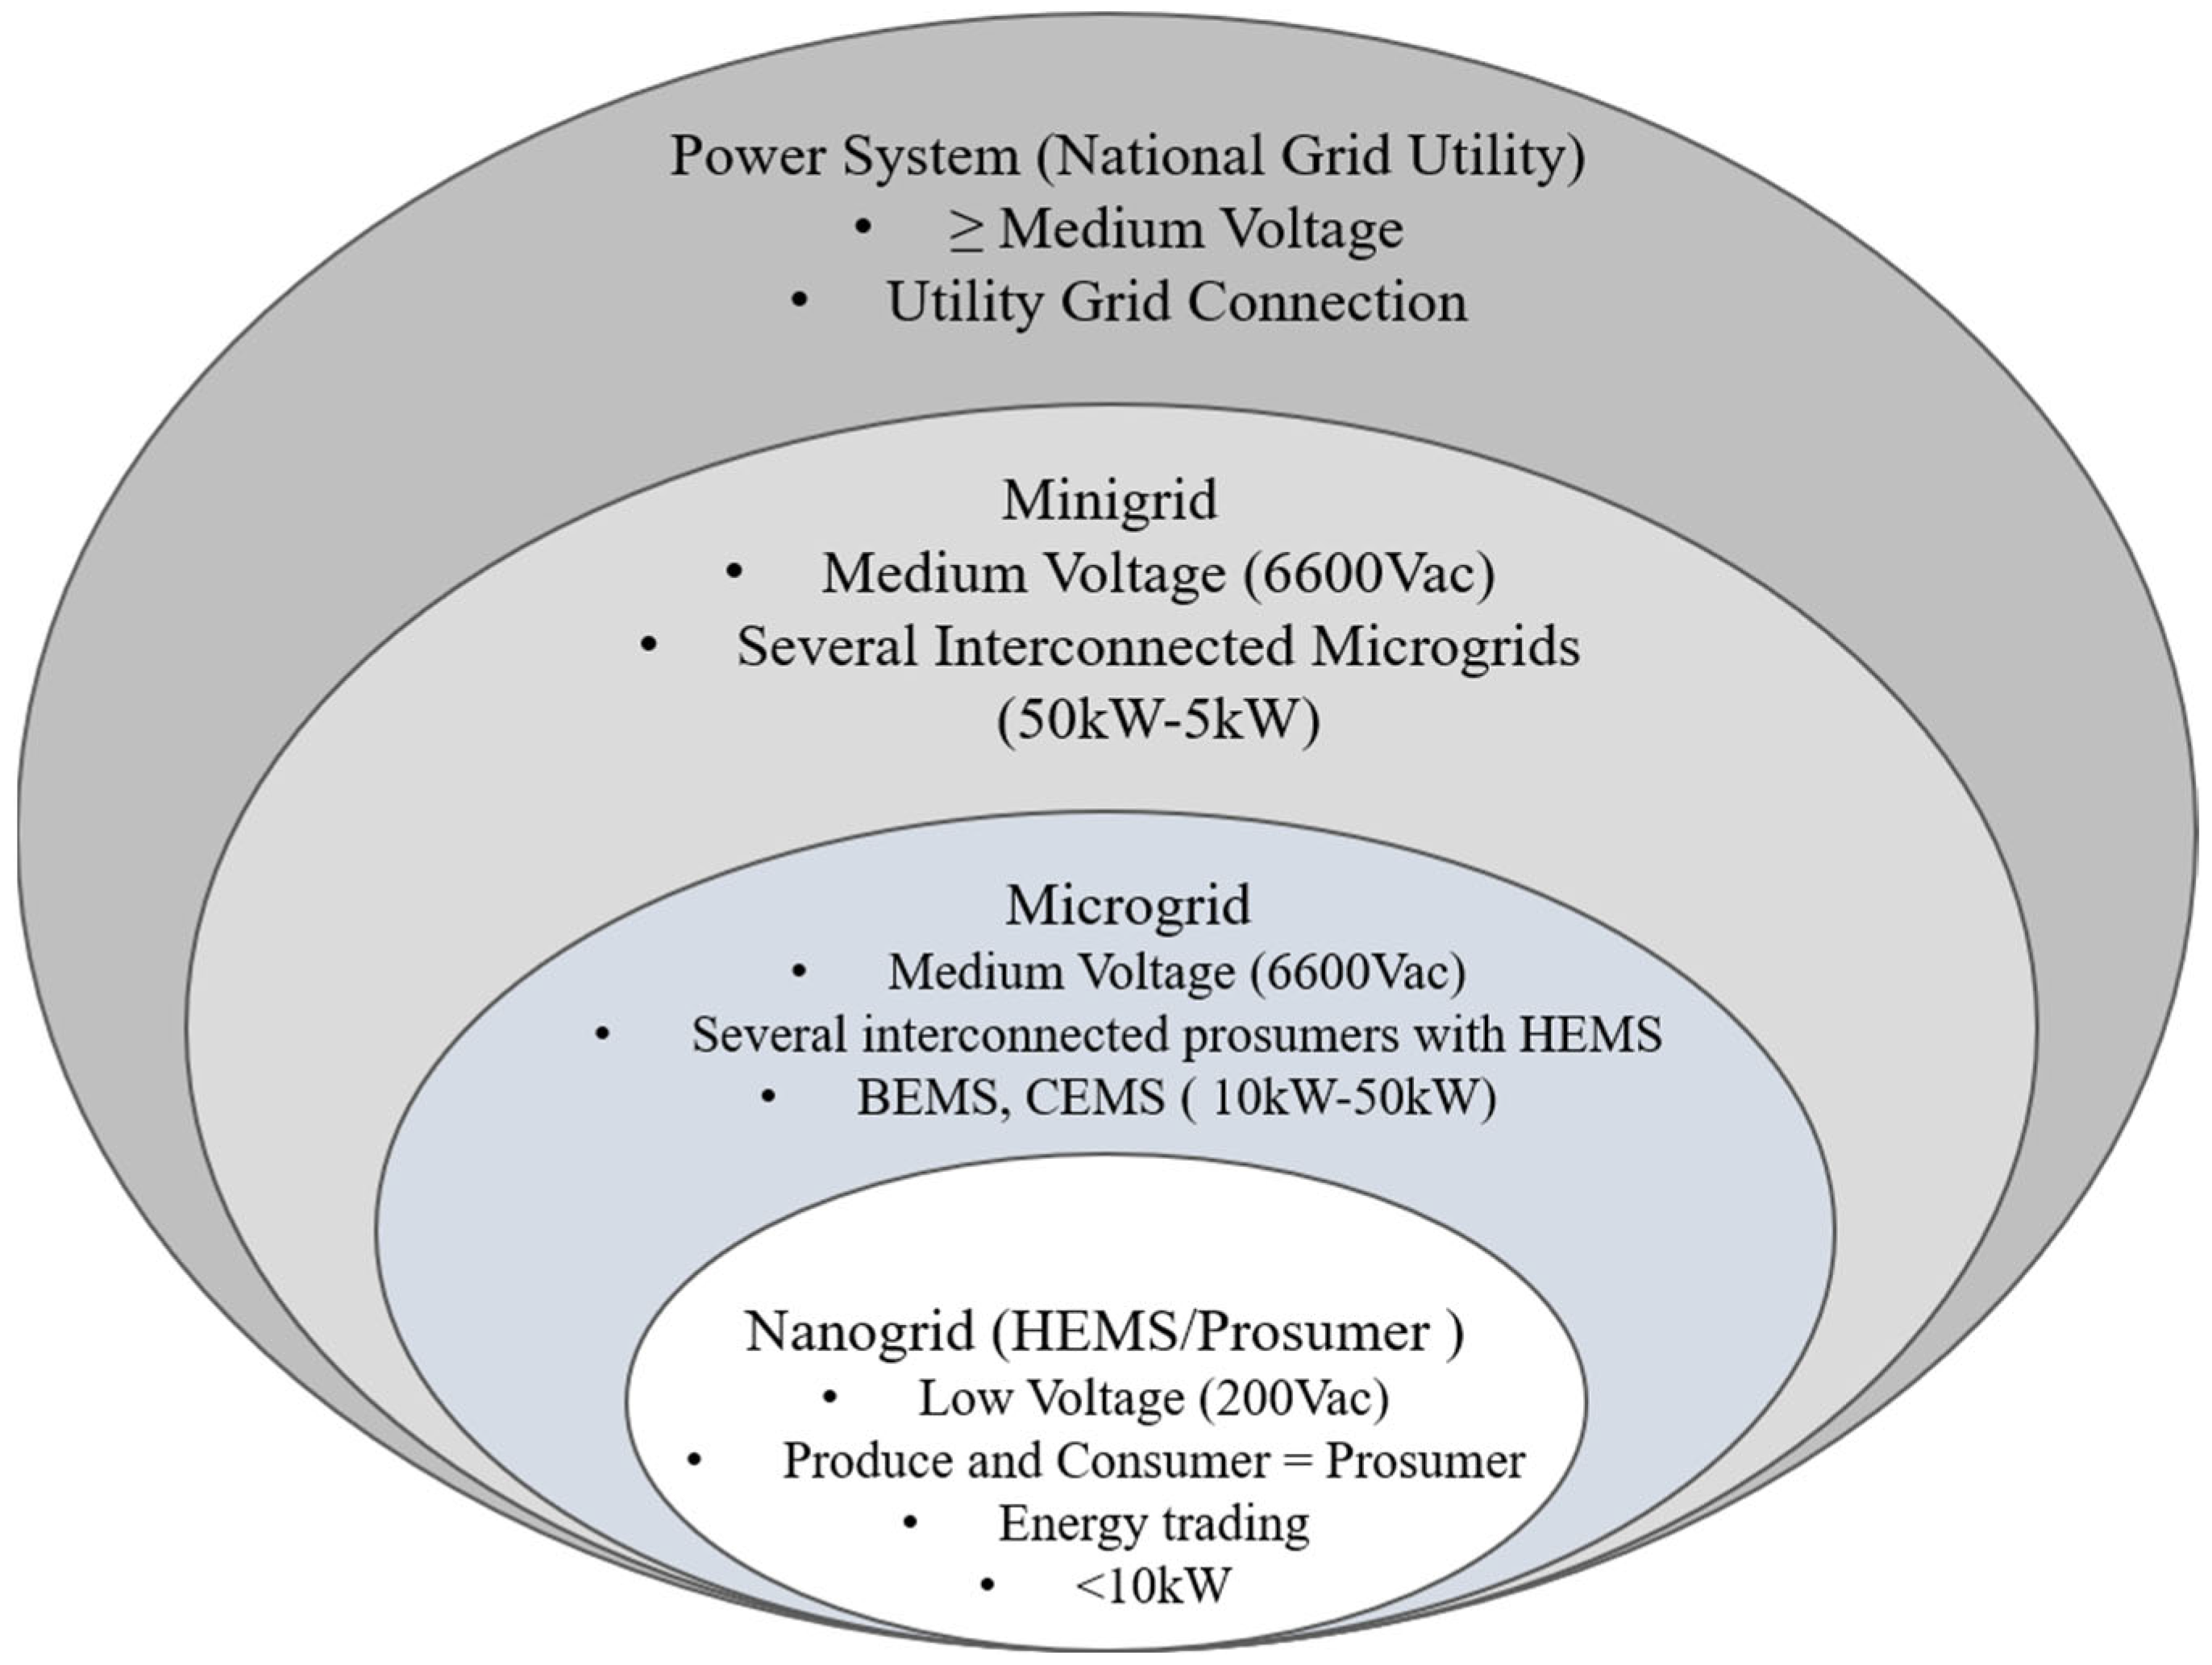
The integration of DERs that include renewable energy sources, loads, and BESSs that operate collectively as controllable units is termed a microgrid [5,6]. Microgrids can range from simple and small to complex and large. A review of existing DER literature in [7,8] reveals that the terms microgrid and minigrid are often used interchangeably. However, various authors agree that the key differentiator is the size and capability of the DER. Since there is no standard classification of the microgrid in terms of capacity or capability, this article’s authors attempt to classify the position of the proposed model in terms of capacity, size, and capability in relation to a power system in Figure 1. A nanogrid refers to home energy management systems (HEMS). While HEMS systems that are grid-connected but do not sell power to the grid exist, this literature defines the HEMS equivalent prosumer referenced in the article as capable of two-way power flow in its grid connection.
Researchers in [9,10,11] observe that increased penetration of DERs derives challenges, manifesting as voltage and frequency fluctuations, phase mismatches, and supply–demand imbalances that could disrupt power systems and effectually reduce their reliability. Despite these challenges, many researchers contend that as a clean inexhaustible energy source, with their ease and inexpensive deployment cost, and characteristic storage ability through their battery energy storage systems (BESS), DERs still offer a formidable solution. Various deployments as standalone solutions and supplements to consumer grid networks are increasingly prevalent and have proved beneficial to bridging the energy generation gap.
Concurrently, authors in [12] observe that interconnected systems offer the advantages over standalone systems of improved resilience and reduced energy losses, thus cost-saving through sharing resources. Particularly, the resiliency characteristic of DERs is essential to power system collapse prevention during planned and unplanned shutdowns [13]. Unplanned outages are becoming increasingly common worldwide, caused by natural disasters, common faults, and, more recently, cyber-attacks. The authors have shared accounts of disaster-related power outages in [14,15,16,17], detailing immense losses to the affected communities. These researchers cast light on the lack of resilient power systems characterized by emergency backup systems to grid power supply should a disaster occur. Various authors have proposed solutions to improve the reliability of the grid, for example, the scheduled generation dispatch proposed in [11,13].
The authors extensively explored the concept of “resilience” in [15,16], who define a resilient power system as flexible, robust, adaptable, and resourceful with prediction capabilities. Moreover, the importance of storage systems is amplified to be critical to resilience as energy market concept recognition grows. Noteworthy is the dependence of DERs on external factors such as weather, which implies that, short of prediction methodology, their BESS’s measured state of charge (SOC) is the true measure of the guaranteed output power for a particular period. Therefore, the proposed prosumer model considers BESS SOC as the basis for the resulting energy management system’s decision-making process. Within this context, the proposed prosumer model and EMS ensure demand and supply balance in standalone and interconnected prosumer modes while controlling system characteristics.
Microgrid operators often require approximate models of the basic system components which manifest real system characteristics to design feasible interconnected power systems. These approximate system models serve as test systems to iron out typical system installation-related issues, including human errors, inconsistencies, cost, and time [18]. Therefore, if they were simplified, more flexible, and able to run fast and accurate simulations, they would greatly aid the design process. Consequently, the developed prosumer model adopts approximate average value models that significantly allow for reduced ‘practical’ simulation time during long steady-state simulations.
1.2. Related Works
The authors in [6,19,20] present an overview of microgrid architectures, definitions, and control strategies in their definition of the single-bus topology adopted for this article as the commonly used topology in microgrid systems. These authors also document the concept of the prosumer model, at times referred to as a HEMS and commonly known as a residential microgrid. Table 1 and Table 2 present a summary of the proposed models from various researchers selected for their close relation to our proposed model in terms of type, objective, and key control parameters.
Arani et al. in [21] contend that microgrids are low- and medium-voltage network distribution systems where the growth rate for the residential-type prosumer model type is rapid. Their observation motivates this article’s single-phase approach to the inverter and load modelling. In addition, an analysis of the published research in the two tables points to little attention from researchers on single-phase modelling, with most of the research focusing on three-phase systems, further warranting our proposed approach. In some of this literature, researchers do not indicate the load types.
The literature review also shows that little emphasis has been put on load model designs regarding mixed loads and exploring possibilities of partitioned loads for improved load management. While some authors [22,23] include load shedding as part of their control algorithms, only Michaelson et al. in [24] apply load shedding by separating it into critical and sheddable non-critical loads. However, this author opts for an arbitrary load profile to demonstrate the performance of the proposed algorithm, thus leaving their feasibility in practical situations to question. Other authors explored a re-schedulable load modelling approach to supply and demand balance which is demonstrated to even the balance curve. Still, these authors ignore the control of characteristics such as frequency control, voltage control, and phase matching of the generated load current and supply voltage that lead to power loss and system instability.
Furthermore, in modelling their prosumer models, it is observed from Table 1 that the objective of the research biases the design of the microgrid model. For example, the authors in [22,23,25], whose objective is reducing the electricity bill’s cost, assume a balanced system to perform optimized outcomes and thus ignore the characteristics of the electrical components. This exclusion of system characteristics results in the inaccuracy of the results of the proposed control algorithms. The papers with detailed voltage source controllers (VSCs) in [26,27] either consider only active load or are three-phase VSC approaches, such as in [28,29]. Most models from these tables that focus on pricing implement long duration, i.e., 24 h or more, using average value VSC simulation designs but ignore system characteristics.

Table 1.
Summary of Related Works: Objectives and model.
| References | Objectives | Model | |||
|---|---|---|---|---|---|
| PV and BESS | VSC Type | Load | Grid Connected | ||
| [22] | Load scheduling for a reduced bill | ✓ | Average | Active | ✓ |
| [23] | Load scheduling for a reduced bill | ✓ | Average | Active | ✓ |
| [24] | Increase uptime | ✓ | Average | Mixed 1 | ✕ |
| [25] | Load scheduling for a reduced bill | ✓ | Average | Active | ✓ |
| [26] | Demand and supply balance | ✓ | Detailed | Active | ✕ |
| [27] | Demand and supply balance | ✓ | Detailed | Active | ✕ |
| [28] | Demand and supply balance | ✓ | Detailed | Mixed 1,2 | ✓ |
| [29] | Demand and supply balance | ✓ | Detailed | Mixed 1 | ✕ |
| [30] | Demand and supply balance | ✓ | Average | Mixed 1 | ✓ |
| [31] | Power flow control by day-ahead scheduling | ✓ | Detailed | Mixed 2 | ✓ 3 |
| [32] | System stability by treating BESS thermal constraints | ✓ | Detailed | Active | ✕ |
| [33] | System stability in grid-forming applications | ✓ | Detailed | Mixed 2 | ✓ |
| The proposed method | Energy preservation during low generation periods | ✓ | Average | Mixed 2 | ✓ |
1 Three-phase, 2 Single-phase, 3 Buying.
Table 2.
Summary of Related Works: Control Parameters and Features.
| References | Control Parameters and Features | Disaster Consideration | |||
|---|---|---|---|---|---|
| Voltage/Frequency/ Phase Control | Energy Sharing | Load Shedding | PV Curtailment | ||
| [22] | N/A | ✕ | ✓ | ✓ | ✕ |
| [23] | N/A | ✕ | ✓ | ✓ | ✕ |
| [24] | ✕ | ✕ | ✓ | ✓ | ✕ |
| [25] | N/A | ✓ | ✓ | ✓ | ✕ |
| [26] | ✓ | ✕ | ✓ | ✓ | ✕ |
| [27] | ✓ | ✕ | ✕ | ✕ | ✕ |
| [28] | ✓ | ✕ | ✕ | ✕ | ✕ |
| [29] | ✓ | ✕ | ✕ | ✕ | ✕ |
| [30] | ✓ | ✕ | ✕ | ✕ | ✕ |
| [31] | ✕ | ✕ | ✕ | ✕ | ✕ |
| [32] | ✓ | ✕ | ✕ | ✕ | ✕ |
| [33] | ✓ | ✓ | ✕ | ✕ | ✕ |
| The proposed method | ✓ | ✓ | ✓ | ✓ | ✓ |
By comparing this existing literature in Table 2, we observe the inconsideration of energy sharing and increasingly often disaster occurrences in the model designs. Considering the rising applicability of energy-sharing systems to create the so-called energy markets, energy sharing, with a bidirectional flow of power to and from the prosumer’s installation, is imperative. However, few authors, such as [25], consider this advancement in the prosumer model. The popularity of energy sharing is not just a result of the interrelated financial gain but also a recently popular method for guaranteeing power security against disasters. As disasters are increasingly common, their consideration in prosumer designs, simulations, and test scenarios would significantly improve the results. Accordingly, our proposed prosumer model employs load shedding, PV curtailment (PVC) as demand and supply balancing methods, and voltage and phase matching control during long steady-state simulations to ensure fast disaster recovery.
DERs are essentially powered electronic systems supported by information and communication technology applications. Therefore, as DER penetration into grid networks increases, part of the role of the EMS is to ensure smooth synchronization when integrated. Phase-locked loop (PLL) techniques are increasingly popular in synchronizing, monitoring, and controlling grid-connected inverter-based DERs. PLLs are preferred because they are typified by frequency, phase angle, and amplitude detection of the system voltage to ensure the correct generation of a matched local reference current signal. This allows matching the inverter current phase angle with the grid voltage phase angle to obtain a power factor close to unity [34]. To this effect, PLLs of different types have been proposed by various researchers to synchronize the injected current with the grid voltage. These techniques include time delay PLL, inverse park transform PLL, enhanced PLL, and second-order generalized integrators (SOGI)-PLL, among others. Amongst these, the SOGI-based PLL is popular in single-phase applications, given its harmonic rejection capability, high accuracy, and fast response to grid variations [35,36]. However, a quadrature signal generator (QSG)-SOGI is still unstable when its input signal contains frequency harmonic currents and other harmonic components, as deliberated by the authors in [37]. Therefore, the authors of this article implement the double SOGI-QSG PLL to match the generated current phase angle to the prosumer supply voltage. The double QSG is preferred for its improved harmonic rejection while maintaining simplicity [38], which enables its fast response during switching and grid variations hence its applicability in long-duration simulations
1.3. Contributions
This study is an extension of the authors’ previous research [39,40,41,42,43,44,45,46,47] published in various proceedings. The study develops a compressive prosumer model with an inbuilt EMS simulated with MATLAB/Simulink Simscape. The contributions are summarized below:
- Development of a prosumer model that includes PV generation, BESS, and electricity load and can flexibly change its mode of operation according to supply and demand conditions. The prosumer model incorporates further characteristic functions to complement its operation that include:
- A PVC function that prevents excess generation;
- DC bus voltage control by using a proportional integrator (PI) controller;
- An improved electricity mixed load model based on actual measurement data using a SOGI-QSG PLL for phase matching;
- System power security by separating critical and non-critical load through the non-critical load shedding (NCLS) function.
- Construction of an EMS simulator that operates in a real-time dynamic environment to coordinate the prosumer components and perform the following functions:
- Flexible load switching (FLS) function where the local generation meets the demand or the demand switches to the external supply from cooperating prosumers during an emergency, within the set BESS limits;
- Real-time monitoring, observation, and an alert warning system for system operation by creating a colour-coding scheme for each operating mode.
The resulting system is a simple, flexible average value model that allows for the interconnection of prosumers to form microgrids that operate in cooperation without the need for communication, thus reducing the cost. In addition, potential revenue can be realized from participating entities if cost incentives are included.
1.4. Paper Organization
The rest of the article is organized as follows: In Section 2, the proposed prosumer model with a detailed description of the comprised components and its control scheme is presented; in Section 3, the simulation design is presented, including the proceeding simulation results and their discussion; finally, Section 4 concludes this article.
2. The Prosumer Model and Control Scheme
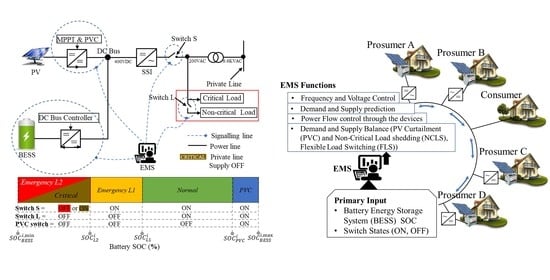
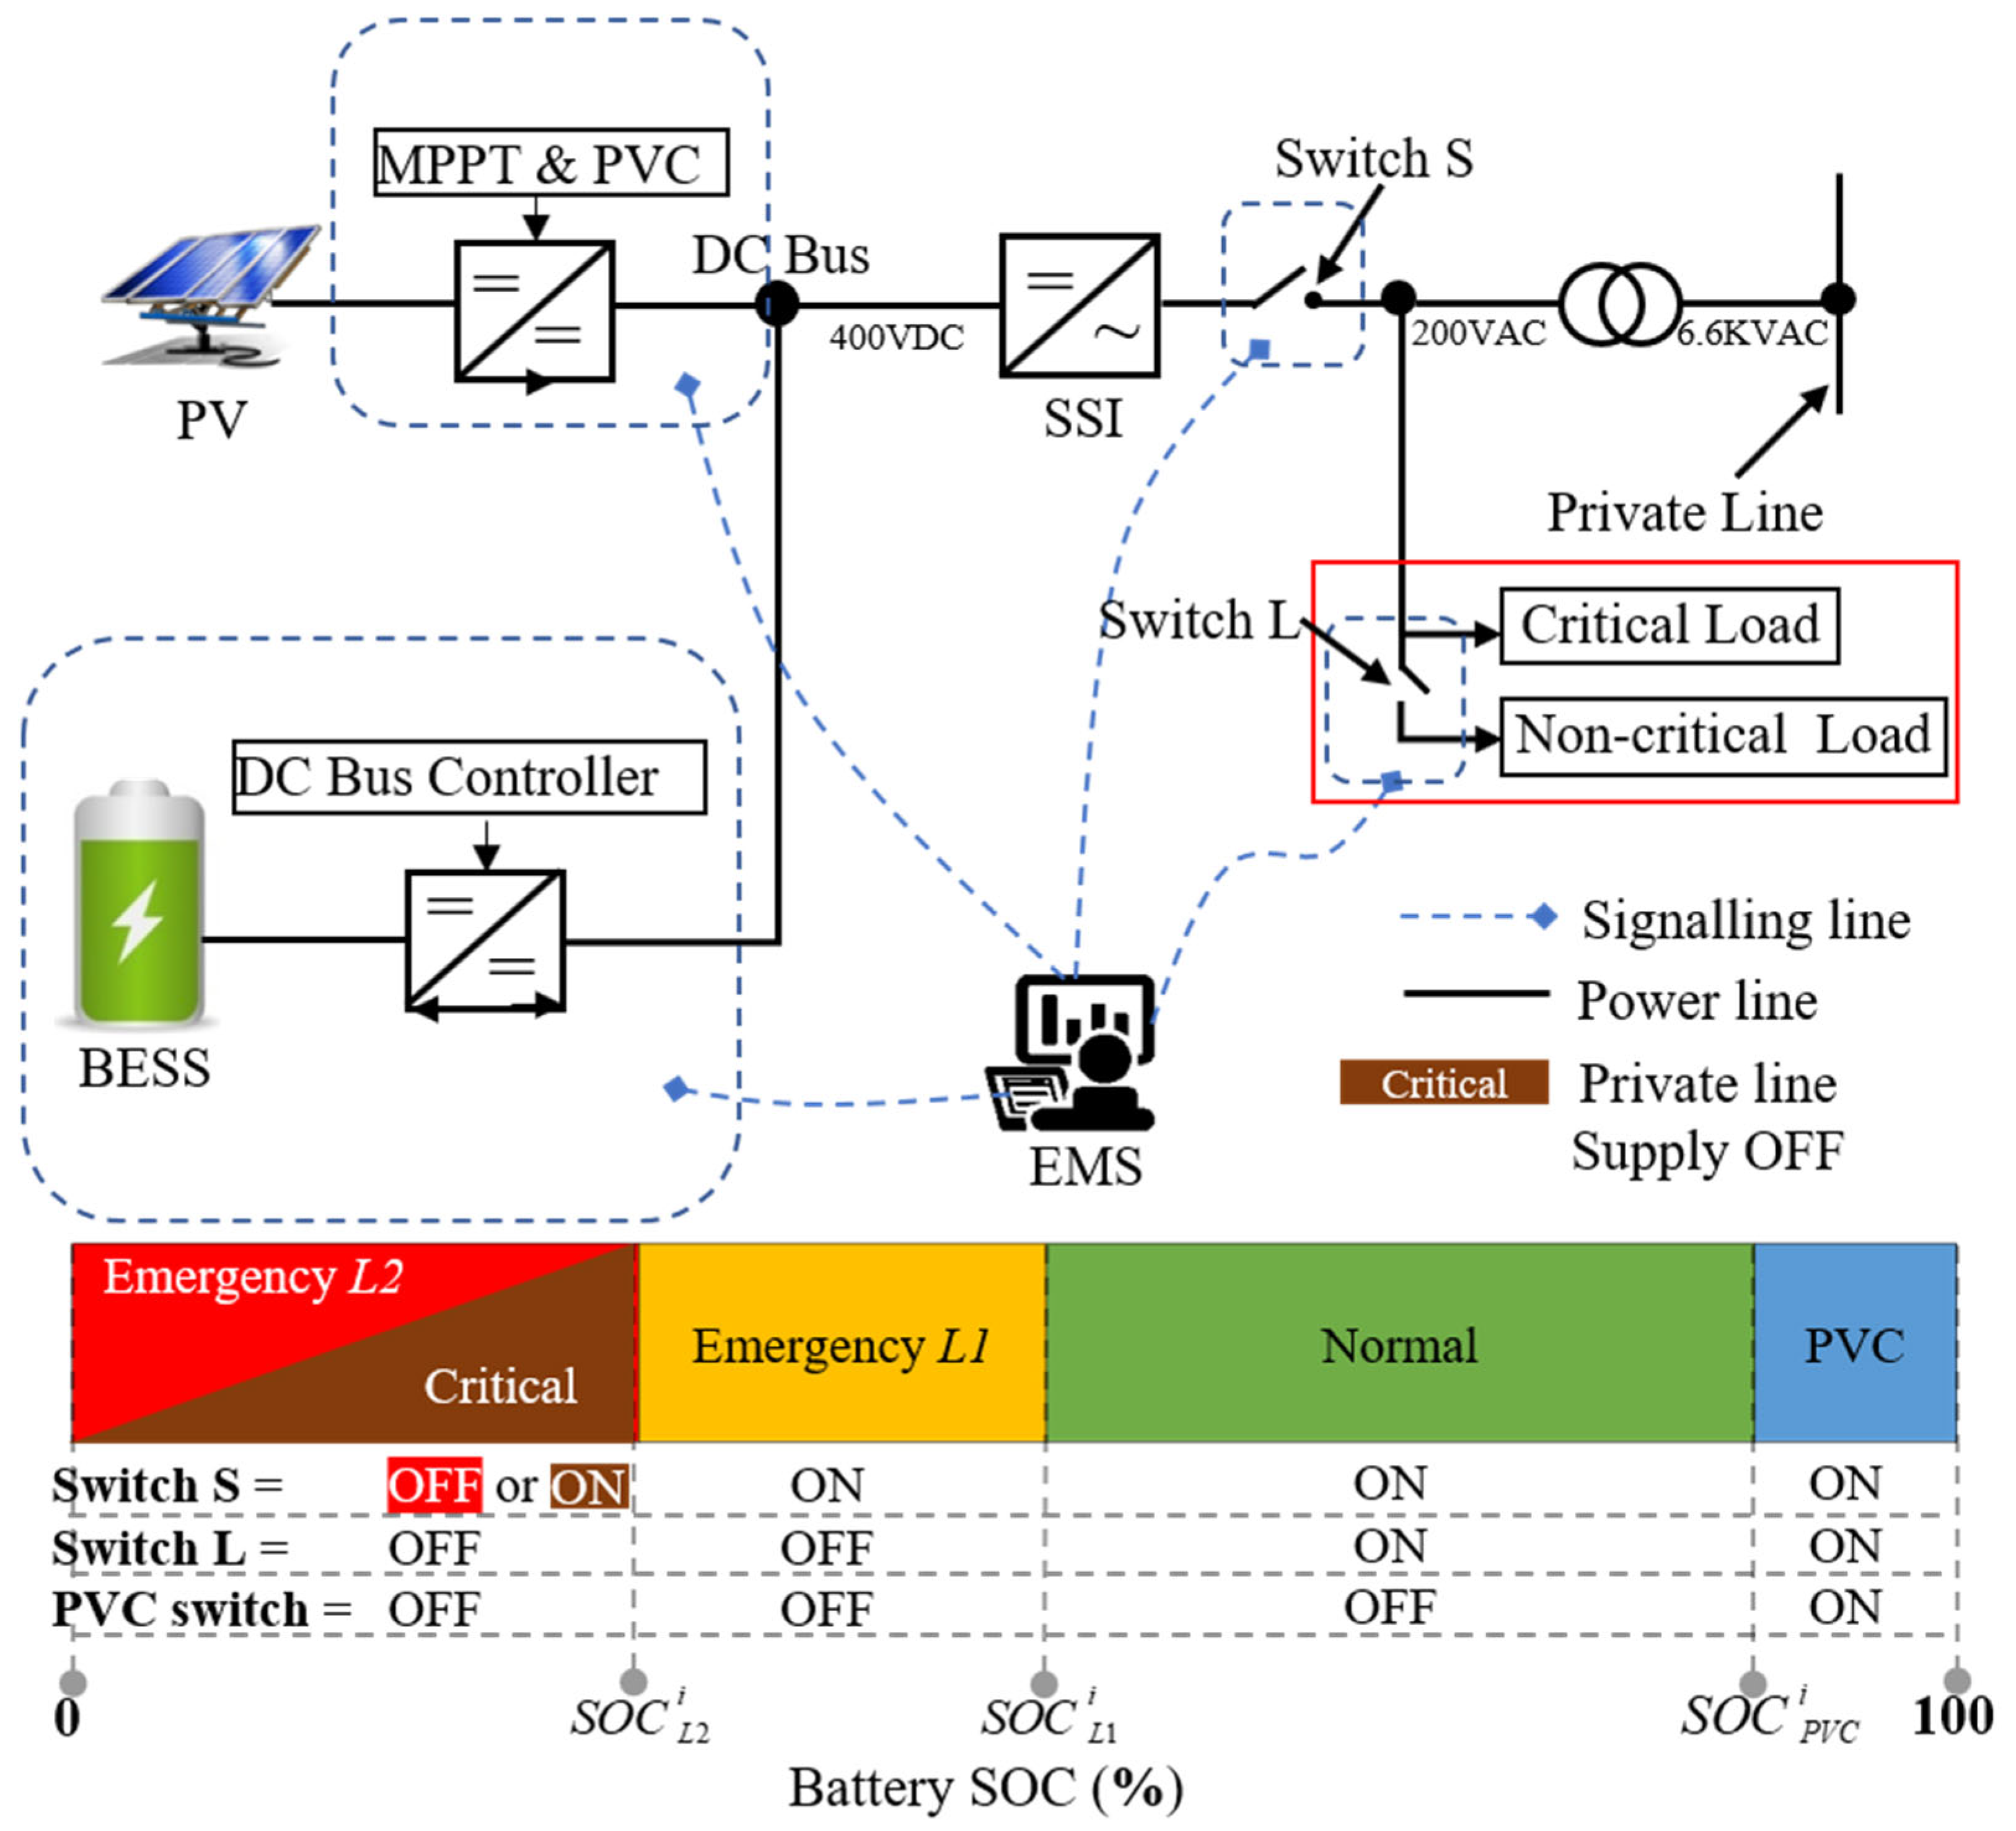
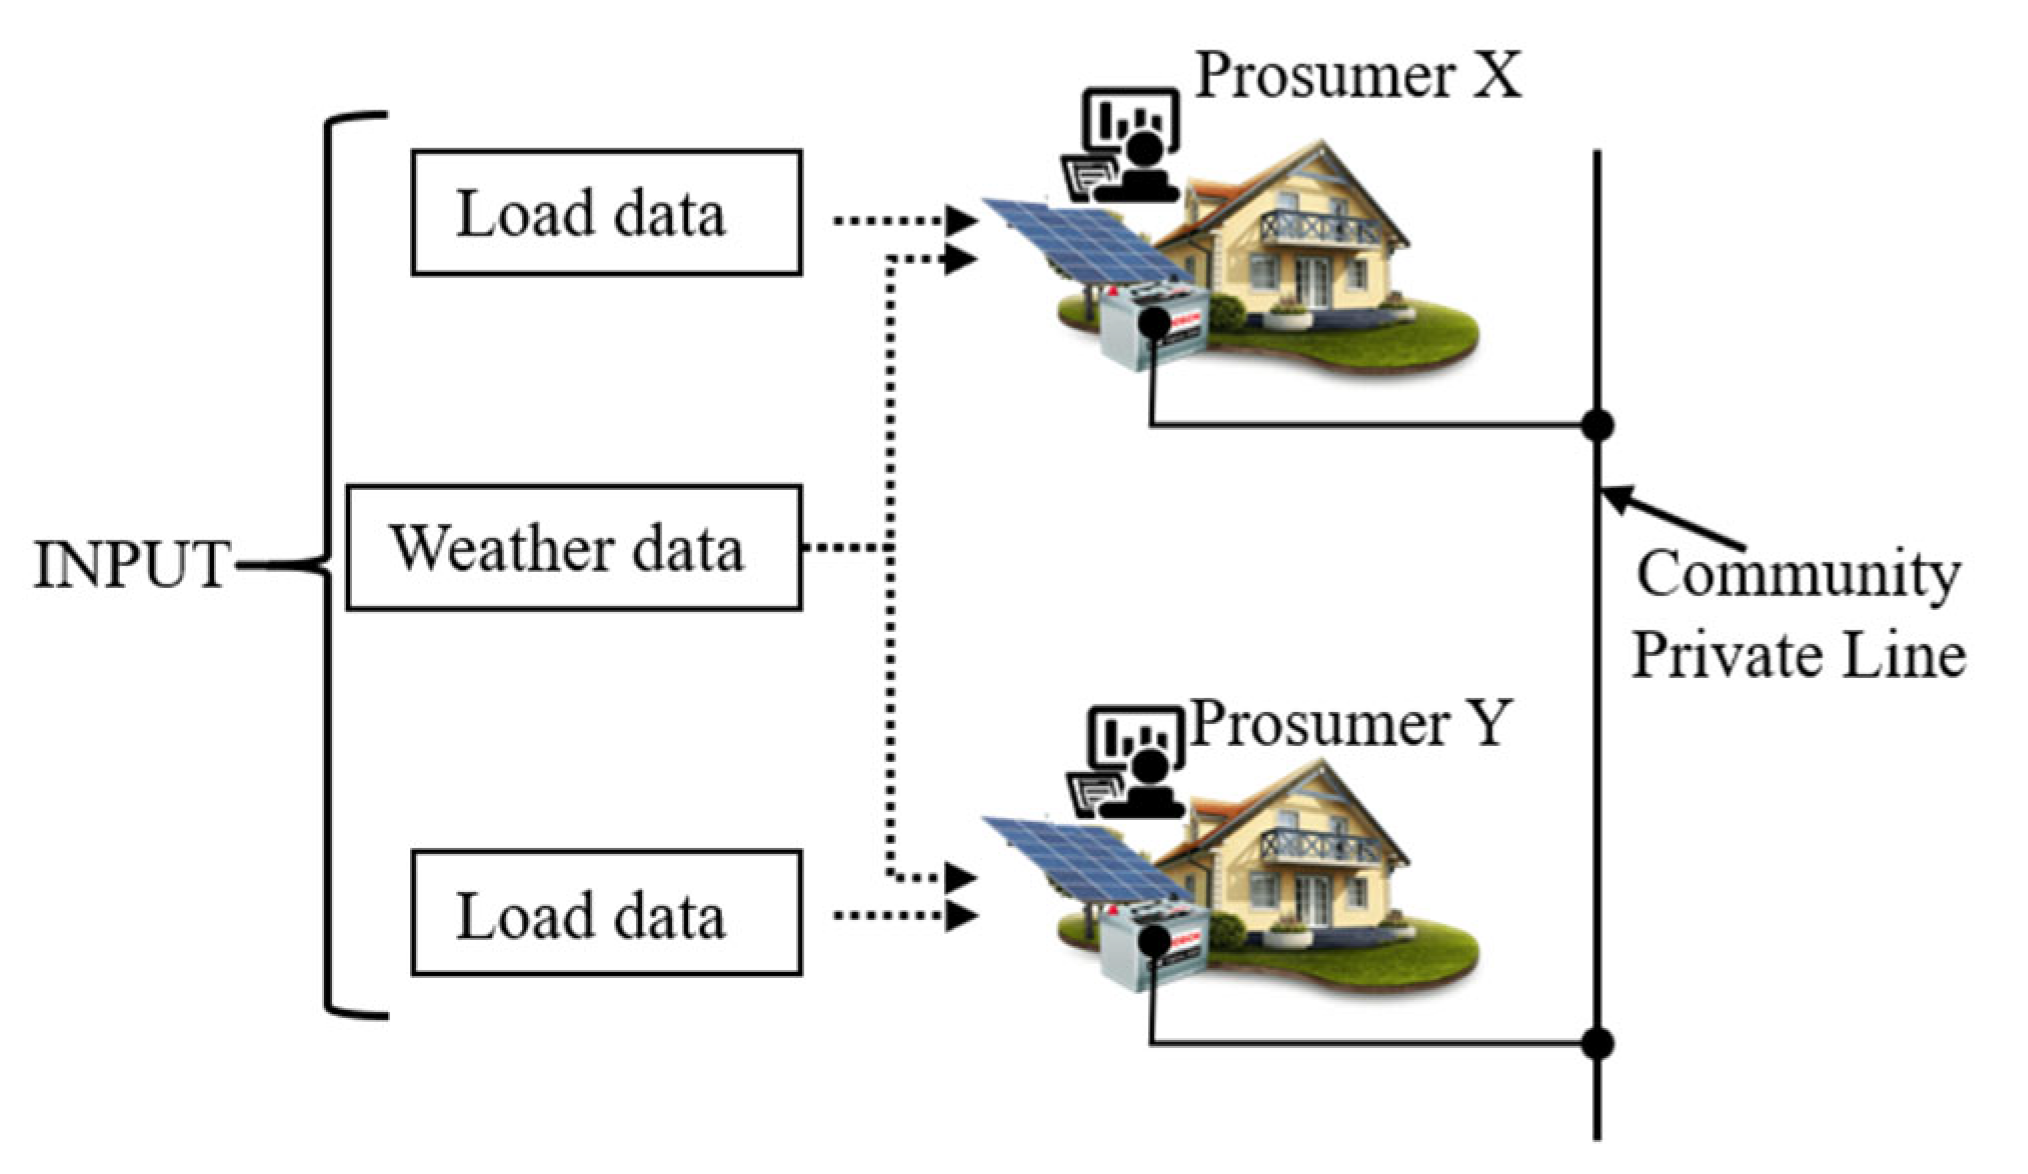
Figure 2 depicts the architecture of the adopted prosumer model. The structure consists of a PV system with maximum power point tracking (MPPT) control to maximize power generation as the primary power source and a BESS to store excess generation and support the control of the DC bus to a constant 400 Vdc reference to which they both connect. Several converters, as depicted in the figure, are used. A unidirectional DC–DC converter (boost type) steps up the generated PV system voltage to 400 Vdc, the reference voltage of the DC bus. A bidirectional DC–DC (buck–boost) converter enables a two-way power flow to and from the BESS. The single-phase VSC synchronous inverter from [33] converts the DC bus voltage, 400 Vdc, to 200 Vac, 60 Hz. This voltage supplies an adjustable single-phase load apportioned into non-sheddable critical and sheddable non-critical loads through switch L (NCLS function). The proposed prosumer model can interconnect with other prosumers on a private line or grid for bidirectional energy sharing through an ideal transformer. Switch S implements the FLS function, where the demand can be met locally or from the private line, depending on the operating mode, while switch L implements the NCLS function.
2.1. The Battery Energy Storage System (BESS)
The BESS consists of the battery, its bidirectional DC–DC converter, and a DC bus controller. The battery model is adopted from MATLAB/Simulink. The battery is assumed to operate between 10% and 90% SOC for consistency in the battery characteristic and to avoid overcharging and over-discharge, synonymous with reduced battery life. Lead-acid type batteries are selected for their competitive cost and popularity. However, all other battery operation-dependent factors such as temperature and power density are not considered as the focus is mainly on the SOC.
The battery is connected to a bidirectional DC–DC converter that enables charging and discharging battery operations. The converter is of average value type, consisting of controlled current and voltage sources. A duty cycle is generated by comparing the DC bus reference voltage and measured voltage using a PI controller. As a result, the DC bus is maintained at 400 Vdc. Equations (1) and (2) below represent the BESS and its DC bus controller’s constraints.
- i.
- Limitations of the BESS SOC (%):
- ii.
- Upper and lower bounds of DC bus voltage (V):
2.2. The PV System
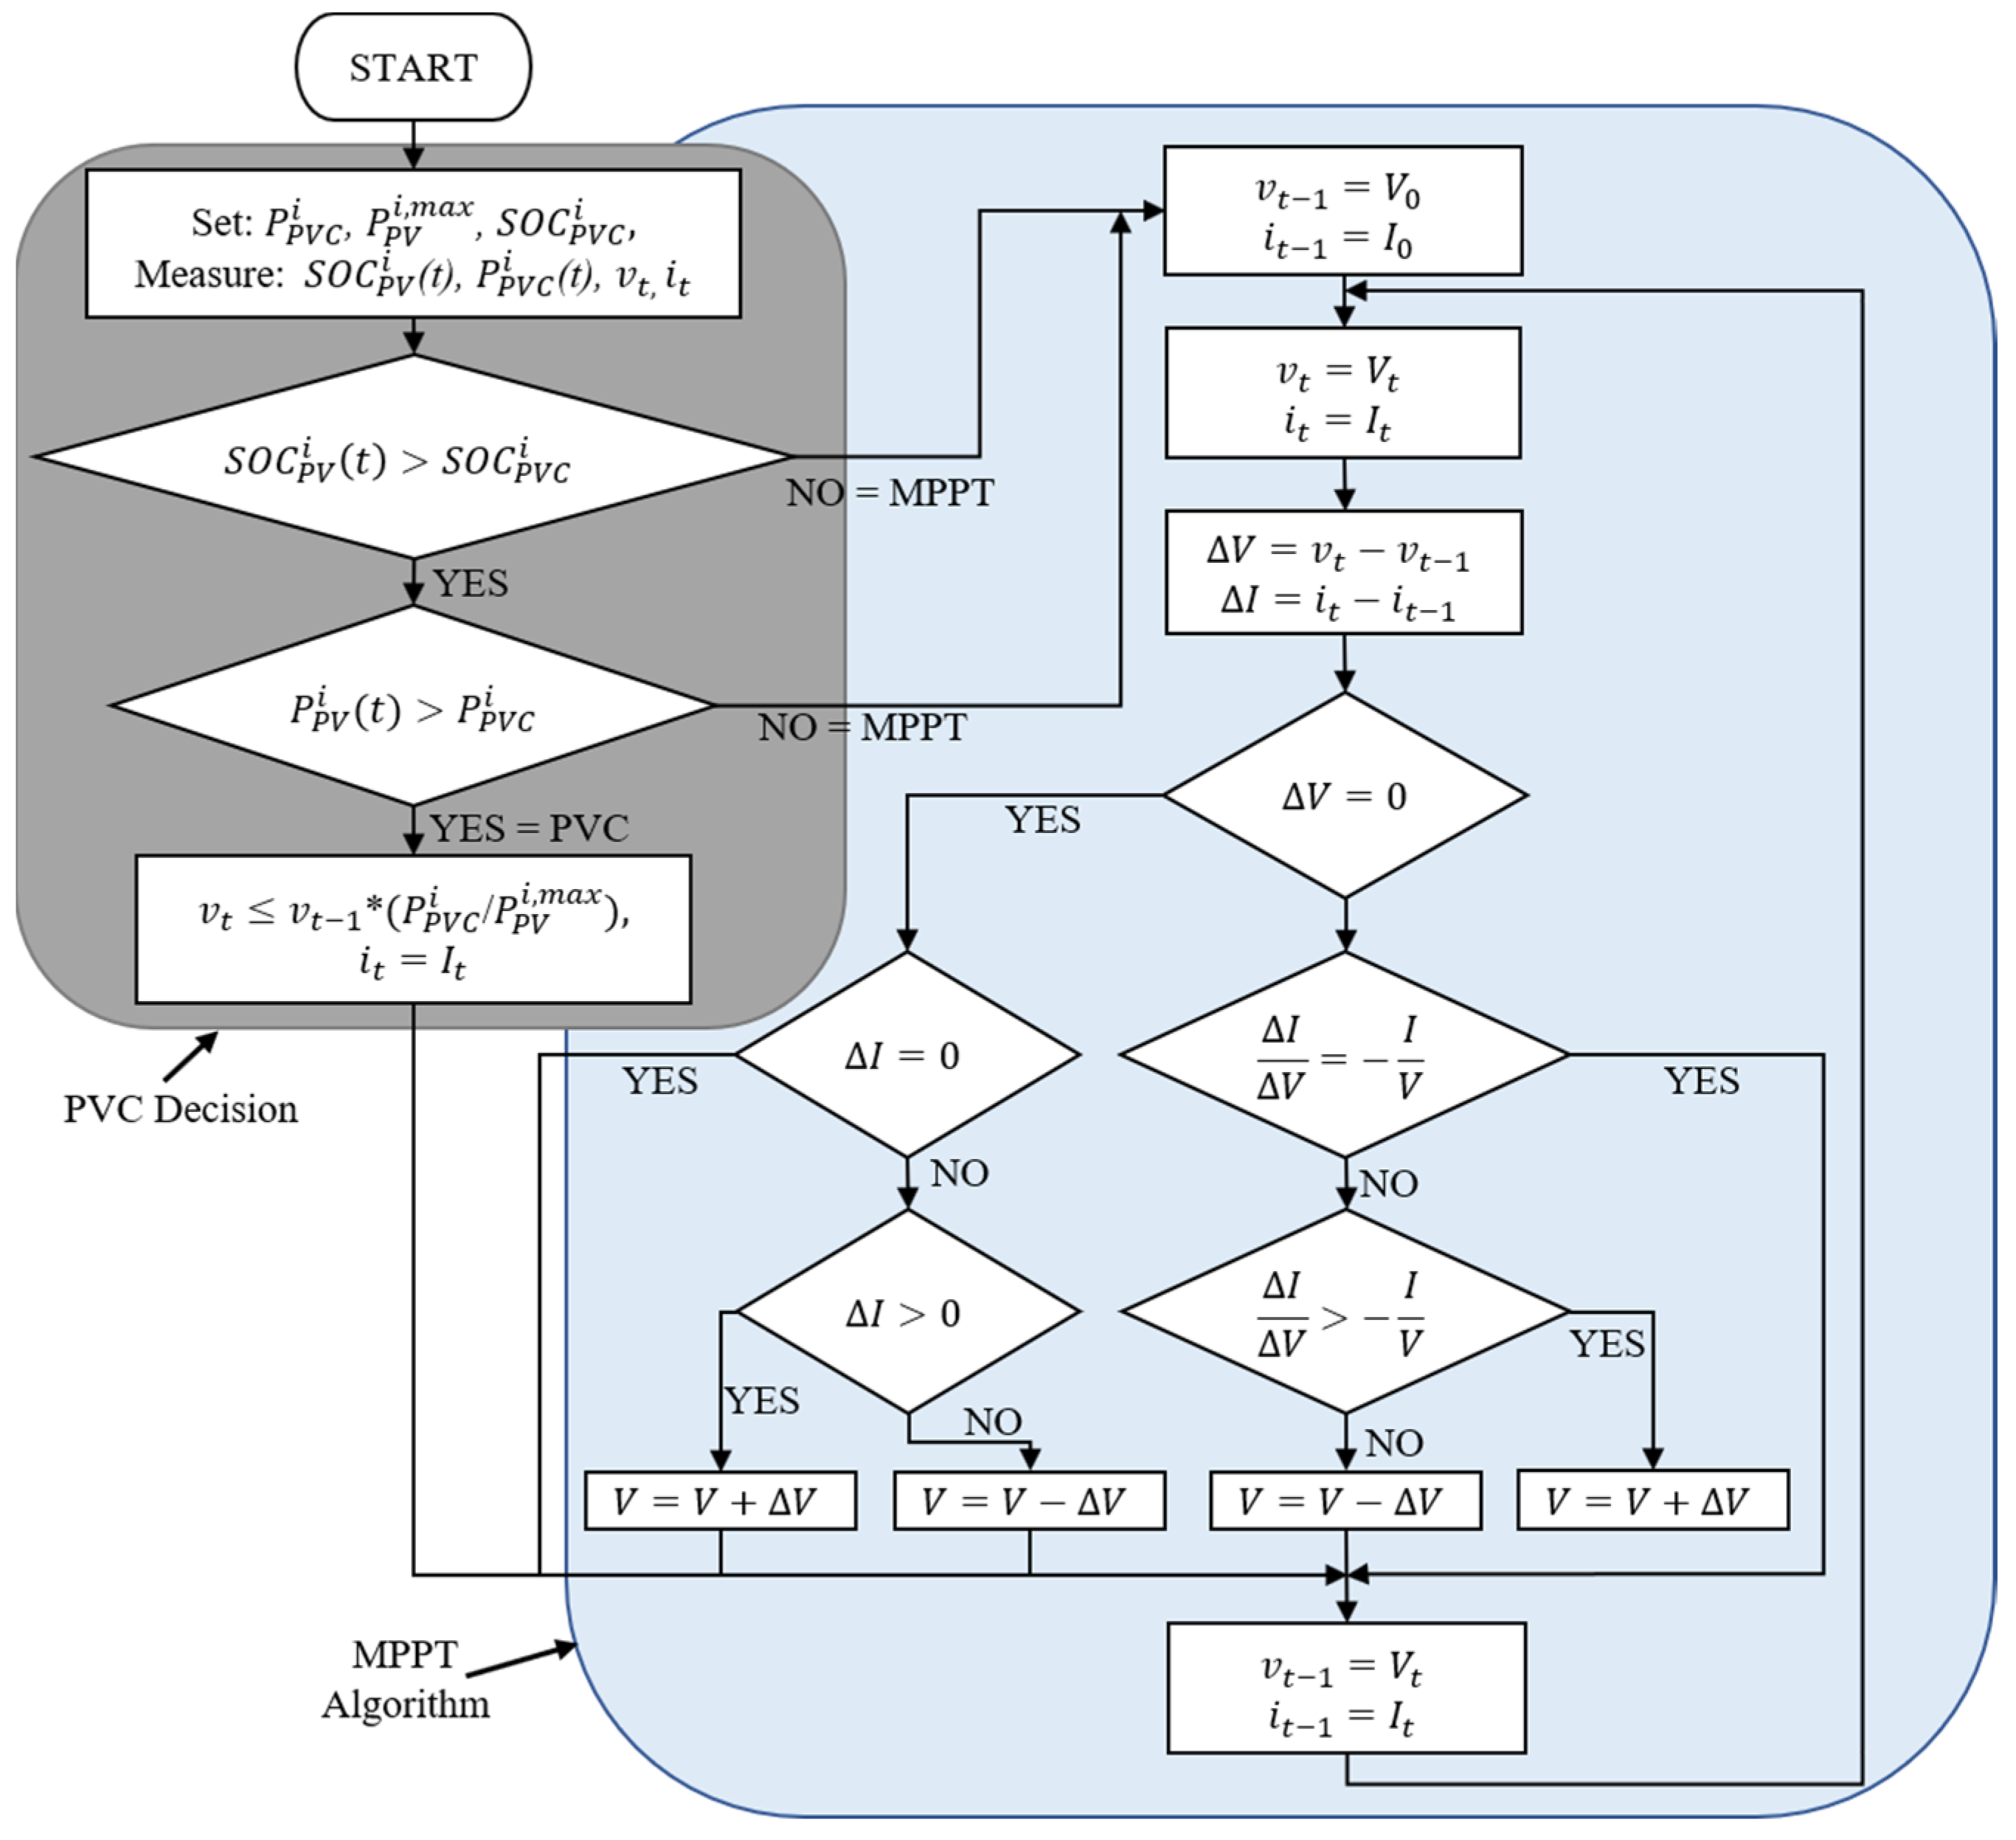
The PV array model from MATLAB/Simulink that inputs temperature and irradiance data to generate the I-V characteristic is used. The input to the PV array is 5-minute data that is interpolated into one-minute data. An array of 3 modules connected in parallel, each string consisting of 13 modules connected in series, is adopted. The output of the PV array is a voltage and a current . The resulting system has a rated output of 7.5 kW. The PV system is fitted with an MPPT controller whose algorithm is shown in Figure 3, which maximizes the PV output based on the incremental conductance algorithm. This algorithm follows the principle that the PV characteristic curve has a gradient zero at MPP, which results in Equation (3).
The incremental inductance algorithm is a typical algorithm shown in Figure 3 where and are the instantaneous voltage and current, and and are the values from the previous time step. The MPPT controller generates the duty ratio that controls the boost DC–DC converter’s output to the DC Bus. The converter is of average value type and contains controlled current and voltage sources. The PV output upper and lower limits are defined by Equation (4) where is the maximum PV output (kW) and is the PV output (kW) at time .
Figure 3.
MPPT algorithm, including a PV curtailment function.

However, instead of depending solely on MPPT to control the boost DC–DC converter’s output, this paper incorporates a PVC method, whose decision algorithm is shown in Figure 3, as an alternate when the PV output is surplus. During PVC mode, a fraction of the PV system’s rated output is defined as the prorated new maximum power point, of PV system output expressed by Equation (5). This new is used as a reference to calculate the next steps of input voltage by defining a new reduced for the gradient calculation in Equation (3). The SOC of the BESS at PVC , above which curtailment is implemented, is also set by Expressions (6) and (7). The EMS operator sets these values through the proposed EMS simulator. Therefore, depending on the current mode of system operation, the EMS controls the separating PVC switch to interchange between MPPT and PVC. The boundaries for implementing the PVC function are defined by the Expressions (4) and (5)–(7) below.
2.3. The Single-Phase Synchronous Inverter (SSI)
The SSI used in this study is also of average value type and consists of a controlled current source on the DC side and a controlled voltage source on the AC side. By combining the output of the AC side and the input of the DC side with the reference voltage values of the DC bus (400 Vdc) and the AC bus (200 Vac, 60 Hz), we can calculate a duty ratio that drives the inverter’s bidirectional energy conversion operation. This inverter model is adopted from in-house research by Yorino et al. [33] that directly implements the dynamic characteristics of synchronous machines using the swing equation.
2.4. The Load Model
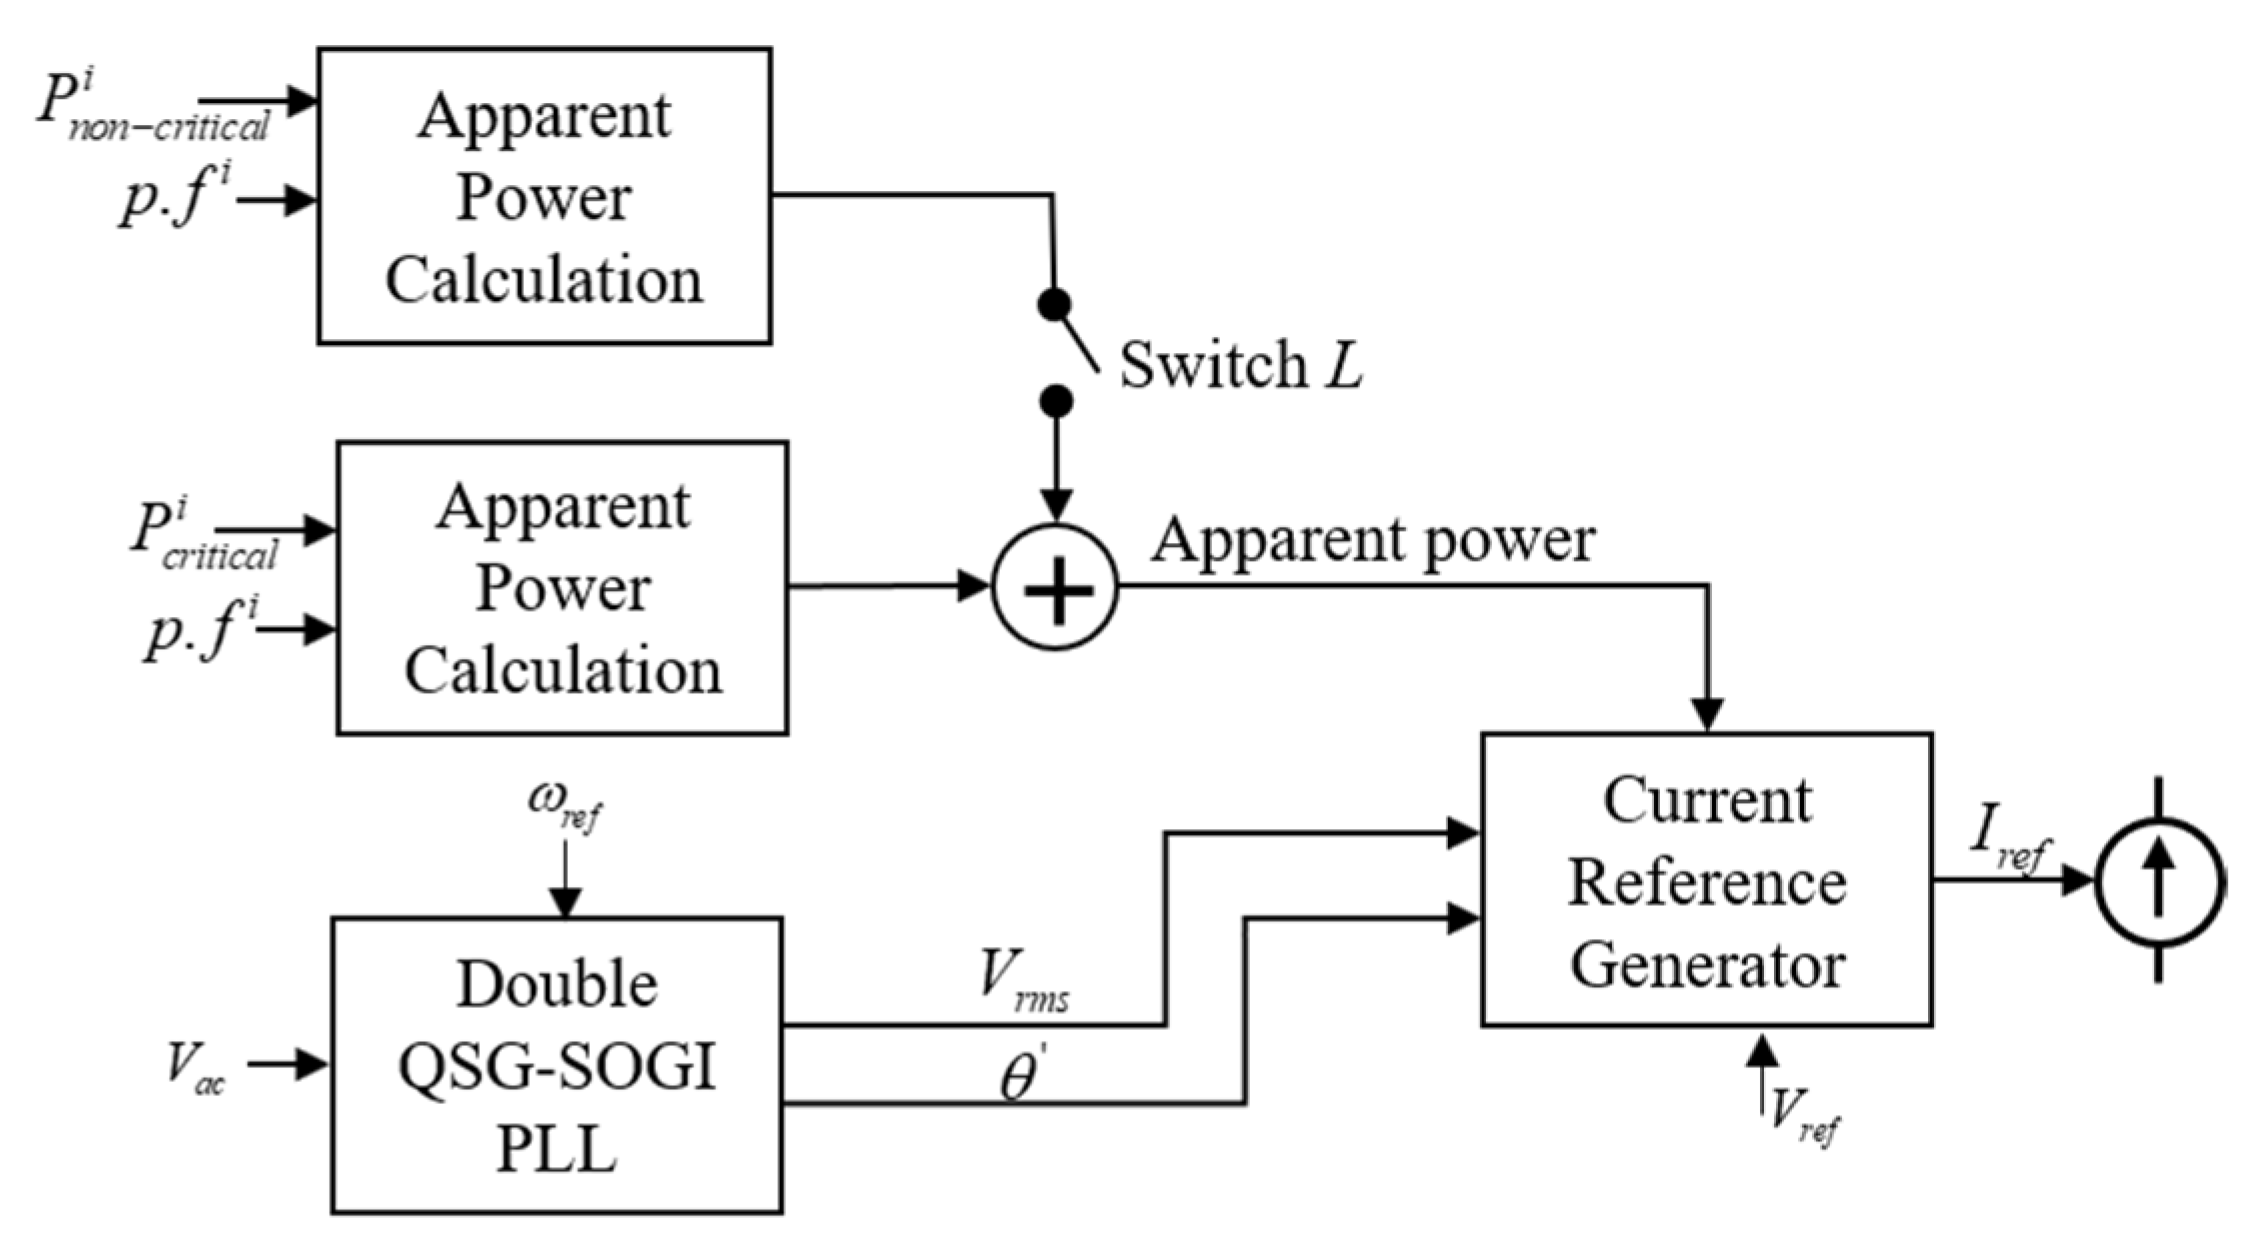
The non-sheddable critical, and sheddable non-critical, loads are separated by switch L, a conventional circuit breaker, as shown in Figure 4. The circuit breaker takes input commands from the EMS to control its state through the NCLS function as instructed by the proposed EMS. This article’s simulation uses the ideal switch available in MATLAB/Simulink. The load model inputs externally generated demand data, recorded over time, to generate a current . It takes the form of a controlled current source in MATLAB/Simulink.
In the proposed load model, we have considered both the active and reactive power components and ensured that the phase of the generated current is matched with the supply AC voltage. This is necessary because the supply voltage source alternates between the private line and the local prosumer source, and mismatched phases can cause instability in the system. Before combining the critical and non-critical loads, we calculated apparent power. The combined critical and non-critical load is then forwarded to the current reference generator shown in Figure 4. The other inputs to this current reference generator are the ac voltage and the voltage phase angle . These values are generated through the double QSG SOGI-PLL, whose open-loop transfer function is expressed by Equations (8)–(11). The QSG SOGI-PLL is thoroughly described by the authors in [34,48], while the improved double QSG SOGI-PLL from [38], which uses a double SOGI-QSG, is implemented for our load model. The equations below summarize the parameter design.
where
where is the selected settling time, the damping ratio, and the centre frequency. Voltage, and phase angle, are combined within the current reference generator to generate , the current reference that drives the controlled current source block.
During normal operation, the demand at time is defined by Equation (12). However, during NCLS, the total demand reduces to the critical load only since the non-critical load is disconnected. Further limitations (13) and (14) are enforced by the NCLS function which is implemented through switch L.
where : Active load demand (kW), : Critical electric load (kW), : Non-critical load (kW), : Maximum non-critical load (kW); : BESS discharging maximum output (kW).
2.5. The Proposed EMS Simulator
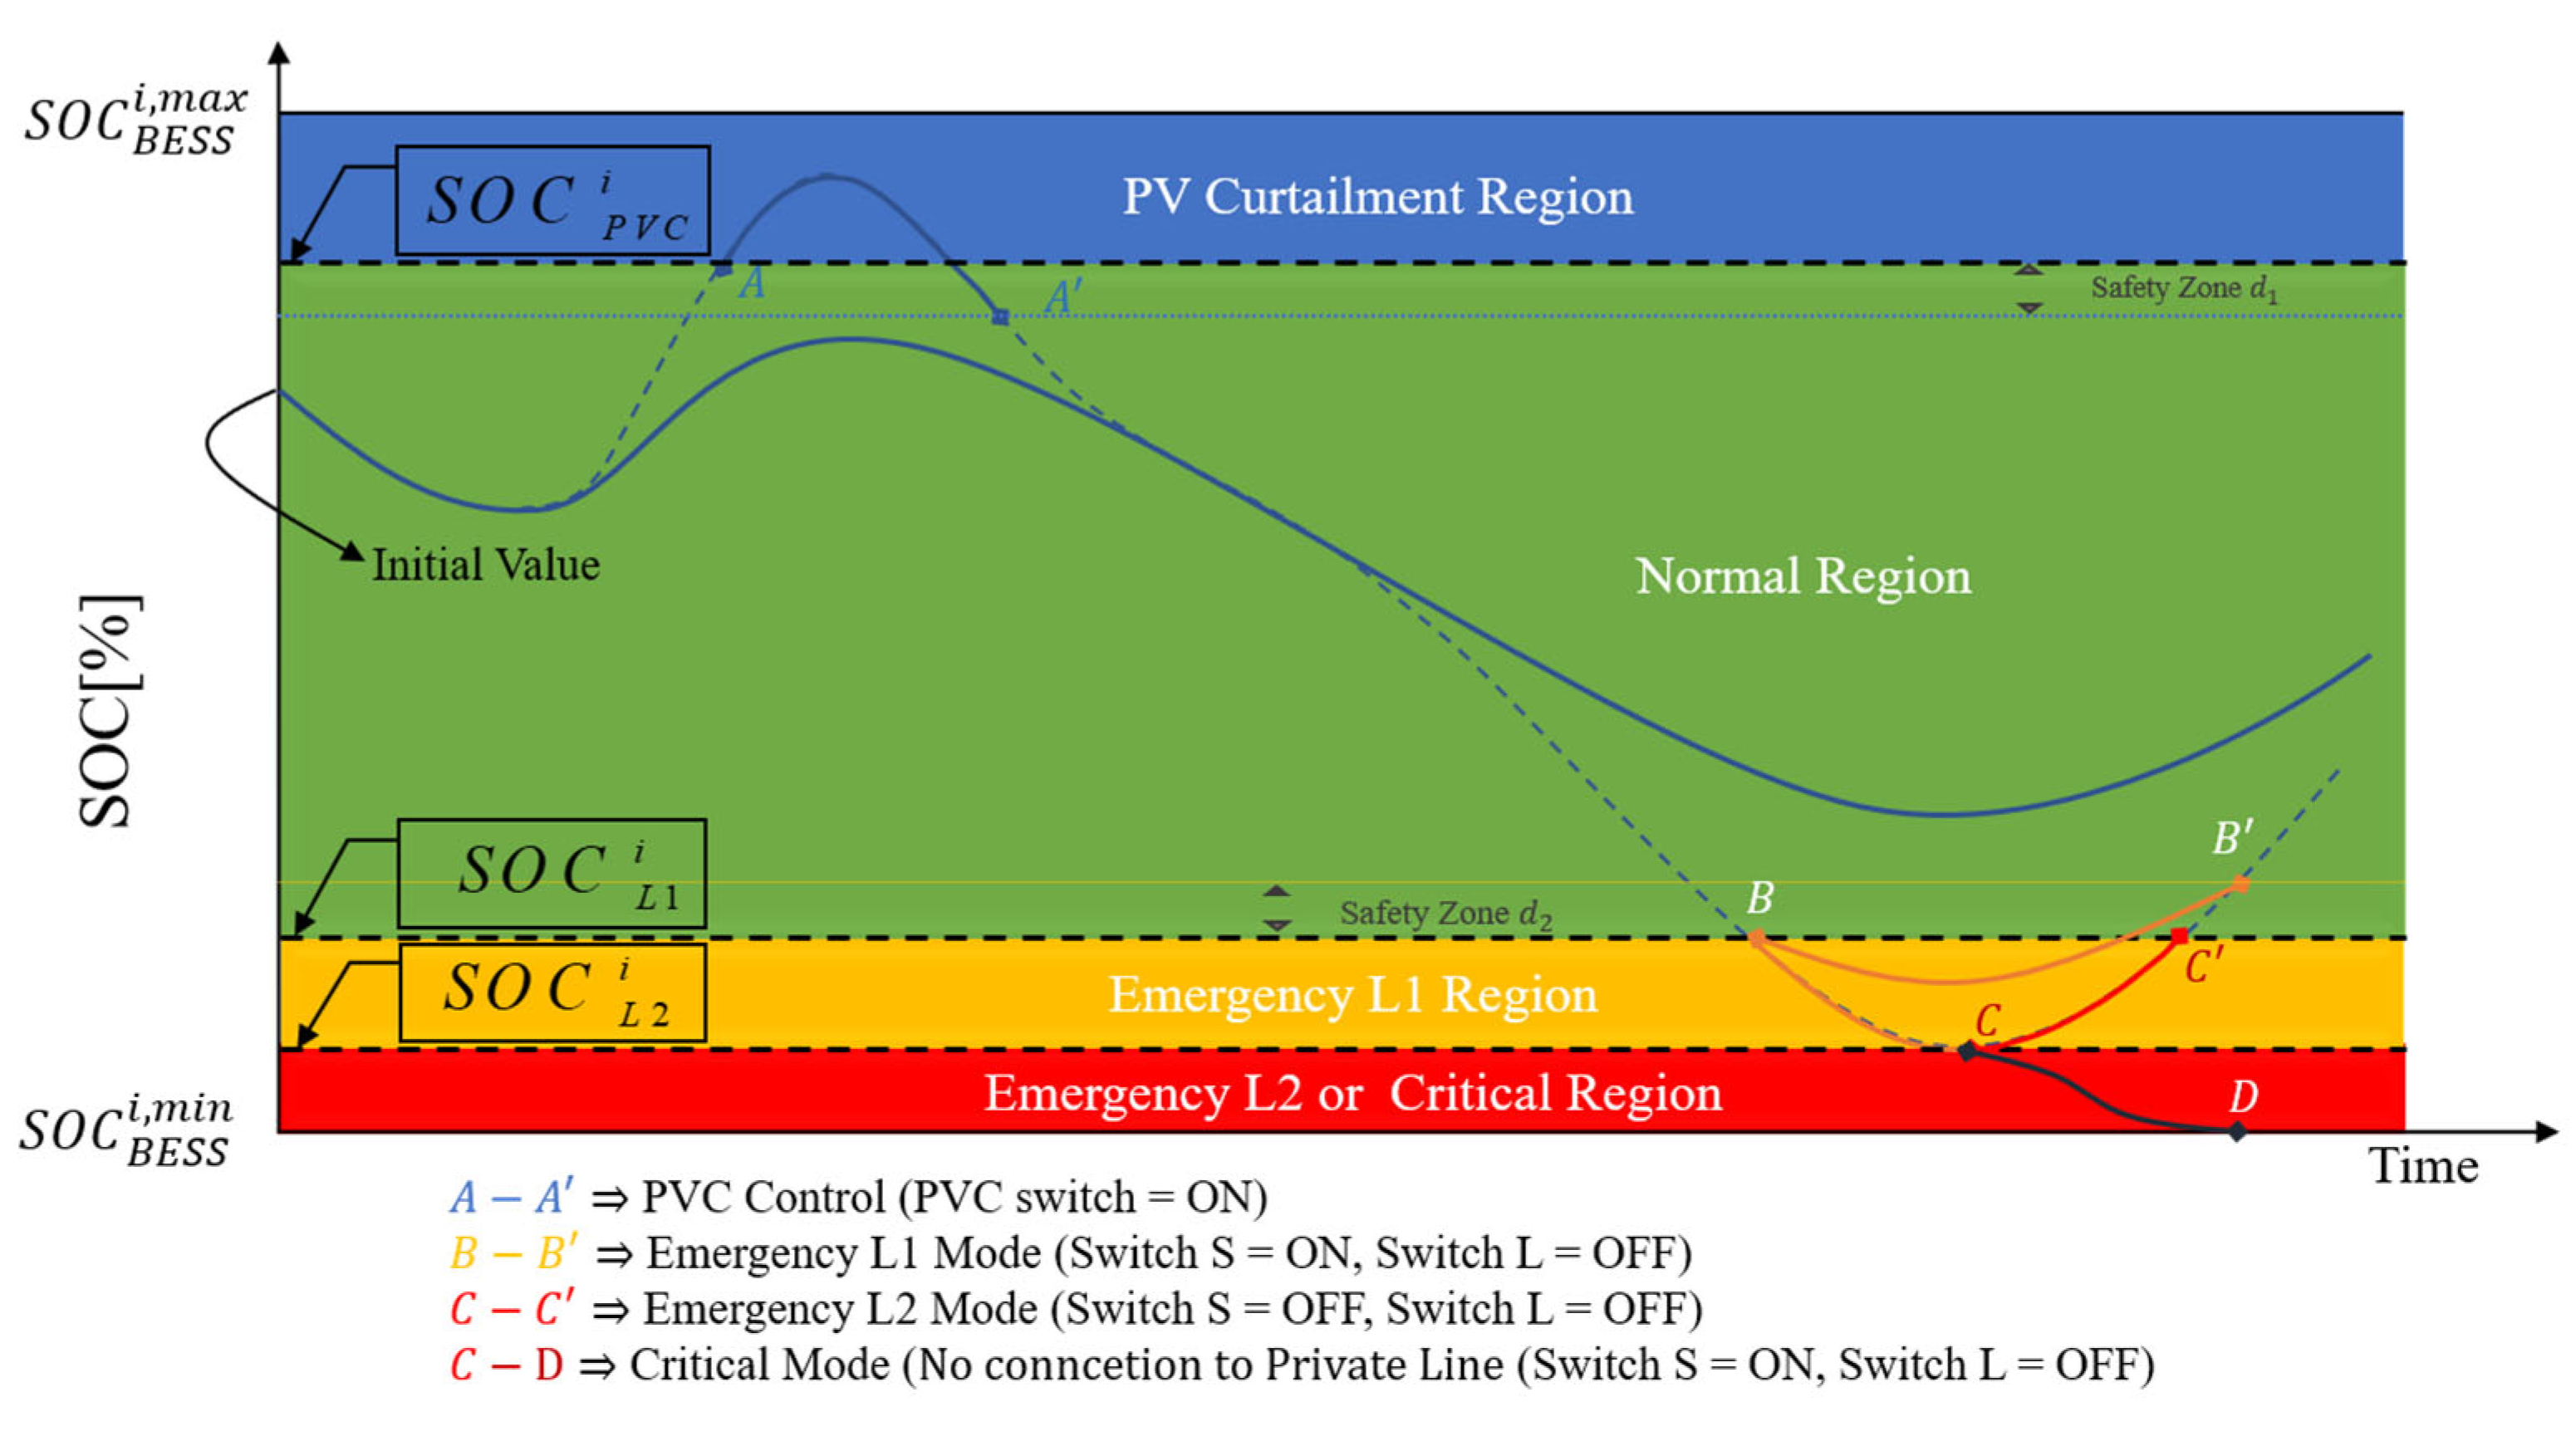
The proposed EMS simulator redefines the BESS SOC operation area whose limits are defined by equation (1) by dividing it into regions, as shown in Figure 5. New constraints and are introduced to the BESS SOC’s operation region, which modifies its operation to limit its depletion during a disaster. These limitations are intended to prevent the BESS SOC from being depleted during a disaster, with the assumption that the prosumer is more concerned with maintaining uptime by drawing power from the network rather than minimizing cost, for example, in a critical installation such as a hospital. Historical data on consumption can be analyzed to define the BESS SOC limits based on the primary objective of the installation concerning uptime requirements.
Therefore, by setting a lower limit of BESS’s SOC , the EMS maintains the critical load beyond a prolonged period; for example, = 3 days for the proposed case, a duration typically sufficient for availing initial relief services should an outage occur. The function in Equation (15) defines the proposed EMS:
The proposed SOC-based EMS tool maintains supply and demand balance based on Equation (15) and the defined constraints (1), (2), (4)–(7), (12)–(14), and the following additional constraints in (16)–(18). Expressions (16) and (17) are BESS power charging and discharging constraints, while (18) is the constraint for FLS control which takes effect when the BESS SOC level is within the region defined by (19).
where : Net power from the private line (kW), : PV maximum output (kW), : BESS discharging minimum output (kW), : BESS discharging maximum output (kW), : BESS charging minimum output (kW), : BESS charging maximum output (kW).
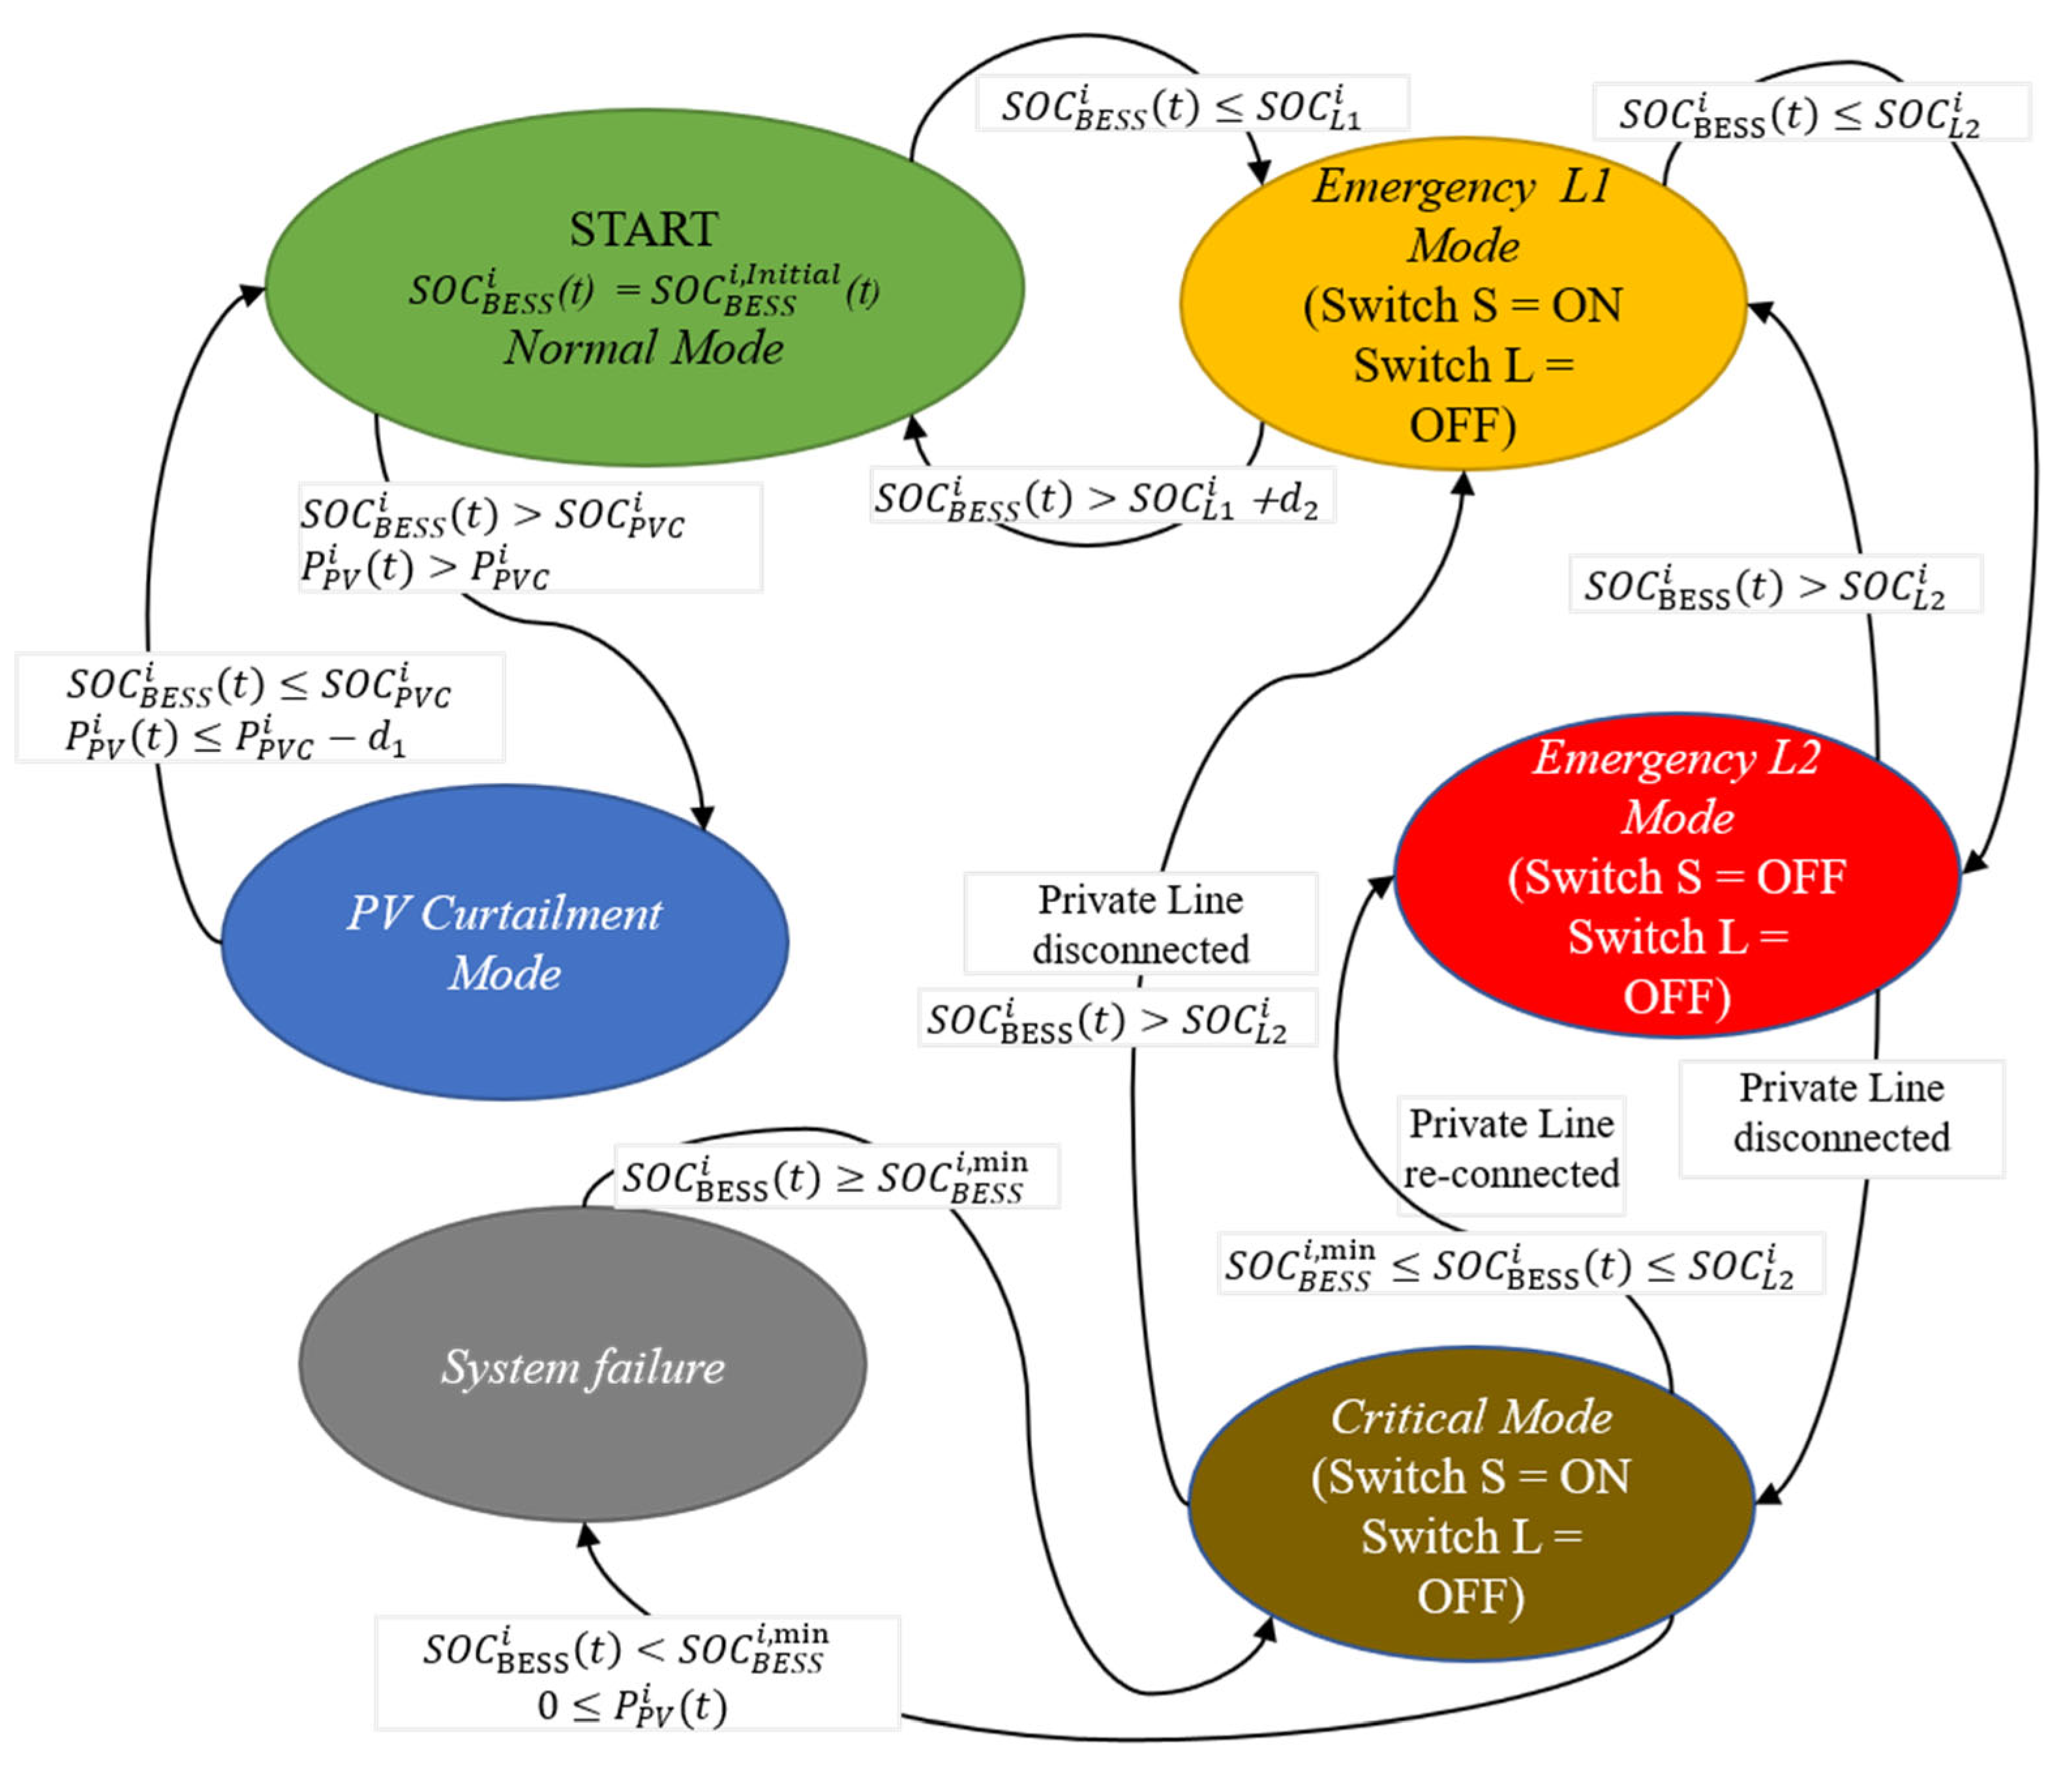
Additionally, Figure 6 is the proposed control flow through which the proposed EMS makes decisions. The defined regions in Figure 5 of the BESS’s SOC operation range determine the alert trigger points for the proposed control actions defined below with different constraints for the BESS and PV system emphasized for each mode:
- Normal mode (Green): Under optimum conditions, the control algorithm maintains the battery operating in the normal area. Here, the load demand is satisfied by the PV and BESS power. The prosumer can also supply power to the private line in case of a surplus in its generation. The expression (15) and its generally defined constraints (1), (2), (4), and (12) for the system operation limits apply to this mode.
- PV Curtailment Mode (Blue): However, when the PV output is surplus to the requirements, i.e., when the BESS SOC, > and the PV system’s output, > , PVC function curtails the PV output to avoid system instability. The prosumer operation range can gradually return to the normal mode through the PI controller-enabled PVC function with pre-set parameters. During the PVC mode of operation, the PVC function overrides the MPPT controller. Therefore, expression (15) applies, but the PV and BESS constraints (5)–(7) are emphasized. Emergency L1 Mode (Orange): If the BESS SOC level falls beyond the upper limit value , NCLS mode follows, where switch L opens, the non-critical load is shed, and only the critical load is supported. Therefore, a modified constraint (12) with and the BESS SOC constraint (14) are stressed.
- Emergency L2 Mode (Red): The EMS, through the FLS function, opens switch S below the lower limit value, . In this region, other cooperating prosumers connected to the private line meet the critical load demand. The expressions in (18) and (19) take priority.
- Critical Mode (Brown): The EMS engages the critical mode if the private line disconnects through an outage or lack of supply. The prosumer utilizes the remaining BESS SOC by taking on normal mode operation but with in expression 15 until Emergency L1 mode is restored. However, if the private line reconnects during the critical mode, Emergency L2 mode is instead assumed.
- System failure (Grey): System failure results if there is no PV output and the BESS SOC is depleted beyond the minimum value. For network and prosumer equipment safety, all loads are shed.
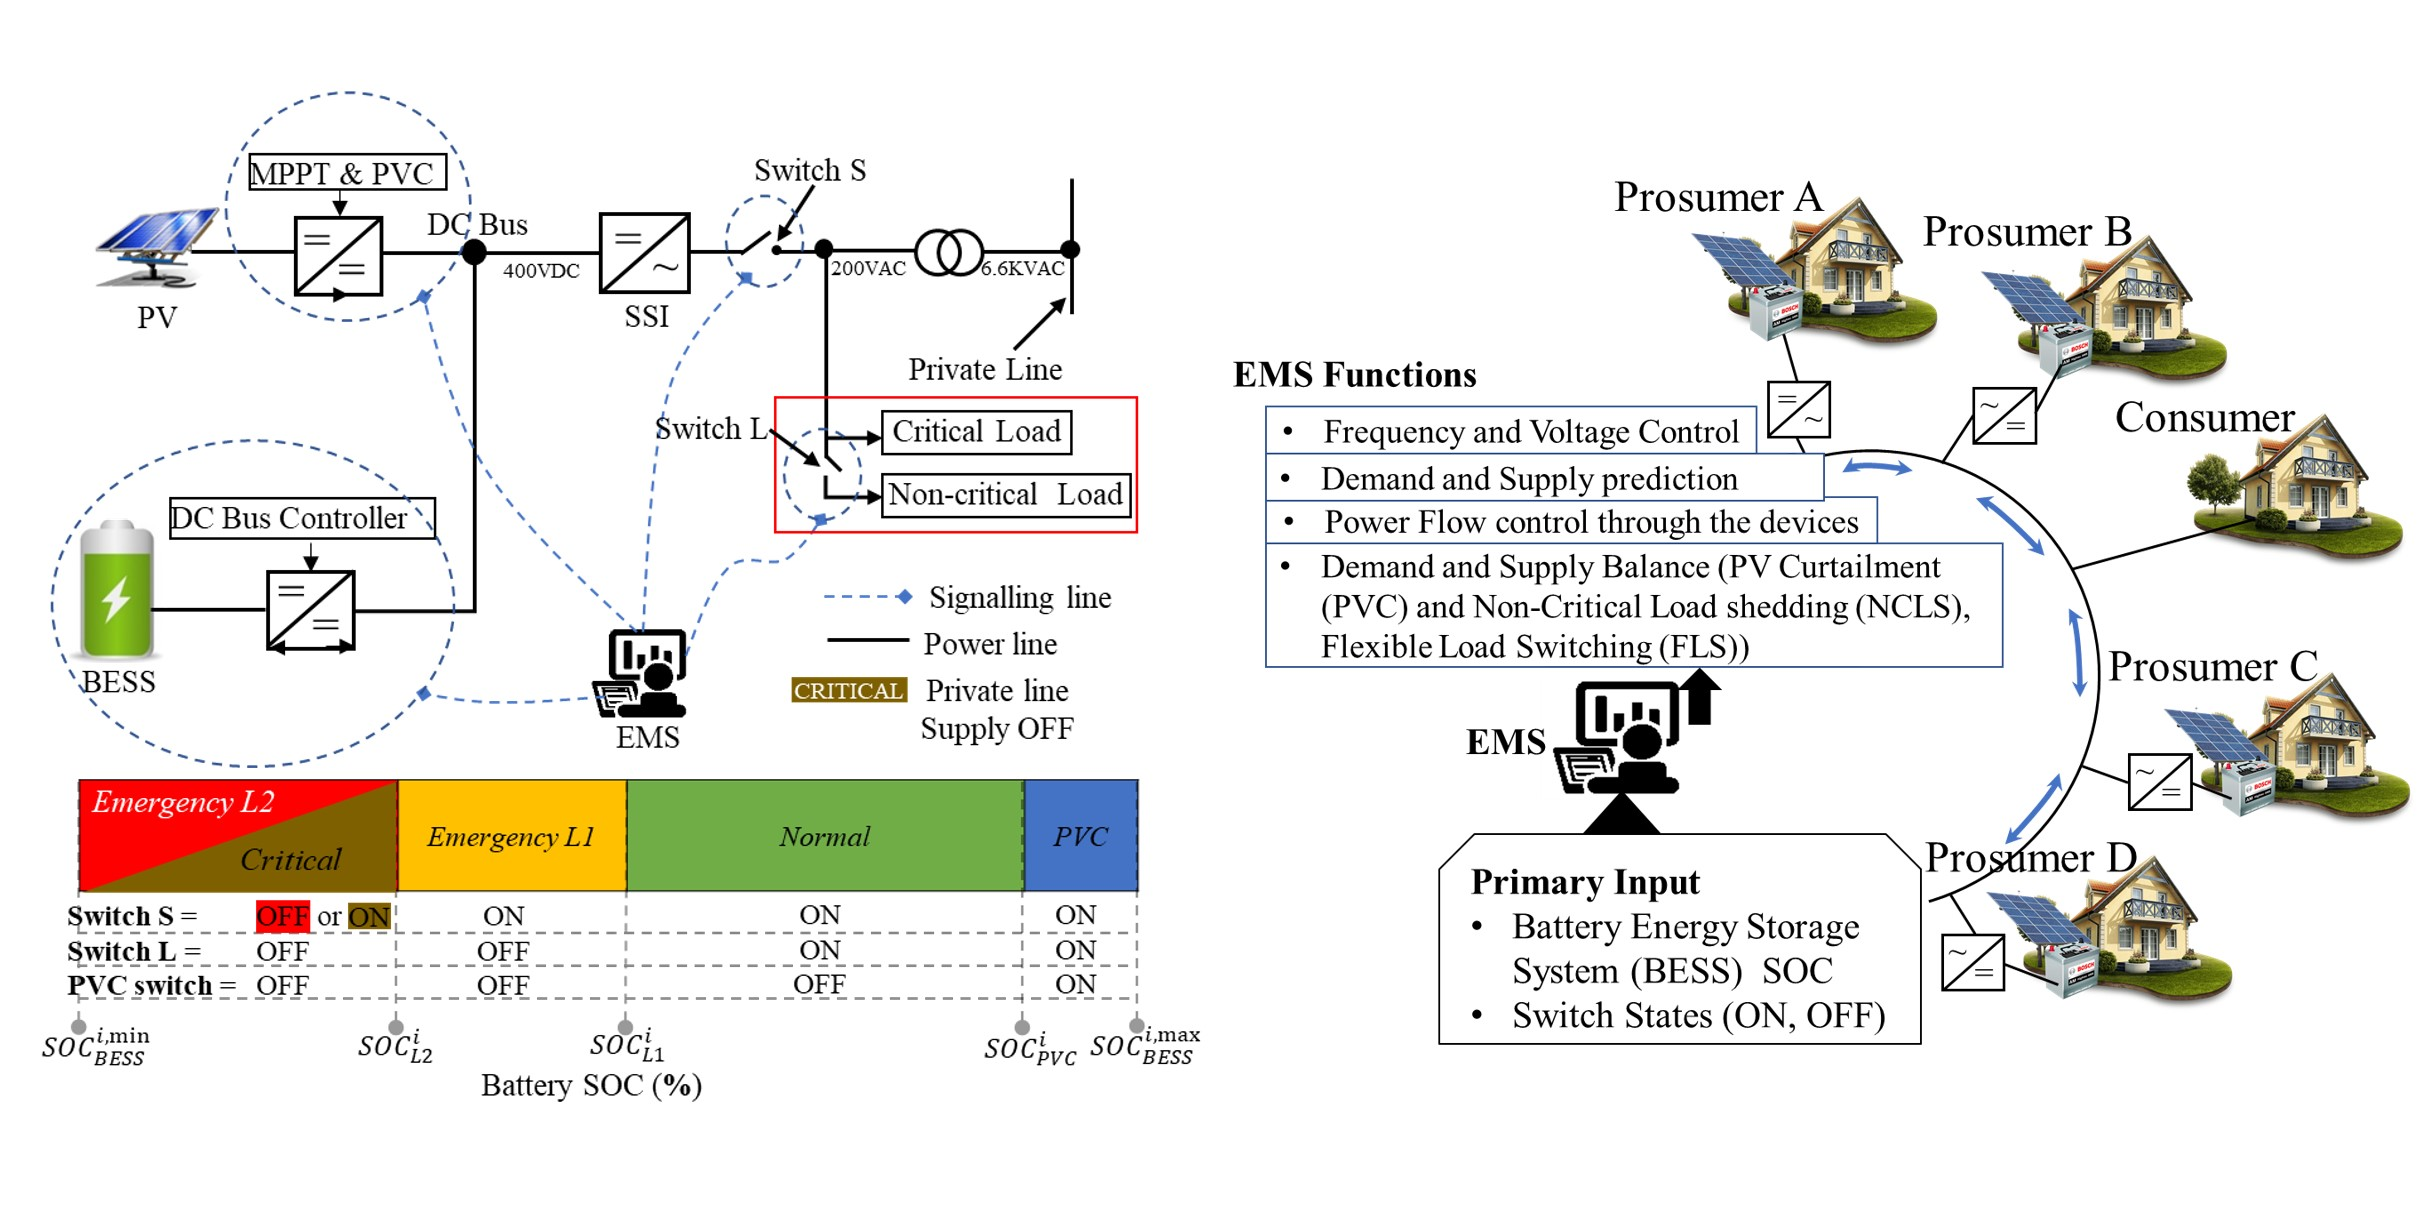
As illustrated in Figure 2, the EMS simulator communicates with components within the prosumer model to ensure proper system operation. It executes the flow described in Figure 6 for each iteration of the input conditions. The EMS simulator enables the creation of cooperative interconnected prosumer microgrid systems in a distributed architecture without the need for communication between them, providing a robust system that is resistant to communication failures and potentially cost-effective to implement in microgrids. In this simulation, we have not considered energy costs, but this will be an area of future research.
Figure 6.
The proposed EMS simulator flow.

3. Simulation and Results
To ensure the consistency of our results, we assumed that the two prosumers in Figure 6 and Figure 7 were operating under identical weather conditions. Both prosumers were designed with identical components, including a 7.5 kW-rated PV system with a 40 AH lead acid BESS system with a 5-h discharge rate, a 48 V nominal voltage, and a 17.4 A/unit rated discharge current. These components were modelled using the models provided in MATLAB/Simulink. We set the PVC value = 5 kW for the prosumer and the parameters and in Figure 5 and Figure 6 were set to 1% of the maximum BESS SOC. The system was operated at 60 Hz, and the test cases assumed a post-disaster situation.
The BESS settings for each prosumer were chosen arbitrarily and are shown in Table 3. Prosumer X represents installations that require high BESS SOC backups, while prosumer Y represents those with minimal backup requirements and a preference for energy trading. For this simulation, energy trading and the associated tariffs were not considered.
3.1. Simulation Conditions
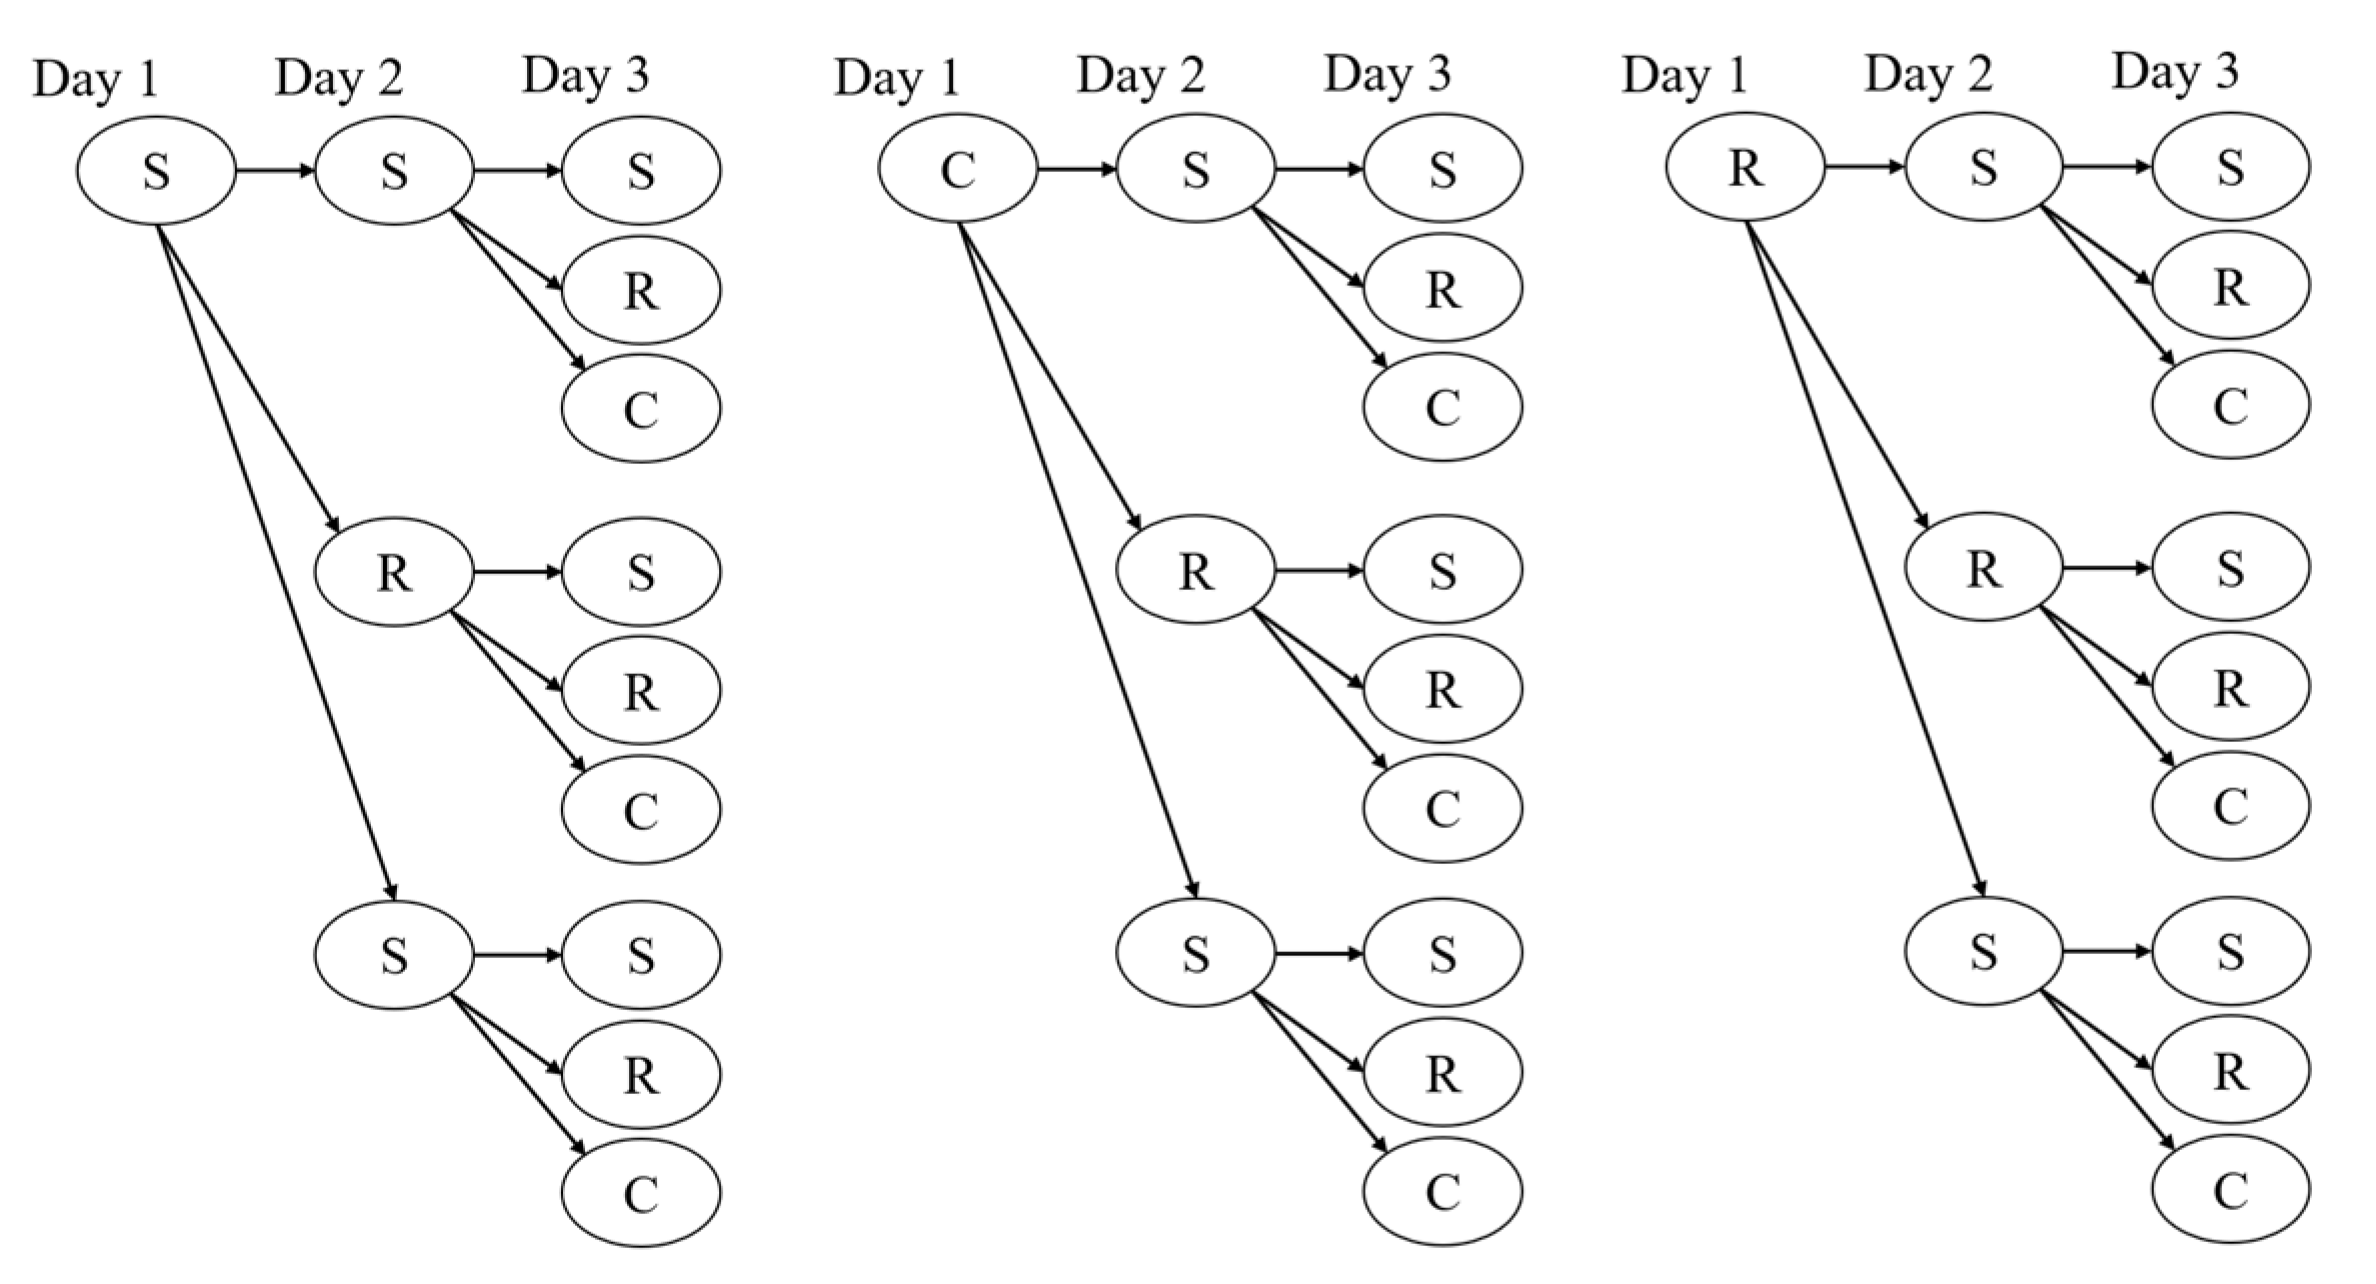
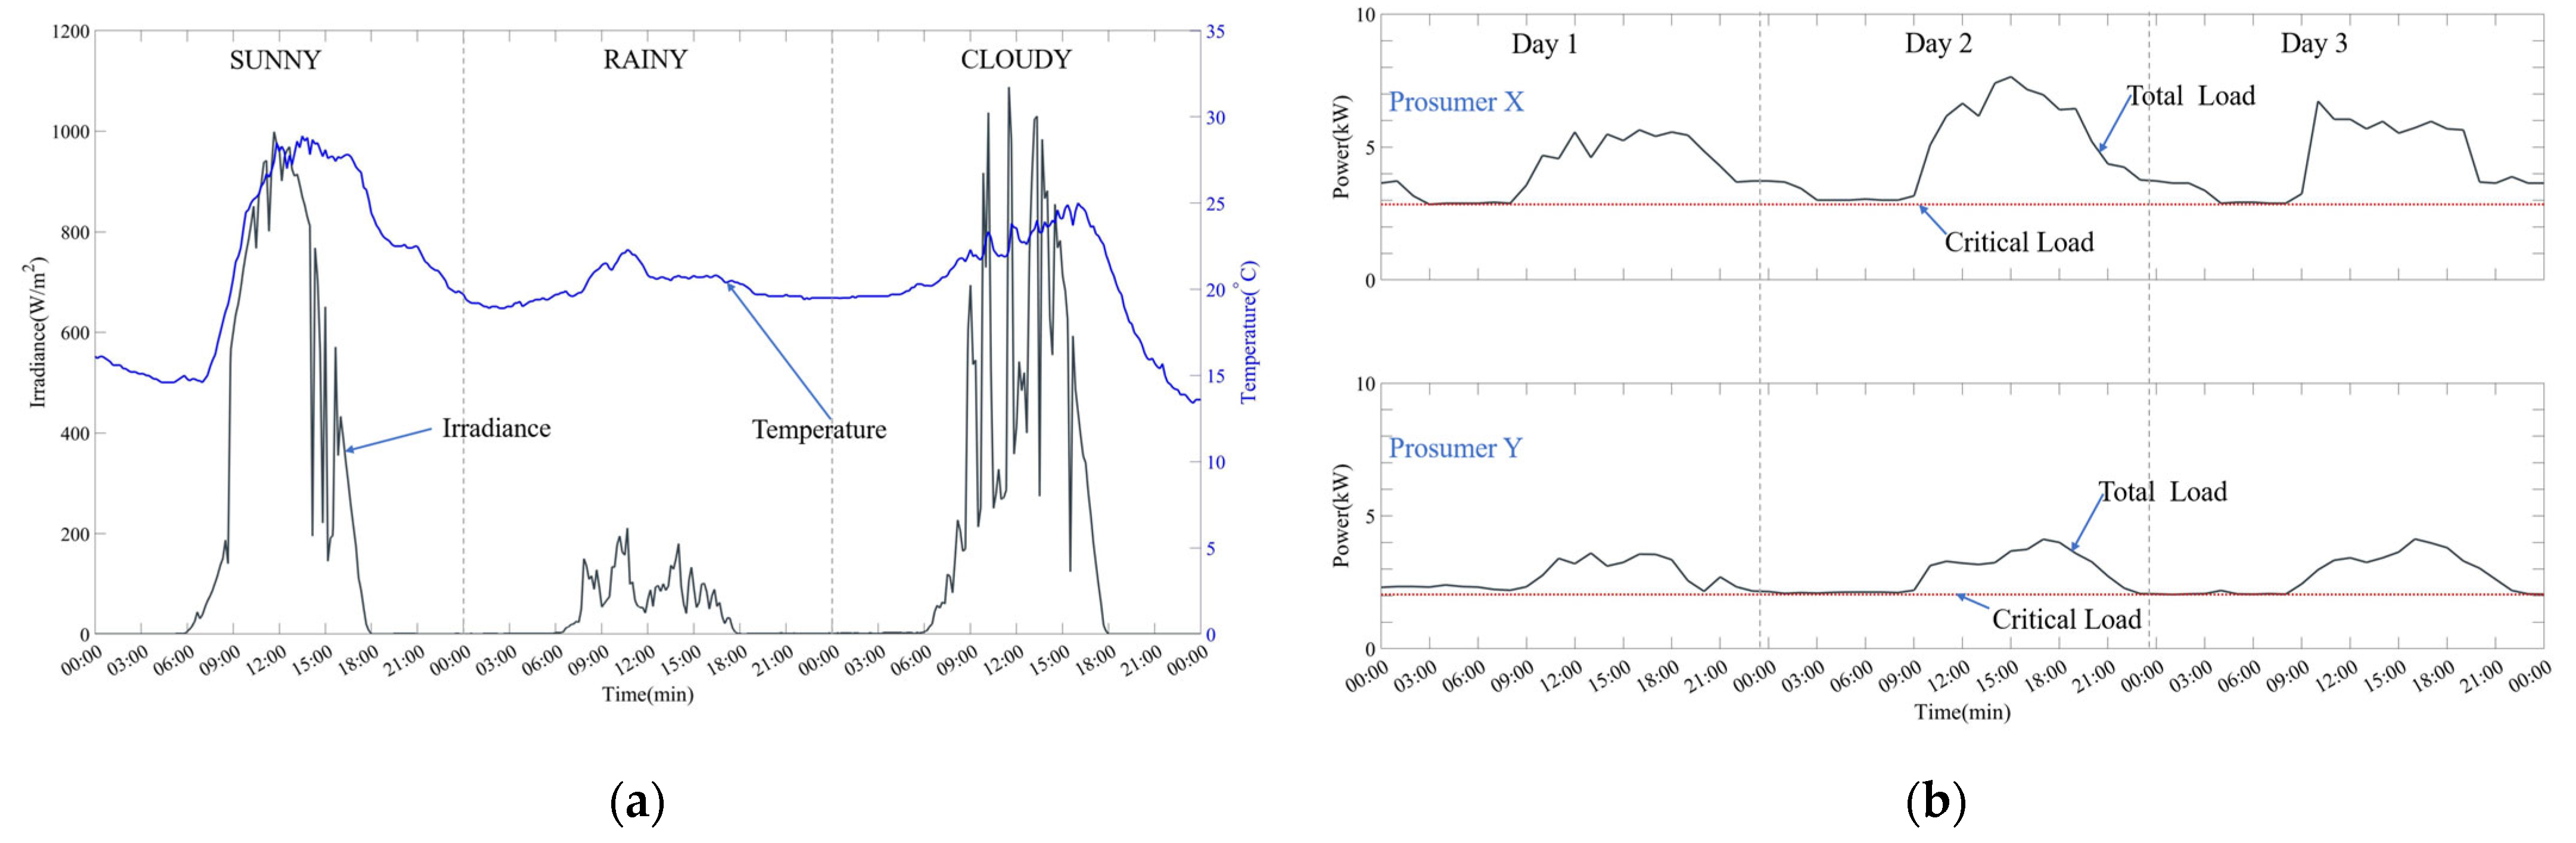
Various three-day weather patterns in Figure 8 were formulated from the sunny (S)-rainy (R)-cloudy (C) options in Figure 9a and were considered for the simulation.
This figure’s temperature and radiance data were used to generate the corresponding PV curves. When the simulation was run with day one as rainy in the third tree, it failed because the demand exceeded the sum of the generated power and the energy stored in the BESS, thus violating the constraints of Equation (15). Consequently, the feasible worst-case scenario was the cloudy-rainy-rainy pattern from the second tree used for the simulation.
Figure 9b includes the demand curves for the two considered prosumers. Following the proposed load model, the data shows variable non-critical and constant critical loads used as input. The load data was fed into the proposed load model to generate the load supply current. This load data was collected from the different floors of the electric power and energy systems laboratory building at Hiroshima university and thus follows a typical research facility profile. The weather data was collected from the building’s rooftop over the summer. A comparative simulation was run for five test cases in Table 4, considering two disconnected and three scenarios where the two prosumers, X and Y, were connected. FLS is not applicable in disconnected cases as there is no external power source. Test cases 1 and 3 are control cases for each connection status, where the NCLS for both cases and the FLS function for case 3 were disabled. Test cases 2 and 4 are for the case where only NCLS was enabled, and finally, test case 5 is the test for the proposed prosumer model and its EMS where PVC, NCLS, and FLS control are all enabled. For all cases, the PVC was enabled.
3.2. Simulation Results
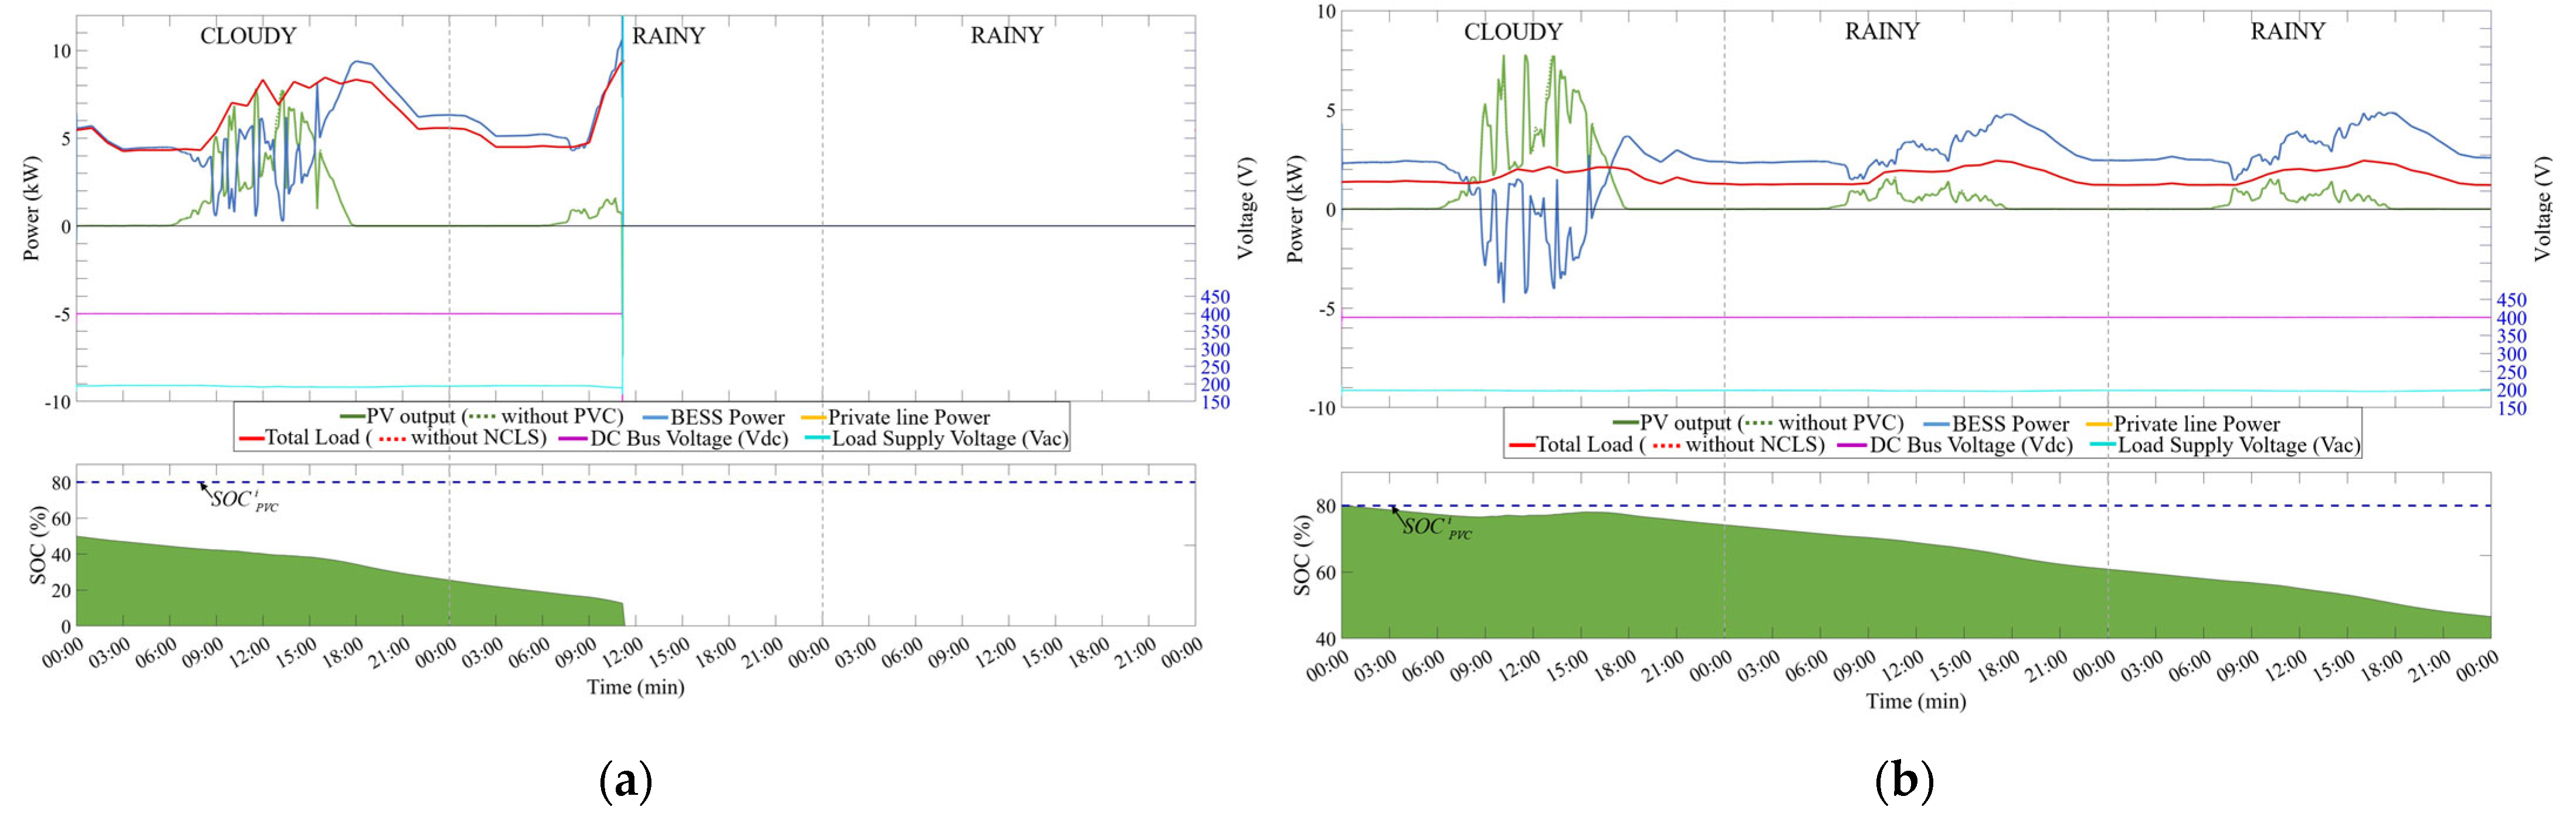
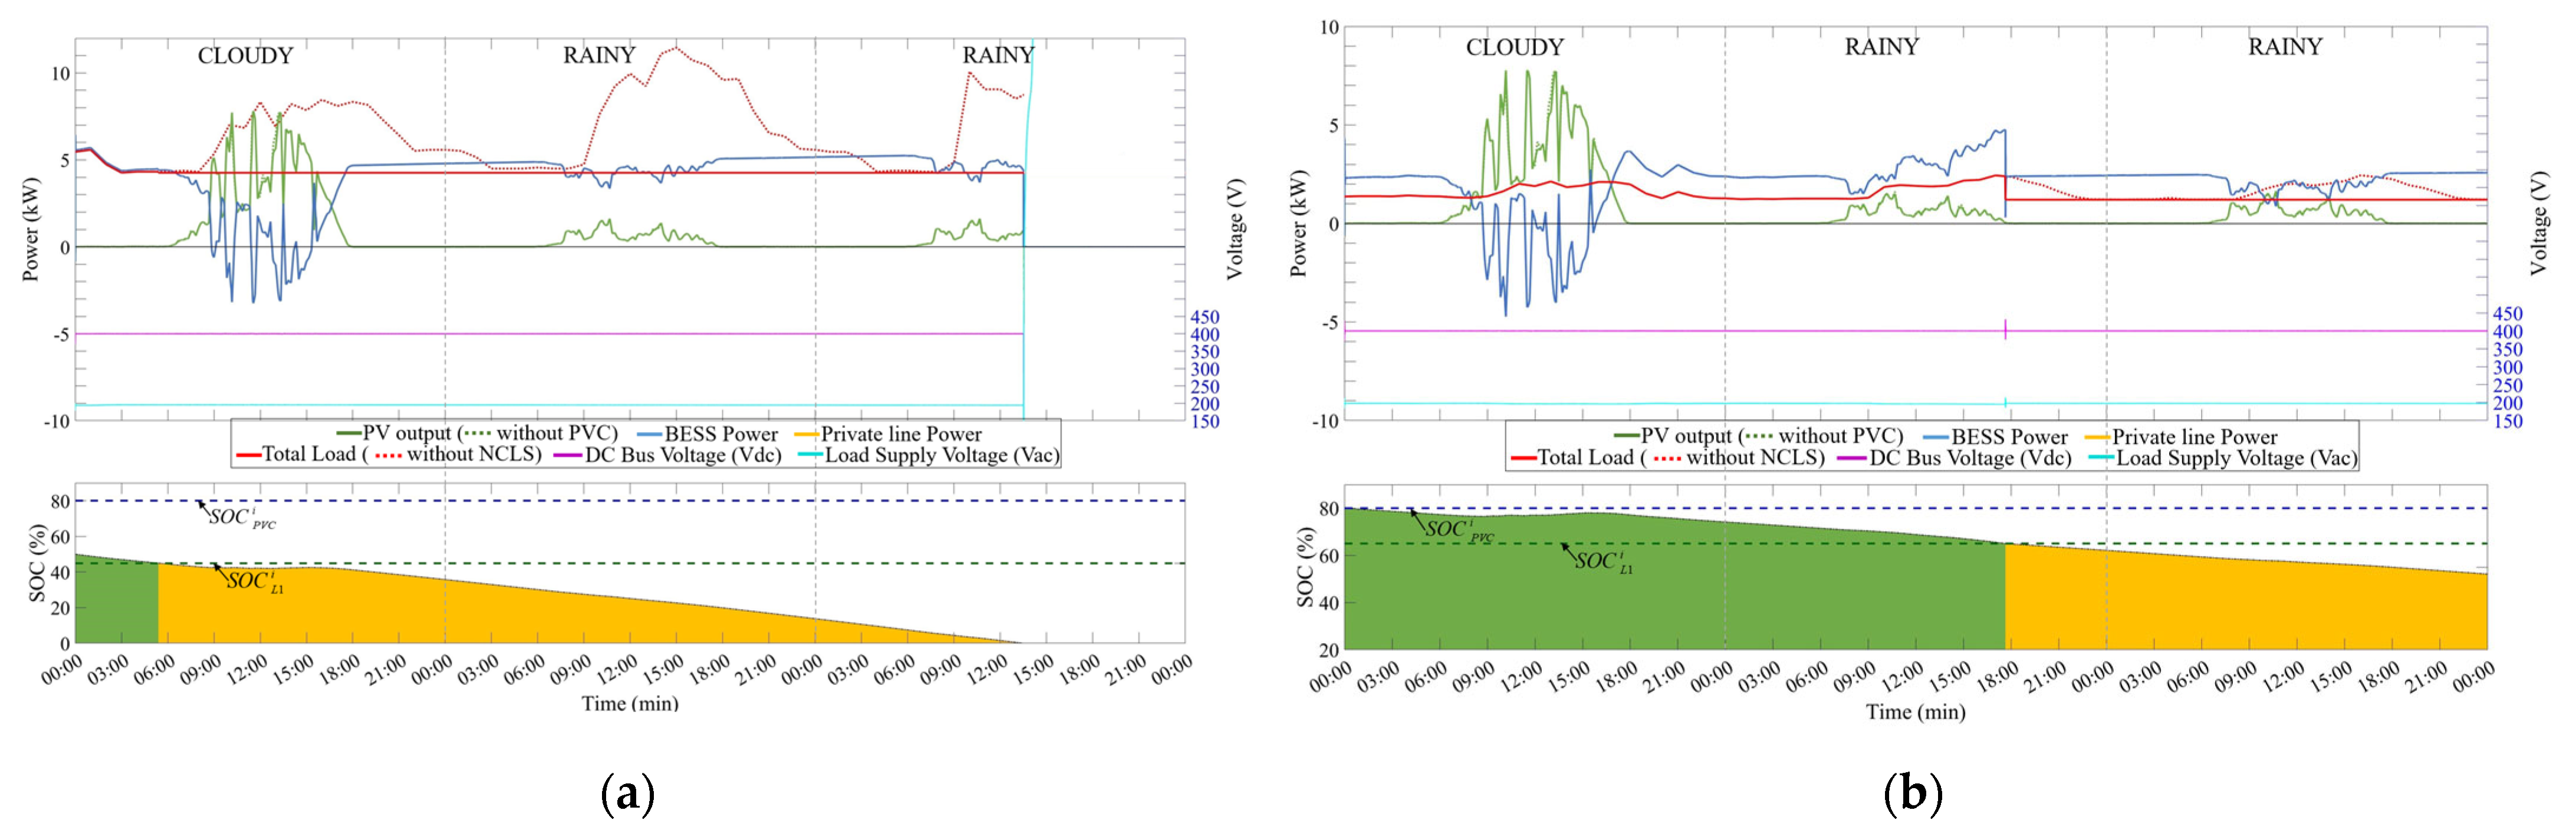
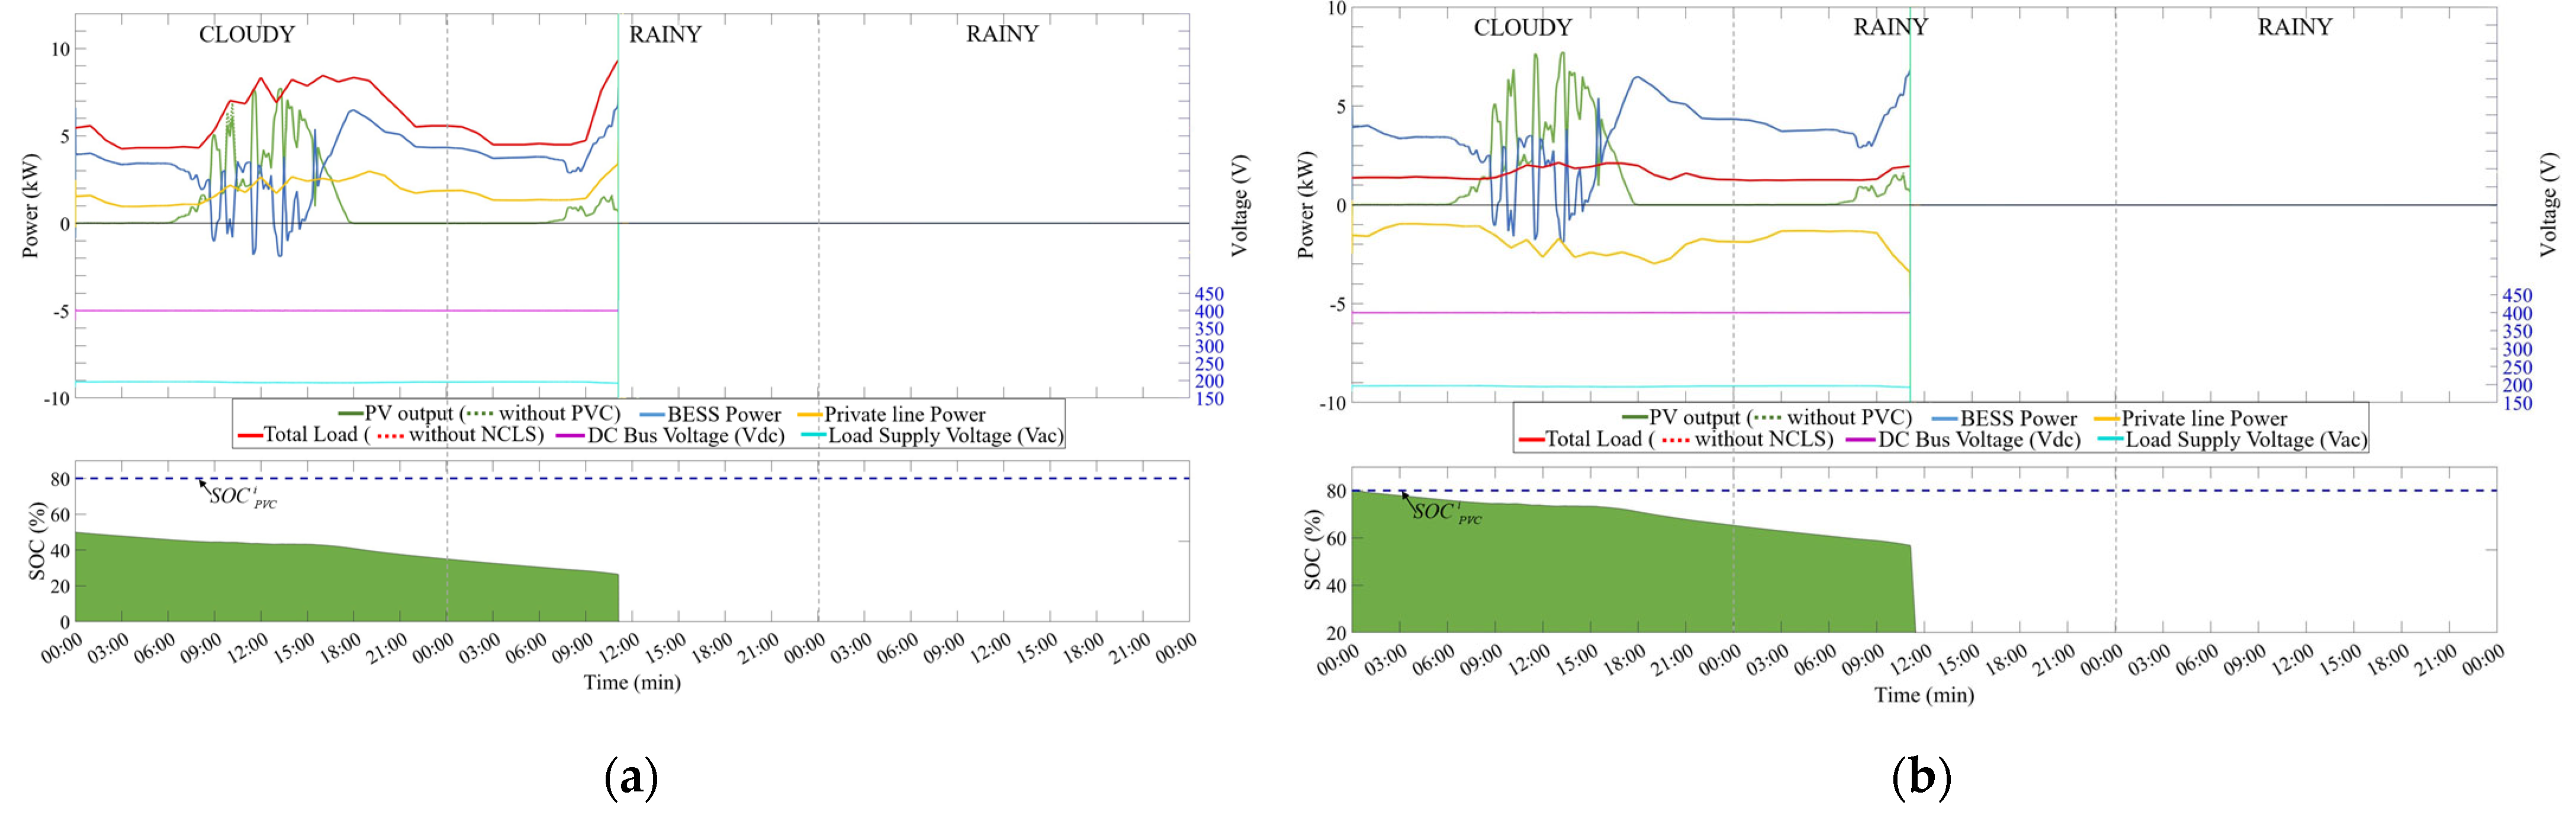
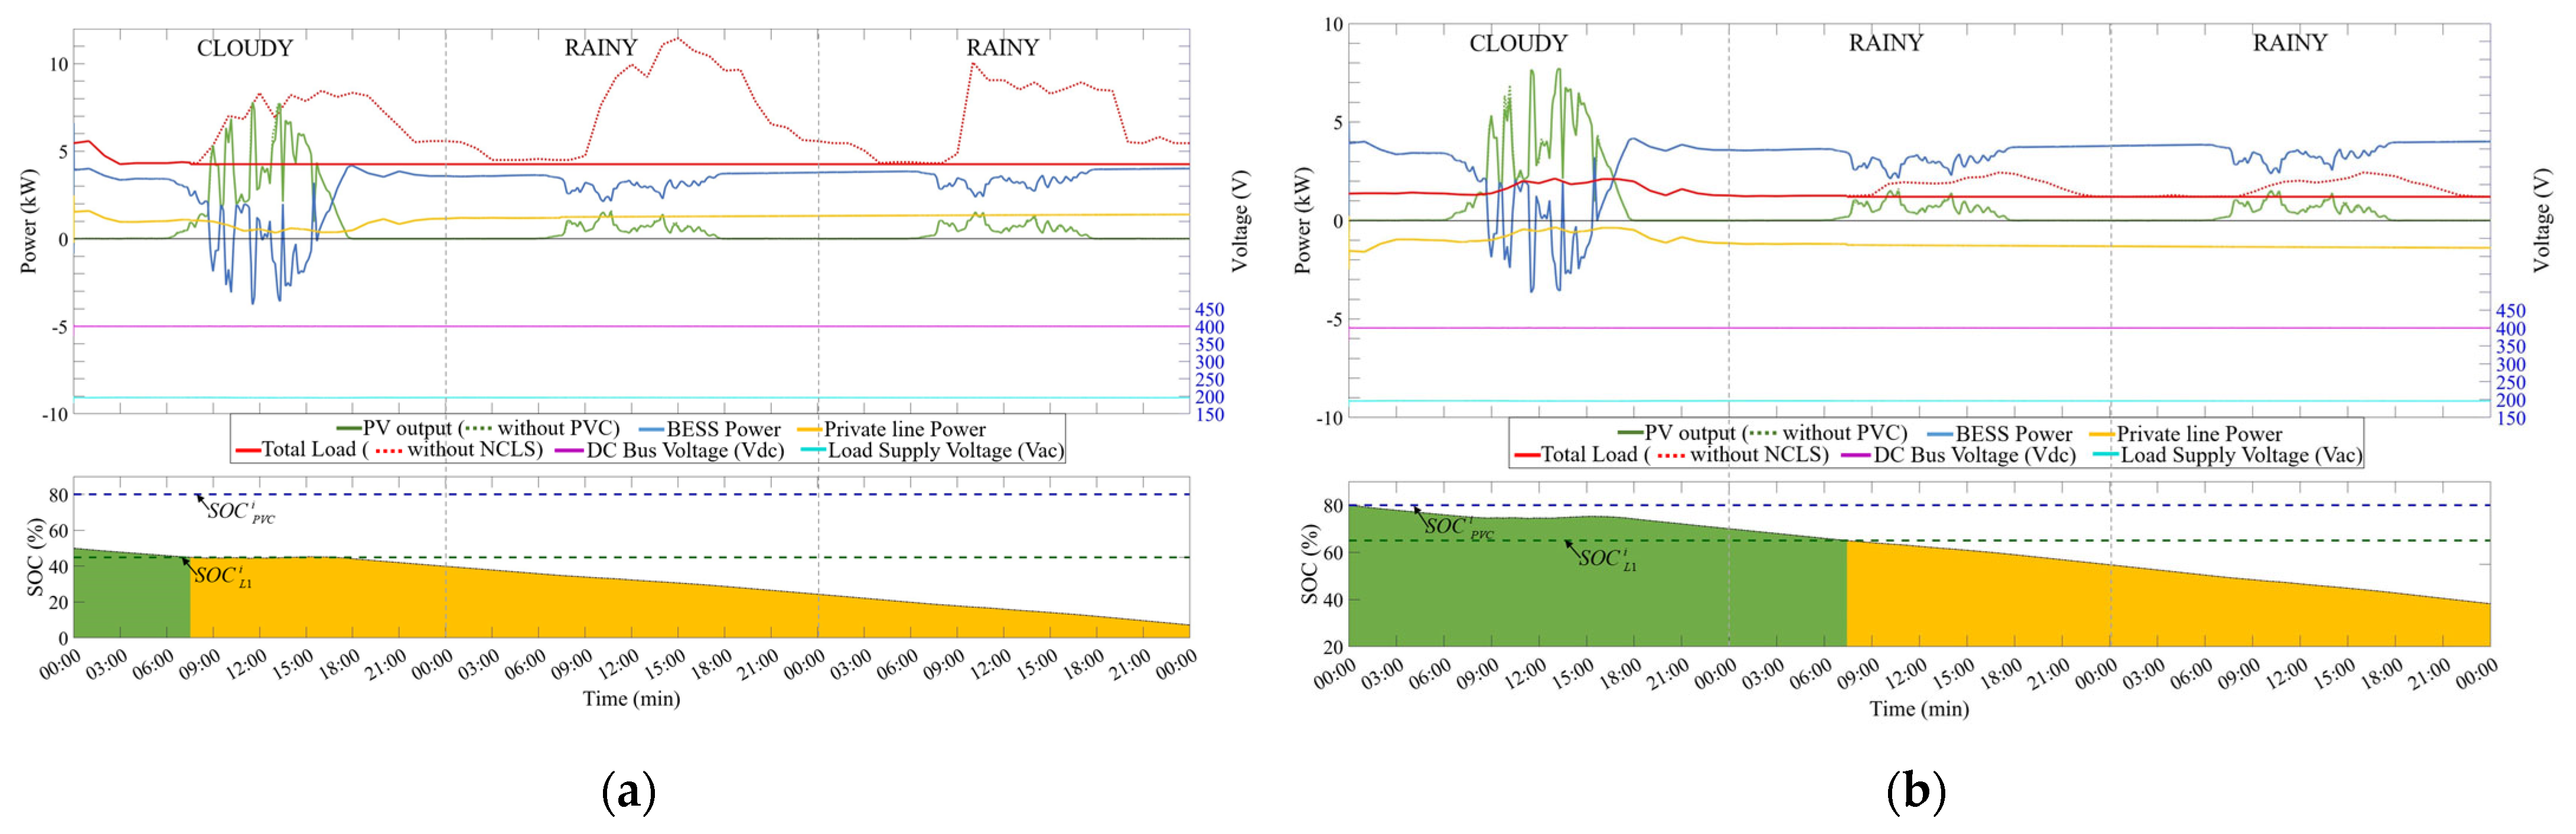
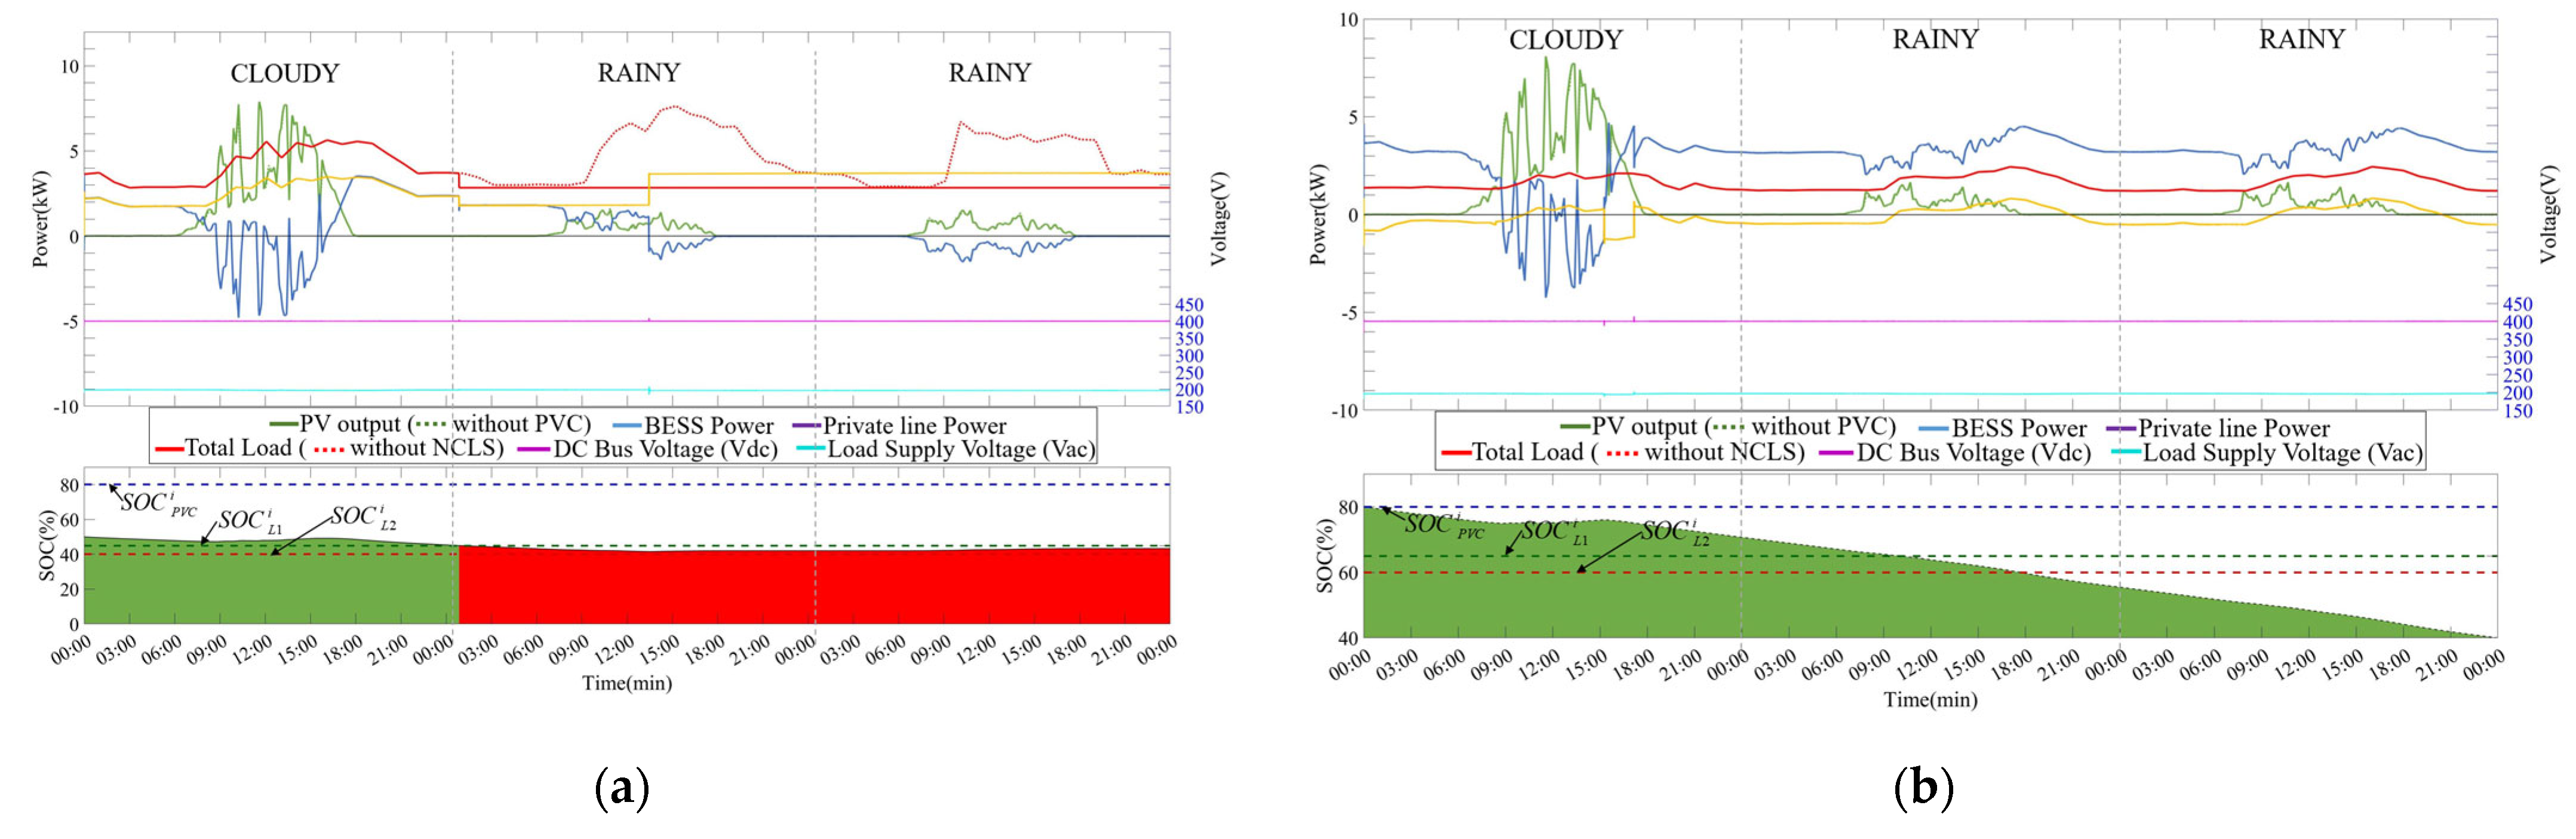
Figure 10, Figure 11, Figure 12, Figure 13 and Figure 14 present the three-day simulation results of the five test cases for prosumers X and Y, respectively. All the graphs from top to bottom in each figure include the power flow, DC Bus voltage, load supply and BESS SOC with colour coding described in the proposed EMS in Section 2.5.
Positive BESS power indicates discharge in the power flow curve for each figure, whereas negative power denotes BESS charging. Similarly, positive private line power values signify power flow from the private line, whereas negative flow means power flow towards the private line from the prosumer.
In the disconnected test case 1 (Figure 10), the SOC of prosumer X was observed to reach 0% on day two due to its low initial SOC, high demand, and low power generation. As a result, the system collapsed, considering that the generated PV power on the second rainy day could not support the demand. However, prosumer Y successfully navigated the three-day simulation by consuming almost half the stored power in its BESS and the generated PV Power.
Both prosumers in the disconnected test case 2 (Figure 11) show improved performance in the remaining SOC after three simulation days. All prosumers maintain uptime and depict stable DC bus voltages compared to the control test case 1. This improved performance results from prolonged load shedding of the non-critical load.
Without any form of demand and supply control or protection, test case 3 in Figure 12 fails on day two of the simulation. This is despite the power flow between the two prosumers. At the failure instant, both prosumers cannot meet the total demand, and therefore, this imbalance results in an unstable system. Contrarily, a stable system is observed in Figure 13 (test case 4), where a power flow between the two prosumers is observed to supplement their performance. However, it is seen that the SOC for prosumer X operates far below our proposed lower limit , even with the prolonged load shedding and the constant power supply from prosumer Y.
The performance of our proposed prosumer model and its EMS depicted in Figure 14 shows an increased flow of power from prosumer Y to prosumer X. This power flow reduced the shedding of the non-critical load when compared with the test case 4. Therefore, prosumer X’s SOC remained very close to its initial SOC at the beginning of the simulation. PVC was enabled for all test cases, but since the weather conditions were the worst-case scenario, PVC is not observable in the simulation results.
Table 5 summarizes the results of the five test cases depicted in Figure 10, Figure 11, Figure 12, Figure 13 and Figure 14. A comparison of the results indicates that the proposed interconnected prosumer model with its EMS offers the best performance as it maintains the SOC of prosumer X at a relatively high SOC by the end of the three-day simulation.
3.3. Results Discussion
It is observable in the results that the proposed model successfully maintains the system’s stability over three days under a pattern of abysmal weather, hence meeting the research objective. The maintained high SOC of prosumer X could allow it to run the critical load for an extra day, which would be ideal for essential facilities critical to disaster recovery such as hospitals. Prosumer Y is a typical non-essential facility such as an office building that maintains essential critical services by yielding their stored BESS’s SOC. It could also benefit if revenue is levied on the shared power.
However, this observed system stability is a trade-off between uptime and prolonged curtailment of a prosumer’s non-critical load plus the potential cost of purchasing power. This article omits the costs associated with energy trading by assuming each prosumer prioritizes uptime over cost. Therefore, a consensus approach to trading where the prosumers are owned by the same entity with uniform or zero costing is ideal.
Nevertheless, the high amount of traded power, as seen in Figure 14, indicates an opportunity for energy trading. Revenues from energy trading can offset the cost of installation of prosumer microgrids which could encourage renewable energy growth in line with the sustainable development goals agenda. Therefore, an economic viability study is recommended to realize this potential.
The proposed alert warning system enables the system administrator to monitor the system’s operation and also aids the planning process for disaster recovery. However, the intended purpose is to share this basic information of colour codes with a proposed future central control system which could better manage waste from curtailed PV power and improve the efficiency of the proposed solution as part of our ongoing study.
The initial SOC of each prosumer can affect its performance curve, but it does not impact system stability for successful days of good weather, as we shared in [44]. The balance between supply and demand through energy trading, PVC, and FLS, supported by the included DC bus control technique, ensures the stability of the power system. Therefore, the initial SOC can take any random value between 0% and 100%. However, as shown in Figure 8, cases where the weather on the first day was rainy were not able to maintain uptime beyond the first day due to the high demand of prosumer X with a low initial SOC. Maintaining a higher initial SOC for the BESS prior to a disaster could improve post-disaster resiliency. Thus, prosumer owners should consider this requirement when determining the lower BESS SOC limit for the proposed EMS.
Additionally, this result indicates that the performance of each prosumer is heavily dependent on an interconnected prosumer’s willingness to participate cooperatively in energy sharing and is highly susceptible to failure in the disconnected case. While some successful situations exist, interconnected prosumers with the switching control will inevitably become unstable after consuming all their remaining BESS’s SOC when operating in the Emergency L2 Mode and critical modes. Therefore, when interconnected with multiple prosumers, a separate generation system or BESS could be essential to buffer the periods when the initial conditions of the PV generation and BESS SOC are low. Interconnected prosumers with only PVC and NCLS can potentially sustain long periods of uptime, as seen in the results of test case 3. The prosumers maintain balance by sharing power to meet only their critical loads; thus, by the end of the simulation, both prosumers have their remaining SOC almost depleted. If the generated power of the prosumers on day four does not improve, it will inevitably result in instability. Therefore, this builds the case for our proposed model that reduces the load shedding duration while maintaining the SOC above the emergency operating region with remaining BESS’s SOC almost enough to run for a fourth consecutive day of bad weather conditions. Ideally, relief services or weather improvement will be in place after these three days.
To validate our proposed model, we conducted a stress test using the Monte Carlo simulation in [44] to confirm the model’s performance under various initial BESS SOC conditions. We also applied the model to a scenario involving a disaster occurring during mid-operation in [42] and tested it in a large system comprising 11 prosumers and 5 consumers in an intercommunity microgrid setup in [41]. These tests all returned positive results in terms of increased uptime, with input and output waveforms that approximated those of typical systems. In addition, the inverter model proposed in this paper has been experimentally tested in [33] and compared with existing models, demonstrating increased stability compared to conventional models. Therefore, the simulation results presented in this paper further validate the performance of our proposed model and confirm the reliability of the proposed EMS method.
4. Limitations of the Study
The current study does not take into account the costs associated with energy sharing, which could significantly impact power flow and decision-making in terms of scheduling. Additionally, the study does not consider important factors such as AC side and network voltage control, which are necessary for system stability. Therefore, in future work, we propose to include additional data related to prosumer uptime optimization, dispatch scheduling, uncertainties treatment, AC side voltage control, and demand and weather prediction from [9,10,11,13,49,50,51] to further improve the effectiveness of the proposed energy management system.
Additionally, we will explore the coordinated operation of multiple interconnected prosumers using a quasi-central control method with minimal data sharing to evaluate the potential benefits of improved energy utilization and network protection compared to a distributed approach that prioritizes the needs of individual prosumers.
5. Conclusions
This article presents an approximate prosumer design for long-duration simulations and its energy management system simulator that manages a prosumer’s BESS state of charge, intending to increase its uptime. Reactive power components are included in the load model while maintaining its applicability in long-duration simulations. In addition, the design includes non-critical load shedding, PV curtailment, and flexible load switching functions as demand–supply balance techniques to improve the prosumer’s resilience in situations with limited generation.
When compared to the disconnected and connected cases without an EMS, the proposed prosumer model with its EMS shows a resilient performance under extreme weather conditions, which can significantly reduce the power generated. The proposed EMS successfully prevents the system from operating in a critical mode and maintains the system’s characteristics within acceptable levels. The three-day simulation run time of 19.5 min is practical for long-duration simulation studies for microgrid operators, EMS suppliers, and consulting firms.
This model is applicable as a test bench to further research on distributed energy management systems due to its practical computation time and proximity to a real system. Operators of microgrids can use it to plan for new installations and evaluate the existing ones by entering only the system specifications [9,10,11,13,49,50,51].
Author Contributions
Conceptualization, K.S.M., Y.S. and Y.T.; methodology, K.S.M., Y.S. and Y.T.; software, K.S.M. and Y.T.; validation, Y.S., N.Y. and Y.Z.; formal analysis, K.S.M.; resources, Y.S.; writing—original draft preparation, K.S.M.; writing—review and editing, K.S.M., Y.S., Y.T. and A.B.; supervision, Y.S., N.Y. and Y.Z.; project administration, Y.S. All authors have read and agreed to the published version of the manuscript.
Funding
This research received no external funding.
Data Availability Statement
The data are not publicly available but can be provided on request.
Conflicts of Interest
The authors declare no conflict of interest.
Nomenclature
| Main Symbols | |
| Settling time | |
| Damping ratio | |
| Center frequency | |
| RMS voltage | |
| Phase angle of the load supply AC voltage | |
| The current reference | |
| PV output current | |
| Prosumer number (1, …, NP) | |
| Electric load [kW] of prosumer i at time t, | |
| PV output | |
| BESS charging power | |
| BESS discharging power | |
| Net power from the private line | |
| PV maximum output | |
| BESS discharging maximum output | |
| BESS charging maximum input | |
| DC bus minimum voltage | |
| DC bus voltage | |
| DC bus maximum voltage | |
| PV output voltage | |
| Maximum Power Point Tracking at PVC | |
| BESS minimum SOC | |
| BESS SOC | |
| BESS maximum SOC | |
| Set PVC SOC | |
| Set PVC power | |
| Critical electric load | |
| Non-critical load | |
| Maximum non-critical load | |
Abbreviations
| BESS | Battery Energy Storage System |
| BEMS | Building Energy Management System |
| CEMS | Community Energy Management System |
| DER | Distributed Energy Resources |
| EMS | Energy Management System |
| HEMS | Home Energy Management System |
| NCLS | Non-critical Load shedding |
| PI | Proportional Integrator |
| PLL | Phase Locked Loop |
| PV | Photovoltaic |
| PVC | PV Curtailment |
| QSG | Quadrature Signature Generator |
| SOC | State of Charge |
| SOGI | Second Order Generalized Integrator |
| VSC | Voltage Source Converter |
References
- Elavarasan, R.M.; Shafiullah, G.; Padmanaban, S.; Kumar, N.M.; Annam, A.; Vetrichelvan, A.M.; Mihet-Popa, L.; Holm-Nielsen, J.B. A Comprehensive Review on Renewable Energy Development, Challenges, and Policies of Leading Indian States with an International Perspective. IEEE Access 2020, 8, 74432–74457. [Google Scholar] [CrossRef]
- Rehman, W.U.; Bhatti, A.R.; Awan, A.B.; Sajjad, I.A.; Khan, A.A.; Bo, R.; Haroon, S.S.; Amin, S.; Tlili, I.; Oboreh-Snapps, O. The Penetration of Renewable and Sustainable Energy in Asia: A State-of-the-Art Review on Net-Metering. IEEE Access 2020, 8, 170364–170388. [Google Scholar] [CrossRef]
- Alharbi, F.R.; Csala, D. GCC Countries’ Renewable Energy Penetration and the Progress of Their Energy Sector Projects. IEEE Access 2020, 8, 211986–212002. [Google Scholar] [CrossRef]
- Xu, S.; Xue, Y.; Chang, L. Review of Power System Support Functions for Inverter-Based Distributed Energy Resources- Standards, Control Algorithms, and Trends. IEEE Open J. Power Electron. 2021, 2, 88–105. [Google Scholar] [CrossRef]
- Olivares, D.E.; Mehrizi-Sani, A.; Etemadi, A.H.; Cañizares, C.A.; Iravani, R.; Kazerani, M.; Hajimiragha, A.H.; Gomis-Bellmunt, O.; Saeedifard, M.; Palma-Behnke, R.; et al. Trends in Microgrid Control. IEEE Trans. Smart Grid 2014, 5, 1905–1919. [Google Scholar] [CrossRef]
- Farrokhabadi, M.; Lagos, D.; Wies, R.W.; Paolone, M.; Liserre, M.; Meegahapola, L.; Kabalan, M.; Hajimiragha, A.H.; Peralta, D.; Elizondo, M.A.; et al. Microgrid Stability Definitions, Analysis, and Examples. IEEE Trans. Power Syst. 2020, 35, 13–29. [Google Scholar] [CrossRef]
- Bahaj, A.S.; James, P.A.B. Electrical Minigrids for Development: Lessons from the Field. Proc. IEEE 2019, 107, 1967–1980. [Google Scholar] [CrossRef] [Green Version]
- Kempener, R.; Lavagne, O.; Saygin, D.; Skeer, J.; Vinci, S.; Gielen, D. Off-Grid Renewable Energy Systems: Status and Methodological Issues; The International Renewable Energy Agency (IRENA): Ahbu Dhabi, United Arab Emirates, 2015; pp. 5–10. [Google Scholar]
- Bedawy, A.; Yorino, N.; Mahmoud, K.; Lehtonen, M. An Effective Coordination Strategy for Voltage Regulation in Distribution System Containing High Intermittent Photovoltaic Penetrations. IEEE Access 2021, 9, 117404–117414. [Google Scholar] [CrossRef]
- Yorino, N.; Taenaka, H.; Bedawy, A.; Sasaki, Y.; Zoka, Y. Novel Agent-Based Voltage Control Methods for PV Prosumers Using Nodal Price. Electr. Power Syst. Res. 2022, 213, 108407. [Google Scholar] [CrossRef]
- Sasaki, Y.; Yorino, N.; Zoka, Y.; Wahyudi, F. Robust Stochastic Dynamic Load Dispatch against Uncertainties. IEEE Trans. Smart Grid 2018, 9, 5535–5542. [Google Scholar] [CrossRef]
- Blume, S.W. Interconnected Power Systems. Electric Power System Basics for the Nonelectrical Professional; IEEE Press: Piscataway, NJ, USA, 2016; Volume 2, Chapter 8; pp. 165–186. [Google Scholar] [CrossRef]
- Sasaki, Y.; Tsurumi, T.; Yorino, N.; Zoka, Y.; Beni Rehiara, A. Real-Time Dynamic Economic Load Dispatch Integrated with Renewable Energy Curtailment. J. Int. Counc. Electr. Eng. 2019, 9, 85–92. [Google Scholar] [CrossRef]
- Afzal, S.; Mokhlis, H.; Azil Lllias, H.; Nadzirah Mansor, N.; Shareef, H. State-of-the-Art Review on Power System Resilience and Assessment Techniques. IET Gener. Transm. Distrib. 2020, 14, 6107–6121. [Google Scholar] [CrossRef]
- Mohamed, M.A.; Chen, T.; Su, W.; Jin, T. Proactive Resilience of Power Systems against Natural Disasters: A Literature Review. IEEE Access 2019, 7, 163778–163795. [Google Scholar] [CrossRef]
- Wang, Y.; Chen, C.; Wang, J.; Baldick, R. Research on Resilience of Power Systems under Natural Disasters—A Review. IEEE Trans. Power Syst. 2016, 31, 1604–1613. [Google Scholar] [CrossRef]
- Abbey, C.; Cornforth, D.; Hatziargyriou, N.; Hirose, K.; Kwasinski, A.; Kyriakides, E.; Platt, G.; Reyes, L.; Suryanarayanan, S. Powering through the Storm: Microgrids Operation for More Efficient Disaster Recovery. IEEE Power Energy Mag. 2014, 12, 67–76. [Google Scholar] [CrossRef]
- Hashimoto, J.; Ustun, T.S.; Suzuki, M.; Sugahara, S.; Hasegawa, M.; Otani, K. Advanced Grid Integration Test Platform for Increased Distributed Renewable Energy Penetration in Smart Grids. IEEE Access 2021, 9, 34040–34053. [Google Scholar] [CrossRef]
- Dragicevic, T.; Lu, X.; Vasquez, J.C.; Guerrero, J.M. DC Microgrids—Part I: A Review of Control Strategies and Stabilization Techniques. IEEE Trans. Power Electron 2016, 31, 4876–4891. [Google Scholar] [CrossRef] [Green Version]
- Dragičević, T.; Lu, X.; Vasquez, J.C.; Guerrero, J.M. DC Microgrids—Part II: A Review of Power Architectures, Applications, and Standardization Issues. IEEE Trans. Power Electron 2016, 31, 3528–3549. [Google Scholar] [CrossRef] [Green Version]
- Khodadoost Arani, A.A.; Gharehpetian, G.B.; Abedi, M. Review on Energy Storage Systems Control Methods in Microgrids. Int. J. Electr. Power Energy Syst. 2019, 107, 745–757. [Google Scholar] [CrossRef]
- Rehman, A.U.; Wadud, Z.; Elavarasan, R.M.; Hafeez, G.; Khan, I.; Shafiq, Z.; Alhelou, H.H. An Optimal Power Usage Scheduling in Smart Grid Integrated with Renewable Energy Sources for Energy Management. IEEE Access 2021, 9, 84619–84638. [Google Scholar] [CrossRef]
- Singaravelan, A.; Kowsalya, M.; Ram, J.P.; Gunapriya, B.; Kim, Y.J. Application of Two-Phase Simplex Method (TPSM) for an Efficient Home Energy Management System to Reduce Peak Demand and Consumer Consumption Cost. IEEE Access 2021, 9, 63591–63601. [Google Scholar] [CrossRef]
- Michaelson, D.; Mahmood, H.; Jiang, J. A Predictive Energy Management System Using Pre-Emptive Load Shedding for Islanded Photovoltaic Microgrids. IEEE Trans. Ind. Electron. 2017, 64, 5440–5448. [Google Scholar] [CrossRef]
- Dinh, H.T.; Yun, J.; Kim, D.M.; Lee, K.H.; Kim, D. A Home Energy Management System with Renewable Energy and Energy Storage Utilizing Main Grid and Electricity Selling. IEEE Access 2020, 8, 49436–49450. [Google Scholar] [CrossRef]
- Kumar, P.S.; Chandrasena, R.P.S.; Ramu, V.; Srinivas, G.N.; Babu, K.V.S.M. Energy Management System for Small Scale Hybrid Wind Solar Battery Based Microgrid. IEEE Access 2020, 8, 8336–8345. [Google Scholar] [CrossRef]
- Mathew, P.; Madichetty, S.; Mishra, S. A Multilevel Distributed Hybrid Control Scheme for Islanded DC Microgrids. IEEE Syst J 2019, 13, 4200–4207. [Google Scholar] [CrossRef]
- Ortiz, L.; Orizondo, R.; Águila, A.; González, J.W.; López, G.J.; Isaac, I. Hybrid AC/DC Microgrid Test System Simulation: Grid-Connected Mode. Heliyon 2019, 5, e02862. [Google Scholar] [CrossRef] [PubMed] [Green Version]
- Njoya Motapon, S.; Dessaint, L.A.; Al-Haddad, K. A Comparative Study of Energy Management Schemes for a Fuel-Cell Hybrid Emergency Power System of More-Electric Aircraft. IEEE Trans. Ind. Electron. 2014, 61, 1320–1334. [Google Scholar] [CrossRef]
- Albuquerque, F.L.; Moraes, A.J.; Guimarães, G.C.; Sanhueza, S.M.R.; Vaz, A.R. Photovoltaic Solar System Connected to the Electric Power Grid Operating as Active Power Generator and Reactive Power Compensator. Sol. Energy 2010, 84, 1310–1317. [Google Scholar] [CrossRef]
- Aznavi, S.; Fajri, P.; Asrari, A.; Harirchi, F. Realistic and Intelligent Management of Connected Storage Devices in Future Smart Homes Considering Energy Price Tag. IEEE Trans. Ind. Appl. 2020, 56, 1679–1689. [Google Scholar] [CrossRef]
- Sasaki, Y.; Shimamura, Y.; Yamamoto, Y.; Zoka, Y.; Yorino, N.; Mayaguchi, N. Development of an EMS Simulator for the Purpose of Installation of Photovoltaic Power Generation and Storage Battery in a Customer—Considering Thermal Constraints of Storage Battery. Trans. Inst. Electr. Install. Eng. Jpn. 2019, 39, 41–49. [Google Scholar] [CrossRef]
- Yorino, N.; Sekizaki, S.; Adachi, K.; Sasaki, Y.; Zoka, Y.; Bedawy, A.; Shimizu, T.; Amimoto, K. A Novel Design of Single-Phase Microgrid Based on Non-Interference Core Synchronous Inverters for Power System Stabilization. IET Gener. Transm. Distrib. 2022, 1–15. [Google Scholar] [CrossRef]
- Ciobotaru, M.; Teodorescu, R.; Blaabjerg, F. A New Single-Phase PLL Structure Based on Second Order Generalized Integrator. In Proceedings of the 2006 37th IEEE Power Electronics Specialists Conference, Jeju, Korea, 18–22 June 2006. [Google Scholar] [CrossRef]
- Yang, Y.; Hadjidemetriou, L.; Blaabjerg, F.; Kyriakides, E. Benchmarking of Phase Locked Loop Based Synchronization Techniques for Grid-Connected Inverter Systems. In Proceedings of the 2015 9th International Conference on Power Electronics and ECCE Asia (ICPE-ECCE Asia), Seoul, Korea, 1–5 June 2015; pp. 2167–2174. [Google Scholar] [CrossRef] [Green Version]
- Xu, J.; Qian, H.; Hu, Y.; Bian, S.; Xie, S. Overview of SOGI-Based Single-Phase Phase-Locked Loops for Grid Synchronization under Complex Grid Conditions. IEEE Access 2021, 9, 39275–39291. [Google Scholar] [CrossRef]
- Basic, D. Input Current Interharmonics of Variable-Speed Drives Due to Motor Current Imbalance. IEEE Trans. Power Deliv. 2010, 25, 2797–2806. [Google Scholar] [CrossRef]
- Xin, Z.; Wang, X.; Qin, Z.; Lu, M.; Loh, P.C.; Blaabjerg, F. An Improved Second-Order Generalized Integrator Based Quadrature Signal Generator. IEEE Trans. Power Electron. 2016, 31, 8068–8073. [Google Scholar] [CrossRef]
- Sasaki, Y.; Ueoka, M.; Yorino, N.; Zoka, Y.; Bedawy, A.; Kihembo, M.S. Dynamic Economic Load Dispatch with Emergency Demand Response for Microgrid System Operation. In Proceedings of the 2021 22nd International Middle East Power Systems Conference (MEPCON), Assiut, Egypt, 14–16 December 2021; pp. 497–502. [Google Scholar] [CrossRef]
- Mumbere, K.S.; Sasaki, Y.; Yorino, N.; Zoka, Y.; Bedawy, A.; Tanioka, Y. An Interconnected Prosumer Energy Management System Model for Improved Outage Resilience. In Proceedings of the 2022 IEEE PES/IAS PowerAfrica, Kigali, Rwanda, 22–26 August 2022. [Google Scholar] [CrossRef]
- Samuel, M.K.; Fukuhara, A.; Sasaki, Y.; Zoka, Y.; Yorino, N.; Tanioka, Y. A Novel Energy Management Approach to Networked Microgrids for Disaster Resilience. In Proceedings of the 2021 International Symposium on Devices, Circuits and Systems (ISDCS), Higashihiroshima, Japan, 3–5 March 2021. [Google Scholar] [CrossRef]
- Mumbere, S.K.; Tanioka, Y.; Matsumoto, S.; Sasaki, Y.; Zoka, Y.; Yorino, N. Distributed Control of Islanded Microgrids Based on Battery SOC in Disaster Situations. In Proceedings of the 2020 IEEE PES Innovative Smart Grid Technologies Europe (ISGT-Europe), The Hague, The Netherlands, 26–28 October 2020; pp. 1226–1230. [Google Scholar] [CrossRef]
- Mumbere, S.K.; Fukuhara, A.; Sasaki, Y.; Bedawy, A.; Zoka, Y.; Yorino, N. Development of An Energy Management System Tool for Disaster Resilience in Islanded Microgrid Networks. In Proceedings of the ISCIT 2021: 2021 20th International Symposium on Communications and Information Technologies: Quest for Quality of Life and Smart City, Tottori, Japan, 19–22 October 2021; pp. 97–100. [Google Scholar] [CrossRef]
- Mumbere, K.S.; Sasaki, Y.; Yorino, N.; Fukuhara, A.; Zoka, Y.; Bedawy, A.; Tanioka, Y. Prosumer Control Strategy for A Robust Microgrid Energy Management System. In Proceedings of the 2021 IEEE PES Innovative Smart Grid Technologies Europe: Smart Grids: Toward a Carbon-Free Future, ISGT Europe, Espoo, Finland, 18–21 October 2021. [Google Scholar] [CrossRef]
- Mumbere, S.K.; Tanioka, Y.; Matsumoto, S.; Fukuhara, A.; Sasaki, Y.; Zoka, Y.; Yorino, N. A Novel Energy Management Technique for Shared Solar and Storage Resources in Remote Communities. In Proceedings of the 2020 IEEE PES/IAS PowerAfrica, Nairobi, Kenya, 25–28 August 2020. [Google Scholar] [CrossRef]
- Mumbere, S.K.; Matsumoto, S.; Fukuhara, A.; Bedawy, A.; Sasaki, Y.; Zoka, Y.; Yorino, N.; Tanioka, Y. An Energy Management System for Disaster Resilience in Islanded Microgrid Networks. In Proceedings of the 2021 IEEE PES/IAS PowerAfrica, Nairobi, Kenya, 23–27 August 2021. [Google Scholar] [CrossRef]
- Tanioka, Y.; Sasaki, Y.; Mastumoto, S.; Mumbere, K.S.; Fukuhara, A.; Sekizaki, S.; Yorino, naoto; Zoka, Y. A Study on Power Sharing Control Considering State of Charge of Prosumers Batteries in Local Community. Trans. Inst. Electr. Install. Eng. Jpn. 2021, 41, 19–28. [Google Scholar] [CrossRef]
- Teodorescu, R.; Liserre, M.; Rodríguez, P. Grid Synchronization in Single-Phase Power Converters. Grid Convert. Photovolt. Wind Power Syst. 2010, 29, 43–91. [Google Scholar] [CrossRef]
- Sasaki, Y.; Enomoto, S.; Yorino, N.; Zoka, Y.; Kihembo, M.S. Solar Power Prediction Using Iterative Network Pruning Technique for Microgrid Operation. In Proceedings of the 2021 IEEE PES Innovative Smart Grid Technologies-Asia (ISGT Asia), Brisbane, Australia, 5–8 December 2021. [Google Scholar] [CrossRef]
- Rehiara, A.B.; Yorino, N.; Sasaki, Y.; Zoka, Y. A Novel Adaptive LFC Based on MPC Method. IEEJ Trans. Electr. Electron. Eng. 2019, 14, 1145–1152. [Google Scholar] [CrossRef]
- Wang, W.; Yorino, N.; Sasaki, Y.; Zoka, Y.; Bedawy, A.; Kawauchi, S. A Novel Adaptive Model Predictive Frequency Control Using Unscented Kalman Filter. Electr. Power Syst. Res. 2022, 213, 108721. [Google Scholar] [CrossRef]
Figure 1.
Classification of grids by capacity.

Figure 2.
The proposed prosumer model.

Figure 4.
The proposed load model.

Figure 5.
Definition of the BESS SOC operating region.

Figure 7.
Simulation setup.

Figure 8.
Three-day weather pattern possibilities.

Figure 9.
(a) Three-day weather data. (b) Three-day load profiles.

Figure 10.
Test case 1 (disconnected). (a) Performance of prosumer X. (b) Performance of prosumer Y.
Figure 10.
Test case 1 (disconnected). (a) Performance of prosumer X. (b) Performance of prosumer Y.

Figure 11.
Test case 2 (Disconnected). (a) Performance of prosumer X. (b) Performance of prosumer Y.
Figure 11.
Test case 2 (Disconnected). (a) Performance of prosumer X. (b) Performance of prosumer Y.

Figure 12.
Test case 3 (Connected). (a) Performance of prosumer X. (b) Performance of prosumer Y.

Figure 13.
Test case 4 (Connected). (a) Performance of prosumer X. (b) Performance of prosumer Y.

Figure 14.
Test case 5 (Connected). (a) Performance of prosumer X. (b) Performance of prosumer Y.

Table 3.
SOC Settings for Each Prosumer.
| Prosumer | Initial Value [%] | PVC Value [%] | ||
|---|---|---|---|---|
| X | 80 | 80 | 65 | 60 |
| Y | 50 | 80 | 45 | 40 |
Table 4.
Summary of test cases.
| Test Case | Connection Status | Prosumer X | Prosumer Y | ||||
|---|---|---|---|---|---|---|---|
| PVC | NCLS | FLS | PVC | NCLS | FLS | ||
| 1 | Disconnected | ✓ | ✕ | NA | ✓ | ✕ | NA |
| 2 | Disconnected | ✓ | ✓ | NA | ✓ | ✓ | NA |
| 3 | Connected | ✓ | ✕ | ✕ | ✓ | ✕ | ✕ |
| 4 | Connected | ✓ | ✓ | ✕ | ✓ | ✓ | ✕ |
| 5 1 | Connected | ✓ | ✓ | ✓ | ✓ | ✓ | ✓ |
1 The proposed method.
Table 5.
Summary of results.
| Test Case | Prosumer | Initial SOC (%) | Final SOC (%) | Result of Simulation |
|---|---|---|---|---|
| 1 | X | 50 | NA | Unstable (day 2) |
| Y | 80 | 46.7 | Stable | |
| 2 | X | 50 | NA | Unstable (day 3) |
| Y | 80 | 52.10 | Stable | |
| 3 | X | 50 | NA | Unstable (day 2) |
| Y | 80 | NA | Unstable (day 2) | |
| 4 | X | 50 | 7.3 | Stable |
| Y | 80 | 38.3 | Stable | |
| 5 1 | X | 50 | 42.7 | Stable |
| Y | 80 | 40 | Stable |
1 The proposed method.
Disclaimer/Publisher’s Note: The statements, opinions and data contained in all publications are solely those of the individual author(s) and contributor(s) and not of MDPI and/or the editor(s). MDPI and/or the editor(s) disclaim responsibility for any injury to people or property resulting from any ideas, methods, instructions or products referred to in the content. |
© 2023 by the authors. Licensee MDPI, Basel, Switzerland. This article is an open access article distributed under the terms and conditions of the Creative Commons Attribution (CC BY) license (https://creativecommons.org/licenses/by/4.0/).
Share and Cite
MDPI and ACS Style
Mumbere, K.S.; Sasaki, Y.; Yorino, N.; Zoka, Y.; Tanioka, Y.; Bedawy, A. A Resilient Prosumer Model for Microgrid Communities with High PV Penetration. Energies 2023, 16, 621. https://doi.org/10.3390/en16020621
AMA Style
Mumbere KS, Sasaki Y, Yorino N, Zoka Y, Tanioka Y, Bedawy A. A Resilient Prosumer Model for Microgrid Communities with High PV Penetration. Energies. 2023; 16(2):621. https://doi.org/10.3390/en16020621
Chicago/Turabian StyleMumbere, Kihembo Samuel, Yutaka Sasaki, Naoto Yorino, Yoshifumi Zoka, Yoshiki Tanioka, and Ahmed Bedawy. 2023. "A Resilient Prosumer Model for Microgrid Communities with High PV Penetration" Energies 16, no. 2: 621. https://doi.org/10.3390/en16020621
Note that from the first issue of 2016, this journal uses article numbers instead of page numbers. See further details here.