Article

Design and Optimization of a Liquid Cooling Thermal Management System with Flow Distributors and Spiral Channel Cooling Plates for Lithium-Ion Batteries

1
Faculty of Maritime and Transportation, Ningbo University, Ningbo 315211, China
2
School of Physical Science and Technology, Ningbo University, Ningbo 315211, China
*
Authors to whom correspondence should be addressed.
Energies 2023, 16(5), 2196; https://doi.org/10.3390/en16052196
Submission received: 13 January 2023 / Revised: 17 February 2023 / Accepted: 21 February 2023 / Published: 24 February 2023
(This article belongs to the Section A: Sustainable Energy)

Abstract

:
In this study, a three-dimensional transient simulation model of a liquid cooling thermal management system with flow distributors and spiral channel cooling plates for pouch lithium-ion batteries has been developed. The cooling plates play the role of uniforming temperature distribution and reducing the maximum temperature within each battery, while the flow distributors have the function of reducing the temperature difference between batteries in the battery module. The accuracy of the thermophysical properties and heat generation rate of the battery was verified experimentally. The optimal structure and cooling strategy of the system was determined by single factor analysis as well as orthogonal test and matrix analysis methods. The optimal solution resulted in a maximum battery module temperature of 34.65 °C, a maximum temperature difference of 3.95 °C, and a channel pressure drop of 8.82 Pa. Using the world-harmonized light-duty vehicles test cycle (WLTC) conditions for a battery pack in an electric car, the performance of the optimal battery thermal management system (BTMS) design was tested, and the results indicate that the maximum temperature can be controlled below 25.51 °C and the maximum temperature difference below 0.21 °C, which well meet the requirements of BTMS designs.

1. Introduction

Global climate change, the energy crisis, and the need to mitigate environmental pollution have resulted in a boom in the development of hybrid electric vehicles (HEVs) and electric vehicles (EVs) in the transportation sector. Electric vehicles are considered to be an effective and alternative technology to the conventional internal combustion engine vehicles (ICEVs) [1]. Lithium-ion batteries (LIBs) are widely used in HEVs and EVs because of their low self-discharge rate, long cycle life, and high power and energy density [2]. The electrochemical nature of lithium-ion batteries means that their optimal operating temperature is between 15 and 35 °C [3]. Temperatures above or below this range can affect performance and even give rise to safety issues such as thermal runaway. In addition, recent studies on two-dimensional heat generation behaviors [4,5] have highlighted the necessity to consider uneven heat generation and battery temperature distribution in the design of BTMS. An understanding of the heat generation mechanism and spatial distribution of the generated heat is critical to the analyses of the temperature behavior of the batteries. Uneven temperature distribution inside the battery can also cause an imbalance in the internal state of charge (SOC), resulting in a region of the battery decaying too fast [6], and causing overcharge and over discharge problems. Within the battery module or battery pack, uneven temperatures between different batteries can also result in issues such as inconsistent pack capacity and overcharge and over discharge, which can seriously affect the safety and power output performance of the battery pack. Therefore, a basic consideration in the design of BTMS is the minimization of the temperature difference inside a single battery and between different batteries in the battery module and pack. The temperature difference acceptable is thought to be within 5 °C [7]. To meet the thermal safety requirements of LIBs, the design of the optimal BTMS is critical.
Battery thermal management methods usually include air cooling, phase change material (PCM) cooling, and liquid cooling. Air cooling was widely used in early BTMS for hybrid electric vehicles and electric vehicles due to its simple structure, light weight, and low cost [8]. However, the low thermal conductivity of air means that it is difficult to meet cooling requirements as energy density and range requirements increase [9]. In recent years, phase change material cooling has attracted intensive attention due to its advantages, such as zero power consumption and good temperature uniformity capability [10], but the drawbacks of low thermal conductivity, difficult material encapsulation and limited latent heat also limit its use in the BTMS of electric vehicles [11]. In contrast, liquid cooling has more efficient temperature control and smaller unit size due to the higher thermal conductivity and higher specific heat capacity of the coolants [12] and, therefore, is now widely used in the thermal management of EVs.
Liquid cooling includes direct cooling and indirect cooling. Direct cooling involves the direct immersion of the battery into a coolant. Although this method sounds simple and effective, it has high requirements for the cooling medium and packing method, and, therefore, is rarely used in the BTMS of electric vehicles. In contrast, indirect liquid cooling is widely adopted. For cylindrical LIBs, two indirect liquid cooling configurations—cooling tubes and cooling jackets—have been studied, while for square and pouch LIBs, the cooling plate configuration is widely adopted.
For the cooling tube configuration, Zhao et al. [13] found that increasing the heat exchange area between adjacent batteries would slightly improve the temperature uniformity within the battery module, while increasing the interfacial area between the battery and the outer wall of the channel could significantly reduce the maximum temperature within the battery module—which would be detrimental to temperature uniformity within the module. Cao et al. [14] investigated the cooling effect of corrugated cooling plates with a serpentine arrangement on a full-size-scale cylindrical battery pack, and developed a numerical model for the heat transfer and fluid flow in the pack. Rao et al. [15] found that liquid cooling systems with variable contact surfaces are superior to those with constant contact surfaces, and it can significantly improve the temperature uniformity of the battery module. Lai et al. [16] developed a thermally conductive structure with three curved contact surfaces to cool cylindrical batteries, showing the advantages of compactness and being lightweight. Spiral tubes have also been studied by several researchers [17,18].
For the cooling jacket configuration, the battery cells are cooled by radially or axially arranged channels. Sheng et al. [19] developed an alveolate liquid cooling jacket, which provides excellent control of the heat distribution in cylindrical LIBs. Liu et al. [20] showed that the battery modules with a tubular vertical layout performed better than those with a horizontal layout in a certain flow rate range. Zhu et al. [21] found that the temperature difference of the battery module could be reduced to 4.28 °C by the numerical study of a liquid cooling battery module with axial and radial synergistic heat dissipation.
For cooling plate configuration for square and pouch LIBs, the design of a liquid cooling structure is more diverse. Rao et al. [22] investigated liquid cooling plates (LCPs) with wedge-shaped microchannels. Results showed that wedge-shaped channels possess a high cooling efficiency and good temperature uniformity in the battery module. Sheng et al. [23] investigated a serpentine channel liquid cooling plate with dual inlets and outlets, and showed that arranging the inlets and outlets of the channels on different sides of the liquid cooling plate was more advantageous than arranging them on the same side. Mohammed et al. [24] designed a liquid cooling plate with a staggered pin arrangement. Liu et al. [25] proposed a tree-shaped microchannel LCP. There are also studies that focus on parallel through-channel liquid cooling plates [26,27]. Deng et al. [28] proposed a new double-layer reversible channel, including a collection layer channel and a dispersion layer channel, whose cooling performance is better than that of conventional serpentine channels and parallel channels. Patil et al. [29] used a U-shaped microchannel liquid cooling plate with multiple inlets and outlets to reduce the maximum temperature and temperature difference by 32.2% and 950.1%, respectively, relative to a crossflow with a single inlet and outlet flow path. In addition, there are studies for the channel profile [30] and setting the channel inside the LIBs [31].
Obviously, most previous studies tend to design liquid cooling plates with multiple inlets and outlets in order to achieve better cooling performance of battery modules and packs. However, such a design poses a great challenge to the arrangement of batteries in the pack. Moreover, it is difficult to uniformize the temperature distribution both within each battery and between different batteries. This paper aims to design a new type of BTMS—with a single inlet and outlet—that can simultaneously reduce the maximum temperature and improve temperature uniformity for pouch batteries. This system is also characterized by a novel dichotomous flow distributor and spiral-channeled liquid cooling plates. The cooling plates play the role of uniforming the temperature distribution and reducing the maximum temperature within each battery, while the flow distributors have the function of reducing the temperature difference between batteries in the battery module. As the cooling plates and flow distributor function together, the heat transferred from the batteries in the module can be dissipated more uniformly, resulting in lower maximum temperatures and smaller temperature differences in single batteries as well as in the module. The performance of the BTMS for an electric vehicle under WLTC conditions is also investigated.

2. Methodology

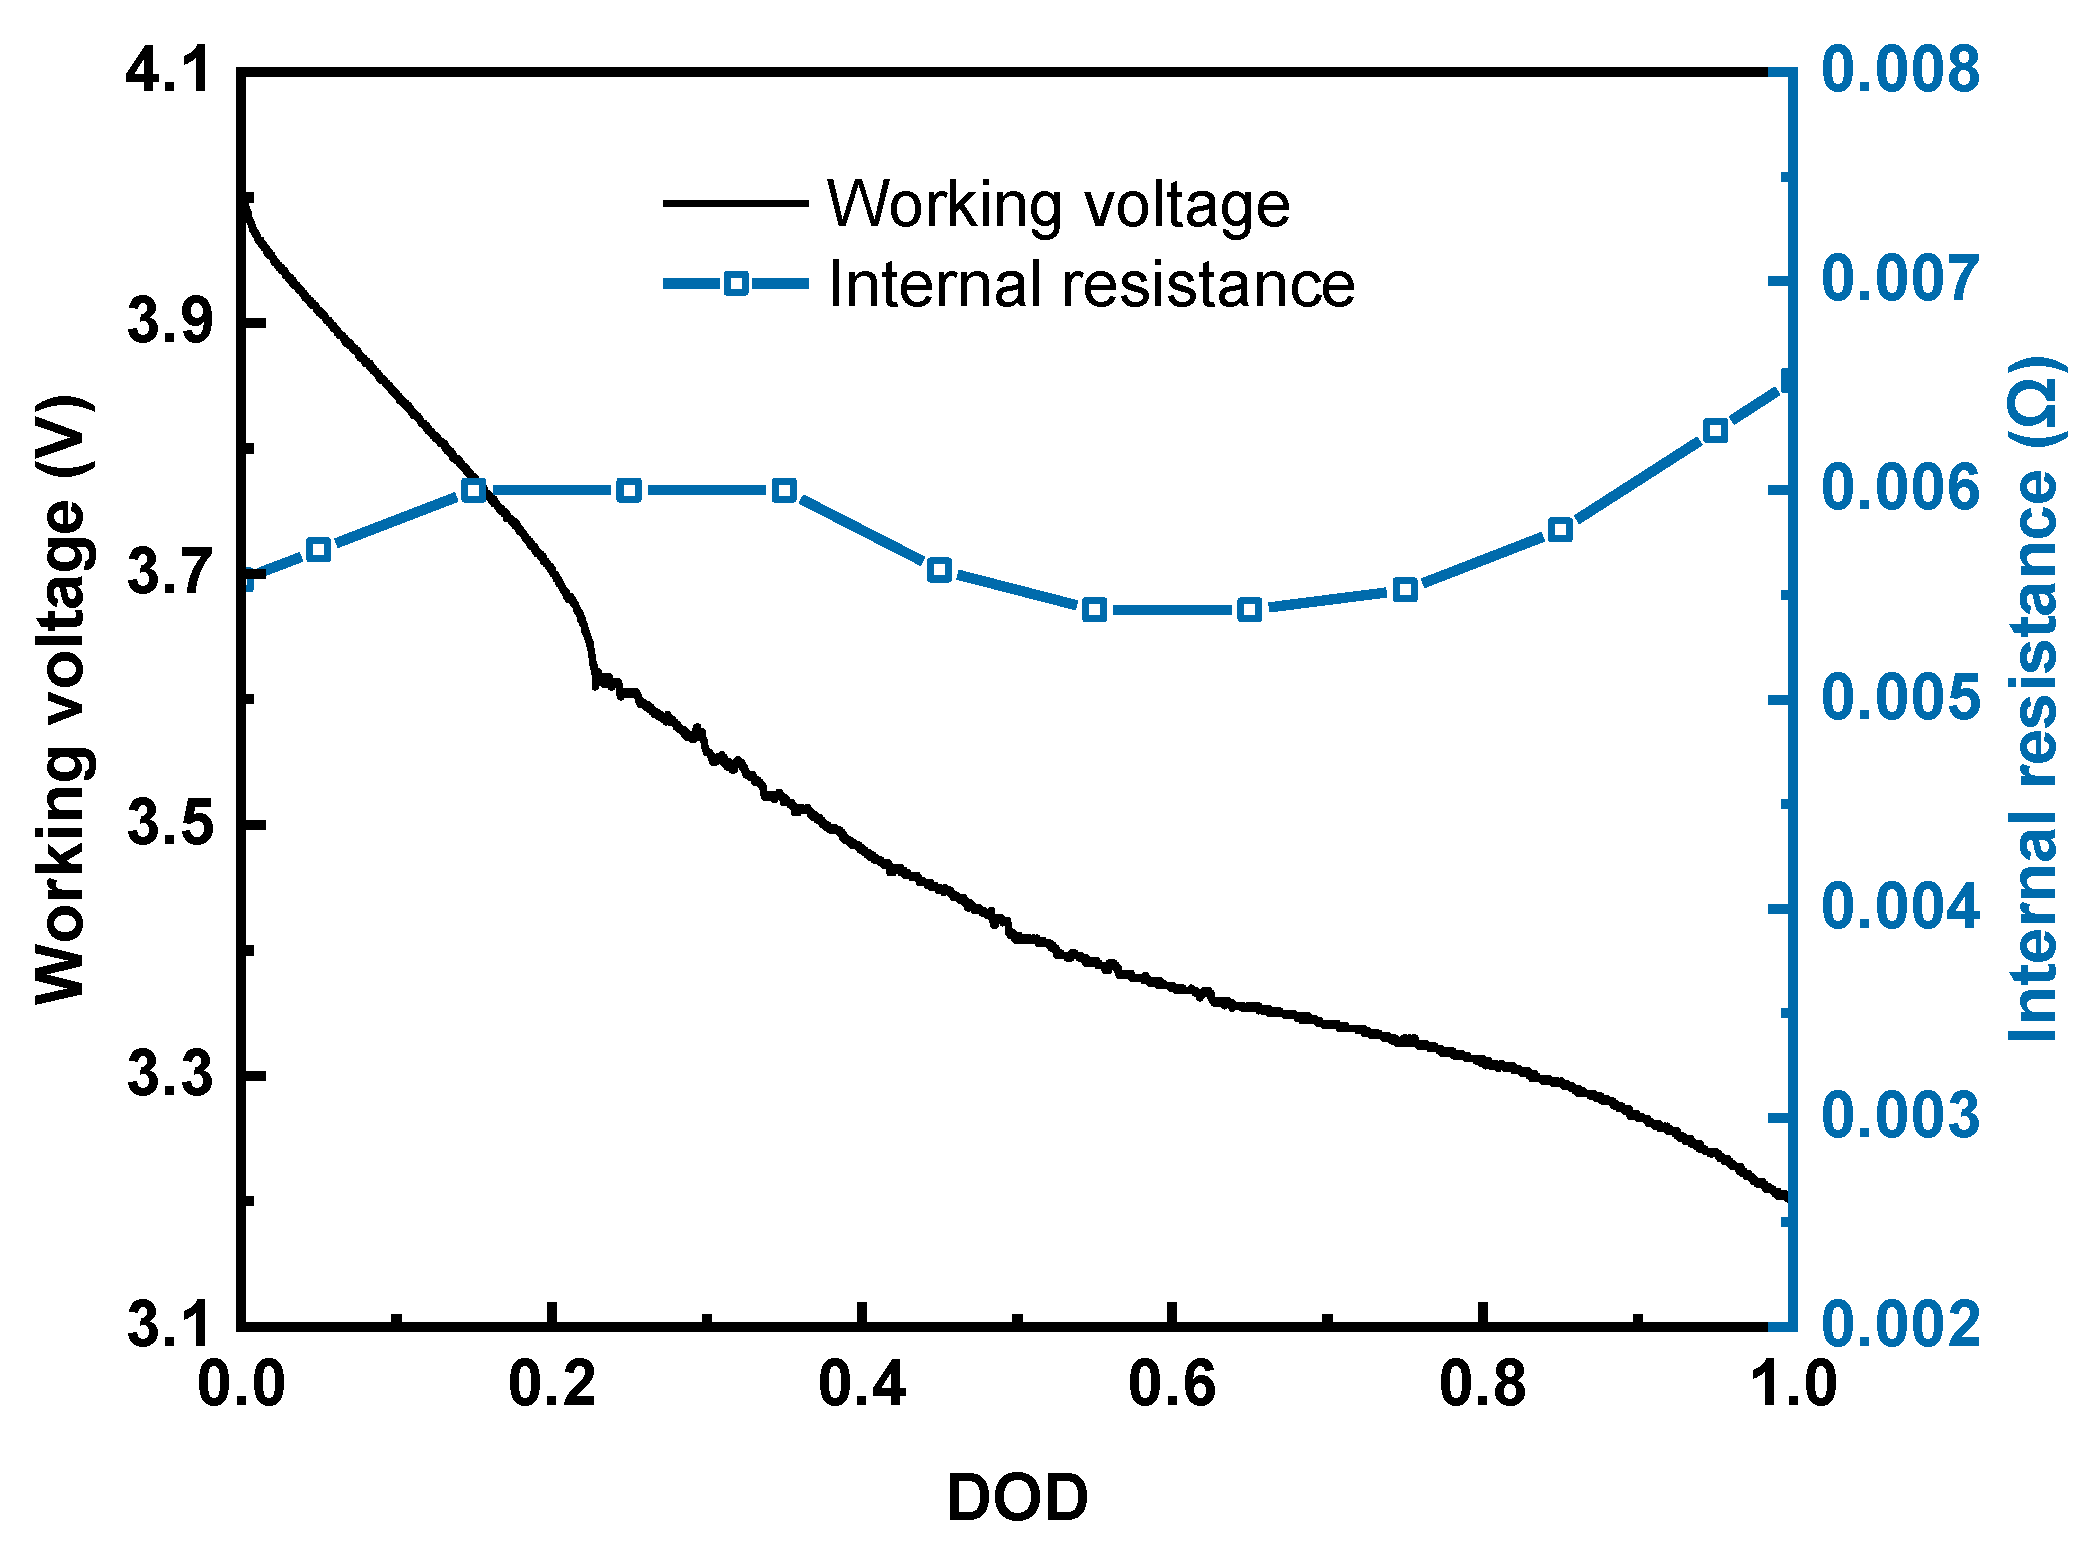
2.1. Specification and Heat Generation Rate of the LIB

In this work, a commercial lithium manganate pouch battery was considered. The thermal conductivity and specific heat capacity of Li-ion batteries were measured by the planar heat source method and the calibrated calorimetric method, respectively [32]. The planar heat source method is based on a non-stationary thermal conduction process, and the calibrated calorimetric method is based on the principle that in an approximately adiabatic condition, part of the heat generated by the heated film is absorbed by the battery, causing the battery temperature to increase; the remaining heat is then dissipated into the environment. Table 1 shows the specification of the battery.
The variation of internal electric resistance R T i (Ω) with SOC for a single battery at any discrete battery temperature Ti (Ti = 5, 15, 25, 35 or 45 °C) was measured using the hybrid pulse power characteristic (HPPC) method [33], and the relationship was fitted to a six-order polynomial as shown in Equation (1):
R T i = k 6 , T i S O C 6 + k 5 , T i S O C 5 + k 4 , T i S O C 4 + k 3 , T i S O C 3 + k 2 , T i S O C 2 + k 1 , T i S O C + k 0 , T i
where SOC represents the state of charge; k 0 , T i , k 1 , T i , k 2 , T i , k 3 , T i , k 4 , T i , k 5 , T i and k 6 , T i are the fitting coefficients at battery temperature Ti, which are listed in Table 2.
Based on Equation (1), the internal resistance (R) of a single battery at any battery temperature (T) between 5 to 45 °C can be obtained via temperature interpolation, as given in Equation (2):
R = R T i + R T i + 1 R T i T i + 1 T i ( T T i )
where T is the battery temperature in concern, Ti is one of the discrete temperatures (5, 15, 25, 35 or 45 °C), which is most close to, but lower than T, and Ti+1 is one of the discrete temperatures, which is most close to, but higher than T. R T i and R T i + 1 are the internal resistances at Ti and Ti+1, respectively.
Thus, the heat generation rate of the battery, q (W·m−3), at any discharge current can be obtained from Equation (3) [34]:
q = 1 V b ( I T d U O C d T + I 2 R )
where I, T, d U O C d T , R and Vb denote the current, temperature, entropy coefficient, internal resistance, and volume of the battery. The first term on the right-hand side is the expression for the reversible heat, which can be ignored due to its small entropy coefficient value. The second term describes the irreversible heat that is exothermic and proportional to the internal resistance and the square of the current.

2.2. Governing Equations

The governing equation of energy conservation for the batteries can be written as [35]:
ρ b C b T t = λ b 2 T + q
where, ρb, Cb and λb are the density, specific heat capacity, and thermal conductivity of the battery, respectively; q is the heat generation rate of the battery.
The governing equation of energy conservation for the coolant is described as follows:
ρ c c c T t + ( ρ c c c u T c ) = ( λ c T )
where ρc, Cc, λc, Tc and u   are the density, specifific heat capacity, and thermal conductivity temperature and velocity vector of the coolant, respectively.
The continuity equation of the coolant is:
ρ c t + ( ρ c u ) = 0
In each simulation case, the Reynolds number does not exceed 2300; thus, the laminar flow model is adopted in the simulations. The momentum conservation equation for the laminar flow can be written as:
t ( ρ c u ) + ( ρ c u u ) = P + ( τ = ) + ρ c g
where P is the static pressure, τ = is the stress tensor, and g is the acceleration of gravity.
The stress tensor τ = is given by:
τ = = μ ( u + u T )
where μ is the molecular viscosity.

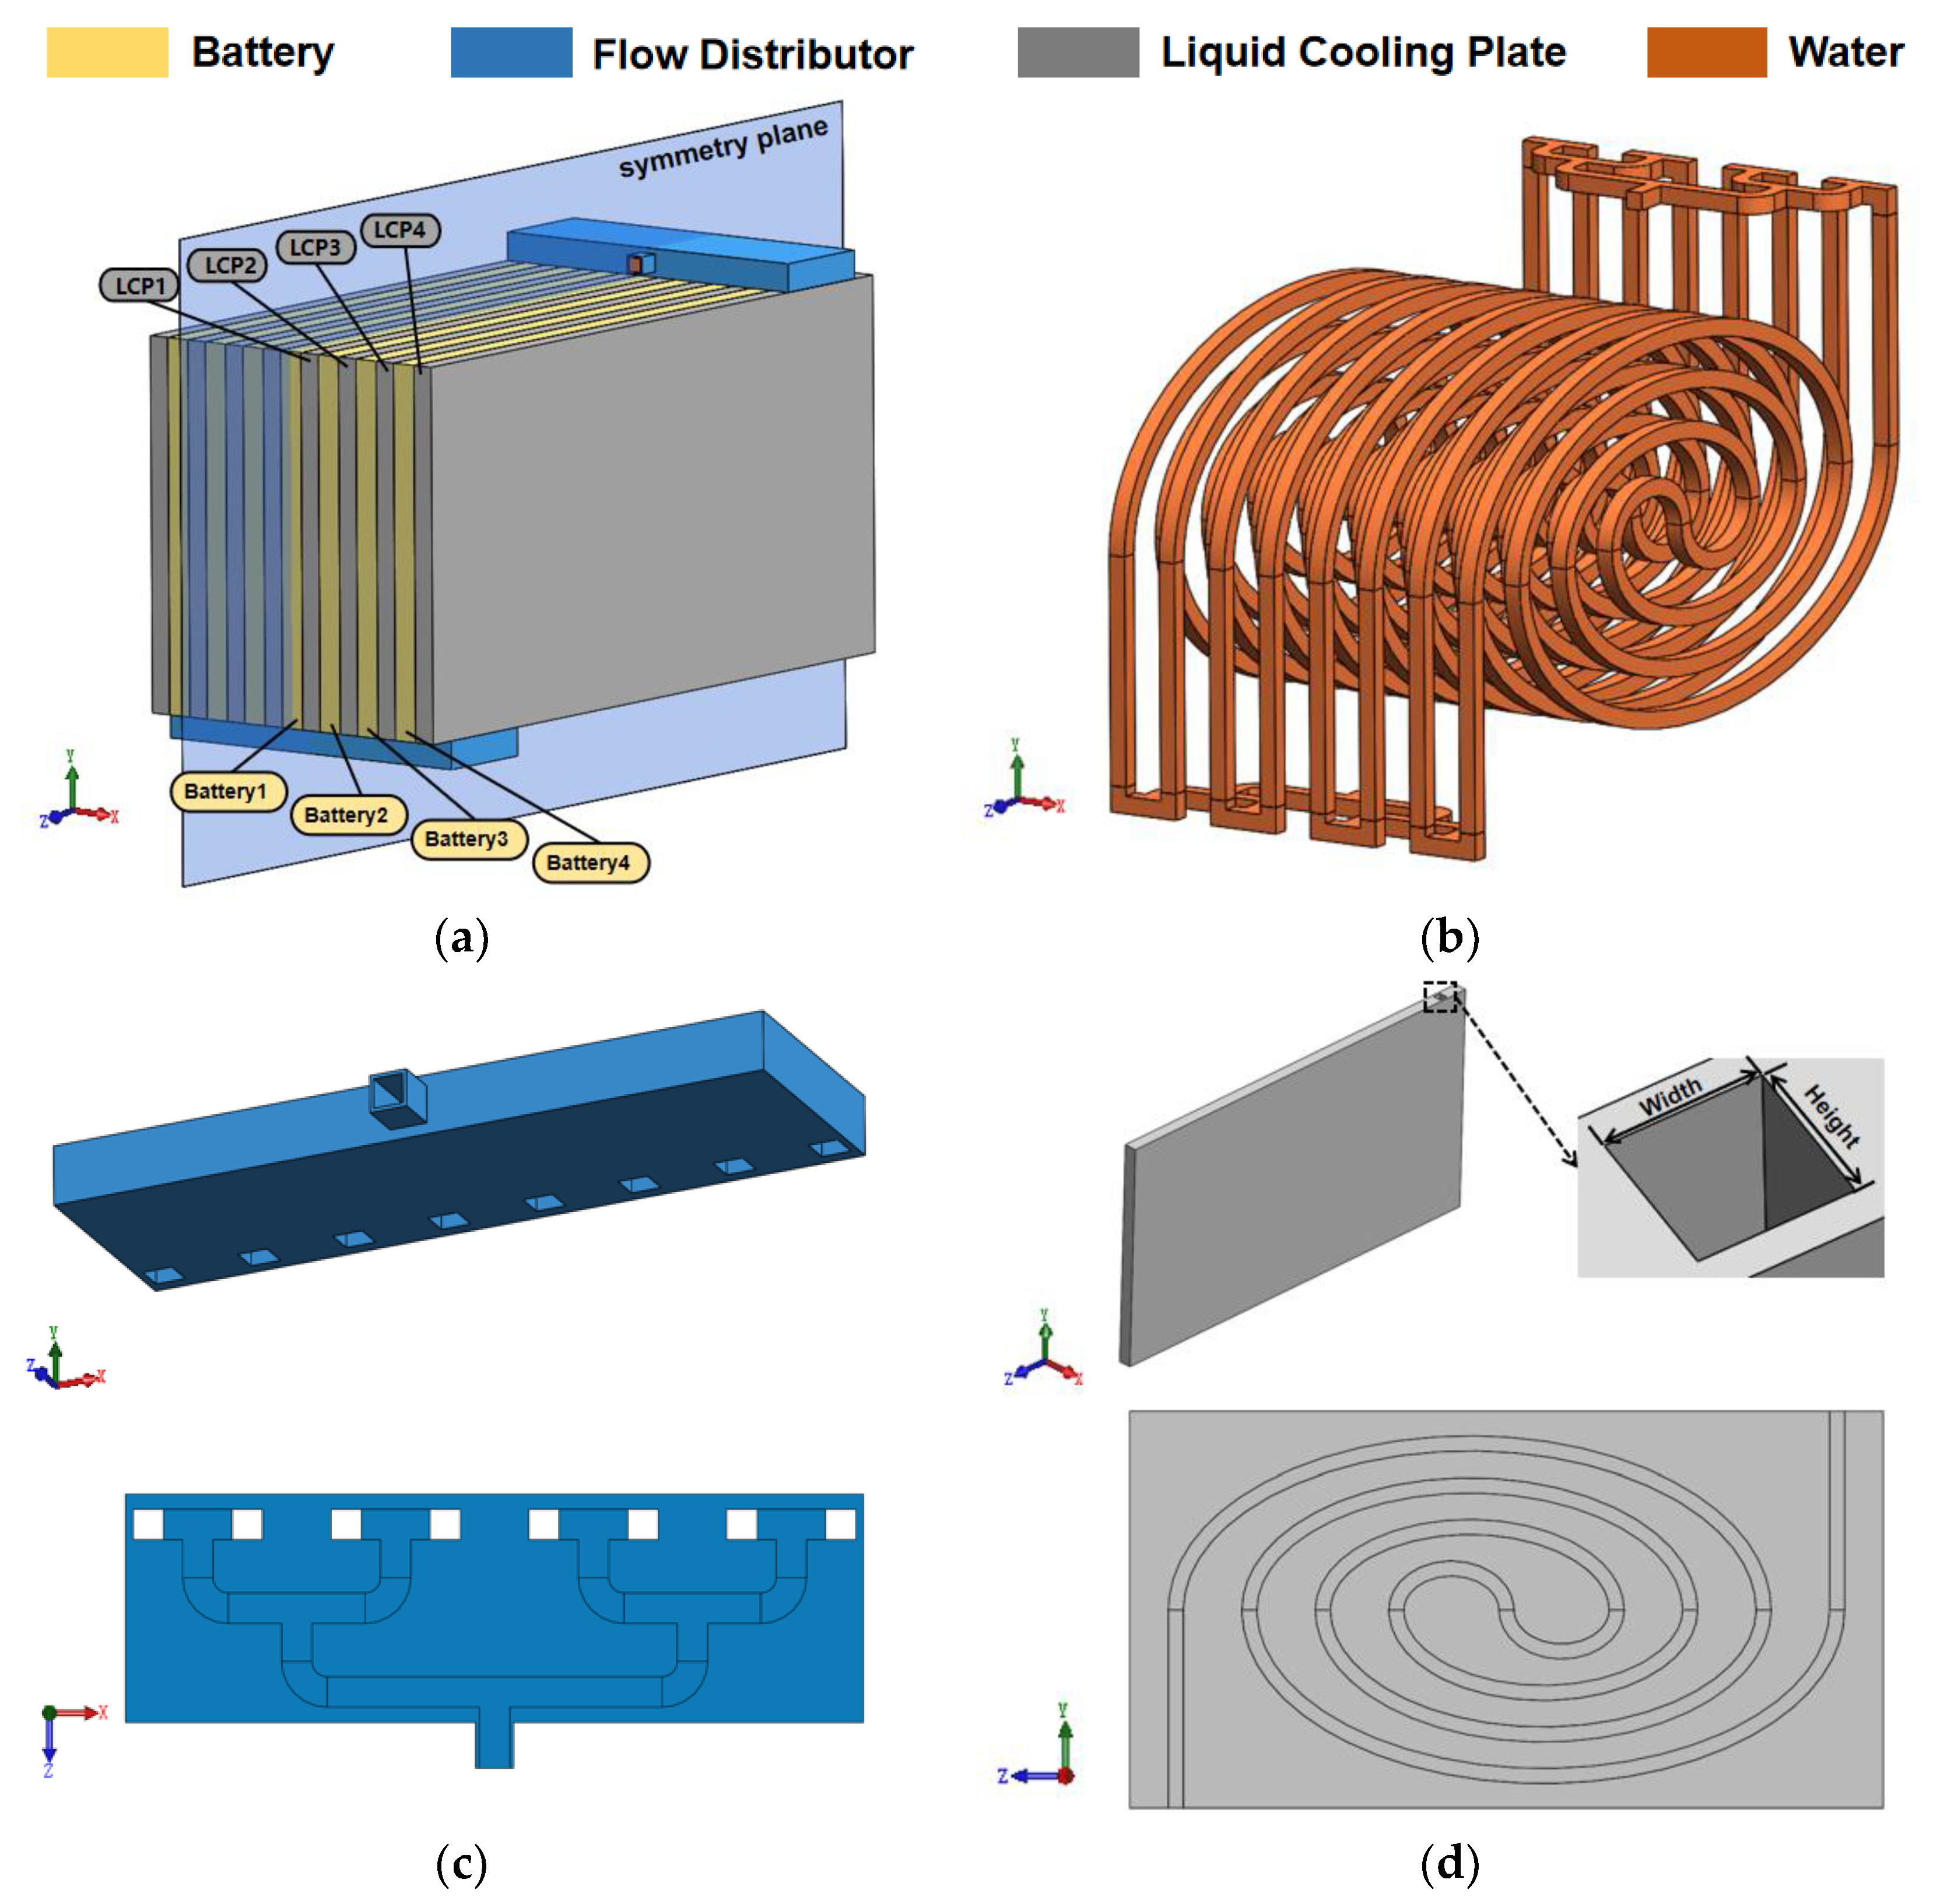
2.3. Structural Design of Liquid Cooling BTMS

The schematic diagram of the BTMS system is shown in Figure 1. The BTMS consists of two flow distributors (both dichotomous or multiseriate), eight liquid cooling plates (with spiral or serpentine channels), and seven lithium manganate pouch batteries (Figure 1a). The single flow stream of the coolant (water) is divided into eight tributaries by the upper flow distributor, and they then flow into the eight LCPs to cool the lithium battery. After they exit the LCPs, the eight tributaries are combined by the lower flow distributor and leave through a single outlet. The flow path of the coolant is shown in Figure 1b. It is worth noting that since the system is symmetric around the YZ surface, only a half of the structure needs to be evaluated in subsequent simulations to reduce computational cost. Figure 1c shows a dichotomous flow distributor with the main part having dimensions of 97 × 30 × 8 mm. Figure 1d shows an LCP with a spiral channel with the dimension of 200 × 105 × 6 mm. The width and height of the channel in the cooling plates are equal to the width and height of the dichotomous flow distributor. The length of the channel is defined as the length of the centerline of the channel.

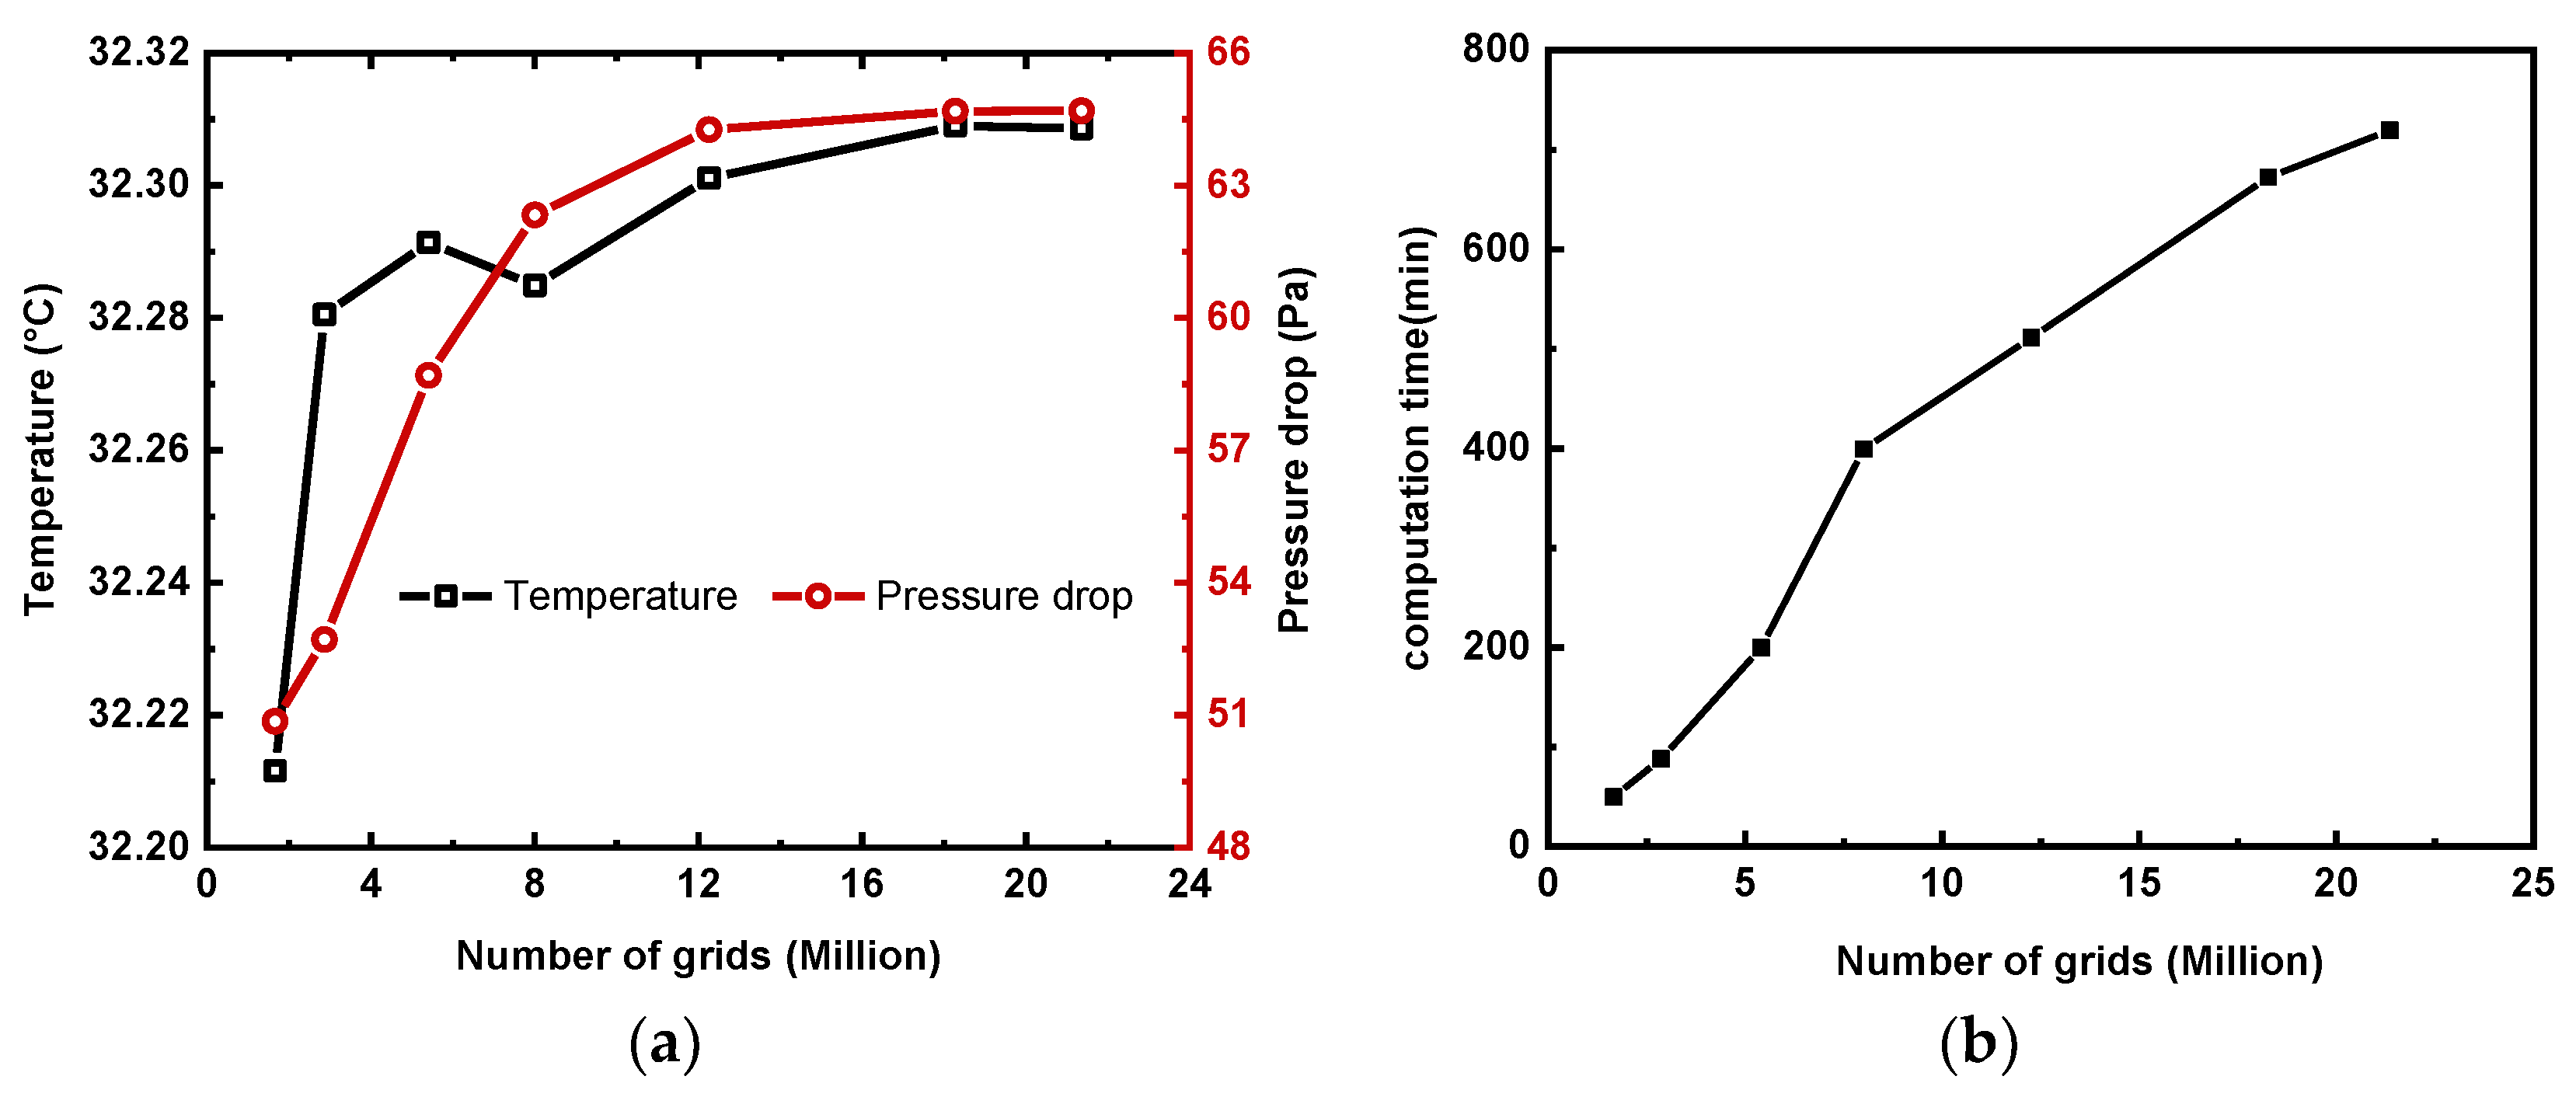
2.4. Computational Model Setup and Grid Independence Verification

The three-dimensional transient numerical simulations for the BTMS in this work were all calculated using the software ANSYS Fluent 19.2. Table 3 shows the physical properties of the materials of the flow distributor, LCP, and coolant [27]. The construction materials of the LCP and flow distributor are aluminum, and water is the chosen coolant.
The boundary conditions are set as follows:
For the momentum equation for the coolant, the inlet coolant mass flow rate is given, while the outlet gauge pressure is set to 0 Pa. There is no slip at the coolant channel wall. For the coolant energy equation, the inlet temperature is given according to the simulation cases. Coolant can exchange heat with the solid body of the cooling plates and flow distributors through convection. For the battery energy equation, the battery surfaces in contact with the cooling plates can exchange heat with the cooling plates through conduction, while the other surfaces of the batteries are adiabatic. In this study, heat convection and conduction within the coolant, as well as heat conduction between the battery, cooling plates, and coolant interior are considered. Radiation heat transfer and convection heat transfer between the battery surface and the surrounding air are omitted.
It is assumed that the coolant is incompressible. The velocity–pressure coupling is solved by the SIMPLE algorithm. Both the energy and the momentum equations are discretized in the second-order upwind format. The initial coolant flow rate is 0 m·s−1 and the initial system temperature is 25 °C. The implicit scheme is adopted for temporal discretization. The time step size is set to 1 s, and the number of time steps for the 2C discharge condition and WLTC condition are 1800 and 28,260, respectively. It is worth noting that, except for the WLTC condition, the batteries are discharged continuously at 2C for all other conditions.
The accuracy of the simulation model is dependent on the number of grids used in the study. It is important to determine when the three-dimensional transient model for the BTMS becomes independent of the grid number. Figure 2a shows the variation in center point temperature of battery 1 and pressure drop through the channel with the number of grids. The tested grid numbers are 1.65, 2.87, 5.41, 8.01, 12.26, 18.26, and 21.36 million, respectively. The results show that the relative errors for the battery 1 center point temperature and channel pressure drop, for grid number of 12.26 million and 21.36 million, are 0.02% and 0.66%, respectively. This analysis indicates that accurate results can be achieved through the use of 12.26 million grids. The results in Figure 2b also show that using a grid number of 12.26 million reduces the computation time by about 208 min. As a result, the grid number used in all of our subsequent simulations is never less than 12.26 million.

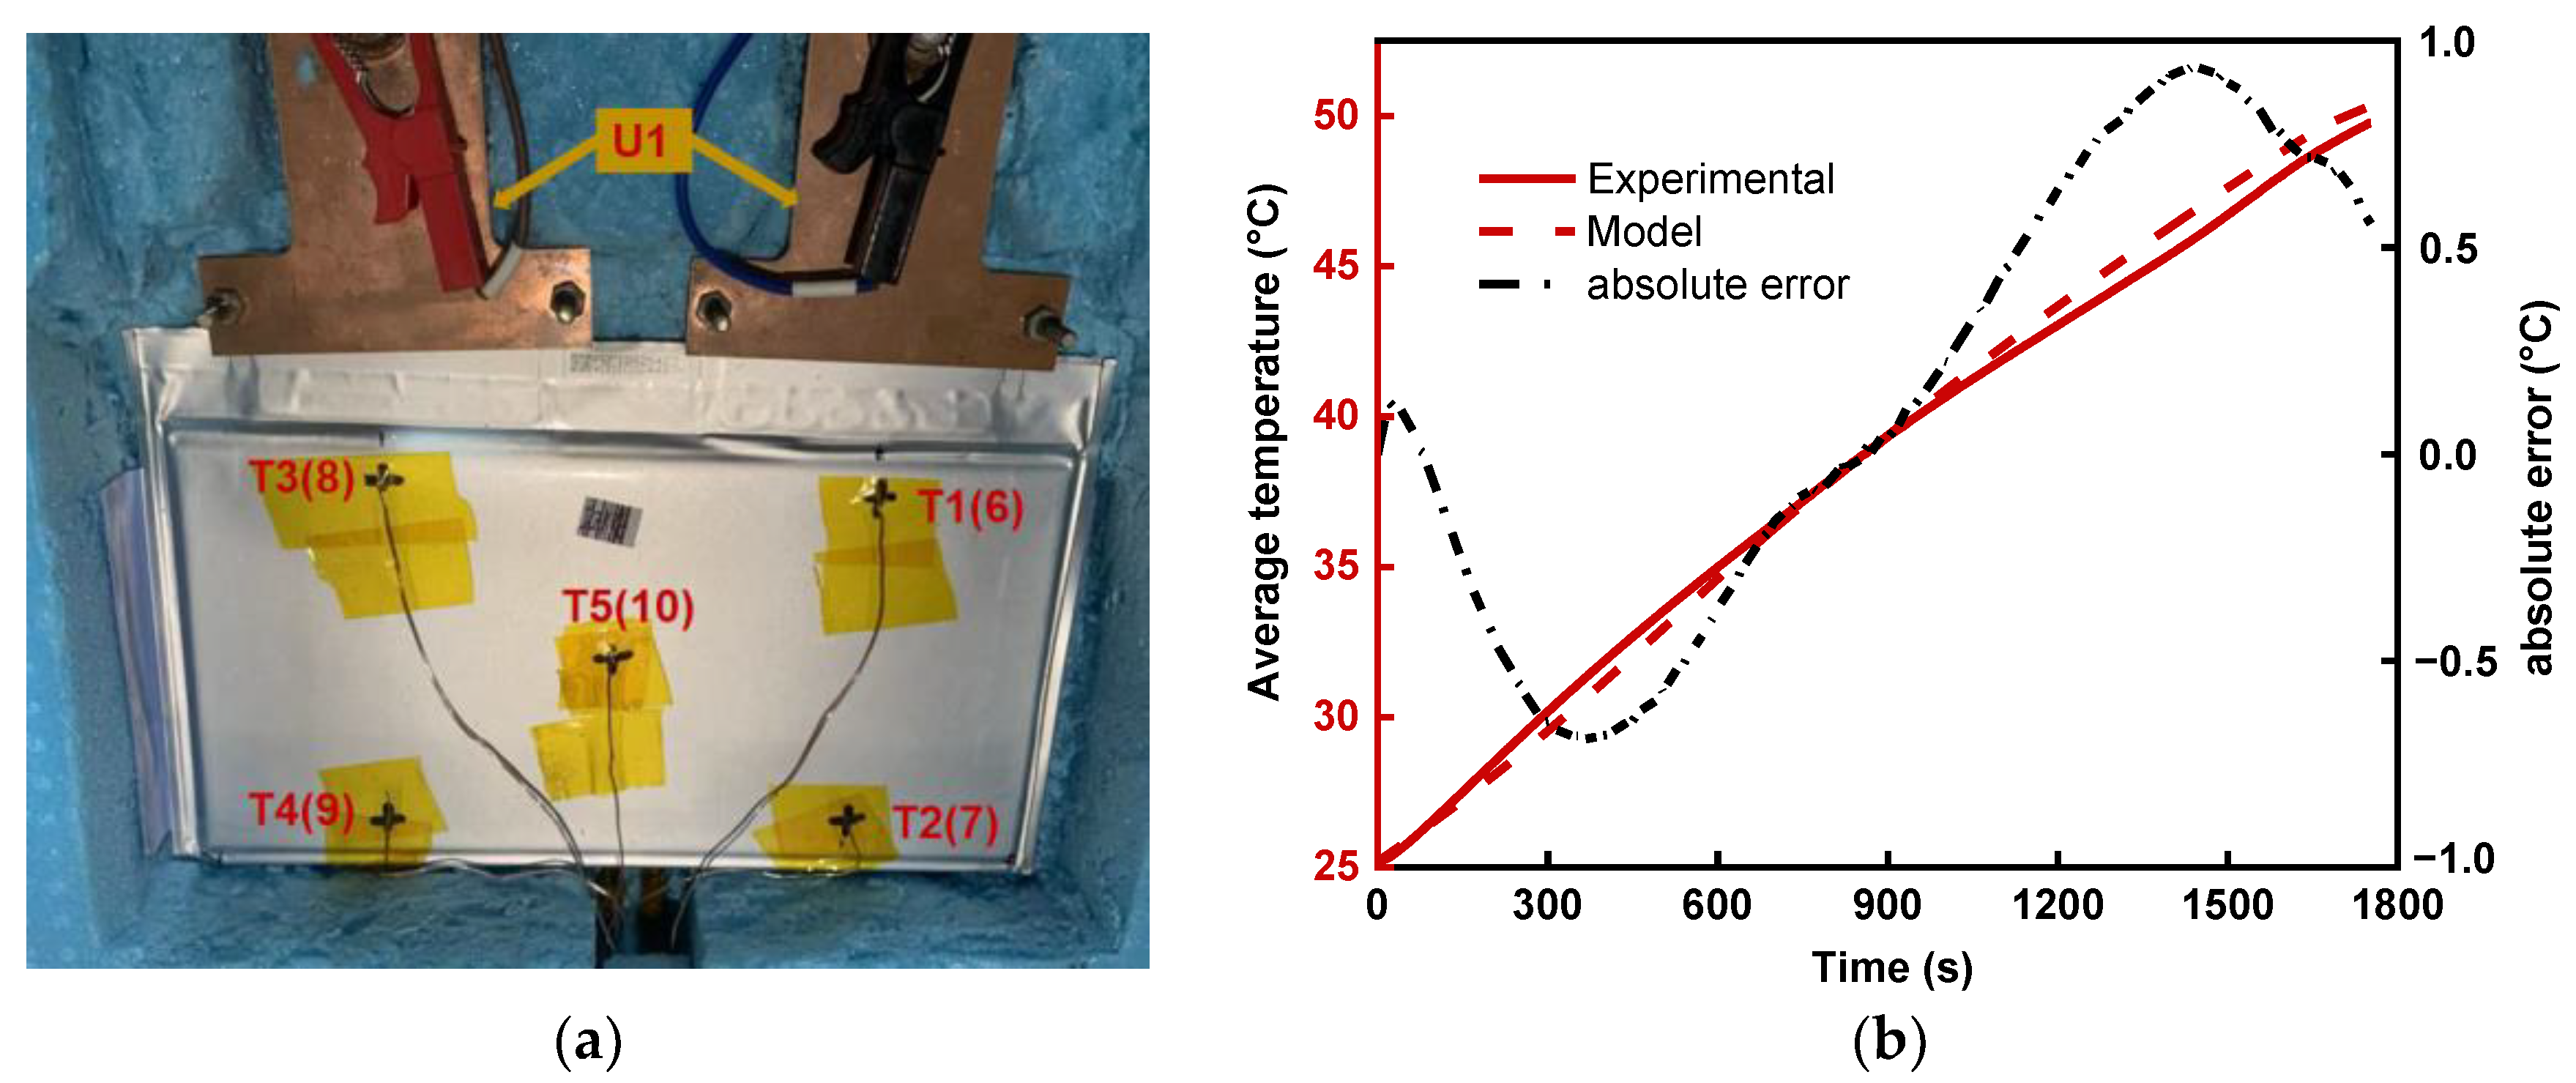
2.5. Experimental Validation of the Model

To verify the accuracy of the thermophysical properties and heat generation rate of the battery used in this work, some laboratory experiments were carried out. The battery was placed in a container made of insulating cotton and placed in a chamber at a constant temperature of 25 °C. This was also the initial temperature of the battery. The battery was then discharged at a constant current. Ten temperature monitoring points (T1 to T10) were located on the surface of the battery, and they are shown in Figure 3a. The temperatures were measured using thermocouples. It is to be expected that a small amount of heat from the battery could still be dissipated into the environment during the experiments. A heat transfer coefficient of 0.8 W·m−2·K−1 was assumed for this heat loss from the surface of the single battery [36]. Under these experimental conditions, a three-dimensional numerical model of the single battery was developed. The volume-averaged temperature of the battery was monitored in the calculations, and the value was compared with the experimentally measured 10-points-averaged temperature, and the results are shown in Figure 3b. It can be seen that the experimental data agree well with the model data, and verifies the accuracy of the thermophysical properties and battery heat generation rate used in this study.

3. Results and Discussion

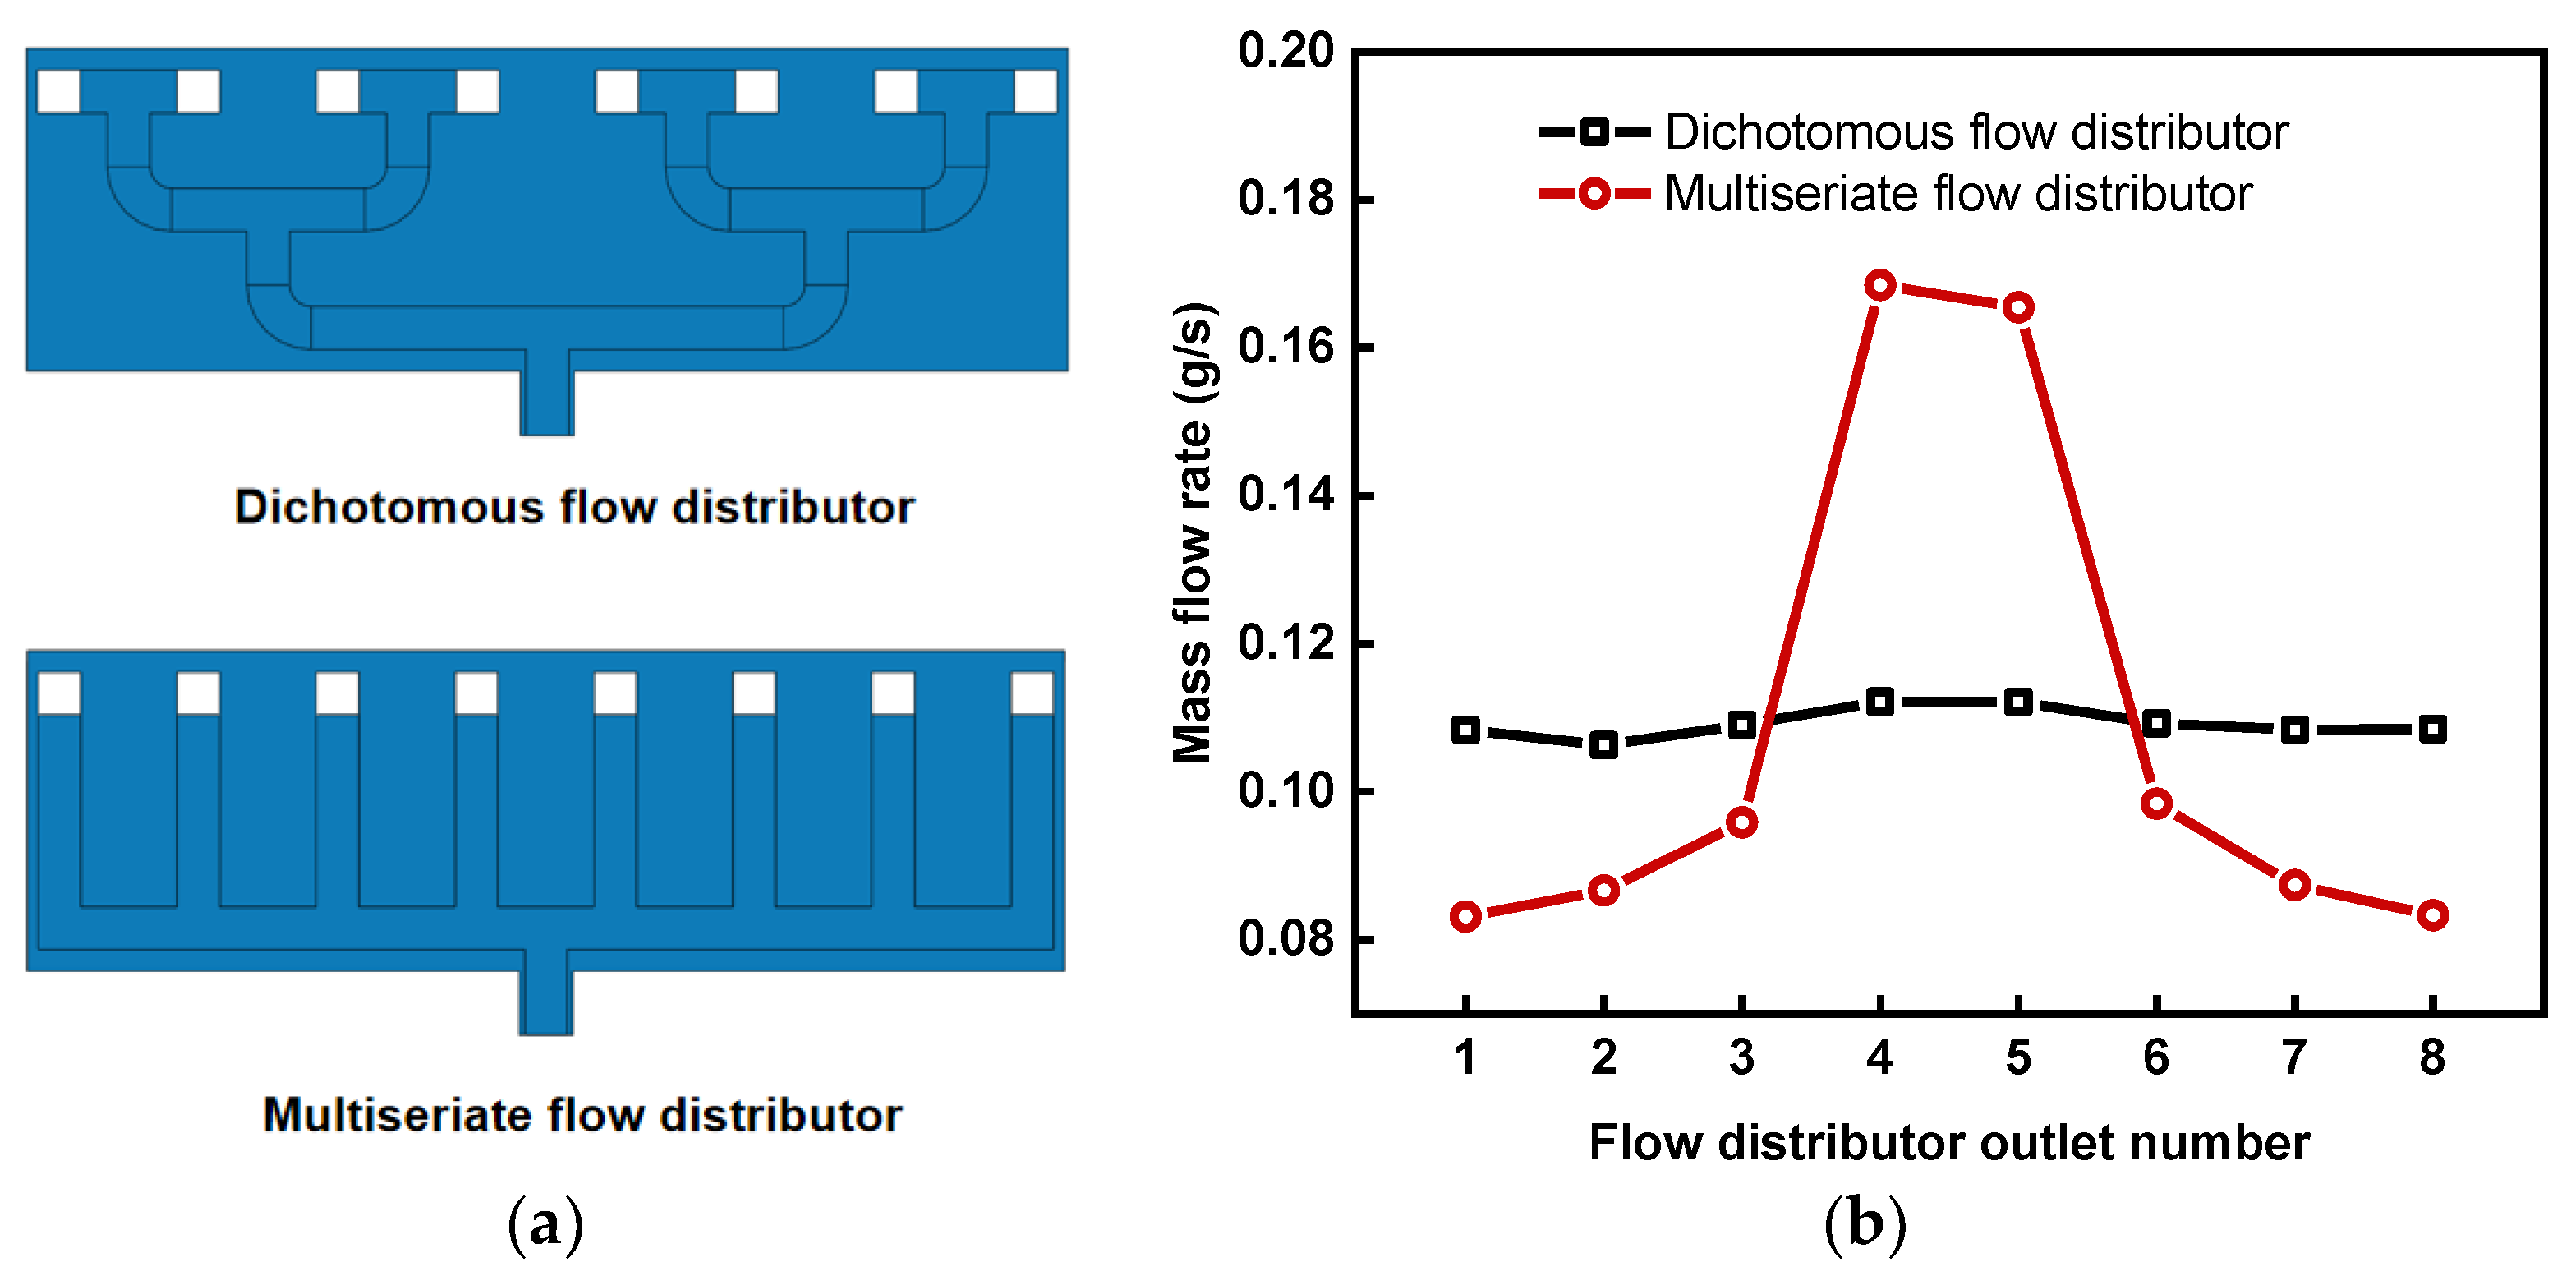
3.1. Comparison of the Flow Uniformity Capacity of Two Types of Flow Distributors

The flow distributor plays the important role of dividing one main flow evenly into eight tributaries, which has a significant impact on the temperature uniformity of the subsequent battery module. Figure 4a shows the channel structure of the dichotomous and the multiseriate flow distributors. Figure 4b shows the mass flow rate of eight outlet tributaries of both flow distributors. It is not surprising that the variation in flow rate of the eight outlets of the dichotomous flow distributor is much smaller than that of the multiseriate flow distributor. In all subsequent BTMS designs, the dichotomous flow distributor is used in the simulations.

3.2. Effect of LCP Structure on Cooling Performances

The cooling performance in this work was quantified by the temperature distribution of the battery module and the system flow energy consumption. The effects of the LCP structure and the cooling strategy will be considered in this and subsequent sections. The desired objective was to ensure that the maximum temperature (Tmax) and the maximum temperature difference (∆T) of the battery module were below 35 °C and 5 °C, respectively, while achieving the lowest possible channel pressure drop (∆p).

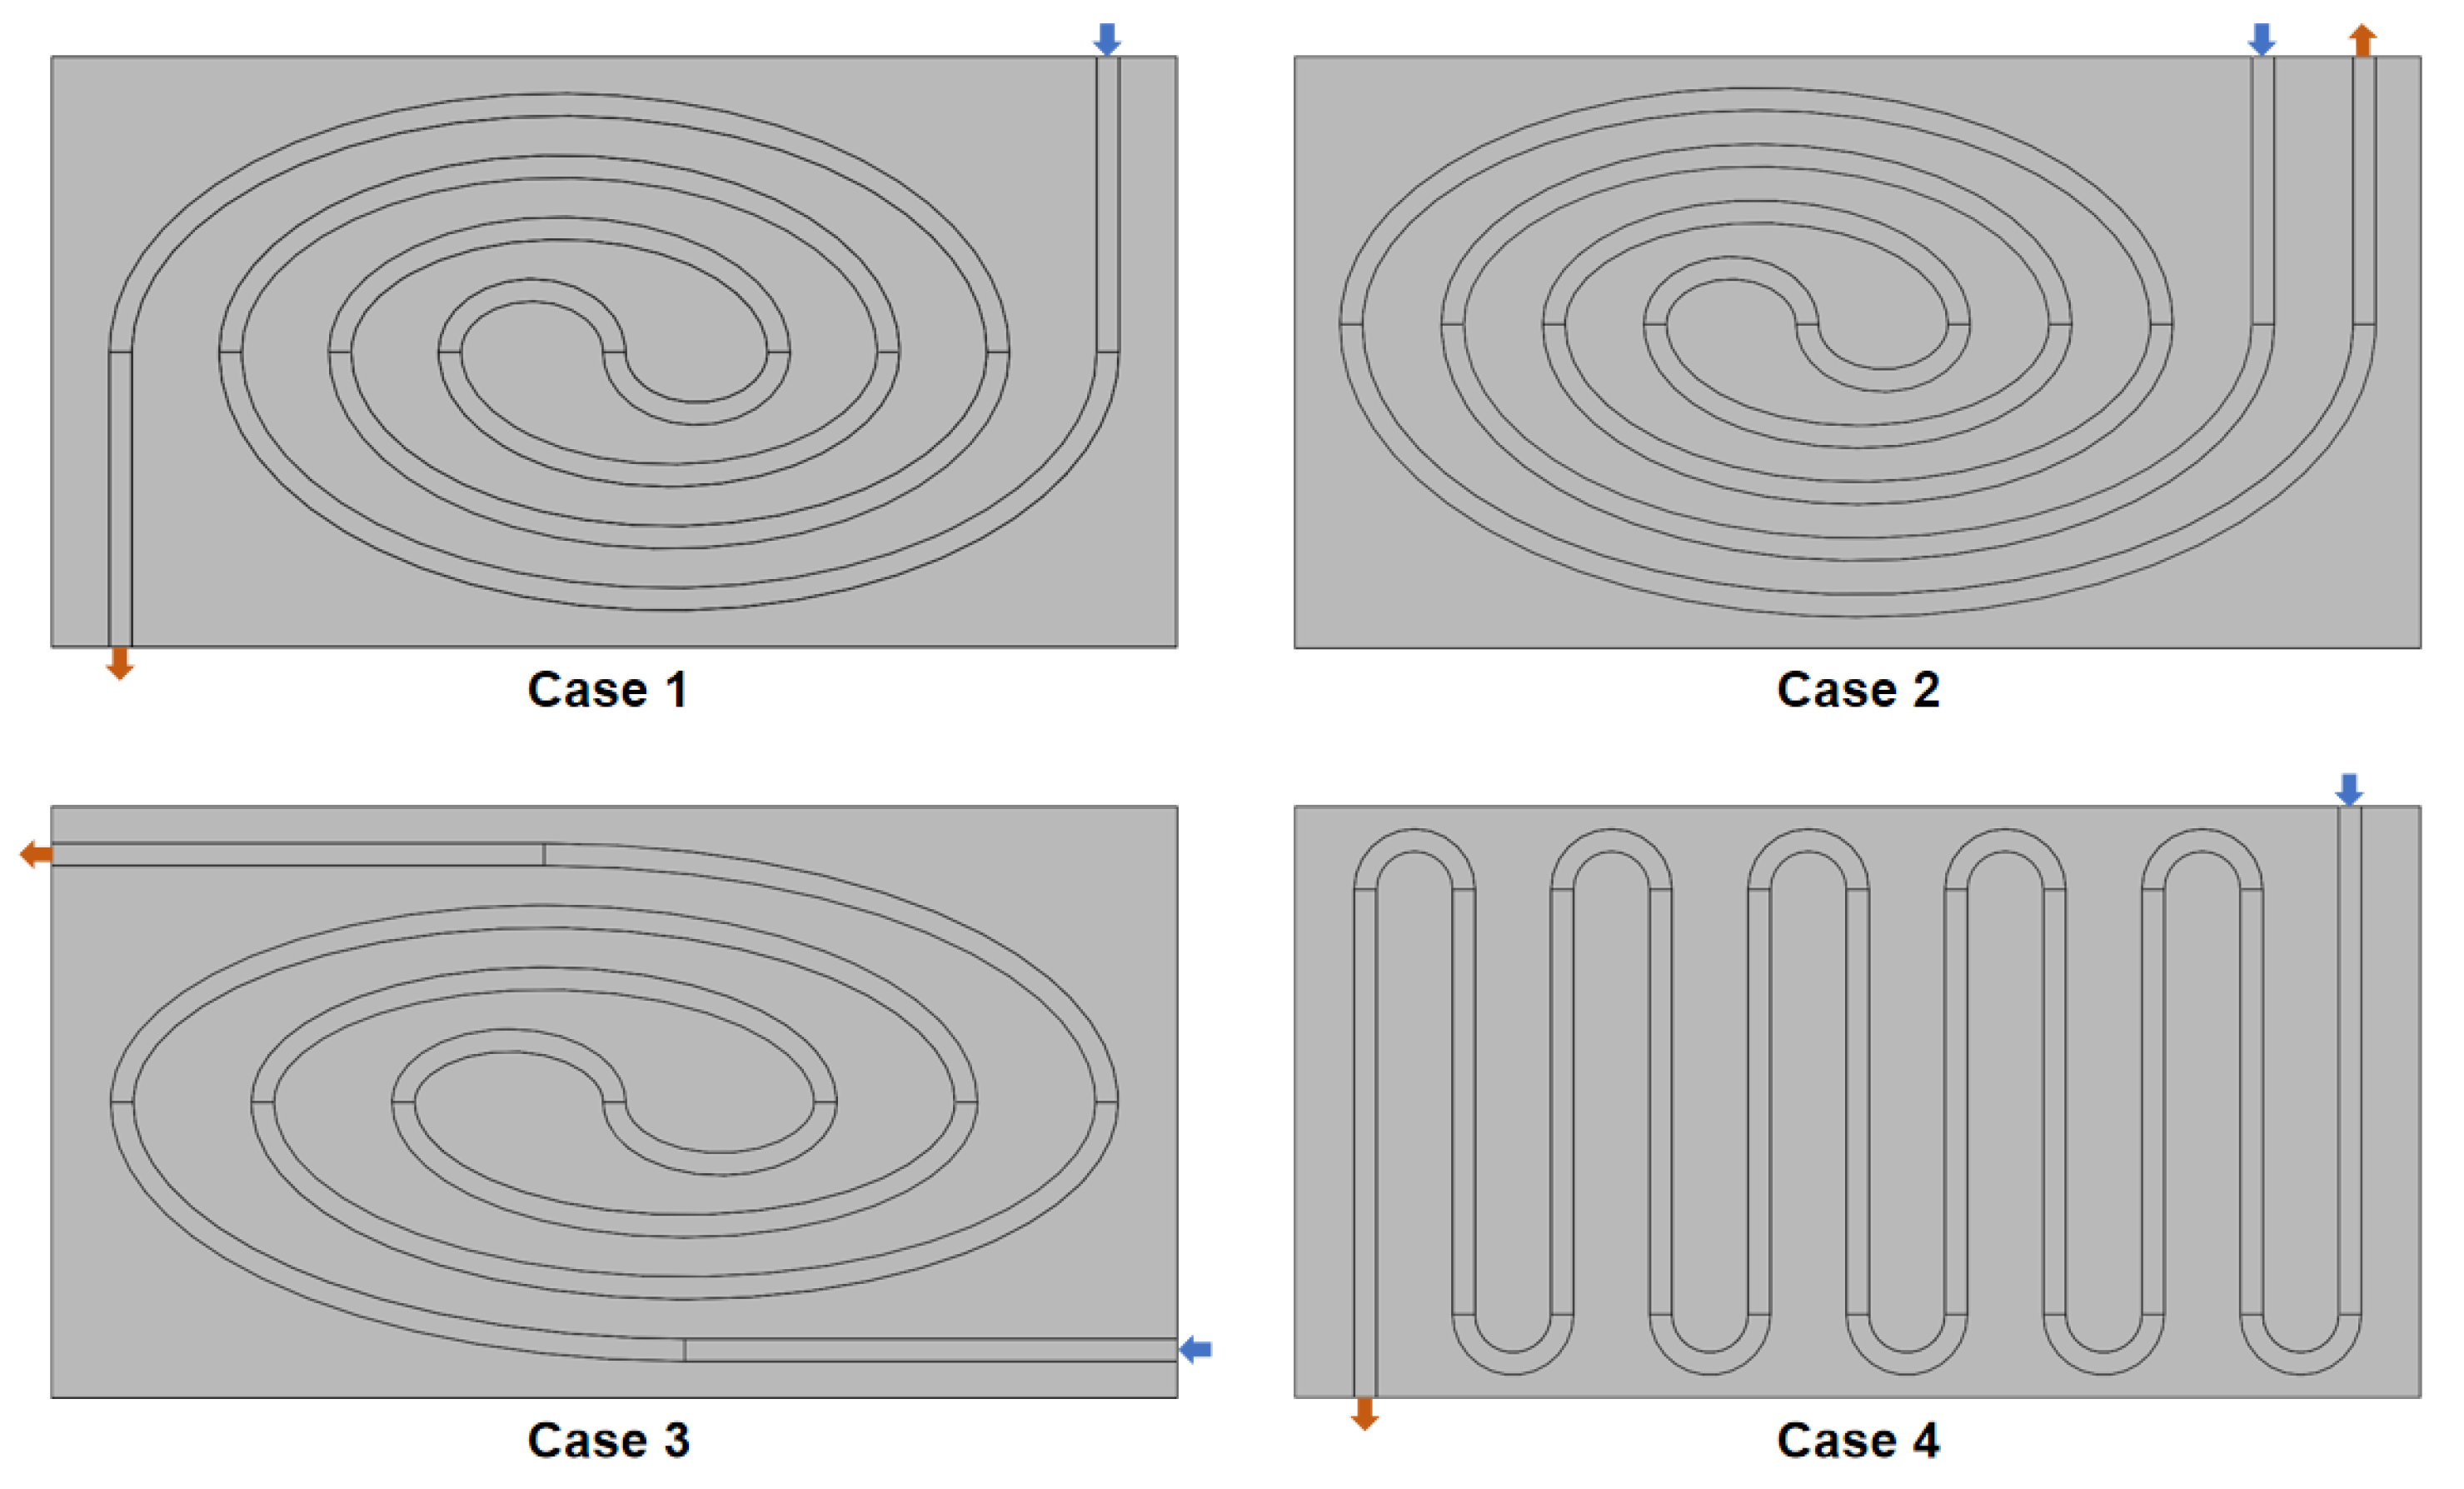
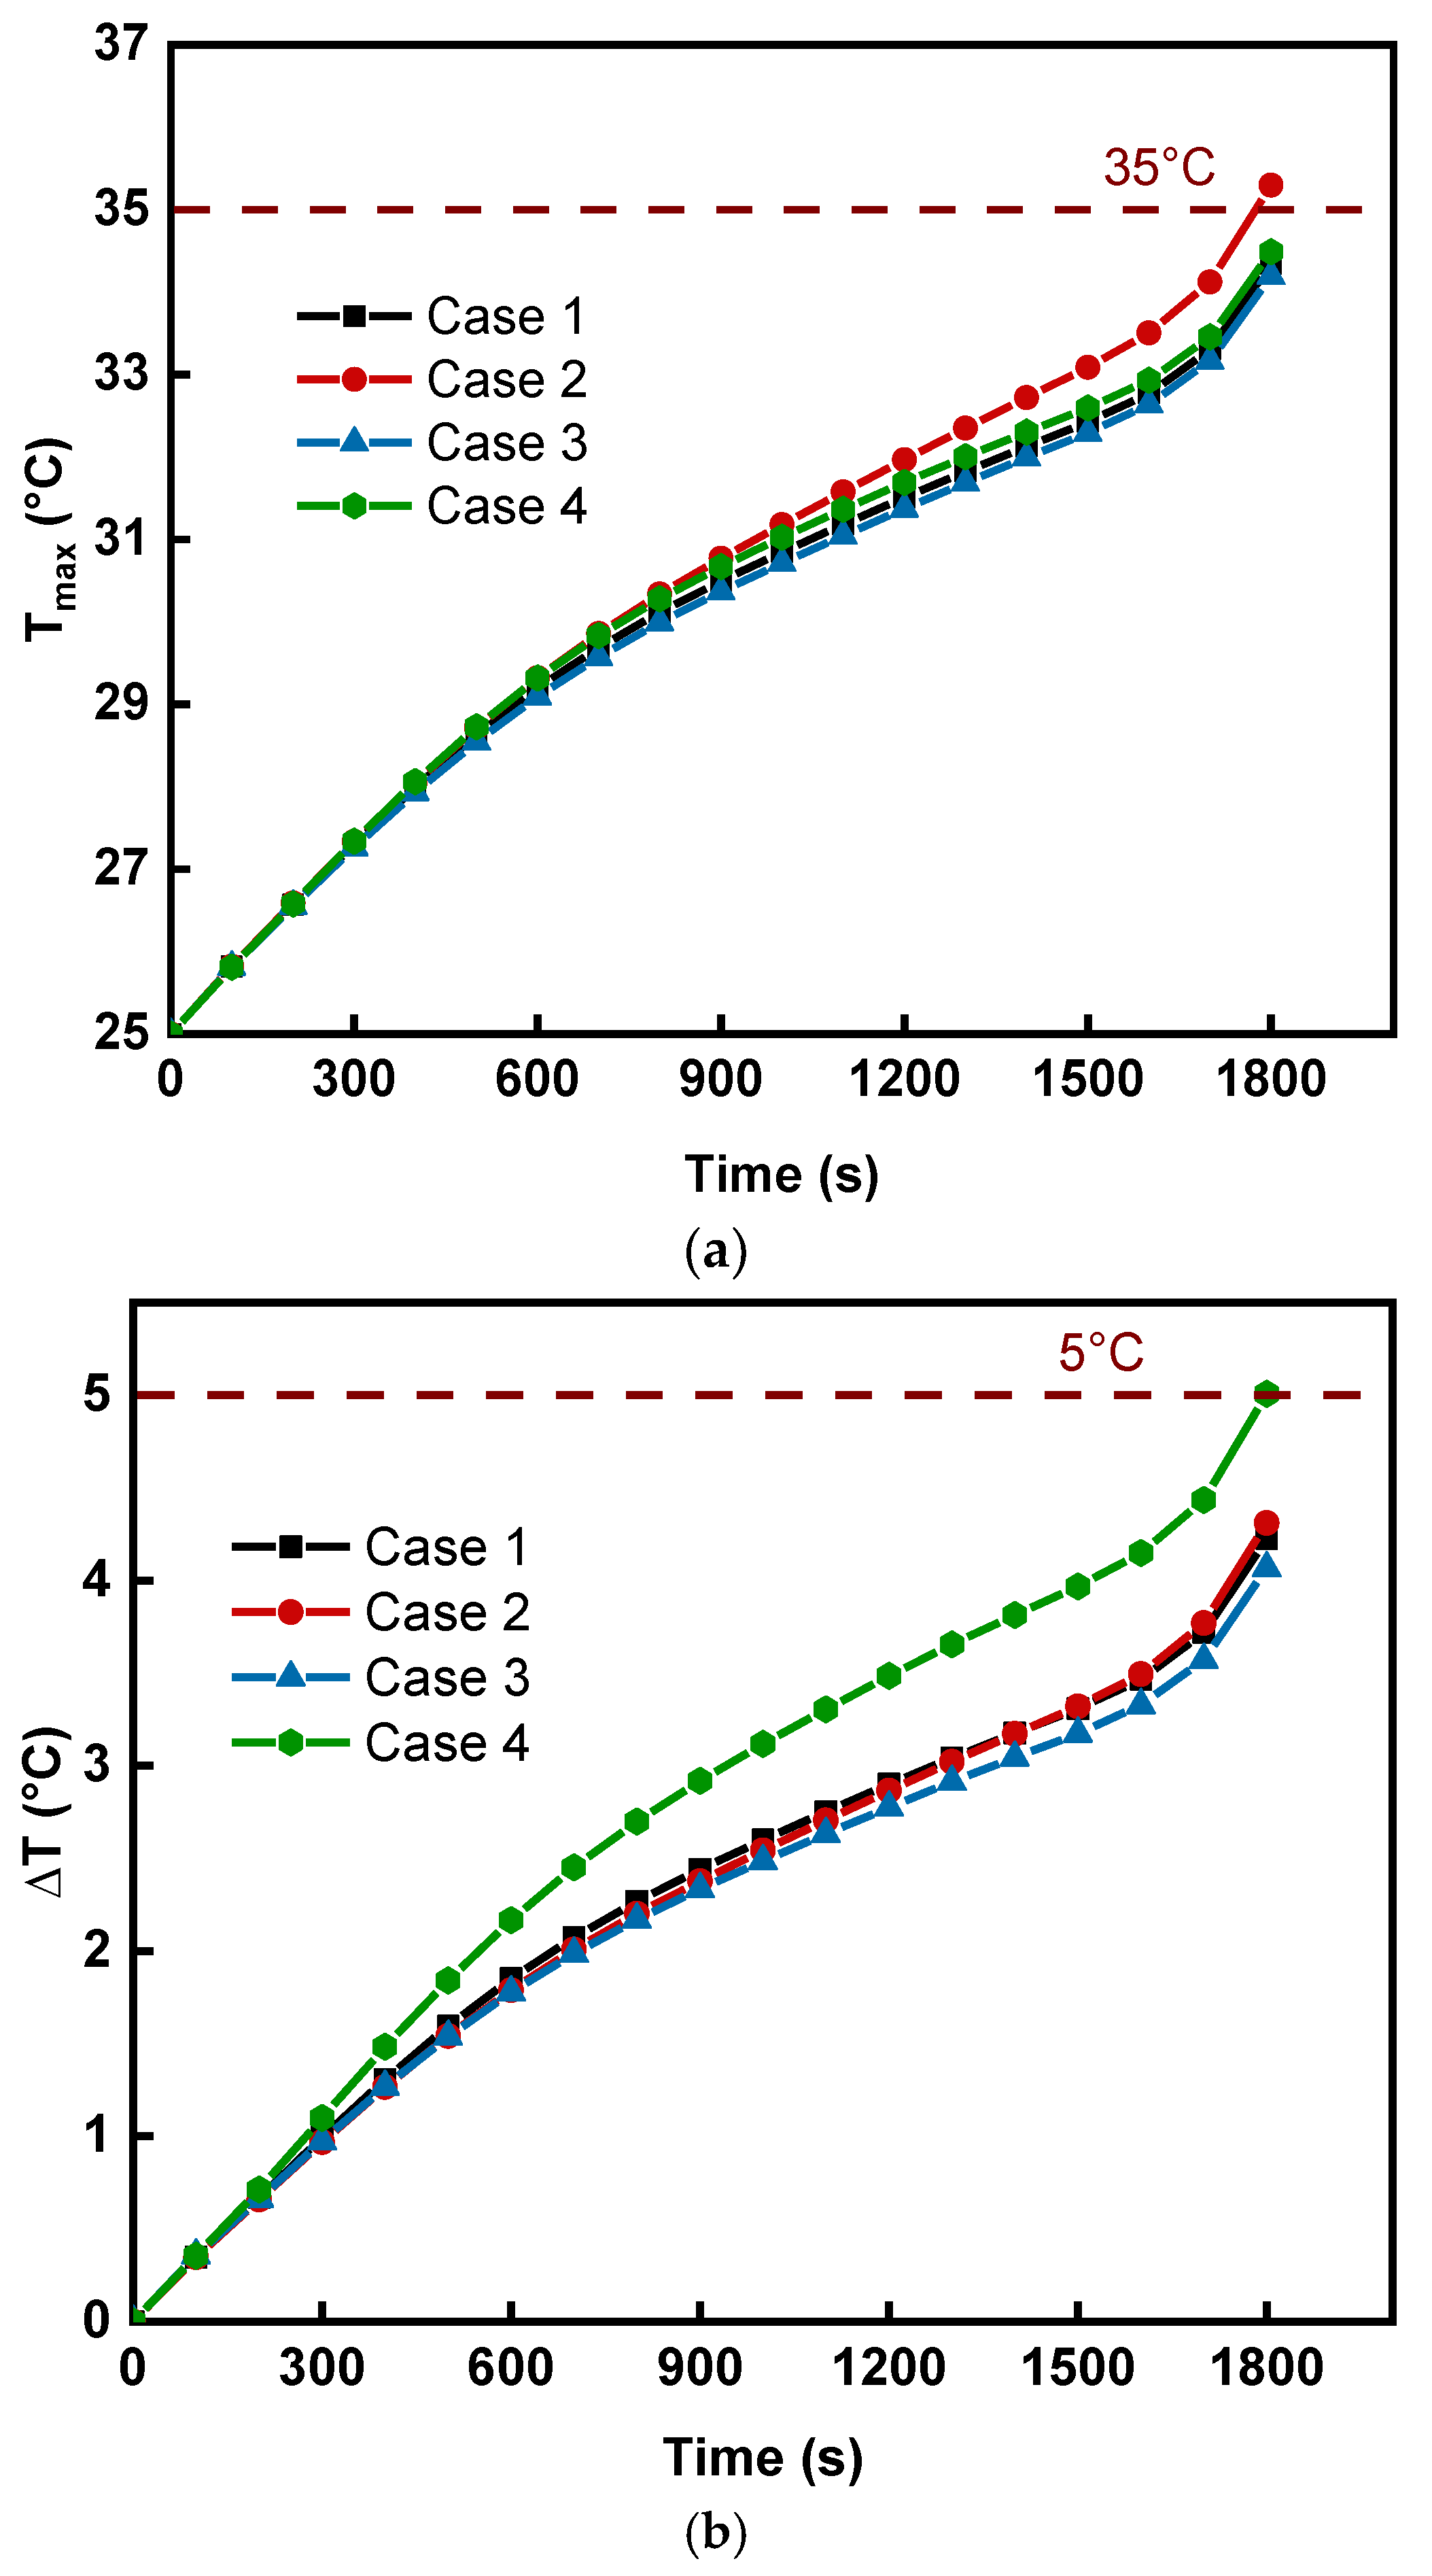
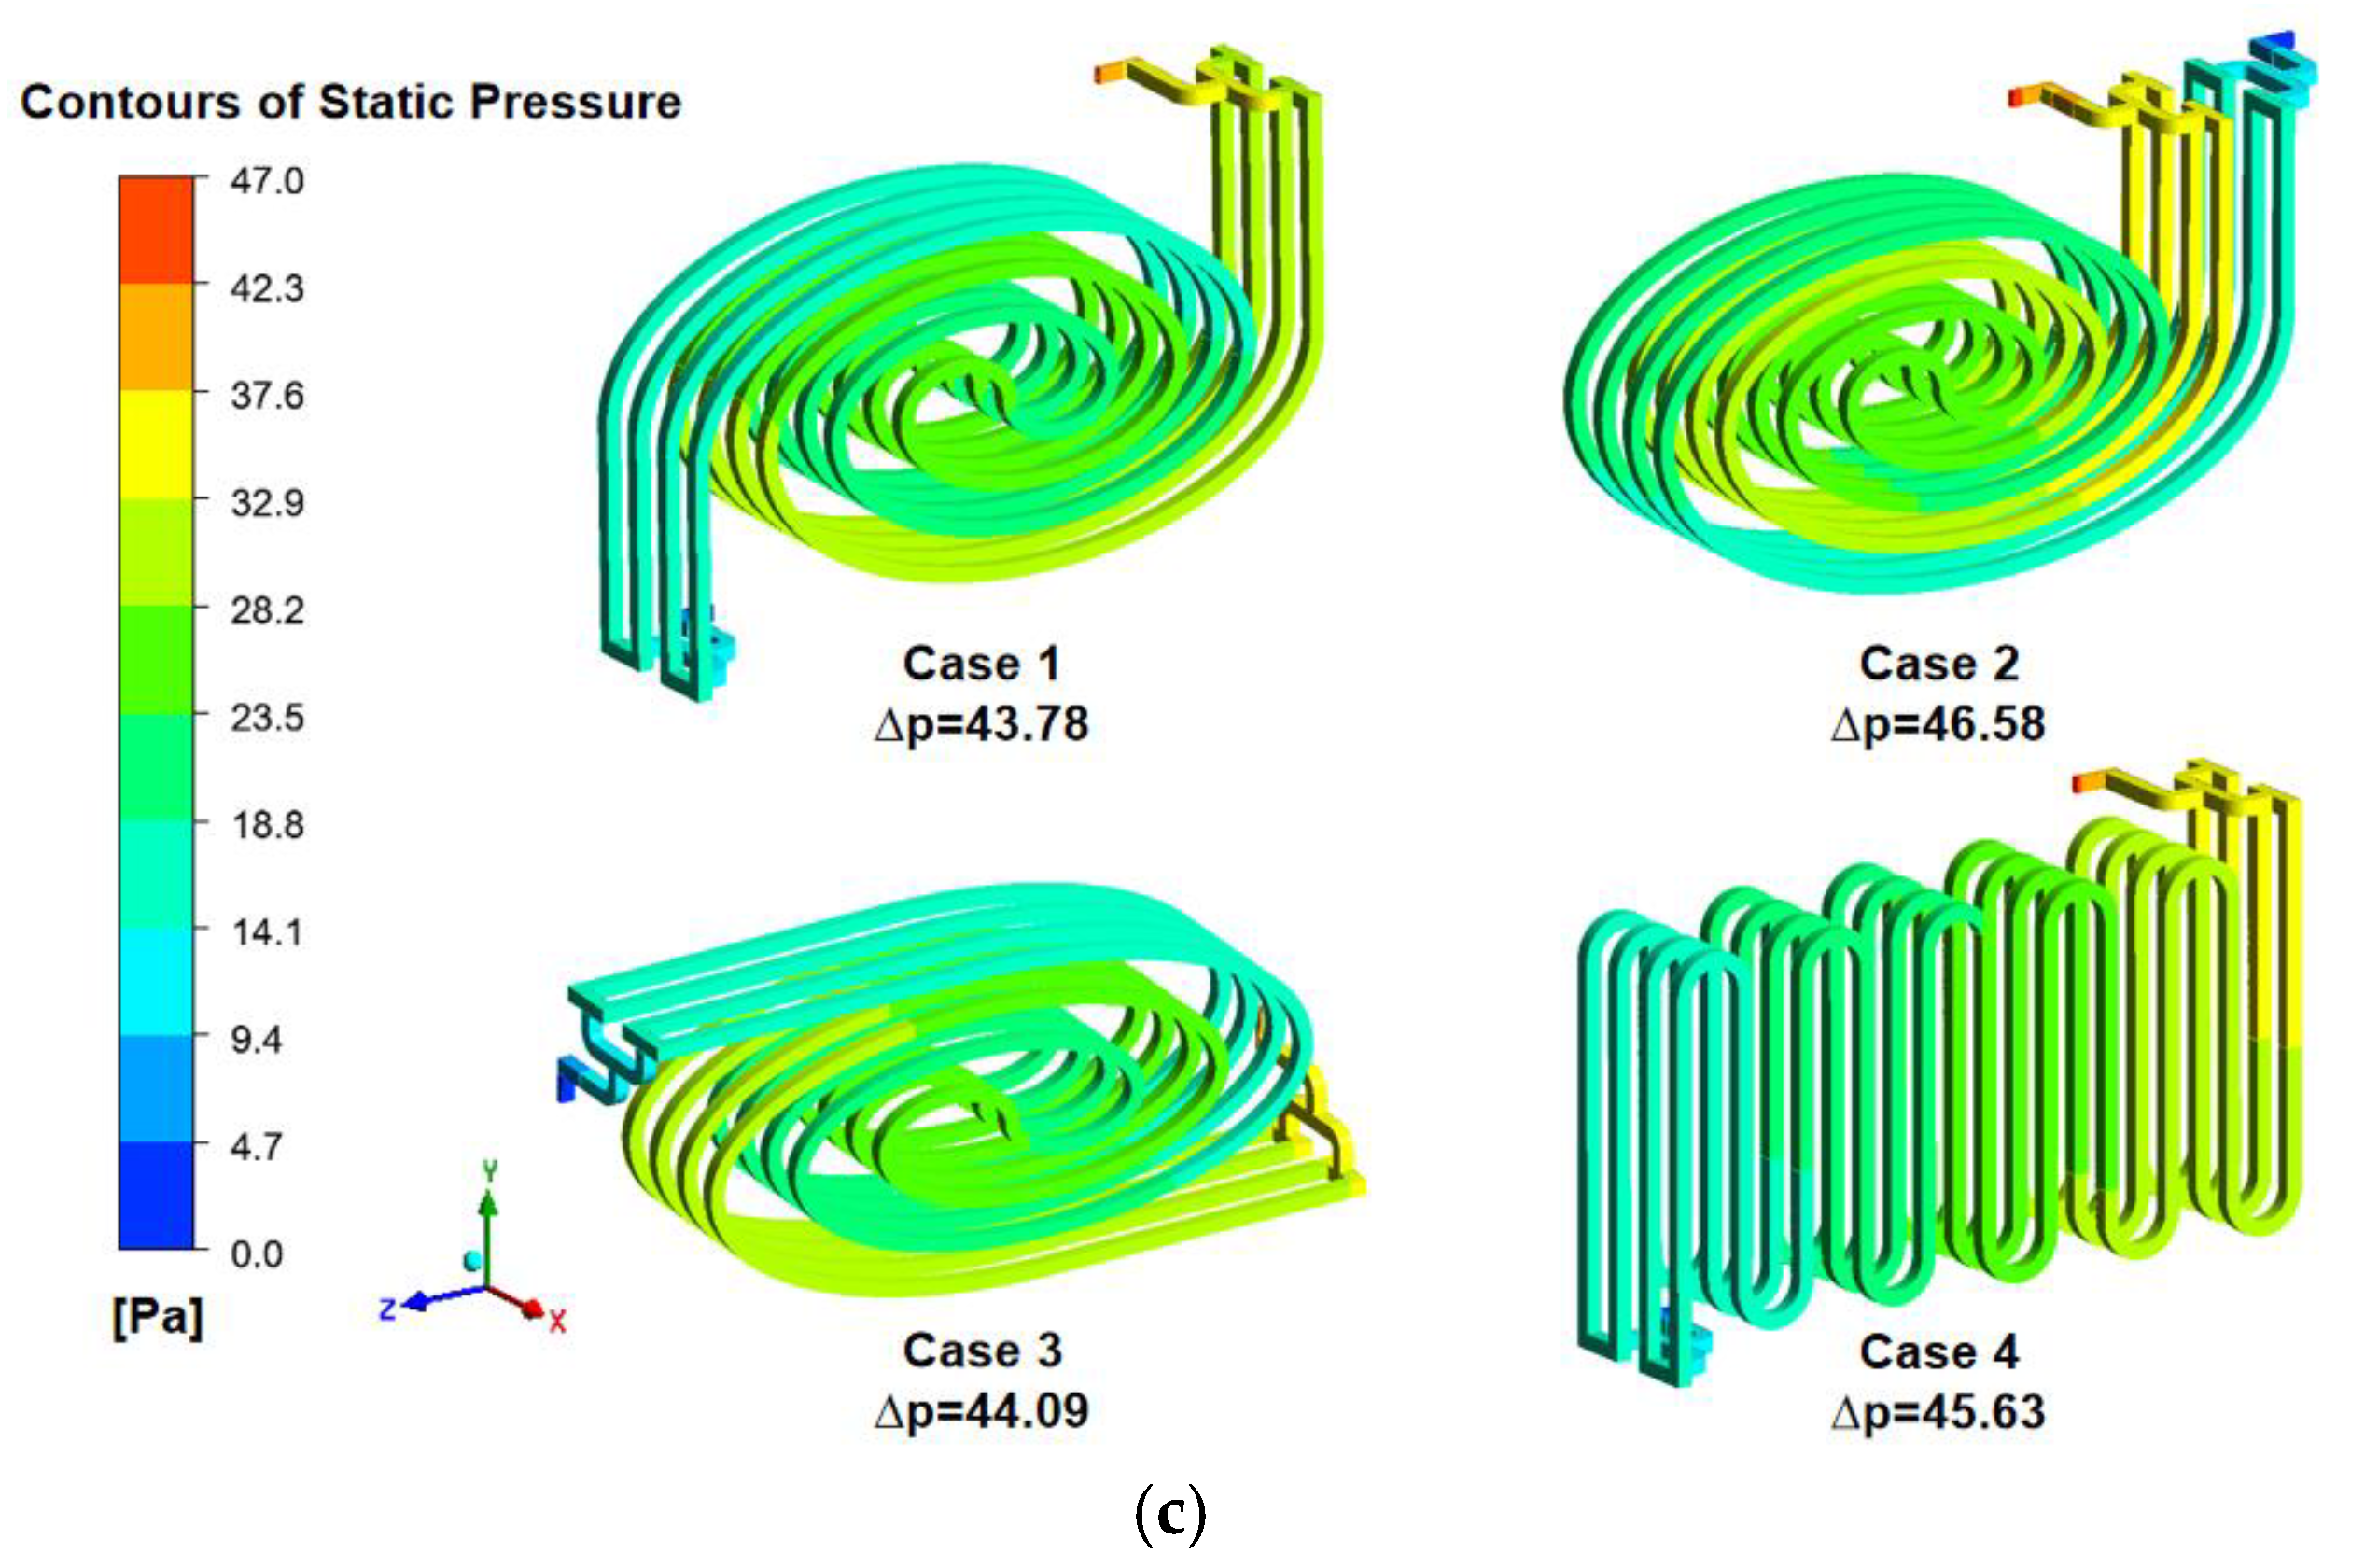
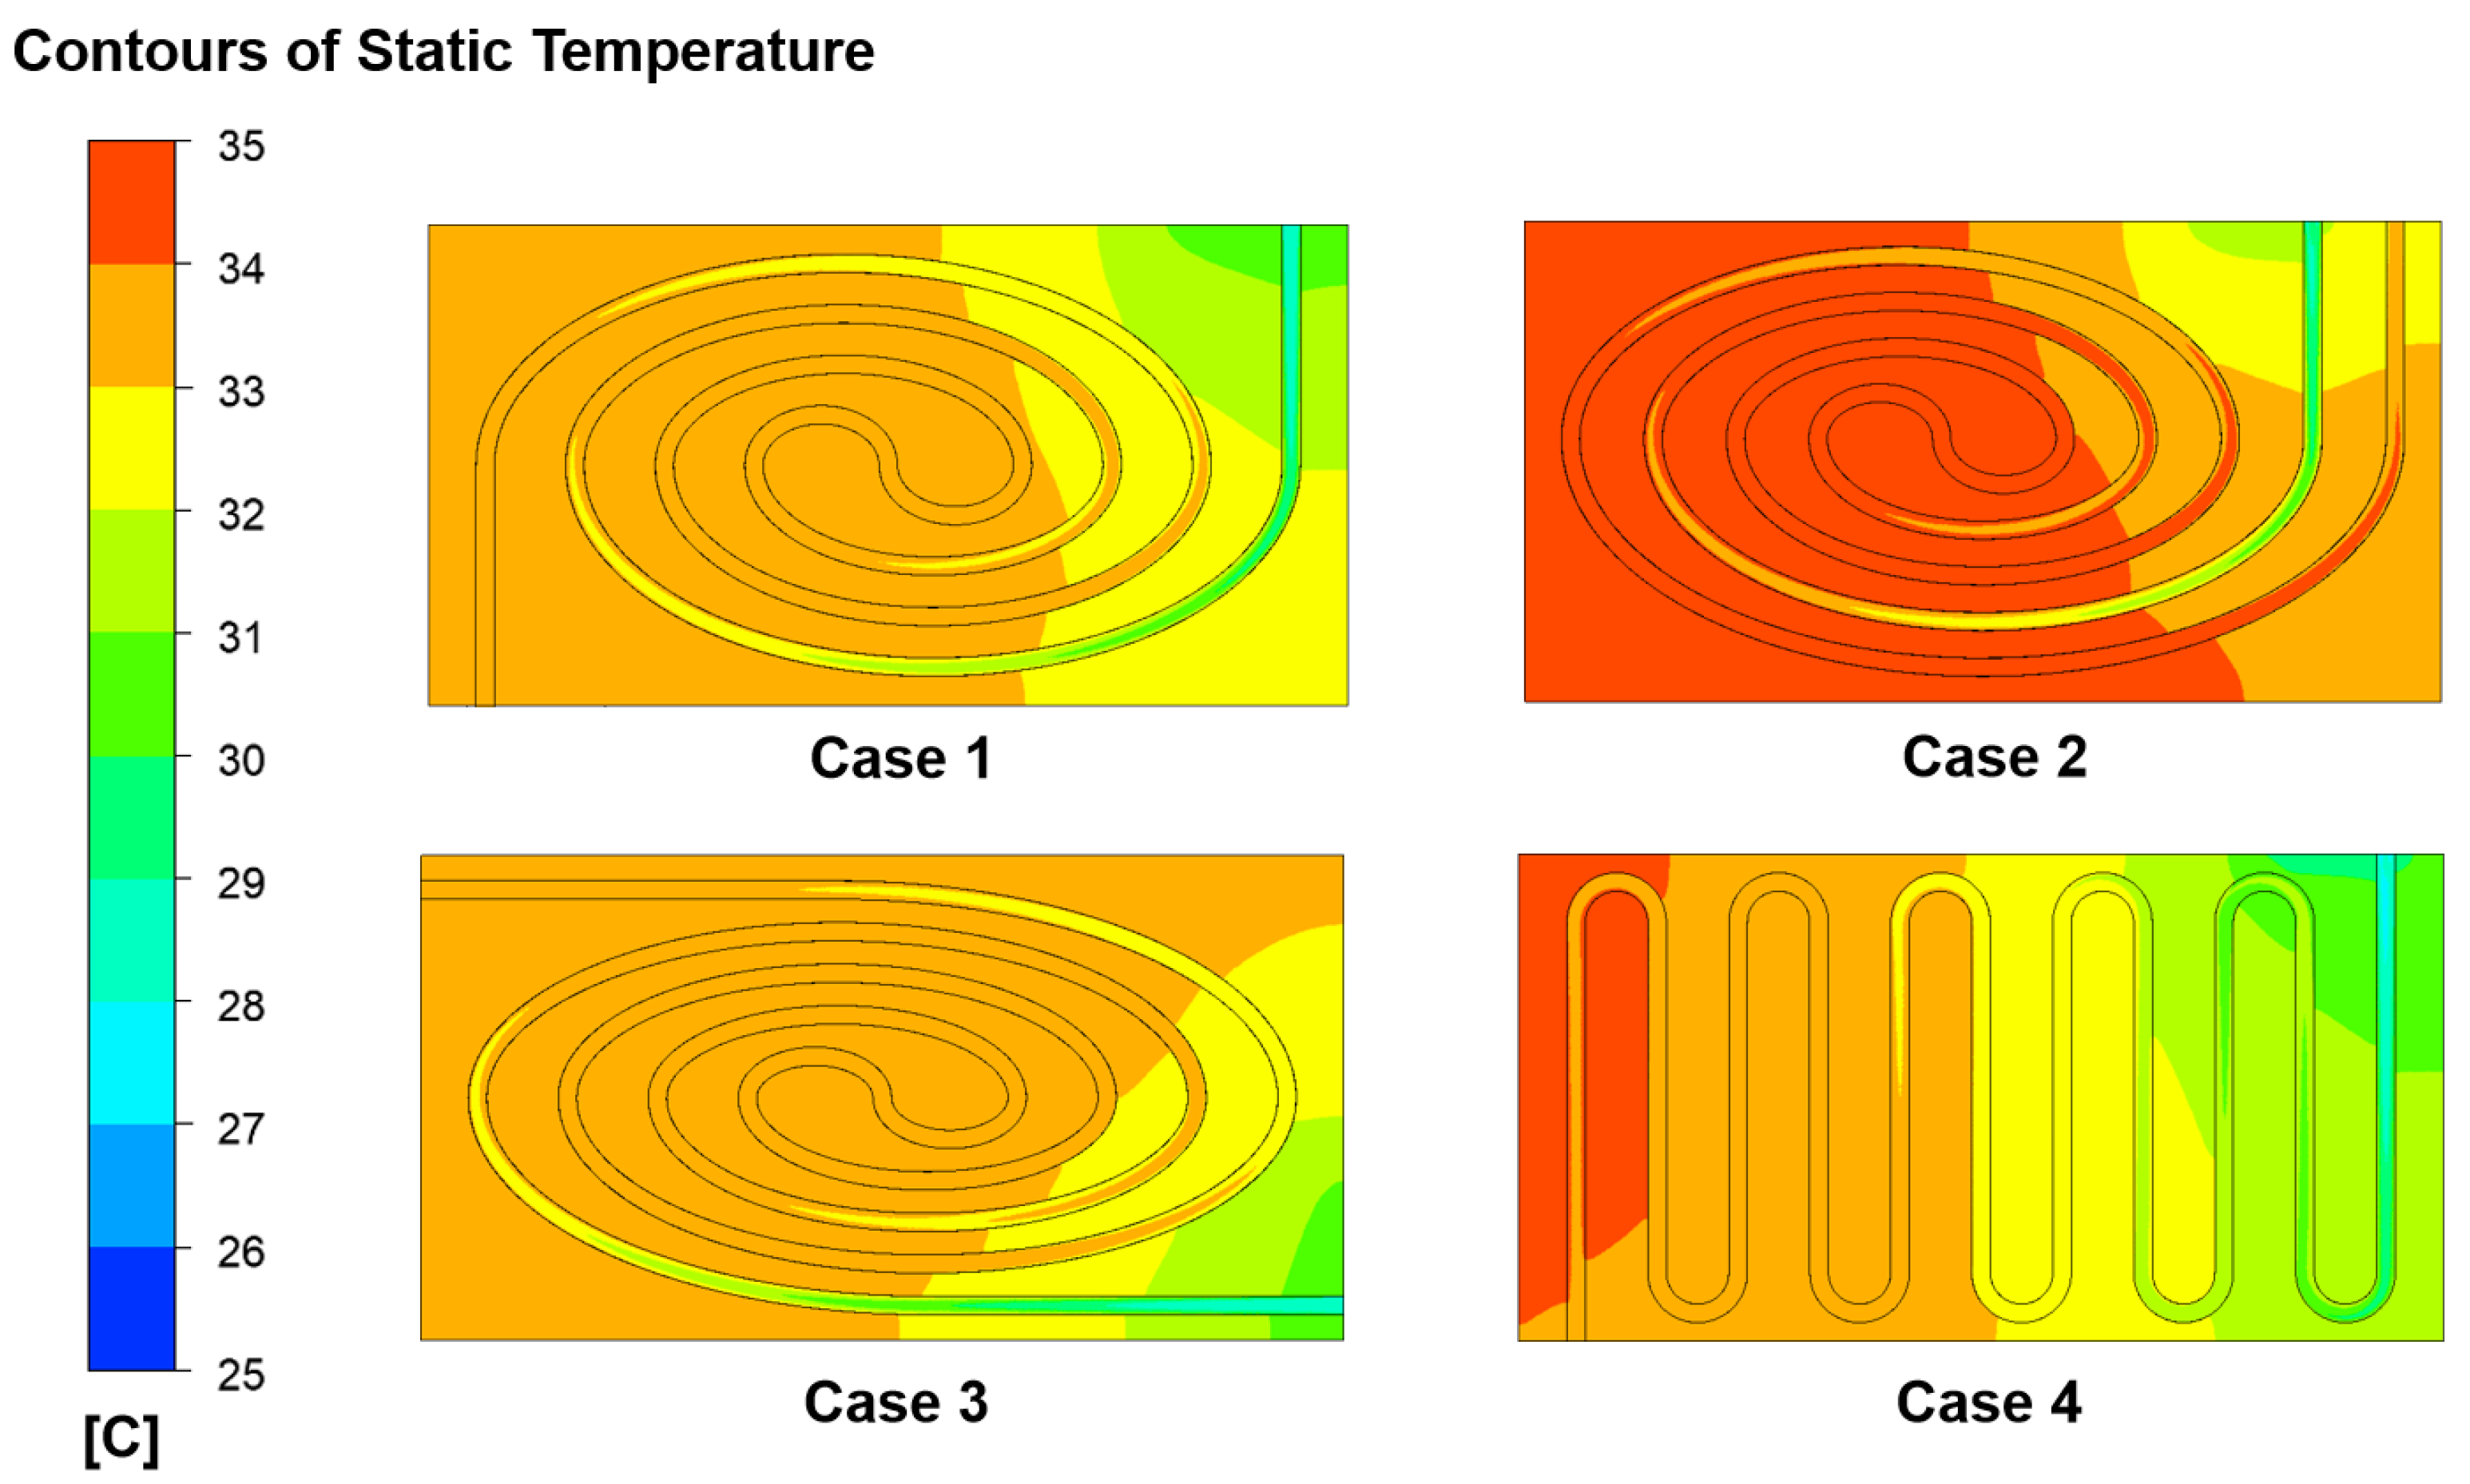
3.2.1. Channel Layout

Figure 5 shows the four different LCP channel layouts for comparison. Cases 1, 2 and 3 have spiral channels, while Case 4 has a serpentine channel. The inlet and outlet of the Case 1 channel are arranged on different long sides of the LCP. For Case 2, the inlet and outlet of the channel are arranged on the same long side of the LCP, while for Case 3 they are arranged on different short sides of the LCP. Case 4 is a serpentine channel with the inlet and outlet of the channel arranged on different long sides of the LCP. In order to exclude the influence of channel length on the module temperature and flow energy consumption, the difference in length between these four channels is kept as small as possible. The channel lengths of Case 1 to Case 4 were 1116.65, 1098.44, 1150.92, and 1134.89 mm, respectively. Figure 6 shows the effect of channel layout on the maximum temperature Tmax, maximum temperature difference ∆T, and channel pressure drop ∆p of the battery module, respectively. As shown in Figure 6a, the temperature remains relatively stable between approximately 600 s and 1500 s of the flowtime, which is mainly attributed to the balance between the rate of heat generated by the batteries and rate of heat carried away by the coolant during this period. The maximum temperature of the battery module in Case 2 is significantly higher than the other three cases, and the reason for this can be explained from information in Figure 7. In Case 2, the inlet and outlet are arranged on the same long side of the LCP. As such the colder inlet fluid is continuously heated up by the hotter outlet fluid, resulting in a hotter inlet fluid for the subsequent battery cooling, which leads to a higher maximum module temperature. In the other three cases, however, the inlet and outlet are on the different sides of the LCPs and the inlet fluid is not heated up by the outlet hot fluid. The inlet fluid has a lower temperature in the battery, resulting in a lower maximum temperature. As shown in Figure 6b, the maximum temperature difference ∆T of the battery module in Case 4 is significantly higher than the other cases. Comparison between Case 1 and Case 4 shows that the maximum temperature difference of the battery module in Case 1 is 15.6% lower than that in Case 4, which indicates that the spiral channel has a better temperature uniformity performance than the serpentine channel under the same inlet and outlet arrangement. This is mainly because the spiral channel arrangement has the hotter fluid close to the colder fluid. Increased heat conduction through the cooling plate between the hot and cold fluid yields a more uniform temperature distribution in the LCP as well as in the batteries [29]. The difference in temperature distribution between Case 1 and Case 3 is small. Case 1 has a slightly lower channel pressure drop, and slightly higher maximum temperature and maximum temperature difference in the battery module than Case 3, mainly because of the slight difference in channel length between the two cases. As Case 1 has a slightly lower pressure drop, it was picked as the best layout for our subsequent studies.

3.2.2. Channel Size

Based on the channel layout of Case 1, the length, width and height of the channel on the cooling performance and system flow energy consumption were analyzed by orthogonal tests and matrix analysis methods [37] for the same mass flow rate. This method is used to determine the optimal solution for the factors, the weight, and the order of influence of each factor on the index values—resulting in a reduced number of calculations in the orthogonal test.
Table 4 gives the three factors of the orthogonal test, which are the length (L), width (W), and height (H) of the channel. Each factor has three levels. The combination of the factors of interest yields an L9(33) orthogonal test design.
A matrix analysis of the orthogonal test was performed as follows:
First, an analytical table of the arithmetic means of the indexes and their range values is determined and this is shown in Table 5. Tmax, ∆T and ∆p are the three indexes of the test results, respectively, and these results are obtained from the calculations in the software Ansys Fluent 19.2. If there are m factors in the orthogonal test and each factor has n levels, then kij is defined as the arithmetic means of the indexes at the j-th level of the i-th factor. For example, ki1 in the table represents the arithmetic means of the three indexes at the 1st level of the i-th factor. The range value si of the i-th factor is the difference between the maximum and minimum values in ki1 to kin, i.e., s i = m a x { k i 1 , , k i n } m i n { k i 1 , , k i n } .
From this information, the indicator layer matrix, factor layer matrix, level layer matrix, and weight matrix are defined. Kij is the weight coefficient of the arithmetic mean of the index at the j-th level of the i-th factor. If the index value is proportional to the expected value, i.e., the larger the index, the more the expected value is satisfied, then Kij = kij; otherwise, Kij = 1/kij. It is noteworthy that all three index values (Tmax, ∆T and ∆p) in this test are inversely proportional to the expected values. The resulting matrix of index layers is established, as shown in Equation (9):
K = [ K 11 0 0 K 12 0 0 K 1 n 0 0 0 K 21 0 0 K 22 0 0 K 2 n 0 0 0 K m 1 0 0 K m 2 0 0 K m n ]
The reciprocal of the sum of Ki1 to Kim is Zi, i.e., Z i = 1 / j = 1 m K i j . The factor layer matrix is thus established, as shown in Equation (10):
Z = [ Z 1 0 0 0 Z 2 0 0 0 Z m ]
The ratio of the range value of the i-th factor to the sum of the range value of all factors is Si, i.e., S i = s i / i = 1 m s i . The resulting level layer matrix is established as shown in Equation (11):
S = [ S 1 S 2 S m ]
Let X i j = K i j Z i S i , where K i j Z i = K i j / j = 1 m K i j . S i = s i / i = 1 m s i is the ratio of the range value of the i-th factor to the sum of the range values of all factors. The value of the product of the two can reflect not only the influence of the first level of the first factor on the value of the index, but also the size of the range value of the first factor. The resulting weight matrix is established as shown in Equation (12):
X = K Z S = [ X 1 , X 2 , , X m × n ] T
The weights of the effects of each level of the factors on the test indexes were calculated. In this test, the weight matrix of Tmax is XTmax, as shown in Equation (13):
X T m a x = [ 0.0201 , 0.0201 , 0.0201 , 0.0131 , 0.0131 , 0.0131 , 0.2921 , 0.3004 , 0.3076 ] T
The weight matrix of ∆T is XT, as shown in Equation (14):
X Δ T = [ 0.0201 , 0.0169 , 0.0173 , 0.0336 , 0.0351 , 0.0411 , 0.2105 , 0.3119 , 0.3135 ] T
The weight matrix of ∆p is Xp, as shown in Equation (15):
X Δ p = [ 0.0395 , 0.1014 , 0.0602 , 0.0345 , 0.0123 , 0.2535 , 0.0363 , 0.1178 , 0.2357 ] T
Xavg is the average of these three weight matrices, as shown in Equation (16):
X a v g = X T max + X Δ T + X Δ P 3 = [ 0.0266 0.0462 0.0325 0.0271 0.0571 0.1026 0.1796 0.2434 0.2856 ] = [ L 1 L 2 L 3 W 1 W 2 W 3 H 1 H 2 H 3 ]
From Equation (11), the weights of the effects of the three levels of the factor L on the test results are: L1 = 0.0266, L2 = 0.0462, L3 = 0.0325, with L2 having the largest weight. Similarly, the weight of W3 in factor W is the largest, and the weight of H3 in factor H is the largest. From this, the optimal solution for the orthogonal test can be quickly determined as L2W3H3, i.e., the length of the channel is 1116.65 mm, the width is 6 mm, and the height is 6 mm. Compared to the basic solution L2W2H2, the optimal solution reduces the maximum temperature, maximum temperature difference, and channel pressure drop by 2.7%, 17.8% and 79.9%, respectively. Meanwhile, since L1 + L2 + L3 = 0.1053, W1 + W2 + W3 = 0.1868, H1 + H2 + H3 = 0.7086, it can also be concluded that the main order of influence of each factor on the index value of the orthogonal test is H > W > L.
From the above discussion, it can be seen that the optimal structural solution for the LCP is the channel layout in Case 1 (the inlet and outlet of the channel arranged on different long edges of the LCP) and the LCP channel size as L2W3H3 (the length of the channel being 1116.65 mm, the width 6 mm, and the height 6 mm). At this time, the highest temperature of the battery module is found in the middlemost battery near the outlet of the channel, and the lowest temperature is in the battery nearest to the side, near the channel inlet. The locations of the highest and lowest temperatures are hardly affected by the flow rate.

3.3. Effect of Cooling Strategy on Cooling Performance

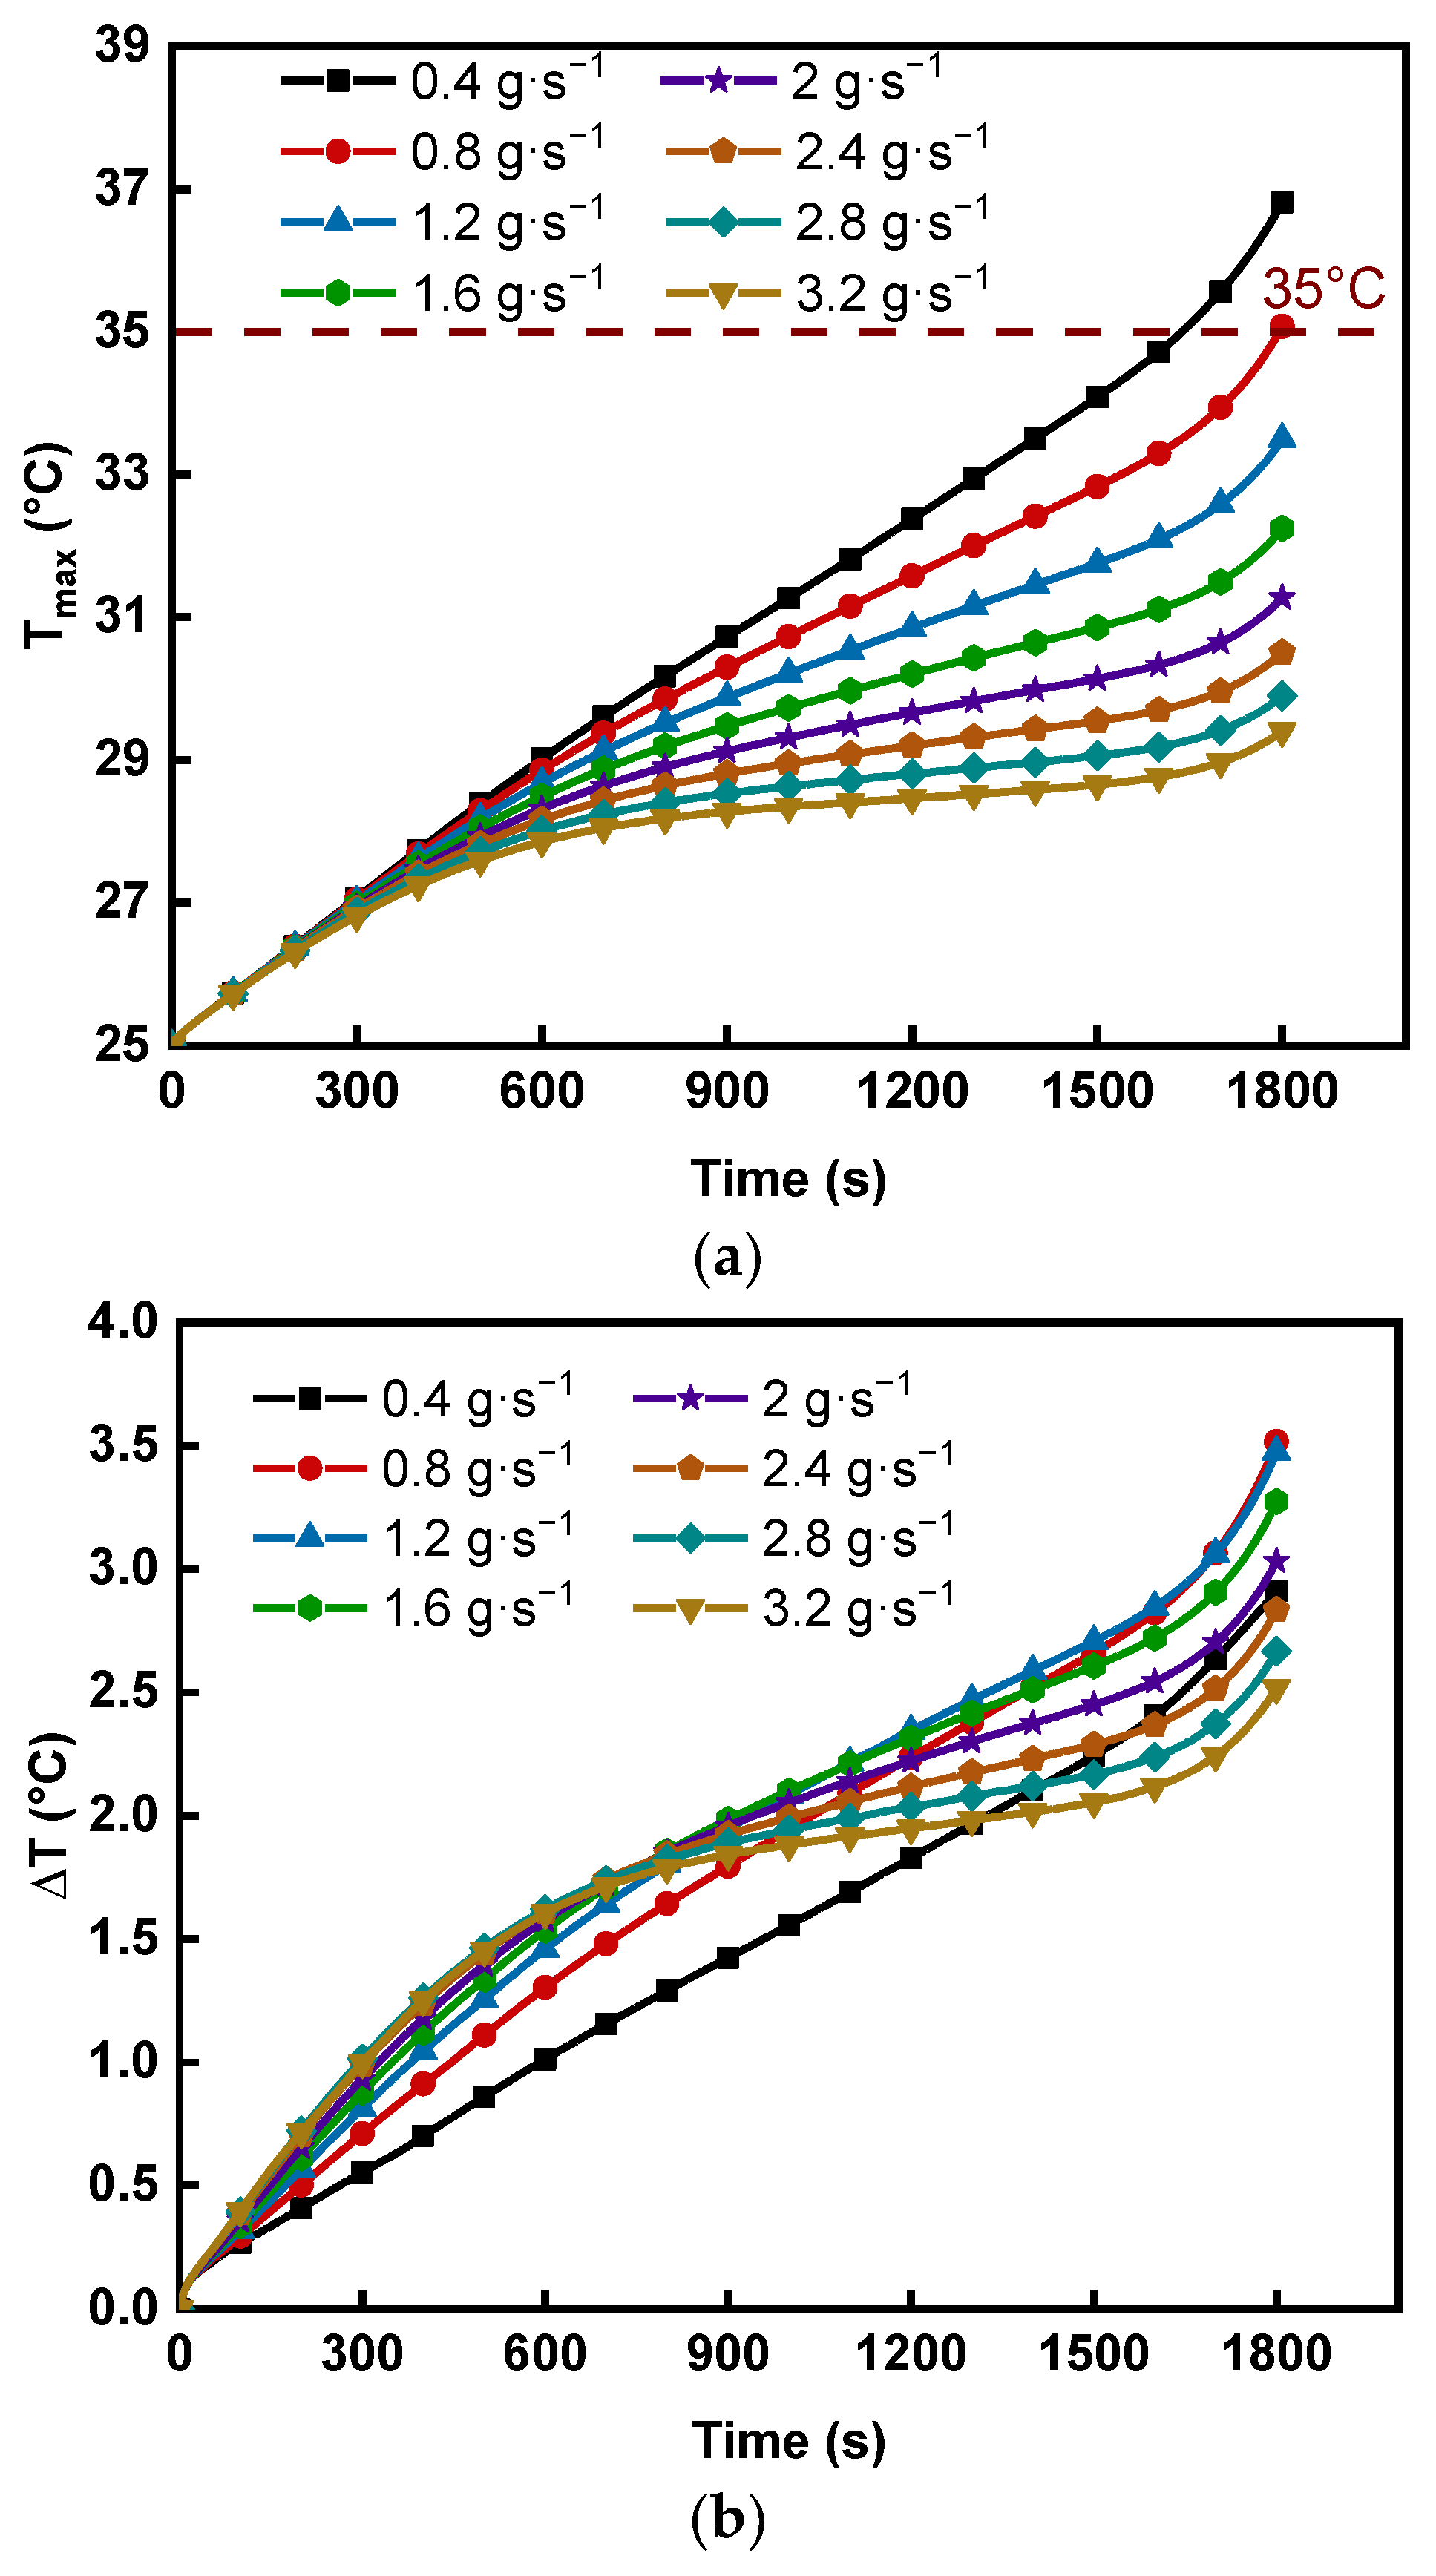
3.3.1. Mass Flow Rate

The study of the flow rate on the cooling performance of the LCP is carried out based on the above selected optimal structural solution for the LCP. The coolant mass flow rate was increased from 0.4 g·s−1 to 3.2 g·s−1 while maintaining the inlet coolant temperature at 25 °C. From Figure 8a, it can be seen that increasing the coolant mass flow rate can effectively reduce the maximum temperature of the battery module, but the magnitude of the change decreases with an increasing mass flow rate. Figure 8b shows that when the coolant mass flow rate is in the range of 0.4–0.8 g·s−1, the maximum temperature difference of the battery module increases with increasing coolant mass flow rate. When the coolant mass flow rate is greater than 0.8 g·s−1, the maximum temperature difference of the battery module decreases with increasing coolant mass flow rate. This is mainly because the minimum temperature of the battery module is higher when the mass flow rate is small. Therefore, increasing the mass flow rate will cause the minimum temperature of the battery module to drop faster than the maximum temperature, leading to increased maximum temperature difference. When the mass flow rate reaches a certain level (>0.8 g·s−1), the minimum temperature of the battery module tends to be close to the inlet temperature of the coolant. Further increases in mass flow rate at this point will cause the minimum temperature of the battery module to drop more slowly than the maximum temperature, leading to a reduction in the maximum temperature difference of the battery module [38]. Based on the principle of energy saving, the lowest mass flow rate is chosen to meet the thermal management temperature requirements. Consequently, the optimal mass flow rate is considered to be 1.2 g·s−1.

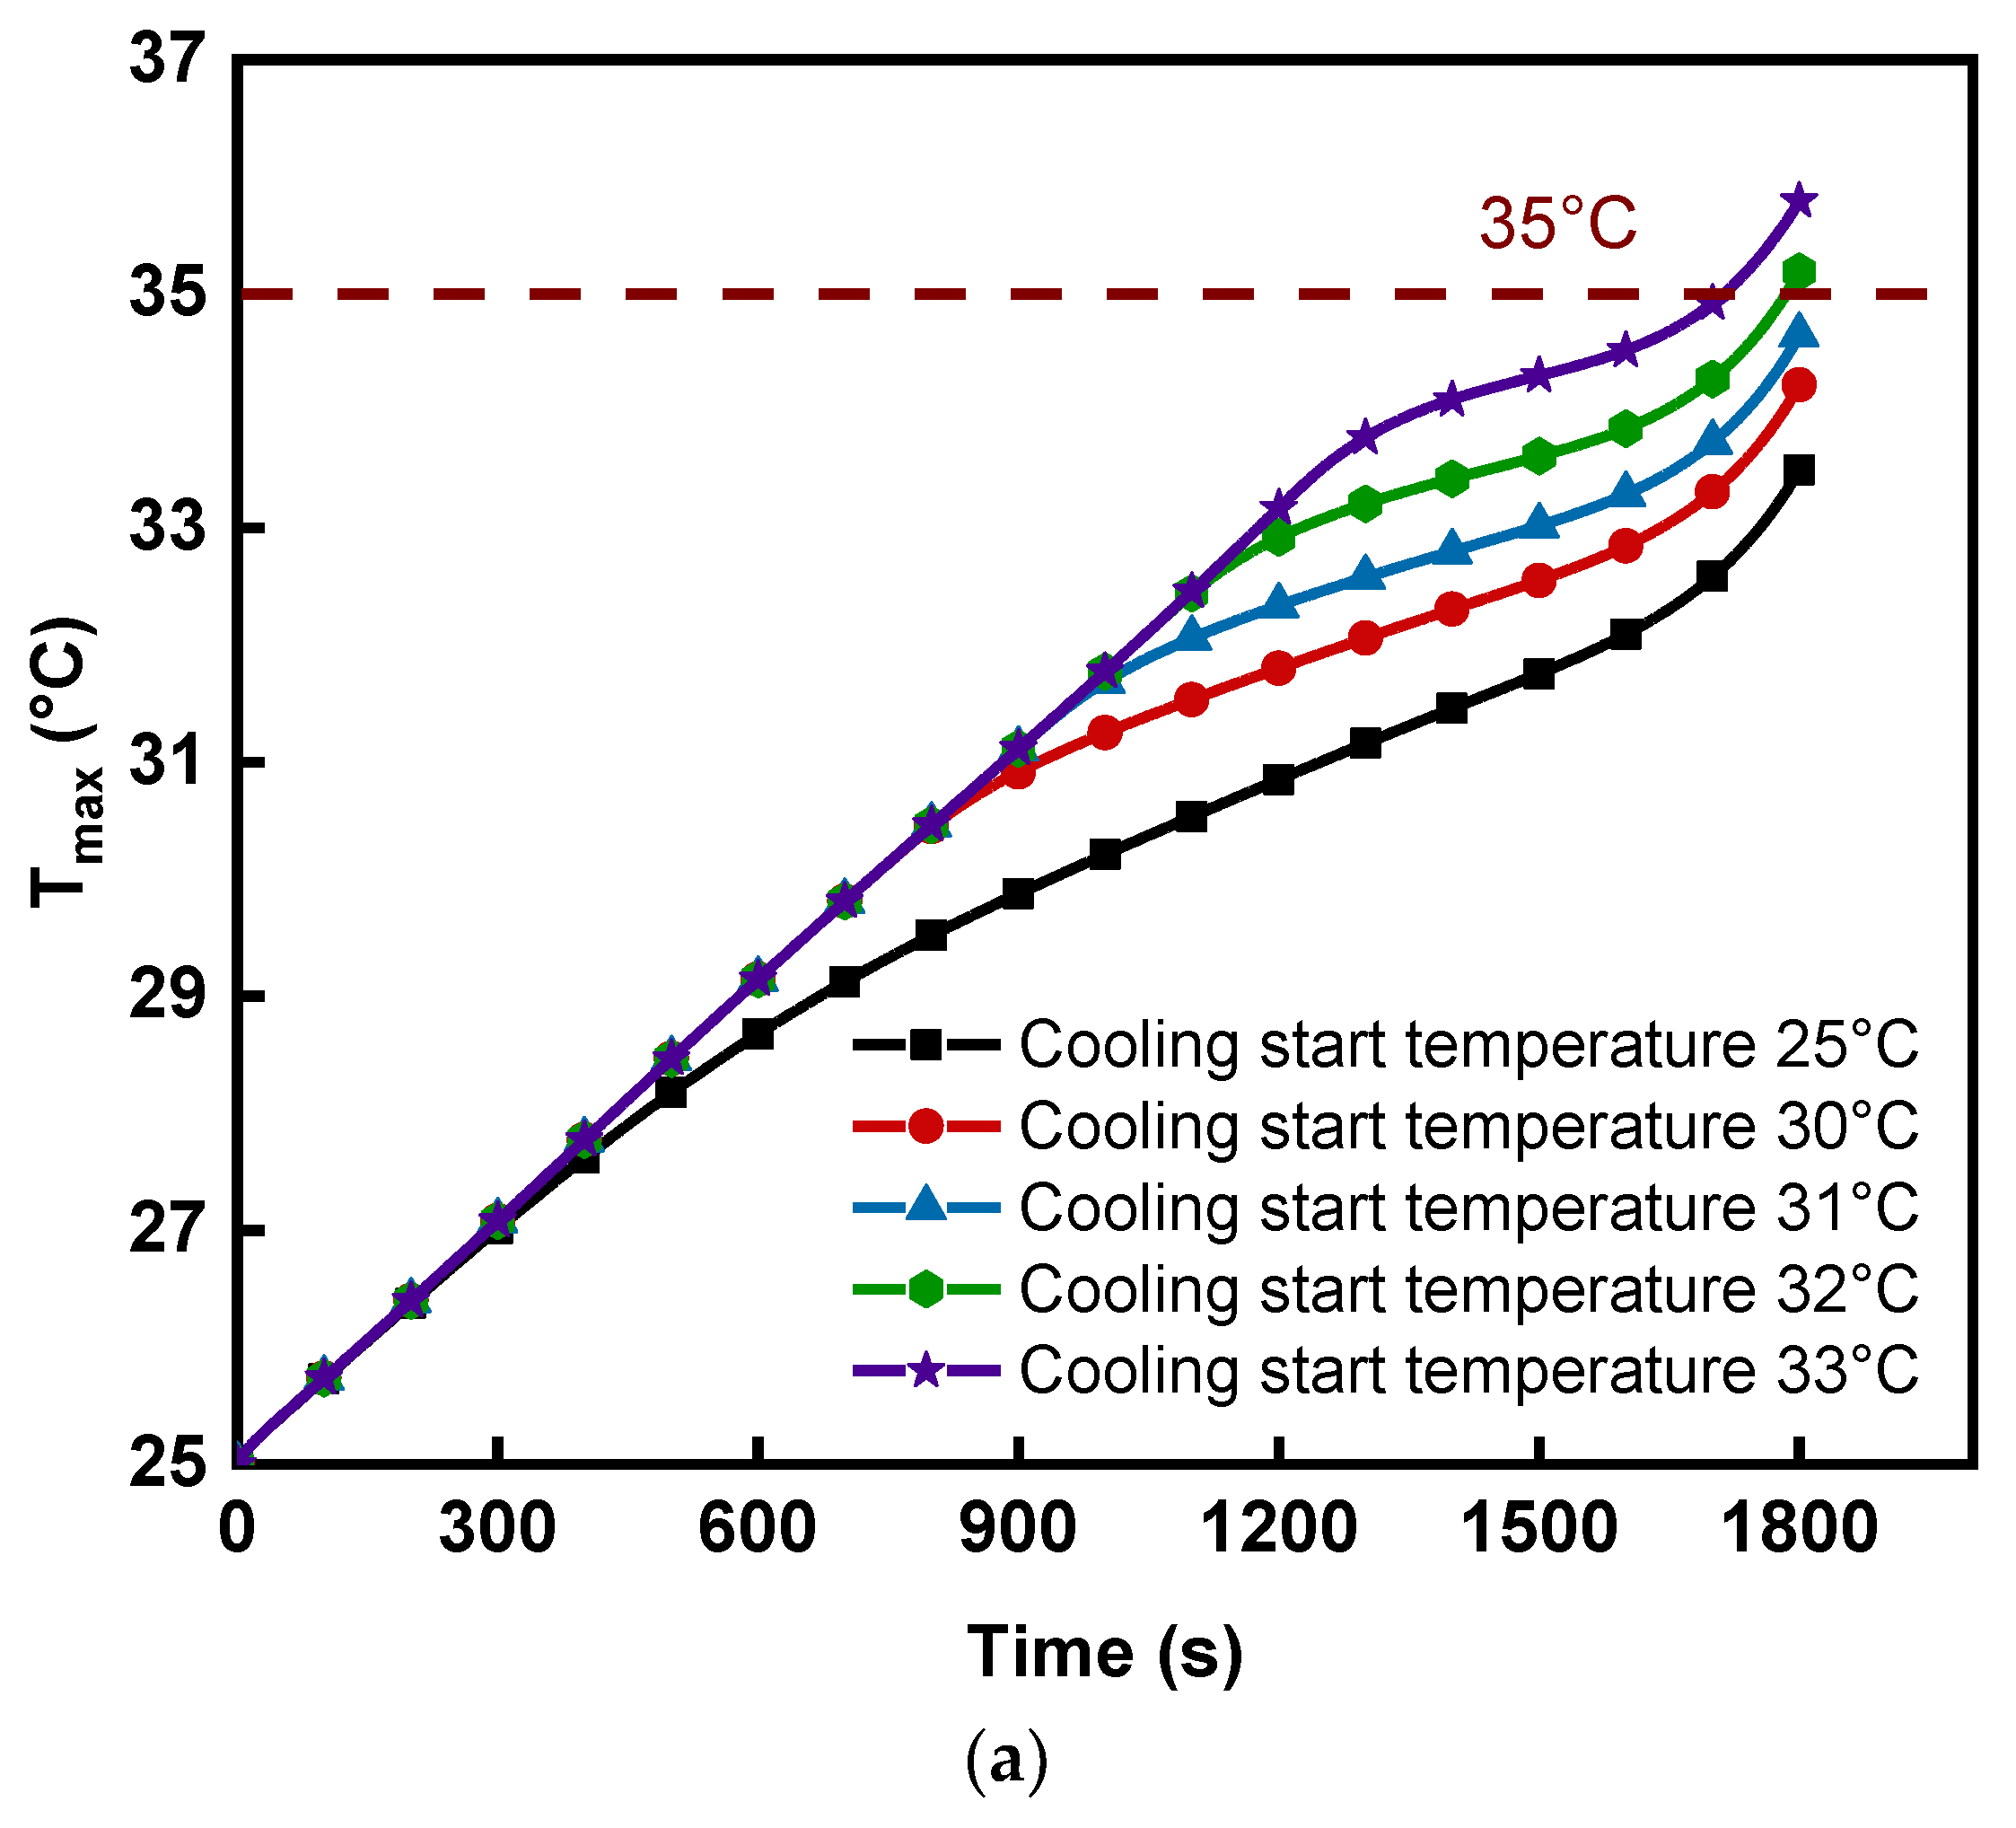
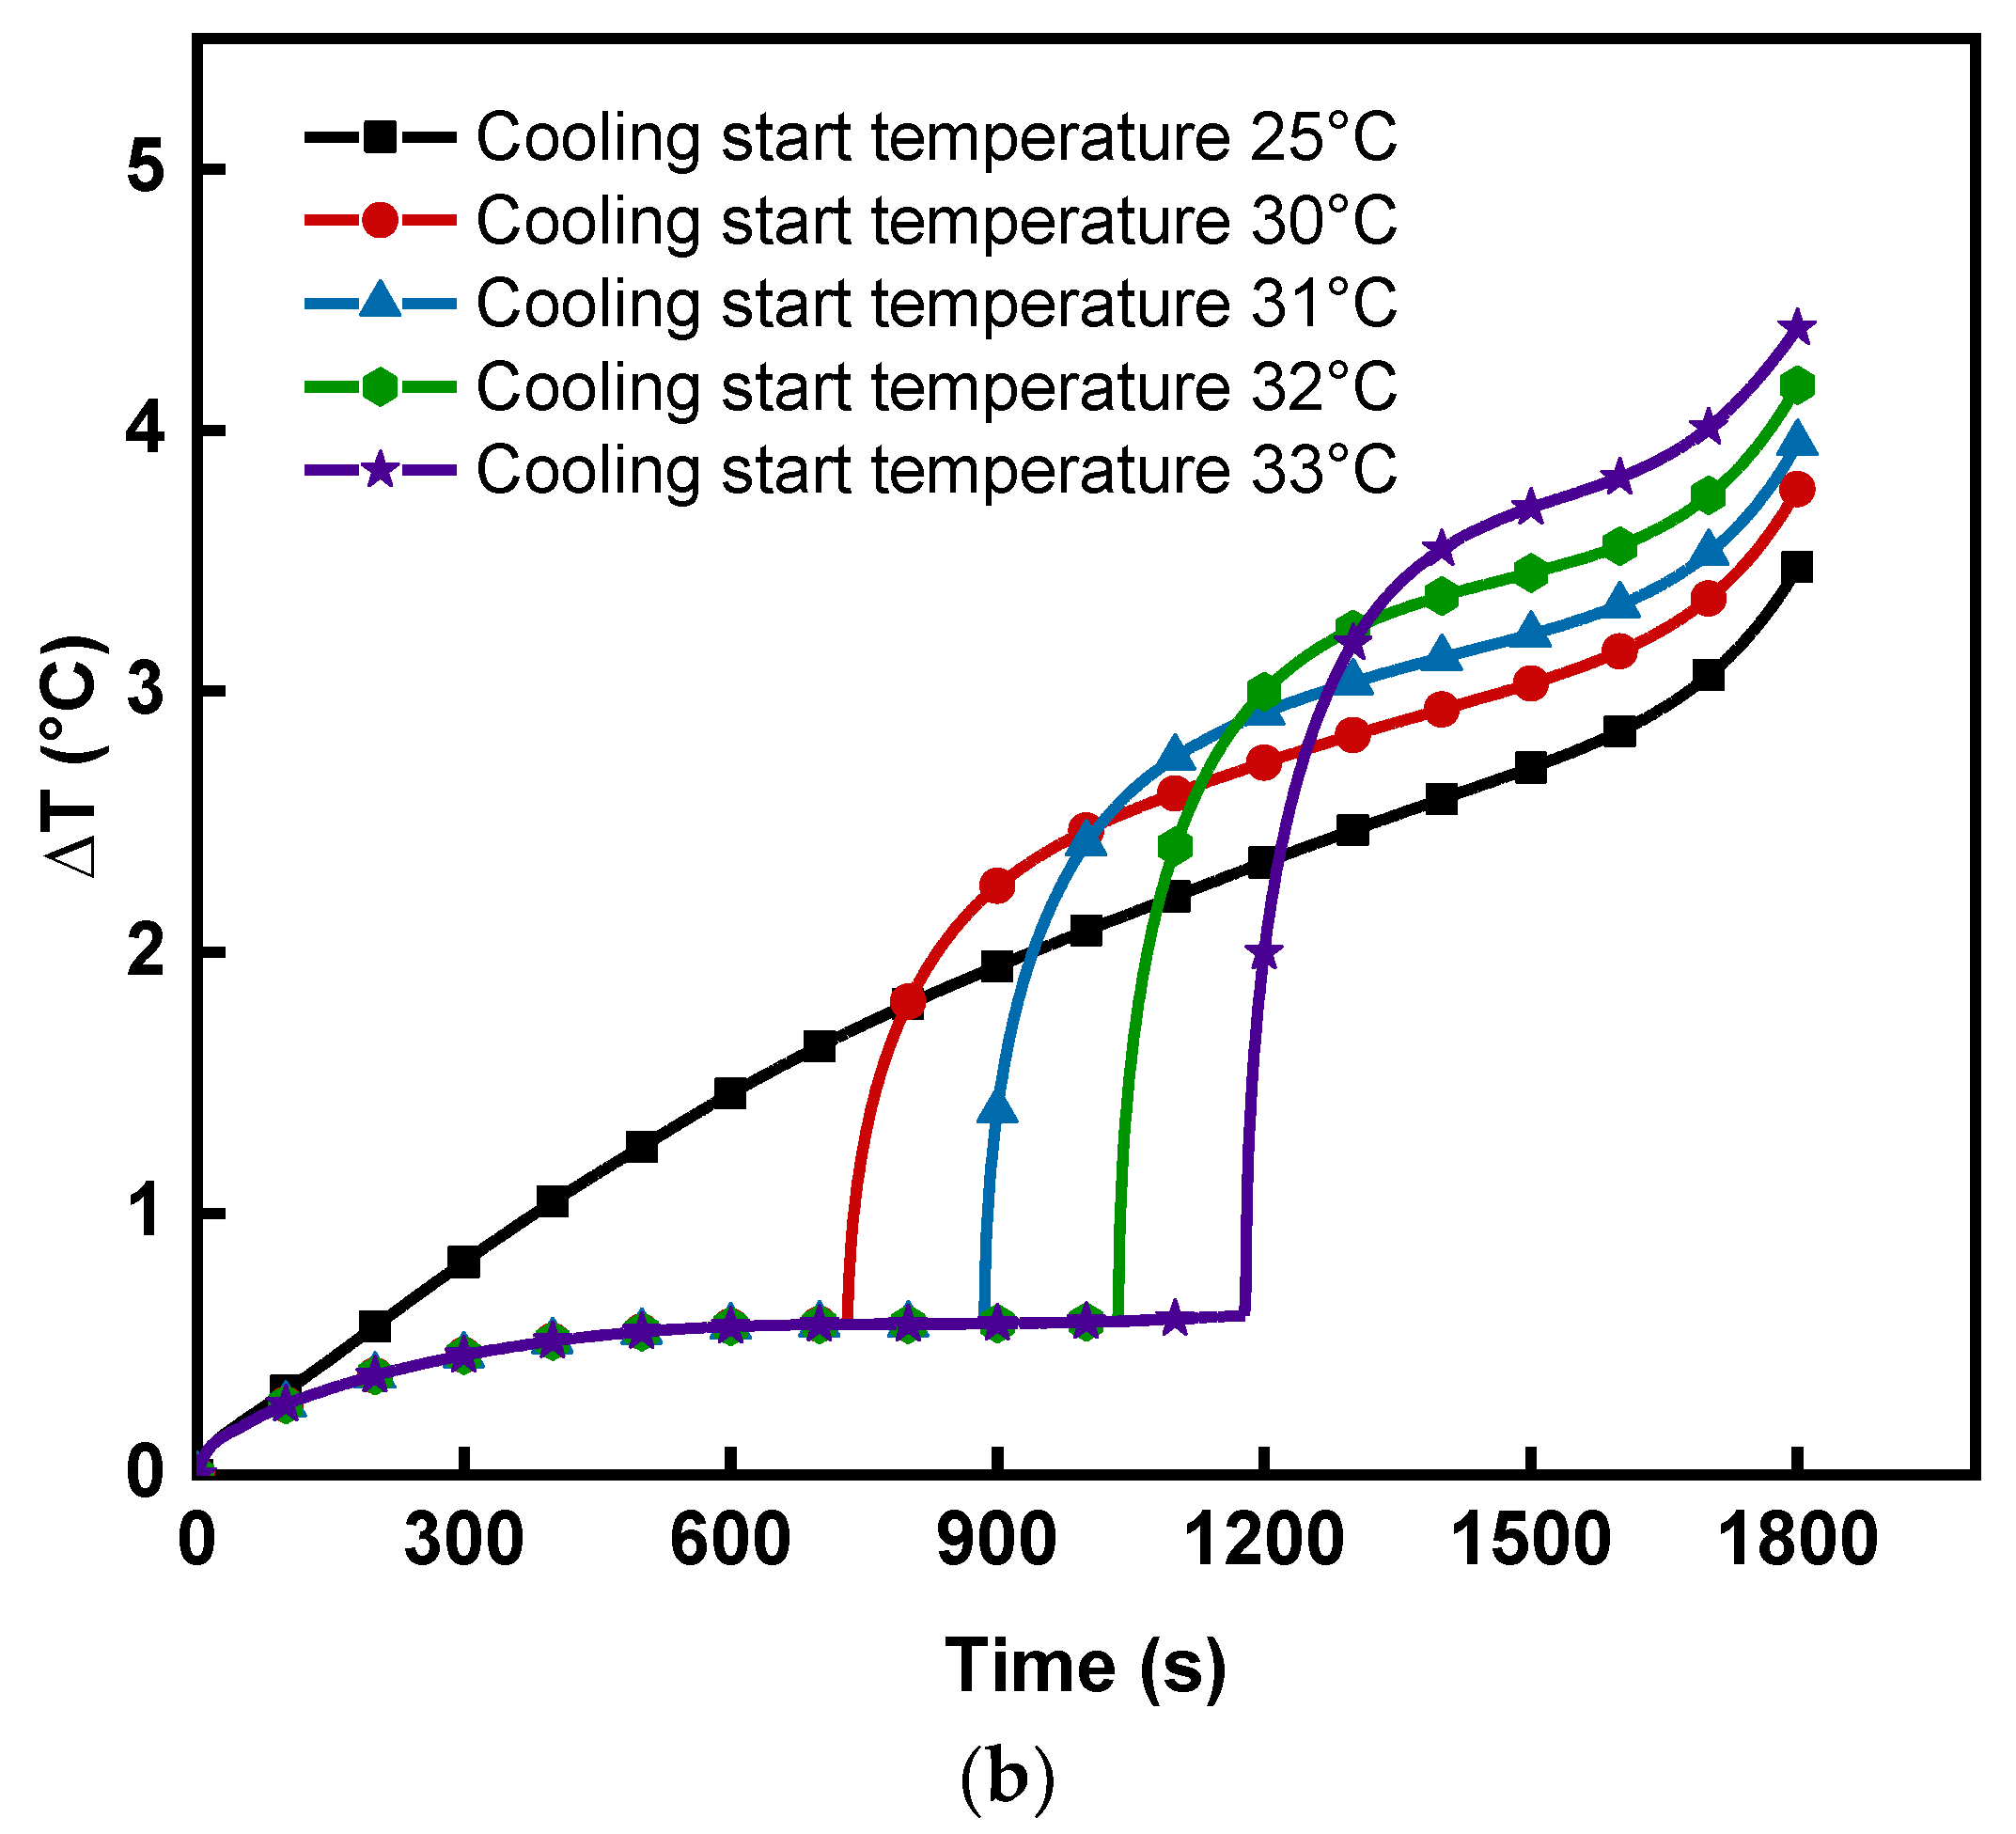
3.3.2. Cooling Start Temperature

When the maximum temperature of the battery module is below the set cooling start temperature (CST), the cooling pump is switched off and no coolant is flowing. When this maximum temperature is equal to or higher than the CST, the cooling pump is switched on and the coolant starts to flow and cool the battery module. It can be expected that delayed cooling may reduce the cooling pump energy consumption of the liquid cooling thermal management system. However, further research on the CST is required to ensure that the thermal management temperature requirements are met. The CSTs considered in this work are 25 °C (initial system temperature), 30 °C, 31 °C, 32 °C, and 33 °C, respectively. Figure 9 shows the simulation results of the battery module for the optimal LCP construction scheme and a mass flow rate of 1.2 g·s−1. As shown in Figure 9a, the higher the CST, the higher the maximum temperature of the battery module at the end of discharge. However, a high CST means a shorter working time of the pump, which contributes to a lower system energy consumption. Obviously, the maximum temperature of the battery module is below 35 °C when the CST does not exceed 31 °C. Each battery in the battery module has a very similar heat generation rate as that of the others. Part of the heat from a single battery is used to raise the temperature of the battery itself, while the rest is absorbed by the LCP and coolant through heat transfer, which results in some temperature difference between the different parts of the battery module. As shown in Figure 9b, the maximum temperature difference of the battery module remains low before the start of cooling because the LCP and coolant absorbs little heat over this time period, resulting in a low temperature difference. However, after cooling commences, most of the heat in the single battery is taken away by the coolant in the channel through convection, giving an abruptly increased temperature difference. Higher CST means more heat is accumulated in the battery module, increasing the temperature difference. This also explains the phenomenon that the maximum temperature difference of the battery module increases sharply at the beginning of cooling, and the higher the temperature at the beginning of cooling, the greater the increase [38]. In summary, the CST is chosen to be 31 °C, which can reduce the energy consumption of the system by 50.9% compared to the operating condition where there is no delayed cooling, and at the same time achieve the required thermal management temperature.
In summary, the optimal solution is chosen for the channel layout of Case 1, the channel size of L2W3H3 (the length of the channel being 1116.65 mm, the width 6 mm, and the height 6 mm), the mass flow rate of 1.2 g/s, and the cooling start temperature of 31 °C. At this time, the maximum temperature of the battery module is 34.65 °C, the maximum temperature difference is 3.95 °C, and the channel pressure drop is 8.82 Pa, which reduces the energy consumption of the system by 50.9% compared to the working condition without delayed cooling, while meeting the thermal management temperature requirement of the battery, indicating that the thermal management system is designed to be efficient and reasonable.

3.4. Cooling Performance under WLTC Conditions

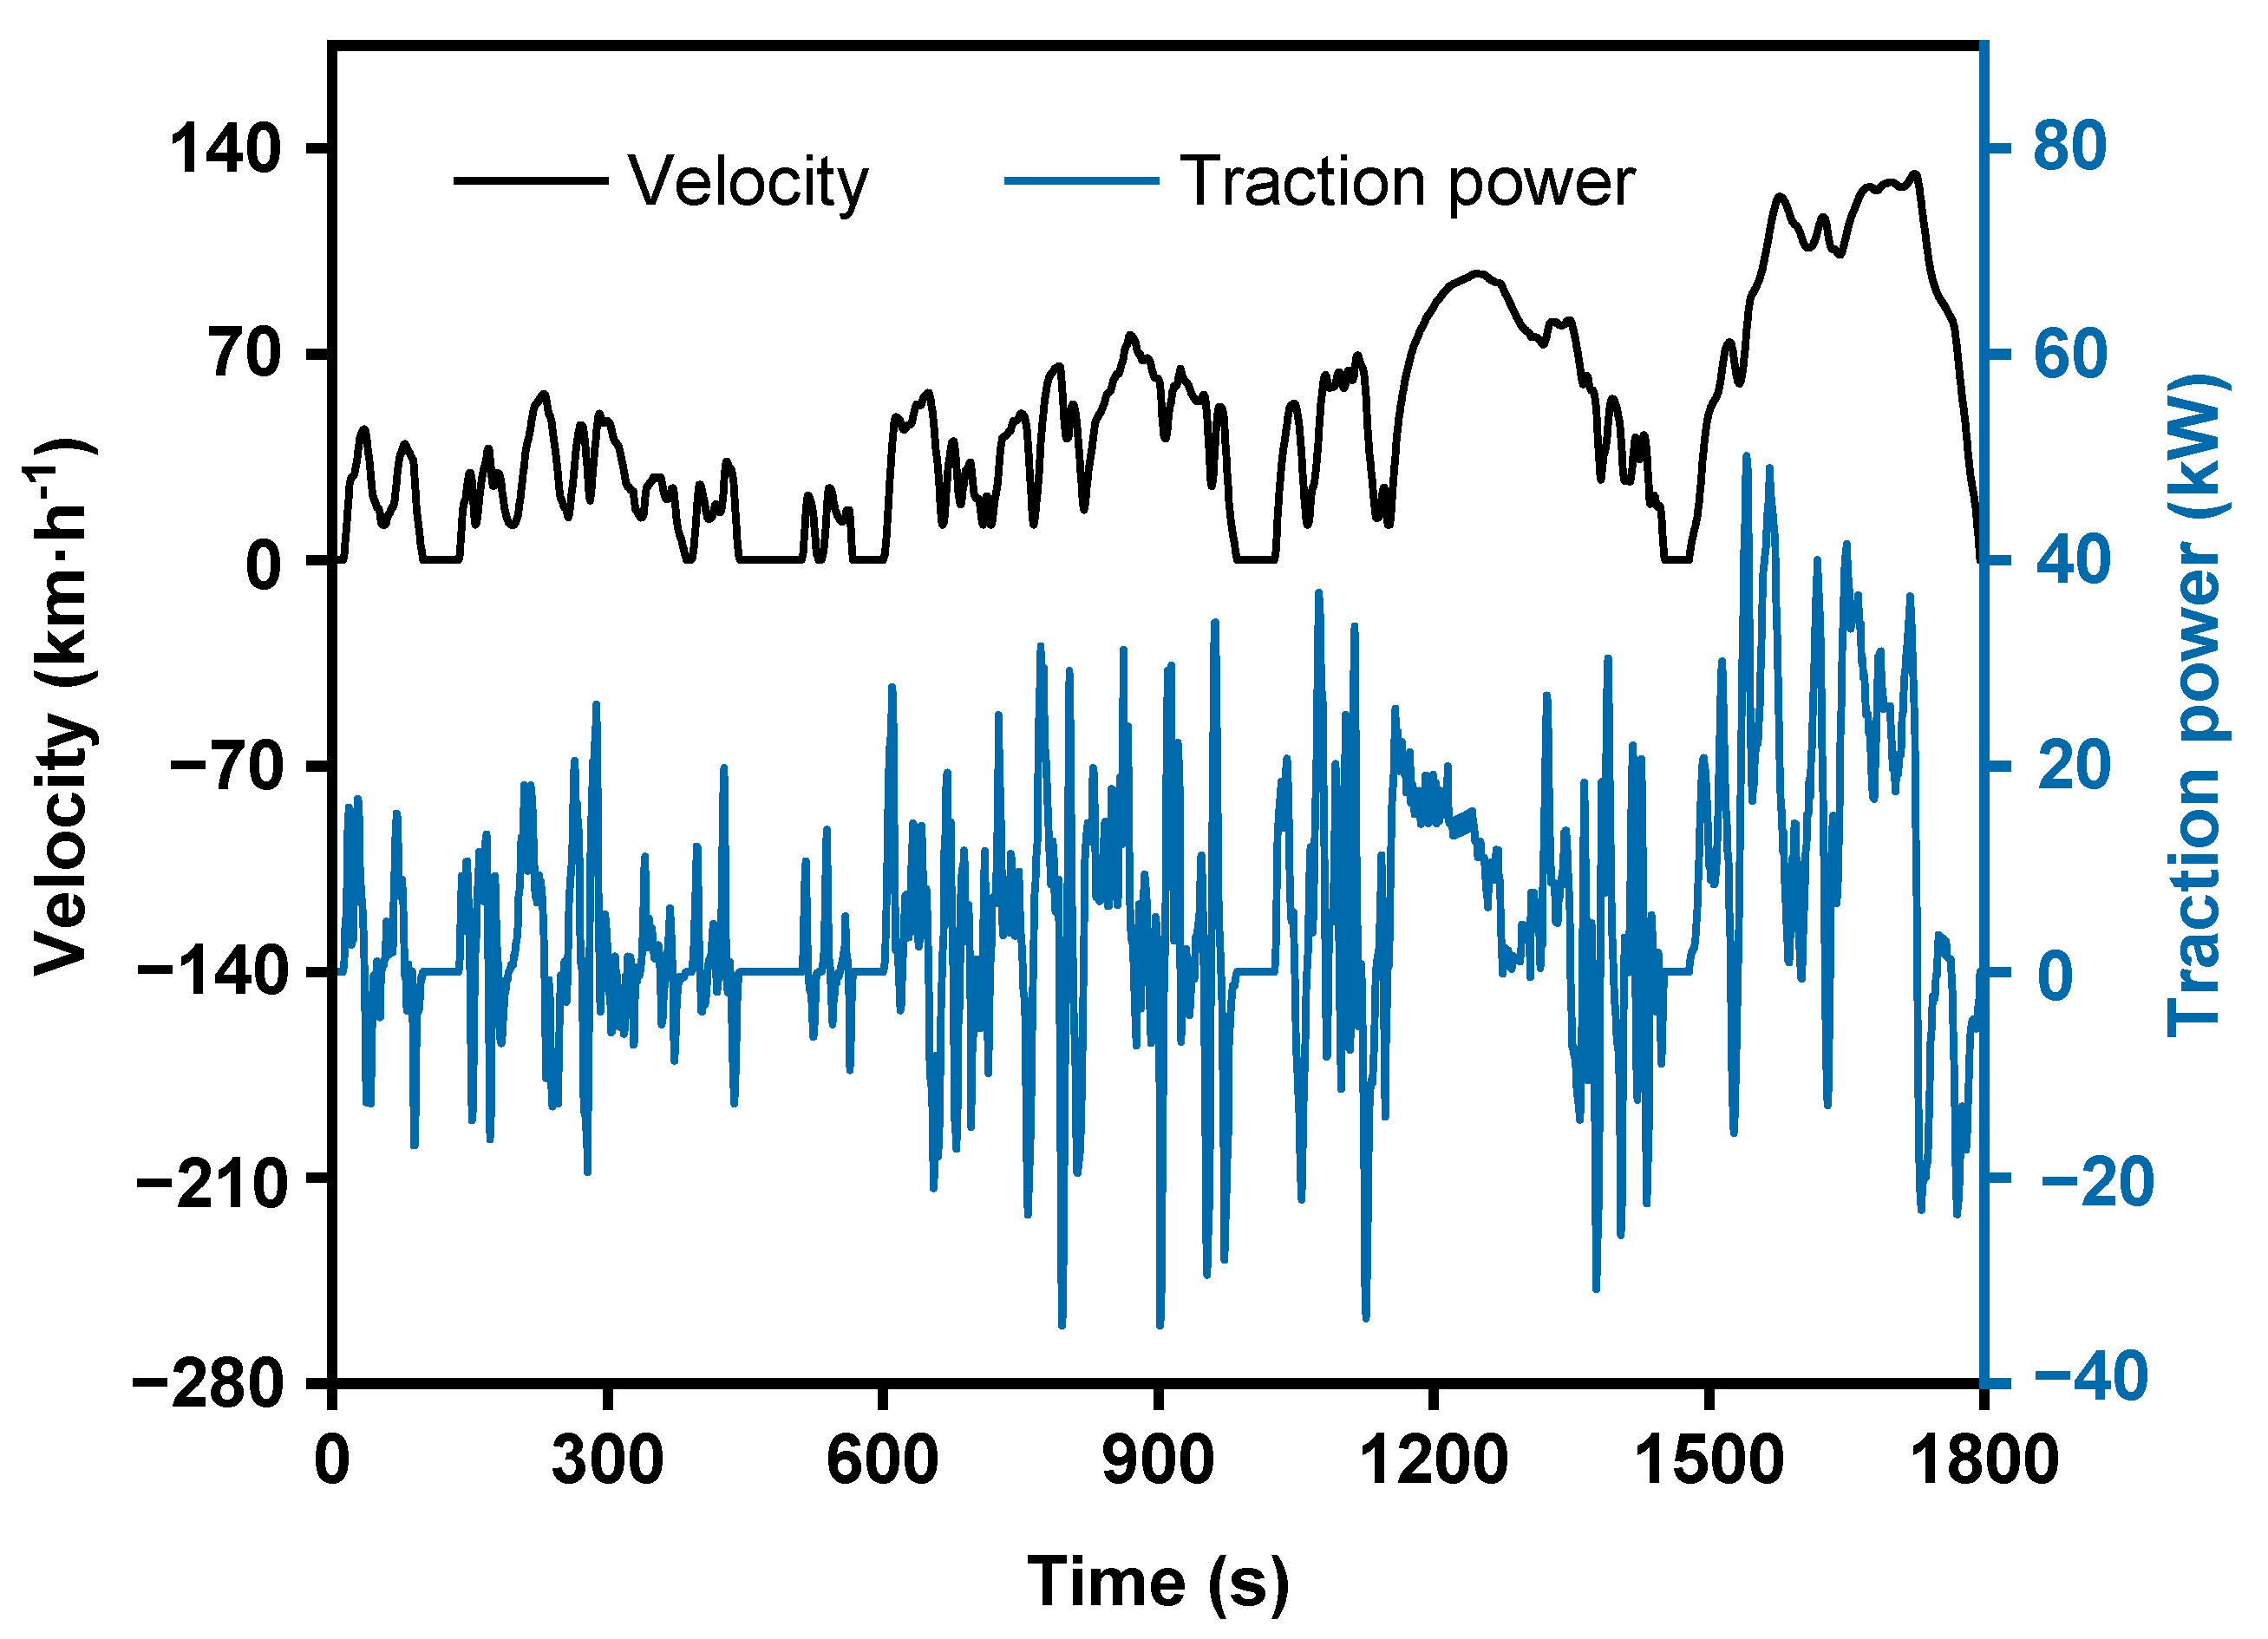
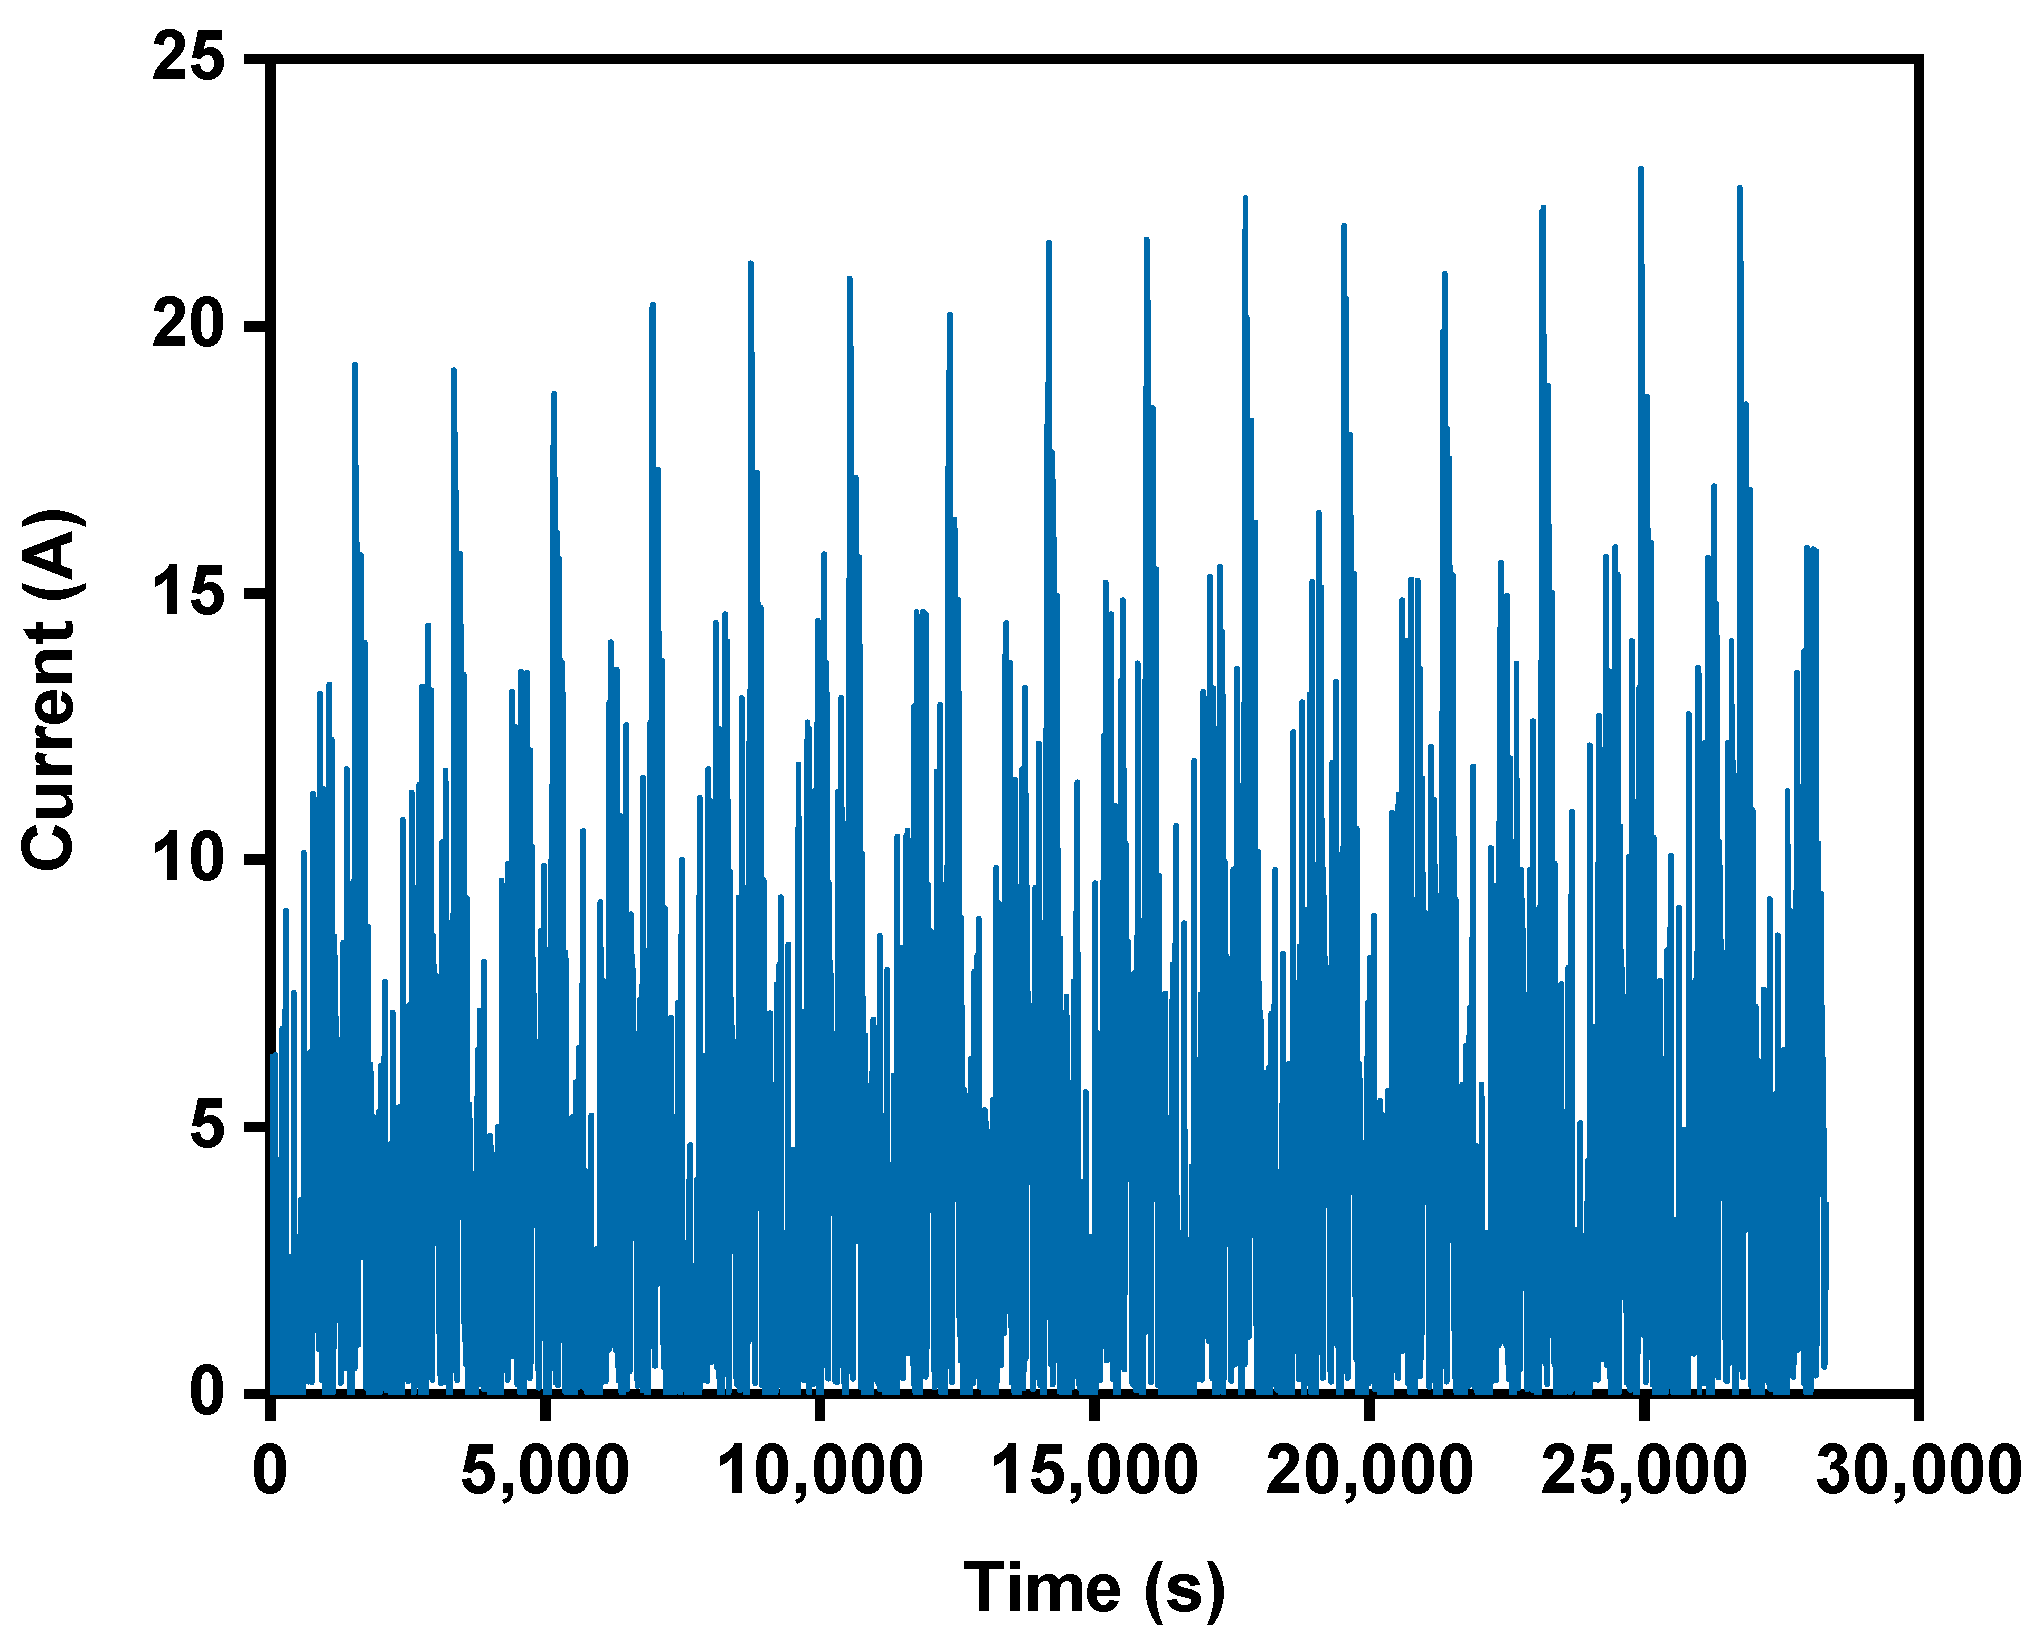
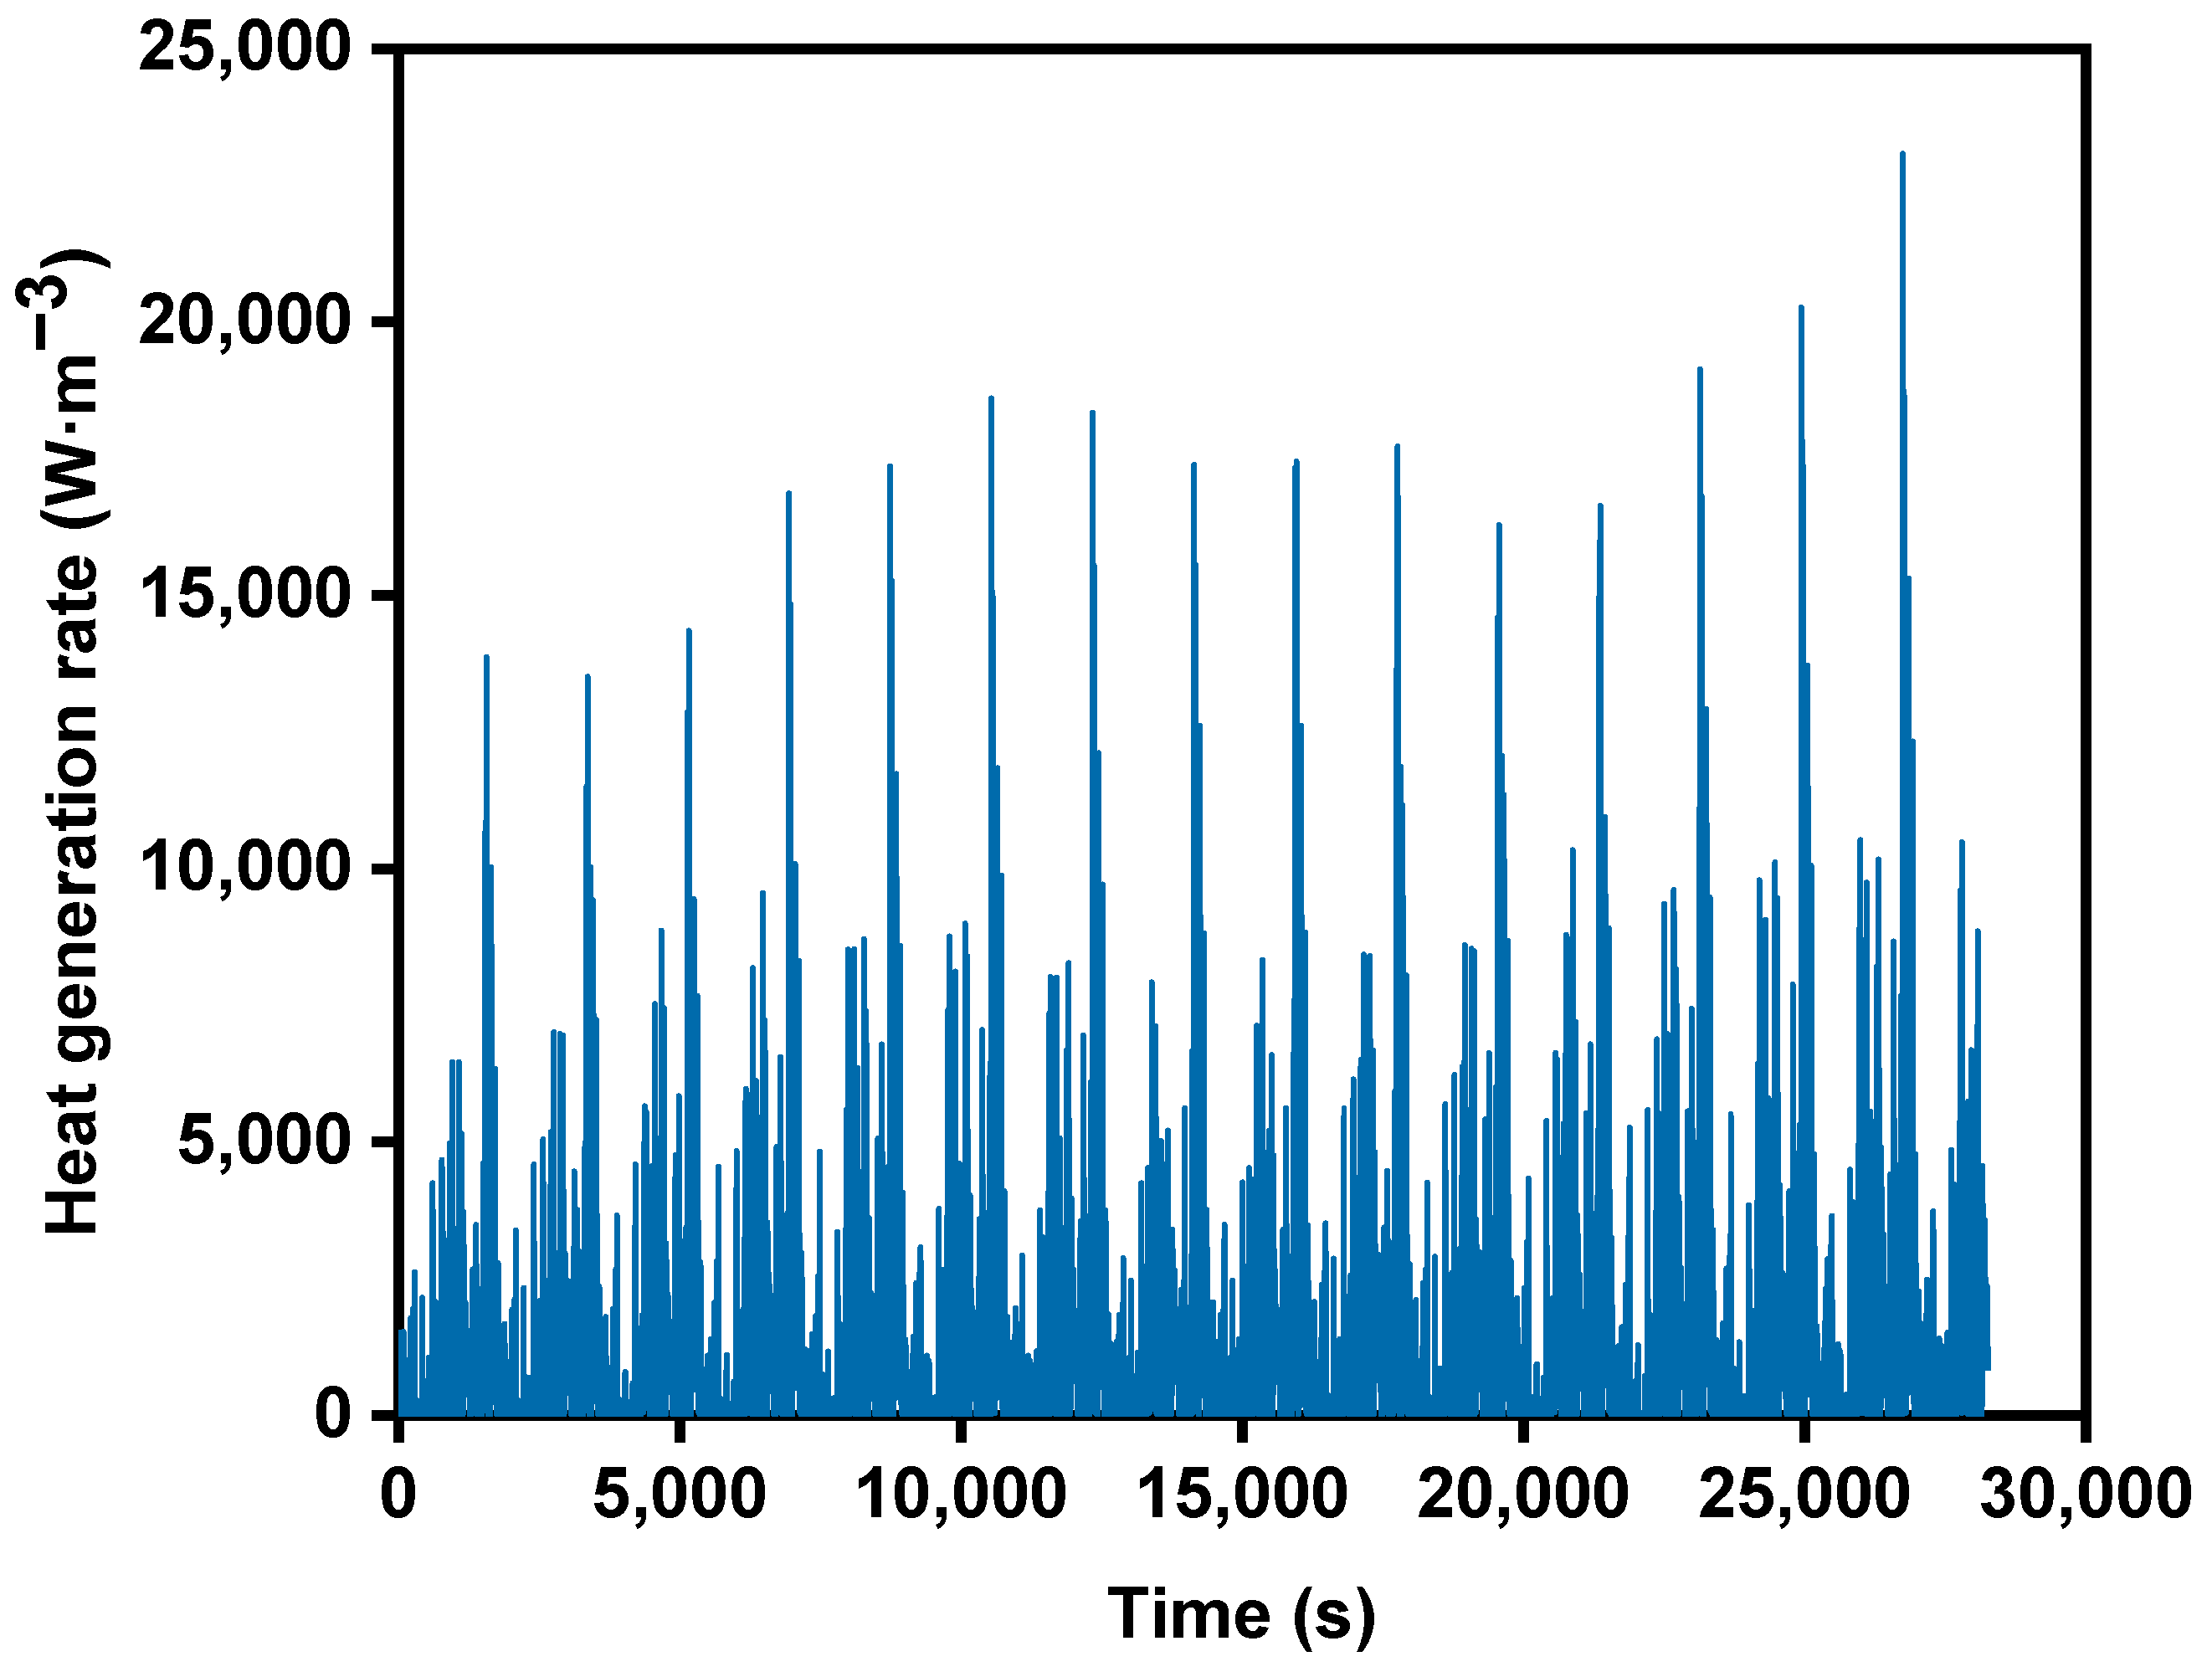
3.4.1. Determination of Dynamic Heat Generation Rate in WLTC

In practical applications, batteries are unlikely to be discharged continuously at 2C. The world-harmonized light-duty vehicles test cycle (WLTC) was introduced to study the performance of the liquid cooling system under actual vehicle conditions. WLTC working conditions cover a larger speed and load range, and more transient working conditions. The maximum speed is as high as 130 km·h−1, which could reflect the actual driving behavior of the EV and considers extreme driving behavior. The WLTC conditions include low, medium, high, and superhigh speed sections. The maximum speeds are 56, 76, 97 and 130 km·h−1, respectively. The test time is 1800 s, and the test mileage is 23.27 km. The speed profile of one WLTC is shown in Figure 10. The traction power Pt,1 of the complete vehicle during one WLTC is estimated by Equation (17) [39]:
P t , 1 = v 1000 η [ μ r m e v g c o s α + m e v g sin α + 0.5 ρ A f C d v 2 + m e v d v d t ]
where v is velocity of the EV, η is the motion efficiency, μr is the rolling resistance, mev is the mass of the EV, g is standard gravity, α is the road gradient, ρ is air density, Af is the windward area, and Cd is the air friction coefficient.
Table 6 lists the values of the vehicle specification and driving conditions used in Equation (17).
It is assumed that the vehicle is driving on a horizontal road. The resulting power curve calculated is also shown in Figure 10, where negative power indicates that the battery is charging, and this part of the energy can be regenerated back into the battery system by a regenerative braking system with an efficiency of 0.8.
The EV battery pack in this work consists of 95 series-connected lithium manganate battery modules, each with seven single batteries placed in parallel. The whole pack has 665 single batteries with a total voltage of 351.5 V. As shown in Figure 11, the working voltage and internal resistance variation curves with the depth of discharge (DOD) of the lithium manganate single battery were obtained in our previous work [37]. The energy of the whole pack is given by Equation (18):
E b p = 0 t 0 U I u n b 1000 × 3600 d t
where Ebp is the energy of the pack, t0 is the end time of the operating voltage measurement, U is the operating voltage, Iu is the discharge current, and nb is the number of single batteries in the pack. The Ebp is calculated to be 40.77 kWh.
The output power of the entire discharge process of the battery pack under multiple WLTCs can be expressed by Equation (19):
P c = P t , m
where Pc is the output power of the battery pack and Pt,m is the traction power of the vehicle under multiple WLTCs, i.e., multiple cycles of Pt,1.
From Equation (20), we can obtain the time t1 required for the battery pack to finish discharging under multiple WLTCs:
0 t 1 P c 3600 d t = E b p
The calculation gives t1 = 28,260 s, which corresponds to 15.7 WLTCs.
Figure 12 shows the profile of current in the entire discharge process of a single battery under multiple WLTCs, which can be obtained from Equation (21):
I = P c × 1000 n b U
Figure 13 shows the heat generation rate of the entire discharge process of a single battery under multiple WLTCs, which can be obtained from Equation (3).

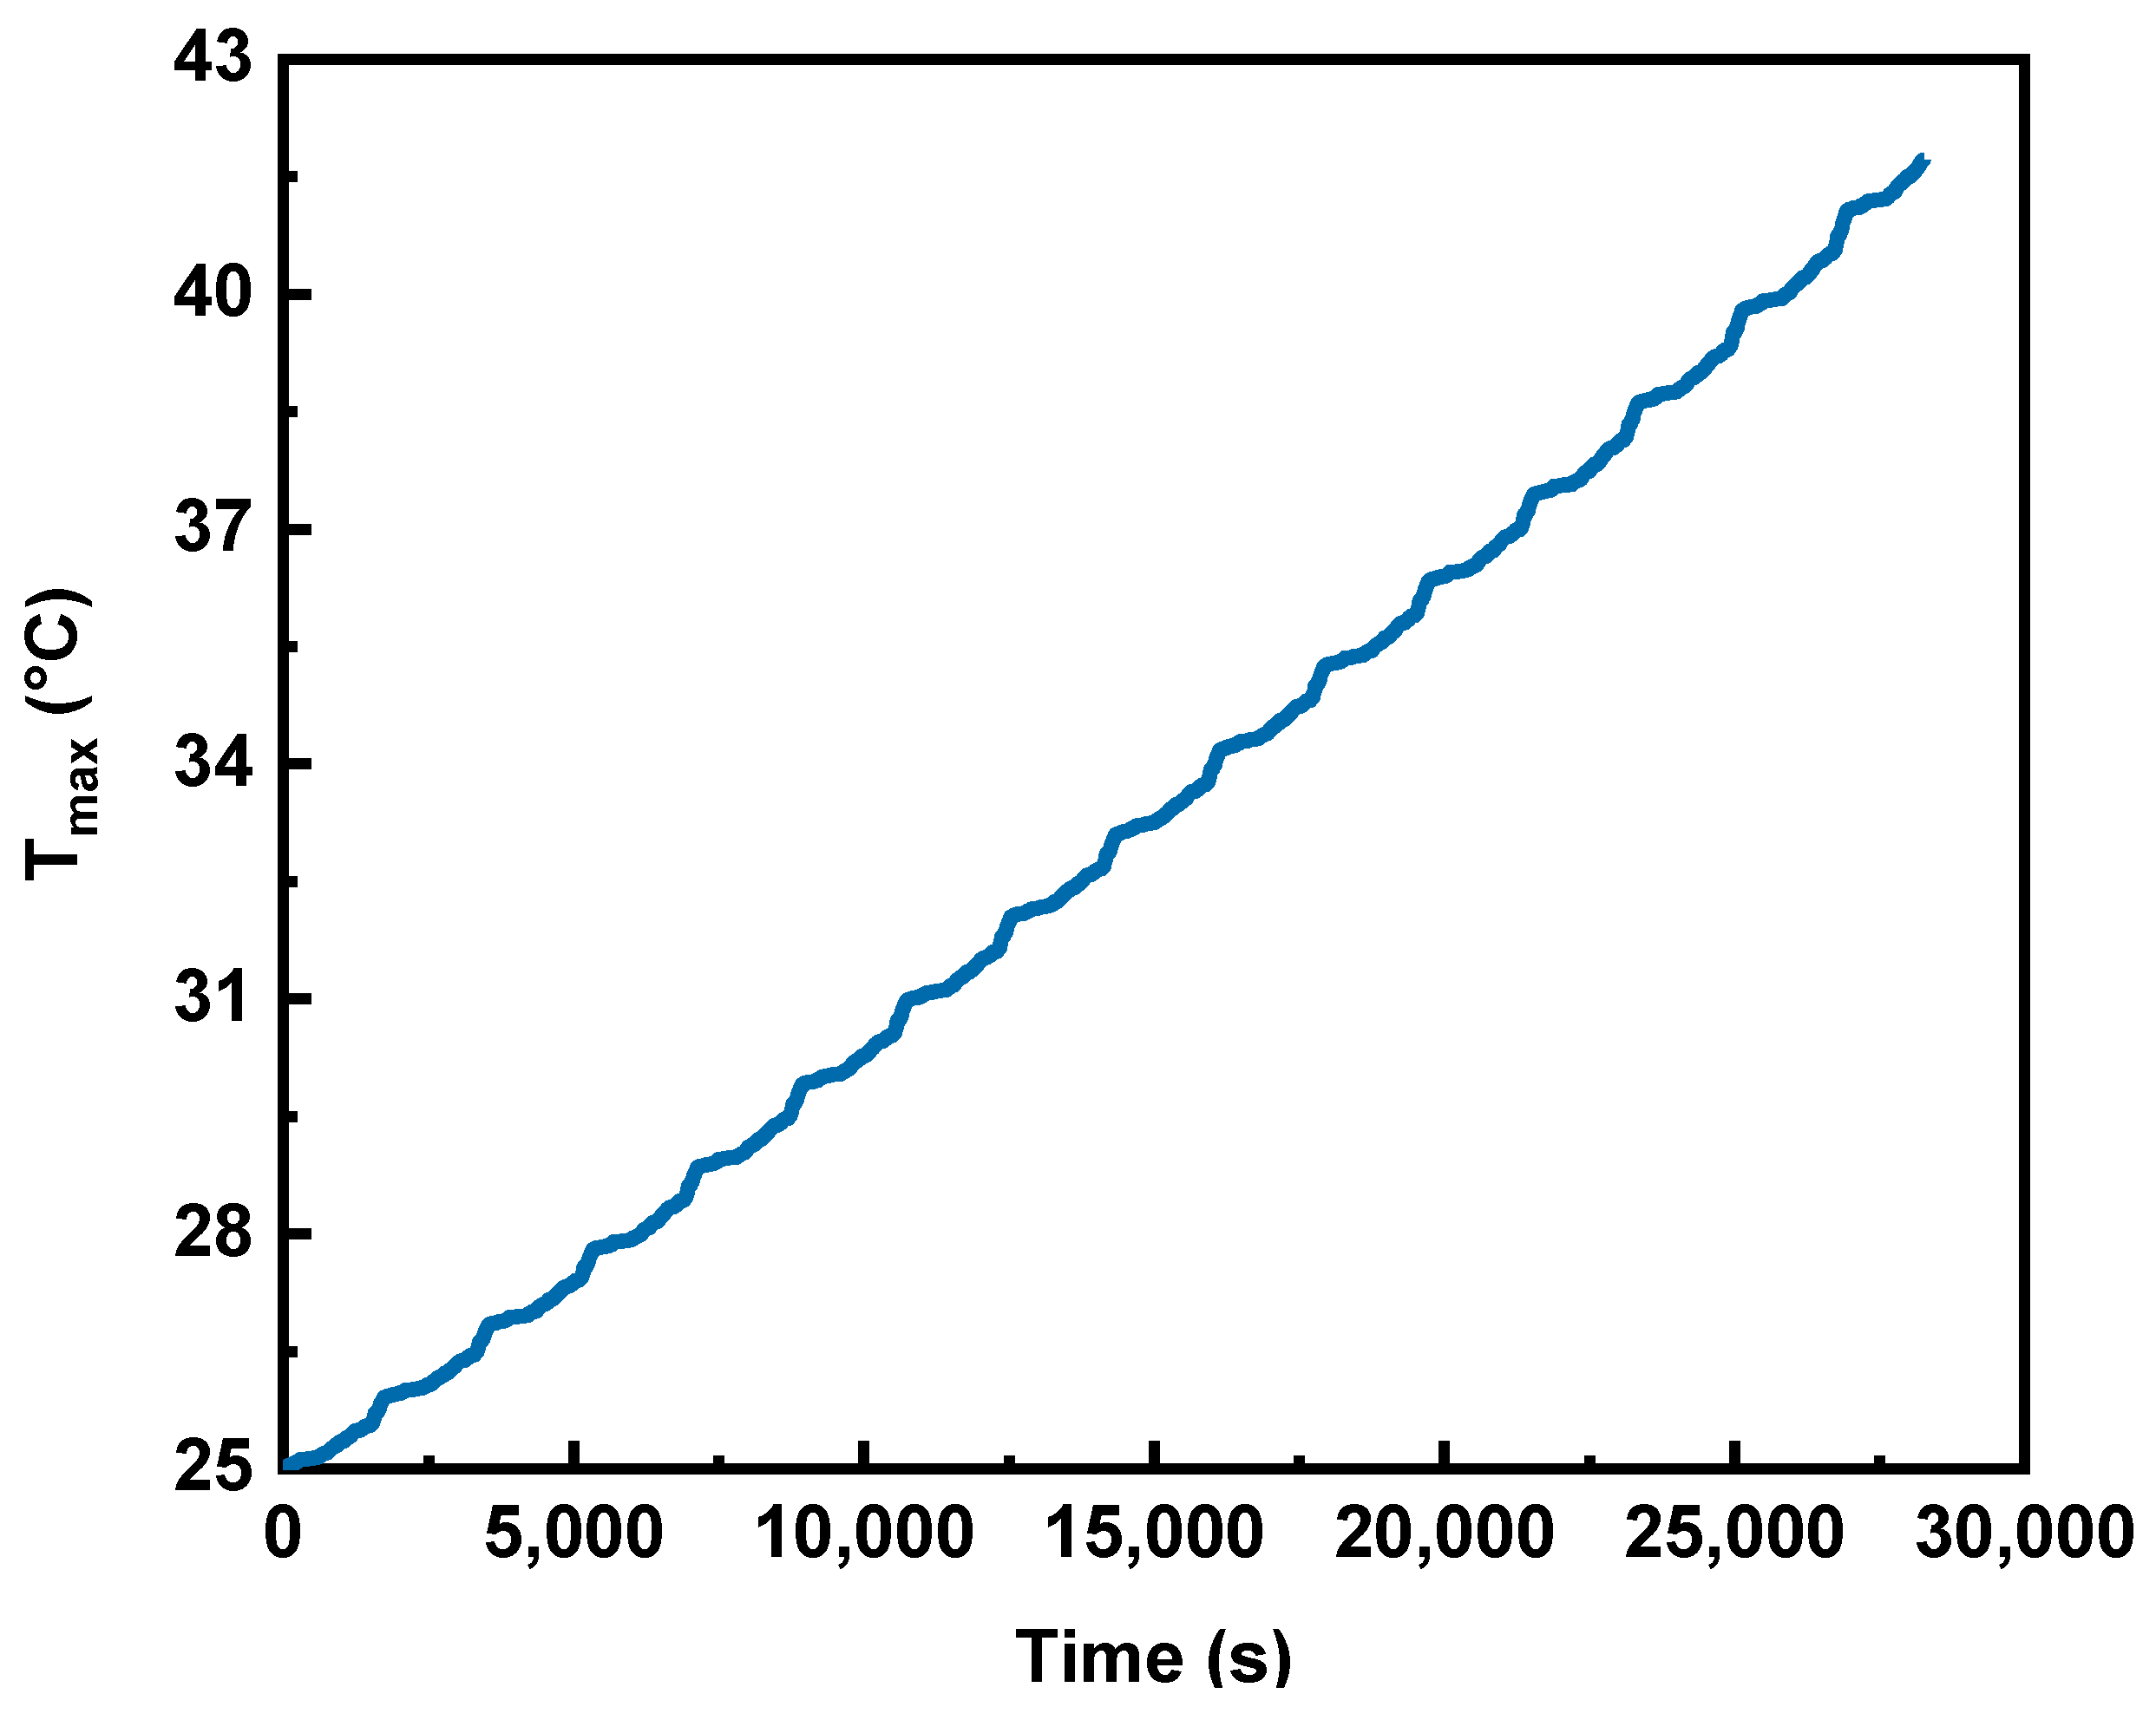
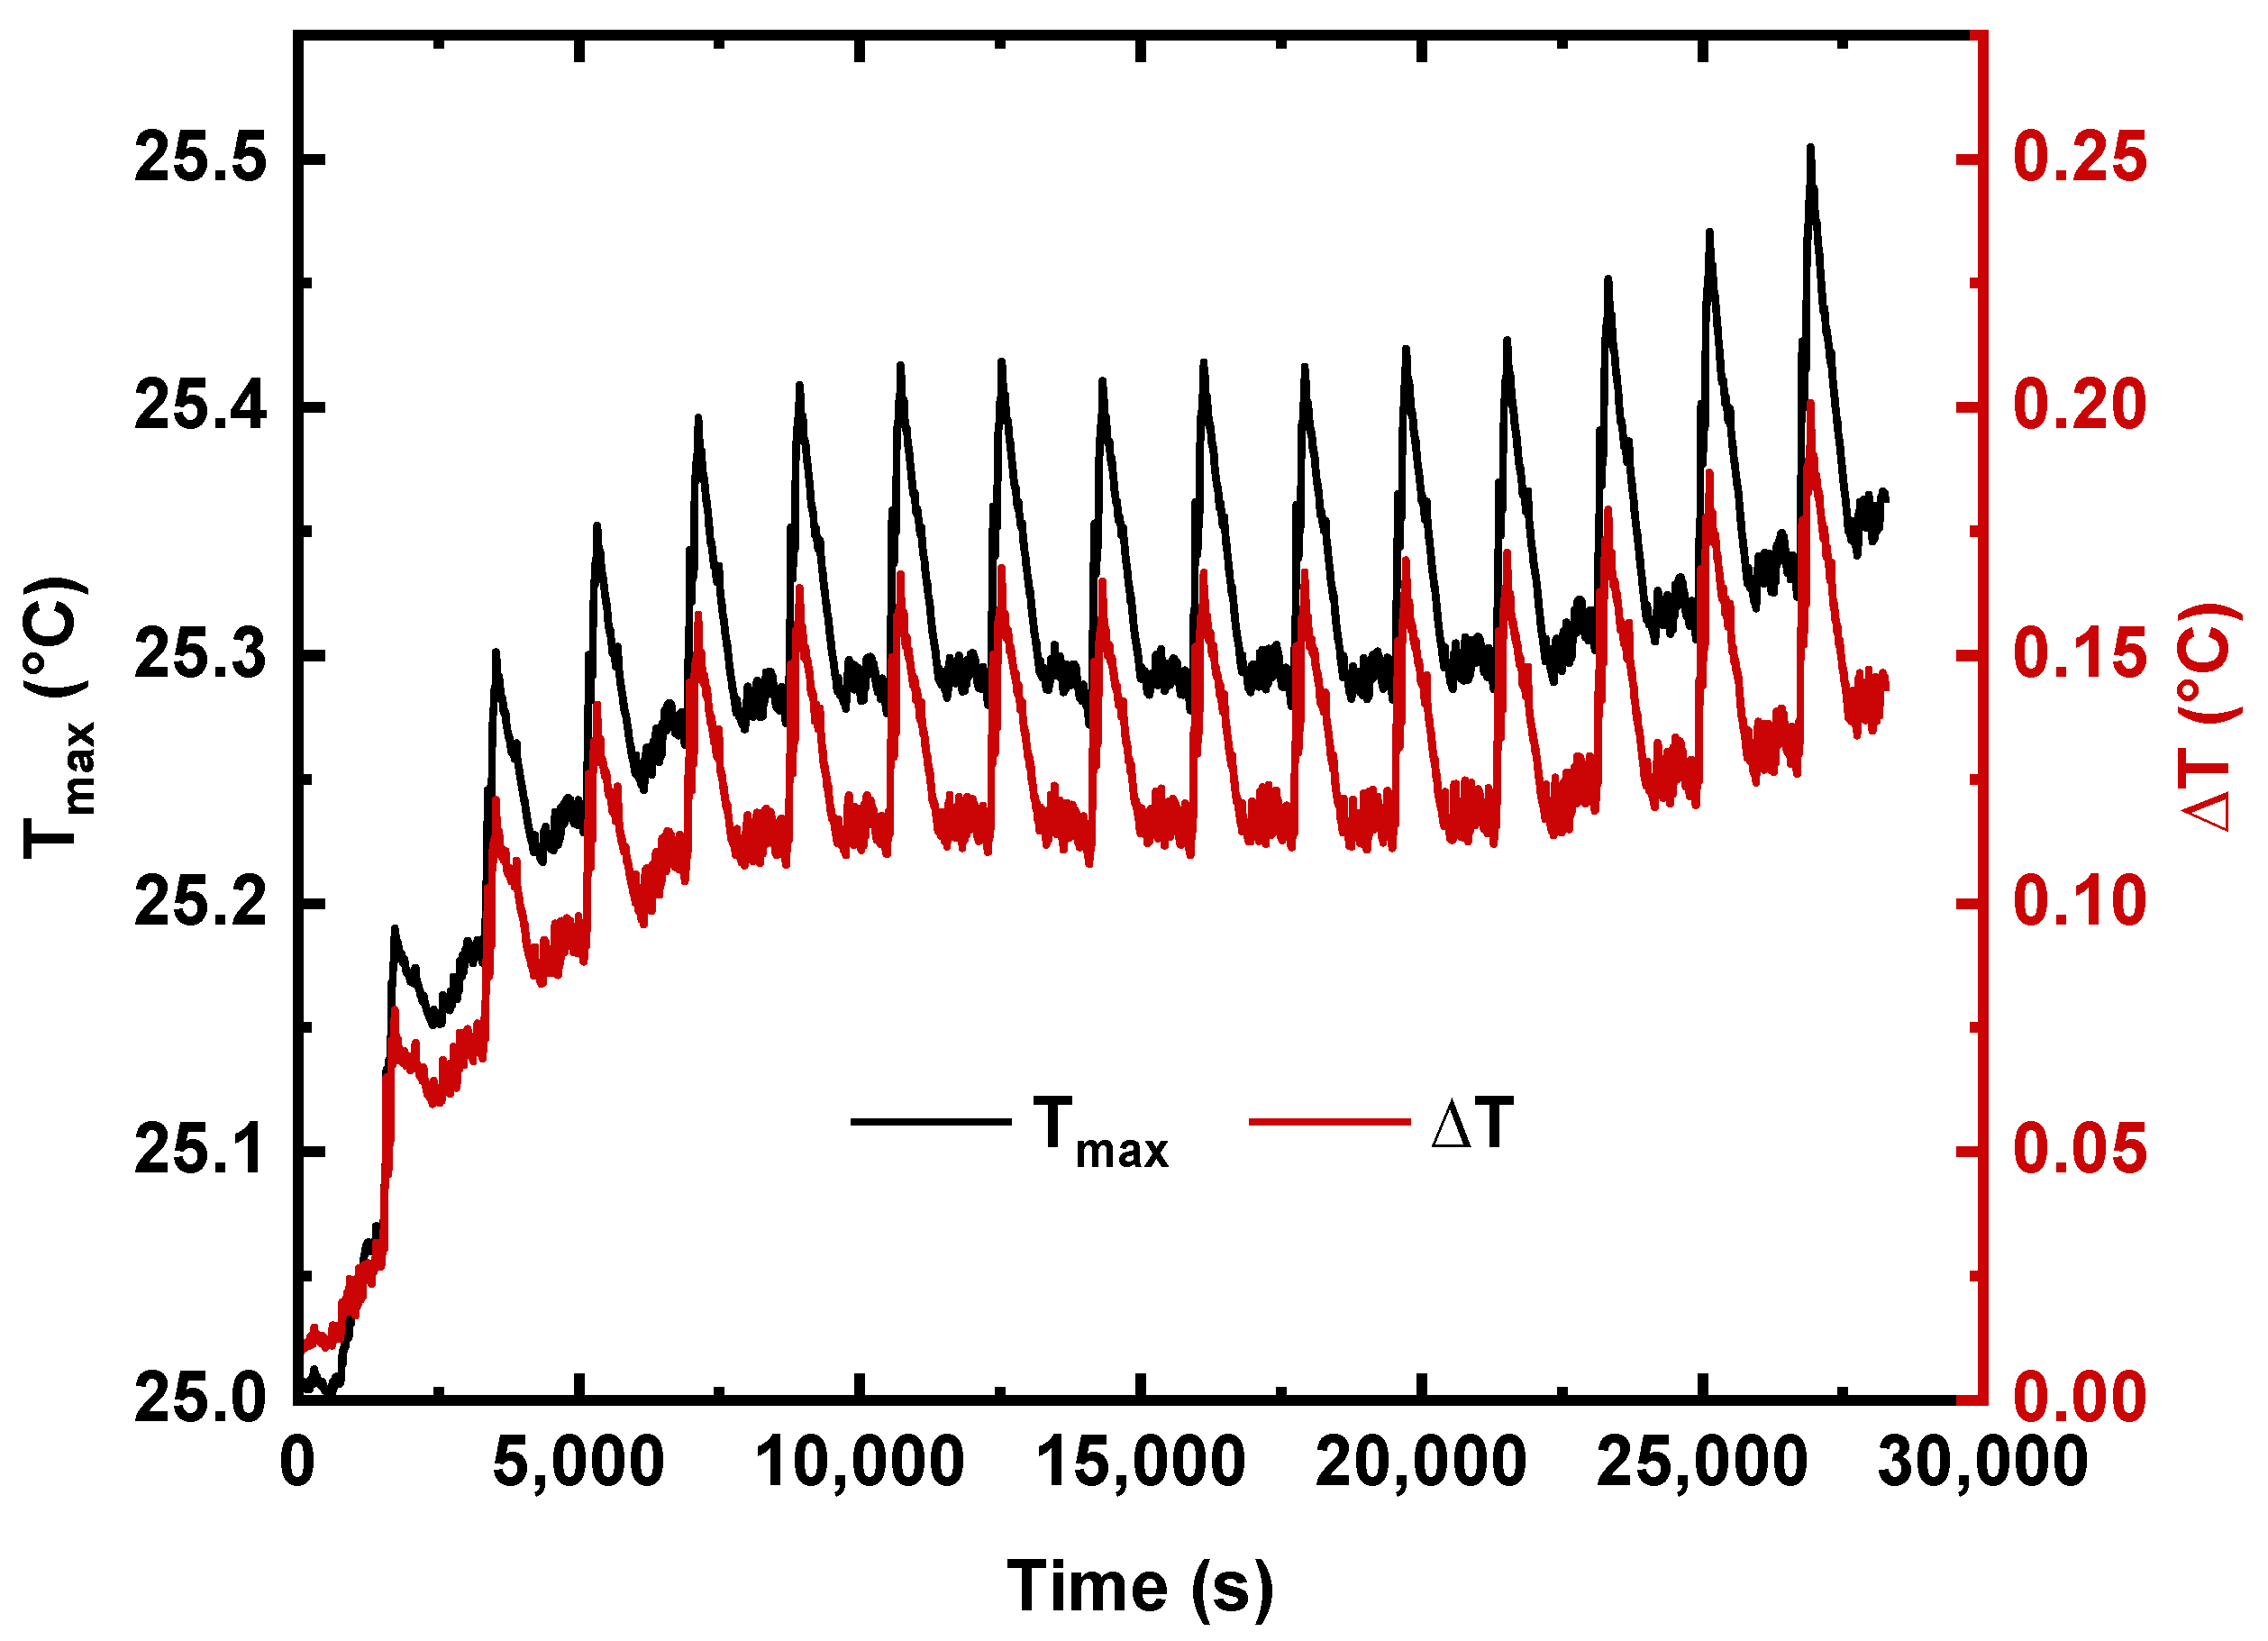
3.4.2. Temperature Analysis of the Battery under Multiple WLTCs

In order to compare the difference in battery temperature variation with and without thermal management, the results of the maximum battery temperature and maximum temperature difference are simulated for the battery in adiabatic condition and in the condition with BTMS in this work. Figure 14 shows the variation in the maximum temperature of a single battery after 15.7 WLTCs (completely discharged) under adiabatic conditions. It can be seen that the maximum temperature of the battery can reach 41.71 °C without BTMS.
Figure 15 shows the variation in the maximum temperature and maximum temperature difference of the battery module during 15.7 WLTCs with the optimal LCP. The mass flow rate is 1.2 g·s−1 and the CST is 25 °C. The reason for choosing a CST of 25 °C instead of 31 °C is that the average discharge multiplier of the battery under WLTC conditions is only about 0.13 C. Choosing a CST of 25 °C can greatly reduce the battery temperature rise (within 0.51 °C), which shows a better cooling performance of the thermal management system. It can be seen that the maximum temperature and maximum temperature difference of the battery module with thermal management have similar trends under WLTC conditions. They increase faster in the initial stage of discharge and reach their maximum values at the end of the 15th complete cycle, when the maximum temperature is only 25.51 °C and the maximum temperature difference is 0.21 °C. The temperature results show that the BTMS system and cooling strategy can meet the thermal management requirements under WLTC conditions and provide excellent battery cooling performance.

4. Conclusions

This study on pouch lithium-ion batteries proposes the use of a liquid cooling thermal management system with a dichotomous flow distributor, and a liquid cooling plate with a spiral channel suitable for high-rate discharge conditions. The structure of the liquid cooling plate was optimized by orthogonal tests and matrix analysis methods. The influence of the coolant mass flow rate and cooling start temperature on the cooling performance of the battery module was investigated. Application of the thermal management system to WLTC conditions was also discussed. The specific conclusions are as follows:
(1) The dichotomous flow distributor has a better flow uniformity capability than the multiseriate flow distributor.
(2) Compared with the serpentine channel, the spiral channel liquid cooling plate can reduce the maximum temperature difference of the battery module by 15.61% under the conditions of the same coolant mass flow rate and channel length. For a spiral channel liquid cooling plate, arranging the channel inlet and outlet on different sides of the cooling plate rather than on the same side can effectively reduce the maximum temperature of the battery module. These results indicate that channel layout in the cooling plate is crucial to the cooling performance of the cooling plate.
(3) On optimizing the spiral channel size using orthogonal tests and the matrix analysis method, the maximum temperature, maximum temperature difference, and channel pressure drop of the battery module are reduced by 2.7%, 17.8% and 79.9%, respectively.
(4) Increasing the coolant mass flow rate can effectively reduce the maximum temperature of the battery module. However, the magnitude of the reduction decreases gradually with an increasing mass flow rate. Trends of diminishing change are also seen from the maximum temperature difference of the battery module, increasing at first with increasing mass flow rate, and then decreasing.
(5) A higher cooling start temperature leads to a higher maximum temperature of the battery module, but can result in reduced energy consumption of the cooling pump. The appropriate cooling start temperature adopted in this work was 31 °C.
(6) Under the multiple WLTCs, the liquid cooling BTMS proposed in this work can effectively control the maximum temperature and maximum temperature difference of the EV battery pack below 25.51 °C and 0.21 °C, respectively.

Author Contributions

Conceptualization, H.Z.; Investigation, S.Z.; Methodology, J.D.; Software, X.L.; Supervision, J.Y.; Validation, X.L.; Writing—original draft, P.L.; Writing—review & editing, J.Z. All authors have read and agreed to the published version of the manuscript.

Funding

This research was supported by the Zhejiang Provincial Natural Science Foundation of China (No. LGG19E060003), National Natural Science Foundation of China (NSFC, No. 51706113), the National Key Research and Development Project of China (2018YFB1502204) and the K. C. Wong Magna Fund in Ningbo University, China.

Data Availability Statement

Data is contained within the article.

Conflicts of Interest

The authors declare no conflict of interest.

Nomenclature

AbbreviationsLLength of channel (mm)
BTMS Battery thermal management systemmevMass of the EV (kg)
CCurrent ratenbNumber of batteries in the battery pack (-)
CSTCooling start temperaturePt,1Traction power in one WLTC (W)
DOD Depth of dischargePt,cTraction power under multiple WLTCs (W)
EVElectric vehiclepChannel pressure drop (Pa)
FDFlow distributorqHeat generation rate (kW·m−3)
HEVHybrid electric vehicleRInternal electric resistance (Ω)
HPPCHybrid pulse power characteristict0End time when measuring working voltage (s)
ICEVInternal combustion engine vehiclet1Time required for a battery to be fully discharged under WLTC conditions (s)
LCP Liquid cooling plateTmaxMaximum temperature (°C)
LIBLithium-ion batteryTMaximum temperature difference (°C)
PCMPhase change materialUWorking voltage (V)
SOCState of chargevVelocity (m·s−1)
WLTCThe world-harmonized light-duty vehicles test cycle VbBattery volume (m3)
Variable or parameterWWidth of channel (mm)
AfWindward area of car (m2)Greek letters
CdAir friction coefficient (-)αRoad gradient (-)
EbpTotal energy of battery pack (kwh)μrRolling resistance (-)
gStandard gravity (m·s−2)ρAir density (kg·m−3)
HHeight of channel (mm)ηMotion efficiency (-)
ICurrent (A)ηrRegenerative coefficient (-)
IuDischarge current for the measurement of working voltage (A)

References

  1. Yuan, C.; Wang, Q.; Wang, Y.; Zhao, Y. Inhibition effect of different interstitial materials on thermal runaway propagation in the cylindrical lithium-ion battery module. Appl. Therm. Eng. 2019, 153, 39–50. [Google Scholar] [CrossRef] [Green Version]
  2. Zhao, J.; Rao, Z.; Huo, Y.; Liu, X.; Li, Y. Thermal management of cylindrical power battery module for extending the life of new energy electric vehicles. Appl. Therm. Eng. 2015, 85, 33–43. [Google Scholar] [CrossRef]
  3. Jouhara, H.; Khordehgah, N.; Serey, N.; Almahmoud, S.; Lester, S.P.; Machen, D.; Wrobel, L. Applications and thermal management of rechargeable batteries for industrial applications. Energy 2019, 170, 849–861. [Google Scholar] [CrossRef]
  4. Hu, Y.; Choe, S.-Y.; Garrick, T.R. Measurement of heat generation rate and heat sources of pouch type Li-ion cells. Appl. Therm. Eng. 2021, 189, 116709. [Google Scholar] [CrossRef]
  5. Hu, Y.; Choe, S.-Y.; Garrick, T.R. Measurement of two-dimensional heat generation rate of pouch type lithium-ion battery using a multifunctional calorimeter. J. Power Sources 2022, 532, 231350. [Google Scholar] [CrossRef]
  6. Klein, M.; Tong, S.; Park, J. In-plane nonuniform temperature effects on the performance of a large-format lithium-ion pouch cell. Appl. Energy 2016, 165, 639–647. [Google Scholar] [CrossRef]
  7. Qian, Z.; Li, Y.; Rao, Z. Thermal performance of lithium-ion battery thermal management system by using mini-channel cooling. Energy Convers. Manag. 2016, 126, 622–631. [Google Scholar] [CrossRef]
  8. Li, X.; Zhao, J.; Yuan, J.; Duan, J.; Liang, C. Simulation and analysis of air cooling configurations for a lithium-ion battery pack. J. Energy Storage 2021, 35, 102270. [Google Scholar] [CrossRef]
  9. Monika, K.; Datta, S.P. Comparative assessment among several channel designs with constant volume for cooling of pouch-type battery module. Energy Convers. Manag. 2022, 251, 114936. [Google Scholar] [CrossRef]
  10. Chen, X.; Zhou, F.; Yang, W.; Gui, Y.; Zhang, Y. A hybrid thermal management system with liquid cooling and composite phase change materials containing various expanded graphite contents for cylindrical lithium-ion batteries. Appl. Therm. Eng. 2022, 200, 117702. [Google Scholar] [CrossRef]
  11. Shang, Z.; Qi, H.; Liu, X.; Ouyang, C.; Wang, Y. Structural optimization of lithium-ion battery for improving thermal performance based on a liquid cooling system. Int. J. Heat Mass Transf. 2018, 130, 33–41. [Google Scholar] [CrossRef]
  12. Akbarzadeh, M.; Kalogiannis, T.; Jaguemont, J.; Jin, L.; Behi, H.; Karimi, D.; Beheshti, H.; Van Mierlo, J.; Berecibar, M. A comparative study between air cooling and liquid cooling thermal management systems for a high-energy lithium-ion battery module. Appl. Therm. Eng. 2021, 198, 117503. [Google Scholar] [CrossRef]
  13. Zhao, C.; Cao, W.; Dong, T.; Jiang, F. Thermal behavior study of discharging/charging cylindrical lithium-ion battery module cooled by channeled liquid flow. Int. J. Heat Mass Transf. 2018, 120, 751–762. [Google Scholar] [CrossRef]
  14. Cao, W.; Zhao, C.; Wang, Y.; Dong, T.; Jiang, F. Thermal modeling of full-size-scale cylindrical battery pack cooled by channeled liquid flow. Int. J. Heat Mass Transf. 2019, 138, 1178–1187. [Google Scholar] [CrossRef]
  15. Rao, Z.; Qian, Z.; Kuang, Y.; Li, Y. Thermal performance of liquid cooling based thermal management system for cylindrical lithium-ion battery module with variable contact surface. Appl. Therm. Eng. 2017, 123, 1514–1522. [Google Scholar] [CrossRef]
  16. Lai, Y.; Wu, W.; Chen, K.; Wang, S.; Xin, C. A compact and lightweight liquid-cooled thermal management solution for cylindrical lithium-ion power battery pack. Int. J. Heat Mass Transf. 2019, 144, 118581. [Google Scholar] [CrossRef]
  17. Dong, F.; Cheng, Z.; Zhu, J.; Song, D.; Ni, J. Investigation and optimization on cooling performance of a novel double helix structure for cylindrical lithium-ion batteries. Appl. Therm. Eng. 2021, 189, 116758. [Google Scholar] [CrossRef]
  18. Zhou, H.; Zhou, F.; Zhang, Q.; Wang, Q.; Song, Z. Thermal management of cylindrical lithium-ion battery based on a liquid cooling method with half-helical duct. Appl. Therm. Eng. 2019, 162, 114257. [Google Scholar] [CrossRef]
  19. Sheng, L.; Zhang, H.; Su, L.; Zhang, Z.; Zhang, H.; Li, K.; Fang, Y.; Ye, W. Effect analysis on thermal profile management of a cylindrical lithium-ion battery utilizing a cellular liquid cooling jacket. Energy 2021, 220, 119725. [Google Scholar] [CrossRef]
  20. Liu, Z.; Liu, X.; Meng, H.; Guo, L.; Zhang, Z. Numerical analysis of the thermal performance of a liquid cooling battery module based on the gradient ratio flow velocity and gradient increment tube diameter. Int. J. Heat Mass Transf. 2021, 175, 121338. [Google Scholar] [CrossRef]
  21. Zhu, Z.; Wu, X.; Zhang, H.; Guo, Y.; Wu, G. Multi-objective optimization of a liquid cooled battery module with collaborative heat dissipation in both axial and radial directions. Int. J. Heat Mass Transf. 2020, 155, 119701. [Google Scholar] [CrossRef]
  22. Rao, Z.; Zhang, X. Investigation on thermal management performance of wedge-shaped microchannels for rectangular Li-ion batteries. Int. J. Energy Res. 2019, 43, 3876–3890. [Google Scholar] [CrossRef]
  23. Sheng, L.; Su, L.; Zhang, H.; Li, K.; Fang, Y.; Ye, W.; Fang, Y. Numerical investigation on a lithium ion battery thermal management utilizing a serpentine-channel liquid cooling plate exchanger. Int. J. Heat Mass Transf. 2019, 141, 658–668. [Google Scholar] [CrossRef]
  24. Mohammed, A.H.; Esmaeeli, R.; Aliniagerdroudbari, H.; Alhadri, M.; Hashemi, S.R.; Nadkarni, G.; Farhad, S. Dual-purpose cooling plate for thermal management of prismatic lithium-ion batteries during normal operation and thermal runaway. Appl. Therm. Eng. 2019, 160, 114106. [Google Scholar] [CrossRef]
  25. Liu, H.-L.; Shi, H.-B.; Shen, H.; Xie, G. The performance management of a Li-ion battery by using tree-like mini-channel heat sinks: Experimental and numerical optimization. Energy 2019, 189, 116150. [Google Scholar] [CrossRef]
  26. Zhang, H.; Li, C.; Zhang, R.; Lin, Y.; Fang, H. Thermal analysis of a 6s4p Lithium-ion battery pack cooled by cold plates based on a multi-domain modeling framework. Appl. Therm. Eng. 2020, 173, 115216. [Google Scholar] [CrossRef]
  27. Chen, K.; Chen, Y.; Song, M.; Wang, S. Multi-parameter structure design of parallel mini-channel cold plate for battery thermal management. Int. J. Energy Res. 2020, 44, 4321–4334. [Google Scholar] [CrossRef]
  28. Deng, T.; Ran, Y.; Yin, Y.; Chen, X.; Liu, P. Multi-objective optimization design of double-layered reverting cooling plate for lithium-ion batteries. Int. J. Heat Mass Transf. 2019, 143, 118580. [Google Scholar] [CrossRef]
  29. Patil, M.S.; Seo, J.-H.; Panchal, S.; Jee, S.-W.; Lee, M.-Y. Investigation on thermal performance of water-cooled Li-ion pouch cell and pack at high discharge rate with U-turn type microchannel cold plate. Int. J. Heat Mass Transf. 2020, 155, 119728. [Google Scholar] [CrossRef]
  30. Amalesh, T.; Narasimhan, N.L. Introducing new designs of minichannel cold plates for the cooling of Lithium-ion batteries. J. Power Sources 2020, 479, 228775. [Google Scholar] [CrossRef]
  31. Mohammadian, S.K.; He, Y.-L.; Zhang, Y. Internal cooling of a lithium-ion battery using electrolyte as coolant through microchannels embedded inside the electrodes. J. Power Sources 2015, 293, 458–466. [Google Scholar] [CrossRef]
  32. Ximing, C.; Yu, T.; Shouqun, W. Thermophysical Parameter Measurements for Lithium-Ion Batteries: A Review. J. Mech. Eng. 2019, 55, 140–150. [Google Scholar] [CrossRef]
  33. Belt, J.R. Battery Test Manual for Plug-In Hybrid Electric Vehicles; Idaho National Lab. (INL): Idaho Falls, ID, USA, 2010.
  34. Hu, Y.; Choe, S.Y. Simultaneous and continuous characterization of reversible and irreversible heat of lithium-ion battery using wavelet transform technique. Electrochim. Acta 2021, 375, 137973. [Google Scholar] [CrossRef]
  35. Wang, F.; Cao, J.; Ling, Z.; Zhang, Z.; Fang, X. Experimental and simulative investigations on a phase change material nano-emulsion-based liquid cooling thermal management system for a lithium-ion battery pack. Energy 2020, 207, 118215. [Google Scholar] [CrossRef]
  36. Sheng, L.; Zhang, Z.; Su, L.; Zhang, H.; Zhang, H.; Li, K.; Fang, Y.; Ye, W. Experimental and numerical approach for analyzing thermal behaviors of a prismatic hard-cased lithium-ion battery. J. Energy Storage 2021, 35, 102313. [Google Scholar] [CrossRef]
  37. Duan, J.; Zhao, J.; Li, X.; Panchal, S.; Yuan, J.; Fraser, R.; Fowler, M. Modeling and Analysis of Heat Dissipation for Liquid Cooling Lithium-Ion Batteries. Energies 2021, 14, 4187. [Google Scholar] [CrossRef]
  38. Zhang, Z.; Fu, L.; Sheng, L.; Ye, W.; Sun, Y. Method of liquid-cooled thermal control for a large-scale pouch lithium-ion battery. Appl. Therm. Eng. 2022, 211, 118417. [Google Scholar] [CrossRef]
  39. Liu, Y.; Zhang, J. Self-adapting J-type air-based battery thermal management system via model predictive control. Appl. Energy 2020, 263, 114640. [Google Scholar] [CrossRef]
Figure 1. Design of liquid cooling BTMS. (a) Battery module liquid cooling system structure; (b) the flow path of coolant; (c) structure of the flow distributor; (d) structure of the LCP.
Energies 16 02196 g001
Figure 2. Results of grid independence verification for the BTMS simulation model. (a) The variation of center point temperature of battery 1 and pressure drop through the channel with the number of grids; (b) the variation of computation time with the number of grids.
Energies 16 02196 g002
Figure 3. Experimental validation of the model. (a) Temperature monitoring points of the lithium-ion battery in the experiment; (b) comparison of experimental data with model data.
Energies 16 02196 g003
Figure 4. Comparison of flow uniformity capacity of the dichotomous and multiseriate flow distributors. (a) The channel structure of the dichotomous and the multiseriate flow distributors; (b) the mass flow rate of each outlet face of these two flow distributors.
Energies 16 02196 g004
Figure 5. The four layouts of the channels named Case 1 to Case 4.
Energies 16 02196 g005
Figure 6. Effect of channel layout on: (a) maximum temperature Tmax of battery module; (b) maximum temperature difference ∆T of battery module; (c) channel pressure drop ∆p.
Energies 16 02196 g006aEnergies 16 02196 g006b
Figure 7. Temperature distribution in the four LCPs: Case 1 to Case 4.
Energies 16 02196 g007
Figure 8. Effect of fluid flow rates on: (a) maximum temperature Tmax; (b) maximum temperature difference DT of battery module.
Energies 16 02196 g008
Figure 9. Effect of cooling start temperature CST on: (a) maximum temperature Tmax; (b) maximum temperature difference DT of battery module.
Energies 16 02196 g009aEnergies 16 02196 g009b
Figure 10. Velocity and traction power profiles of WLTC.
Energies 16 02196 g010
Figure 11. The working voltage and internal resistance curve (Temperature: 25 °C, C-Rate: 0.5C).
Energies 16 02196 g011
Figure 12. The profile of current in the entire discharge process of a single battery under 15.7 WLTCs.
Energies 16 02196 g012
Figure 13. Heat generation rate of a single battery under 15.7 WLTCs.
Energies 16 02196 g013
Figure 14. The temperature rise of battery under adiabatic condition.
Energies 16 02196 g014
Figure 15. Variation in maximum temperature and maximum temperature difference of the battery module with BTMS during 15.7 WLTCs.
Energies 16 02196 g015
Table 1. Specifications of the LIB used in this study.
ItemValue
Active area dimensions (mm) 200 × 105 × 7
Mass (g)352.6
Nominal voltage (V) 3.7
Rated capacity (Ah)21
Density (kg·m−3)2398.7
Specific heat (J·kg−1·K−1)1238
Thermal conductivity (W·m−1·K−1)⊥ battery main surface: 1.1
∥ battery main surface: 18.1
Note: ⊥ battery main surface means the direction perpendicular to battery main surface. ∥ battery main surface means the direction parallel to battery main surface.
Table 2. Six-order polynomial fitting coefficients in Equation (1) for the calculation of internal resistance R T i (Ω) at different battery temperatures Ti.
Ti (°C)Fitting Coefficients for Equation (1)
k6,Tik5,Tik4,Tik3,Tik2,Tik1,Tik0,Ti
500.0039 −0.0049 0.0054 −0.0039 0.0008 0.0023
1500 −0.0034 0.0099 −0.0077 0.0017 0.0016
250.0600 −0.1751 0.1880 −0.0828 0.0097 0.0011 0.0032
350.4679 −1.2613 1.2574 −0.5506 0.0923 −0.0019 0.0043
450 0−0.0054 0.0178 −0.0170 0.0047 0.0039
Table 3. Physical properties of LCP, flow distributor (FD) and coolant.
PropertyLCP and FD (Aluminium)Coolant (Water)
Density (kg·m−3)2719997.56
Specific heat (J·kg−1·K−1)8714181.72
Thermal conductivity (W·m−1·K−1)202.40.62
Viscosity (kg·m−1·s −1)-0.000889
Table 4. Factors and levels of the orthogonal test.
LevelsFactors
L (mm)W (mm)H (mm)
188522
2111744
3135766
Table 5. Arithmetic means of the indexes and their range value analysis results in the orthogonal tests.
Test NumberFactorsIndexes
L
(Factor 1)
W
(Factor 2)
H
(Factor 3)
Tmax (°C)T (°C)p (Pa)
111135.30 5.30 619.65
212333.50 3.47 19.25
313234.27 4.10 18.56
421333.54 3.78 112.66
522234.21 4.06 44.09
623135.22 5.30 100.98
731234.31 4.30 220.16
832135.21 5.17 204.71
933333.24 3.35 9.69
ki134.35 34.38 35.24 Tmax
ki234.32 34.31 34.26
ki334.25 34.24 33.42
si0.1 0.14 1.82
ki14.29 4.46 5.26 T
ki24.38 4.23 4.15
ki34.27 4.25 3.53
si0.11 0.23 1.73
ki1219.15 317.49 308.45 p
ki285.91 89.35 94.27
ki334.25 43.08 47.20
si184.9 274.41 261.24
Table 6. Parameters of vehicle specification and driving conditions.
ParametersSymbolValue
Mass of the EV (kg)mev2000
Windward area (m2)Af2.05
Standard gravity (m·s−2)g9.8
Air density (kg·m−3)ρ1.169
Velocity (m·s−1)v-
Air friction coefficient (-)Cd0.3
Motion efficiency (-)η0.98
Rolling resistance (-)μr0.01
Regenerative coefficient (-)ηr0.8
Road gradient (-)α0
Disclaimer/Publisher’s Note: The statements, opinions and data contained in all publications are solely those of the individual author(s) and contributor(s) and not of MDPI and/or the editor(s). MDPI and/or the editor(s) disclaim responsibility for any injury to people or property resulting from any ideas, methods, instructions or products referred to in the content.

