
Vehicle Market Analysis of Drivers’ Preferences in Terms of the Propulsion Systems: The Czech Case Study
 , , , , and
Abstract
:1. Introduction
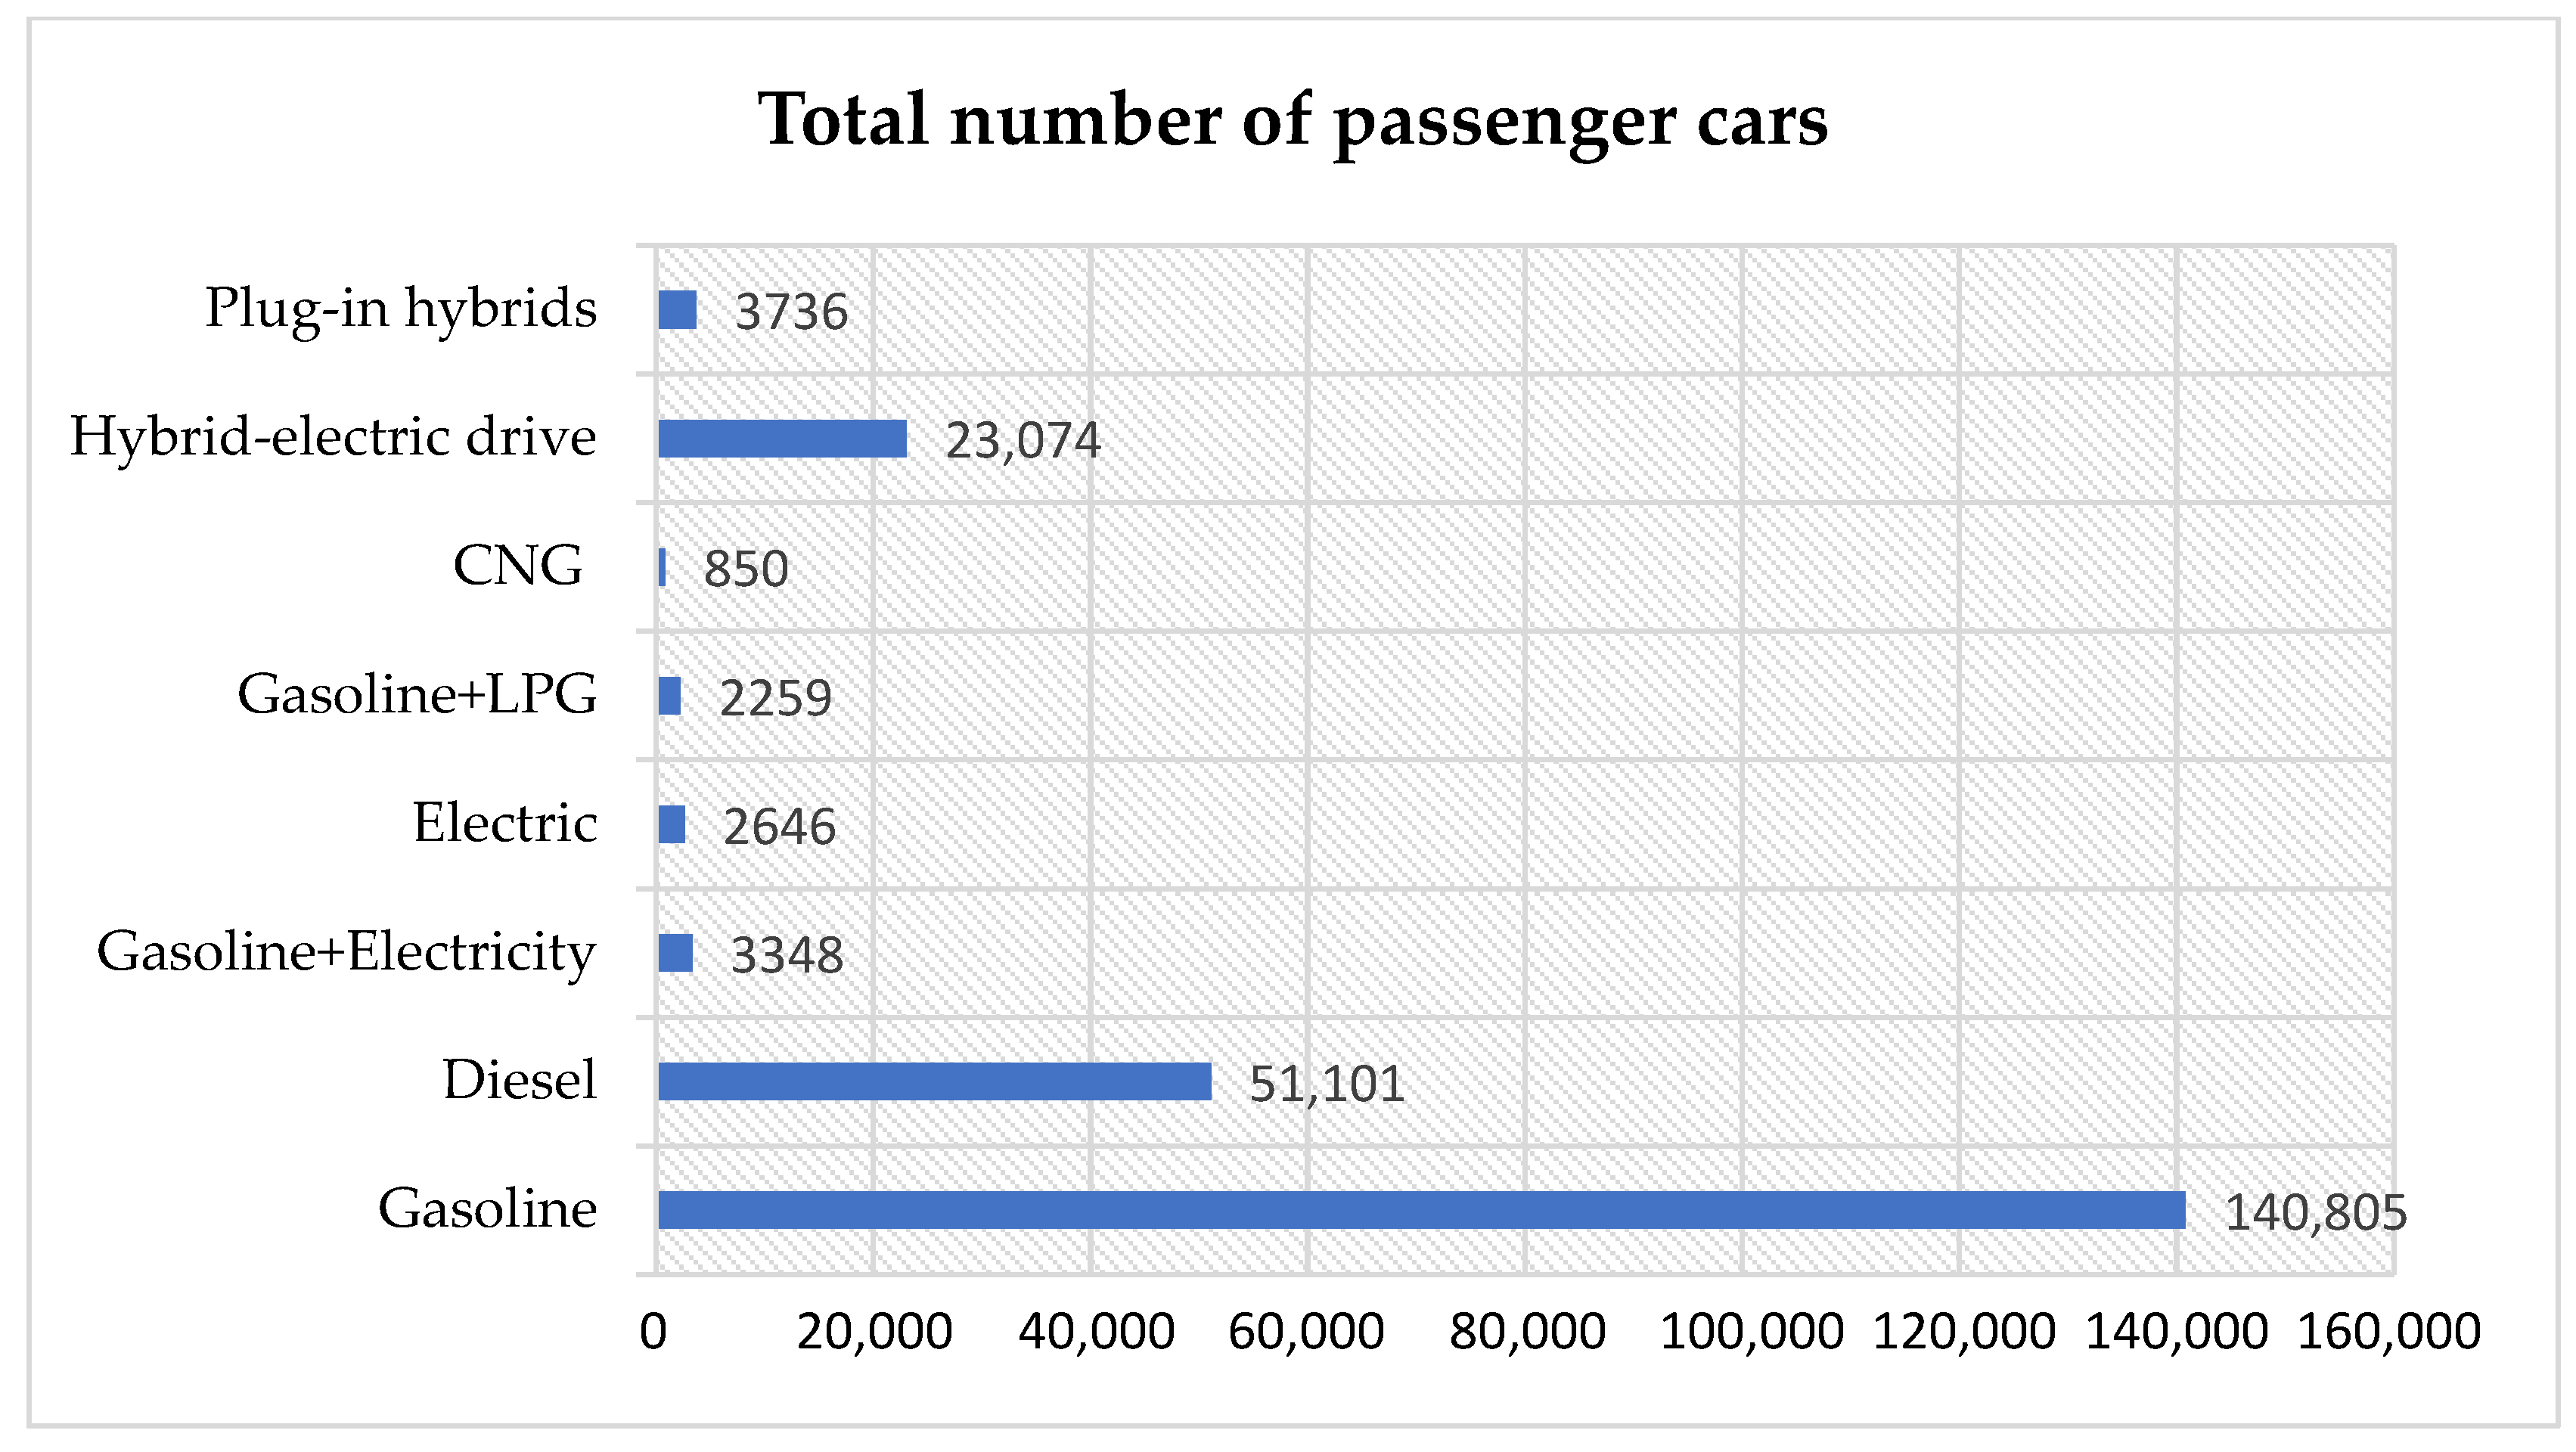
2. A Brief Description of the Automotive Market in the Czech Republic
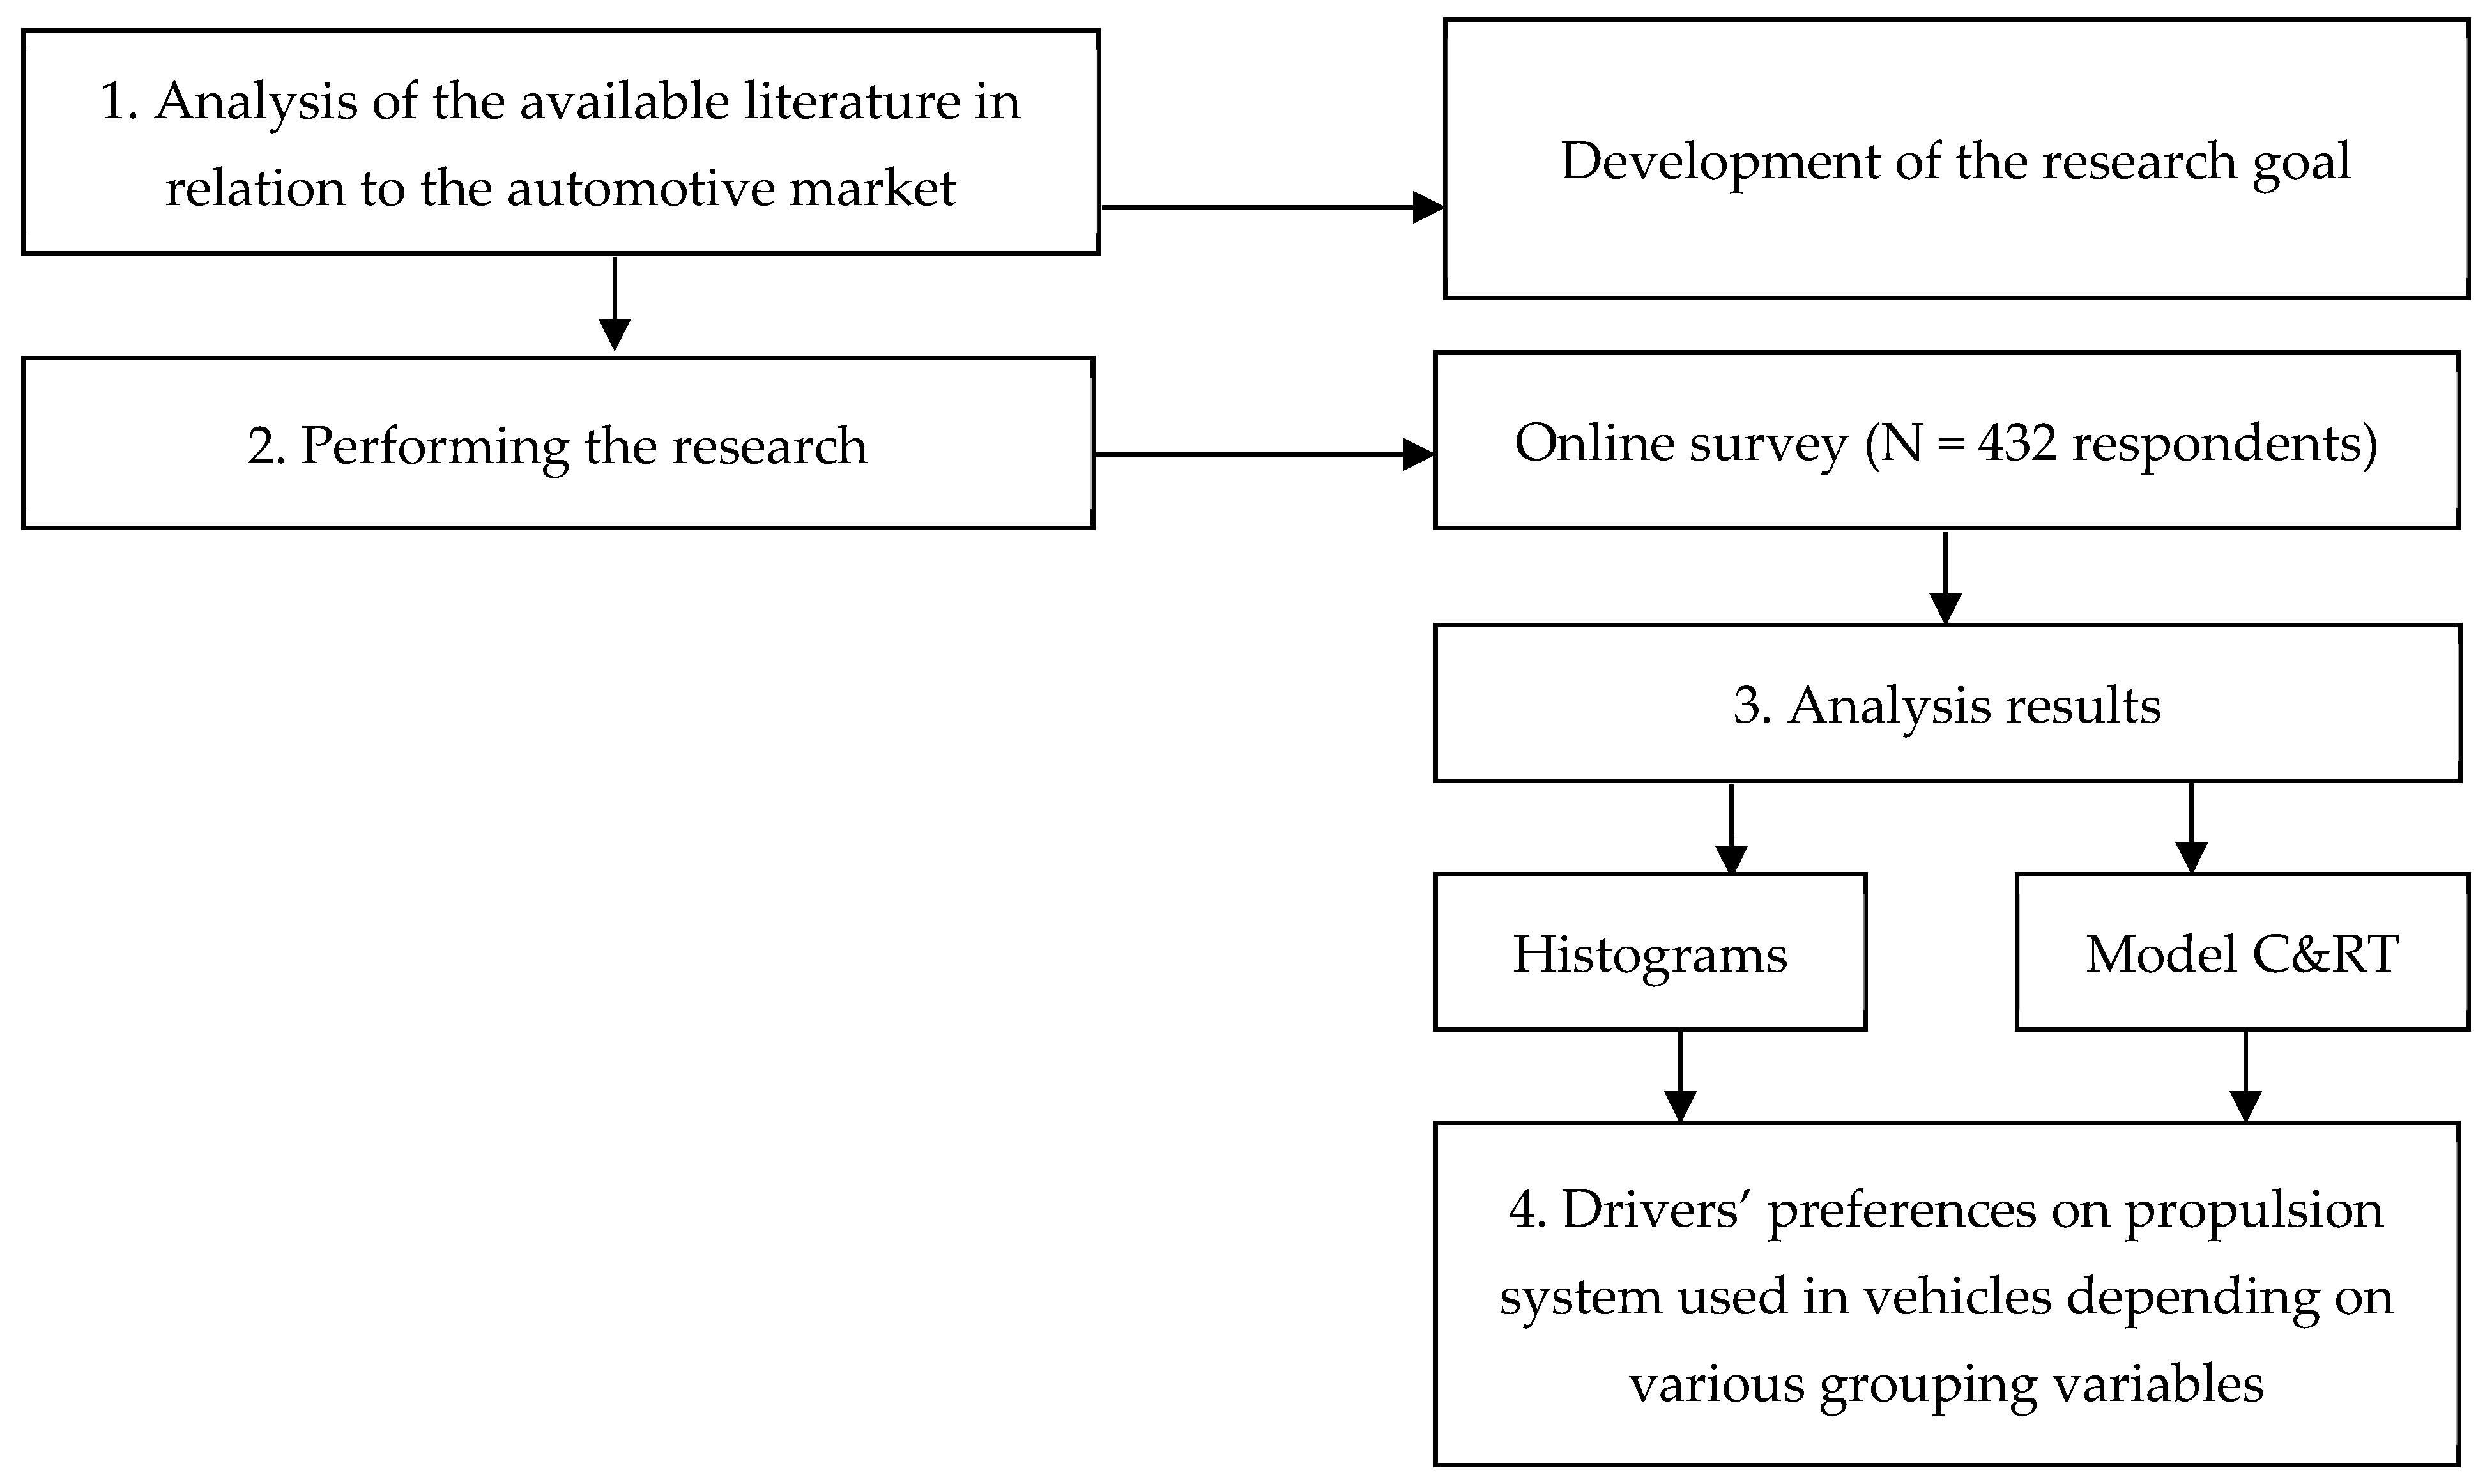
3. Materials and Methods
3.1. Study Design—The Choice of the Research Method and Study Area
3.2. Survey Questionnaire as a Research Tool
3.3. Research Sample
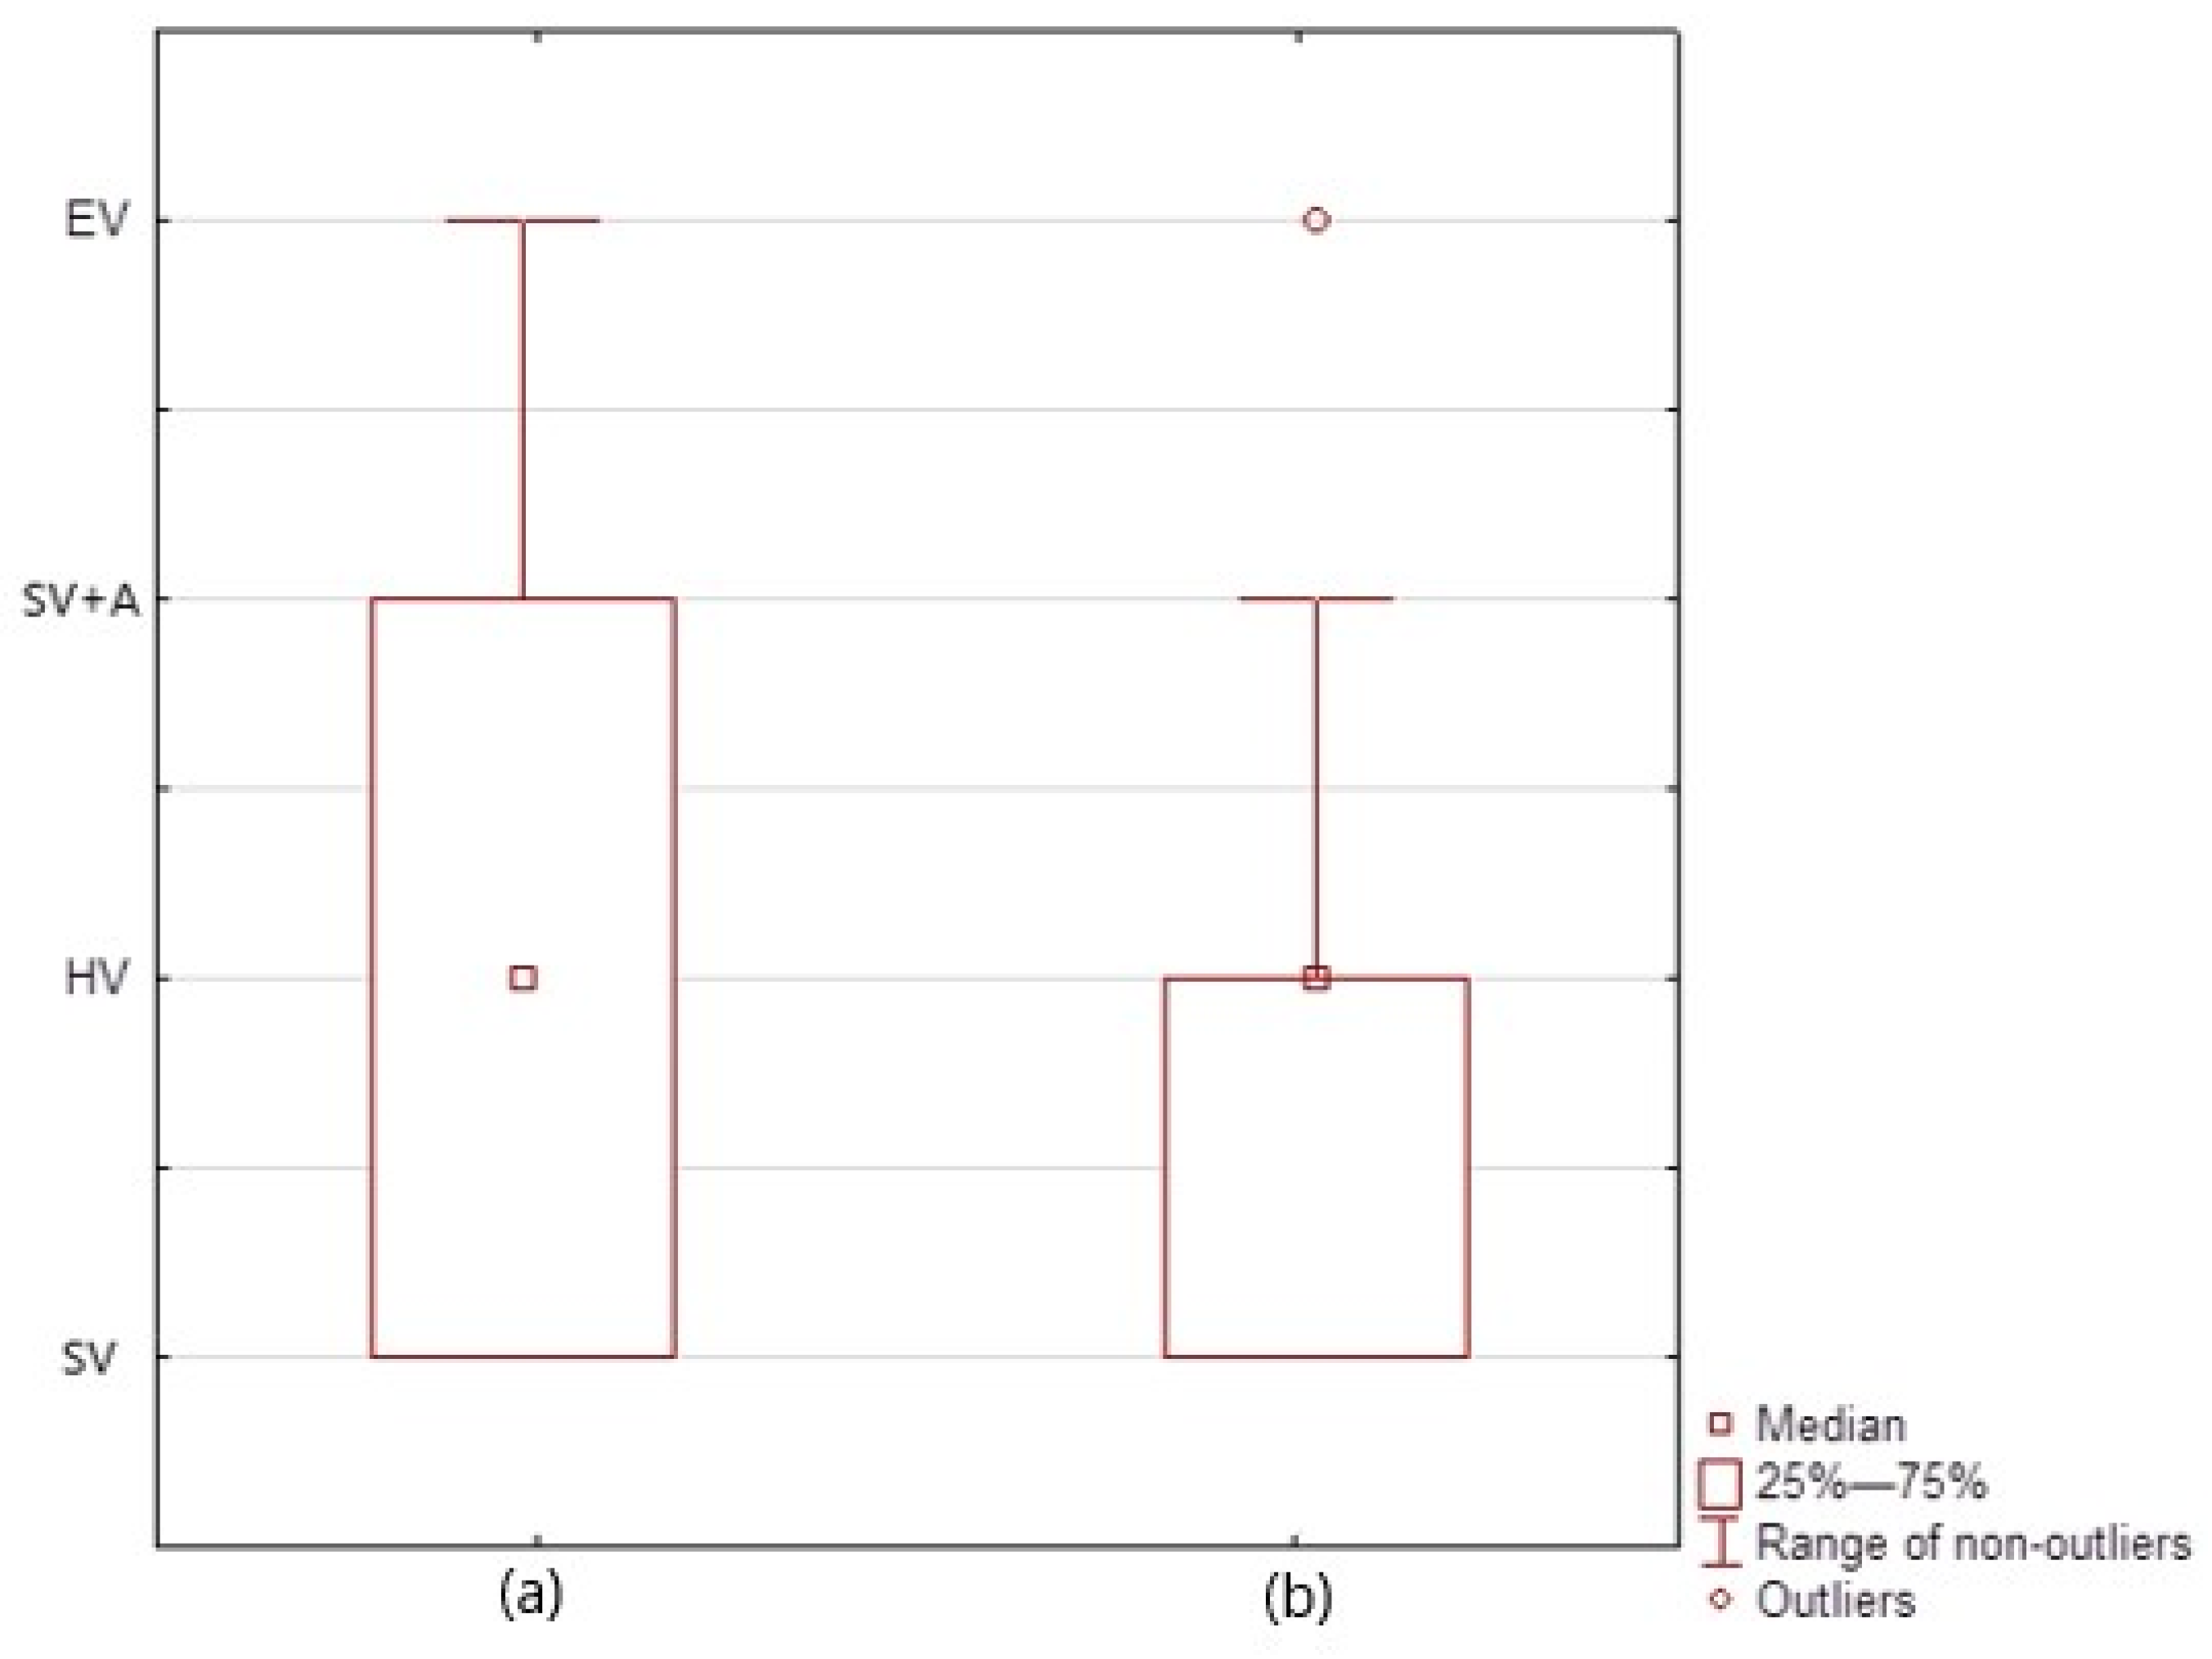
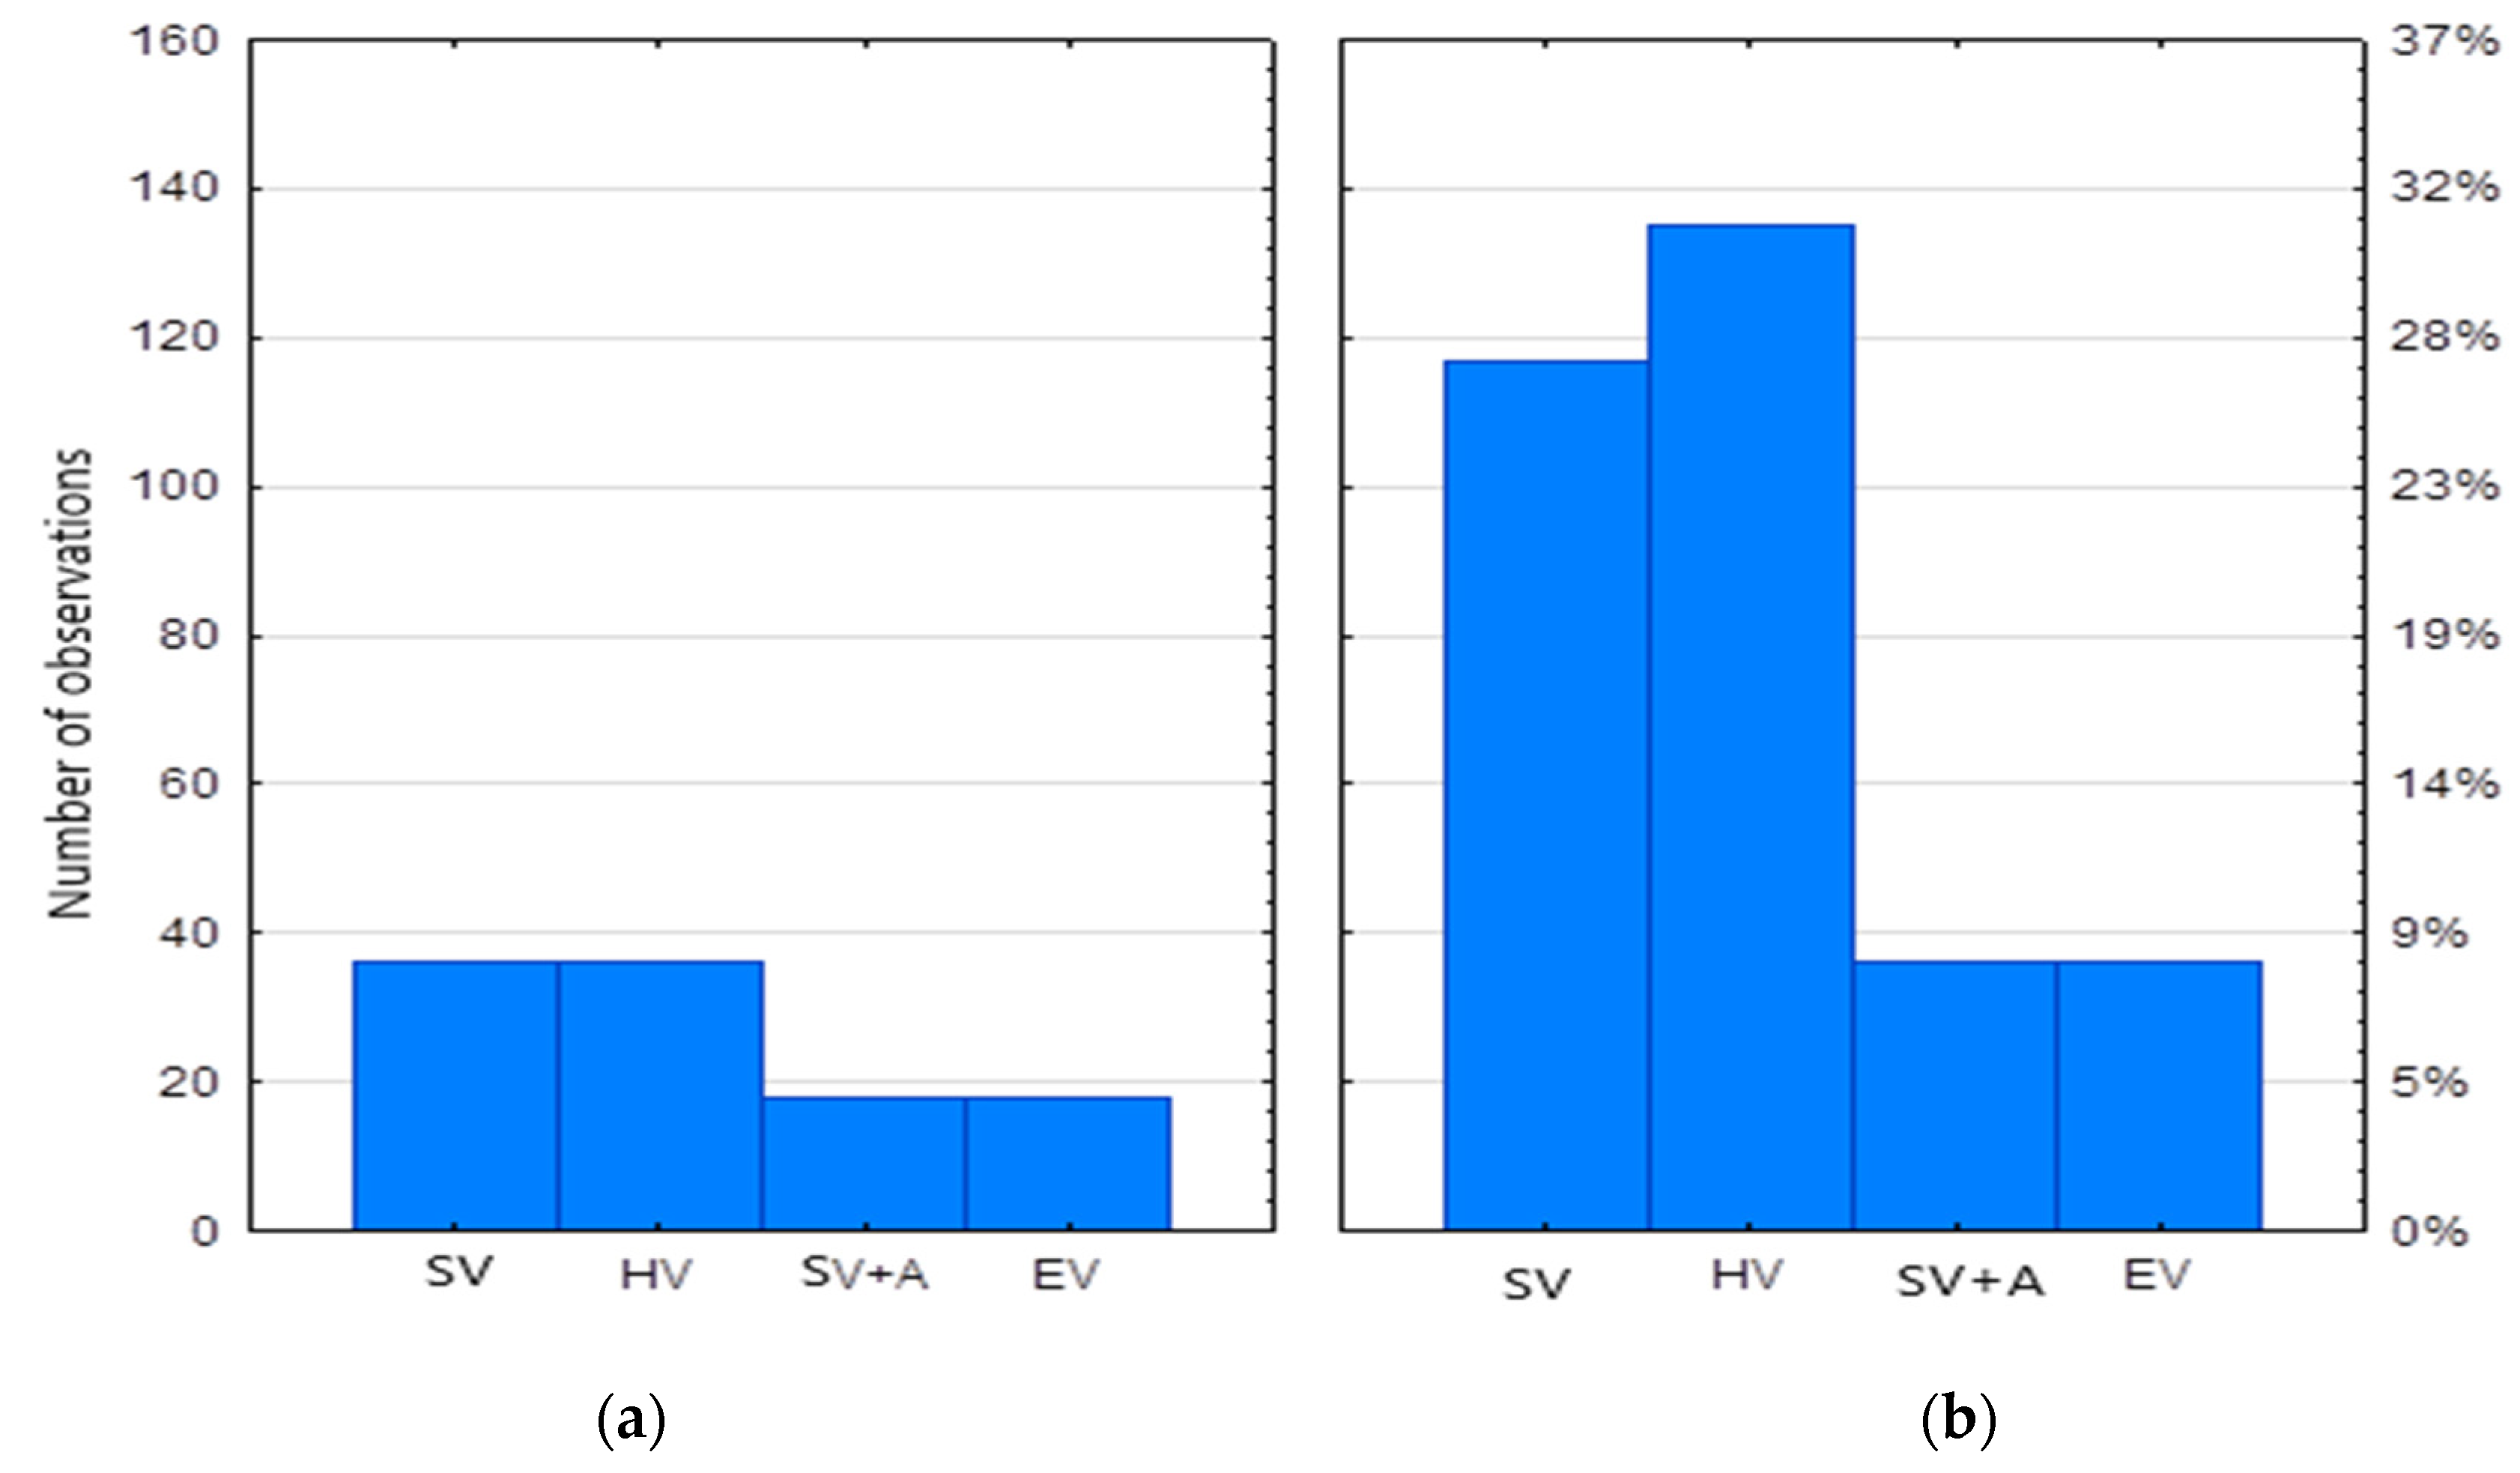
3.4. Data Analysis
4. Results and Discussion
5. Conclusions
Author Contributions
Funding
Data Availability Statement
Acknowledgments
Conflicts of Interest
References
- Dube, K.; Nhamo, G.; Chikodzi, D. COVID-19 pandemic and prospects for recovery of the global aviation industry. J. Air Transp. Manag. 2021, 92, 102022. [Google Scholar] [CrossRef] [PubMed]
- Guan, D.; Wang, D.; Hallegatte, S.; Davis, S.J.; Huo, J.; Li, S.; Gong, P. Global supply-chain effects of COVID-19 control measures. Nat. Hum. Behav. 2020, 4, 577–587. [Google Scholar] [CrossRef] [PubMed]
- Xu, L.; Shi, J.; Chen, J.; Li, L. Estimating the effect of COVID-19 epidemic on shipping trade: An empirical analysis using panel data. Mar. Policy 2021, 133, 104768. [Google Scholar] [CrossRef] [PubMed]
- Yang, Y.; Liu, Q.; Hang, C.H. China-Europe freight transportation under the first wave of COVID-19 pandemic and government restriction measures. Res. Transp. Econ. 2022, 97, 101251. [Google Scholar] [CrossRef]
- EIA. U.S. Sales to End Users, Total Refiner Motor Gasoline Sales Volumes. 2020. Available online: https://www.eia.gov/dnav/pet/pet_cons_refmg_d_nus_VTR_mgalpd_m.htm. (accessed on 5 November 2022).
- Harantova, V.; Hajnik, A.; Kalasova, A.; Figlus, T. The effect of the COVID-19 pandemic on traffic flow characteristics, emissions production and fuel consumption at a selected intersection in Slovakia. Energies 2022, 15, 2020. [Google Scholar] [CrossRef]
- Hasnat, M.M.; Bardaka, E. Exploring the efficacy of traditional and alternative funding mechanisms to provide transportation revenue during the COVID-19 pandemic. Case Stud. Transp. Policy 2022, 10, 1249–1261. [Google Scholar]
- Dižo, J.; Blatnický, M.; Semenov, S.; Mikhailov, E.; Kostrzewski, M.; Drozdziel, P.; Štastniak, P. Electric and plug-in hybrid vehicles and their infrastructure in a particular European region. Transp. Res. Procedia 2021, 55, 629–636. [Google Scholar] [CrossRef]
- Dumortier, J.; Zhang, F.; Marron, J. State and federal fuel taxes: The road ahead for U.S. infrastructure funding. Transp. Policy 2017, 53, 39–49. [Google Scholar] [CrossRef] [Green Version]
- Duncan, D.; Li, D.; Graham, J.D. Tax rate design and support for mileage user-fees. Transp. Policy 2020, 93, 17–26. [Google Scholar] [CrossRef]
- Agrawal, A.W.; Nixon, H. What Do Americans Think about Federal Tax Options to Support Transportation? Results from Year Nine of a National Survey. Technical Report. 2018. Available online: https://transweb.sjsu.edu/sites/default/files/1828_Transportation-Taxes-Survey-Year-Nine_0.pdf (accessed on 5 November 2022).
- Buehler, R.; Pucher, J. COVID-19 impacts on cycling, 2019–2020. Transp. Rev. 2021, 41, 393–400. [Google Scholar] [CrossRef]
- Dill, J.; Weinstein, A. How to pay for transportation? A survey of public preferences in California. Transp. Policy 2007, 14, 346–356. [Google Scholar] [CrossRef]
- Norboge, N.D.; Head, W.; Findley, D.; Ravi, P.E.; Chittilla, K.; Broussard, P.; Cobb, M.; Goode, L.; Bardaka, E. Public Perceptions of Transportation Fees and Taxes in North Carolina; Technical Report; Institute for Transportation Research and Education (ITRE): Raleigh, NC, USA, 2019. [Google Scholar]
- Tonn, G.; Reilly, A.; Czajkowski, J.; Ghaedi, H.; Kunreuther, H.U.S. transportation infrastructure resilience: Influences of insurance, incentives, and public assistance. Transp. Policy 2021, 100, 108–119. [Google Scholar] [CrossRef]
- Abdullah, M.; Ali, N.; Dias, C.; Campisi, T.; Javid, M.A. Exploring the Traveler’s Intentions to Use Public Transport during the COVID-19 Pandemic While Complying with Precautionary Measures. Appl. Sci. 2021, 11, 3630. [Google Scholar] [CrossRef]
- Dudziak, A.; Caban, J. The Urban Transport Strategy on the Example of the City Bike System in the City of Lublin in Relation to the COVID-19 Pandemic. LOGI Sci. J. Transp. Logist. 2022, 13, 1–12. [Google Scholar] [CrossRef]
- Kurek, A.; Macioszek, E. Daily variability of the use of parking spaces in the Paid Parking Zone covered by Dynamic Parking Information before and during the COVID-19 pandemic. Sci. J. Sil. Univ. Technol. Ser. Transp. 2022, 114, 55–65. [Google Scholar] [CrossRef]
- Makarov, V.; Makarova, T.; Korobov, S.; Kontseva, V.; Kisala, P.; Droździel, P.; Smailova, S.; Mussabekov, K.; Kulakova, Y. Essential aspects of regional motor transport system development. In Mechatronic Systems 1: Applications in Transport, Logistics, Diagnostics, and Control; Routledge: London, UK, 2021; pp. 185–195. [Google Scholar]
- Stefancova, V.; Kalasova, A.; Culik, K.; Mazanec, J.; Vojtek, M.; Masek, J. Research on the impact of COVID-19 on micromobility using statistical methods. Appl. Sci. 2022, 12, 8128. [Google Scholar] [CrossRef]
- Li, X.; Farrukh, M.; Lee, C.; Khreis, H.; Sarda, S.; Sohrabi, S.; Zhang, Z.; Dadashova, B. COVID-19 impacts on mobility, environment, and health of active transportation users. Cities 2022, 131, 103886. [Google Scholar] [CrossRef]
- Mikulski, M.; Drozdziel, P.; Tarkowski, S. Reduction of transport-related air pollution. A case study based on the impact of the COVID-19 pandemic on the level of NOx emissions in the city of Krakow. Open Eng. 2021, 11, 790–796. [Google Scholar] [CrossRef]
- Nazelle, A.; Bode, O.; Orjuela, J.P. Comparison of air pollution exposures in active vs. passive travel modes in european cities: A quantitative review. Environ. Int. 2017, 99, 151–160. [Google Scholar] [CrossRef]
- Vichova, K.; Veselik, P.; Heinzova, R.; Dvoracek, R. Road transport and its impact on air pollution during the COVID-19 pandemic. Sustainability 2021, 13, 11803. [Google Scholar] [CrossRef]
- Mulholland, E.; Miller, J.; Bernard, Y.; Lee, K.; Rodríguez, F. The role of NOx emission reductions in Euro 7/VII vehicle emission standards to reduce adverse health impacts in the EU27 through 2050. Transp. Eng. 2022, 9, 100133. [Google Scholar] [CrossRef]
- Beik, Y.; Dziewiątkowski, M.; Szpica, D. Exhaust emissions of an engine fuelled by petrol and liquefied petroleum gas with control algorithm adjustment. SAE Int. J. Engines 2020, 13, 739–759. [Google Scholar] [CrossRef]
- Dziewiatkowski, M.; Szpica, D.; Borawski, A. Evaluation of impact of combustion engine controller adaptation process on level of exhaust gas emissions in gasoline and compressed natural gas supply process. Eng. Rural. Dev. 2020, 19, 541–548. [Google Scholar]
- Hunicz, J.; Kordos, P.; Ignaciuk, P. Experimental investigation into thermal and chemical effects of negative valve overlap injection in a gasoline HCCI engine. SAE Technol. Pap. 2014, 2014, 109725. [Google Scholar]
- Kriaučiūnas, D.; Pukalskas, S.; Rimkus, A.; Barta, D. Analysis of the influence of CO2 concentration on a spark ignition engine fueled with biogas. Appl. Sci. 2021, 11, 6379. [Google Scholar] [CrossRef]
- Kruczyński, S.; Ślęzak, M.; Gis, W. Impact of fuel vapor pressure on emissions of non-methane volatile organic compounds from transport vehicles. Przem. Chem. 2016, 95, 1025–1028. [Google Scholar]
- Litak, G.; Wendeker, M.; Krupa, M.; Czarnigowski, J. A numerical study of a simple stochastic/deterministic model of cycle-to-cycle combustion fluctuations in spark ignition engines. J. Vib. Control. 2005, 11, 371–379. [Google Scholar] [CrossRef] [Green Version]
- Sarkan, B.; Kuranc, A.; Kucera, L. Calculations of exhaust emissions produced by vehicle with petrol engine in urban area. IOP Conf. Ser. Mater. Sci. Eng. 2019, 710, 012023. [Google Scholar] [CrossRef]
- Wang, Y.; Yuan, S.; Shi, Z.; Zhao, M.; Gong, M.; Liu, Z.; Chen, Q.; Chen, Y. Medium-Coupled Catalysts Meeting Euro III Emission Standards for Gasoline Vehicles. Chin. J. Catal. 2007, 28, 97–99. [Google Scholar] [CrossRef]
- Bergthorson, J.M.; Thomson, M.J. A review of the combustion and emissions properties of advanced Transportation biofuels and their impact on existing and future engines. Renew. Sustain. Energy Rev. 2015, 42, 1393–1417. [Google Scholar] [CrossRef]
- Chen, Y.; Wang, L.; Guan, X.; Tang, S.; Gong, M.; Chen, Y. A novel diesel oxidation catalyst with low SO2 oxidation activity and capable of meeting Euro V emission standards. Chin. J. Catal. 2013, 34, 667–673. [Google Scholar] [CrossRef]
- Longwic, R.; Sander, P.; Nieoczym, A.; Lotko, W.; Krzysiak, Z.; Samociuk, W.; Bąkowski, H. Effect of some properties of hydrocarbon fuels on self-ignition delay. Przem. Chem. 2017, 96, 1123–1127. [Google Scholar]
- Makarevičiene, V.; Matijošius, J.; Pukalskas, S.; Vegneris, R.; Kazanceva, I.; Kazancev, K. The exploitation and environmental characteristics of diesel fuel containing rapeseed butyl esters. Transport 2013, 28, 158–165. [Google Scholar] [CrossRef]
- Szpica, D.; Czaban, J.; Banaszuk, P.; Weresa, E. The diesel and the vegetable oil properties assessment in terms of pumping capability and cooperation with internal combustion engine fuelling system. Acta Mech. Autom. 2015, 9, 14–18. [Google Scholar] [CrossRef] [Green Version]
- Tucki, K.; Orynycz, O.; Wasiak, A.; Swic, A.; Mruk, R.; Botwińska, K. Estimation of carbon dioxide emissions from a diesel engine powered by lignocellulose derived fuel for better management of fuel production. Energies 2020, 13, 561. [Google Scholar] [CrossRef] [Green Version]
- Droździel, P. The influence of the vehicle work organization conditions on the engine start-up parameters. Eksploat. I Niezawodn. Maint. Reliab. 2008, 37, 72–74. [Google Scholar]
- Kamiński, M.; Budzyński, P.; Hunicz, J.; Józwik, J. Evaluation of changes in fuel delivery rate by electromagnetic injectors in a common rail system during simulated operation. Eksploat. Niezawodn. Maint. Reliab. 2021, 23, 352–358. [Google Scholar] [CrossRef]
- Merkisz, J.; Fuc, P.; Lijewski, P.; Ziolkowski, A.; Wojciechowski, K.T. The analysis of exhaust gas thermal energy recovery through a TEG generator in city traffic conditions reproduced on a dynamic engine test bed. J. Electron. Mater. 2015, 44, 1704–1715. [Google Scholar] [CrossRef] [Green Version]
- Yadav, S.; Kumar, A.; Chaudhary, A. Effect of Karanja biodiesel blends on the characteristics of Diesel engine. Sci. J. Sil. Univ. Technol. Ser. Transp. 2022, 115, 249–264. [Google Scholar] [CrossRef]
- Longwic, R.; Sander, P.; Zdziennicka, A.; Szymczyk, K.; Jańczuk, B. Combustion Process of Canola Oil and n-Hexane Mixtures in Dynamic Diesel Engine Operating Conditions. Appl. Sci. 2020, 10, 80. [Google Scholar] [CrossRef] [Green Version]
- Rimkus, A.; Pukalskas, S.; Matijošius, J.; Sokolovskij, E. Betterment of ecological parameters of a diesel engine using Brown’s gas. J. Environ. Eng. Landsc. Manag. 2013, 21, 133–140. [Google Scholar] [CrossRef]
- Valeika, G.; Matijošius, J.; Górski, K.; Rimkus, A.; Smigins, R. A study of energy and environmental parameters of a diesel engine running on hydrogenated vegetable oil (HVO) with addition of biobutanol and castor oil. Energies 2021, 14, 3939. [Google Scholar] [CrossRef]
- Szmigielski, M.; Zarajczyk, J.; Węgrzyn, A.; Leszczyński, N.; Kowalczuk, J.; Andrejko, D.; Krzysiak, Z.; Samociuk, W.; Zarajczyk, K. Testing the technological line for the production of alternative fuels. Przem. Chem. 2018, 97, 1079–1082. [Google Scholar]
- Verner, J. Overview of the development of emission standards for the reduction of air pollution by nonroad mobile machinery (in Czech). Prener’s Contacts 2021, 16, 2. [Google Scholar] [CrossRef]
- Gnap, J.; Šarkan, B.; Konečný, V.; Skrúcaný, T. The Impact of Road Transport on the Environment. Lect. Notes Netw. Syst. 2020, 124, 251–309. [Google Scholar]
- Manko, I.; Shuba, Y.; Korpach, A.; Gutarevyc, S.; Ragulskiene, J.; Pauliukas, A. Measurement of fuel consumption and harmful emissions of cars when using different types of fuel. J. Meas. Eng. 2020, 8, 182–196. [Google Scholar] [CrossRef]
- Rito, J.E.; Lopez, N.S.; Biona, J.B.M. Modeling traffic flow, energy use, and emissions using google maps and google street view: The case of Edsa, Philippines. Sustainability 2021, 13, 6682. [Google Scholar] [CrossRef]
- Skrúcaný, T.; Kendra, M.; Čechovič, T.; Majerník, F.; Pečman, J. Assessing the Energy Intensity and Greenhouse Gas Emissions of the Traffic Services in a Selected Region. LOGI Sci. J. Transp. Logist. 2021, 12, 25–35. [Google Scholar] [CrossRef]
- Skrucany, T.; Semanova, S.; Figlus, T.; Sarkan, B.; Gnap, J. Energy intensity and GHG production of chosen propulsions used in road transport. Commun. Sci. Lett. Univ. Zilina 2017, 19, 3–9. [Google Scholar] [CrossRef]
- Synak, F.; Kalasova, A.; Synak, J. Air filter and selected vehicle characteristics. Sustainability 2020, 12, 9326. [Google Scholar] [CrossRef]
- Tarbajovsky, P.; Soltesova, M.; Puskar, M. Emission problems of vehicles and advanced fuels application. Stroj. Cas. J. Mech. Eng. 2022, 72, 35–40. [Google Scholar] [CrossRef]
- Bartuška, L.; Masek, J. Changes in road traffic causes by the declaration of a state of emergency in the Czech Republic—A case study. Transp. Res. Procedia 2021, 53, 321–328. [Google Scholar] [CrossRef]
- Harantova, V.; Kalasova, A.; Kubikova, S. Use of traffic planning software outputs when a new highway section is put into operation. Sustainability 2021, 13, 2467. [Google Scholar] [CrossRef]
- Hasan, U.; Whyte, A.; AlJassmi, H. A microsimulation modelling approach to quantify environmental footprint of autonomous buses. Sustainability 2022, 14, 15657. [Google Scholar] [CrossRef]
- Duda, K.; Wierzbicki, S.; Mikulski, M.; Konieczny, Ł.; Łazarz, B.; Letuń-Łatka, M. Emissions from a medium-duty crdi engine fuelled with diesel-biodiesel blends. Transp. Probl. 2021, 16, 39–49. [Google Scholar] [CrossRef]
- Kovacs, V.B.; Torok, A. Environmental impact estimation of renewable gaseous fuels consumed by road vehicles. Pollack Period. 2009, 4, 87–97. [Google Scholar] [CrossRef]
- Lebedevas, S.; Čepaitis, T. Parametric analysis of the combustion cycle of a diesel engine for operation on natural gas. Sustainability 2021, 13, 2773. [Google Scholar] [CrossRef]
- Šarkan, B.; Jaśkiewicz, M.; Kubiak, P.; Tarnapowicz, D.; Loman, M. Exhaust Emissions Measurement of a Vehicle with Retrofitted LPG System. Energies 2022, 15, 1184. [Google Scholar] [CrossRef]
- Marczak, H.; Drozdziel, P. Analysis of pollutants emission into the air at the stage of an electric vehicle operation. J. Ecol. Eng. 2021, 22, 182–188. [Google Scholar] [CrossRef]
- Sendek-Matysiak, E.; Rzedowski, H.; Skrucany, T. Electromobility in Poland and Slovakia. Benchmarking of electric vehicles for 2019. Commun. Sci. Lett. Univ. Zilina 2020, 22, 35–45. [Google Scholar] [CrossRef]
- Rievaj, V.; Synák, F. Does electric car produce emissions? Sci. J. Sil. Univ. Technol. Ser. Transp. 2017, 94, 187–197. [Google Scholar] [CrossRef]
- Mikušová, M.; Torok, A.; Brída, P. Technological and economical context of renewable and non-renewable energy in electric mobility in Slovakia and Hungary. Lect. Notes Comput. Sci. 2018, 11056, 429–436. [Google Scholar]
- Małek, A.; Marciniak, A. The use of deep recurrent neural networks to predict performance of photovoltaic system for charging electric vehicles. Open Eng. 2021, 11, 377–389. [Google Scholar] [CrossRef]
- Almohaimeed, S.A. Electric Vehicle Deployment and Integration in the Saudi Electric Power System. World Electr. Veh. J. 2022, 13, 84. [Google Scholar] [CrossRef]
- Gorzelańczyk, P.; Kelm, B. Analysis of the operating costs of passenger cars declared by vehicles’ manufacturers and obtained by users. Commun. Sci. Lett. Univ. Zilina 2021, 24, A44–A52. [Google Scholar] [CrossRef]
- König, A.; Nicoletti, L.; Schröder, D.; Wolff, S.; Waclaw, A.; Lienkamp, M. An overview of parameter and cost for battery electric vehicles. World Electr. Veh. J. 2021, 12, 21. [Google Scholar] [CrossRef]
- López-Arquillos, A.; Rubio-Romero, J.C.; Súarez-Cebador, M.; del Carmen Pardo-Ferreira, M. Comparative risk assessment of vehicle maintenance activities: Hybrid, battery electric, and hydrogen fuel cell cars. Int. J. Ind. Ergon. 2015, 47, 53–60. [Google Scholar] [CrossRef]
- Małek, A.; Taccani, R. Innovative approach to electric vehicle diagnostics. Arch. Automot. Eng. Arch. Motoryz. 2021, 92, 49–67. [Google Scholar] [CrossRef]
- Pearre, N.S.; Kempton, W.; Guensler, R.L.; Elango, V.V. Electric vehicles: How much range is required for a day’s driving? Transp. Res. Part C Emerg. Technol. 2011, 19, 1171–1184. [Google Scholar] [CrossRef]
- Alcázar-García, D.; Romeral Martínez, J.L. Model-based design validation and optimization of drive systems in electric, hybrid, plug-in hybrid and fuel cell vehicles. Energy 2022, 254, 123719. [Google Scholar] [CrossRef]
- Boonjun, J.; Manosroi, W.; Kammuang-lue, N. Energy consumption of diesel hybrid electric bus simulated from different drive modes. Energy Rep. 2022, 8, 523–530. [Google Scholar] [CrossRef]
- Liao, J.; Yang, Y.; Luo, R.; Luo, C.; Fu, C. Energy management strategy of four-wheel drive SUV electric-hydraulic hybrid (EHH) power system based on optimal instantaneous efficiency. Sustain. Energy Technol. Assess. 2022, 52, 102139. [Google Scholar] [CrossRef]
- Orecchini, F.; Santiangeli, A.; Zuccari, F. Hybrid-electric system truth test: Energy analysis of Toyota Prius IV in real urban drive conditions. Sustain. Energy Technol. Assess. 2020, 37, 100573. [Google Scholar] [CrossRef]
- Al-Flehawee, M.; Al-Mayyahi, A. Energy management for hybrid electric vehicles using rule based strategy and PI control tuned by particle swarming optimization algorithm. Int. J. Electr. Comput. Eng. 2022, 12, 5938–5949. [Google Scholar] [CrossRef]
- Tu, R.; Xu, J.; Wang, A.; Zhang, M.; Zhai, Z. Real-world emissions and fuel consumption of gasoline and hybrid light duty vehicles under local and regulatory drive cycles. Sci. Total Environ. 2022, 805, 150407. [Google Scholar] [CrossRef]
- Ahn, J.K.; Jung, K.H.; Kim, D.H.; Jin, H.B.; Hwang, S.H. Analysis of a regenerative braking system for Hybrid Electric Vehicles using an Electro-Mechanical Brake. Int. J. Automot. Technol. 2009, 10, 229–234. [Google Scholar] [CrossRef]
- Chen, Z.; Xia, B.; You, C.; Mi, C.C. A novel energy management method for series Plug-in Hybrid Electric Vehicles. Appl. Energy 2015, 145, 172–179. [Google Scholar] [CrossRef]
- Xu, L.; He, X.; Shen, X. Improving energy recovery rate of the regenerative braking system by optimization of influencing factors. Appl. Sci. 2019, 9, 3807. [Google Scholar] [CrossRef] [Green Version]
- Ma, Y.; Chen, J.; Zhu, X.; Xu, Y. Lateral stability integrated with energy efficiency control for electric vehicles. Mech. Syst. Signal Process. 2019, 127, 1–15. [Google Scholar] [CrossRef]
- Vodovozov, V.; Raud, Z.; Petlenkov, E. Review on braking energy management in electric vehicles. Energies 2021, 14, 4477. [Google Scholar]
- Xu, Q.; Zhou, C.; Huang, H.; Zhang, X. Research on the coordinated control of regenerative braking system and abs in hybrid electric vehicle based on composite structure motor. Electronics 2021, 10, 223. [Google Scholar] [CrossRef]
- Axsen, J.; Kurani, K.S. Hybrid, Plug-In Hybrid, or Electric—What Do Car Buyers Want? Energy Policy 2013, 61, 532–543. [Google Scholar] [CrossRef]
- Bastin, Z.; Bhattacharya, S.; Kumar, A. International Electric Vehicle Consumer Survey: Are Battery Electric Vehicles Here to Stay. AlixPartners. 9 October 2019. Available online: https://www.alixpartners.com/insights-impact/insights/international-electric-vehicle-consumer-survey/ (accessed on 10 February 2023).
- Carley, S.; Krause, R.M.; Lane, B.W.; Graham, J.D. Intent to Purchase a Plug-in Electric Vehicle: A Survey of Early Impressions in Large U.S. Cities. Transp. Res. D Transp. Environ. 2013, 18, 39–45. [Google Scholar] [CrossRef]
- Carley, S.; Siddiki, S.; Nicholson-Crotty, S. Evolution of Plug-In Electric Vehicle Demand: Assessing Consumer Perceptions and Intent to Purchase Over Time. Transp. Res. D Transp. Environ. 2019, 70, 94–111. [Google Scholar] [CrossRef]
- Li, W.; Long, R.; Chen, H.; Geng, J. A Review of Factors Influencing Consumer Intentions to Adopt Battery Electric Vehicles. Renew. Sustain. Energy Rev. 2017, 78, 318–328. [Google Scholar] [CrossRef]
- Siddiki, S.; Dumortier, J.; Curley, C.; Graham, J.D.; Carley, S.; Krause, R.M. Exploring Drivers of Innovative Technology Adoption Intention: The Case of Plug-In Vehicles. Rev. Policy Res. 2015, 32, 649–674. [Google Scholar] [CrossRef]
- Transportation Research Board and National Research Council. Overcoming Barriers to Deployment of Plug-in Electric Vehicles; The National Academies Press: Washington, DC, USA, 2015. [Google Scholar] [CrossRef]
- Egbue, O.; Long, S. Barriers to Widespread Adoption of Electric Vehicles: An Analysis of Consumer Attitudes and Perceptions. Energy Policy 2012, 48, 717–729. [Google Scholar] [CrossRef]
- Počet Obyvatel v Regionech Soudržnosti, Krajích a Okresech České Republiky k 1.1. Český Statistický Úřad. 2022. Available online: https://www.czso.cz/documents/10180/142756350/1300722101.pdf (accessed on 8 November 2022).
- UNDP (United Nations Development Programme). Human Development Report 2013: The Rise of the South: Human Progress in a Diverse World. New York. 2013. Available online: https://hdr.undp.org/content/human-development-report-2013 (accessed on 10 November 2022).
- Členské Státy Evropské Unie—European Union Website, the Official Eu Website—European Commission. Available online: https://european-union.europa.eu/principles-countries-history/country-profiles_cs (accessed on 10 November 2022).
- Davies, M.B.; Hughes, N. Doing a Successful Research Project: Using Qualitative or Quantitative Methods; Bloomsbury Publishing: London, UK, 2014. [Google Scholar]
- Merriam, S.B.; Tisdell, E.J. Qualitative Research: A Guide to Design and Implementation; John Wiley & Sons: Hoboken, NJ, USA, 2015. [Google Scholar]
- Patton, M.Q. Qualitative Evaluation and Research Methods; SAGE Publications, Inc.: NewYork, NY, USA, 1990. [Google Scholar]
- Creswell, J.W.; Creswell, J.D. Research Design: Qualitative, Quantitative, and Mixed Methods Approaches; Sage Publications Ltd.: Thousand Oaks, CA, USA, 2017. [Google Scholar]
- Morton, C.; Anable, J.; Nelson, J.D. Exploring consumer preferences towards electric vehicles: The influence of consumer innovativeness. Res. Transp. Bus. Manag. 2016, 18, 18–28. [Google Scholar] [CrossRef]
- Simsekoglu, Ö.; Nayum, A. Predictors of intention to buy a battery electric vehicle among conventional car drivers. Transp. Res. Part F Traffic Psychol. Behav. 2019, 60, 1–10. [Google Scholar] [CrossRef]
- Sovacool, B.K.; Kester, J.; Noel, L.; Zarazua de Rubens, G. Are electric vehicles masculinized? Gender, identity, and environmental values in Nordic transport practices and vehicle-to-grid (V2G) preferences. Transp. Res. D Transp. Environ. 2019, 72, 187–202. [Google Scholar] [CrossRef]
- Sugihara, C.; Sutton, K.; Davis, A.; Karanam, V.; Tal, G. From Sport to Eco: A Case Study of Driver Inputs on Electric Vehicle Efficiency. Transp. Res. Part F Traffic Psychol. Behav. 2021, 82, 412–428. [Google Scholar] [CrossRef]
- Li, S.; Glass, R.; Records, H. The Influence of Gender on New Technology Adoption and Use–Mobile Commerce. J. Internet Commer. 2008, 7, 270–289. [Google Scholar] [CrossRef]
- Ziegler, A. Individual Characteristics and Stated Preferences for Alternative Energy Sources and Propulsion Technologies in Vehicles: A Discrete Choice Analysis for Germany. Transp. Res. Part Policy Pract. 2012, 46, 1372–1385. [Google Scholar] [CrossRef]
- Linzenich, A.; Arning, K.; Bongartz, D.; Mitsos, A.; Ziefle, M. What Fuels the Adoption of Alternative Fuels? Examining Preferences of German Car Drivers for Fuel Innovations. Appl. Energy 2019, 249, 222–236. [Google Scholar] [CrossRef]
- Shin, J.; Bhat, C.R.; You, D.; Garikapati, V.M.; Pendyala, R.M. Consumer Preferences and Willingness to Pay for Advanced Vehicle Technology Options and Fuel Types. Transp. Res. Part C Emerg. Technol. 2015, 60, 511–524. [Google Scholar] [CrossRef] [Green Version]
- Rauh, N.; Franke, T.; Krems, J.F. Understanding the Impact of Electric Vehicle Driving Experience on Range Anxiety. Hum. Factors 2015, 57, 177–187. [Google Scholar] [CrossRef]
- Eisel, M.; Nastjuk, I.; Kolbe, L.M. Understanding the Influence of In-Vehicle Information Systems on Range Stress–Insights from an Electric Vehicle Field Experiment. Transp. Res. Part F Traffic Psychol. Behav. 2016, 43, 199–211. [Google Scholar] [CrossRef]
- Varga, B.O.; Sagoian, A.; Mariasiu, F. Prediction of Electric Vehicle Range: A Comprehensive Review of Current Issues and Challenges. Energies 2019, 12, 946. [Google Scholar] [CrossRef] [Green Version]
- Khan, N.A.; Fatmi, M.R.; Habib, M.A. Type Choice Behavior of Alternative Fuel Vehicles: A Latent Class Model Approach. Transp. Res. Procedia 2017, 25, 3299–3313. [Google Scholar] [CrossRef]
- Ščasnỳ, M.; Zvěřinová, I.; Czajkowski, M. Electric, Plug-in Hybrid, Hybrid, or Conventional? Polish Consumers’ Preferences for Electric Vehicles. Energy Effic. 2018, 11, 2181–2201. [Google Scholar] [CrossRef]
- Kass, G.V. An Exploratory Technique for Investigating Large Quantities of Categorical Data. J. R. Stat. Society. Ser. C (Appl. Statist.) 1980, 29, 119–127. [Google Scholar] [CrossRef] [Green Version]
- Ripley, B.D. Pattern Recognition and Neural Networks; Cambridge University Press: Cambridge, UK, 1996. [Google Scholar]
- Morgan, J.N.; Messenger, R.C. THAID: A Sequential Analysis Program for the Analysis of Nominal Scale Dependent Variables; Technical Report; Institute of Social Research, University of Michigan: Ann Arbor, MI, USA, 1973. [Google Scholar]
- Szumska, E.; Pawełczyk, M.; Pistek, V. Evaluation of the Life Cycle Costs for urban buses equipped with conventional and hybrid drive trains. Arch. Autom. Engineer. Archiw. Mot. 2019, 83, 73–86. [Google Scholar] [CrossRef]


| Description | Characteristic |
|---|---|
| Research goals |
|
| Research object | drivers and users of passenger cars |
| Type of research | qualitative research |
| Research method and technique | online survey (Google Forms) |
| Research tools | proprietary survey questionnaire |
| Selection of units for research | non-random, targeted |
| Sample selection criteria | individual drivers and users of passenger cars, a group of respondents differentiated by gender, age and place of residence |
| Sample size | 432 people |
| Spatial scope | the Czech Republic |
| Time frame of the research process | January–June 2022 |
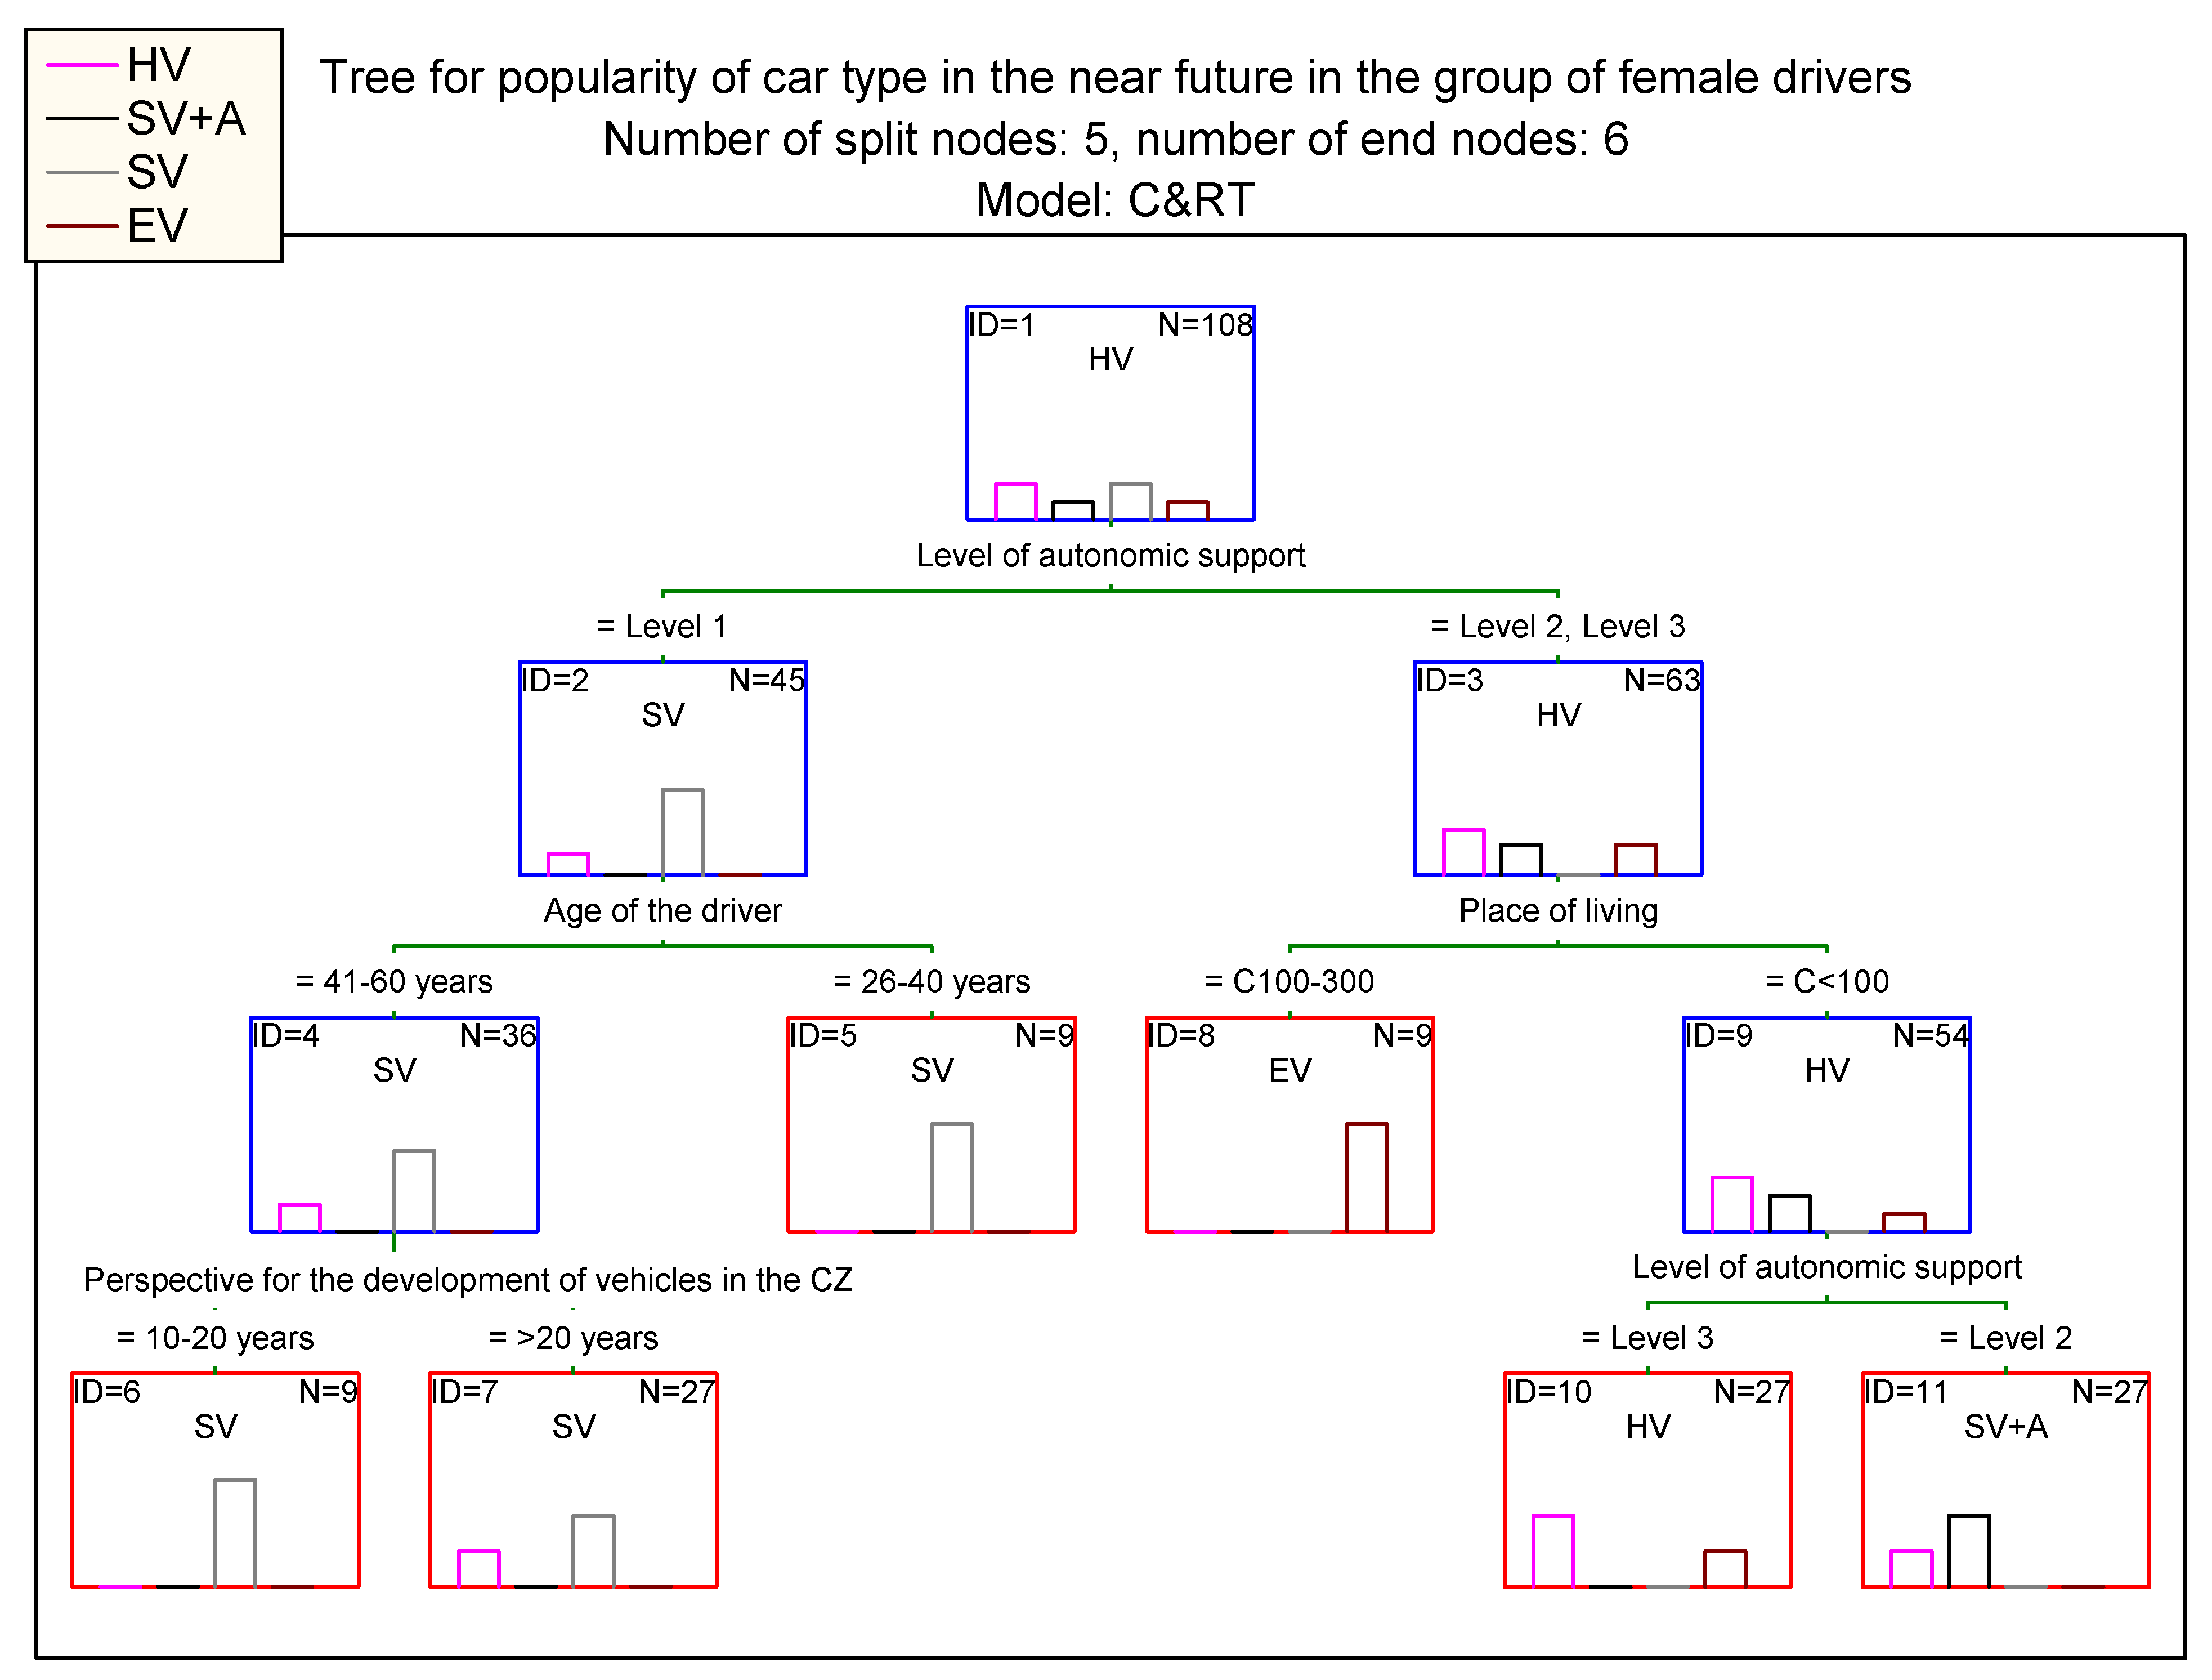
| Class HV | Class SV + A | Class SV | Class EV | Gain | =v1/v5 | =v2/v5 | =v3/v5 | =v4/v5 | |
|---|---|---|---|---|---|---|---|---|---|
| 6 | 0 | 0 | 9 | 0 | 9.00000 | 0.0% | 0.0% | 100.0% | 0.0% |
| 7 | 9 | 0 | 18 | 0 | 27.00000 | 33.3% | 0.0% | 66.7% | 0.0% |
| 5 | 0 | 0 | 9 | 0 | 9.00000 | 0.0% | 0.0% | 100.0% | 0.0% |
| 8 | 0 | 0 | 0 | 9 | 9.00000 | 0.0% | 0.0% | 0.0% | 100.0% |
| 10 | 18 | 0 | 0 | 9 | 27.00000 | 66.7% | 0.0% | 0.0% | 33.3% |
| 11 | 9 | 18 | 0 | 0 | 27.00000 | 33.3% | 66.7% | 0.0% | 0.0% |
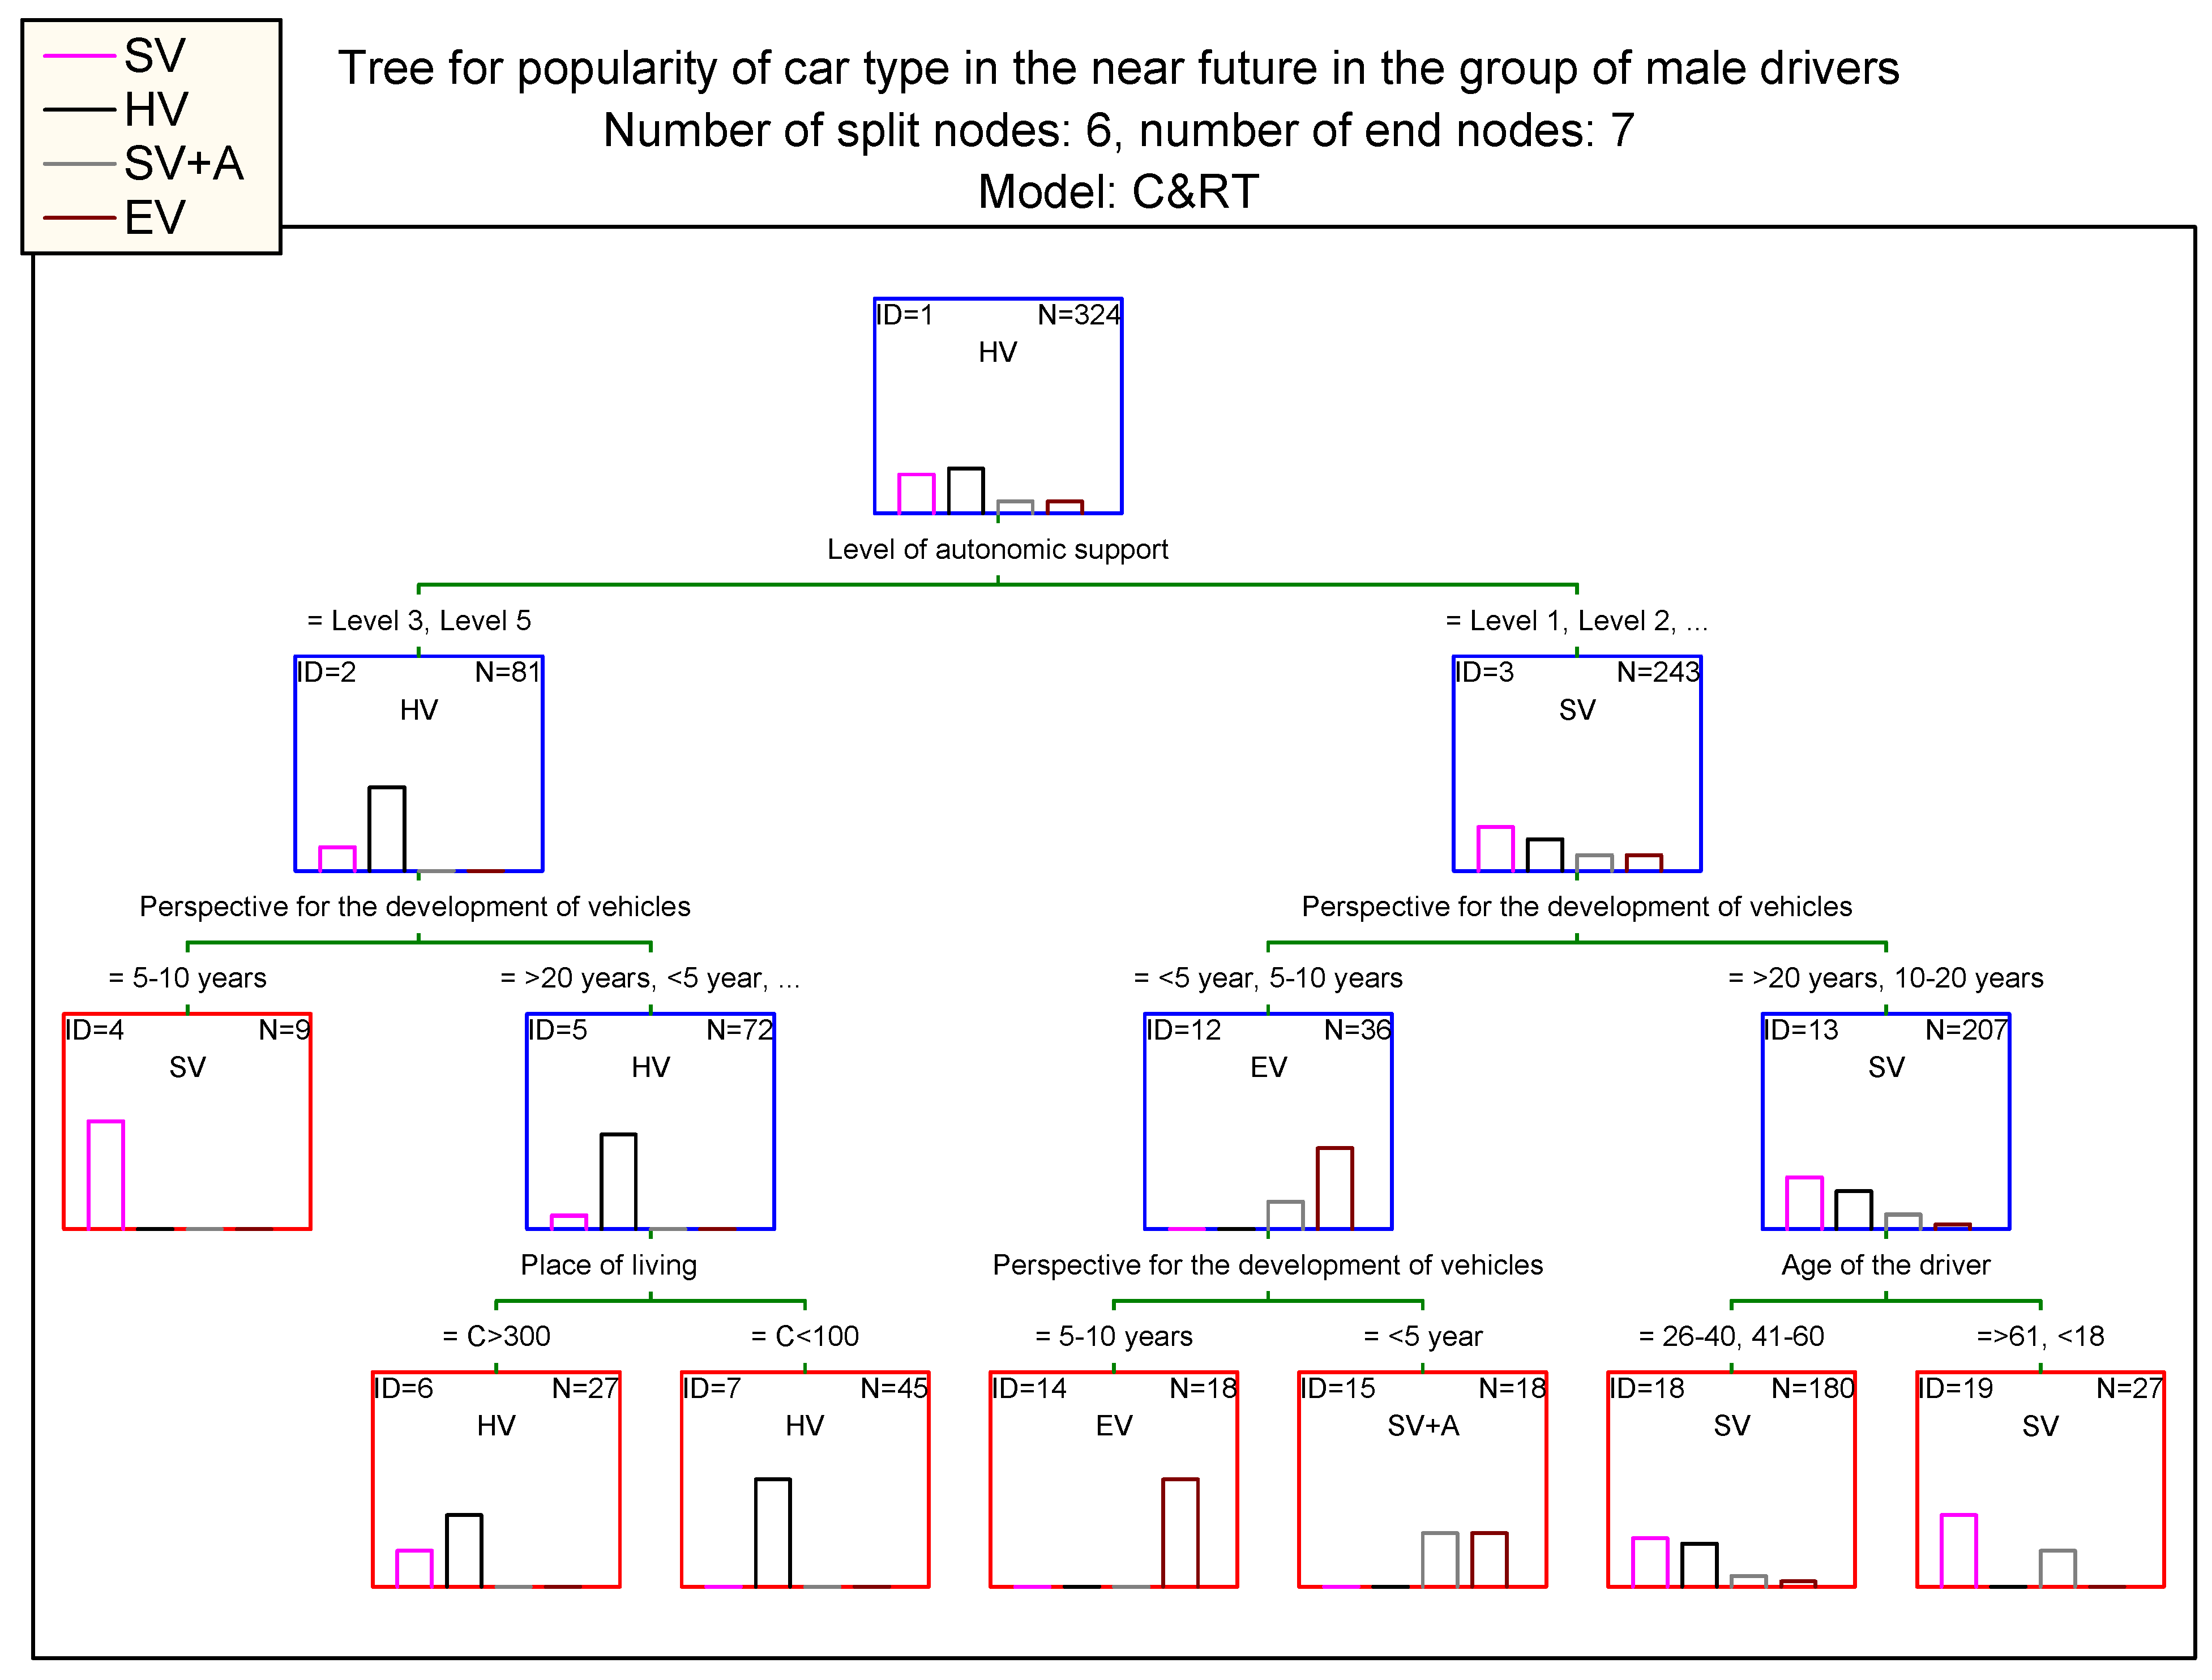
| Class SV | Class HV | Class SV + A | Class EV | Gain | =v1/v5 | =v2/v5 | =v3/v5 | =v4/v5 | |
|---|---|---|---|---|---|---|---|---|---|
| 4 | 9 | 0 | 0 | 0 | 9.0000 | 100.0% | 0.0% | 0.0% | 0.0% |
| 6 | 9 | 18 | 0 | 0 | 27.0000 | 33.3% | 66.7% | 0.0% | 0.0% |
| 7 | 0 | 45 | 0 | 0 | 45.0000 | 0.0% | 100.0% | 0.0% | 0.0% |
| 14 | 0 | 0 | 0 | 18 | 18.0000 | 0.0% | 0.0% | 0.0% | 100.0% |
| 15 | 0 | 0 | 9 | 9 | 18.0000 | 0.0% | 0.0% | 50.0% | 50.0% |
| 18 | 81 | 72 | 18 | 9 | 180.0000 | 45.0% | 40.0% | 10.0% | 5.0% |
| 19 | 18 | 0 | 9 | 0 | 27.0000 | 66.7% | 0.0% | 33.3% | 0.0% |
Disclaimer/Publisher’s Note: The statements, opinions and data contained in all publications are solely those of the individual author(s) and contributor(s) and not of MDPI and/or the editor(s). MDPI and/or the editor(s) disclaim responsibility for any injury to people or property resulting from any ideas, methods, instructions or products referred to in the content. |
© 2023 by the authors. Licensee MDPI, Basel, Switzerland. This article is an open access article distributed under the terms and conditions of the Creative Commons Attribution (CC BY) license (https://creativecommons.org/licenses/by/4.0/).
Share and Cite
Dudziak, A.; Caban, J.; Stopka, O.; Stoma, M.; Sejkorová, M.; Stopková, M. Vehicle Market Analysis of Drivers’ Preferences in Terms of the Propulsion Systems: The Czech Case Study. Energies 2023, 16, 2418. https://doi.org/10.3390/en16052418
Dudziak A, Caban J, Stopka O, Stoma M, Sejkorová M, Stopková M. Vehicle Market Analysis of Drivers’ Preferences in Terms of the Propulsion Systems: The Czech Case Study. Energies. 2023; 16(5):2418. https://doi.org/10.3390/en16052418
Chicago/Turabian StyleDudziak, Agnieszka, Jacek Caban, Ondrej Stopka, Monika Stoma, Marie Sejkorová, and Mária Stopková. 2023. "Vehicle Market Analysis of Drivers’ Preferences in Terms of the Propulsion Systems: The Czech Case Study" Energies 16, no. 5: 2418. https://doi.org/10.3390/en16052418