
Tanana River Test Site Model Verification Using the Marine and Hydrokinetic Toolkit (MHKiT)


1
Water Power Technologies, Sandia National Laboratories, Albuquerque, NM 87185, USA
2
Department of Mechanical Engineering, University of Alaska Fairbanks, Fairbanks, AK 99775, USA
3
Water Power, National Renewable Energy Laboratory, Golden, CO 80401, USA
4
Coastal Sciences Division, Pacific Northwest National Laboratory, Seattle, WA 98109, USA
*
Author to whom correspondence should be addressed.
Energies 2023, 16(8), 3326; https://doi.org/10.3390/en16083326
Submission received: 1 February 2023
/
Revised: 18 March 2023
/
Accepted: 25 March 2023
/
Published: 8 April 2023
(This article belongs to the Special Issue New Challenges in Software for Marine Energy Applications)
Abstract
:The marine energy (ME) industry historically lacked a standardized data processing toolkit for common tasks such as data ingestion, quality control, and visualization. The marine and hydrokinetic toolkit (MHKiT) solved this issue by providing a public software deployment (open-source and free) toolkit for the ME industry to store and maintain commonly used functionality for wave, tidal, and river energy. This paper demonstrates an initial model verification study in MHKiT. Using Delft3D, a numerical model of the Tanana River Test Site (TRTS) at Nenana, Alaska was created. Field data from the site was collected using an Acoustic Doppler Current Profiler (ADCP) at the proposed Current Energy Converter (CEC) locations. MHKiT is used to process model simulations from Delft3D and compare them to the transect data from the ADCP measurements at TRTS. The ability to use a single tool to process simulation and field data demonstrates the ease at which the ME industry can obtain results and collaborate across specialties, reducing errors and increasing efficiency.
1. Introduction
The growing field of marine energy (ME) has numerous archetypes of marine renewable energy devices (MREDs) currently in development, deployment, and testing worldwide across river, tidal, and wave environments. Due to the wide variety of MREDs and resource types, standardization of data processing and analysis techniques has been an ongoing challenge. Each device has unique data collection needs, leading to a variety of data collection strategies. As a result, a variety of data analysis methodologies and independent codebases have arisen. Typically, researchers and device developers create their own data processing software [1,2], which leads to greater time spent on data wrangling and analysis as well as inconsistent results and reporting across the industry. Standards bodies, such as the International Electrotechnical Commission (IEC), have worked to standardize data analysis methodologies relevant to marine energy research and development through the IEC Technical Specification (TS) 62600—“Marine Energy—Wave, tidal, and other water current converters” [3]. This has been an important step towards consistent data analysis, but individuals have still been responsible for interpreting these technical specifications and developing analysis tools.
To tackle this challenge and provide a unified data analysis code base for ME, the United States Department of Energy (DOE) Water Power Technologies Office funded an initiative to develop standards-compliant, open-source ME software, resulting in the Marine and Hydrokinetic ToolKit (MHKiT). In early 2020, the first version of MHKiT was released and featured code based on the IEC technical specifications. This release established a free, open-source for the ME industry to utilize and further develop for areas of interest such as power performance, mechanical loads, and resource characterization for wave, tidal, and river applications [4].
MHKiT expedites ME data processing for data ingestion, quality control, analysis, visualization, and management using an open-source and free Python toolkit. The Python toolkit is also wrapped into a MATLAB toolbox [5] to support a wider user base. MHKiT is hosted on GitHub, which allows anyone to ask questions or submit feature requests directly to the core developers. The core developers are funded through the DOE with staff from the National Renewable Energy Laboratory (NREL), the Pacific Northwest National Laboratory (PNNL), and Sandia National Laboratories (SNL). The core developers add functionality, maintain the code, and field feature requests and issues from the community.
This paper will demonstrate MHKiT’s capabilities to analyze empirical data taken at the University of Alaska Fairbank’s (UAF) Tanana River Test Site (TRTS) and use that data to verify a Delft3D numerical model of the site. The field and model data are first read in and processed, and then selected quantities of interest are taken and compared between the analyzed field and model data. The results can then be used to go back and improve the model. This type of analysis is a common model verification technique used to ensure that a numerical model is producing accurate results prior to manipulation of the domain, such as adding a Current Energy Converter (CEC) to the river. The analysis done for this paper finds the and error values between the field data and the modeled data. Using the MHKiT package allows for a seamless data comparison experience, as the user can run simulations and compare field data all within the same Python environment. The code and data for this analysis are available on the MHKiT Python GitHub as an interactive python notebook named “ADCP_Delft3D_TRTS_example.ipydb” located in the examples folder [6].
2. MHKiT Functionality and Structure
MHKiT is a toolbox designed for the marine energy industry to assist in data ingestion, processing, and visualization. The toolbox was initially released in January 2020 with modules helping users calculate and process data to the specifications detailed in the IEC standards. Additions to MHKiT follow a standard GitHub pull request workflow where the MHKiT core developers review new requests for correctness, tests, examples, and general applicability to the ME industry. If a user finds an issue with current MHKiT features, a bug report may be made and the core developers will address the error and deploy a fix. Sharing common functionality across the ME industry and having users submit features in issues builds up a knowledge base and toolkit, which saves current and future ME practitioners time and effort.
To expand the MHKIT functionality beyond the initial IEC-compliant scope, the MHKiT core developers incorporated previously developed software funded by the DOE, such as the Wave Design Resource Toolbox [7] and Doppler Oceanographic Library for pYthoN (DOLfYN) [8] into the toolkit. One benefit of MHKiT incorporation is access to MHKiT’s user base and code maintenance by the MHKiT team, ensuring simple package installation, functional features, and dependencies as the Python ecosystem evolves. Further, MHKiT gains access to any user base the project may have had and can cast a wider net of data analysis.
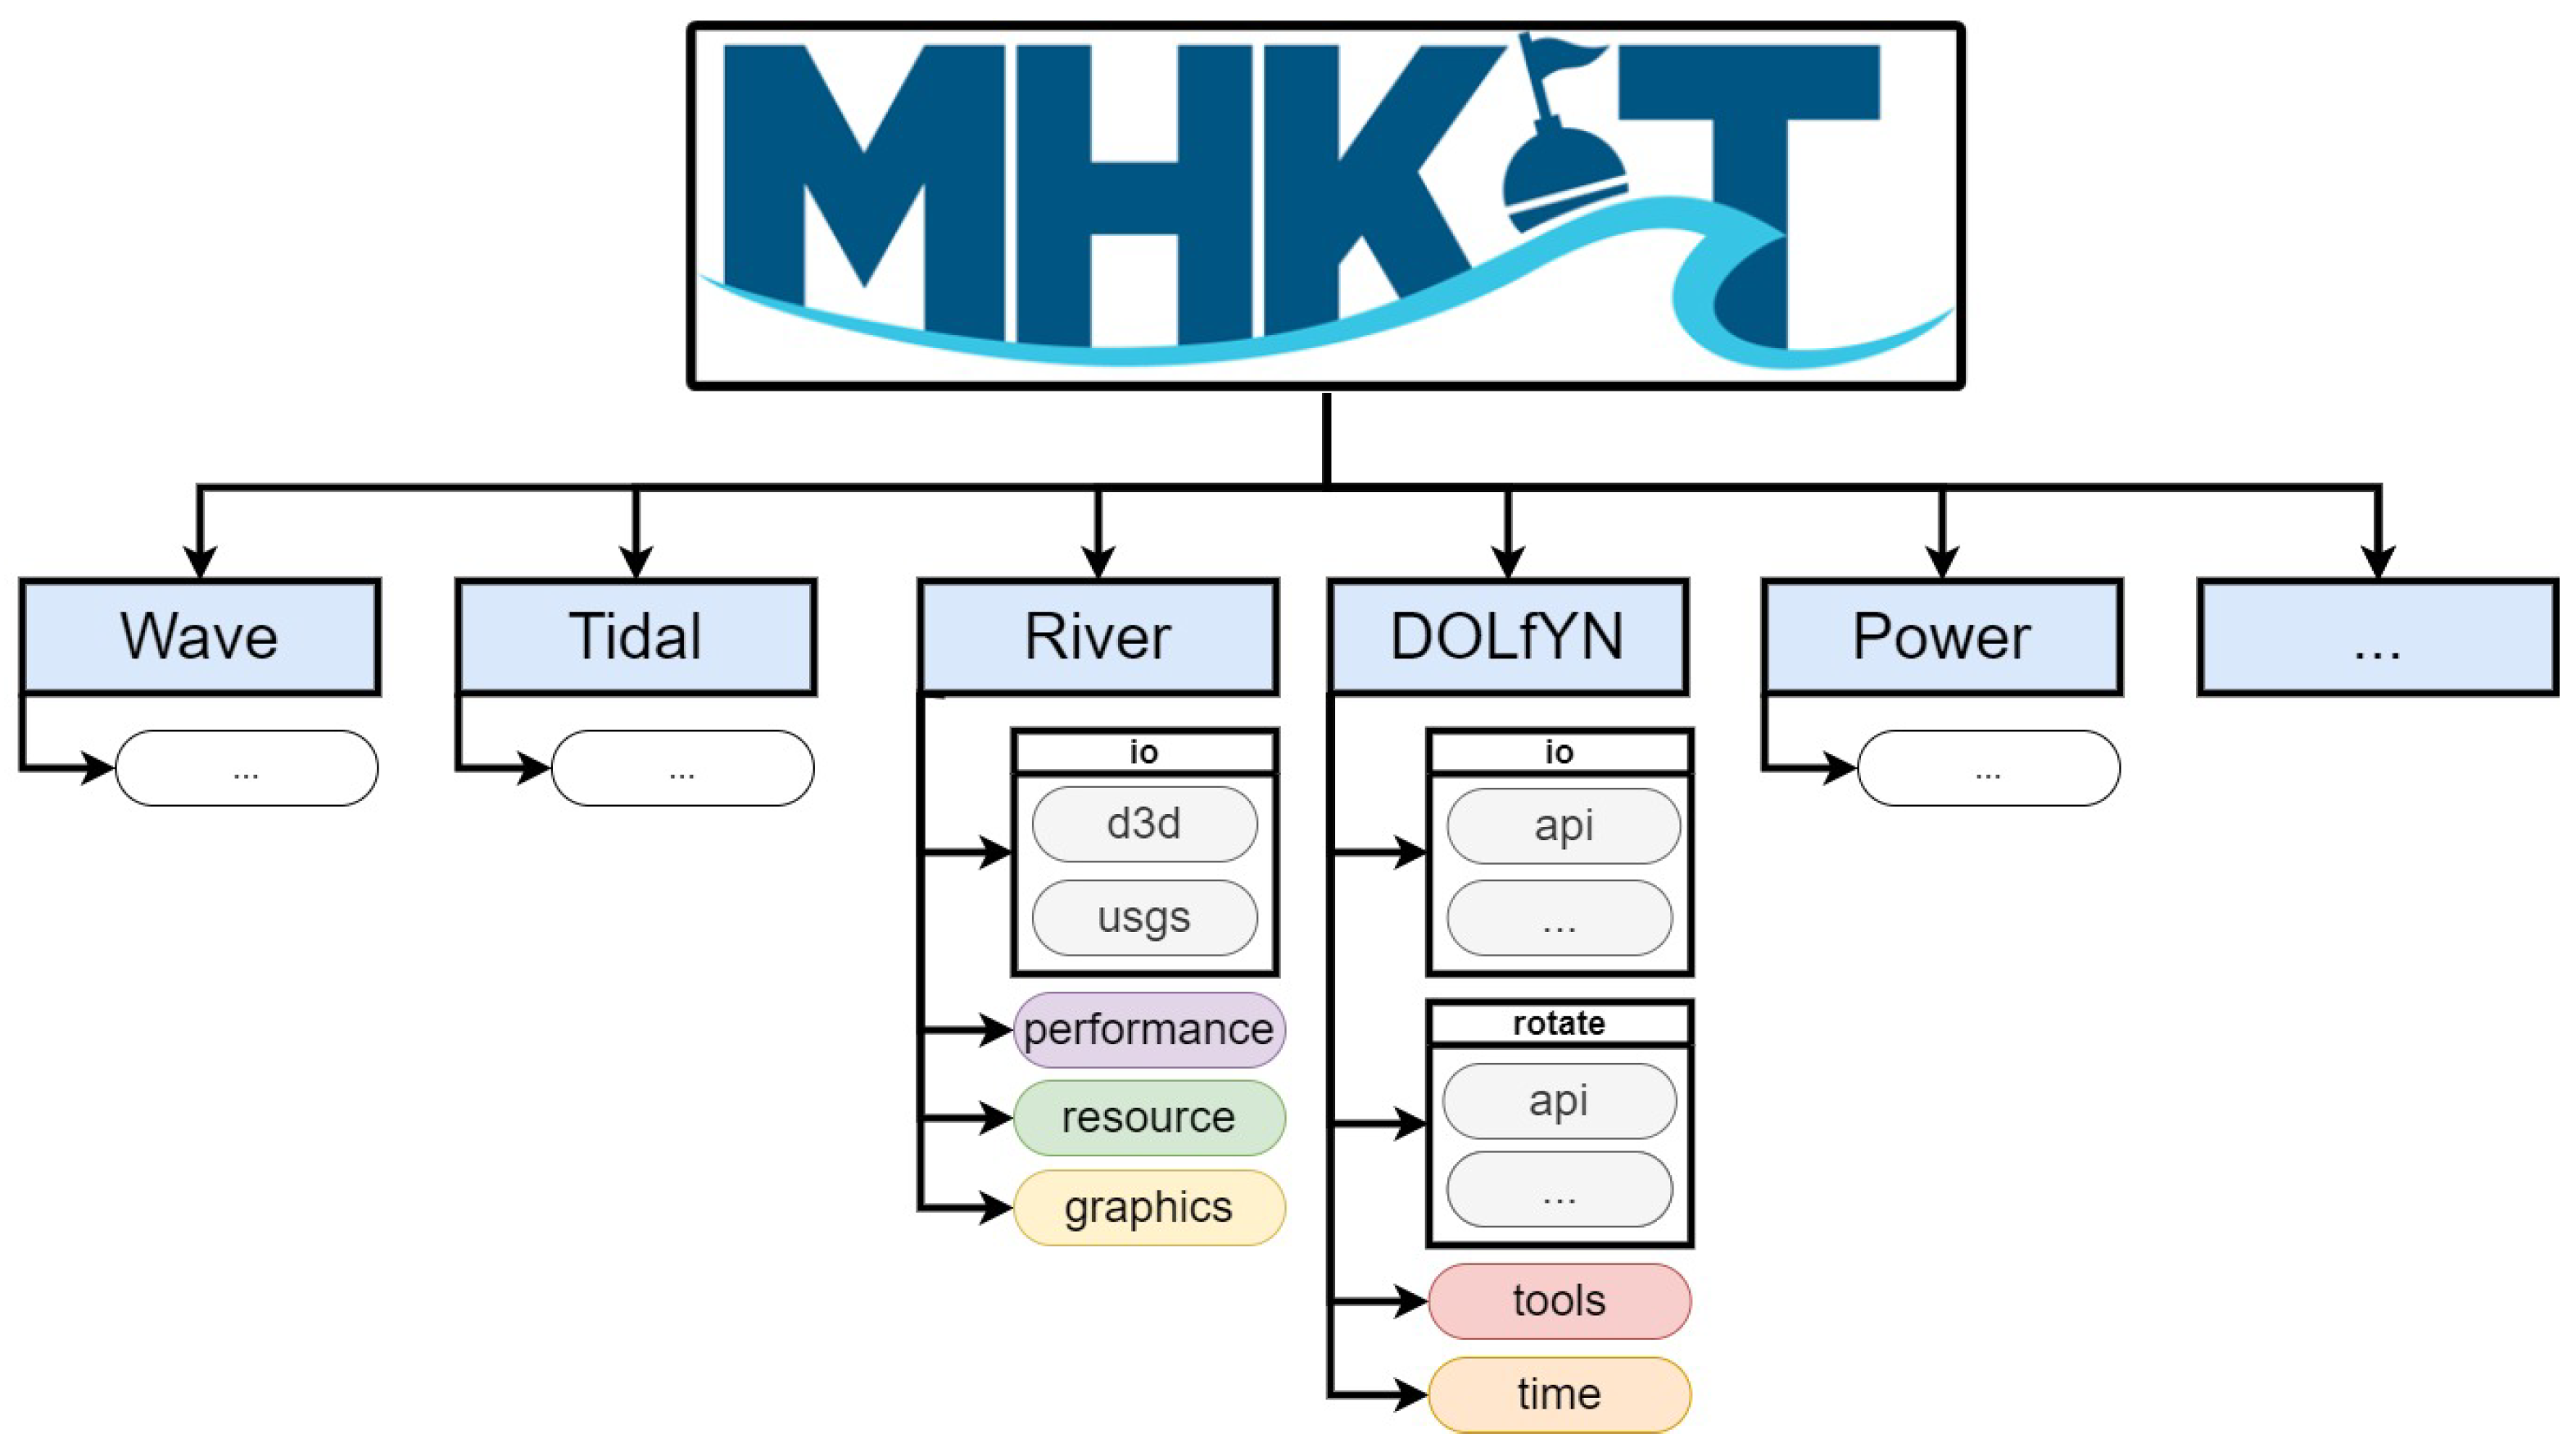
The MHKiT package is organized into modules containing tools for specific types of analysis (see Figure 1). The top-level modules now include Wave [9], Tidal [10], River, DOLfYN, Power, Loads, Quality Control, and Utilities. The three initial modules were organized by resource (Wave, River, and Tidal), each having “input/output (IO)”, “performance”, “resource”, and “graphics” submodules. Modules such as Power, Loads (not shown), and Quality Control (not shown) may apply to any resource and are therefore given their own modules. Olson et al. [11] discussed the package modules in more detail and demonstrated the use of MHKiT for wave resource characterization at PACWAVE, a wave energy converter test site in Oregon. Each module has an example that may be found in the MHKiT GitHub repository examples folder. Users may want to familiarize themselves with the River example, the Delft3D example, and the ADCP example, as components of each of these are expanded in the current study.
The River and DOLfYN modules, which are the focus of this paper, are used to perform the TRTS Delft3D model verification with Acoustic Doppler Current Profiler (ADCP) field data. The River IO submodule has the functionality to ingest and process data from Delft3D and United States Geological Survey (USGS) survey stations. The USGS ingestion tool is used to read in discharge, and water-height measurements at the USGS station near the TRTS on the day the filed data was collected. The DOLfYN IO module has the capability to read, filter, and process ADCP and Acoustic Doppler Velocimeter (ADV) data. The DOLfYN “rotate” module can rotate the data to beam coordinates, instrument (x and y) coordinates, or Earth coordinates (longitude and latitude). The use case demonstrated in this paper will showcase DOLfYN’s riverine applications and how they can be compared to simulated results from the River module.
3. Data Collection and Model Design
The TRTS is located near Nenana, Alaska, and was first investigated as a test site in 2008 after a CEC deployment in Eagle, Alaska ended early due to debris-related issues [12]. Since then, it has become an established test site with modular deployment infrastructure that can be adapted for different CEC deployments [13,14]. The TRTS allows CECs to be tested in a harsh environment with cold temperatures, sediment, and heavy debris, representing the conditions of many remote Alaska river communities that could greatly benefit from ME [12]. The site is shown in Figure 2, with current flowing up from the bottom of the figure, the two transect locations at TRTS, and the barge used to block debris and deploy test turbines. The United States Geological Survey [15] has a nearby survey station (#15515500) downstream of the TRTS, which records discharge and water level. Data from USGS survey stations can be requested through the the MHKiT River module, as demonstrated in the river example [16].
Typically, researchers use a modeling tool such as Deflt3D which, relative to field deployments, can perform low-cost simulations where changes to the environment can be implemented and interpreted quickly. This allows researchers to narrow in on a limited design set for field investigation, thereby increasing the efficiency of field deployments. To initiate the numerical model, a 2010 bathymetry survey taken by Terrasond under contract to the University of Alaska Fairbanks (UAF) was used to represent the domain. This domain was discretized using the Delft3D built-in mesh generation tool, RGF grid, to roughly 5 m × 5 m unstructured squares from a bird’s eye view. Delft3D represents depth using shallow water equations with a sigma layer approach, which distributes the layers between the specified bottom of the river and the water level. A total initial 12 sigma layers were specified to compare to the filed data for this study. The domain was simulated in Delft3D at a constant discharge (volumetric flow rate) of 1789 m/s and a 2.7 m water level, as recorded by the USGS survey station for 10 August 2010 [17]. The USGS discharge was confirmed with the ADCP transect data measured at 1790 m/s using the deployment software Winriver from Teledyne RD Instruments (TRDI) [2]. This functionality is in the process of being added to MHKiT.
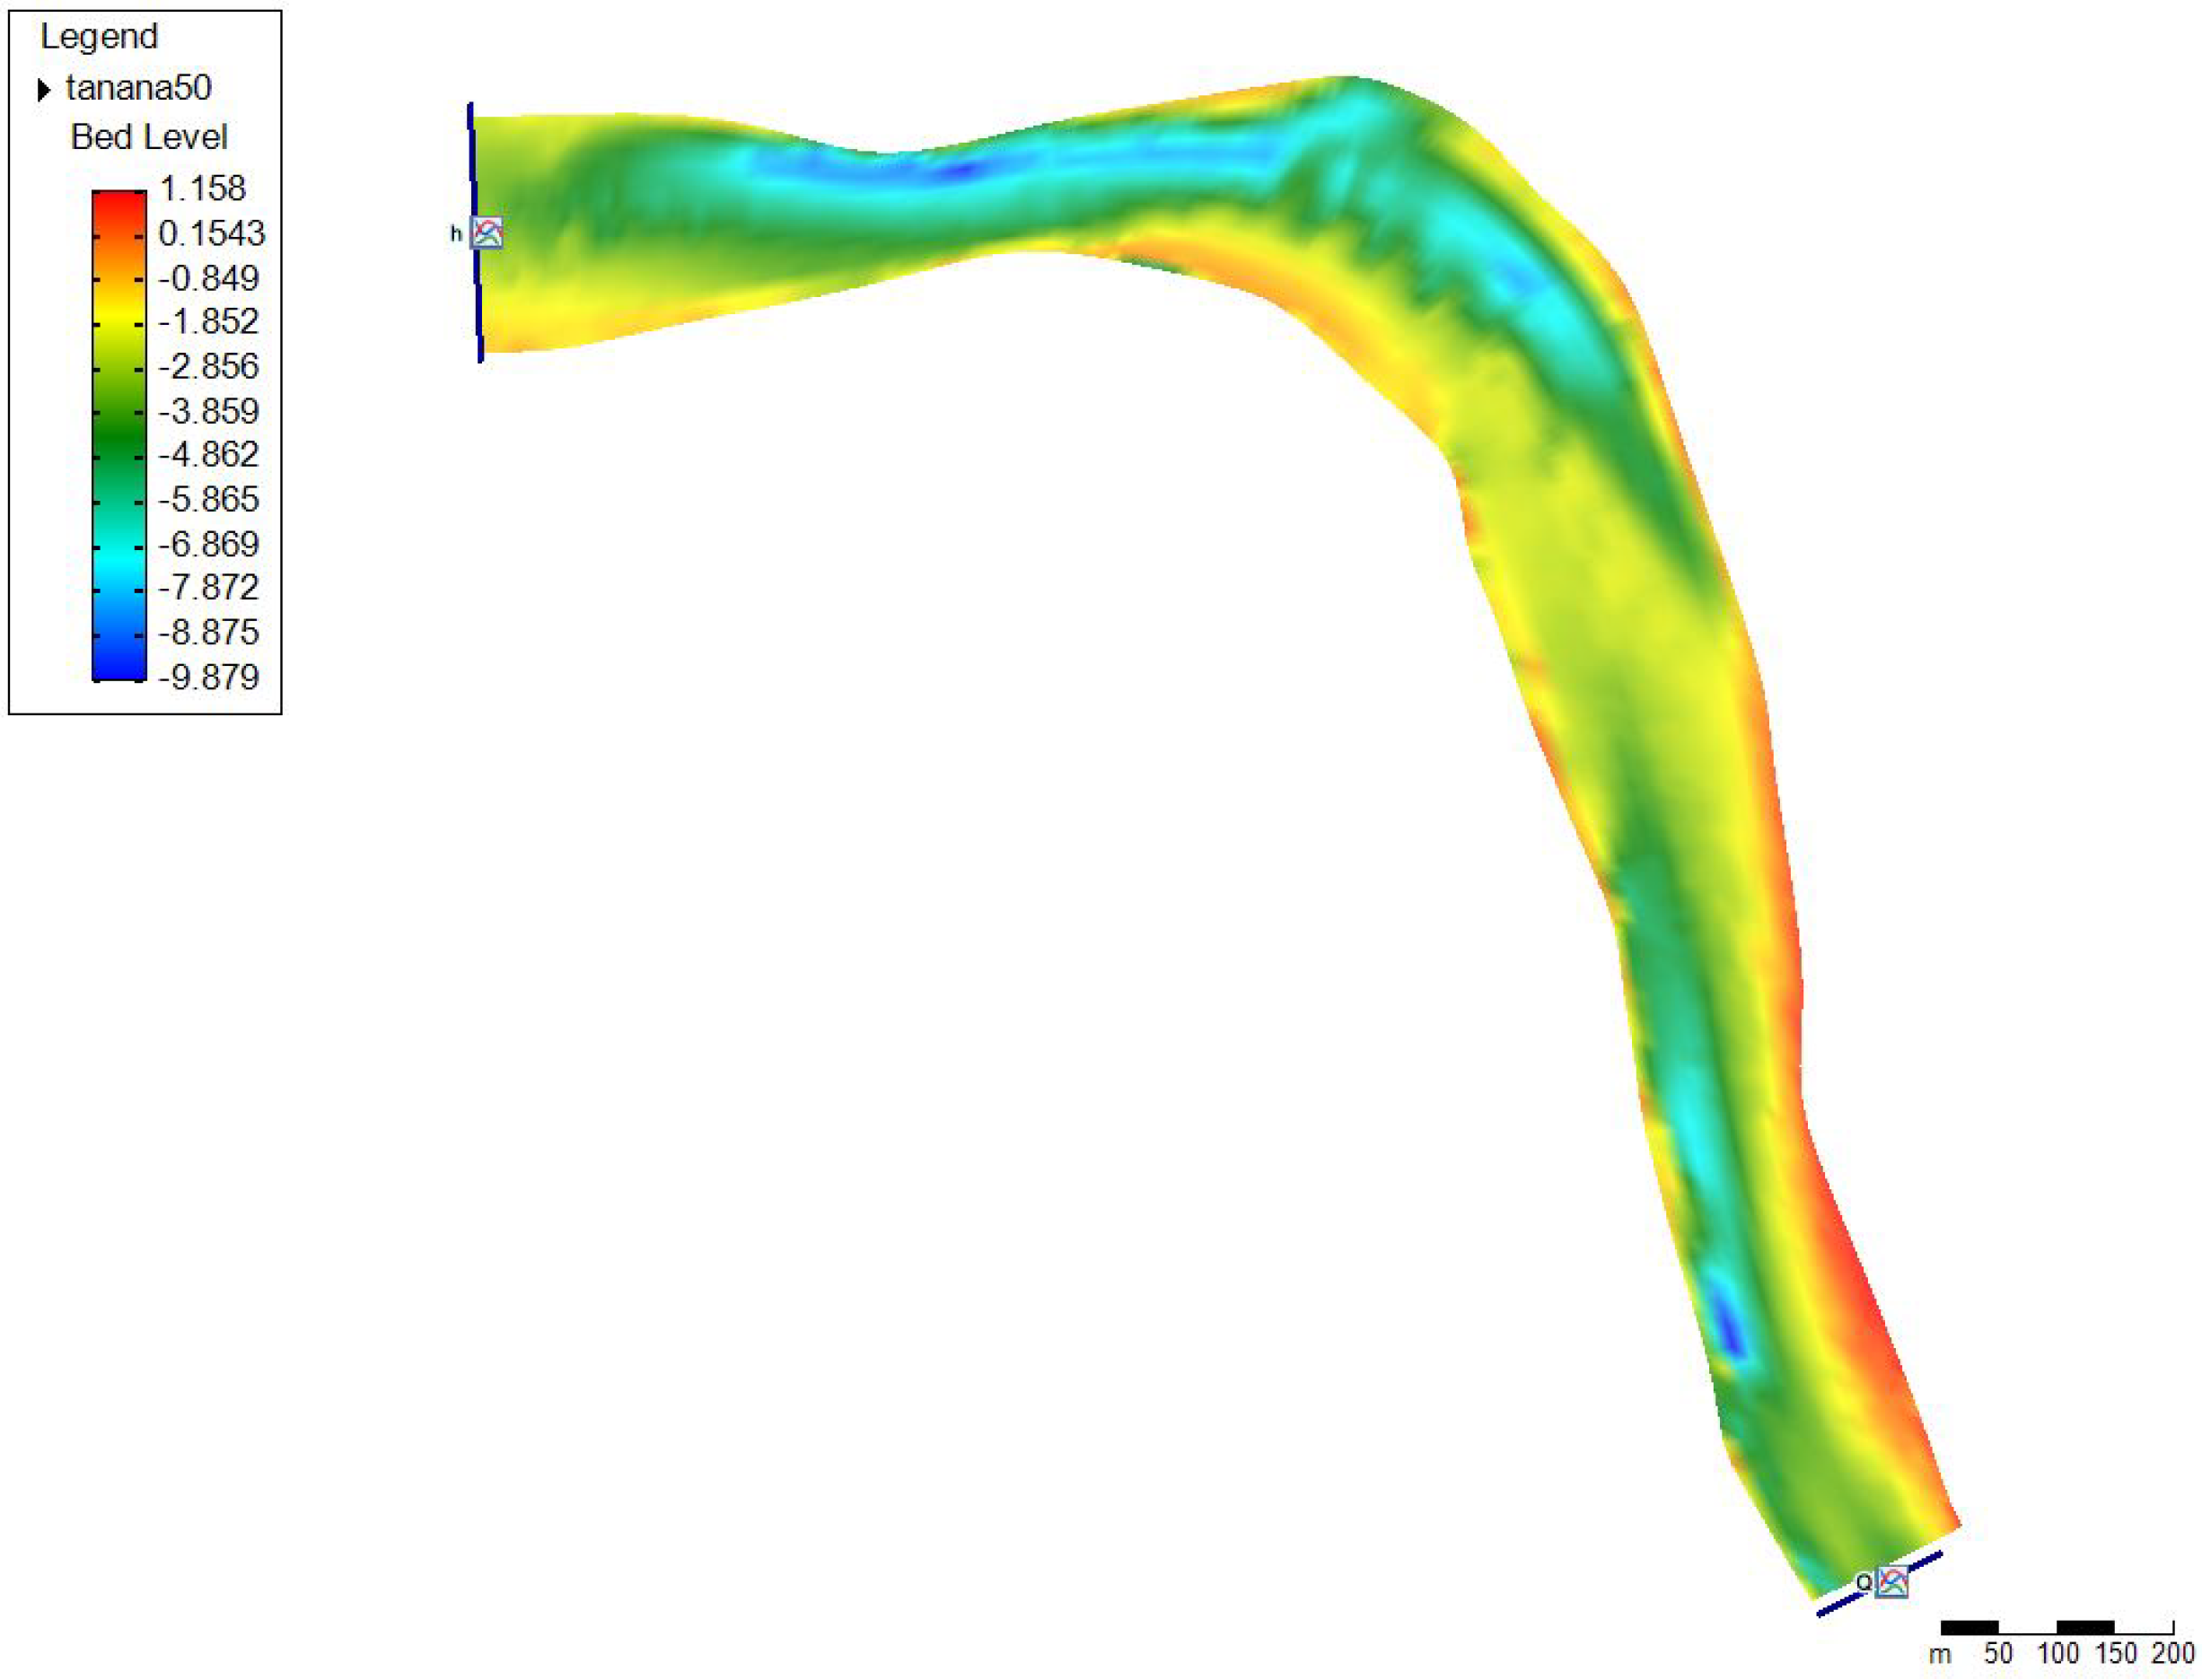
Figure 3 shows the bed level used in Delft3D for modeling, which was collected for UAF in 2010. As shown in Figure 2 previously the flow direction in our Delft3D model is from the bottom of the figure, up and to the left out of the figure. The inlet, at the bottom right of the figure, was set to a constant discharge of 1789 m/s, and the outlet, at the top left of the figure, was set to a constant water level of 2.7 m. These values are used as a starting point to model the TRTS based on the USGS survey station downstream of the outlet in Figure 3 [15]. As the USGS site is downstream it is a good estimate but not a perfect representation. Collecting the ADCP transect and comparing it to the model provides the information needed to fine-tune the Delft3D model.
The boat track for the bow-mounted ADCP transects were taken at the locations shown in Figure 2 on 10 August 2010. In this study, the data collected from them will be used to improve and tune the Delft3D model. MHKiT will be particularly useful here because the USGS data and the Delft3D results can be processed using the river module, and the ADCP results can be processed using the DOLfYN module.
4. Application and Demonstration
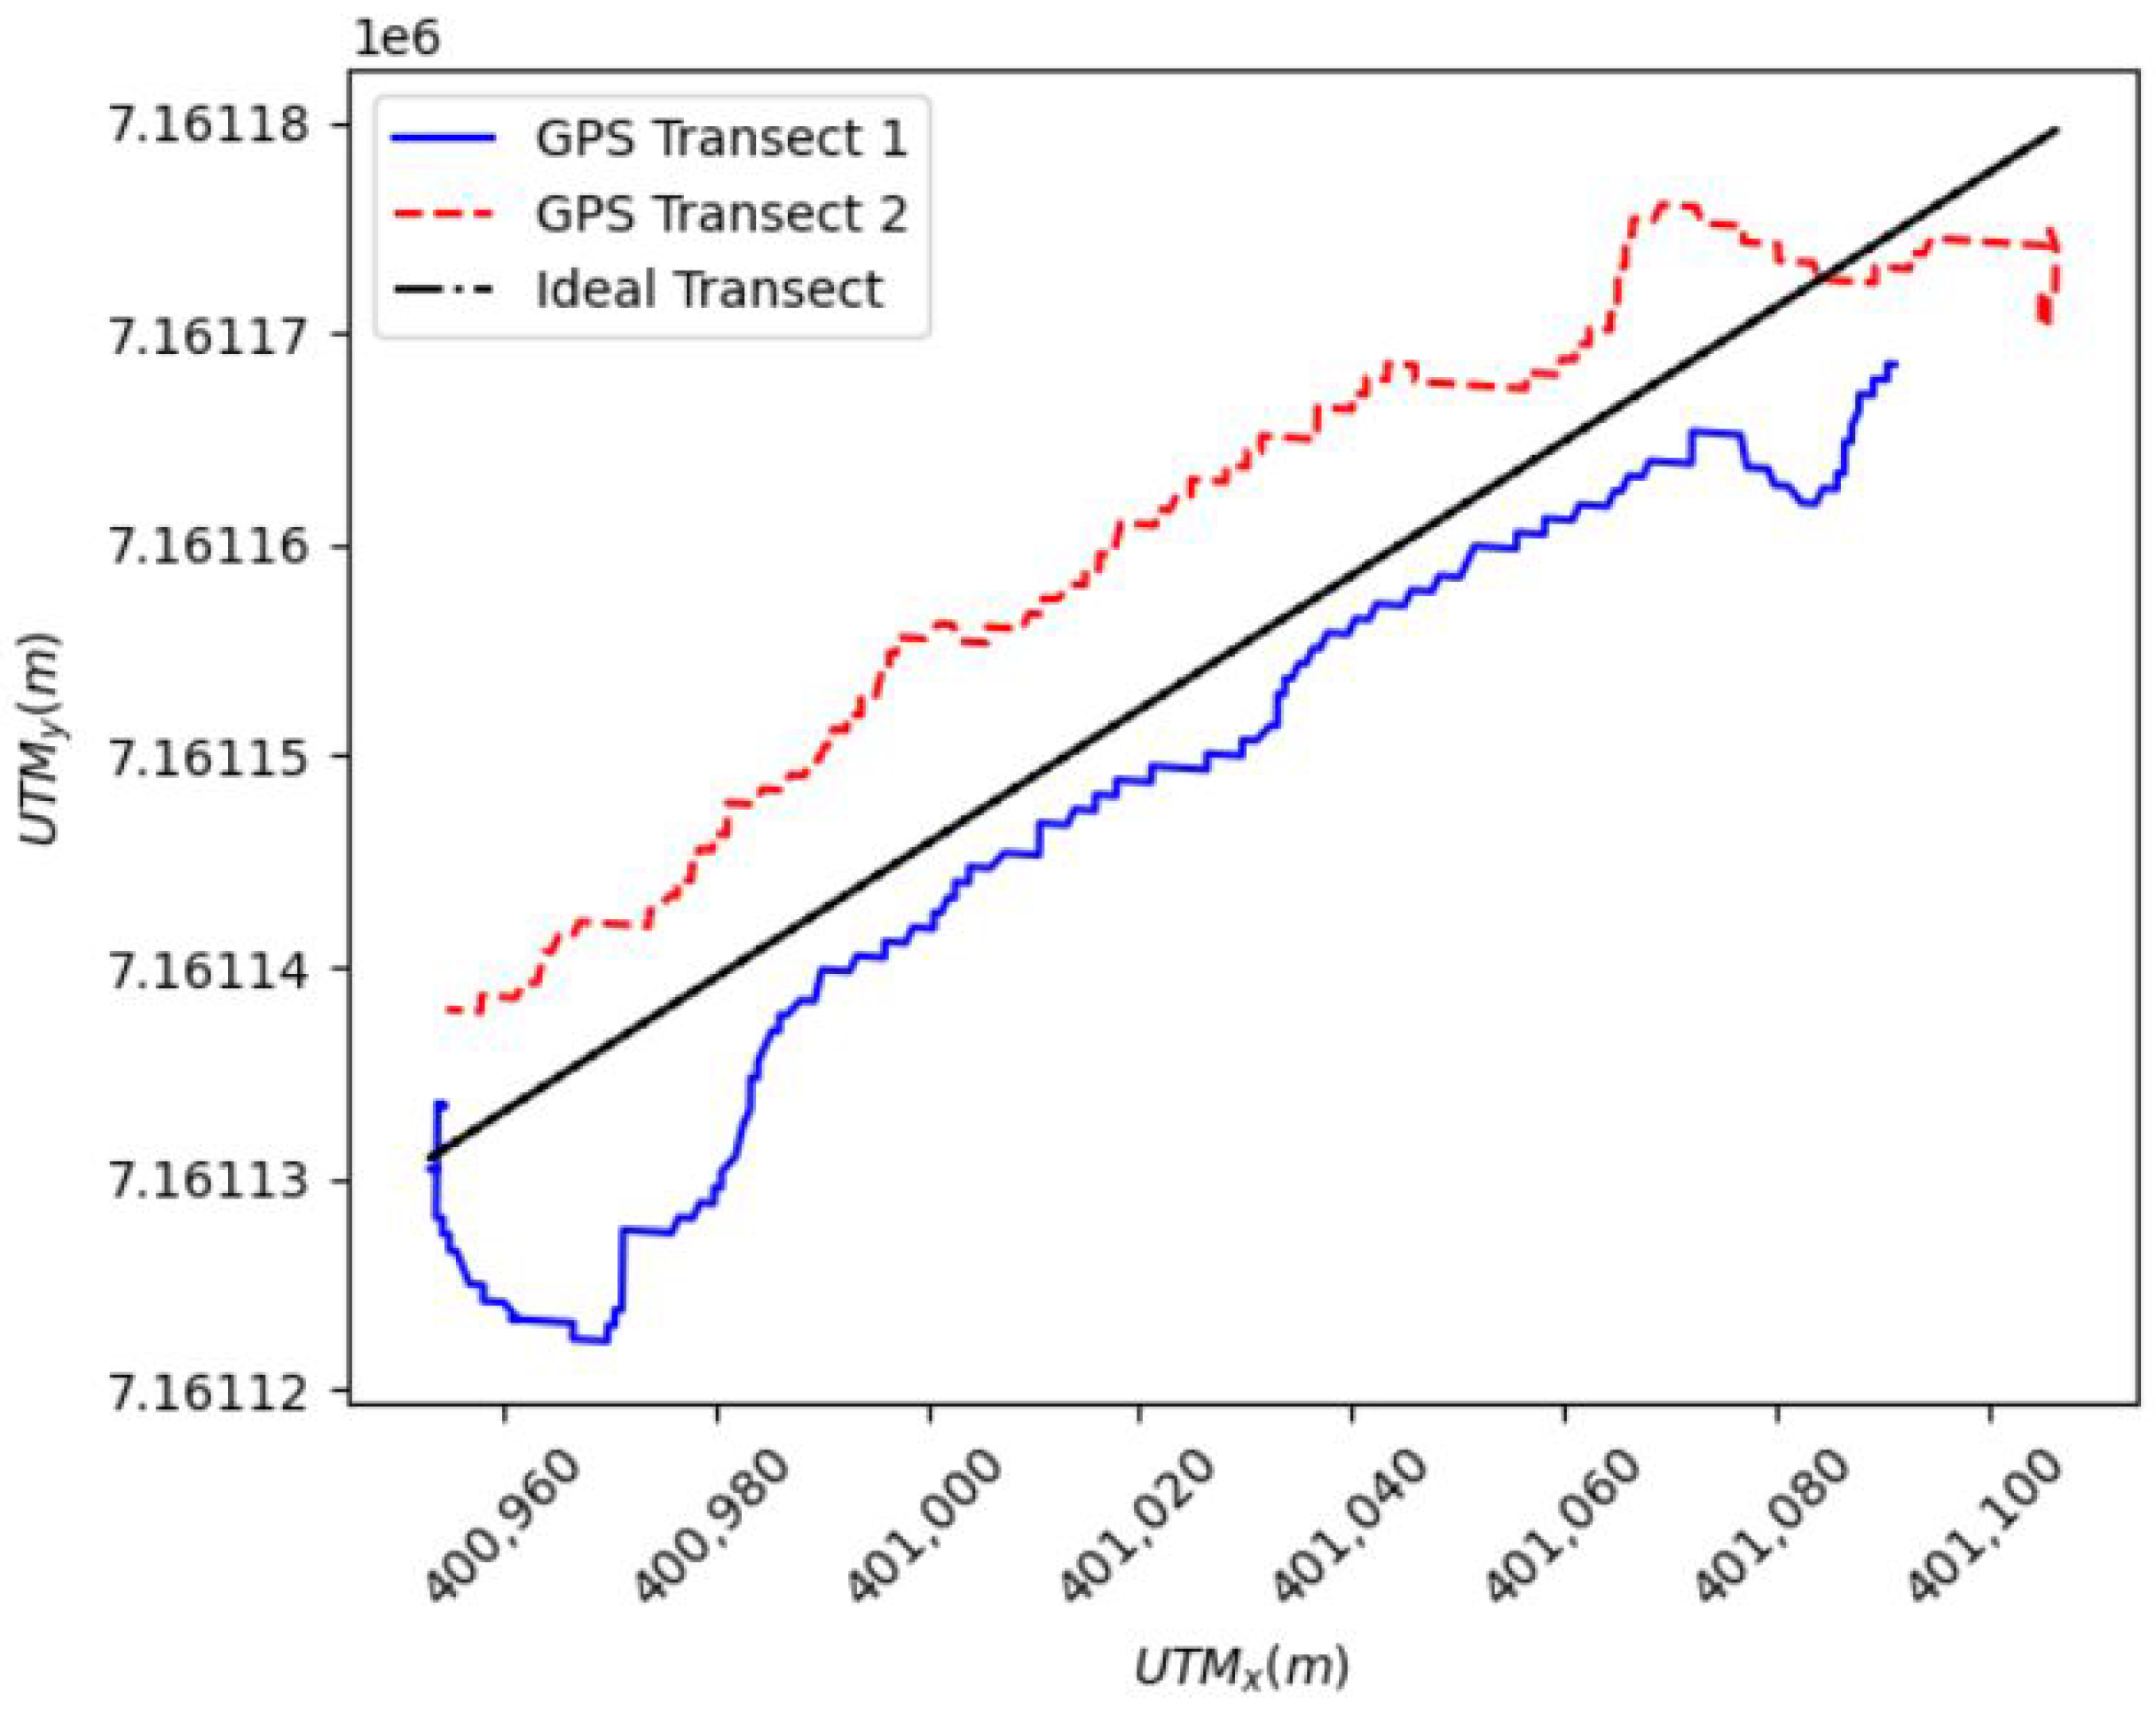
To perform a comparison between the vessel transect and the corresponding slice of the Delft3D model results, an “ideal transect”—defined as a straight path perpendicular to the streamwise flow direction—was interpolated from the vessel’s ADCP and GPS data. This ideal transect determines a linear boat track from the forward and backward passes of the vessel’s path, shown in Figure 4.
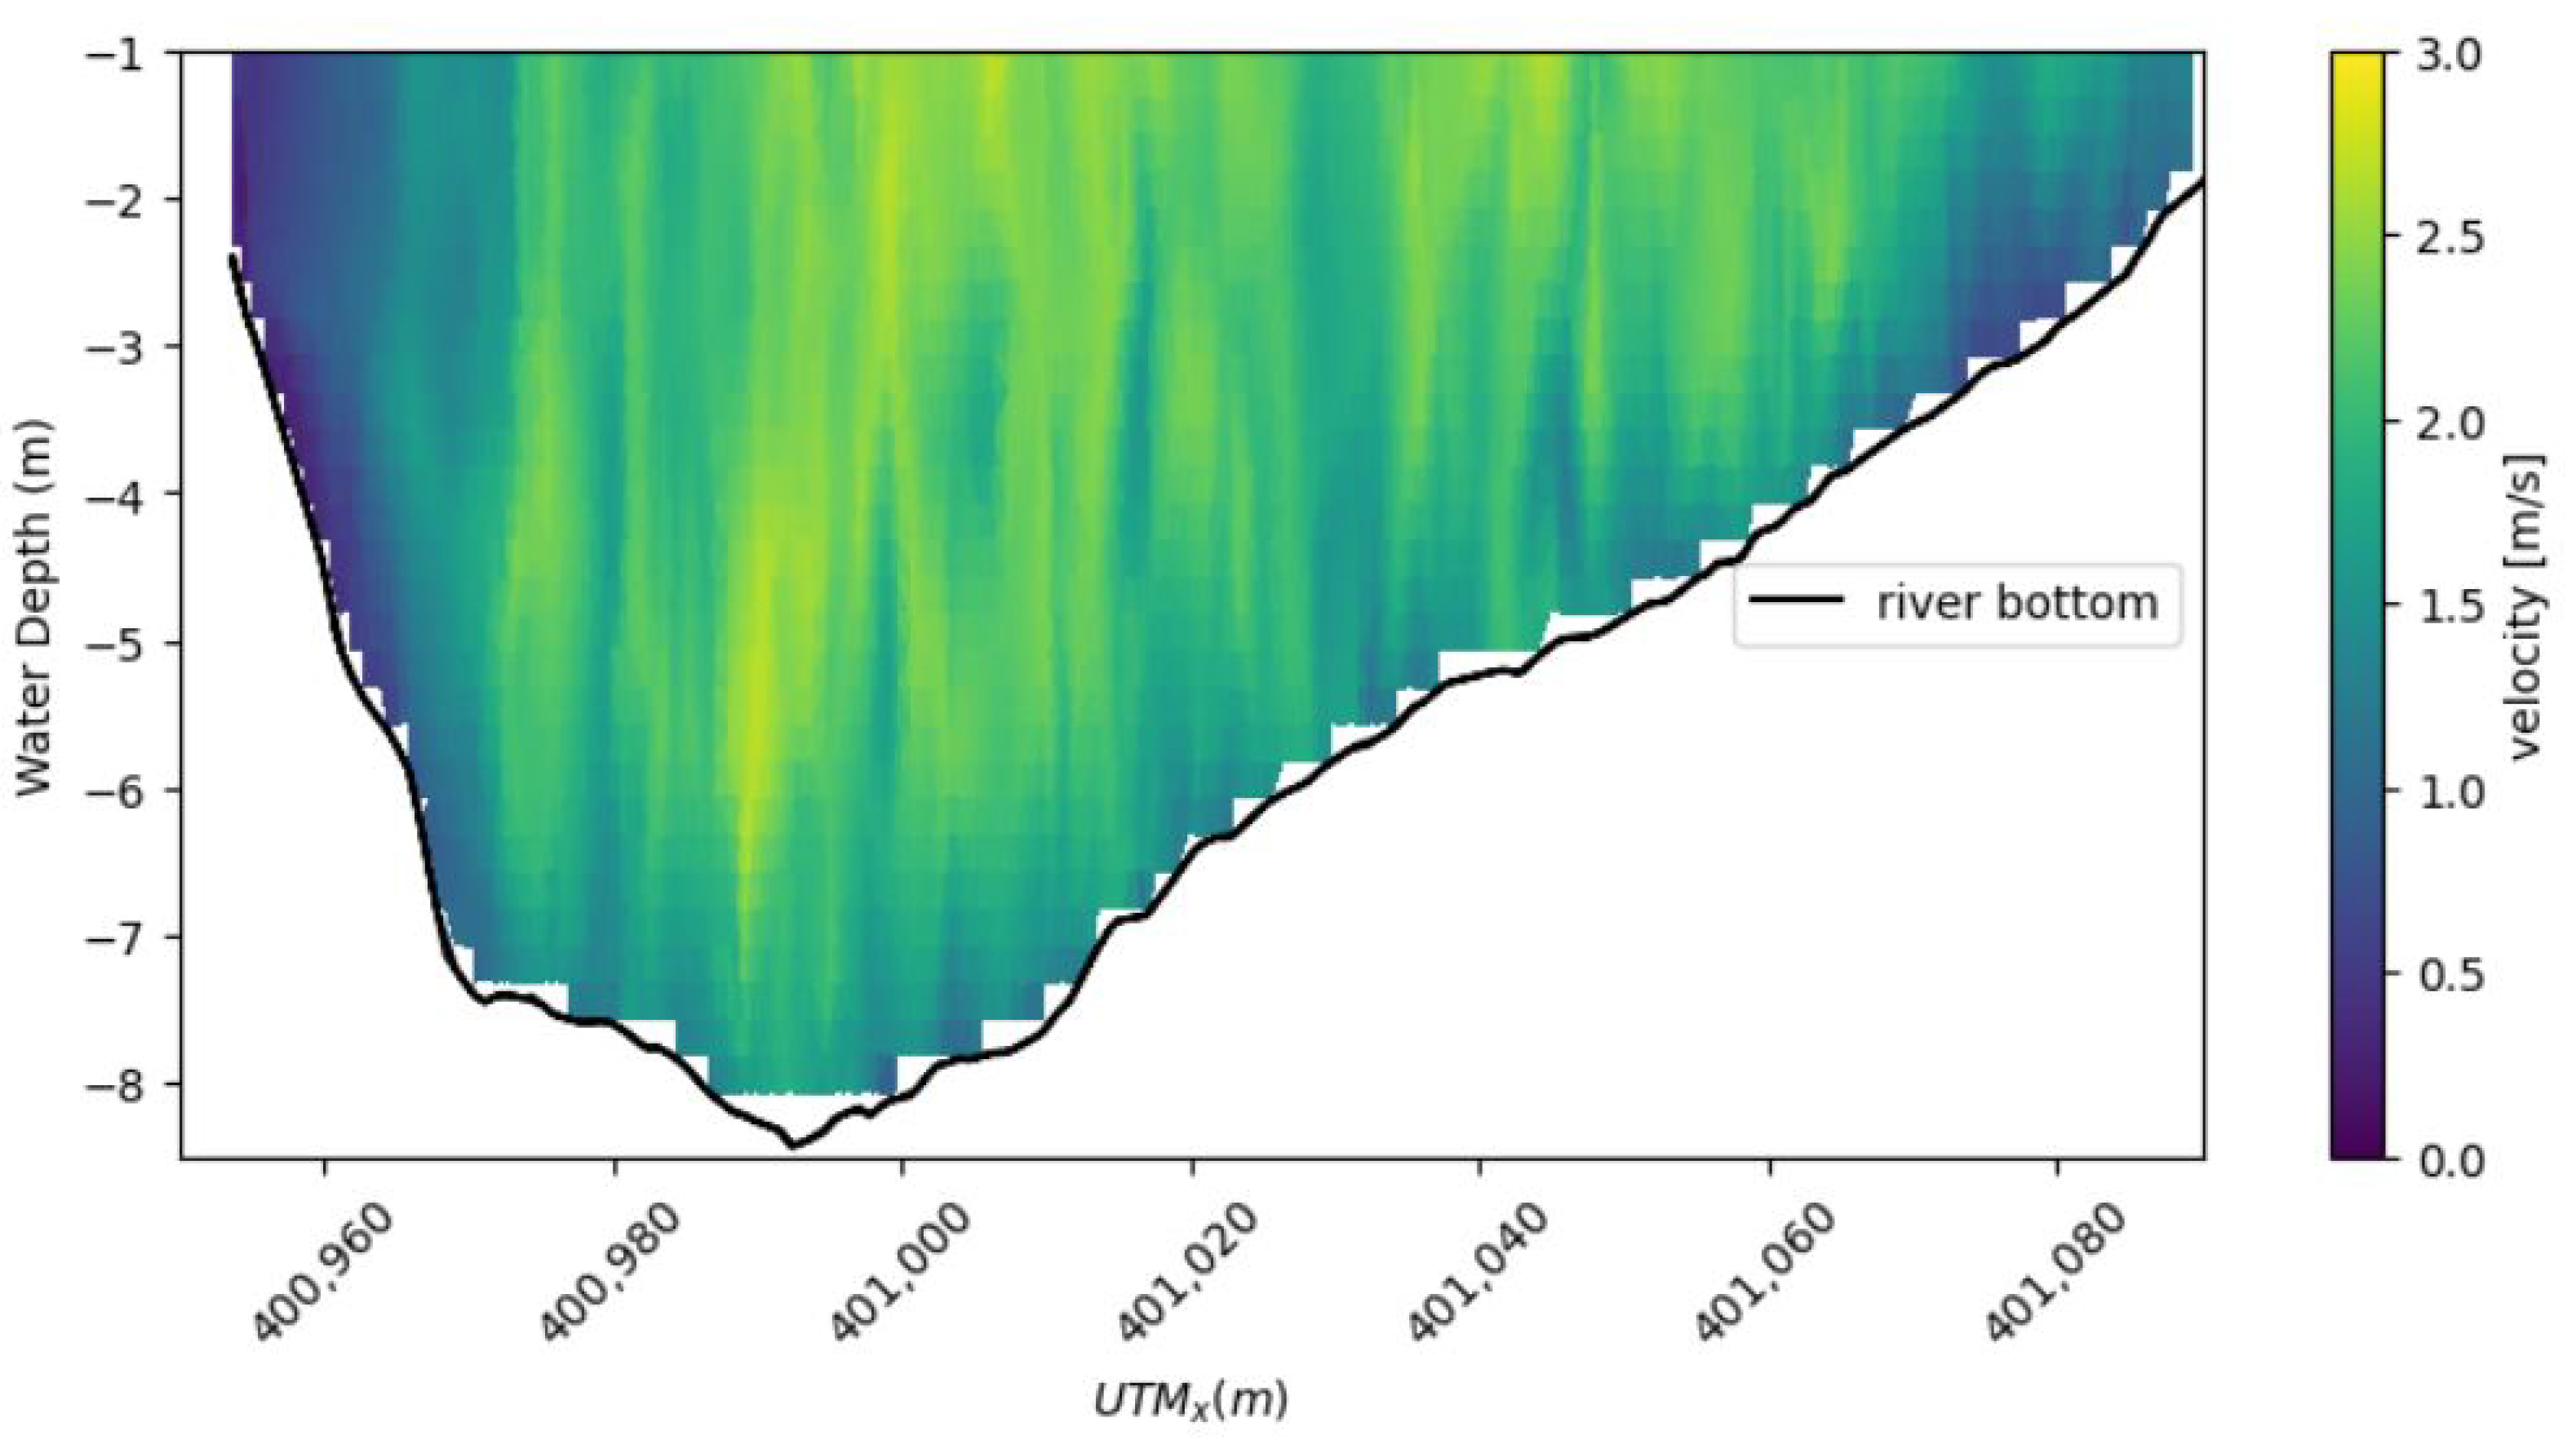
The ADCP data creating this transect requires processing before comparing it to other data. Here, the MHKiT DOLfYN module’s analysis functionality was used to process and plot the ideal transect velocity from the field data shown in Figure 5. The analysis consisted of applying quality control by filtering the data for low acoustic correlation, setting the instrument depth below the surface, removing riverbed interference, correcting the coordinate directions for magnetic declination, and finally rotating the data into the earth coordinate system. The minimum correlation was set to 40 “counts” and the declination was set to 15.7 deg East for Nenana Alaska on 10 August 2010.
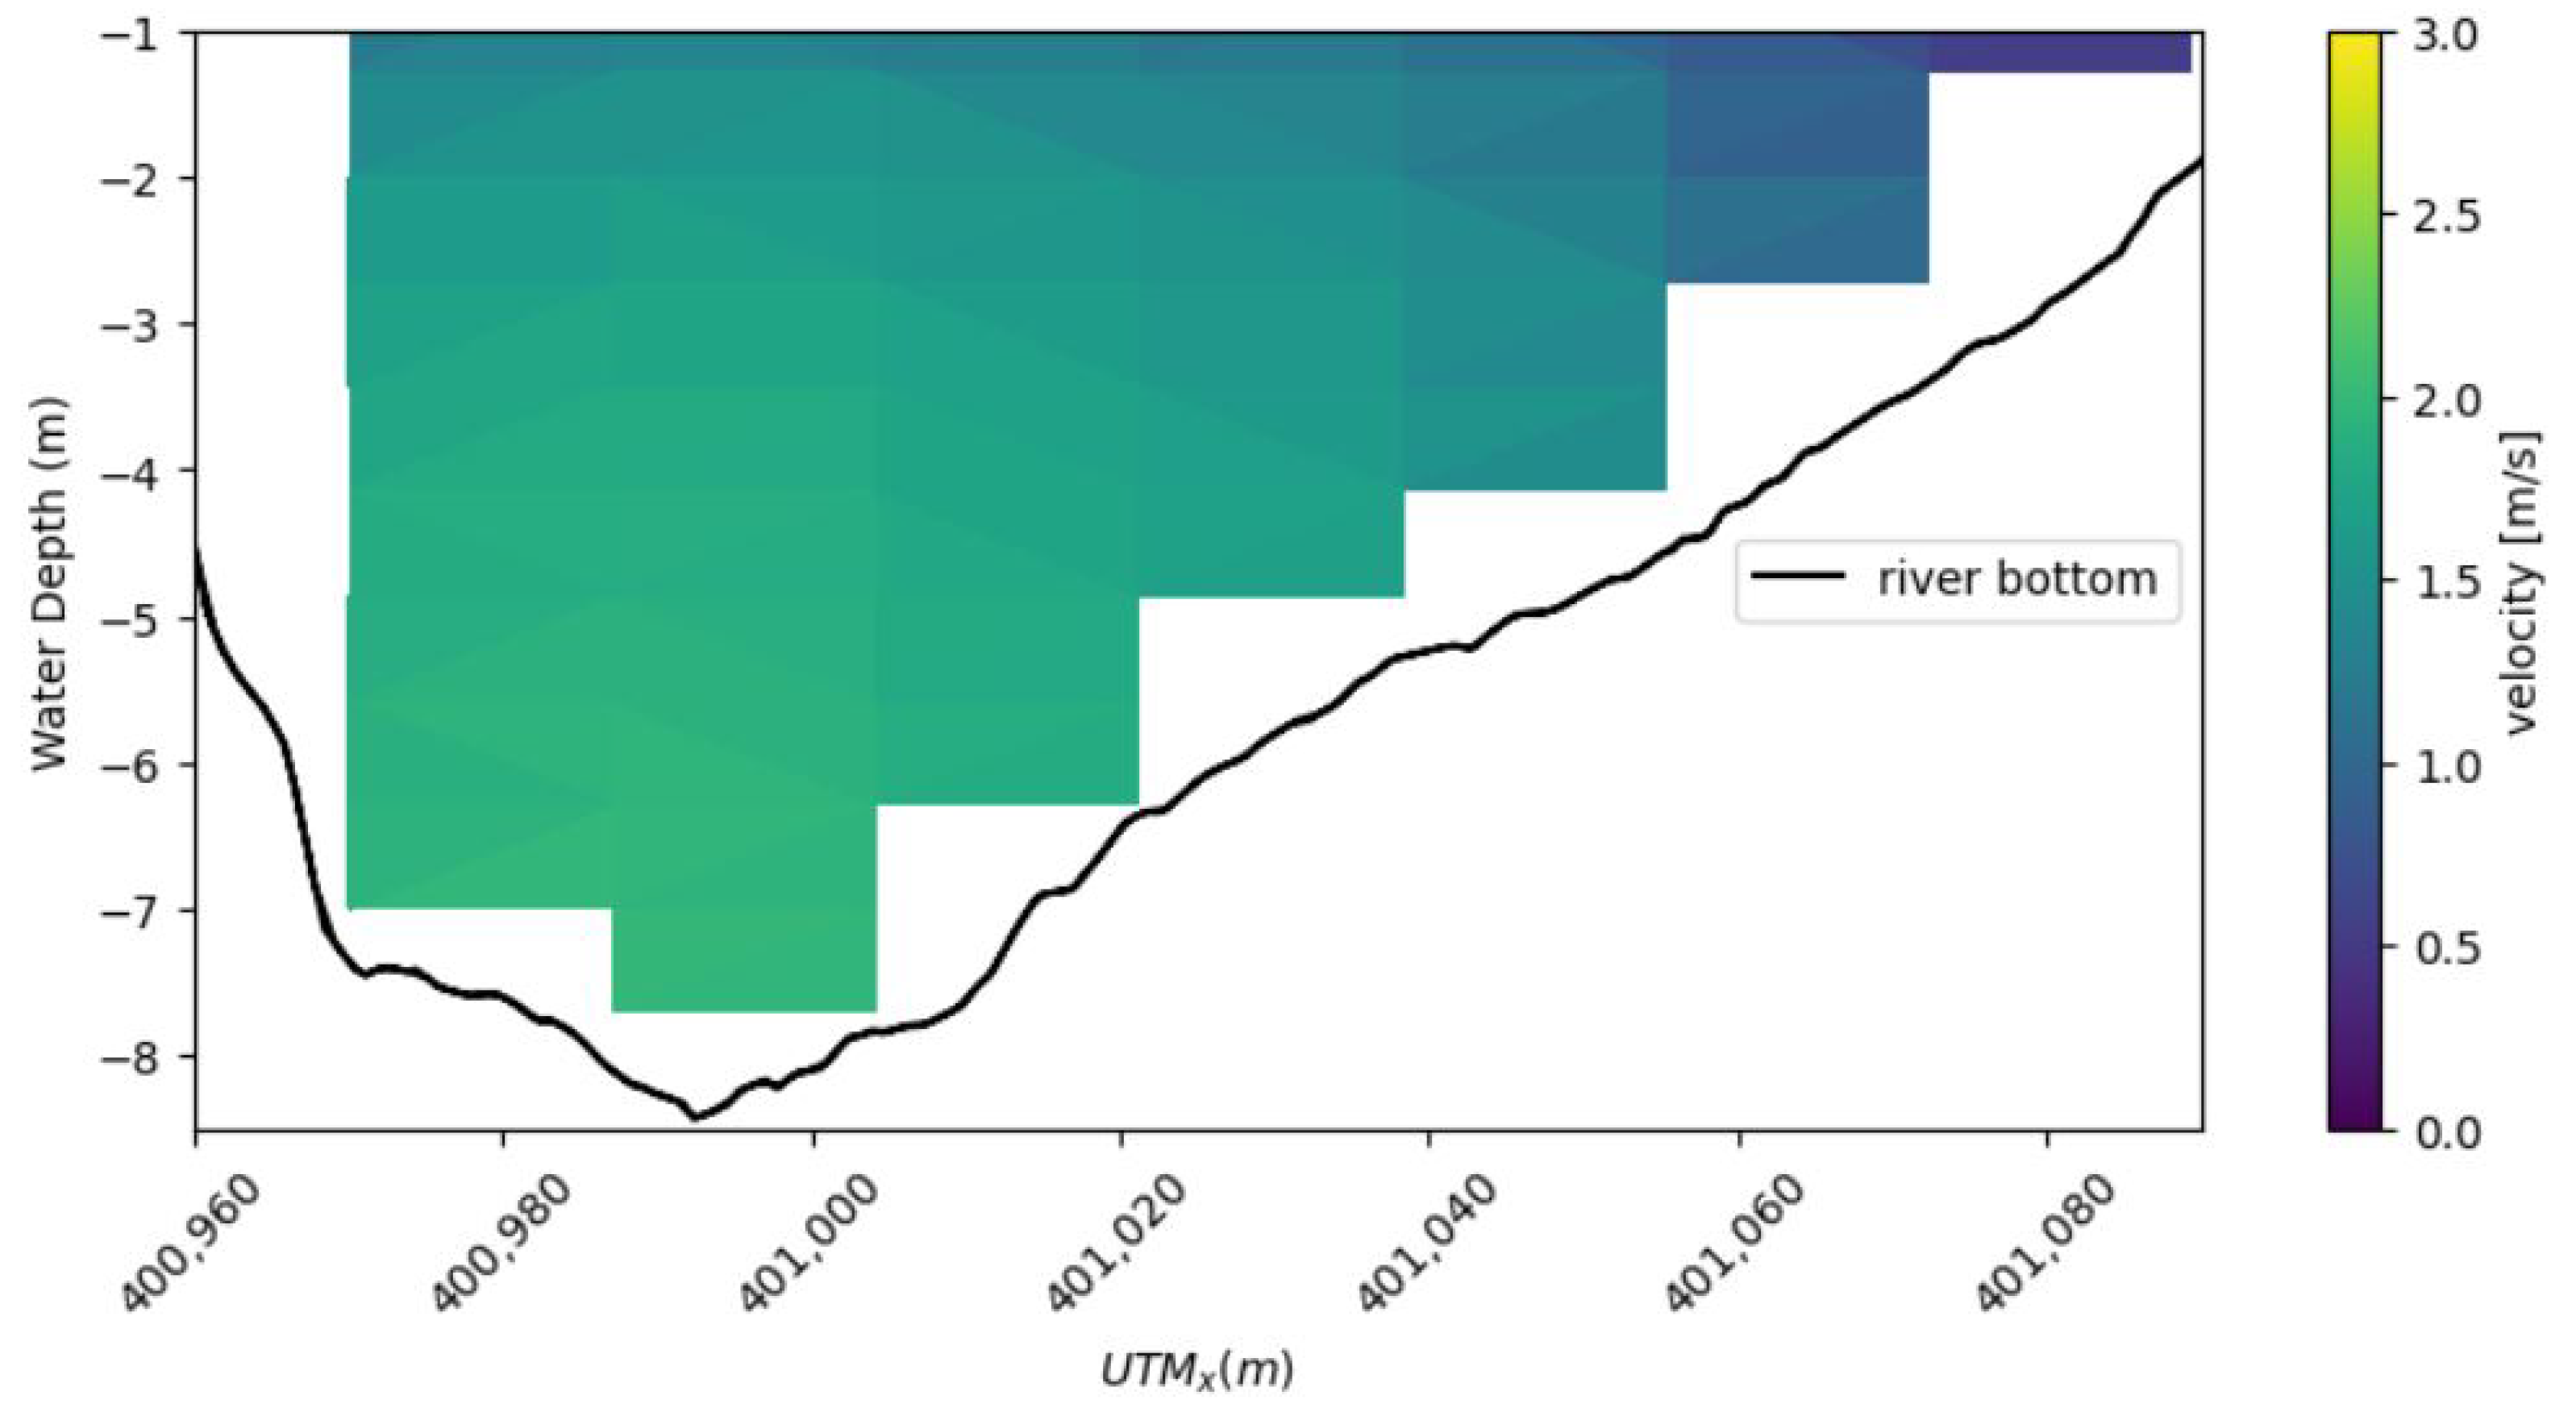
The MHKiT DOLfYN module has the functionality to find the river bottom based on the along-beam acoustic amplitude data or bottom track data recorded from the ADCP. However, if depth sounder data is available, it can be more reliable at representing the river bottom [18,19]. For this case, a depth sounder measured the depth of the river simultaneously with the ADCP data collection. From the processed data, we can plot the measured velocity along the ideal transect of the river and show the calculated river bottom, as in Figure 5. This velocity contour plot shows the maximum velocity of 3 m/s at the center of the river, as we would expect. The lowest velocities, 0 m/s, are primarily observed around the edges and bottom of the transect contour.
Numerical models such as Delft3D use discretized points to represent the domain. Environmental models tend to have a low number of points to represent large continuous areas. For instance, the bird’s eye view of Delft3D only calculated numerical effects at a roughly 5 m by 5 m square. Delft3D then discretizes the depth with an even percentage from the water level to the bed by 12 layers as specified for this initial case. As the collected ADCP data had far more resolution than the numerical model, down-sampling was applied using an average to match the locations at which the Delft3D model returned data. This roughly equated to 10 velocity measurements spanning the width of the river, as shown in Figure 6. The data displayed in Figure 6 can be seen as much coarser as compared to the full data set obtained in the field. For comparison, the river bottom is maintained constant as well as the bounds of the contour plot used in Figure 5.
With the ADCP data prepared, the next step of the numerical model validation was to use the MHKiT River module to read and analyze Delft3D results using the same points as the down-sampled ADCP data. The process of reading in Delft3D data is as simple as loading the MHKiT module and specifying the Delft3D data location. The process is covered in the MHKiT GitHub repository [6]. With the data ingested, a set of sample points from the down-sampled ADCP data was passed to interpolate the simulated velocity. The results of this call are shown in Figure 7. For comparison, the river bottom is maintained constant as well as the bounds of the contour plot used in Figure 5. It should be noted that in Delft3D, the bottom of the river is constant for a given cell, meaning the stair-step structure of the plotted data is equivalent to the modeled domain bottom.
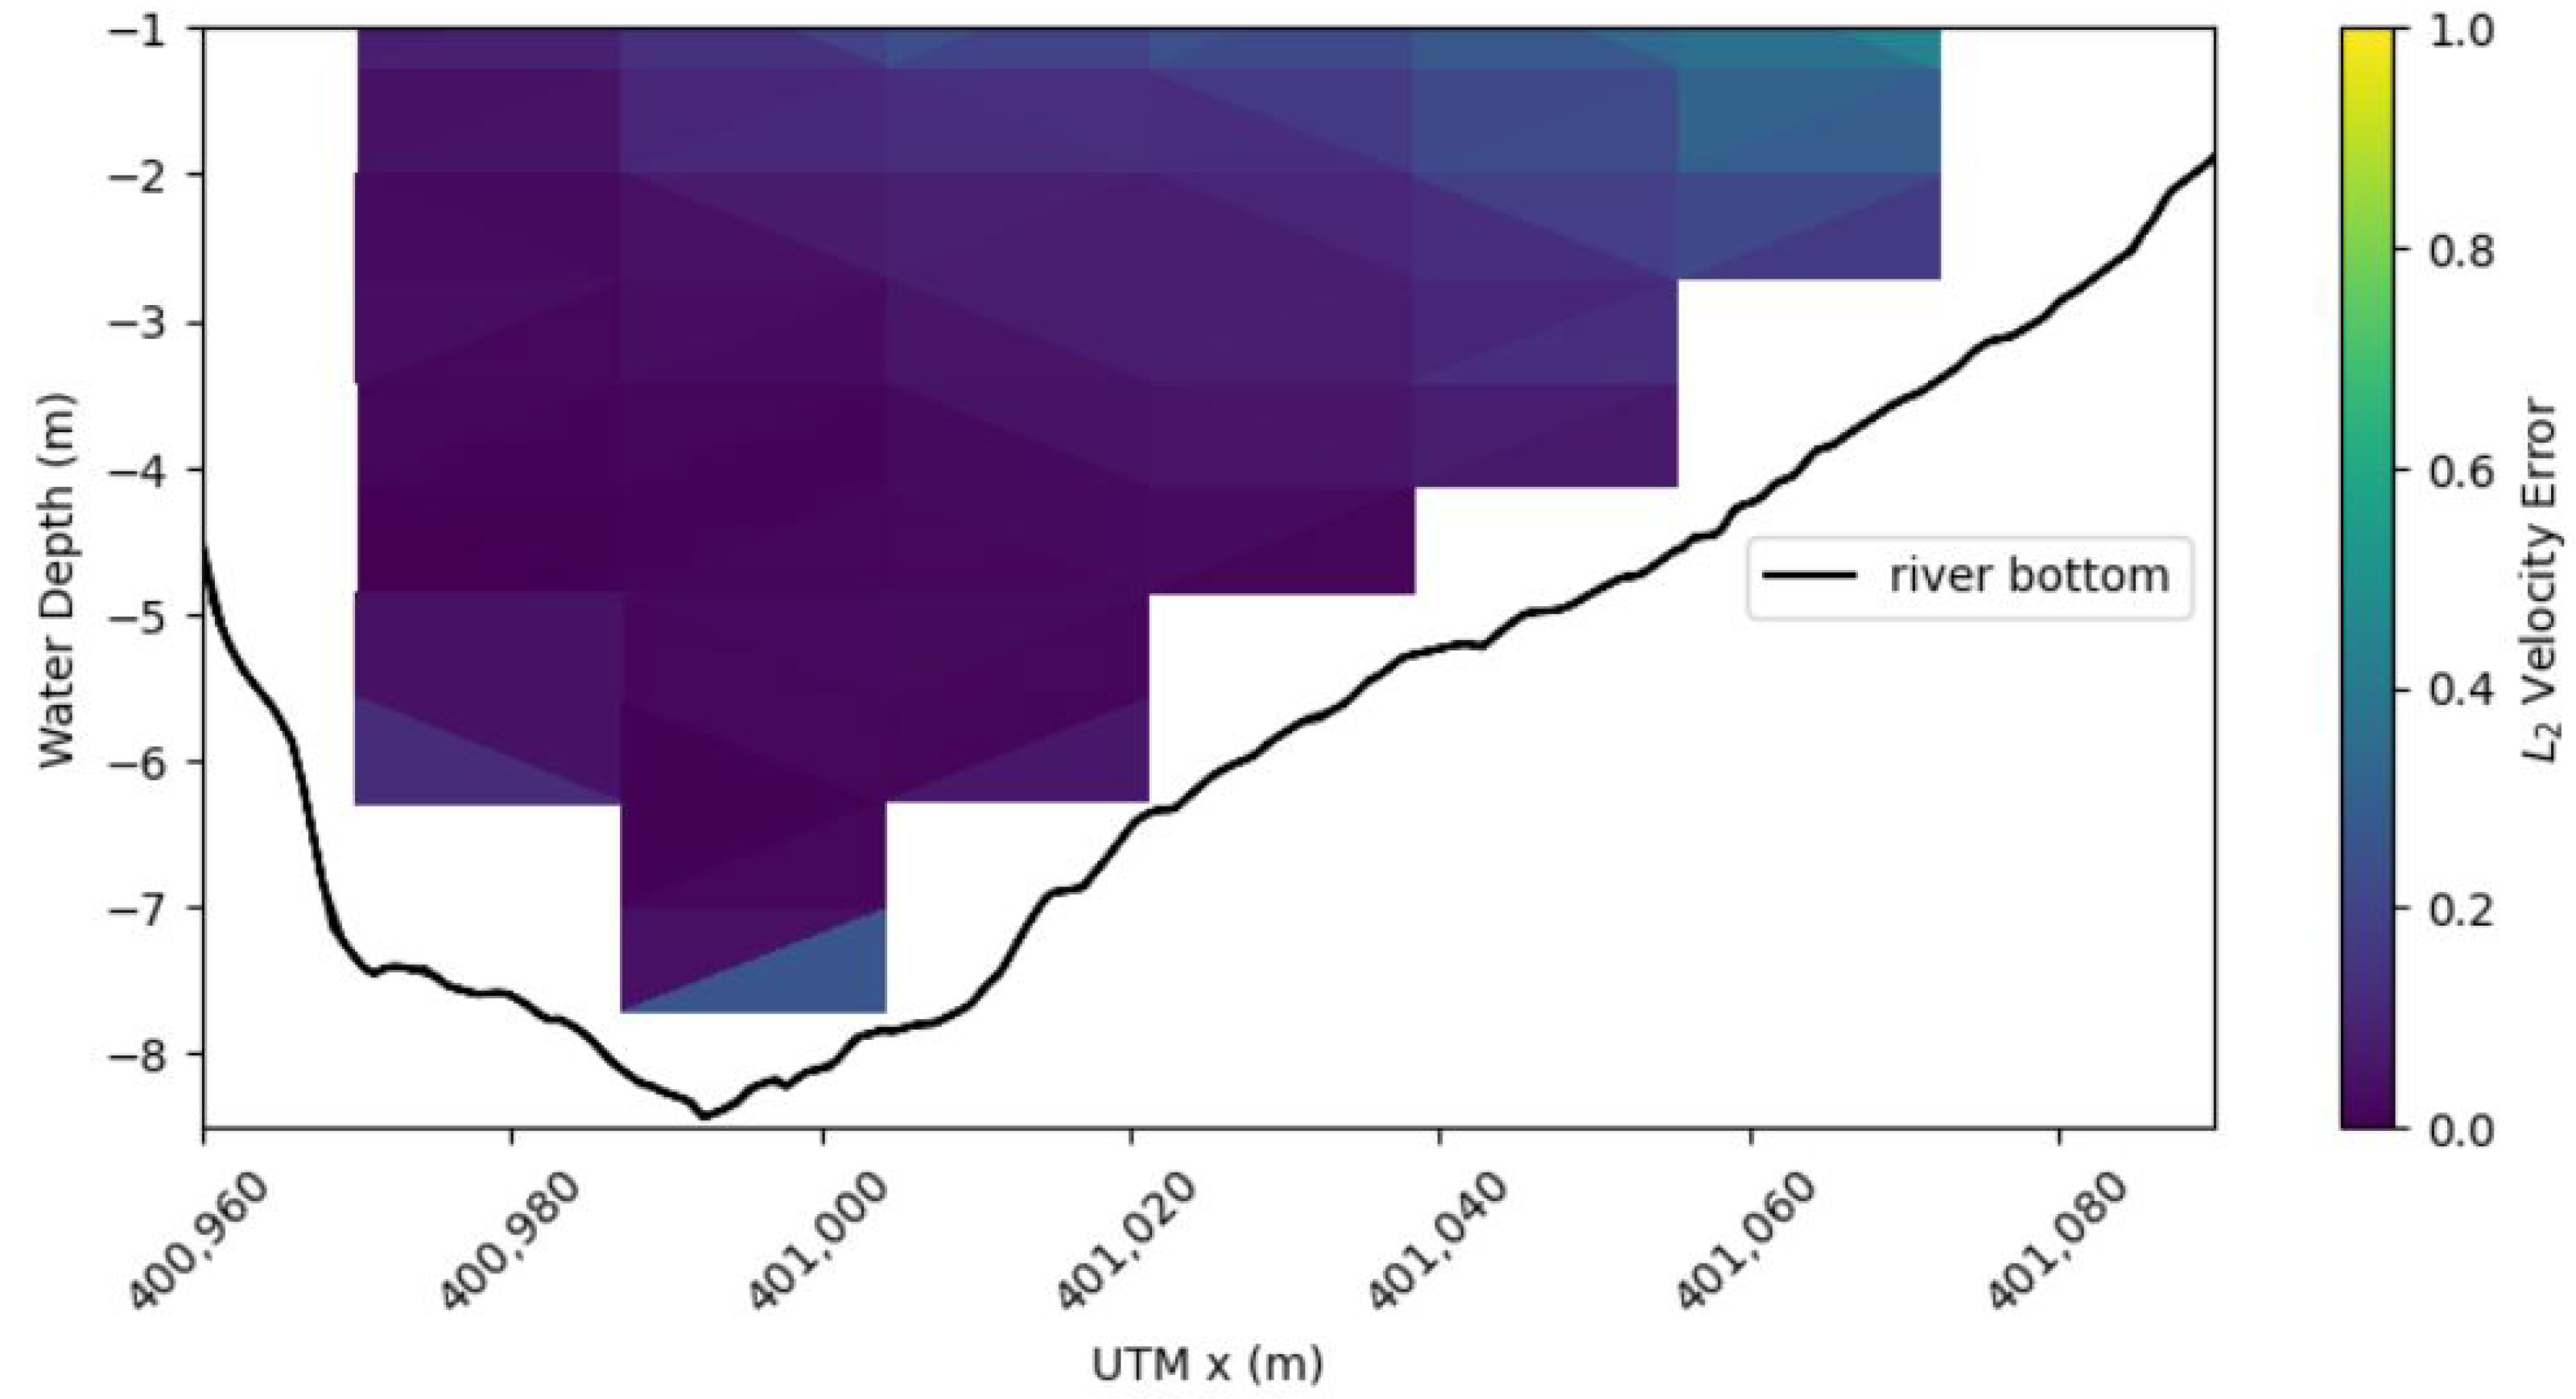
Data from Delft3D and the ADCP were now on an equivalent set of points in our data processing environment. MHKiT can easily compare the data processed from these two different sources. For this comparison, the , , and norms were calculated for the Delft3D transect, and the down-sampled ADCP using Equations (1)–(3) [20].
In Equation (1), the L1 norm is equal to the absolute value of the difference between modeled (D3D) and measured velocities (ADCP) over the measured velocity. This can be expressed as either a fractional or percent difference between measured and modeled velocities. The mean absolute error (MAE) is an average value of (1), equal to 0.270. The error calculation process was repeated to calculate Equation (2) which is commonly referred to as the mean squared error (MSE). MSE is similar to MAE, except the difference is squared, allowing more weight to be put on outliers in the contour plot of Figure 8 and Figure 9. , , and are dimensionless.
5. Discussion
A model verification using Delft3D simulated data of TRTS was compared to field data collected in 2010 using MHKiT. This example showcased the functionality of the MHKiT River and DOLfYN modules using a real-world study, and the findings demonstrated how MHKiT modules may be combined to analyze simulated velocity data and collected velocity field data in a simple and quick manner with two different error metrics and . The analysis conducted here is intended to be used as a jumping off point for researchers to build upon, adding more error metrics and comparing not only velocity but also turbulent intensity, shear stress, discharge, etc. depending on the experimental needs. For reference to the research community this example is included in the MHKiT source code and therefore this analysis is limited in part due to file size constraints when sharing data on GitHub and to minimize the run time of the example code. At the TRTS test site turbines up to a diameter of 2 m or less are being considered. Currently the model discretization is at approximately 5 m. This means that data acquired at out current model spatial discretization can help us inference average velocities but is not detailed enough to show us the needed turbulence or shear stress metrics. All of the code and data used are accessible on GitHub with step by step instructions on how the data was loaded and processed [6].
Other transect plotting software (VMT, WinRiver, and MIDAS) [1,2,21] were run separately from the data analysis software. MHKiT’s ability to process data from multiple common marine energy sources can help developers reach unique and novel results quickly. MHKiT eliminates the need for analysts to write and maintain their own processing scripts and provides a sustainable and validated data analysis environment. Although this is a river example, the MHKiT framework can similarly process and analyze modeled and empirical data from wave or tidal field experiments. Additionally, with an open-source collaborative framework, new functionality can be easily added to and distributed through MHKiT to best meet the industry’s needs.
The high error values found between the model and field data were expected for a first attempt on a course numerical model domain [22,23]. The small size (10 megabytes) of the coarse model domain allows MHKiT to host the data on its repository for public use and replication of this study’s results. This example then allows users to swap in their own data and build off a working example. Using this template, the TRTS Delft3D model may now be tuned and easily compared to the error metrics such as and . Looking forward, a primary focus of model improvement would be increasing the resolution of the Delft3D model, especially on the TRTS section of the Tanana river. Improving the Delft3D model is of particular interest to the TRTS staff as it can be used to predict the impact of the wake of a CEC on the surrounding environment such as the river bottom before it is deployed long-term. This can save time and funding when implementing CECs onto an electrical grid, while also mitigating environmental impact. Future work for MHKiT includes creating additional functions to easily compare metrics not shown here and to introduce features from [1,2], such as discharge estimates and other plotting capabilities, as well as incorporate code for further analysis on topics such as turbulence.
6. Conclusions
MHKiT improves collaboration and the standardization of analysis approaches through an open-source toolbox that is adaptable to meet the users’ specific needs. The MHKiT toolbox can be used to ingest, analyze, and visualize the ADCP transect data and compare it to modeled Delft3D data. Containing these steps in a single toolbox allows for a continuous data flow and comparison process. MHKiT provides open-source software with standardized modules for data ingestion, processing, quality control, visualization, and management. It can reduce the need for repeated efforts and standardize results within the ME industry. In this example, results showed that the Delft3D model needed to be improved to represent the TRTS accurately. The model, when updated and improved, will help improve the prediction of the environmental impacts of adding a CEC or array of CECs at the site. With over 15K downloads, MHKiT has been broadly adopted by the ME sector and continues to expand its reach across the industry. With new modules and user submitted functionality released annually, it continues to expand the ability to produce consistent data processing techniques and results.
Author Contributions
Conceptualization, E.B., S.O., and R.F.; methodology, E.B., S.O.; software, E.B., S.O., and J.M.; validation, E.B. and S.O.; formal analysis, E.B.; writing—original draft preparation, E.B. and S.O.; writing—review and editing, S.O., R.F., A.K., and J.M.; visualization, E.B.; supervision, S.O.; project administration, R.F.; funding acquisition, R.F. All authors have read and agreed to the published version of the manuscript.
Funding
Sandia National Laboratories is a multimission laboratory managed and operated by National Technology and Engineering Solutions of Sandia, LLC, a wholly owned subsidiary of Honeywell International Inc., for the U.S. Department of Energy’s National Nuclear Security Administration under contract DE-NA0003525. This work was authored in part by the National Renewable Energy Laboratory, operated by Alliance for Sustainable Energy, LLC, for the U.S. Department of Energy (DOE) under Contract No. DE-AC36-08GO28308, and the Pacific Northwest National Laboratory, operated by Battelle Memorial Institute for the U.S. Department of Energy (DOE) under Contract No. DE-AC05-76RL01830. Funding provided by the U.S. Department of Energy Office of Energy Efficiency and Renewable Energy Water Power Technologies Office. Any subjective views or opinions that might be expressed in the paper do not necessarily represent the views of the U.S. Department of Energy or the United States Government. The U.S. Government retains and the publisher, by accepting the article for publication, acknowledges that the U.S. Government retains a nonexclusive, paid-up, irrevocable, worldwide license to publish or reproduce the published form of this work, or allow others to do so, for U.S. Government purposes.
Data Availability Statement
MHKiT Python GitHub examples folder. https://github.com/MHKiT-Software/MHKiT-Python/tree/master/examples (accessed on 28 March 2023).
Acknowledgments
The data used for this study was collected by the Alaska Center for Energy and Power by Paul DUVOY and Jack Schmid funded by the Alaska Energy Authority 2195437/G00005572.
Conflicts of Interest
This work was prepared by the core developers of MHKiT who are funded by the Department of Energy to maintain and improve MHKiT. Emily Browning is employed by the University of Alaska Fairbanks as a graduate research assistant and performs research at the Tanana River Test site.
Abbreviations
The following abbreviations are used in this manuscript:
| ME | Marine Energy |
| MRED | Marine Renewable Energy Devices |
| CEC | Current Energy Converter |
| DOLfYN | Doppler Oceanographic Library for pYthoN |
| IEC | International Electrotechnical Commission |
| DOE | Department of Energy |
| NREL | National Renewable Energy Laboratory |
| PNNL | Pacific Northwest National Laboratory |
| SNL | Sandia National Laboratory |
| MHKiT | Marine and Hydrokinetic Toolkit |
| USGS | United States Geological Survey |
| ADCP | Acoustic Doppler Current Profiler |
| ADV | Acoustic Doppler Velocimeter |
| NOAA | National Oceanic and Atmospheric Administration |
| NDBC | National Data Buoy Center |
References
- USGS Hydroacoustics. 2018. Available online: https://hydroacoustics.usgs.gov/movingboat/VMT/VMT.shtml (accessed on 28 March 2023).
- TRDI (Teledyne RD Instruments). WinRiver User’s Guide; RD Instruments: Poway, CA, USA, 2007. [Google Scholar]
- International Electrotechnical Commission. Marine Energy: Wave, Tidal and Other Water Current Converters—Part 40: Acoustic Characterization of Marine Energy Converters; Technical Report; Technical Report IEC TS 62600-40:2019; IEC: Paris, France, 2019. [Google Scholar]
- Klise, K.; Pauly, R.; Ruehl, K.M.; Olson, S.; Shippert, T.; Morrell, Z.; Bredin, S.; Lansing, C.; Macduff, M.; Martin, T.; et al. MHKiT (Marine and Hydrokinetic Toolkit)—Python. [Computer Software]. 2020. Available online: https://github.com/MHKiT-Software/MHKiT-Python (accessed on 28 March 2023).
- Pauly, R.; Klise, K.; Ruehl, K.M.; Olson, S.; Shippert, T.; Morrell, Z.; Bredin, S.; Lansing, C.; Macduff, M.; Martin, T.; et al. MHKiT (Marine and Hydrokinetic Toolkit)—MATLAB. [Computer Software]. 2020. Available online: https://github.com/MHKiT-Software/MHKiT-MATLAB (accessed on 28 March 2023).
- Browning, E.; Olson, S. ADCP Delft3D TRTS Example. Available online: https://github.com/MHKiT-Software/MHKiT-Python/blob/master/examples/ADCP_Delft3D_TRTS_example.ipynb (accessed on 26 January 2023).
- Coe, R.G.; Michelen, C.; Eckert-Gallup, A.; Martin, N.; Yu, Y.H.; van Rij, J.; Quon, E.W.; Manuel, L.; Nguyen, P.; Esterly, T.; et al. WEC Design Response Toolbox (WDRT). 2018. Available online: https://wec-sim.github.io/WDRT/ (accessed on 28 March 2023).
- Kilcher, L.; McVey, J. Welcome to the DOLfYN Home Page. Available online: https://dolfyn.readthedocs.io/en/latest/ (accessed on 5 January 2023).
- MHKiT Wave Module. Available online: https://github.com/MHKiT-Software/MHKiT-Python/blob/master/examples/wave_example.ipynb (accessed on 26 January 2023).
- MHKiT Tidal Module. Available online: https://github.com/MHKiT-Software/MHKiT-Python/blob/master/examples/tidal_example.ipynb (accessed on 26 January 2023).
- Olson, S.; Fao, R.; Coe, R.; Ruehl, K.; Driscoll, F.; Gunawan, B.; Sivaraman, C.; Lansing, C.; Ivanov, H. The Marine and Hydrokinetic ToolKit for Data Quality Control and Analysis; Technical Report; National Renewable Energy Lab. (NREL): Golden, CO, USA, 2021. [Google Scholar]
- Johnson, J.; Toniolo, H.; Seitz, A.; Schmid, J.; Duvoy, P. Characterization of the Tanana River at Nenana, Alaska, to Determine the Important Factors Affecting Site Selection, Deployment, and Operation of Hydrokinetic Devices to Generate Power; Alaska Center for Energy and Power, Alaska Hydrokinetic Energy Research Center: Fairbanks, AK, USA, 2013; p. 130. [Google Scholar]
- Browning, E.A. An Analysis of Turbulent Effects on Hydrokinetic Power Generation. Master’s Thesis, University of Alaska Fairbanks, Fairbanks, AK, USA, 2022. [Google Scholar]
- Walsh, C.; Fochesatto, J.; Toniolo, H. The importance of flow and turbulence characteristics for hydrokinetic energy development on the Tanana River at Nenana, Alaska. Proc. Inst. Mech. Eng. Part J. Power Energy 2012, 226, 283–299. [Google Scholar] [CrossRef]
- Tanana R at Nenana AK. Available online: https://waterdata.usgs.gov/monitoring-location/15515500/#parameterCode=00065&period=P7D (accessed on 5 January 2023).
- MHKiT River Module. Available online: https://github.com/MHKiT-Software/MHKiT-Python/blob/master/examples/river_example.ipynb (accessed on 11 January 2023).
- Deltares. Delft3D-FLOW User Manual; Deltares: Delft, The Netherlands, 2013; Volume 330. [Google Scholar]
- Callede, J.; Kosuth, P.; Loup, J.L.; Guimarães, V.S. Discharge determination by acoustic Doppler current profilers (ADCP): A moving bottom error correction method and its application on the River Amazon at Obidos. Hydrol. Sci. J. 2000, 45, 911–924. [Google Scholar] [CrossRef]
- Mueller, D.S.; Wagner, C.R.; Rehmel, M.S.; Oberg, K.A.; Rainville, F. Measuring Discharge with Acoustic Doppler Current Profilers from a Moving Boat; US Department of the Interior, US Geological Survey: Reston, VI, USA, 2009. [Google Scholar]
- Chai, T.; Draxler, R.R. Root mean square error (RMSE) or mean absolute error (MAE)?—Arguments against avoiding RMSE in the literature. Geosci. Model Dev. 2014, 7, 1247–1250. [Google Scholar] [CrossRef] [Green Version]
- Nortek Group. Nortek Manuals: DVL Operations; Nortek: Rud, Norway, 2022; Available online: https://www.nortekgroup.com/assets/software/N3015-006-DVLOperations.pdf (accessed on 4 April 2023).
- Jia, Y.; Wang, S.S. CCHE2D Verification and Validation Tests Documentation; School of Engineering, The University of Mississippi, National Center for Computational Hydroscience and Engineering: University, MS, USA, 2001. [Google Scholar]
- Duvoy, P.; Toniolo, H. HYDROKAL: A module for in-stream hydrokinetic resource assessment. Comput. Geosci. 2012, 39, 171–181. [Google Scholar] [CrossRef]
Figure 1.
MHKiT v0.5.1 partial file structure. Folders are shown as squares, and files and submodules are shown as pill boxes. All submodules in the River and DOLfYN folders are expanded to rectangular containers. MHKiT modules are shaded light blue. Submodules are shaded with other light colors.
Figure 1.
MHKiT v0.5.1 partial file structure. Folders are shown as squares, and files and submodules are shown as pill boxes. All submodules in the River and DOLfYN folders are expanded to rectangular containers. MHKiT modules are shaded light blue. Submodules are shaded with other light colors.

Figure 2.
TRTS aerial view overlaid with two vessel transects. The arrow shows the direction of the river flow.
Figure 2.
TRTS aerial view overlaid with two vessel transects. The arrow shows the direction of the river flow.

Figure 3.
Depth of the river bed from the surface in meters generated from the Delft3D model based off input measured bathymetry data. The river flow direction is from the bottom right of the figure to the top left. The inlet was set to a constant discharge of 1789 m/s and the outlet was set to a constant water level of 2.7 m.

Figure 4.
GPS coordinates of the boat tracks transects with the interpolated ideal linear transect.

Figure 5.
Velocity magnitude collected by an ADCP linearly interpolated onto an ideal linear transect. The ideal linear transect is shown in Figure 4.
Figure 5.
Velocity magnitude collected by an ADCP linearly interpolated onto an ideal linear transect. The ideal linear transect is shown in Figure 4.

Figure 6.
Down-sampled velocity magnitude from Figure 5. ADCP data was down-sampled to match the discretization of the Delft3D model.
Figure 6.
Down-sampled velocity magnitude from Figure 5. ADCP data was down-sampled to match the discretization of the Delft3D model.

Figure 7.
Delft3D modeled velocity magnitude at the same ideal transect shown in Figure 4.
Figure 7.
Delft3D modeled velocity magnitude at the same ideal transect shown in Figure 4.

Figure 8.
error between ADCP velocity magnitude and Delft3D velocity magnitude using Equation (1).
Figure 8.
error between ADCP velocity magnitude and Delft3D velocity magnitude using Equation (1).

Figure 9.
error between ADCP velocity magnitude and Delft3D velocity magnitude using Equation (2).
Figure 9.
error between ADCP velocity magnitude and Delft3D velocity magnitude using Equation (2).


Table 1.
Error calculating over the complete area of the transect.
| Mean | Mean | |
|---|---|---|
| 0.270 | 0.111 | 0.814 |
Disclaimer/Publisher’s Note: The statements, opinions and data contained in all publications are solely those of the individual author(s) and contributor(s) and not of MDPI and/or the editor(s). MDPI and/or the editor(s) disclaim responsibility for any injury to people or property resulting from any ideas, methods, instructions or products referred to in the content. |
© 2023 by the authors. Licensee MDPI, Basel, Switzerland. This article is an open access article distributed under the terms and conditions of the Creative Commons Attribution (CC BY) license (https://creativecommons.org/licenses/by/4.0/).
Share and Cite
MDPI and ACS Style
Browning, E.; Olson, S.; Fao, R.; Keester, A.; McVey, J. Tanana River Test Site Model Verification Using the Marine and Hydrokinetic Toolkit (MHKiT). Energies 2023, 16, 3326. https://doi.org/10.3390/en16083326
AMA Style
Browning E, Olson S, Fao R, Keester A, McVey J. Tanana River Test Site Model Verification Using the Marine and Hydrokinetic Toolkit (MHKiT). Energies. 2023; 16(8):3326. https://doi.org/10.3390/en16083326
Chicago/Turabian StyleBrowning, Emily, Sterling Olson, Rebecca Fao, Adam Keester, and James McVey. 2023. "Tanana River Test Site Model Verification Using the Marine and Hydrokinetic Toolkit (MHKiT)" Energies 16, no. 8: 3326. https://doi.org/10.3390/en16083326
Note that from the first issue of 2016, this journal uses article numbers instead of page numbers. See further details here.