Article

A Study on Maximum Wind Power Penetration Limit in Island Power System Considering High-Voltage Direct Current Interconnections

1
Department of Electrical & Computer Engineering, Seoul National University, Gwanakero 599, Gwanakegu, Seoul 151-742, Korea
2
School of Electrical Engineering, Korea University, Anam-dong, Sungbuk-gu, Seoul 136-713, Korea
*
Author to whom correspondence should be addressed.
Energies 2015, 8(12), 14244-14259; https://doi.org/10.3390/en81212425
Submission received: 7 September 2015 / Revised: 27 November 2015 / Accepted: 7 December 2015 / Published: 17 December 2015
(This article belongs to the Special Issue Electric Power Systems Research)

Abstract

:
The variability and uncontrollability of wind power increases the difficulty for a power system operator to implement a wind power system with a high penetration rate. These are more serious factors to consider in small and isolated power systems since the system has small operating reserves and inertia to secure frequency and voltage. Typically, this difficulty can be reduced by interconnection with another robust power system using a controllable transmission system such as a high-voltage direct current (HVDC) system. However, the reliability and stability constraints of a power system has to be performed according to the HVDC system implementation. In this paper, the method for calculation of maximum wind power penetration in an island supplied by a HVDC power system is presented, and the operational strategy of a HVDC system is proposed to secure the power system reliability and stability. The case study is performed for the Jeju Island power system in the Korean smart grid demonstration area.

1. Introduction

As a renewable energy source, wind power has many benefits from both the economic and environmental perspective [1,2]. This positive fact is currently being accelerated by the notable cost reduction of wind turbine generators [3]. Subsequently, several countries such as Germany, United States, and China are promoting wind power implementation to increase the penetration rate. The number of annual new wind power installations in Europe has increased steadily and the total installed capacity exceeded 32% (117 GW) of total power generation capacity in 2013 [4]. The growth of wind power installation in the US is also significant, and total wind power capacity has reached 61 GW [5]. In particular, the wind power integration rate in Texas reached 25% in 2014 [6]. This type of high wind power penetration rate is common in areas with robust interconnections with other large-scale power systems, e.g., Denmark and Texas.
However, the characteristics of wind power resource—variability and uncontrollability—create problems to a power system operator when scheduling a generation dispatch or establishing a grid operation strategy to maintain power balance in the system [7]. Especially, it is more difficult to implement wind power in small isolated power systems for that reason. Research institutions around the world have published various technical reports and guidelines on this topic [4,8,9,10,11]. Riso National Laboratory in Denmark published guidelines to implement wind power into isolated power systems by introducing operational engineering design and assessment methods [8]. The U.S. National Renewable Energy Laboratory (NREL) reported the impact of industry structure on high wind penetration potential, and the advantages and difficulties in wind power accommodation [9].
In addition, studies on promoting wind power penetration have been performed. A grid code for operation with wind penetration, the impact on a system, and wind speed forecasting, are discussed in the IEEE power and energy society [10]. Conseil International des Grands Réseaux Électriques (CIGRE) established the B4-62 working group to study the connection of wind farms with weak AC networks in 2013 [11]. Similarly, the power limitations of a wind farm on an island system using energy yield evaluation was introduced in [12]. From the perspective of a power system, estimation of the frequency deviation and the power quality according to wind power penetration was performed by McGill University [13]. In addition, an economic approach was studied by modeling thermal generator dispatches and wind power curves to determine the optimal wind power generation capacity [14]. To mitigate the problems related to high wind power penetration, energy storage systems can be utilized for wind power smoothing [15]. There are efforts to solve the wind power fluctuation problem by system operation or control strategies [16,17]. Similarly, the interconnection with a robust power system can be a solution to promote penetration level [8]. In recent works, the stochastic and probabilistic methods are implemented to estimate maximum wind power penetration [18,19]. Furthermore, the implementation of the grid-scale energy storage system is considered to promote the wind power penetration [20].
To link systems such as wind farms to another system, there are two options from a broad point of view [21,22,23,24,25]: a HVAC system has advantages in transmission loss or competitive investment cost and compared to a HVDC system, it doesn’t require complicated control systems [21]. However, the break-even distance of the HVDC implementation is shorter in the case of underground or undersea transmission to connect isolated systems or offshore wind farms due to the cable capacitive effect of AC transmission [22,23]. Several wind farm construction projects including the BorWin and DolWin ones in Germany have applied HVDC to connect offshore wind farms [24,25]. Two types of HVDCs are applicable at present: a traditional DC transmission technology, commonly known as a line commutated converter (LCC) HVDC and a voltage-source converter (VSC) HVDC. LCC technology is based on the firing angle of the thyristor, which results in the phase of the AC current of the converter always lagging the voltage. To compensate this lagging current, reactive power has to be supplied. Generally, a reactive power of approximately 50%–55% of the DC transmission capacity must be supplied from the AC grid for LCC HVDC. This fact concerning the reactive power consumption, can cause more difficulties as the HVDC transmission capacity increases [26,27]. VSC HVDC, which has reactive power control capability, is frequently used to connect the wind power generators [28]. However, it is necessary to consider both properties in terms of the power system operation.
Jeju Island in Korea is a system that has the characteristics mentioned above. According to the 6th power system planning of MKE (a government-affiliated organization of Korea), the load level of Jeju Island is expected to increase until 2022. Additionally, a LCC HVDC system was installed to link with the mainland and the installation of a large-scale wind power generator is planned. An impact analysis of wind farm implementation on Jeju Island was performed by Jeju University [29]. In addition, a study on the maximum instantaneous wind power penetration on Jeju Island was performed by a Korea power exchange (KPX) project [30,31].
Moreover, there must be research on the analysis of the mutual influence between HVDC operation and wind power penetration level on this isolated island. In this paper, the analytical modeling of power system generation including LCC/VSC HVDC and wind farms of an island system has been performed to study the proper amount of maximum wind power generation. The characteristics of the wind generation and HVDC system are formulated as a function to be reflected in the proposed algorithm. The maximum wind power penetration limit estimation algorithm includes power system reliability and stability criteria. Furthermore, the effect of the type of interconnection on penetration rate has been checked. The proposed method can be utilized for the assessment of an appropriate wind power penetration in power system operation and planning, even as real-time.

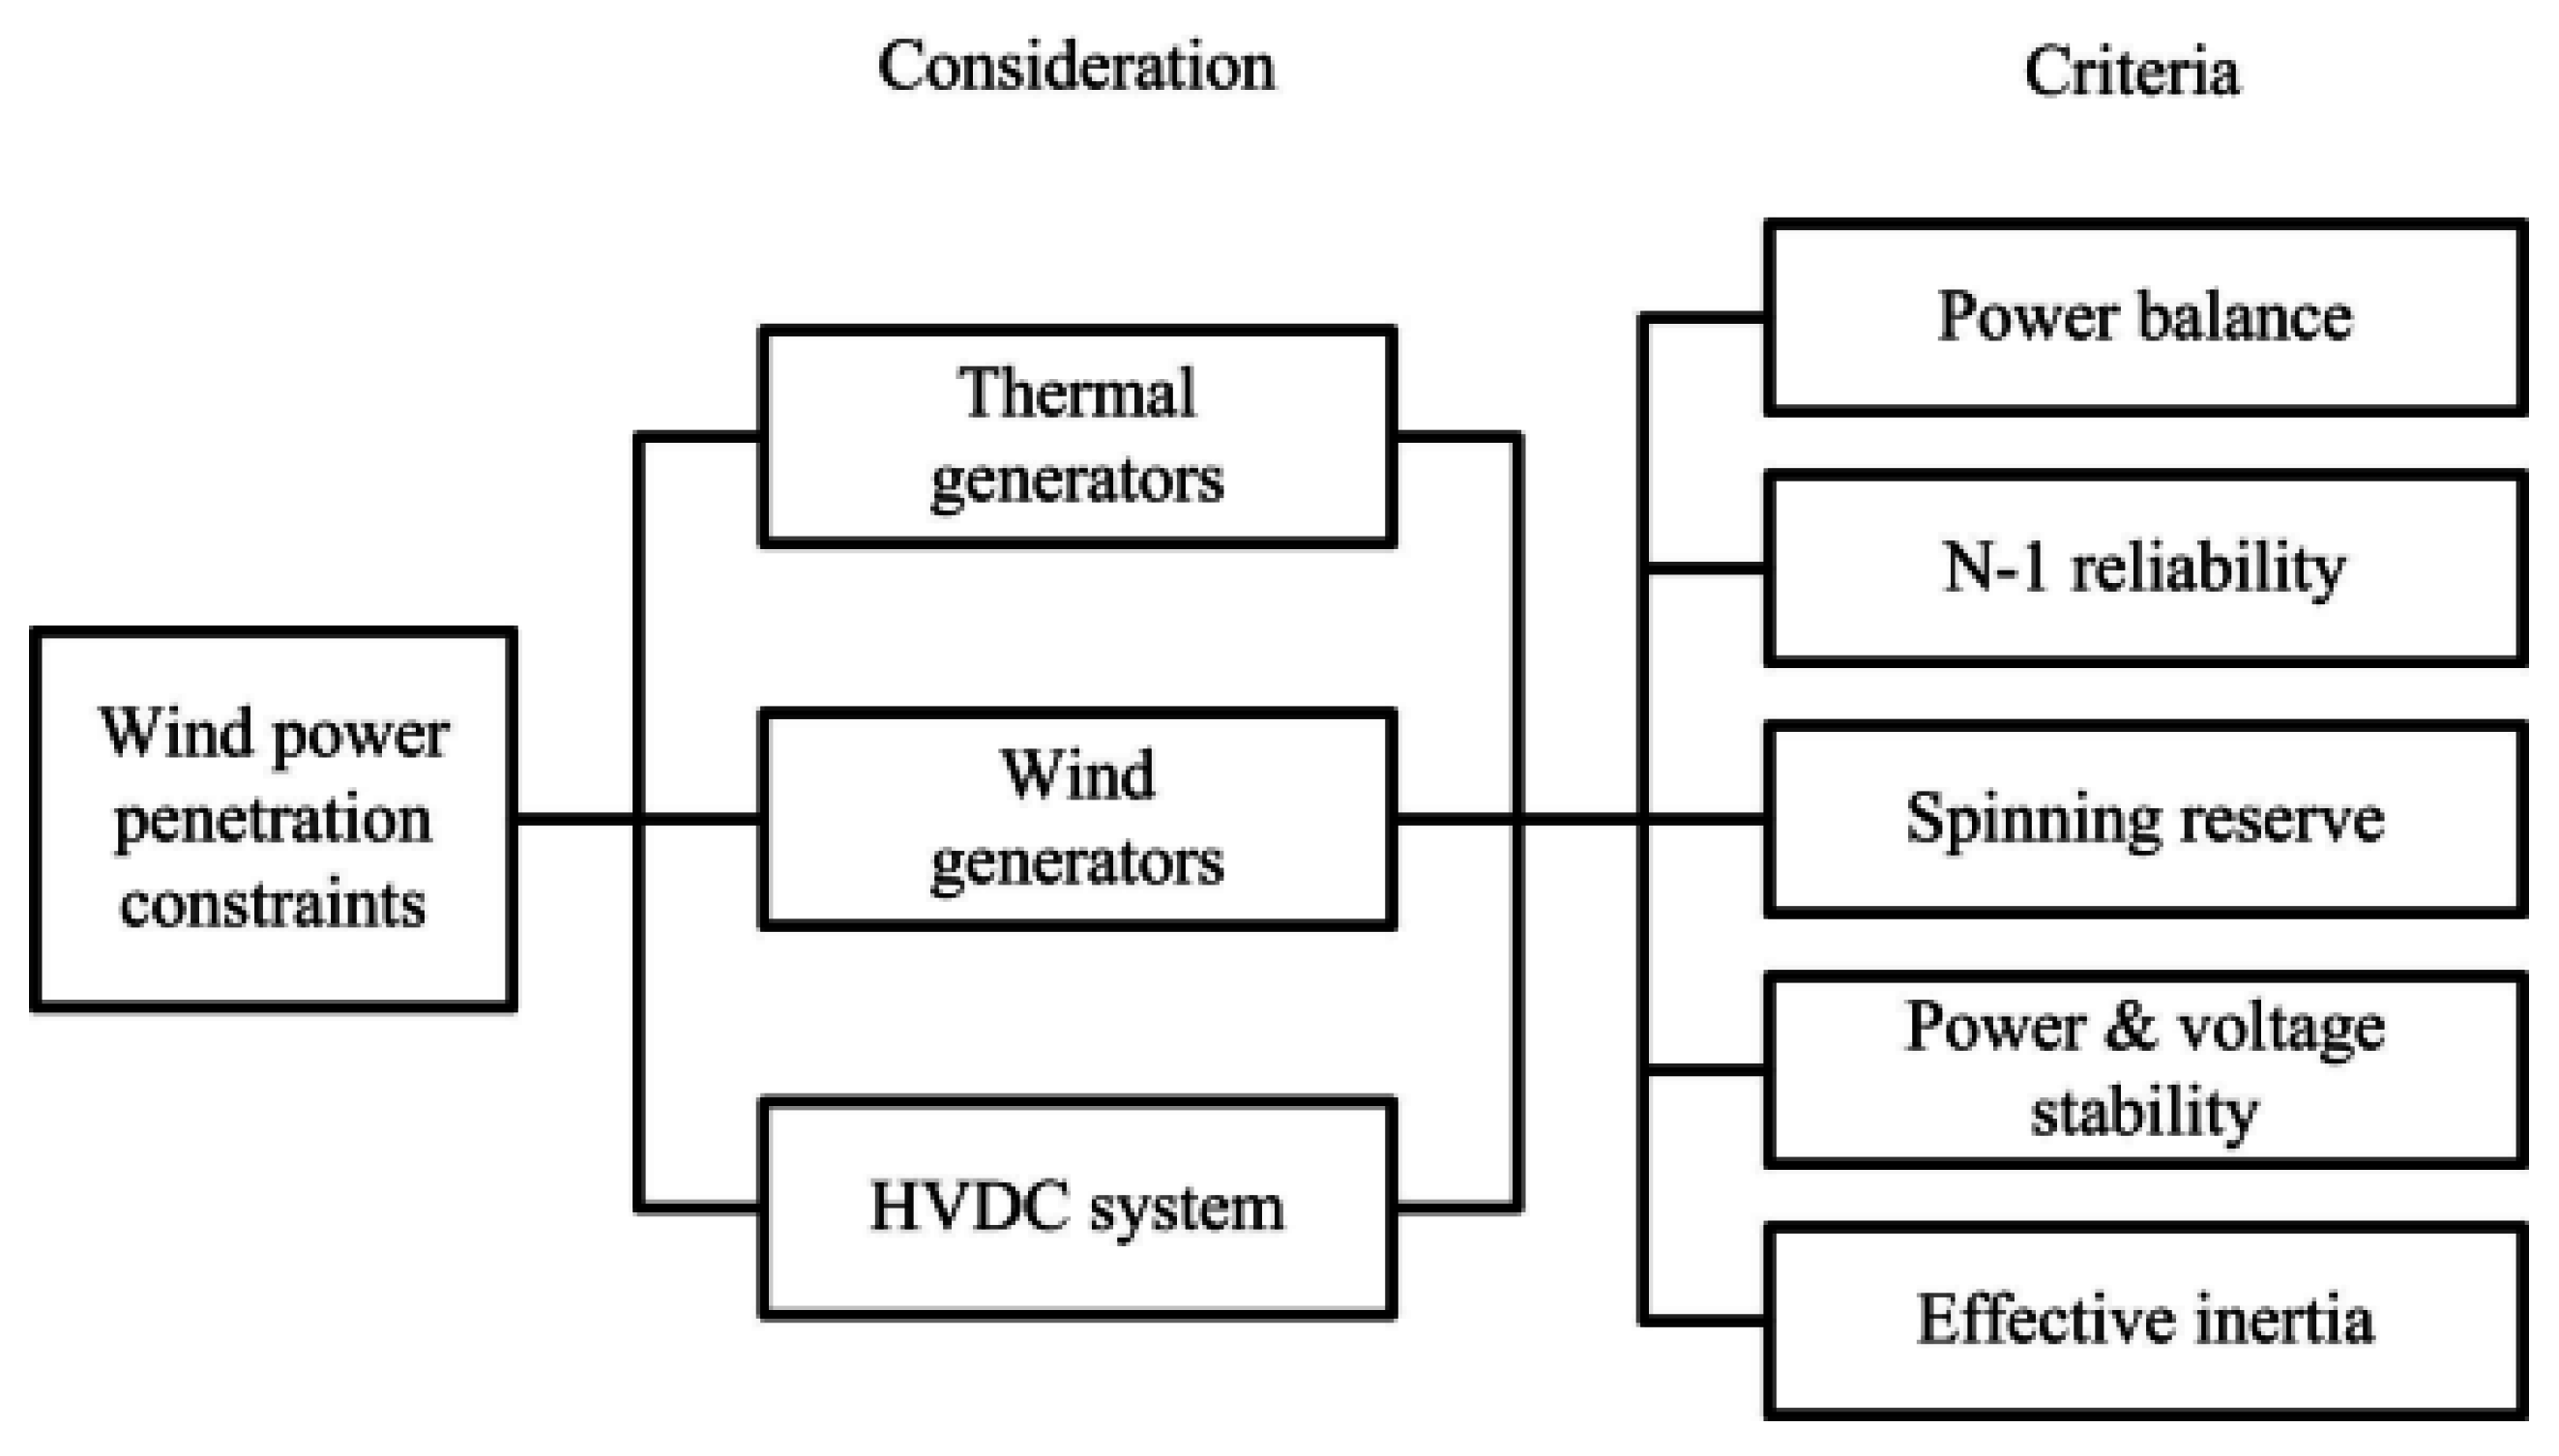
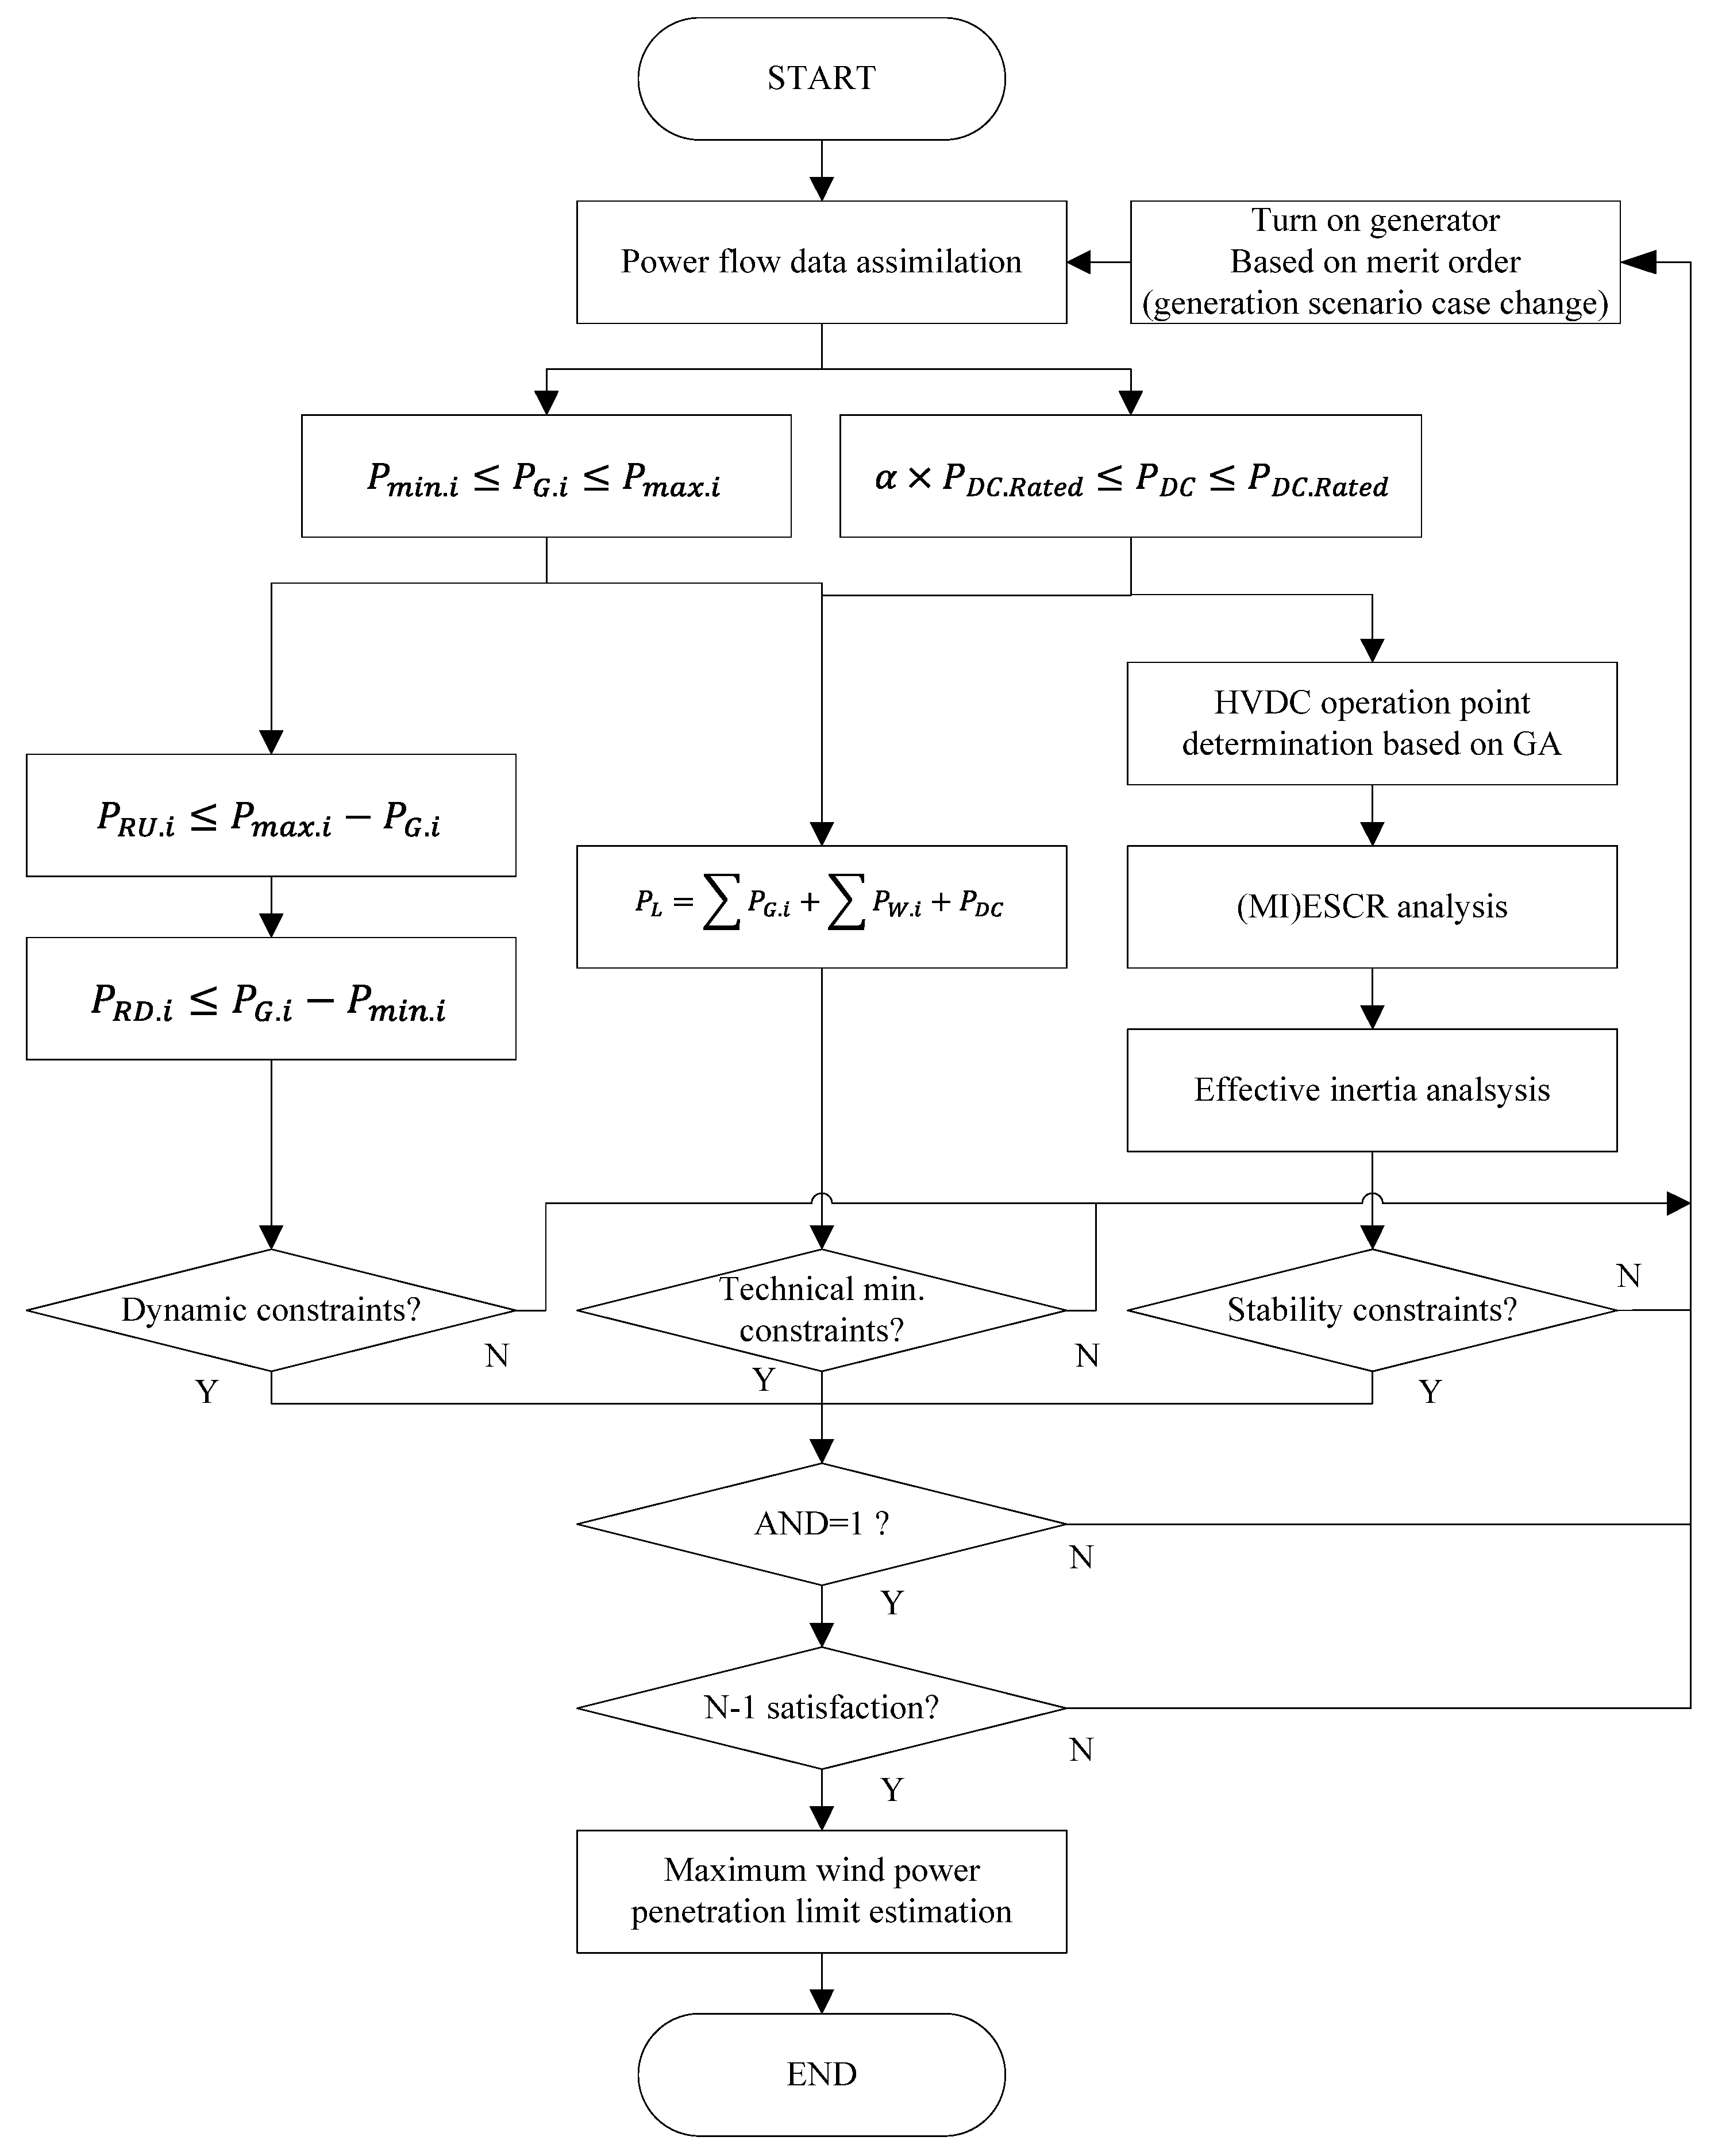
2. Problem Formulation

Due to the fluctuating output characteristics of wind generation, the generating units are key-role components on the determination of the maximum wind power generation in isolated weak power systems. As shown in Figure 1, in this paper the generating units are categorized as thermal generator, wind power generator and HVDC system. Each of components are dependent on the power system operation conditions. The operator of this mixed generation power system has to consider appropriate power system operation criteria to secure mutual system reliability and stability.
Figure 1. Criteria of the wind power generation constraints.
Energies 08 12425 g001
From the viewpoint of a power system operation, it is important to consider not only steady state analysis but also an N − 1 contingency situation. A generation outage in thermal, wind generators or a HVDC system is able to cause a severe frequency drop or voltage/power instability. According to these constraints, at a steady state or in an N − 1 contingency situation, the maximum wind power generation capacity must be limited. In this study, the categorized analysis for a large scale wind power penetrated in an island power system is presented. As shown in Figure 1, there are differences in an analysis criteria depending on the presence or type of HVDC system. The hierarchical structure of the study of wind power generation calculation is as follows:
Figure 2 shows the algorithm for the maximum wind power penetration limit estimation considering power system reliability and stability constraints. The objective function is to minimize the summation of generations from thermal generators and HVDC system in Equation (8). As a result, calculation of the proper wind power penetration limit to match the power demand can be performed instantly by using a mathematical model. The skeleton of the algorithm is based on a power balance equation considering the reliability/stability constraints.
The algorithm starts with the power flow data assimilation required to analyze the maximum wind power penetration limit. The control variables are the generating unit capacity P G . i and P DC , the constraints of each control variable range are explained in Section 2.1 and Section 2.2. The dynamic constraint branch considers the spinning reserve of the system to cover the amount of the wind power fluctuation. The ramp-up/ramp-down spinning reserve of each of the thermal generating units is smaller than the operation margin in the range. For a detailed explanation of the discriminant readers can refer to Section 2.5. The technical minimum is the result from minimum/maximum output capacity constraints of the components. The constraints are based on the power flow equation to match the power balance without any other stability and reliability constraints. The stability constraints are mainly related to determine the HVDC operation point within the stable operation range. The method analyzing the stable operation point considering power voltage stability and effective inertia is described in Section 2.6 and Section 2.7. To calculate the maximum available power (MAP) of HVDC, the optimization method genetic algorithm (GA) is applied.
Figure 2. The algorithm for the maximum wind power penetration limit estimation.
Energies 08 12425 g002
In case that all stability constraints are satisfied (AND = 1), the condition to check the system reliability, N − 1 contingency is applied to the system as described in Section 2.4. In case of an unsatisfactory condition, we turn on an additional generator to improve the system strength and process the iteration loop. Finally, the result of the maximum wind power penetration limit estimation can be acquired.

2.1. Thermal Generator Constraints

Each thermal generator is in the range of normal operational constraints. The total ramp-up/down power capacity of a system depends on the up/down ramping rate of the generators. The ramp-up/down capacity contributes to maintain power balance when a contingency occurs. A more detailed analysis of spinning reserve is mentioned in Section 2.4:
P min . i P G . i P max . i
Power ramp-up capacity:
P RU . i = U R i × t
P RU . i P max . i P G . i
Power ramp-down capacity:
P RD . i = U D i × t
P RD . i P G . i P min . i

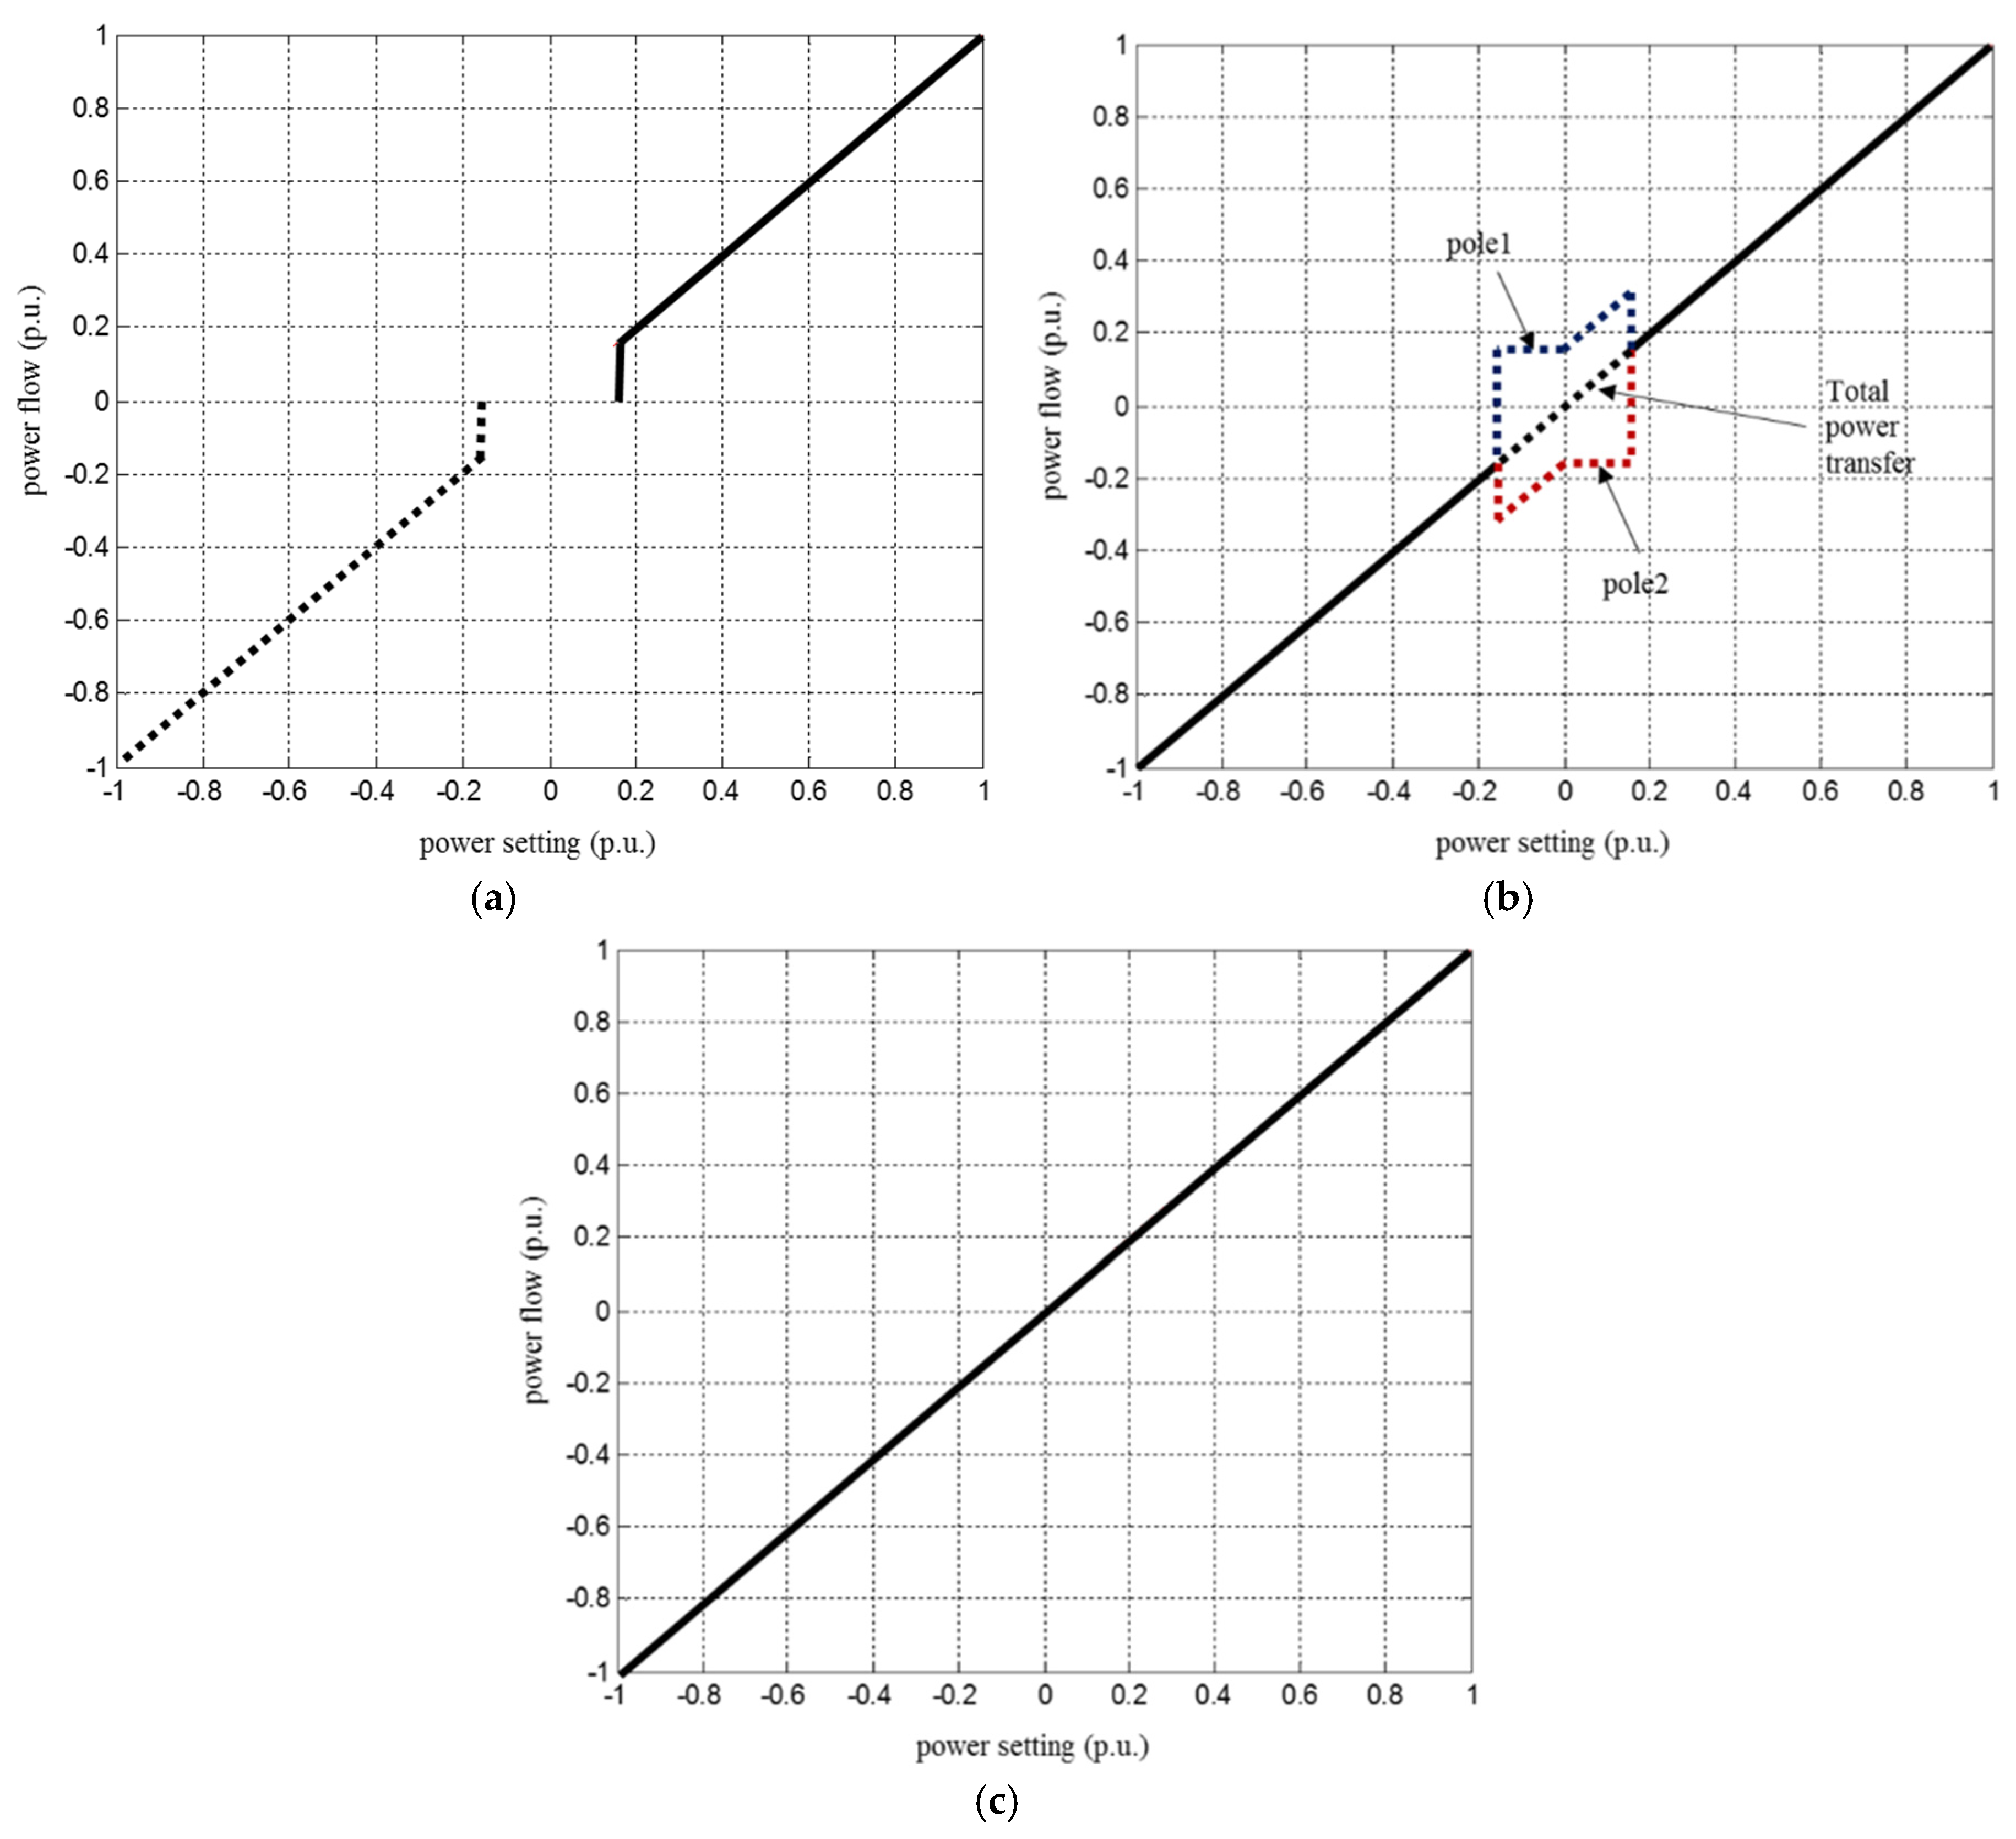
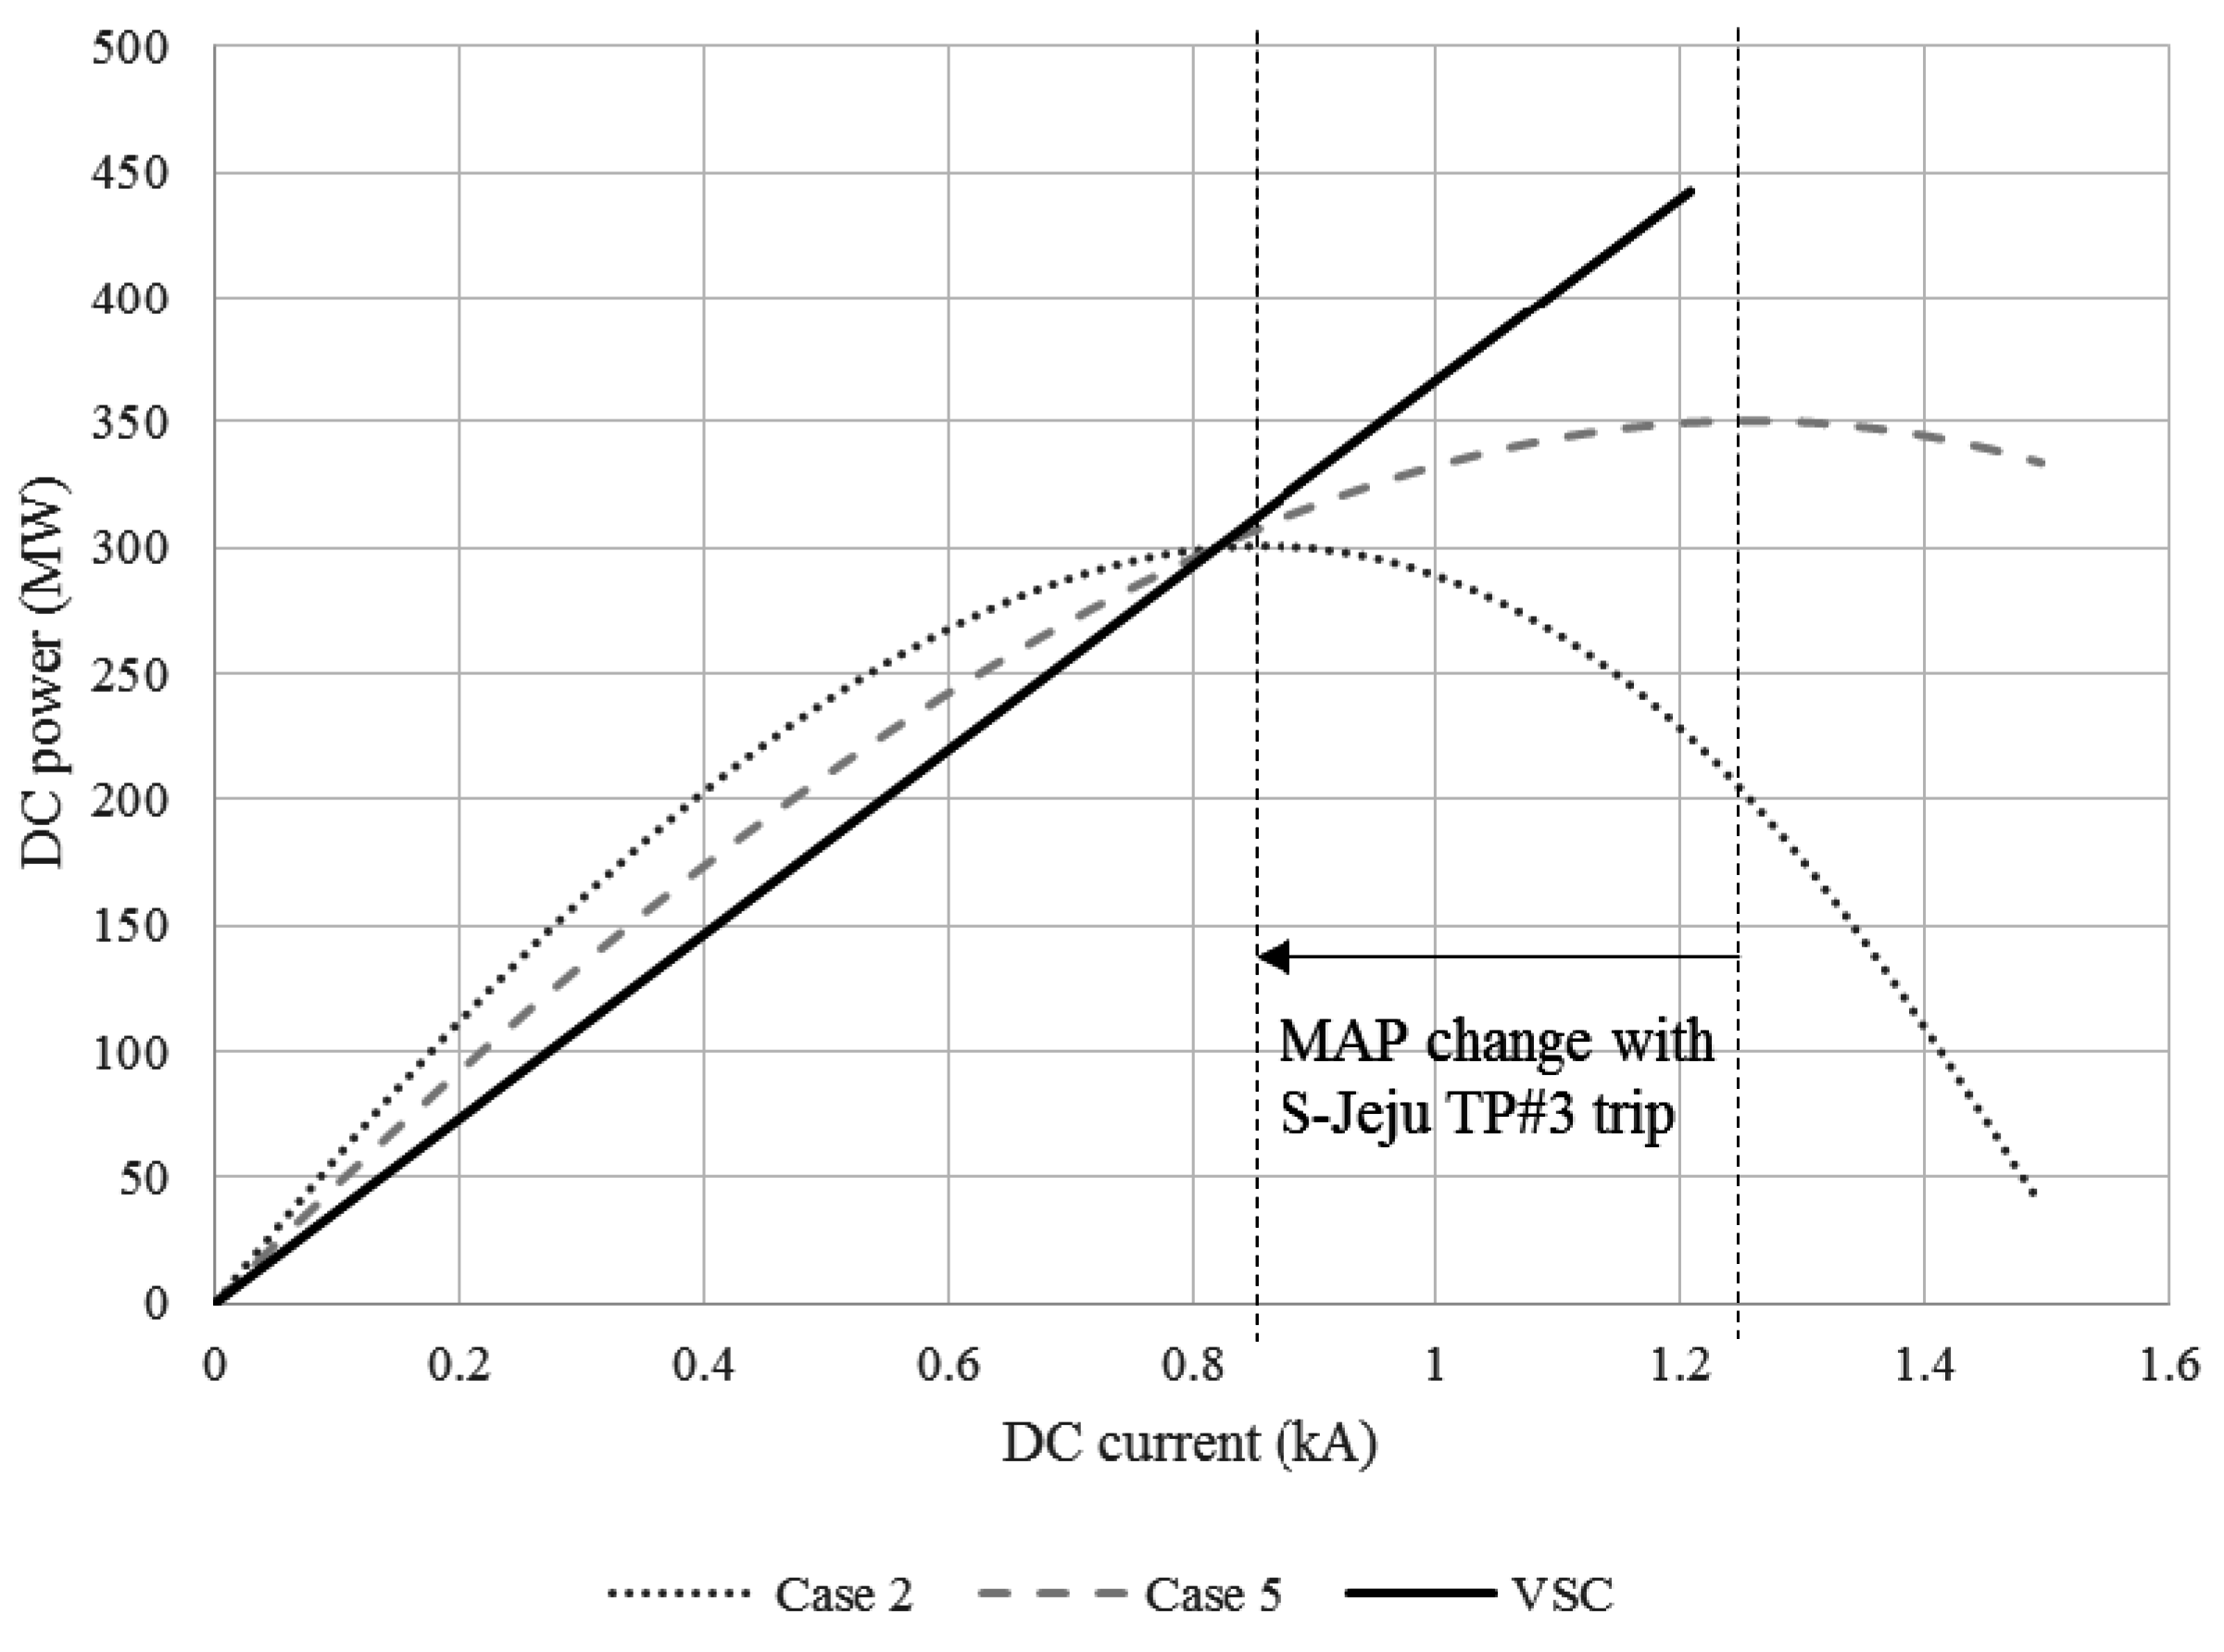
2.2. High-Voltage Direct Current Operation Range

As shown in Figure 3, the amount of HVDC power transfer from positive to negative is flexible if a function that reverses power flow is supported. A VSC HVDC system typically has a function that allows current flow in the opposite direction to the capacity.
Figure 3. Power flow versus power setting depends on: (a) unidirectional line commutated converter (LCC) high-voltage direct current (HVDC); (b) bidirectional LCC HVDC; and (c) voltage-source converter (VSC) HVDC.
Energies 08 12425 g003
In that case, the minimum transferrable power capacity coefficient (τ) is −1 and the permissible DC power transfer range is from − 1 p.u. to 1 p.u., according to Equation (6):
τ × P DC . rated P DC P DC . rated τ = { 1 0.13 VSC and LCC with power reversal LCC without power reversal
On the other hand, this is not simple for an LCC HVDC system owing to the requirement of reversing the voltage polarity [26]. The minimum transferrable capacity of an LCC HVDC system is 0.1–0.2 p.u. under normal conditions; however, reversal of the power flow is possible on LCC HVDC with simultaneous bidirectional power flow control or bipolar power flow control [22]. As an analysis of the Jeju Island case, a coefficient ( α ) of 0.13 is selected for unidirectional LCC study, then, the P D C range is from 0.13 p.u. to 1 p.u. as presented in Section 3.2.

2.3. Power Balance Constraints

2.3.1. Real Power Criteria

According to this analysis, the maximum wind power penetration level can be calculated in terms of supply and demand, as shown in Equation (7). The wind power fluctuation must be compensated by controllable thermal generators and an HVDC system to satisfy the demands of the load:
P L = P G . i + P W . i + P DC
As presented in Equation (8), the thermal generators and HVDC systems are required to be minimum generation to maximize the wind power generation capacity by satisfying power balance equation. If it is possible, an HVDC system is required to be operated as maximum power reversal mode as − 1 p.u. Thermal generators must be operated at minimum generation capacity while maintaining a stable system condition:
P W . max = P L min ( P G . i + P DC )

2.3.2. Reactive Power Criteria

Wind Power Side

The previous type of wind generator, which has an induction turbine, consumes reactive power in the motoring/generating regions by the slip phenomenon. PF control capacitors compensate when the slip effect occurs. This capacitor is able to generate reactive power when the wind generators are off. However, the latest doubly-fed induction generator (DFIG), doubly-fed asynchronous generator (DFAG) type and full converter type wind generators have the capability to control reactive power using a power converter during operation [32]. As a result, the wind generators can be assumed to be operated as almost a unity power factor and this issue does not need to be considered in terms of the local reactive power.

High-Voltage Direct Current Side

The surplus reactive power supply from shunt elements ( Q c ) that compensate the reactive power consumption of an LCC HVDC system ( Q d ) affects the bus voltage with HVDC system blocking. A large short circuit capacity of the system or a sufficient amount of reactive power compensation is required to respond instantaneously. VSC HVDC is more applicable to weak ac system in that sense, having a reactive power control capability [28]. In this study, must-run generators are set to supply short-circuit capacity. This will be noted in Section 2.5:
Q c Q d = 1 4 V d 0 I d sin 2 γ sin 2 ( γ + μ ) + 2 μ cos α cos γ + μ

2.4. N − 1 Reliability

In a power system operation, an N−1 contingency event should be considered [33]. Therefore, the system operator should evaluate the system and maintain a margin for when there is an outage in the largest generators or a transmission line. In this study, the outage of large-scale wind farms is a factor that must be seriously considered. The power system including several generating units is required to satisfy the power balance from the most critical generation outage as shown in Equation (10):
P L P G . i + P W . i + P DC max ( P G . i , P W , P DC )
However, wind power is uncontrollable and is excluded from a generation dispatch:
P L P G . i + P DC max ( P G . i , P W , P DC )
In case of a bipolar or multiple monopolar HVDC system, each pole can be operated complementarily with the control function. Equation (11) has to be modified with the n-number of HVDC poles that can be operated independently. The maximum outage component in HVDC system is not whole system but a pole as shown in Equation (12):
P L P G + P DC max ( P G , P W , 1 n · P DC )

2.5. Spinning Reserve

Spinning reserve refers to the generation capacity that can respond within 10 min for the outage of generation or a transmission line [34]. The ramp-up/ramp-down spinning reserve of thermal generating units are the summation of an each unit P RU . i and P RD . i as shown in Equations (13) and (14). The ramp-up/down rate of an HVDC system is definitely high to follow an order within 10 min [26]. Therefore, HVDC is able to contribute to spinning reserve on condition that upper margin to maximum operation capacity ( P DC . rated P DC ) or lower margin to minimum ( P DC α × P DC . rated ) . The total spinning reserve ( P USR , P DSR ) has to be sufficiently above the required reserve capacity such as wind power fluctuation or other power outage ( σ W × P W ).
In this study, the wind power fluctuation coefficient ( σ W ) was defined as maximum wind power fluctuation ratio versus its capacity. The coefficient needs to be determined carefully depending on the system operation strategy and the spinning reserve planning. Typically, the maximum Jeju Island wind power fluctuation within 10 min is in the range of less than 20% [30]. In conclusion, the up/down spinning reserve of the system is calculated as follows:
Up spinning reserve constraints:
P USR = P RU . i + ( P DC . rated P DC ) P USR σ W × P W
Down spinning reserve constraints:
P DSR = P RD . i + ( P DC α × P DC . rated ) P DSR σ W × P W

2.6. Power and Voltage Stability

When there is a fault in a HVDC system or a severe fault in an AC system, the result can lead to the temporary blocking of HVDC converters. In the case of an LCC HVDC, shunt capacitors are installed for reactive power compensation of HVDC operation, which can cause temporary overvoltage (TOV) at a converter bus by converter blocking. A VSC HVDC system has the capability to support reactive power by AC voltage control, but this compensated amount will disappear by converter blocking. However, if the power system strength is sufficiently high, the temporary overvoltage problem can be alleviated. In this study, we assumed that the wind power system is connected with the voltage control capability, and the voltage support function of VSC is neglected. The MAP concept is widely utilized to analyze the power and voltage stability of a HVDC system [35,36,37]. Consideration of the commutation failure problem is essential to the planning of an LCC HVDC system. Therefore, the strength index is computed as a ratio of the short circuit capacity (SCC) to the DC power transfer amount, called the effective short circuit ratio (ESCR) and critical effective short circuit ratio (CESCR). Equation (15) is derived from converter equation and power flow equation based on a Jacobian matrix. For the procedure to derive Equation (15) readers are referred to [36,37]:
d P d d I d = a U cos ( γ + μ ) [ U 4 ESCR 2 + b ( U 2 ESCR + Q d ) Q d 2 P DC 2 ] det J = 0 a = 2 U d cos γ + cos ( γ + μ ) b = 2 ( Q d P DC tan ( γ + μ ) )
CESCR is the designated value to determine the MAP point, where d P d / d I d is zero. The ESCR index is required to have a value greater than the CESCR to secure power system stability with an LCC HVDC system. A MAP condition occurs when:
U 4 E S C R 2 + b ( U 2 E S C R + Q d ) Q d 2 P DC 2 = 0 CESCR = ESCR , d P d d I d = 0
CESCR is the ESCR value which satisfies the condition of Equation (16). Equation (17) can be derived by a quadratic formula since Equation (16) is a quadratic equation which has ESCR as unknown quantity:
C E S C R = 1 U 2 [ Q d + P DC cot ( π 4 + γ + μ 2 ) ]
To stably operate the HVDC system, the ESCR of the converter bus is required to be greater than the CESCR:
E S C R = S C C Q C P DC C E S C R
Assume the power system is in a flat condition, where U is the unity value. Equation (19) is able to be derived by substituting of Equation (17) into Equation (18):
S C C cot ( π 4 + γ + μ 2 ) · P DC 2 Q d · P DC + Q c
In addition, through the positive voltage sensitivity factor (VSF), the voltage stability of the system can be secured in a stable region when the ESCR is greater than the CESCR [35].

2.7. Effective Inertia Constant Constraints

The effective inertia constant is an index that represents the ability to sustain the power system frequency by the rotational inertia (H) of an AC system. The rotational mechanical inertia of the system is able to provide energy to maintain the electromotive force of the system during the loss of power generation. H DC is the effective inertia constant of the DC power through the inverter versus the rotational inertia of the AC system [38]. In the case of a bipolar system, each pole has the ability to operate independently. However, the total transfer capacity of a DC system should be considered for the analysis of a severe case such as the contingency of a converter station bus or DC line fault.
General situations that cause a decrease in power system frequency are:
-
HVDC commutation failure
-
The faults in a HVDC system while sending and receiving to an end system
-
DC line fault
In a HVDC infeed situation, the effective inertia of the HVDC system is as follows:
H DC = H i · S MVA . i P DC
The frequency deviation of a machine is presented as:
f = P · f 0 · t 2 H
Frequency change after HVDC drop, Equation (22), is derived from Equations (20) and (21):
f = P DC . pu · f 0 · t 2 ( H i · S MVA . i ) / P DC
The power loss period (∆t) calculated from the summation of the fault duration ( t f ) and recovery time ( t r ). To maintain the frequency deviation within the specified range (∆f/ f 0 ) from the power loss during the period (∆t), the system rotational mechanical inertia of ON state generators should be secured as shown in Equation (23). In other words, the DC power transfer capacity is required to be limited related to the rotational inertia of the AC system to sustain frequency stability:
H i · S MVA . i P DC · P DC . pu · f 0 · ( t f + t r ) 2 f

3. Case Study

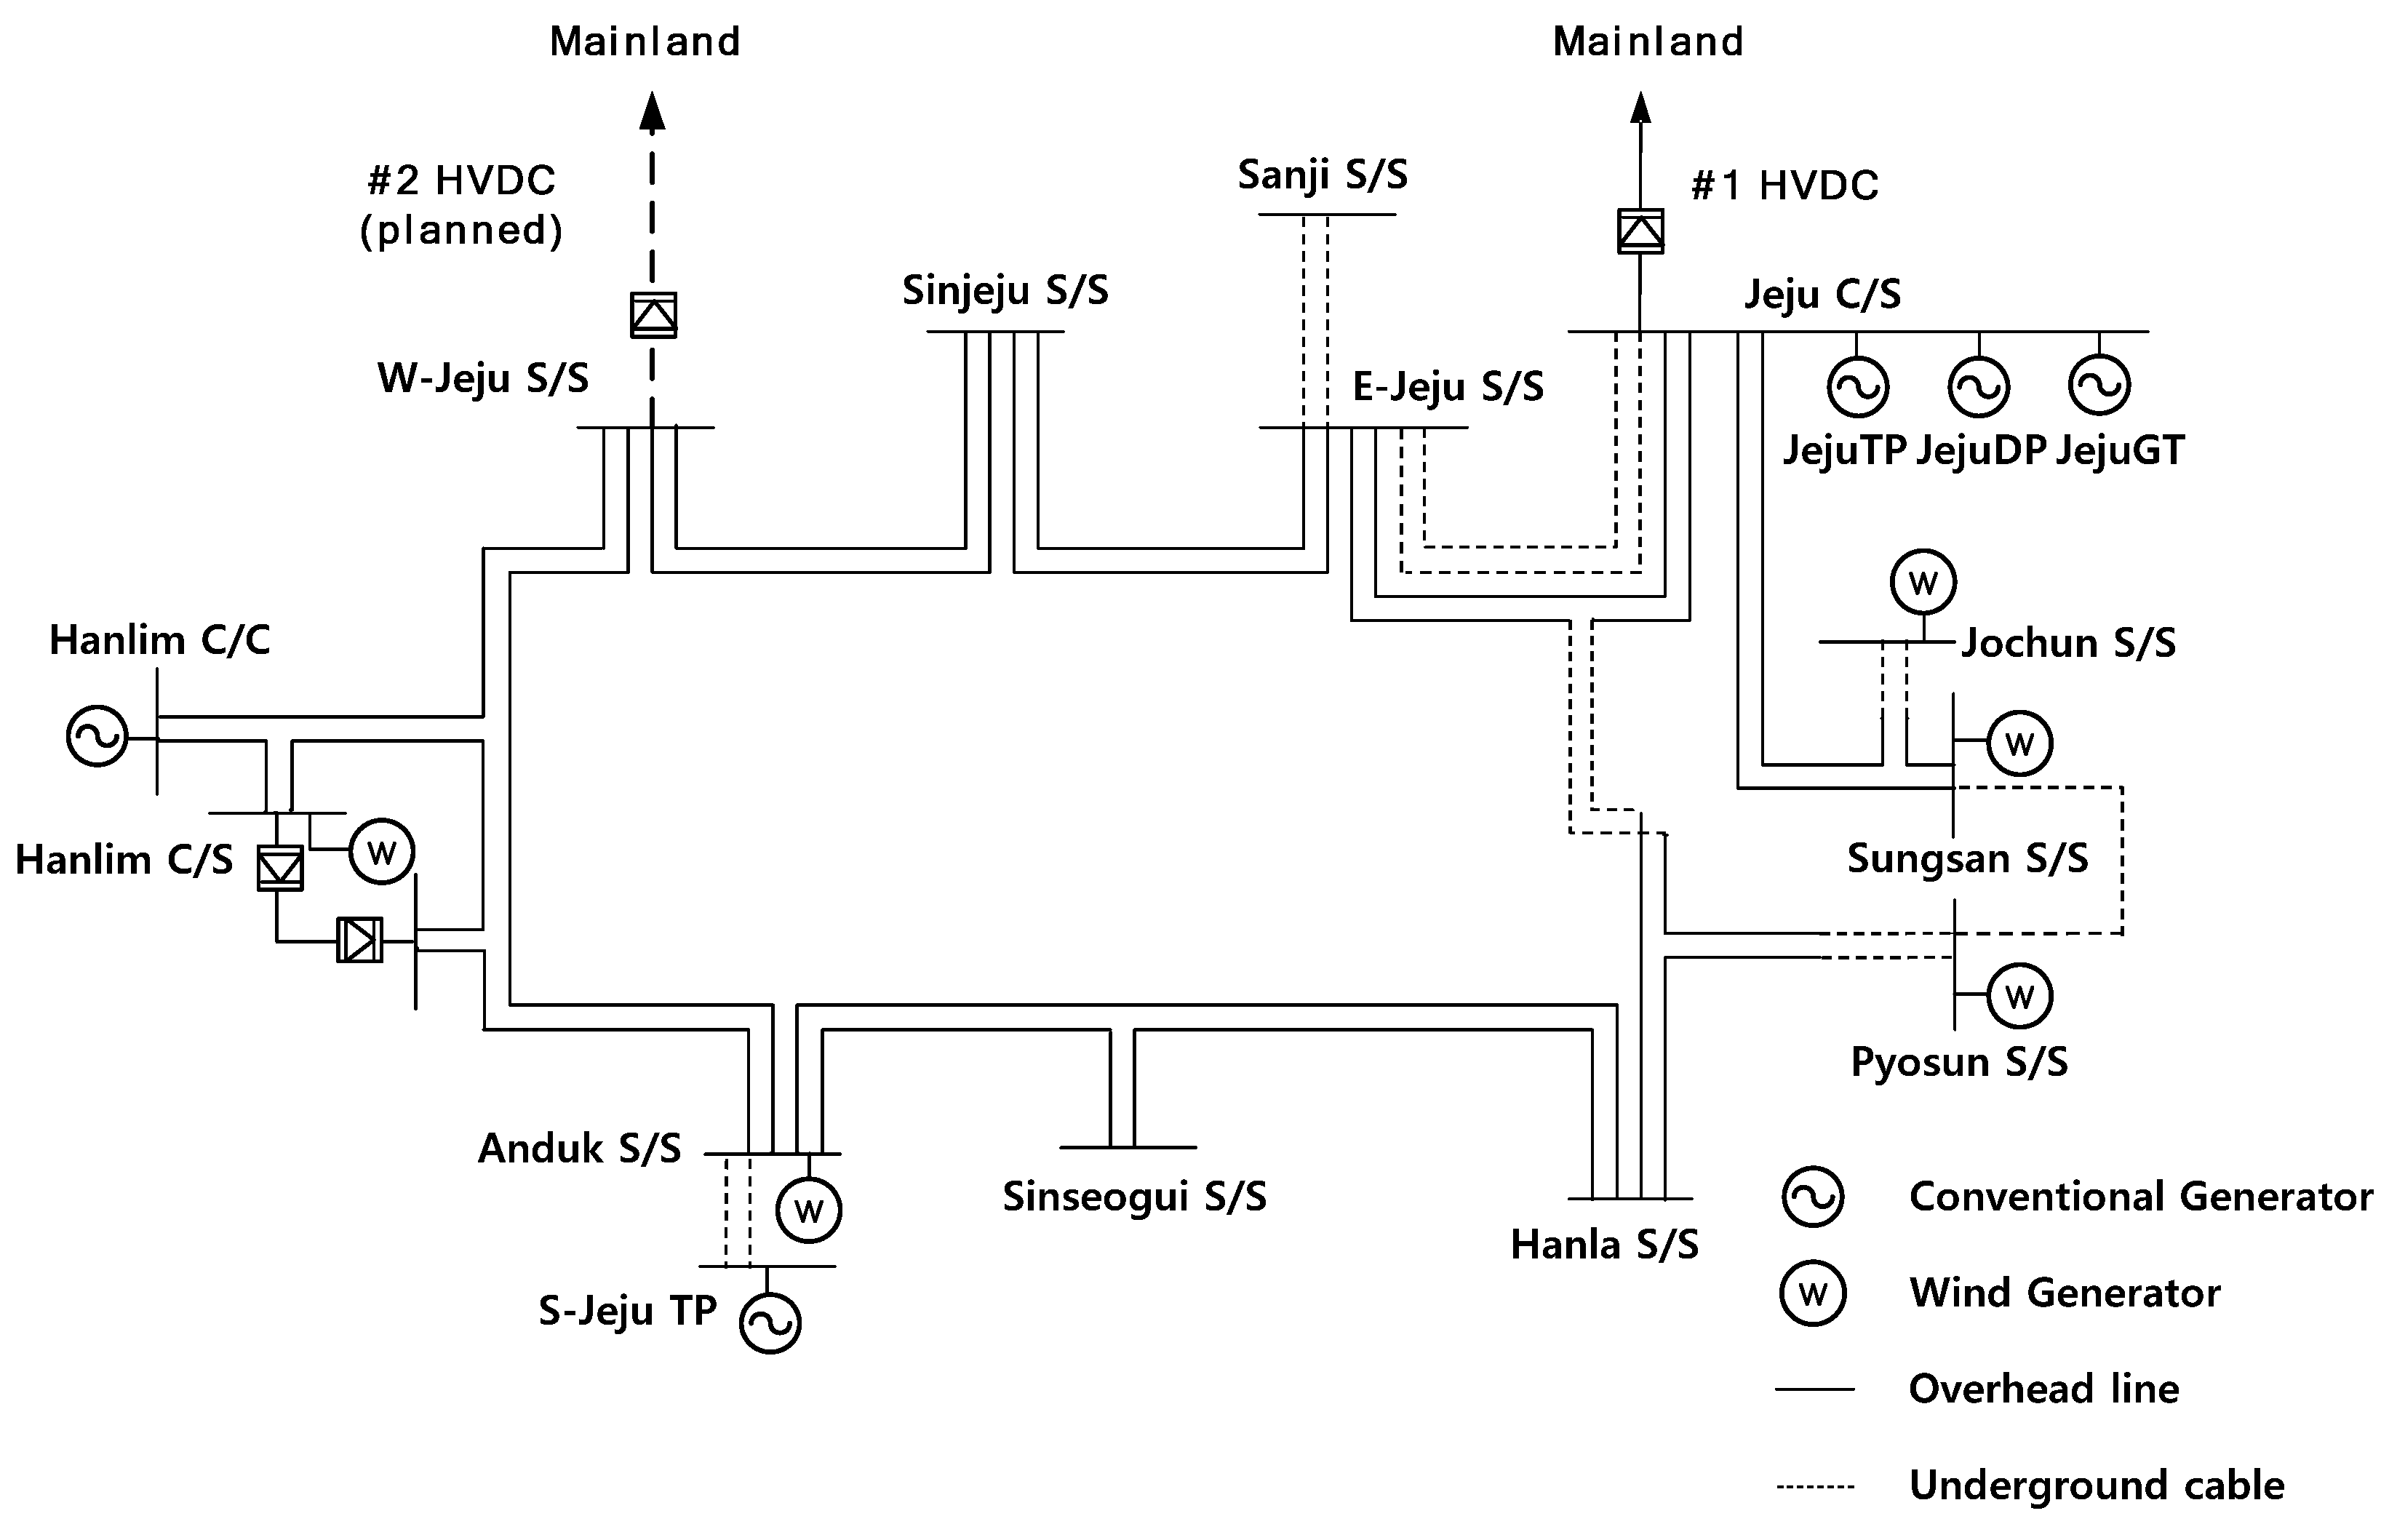
3.1. Introduction of the Jeju Island Power System

The proposed analysis and simulation were performed on the basis of Jeju Island power system data in 2013 of the 6th power system planning of MKE. The schematic diagram of Jeju Island is shown in Figure 4. The peak load level on Jeju Island is 800 MW, and the off-peak load level is 300 MW [31]. A LCC HVDC inverter station is installed in the Jeju C/S bus, and six thermal generators are being operated to supply power to meet the demand load. Hanlim C/C is normally not in operation because of the high generation cost and because the HVDC system and other generators are able to meet the demand load. For wind power generation, approximately 630 MW in contracts have been ordered for installation. The rated capacity, technical minimum, inertia, and ramp rate of generators in Jeju Island are shown in Table 1.
Figure 4. Jeju Island power system diagram.
Energies 08 12425 g004
Table 1. Generators in Jeju Island operation.
GeneratorsPmax (MW)Pmin (MW)InertiaRamp Rate (MW/min)Rating (MVA)
Jeju GT#1 (SC)--2.56-50
Jeju GT#2 (SC)--2.56-50
Jeju DP#140266.712.044.96
Jeju DP#240266.712.044.96
S-Jeju TP#3100505.935130
S-Jeju TP#4100505.935130
Jeju TP#275425.4197.06
Jeju TP#375425.4197.06
Hanlim CC1054168.7150
The basic information of the installed HVDC system, including the topology, rating, firing angle in normal operation, and transformer reactance, is presented in Table 2. A unidirectional 300-MW LCC HVDC system was installed in 1998. The second LCC HVDC is undergoing a system operational test to be implemented. In this study, the effectiveness of a single HVDC system for wind power penetration is analyzed, and the analysis of bidirectional LCC and VSC replacement has been performed as a supplement.
Table 2. HVDC in Jeju Island operation.
SpecificationsHVDC Bipole 1Unit
Power rating150 × 2 (Bipoles)MW
Voltage180kV
Current840A
Gamma firing angle (inverter)27Deg
Power reversalNot available-
% Impedance of transformer12%
Smoothing reactor60mH

3.2. Power System Operation and Analysis Criteria
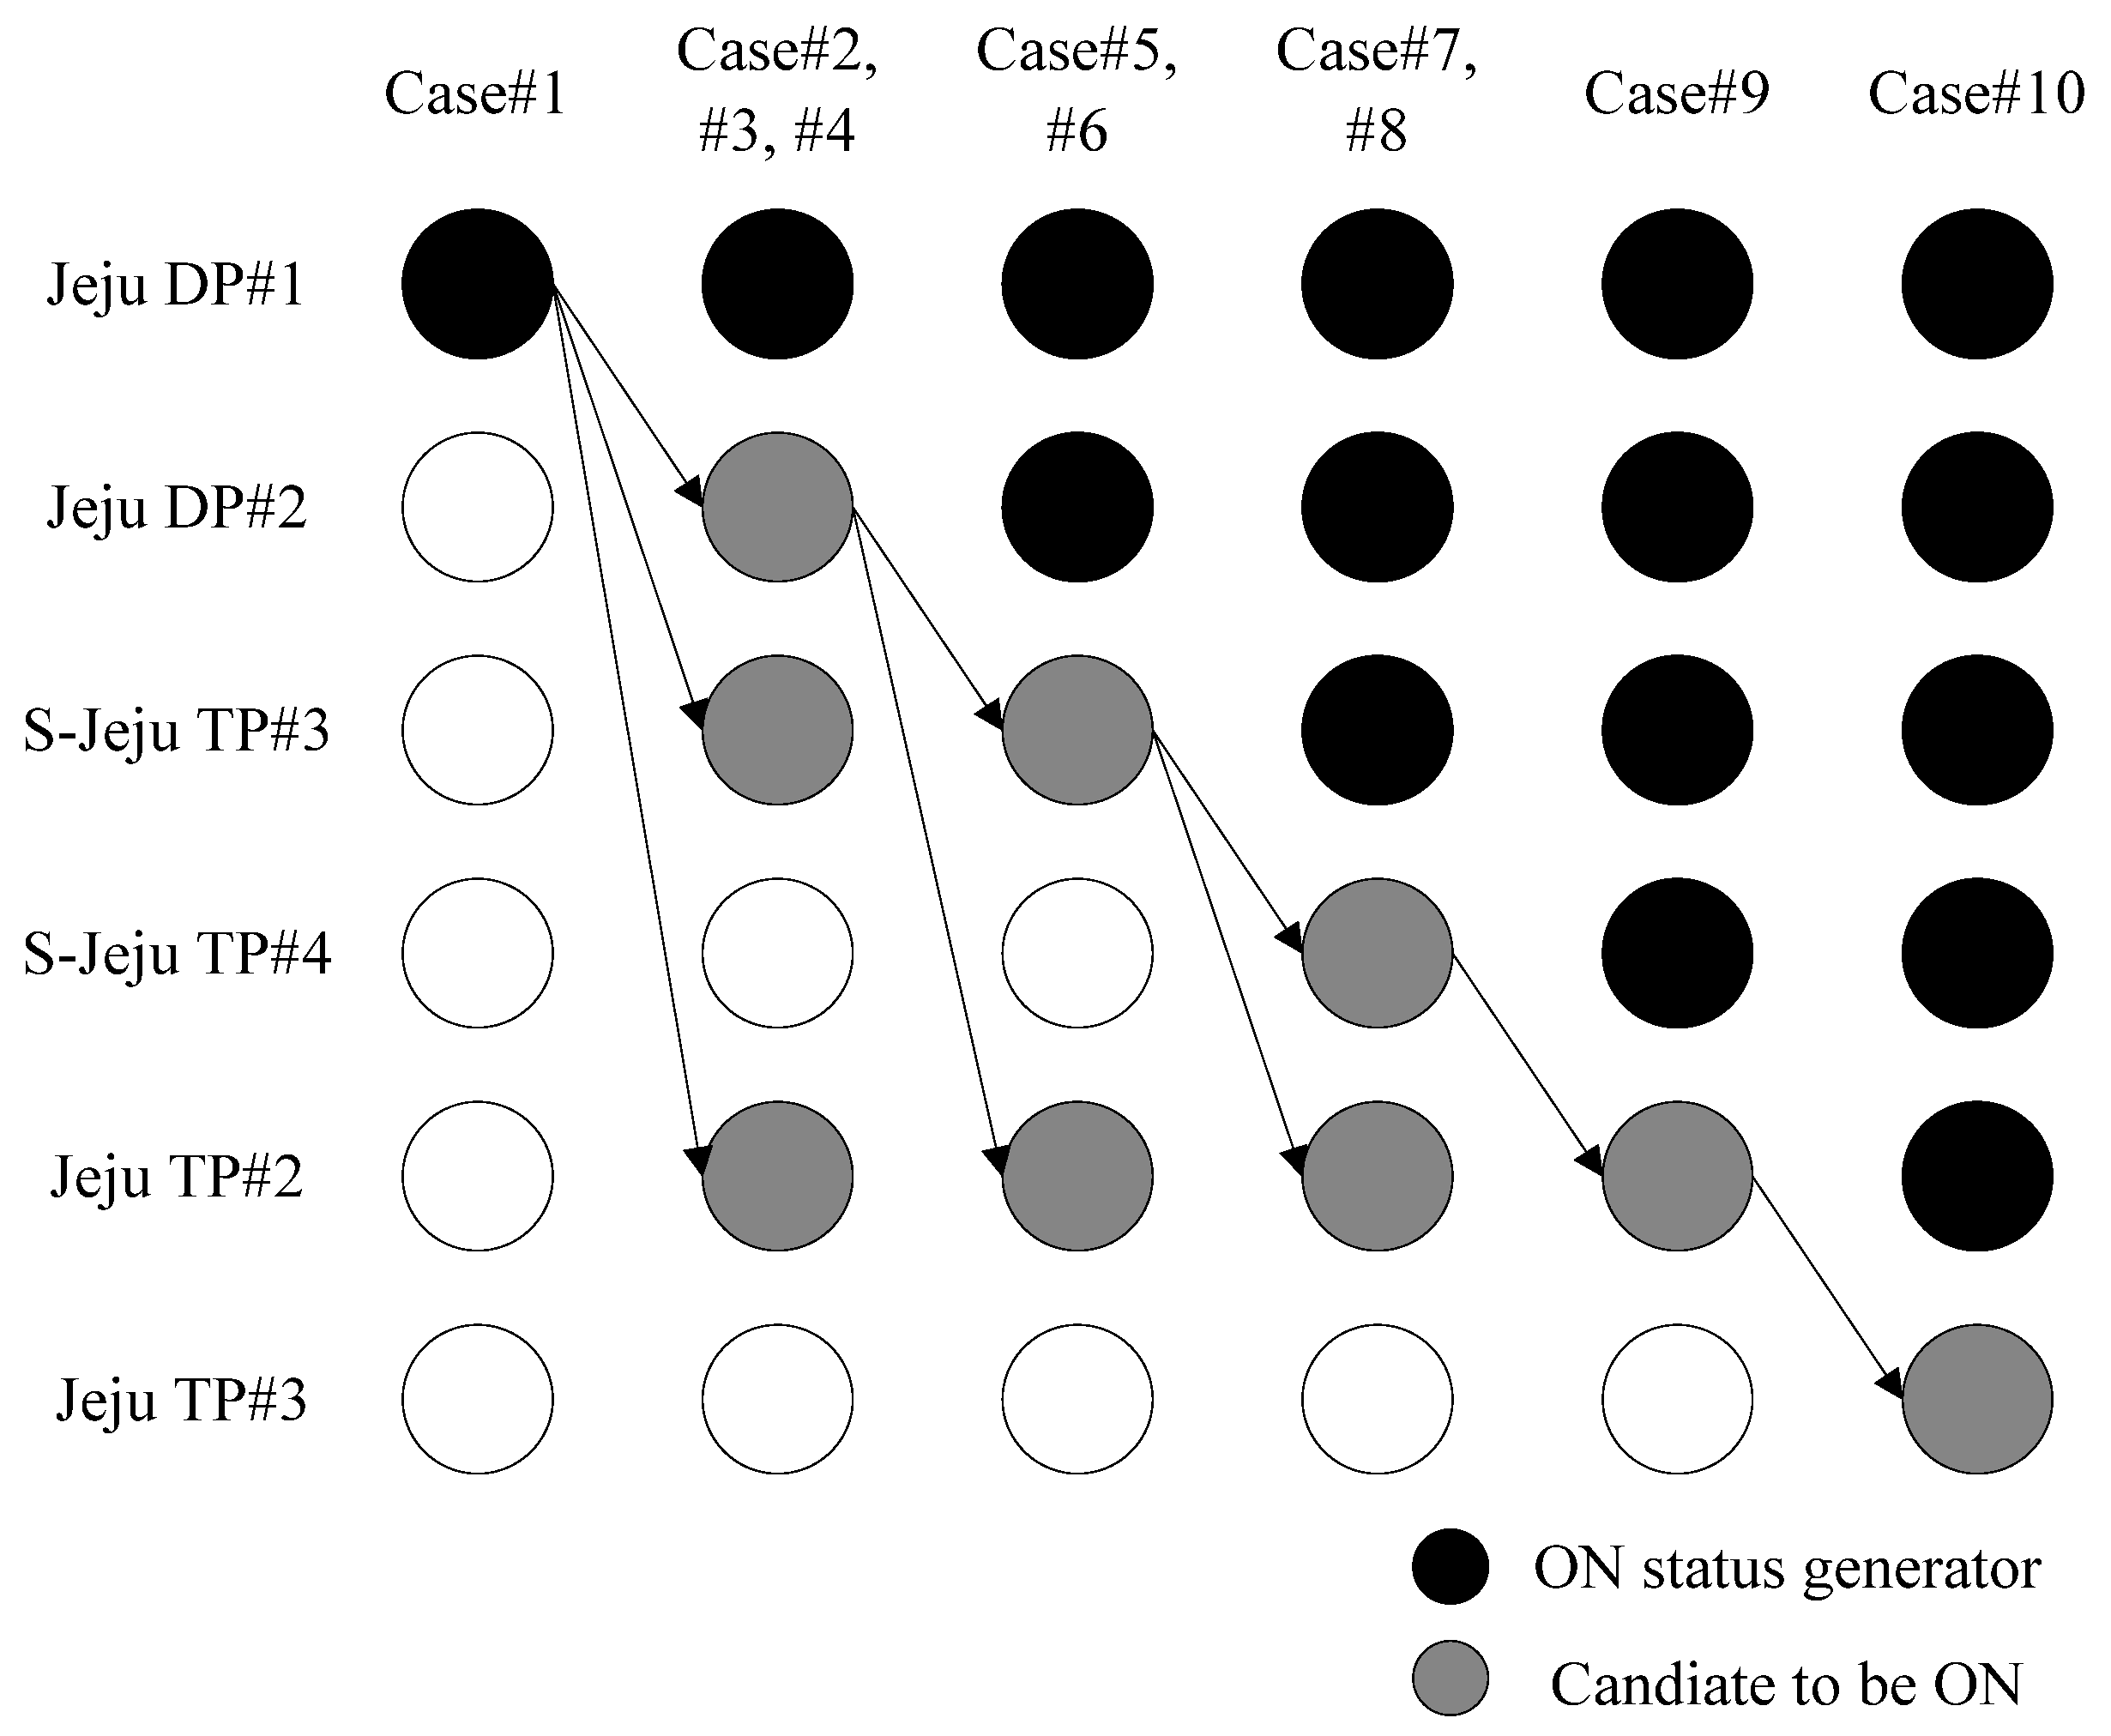
The generator input sequence by the merit order to satisfy the power balance and other constraints in Jeju Island generators is shown in Figure 5 and each generator operation case are shown in Table 3.
Figure 5. Jeju Island generation scenarios.
Energies 08 12425 g005
Table 3. Jeju Island generator in-service cases.
CaseJeju DP#1Jeju DP#2S-Jeju TP#3S-Jeju TP#4Jeju TP#2Jeju TP#3Pmax (MW)Pmin (MW)Ramp Rate (MW/min)
#1ON-----40262
#2ONON----80524
#3ON-ON- -140767
#4ON---ON-115683
#5ONONON- -1801029
#6ONON--ON-155945
#7ONONONON--28015214
#8ONONON ON-25514410
#9ONONONONON-35519415
#10ONONONONONON43023616
As explained above, short circuit capacity and rotational inertia of AC system is essential to operate LCC HVDC. Therefore, must-run generators and an HVDC system are required to be operated at minimum capacity to ensure system reliability and stability. The results of analysis criteria based on the case set of generation units are presented in Table 4.
Table 4. System analysis results considering Jeju #1 HVDC transmission. Short circuit capacity: SCC; effective short circuit ratio: ESCR.
CaseSpinning Reserve (MW)SCC (MVA)ESCRInertiaHdc
w/o HVDCWith Unidirectional LCCWith Bidirectional LCCWith VSC
#120280470470436.070.95813.682.71
#240300490490581.641.441115.363.72
#370330520520918.912.561584.585.28
#430290480480838.132.291337.814.46
#5903505405401018.872.901886.266.29
#650310500500939.122.631639.495.46
#71404005905901335.393.952657.168.86
#81003605505501376.384.092410.398.03
#91504106006001692.715.143181.2910.6
#101604206106102055.56.353705.4112.35
For an N − 1 contingency in the Jeju Island power system, 100 MVA S-Jeju TP is the largest power loss before HVDC construction. However, the largest power supplier is changed to the HVDC or the large-scale wind farms. As presented Section 2.1 and Section 2.4, the controllable units of the Jeju system have to compensate the outage of the largest power generation. The ramp rate to change the power output of conventional generators are not sufficient as spinning reserve or standby generation for the contingency. Therefore, the HVDC system transfers power from the mainland to Jeju or in the opposite direction rapidly. The point of an HVDC system is to increase frequency stability significantly with a rapid response and to make the power system flexible for large-scale wind power penetration.
In power and voltage stability analysis, CESCR calculations are being utilized for the analysis of the stable operation of an HVDC region. The MPC of the 300-MW LCC HVDC operation considering full capacity is shown in Figure 6. The minimum limit of stability is analyzed in Case 2 (MAP is where DC current is 0.86 kA) when SCC of Jeju Island system is 581.6 MVA. In other words, Case 2 set of generation units is almost the boundary for stable operation region with the LCC HVDC system. However, N − 1 contingency has to be considered, Case 5 is the optimal operation point considering and merit order and generator trip. In the case of a VSC HVDC system, there were no violation cases, and stable operation was possible with no generators, as explained in Section 2.6.
In system effective inertia analysis, the permissible maximum frequency decline by a more severe N − 1 contingency in Korea, such as an entire HVDC block failure, is 5%, and the maximum AC fault duration time is 100 ms. In the case of an HVDC system recovery time within 100 ms, the Hdc index of the power system should be over 2.0 for the system stability for HVDC operation. The result of the analysis on effective inertia has less of an effect on the must-run generator constraints. The frequency drop in Jeju Island caused by the largest generation loss can be sustained by two synchronous condensers and one generator unit in Case 1.
Figure 6. Maximum Power Curve of the Jeju system following different generation cases.
Energies 08 12425 g006
In addition, the amount of spinning reserve is being changed by the installed HVDC type, as explained in Section 2.2 and Section 2.5. For a unidirectional LCC HVDC system, the contribution to the spinning reserve increased compared to the situation without any interconnections. A minimum available operation point of the Jeju—Haenam HVDC system is 40 MW and approximately 0.13 p.u., and the margin to the rated capacity is 260 MW. In case of bidirectional LCC and VSC HVDC, the spinning reserve can be increased to 450 MW due to the − 150 MW reversal power flow function. Furthermore, the PSS/e simulation has been performed to compare the variation of voltage and frequency between with and without the VSC HVDC situation in off-peak load.

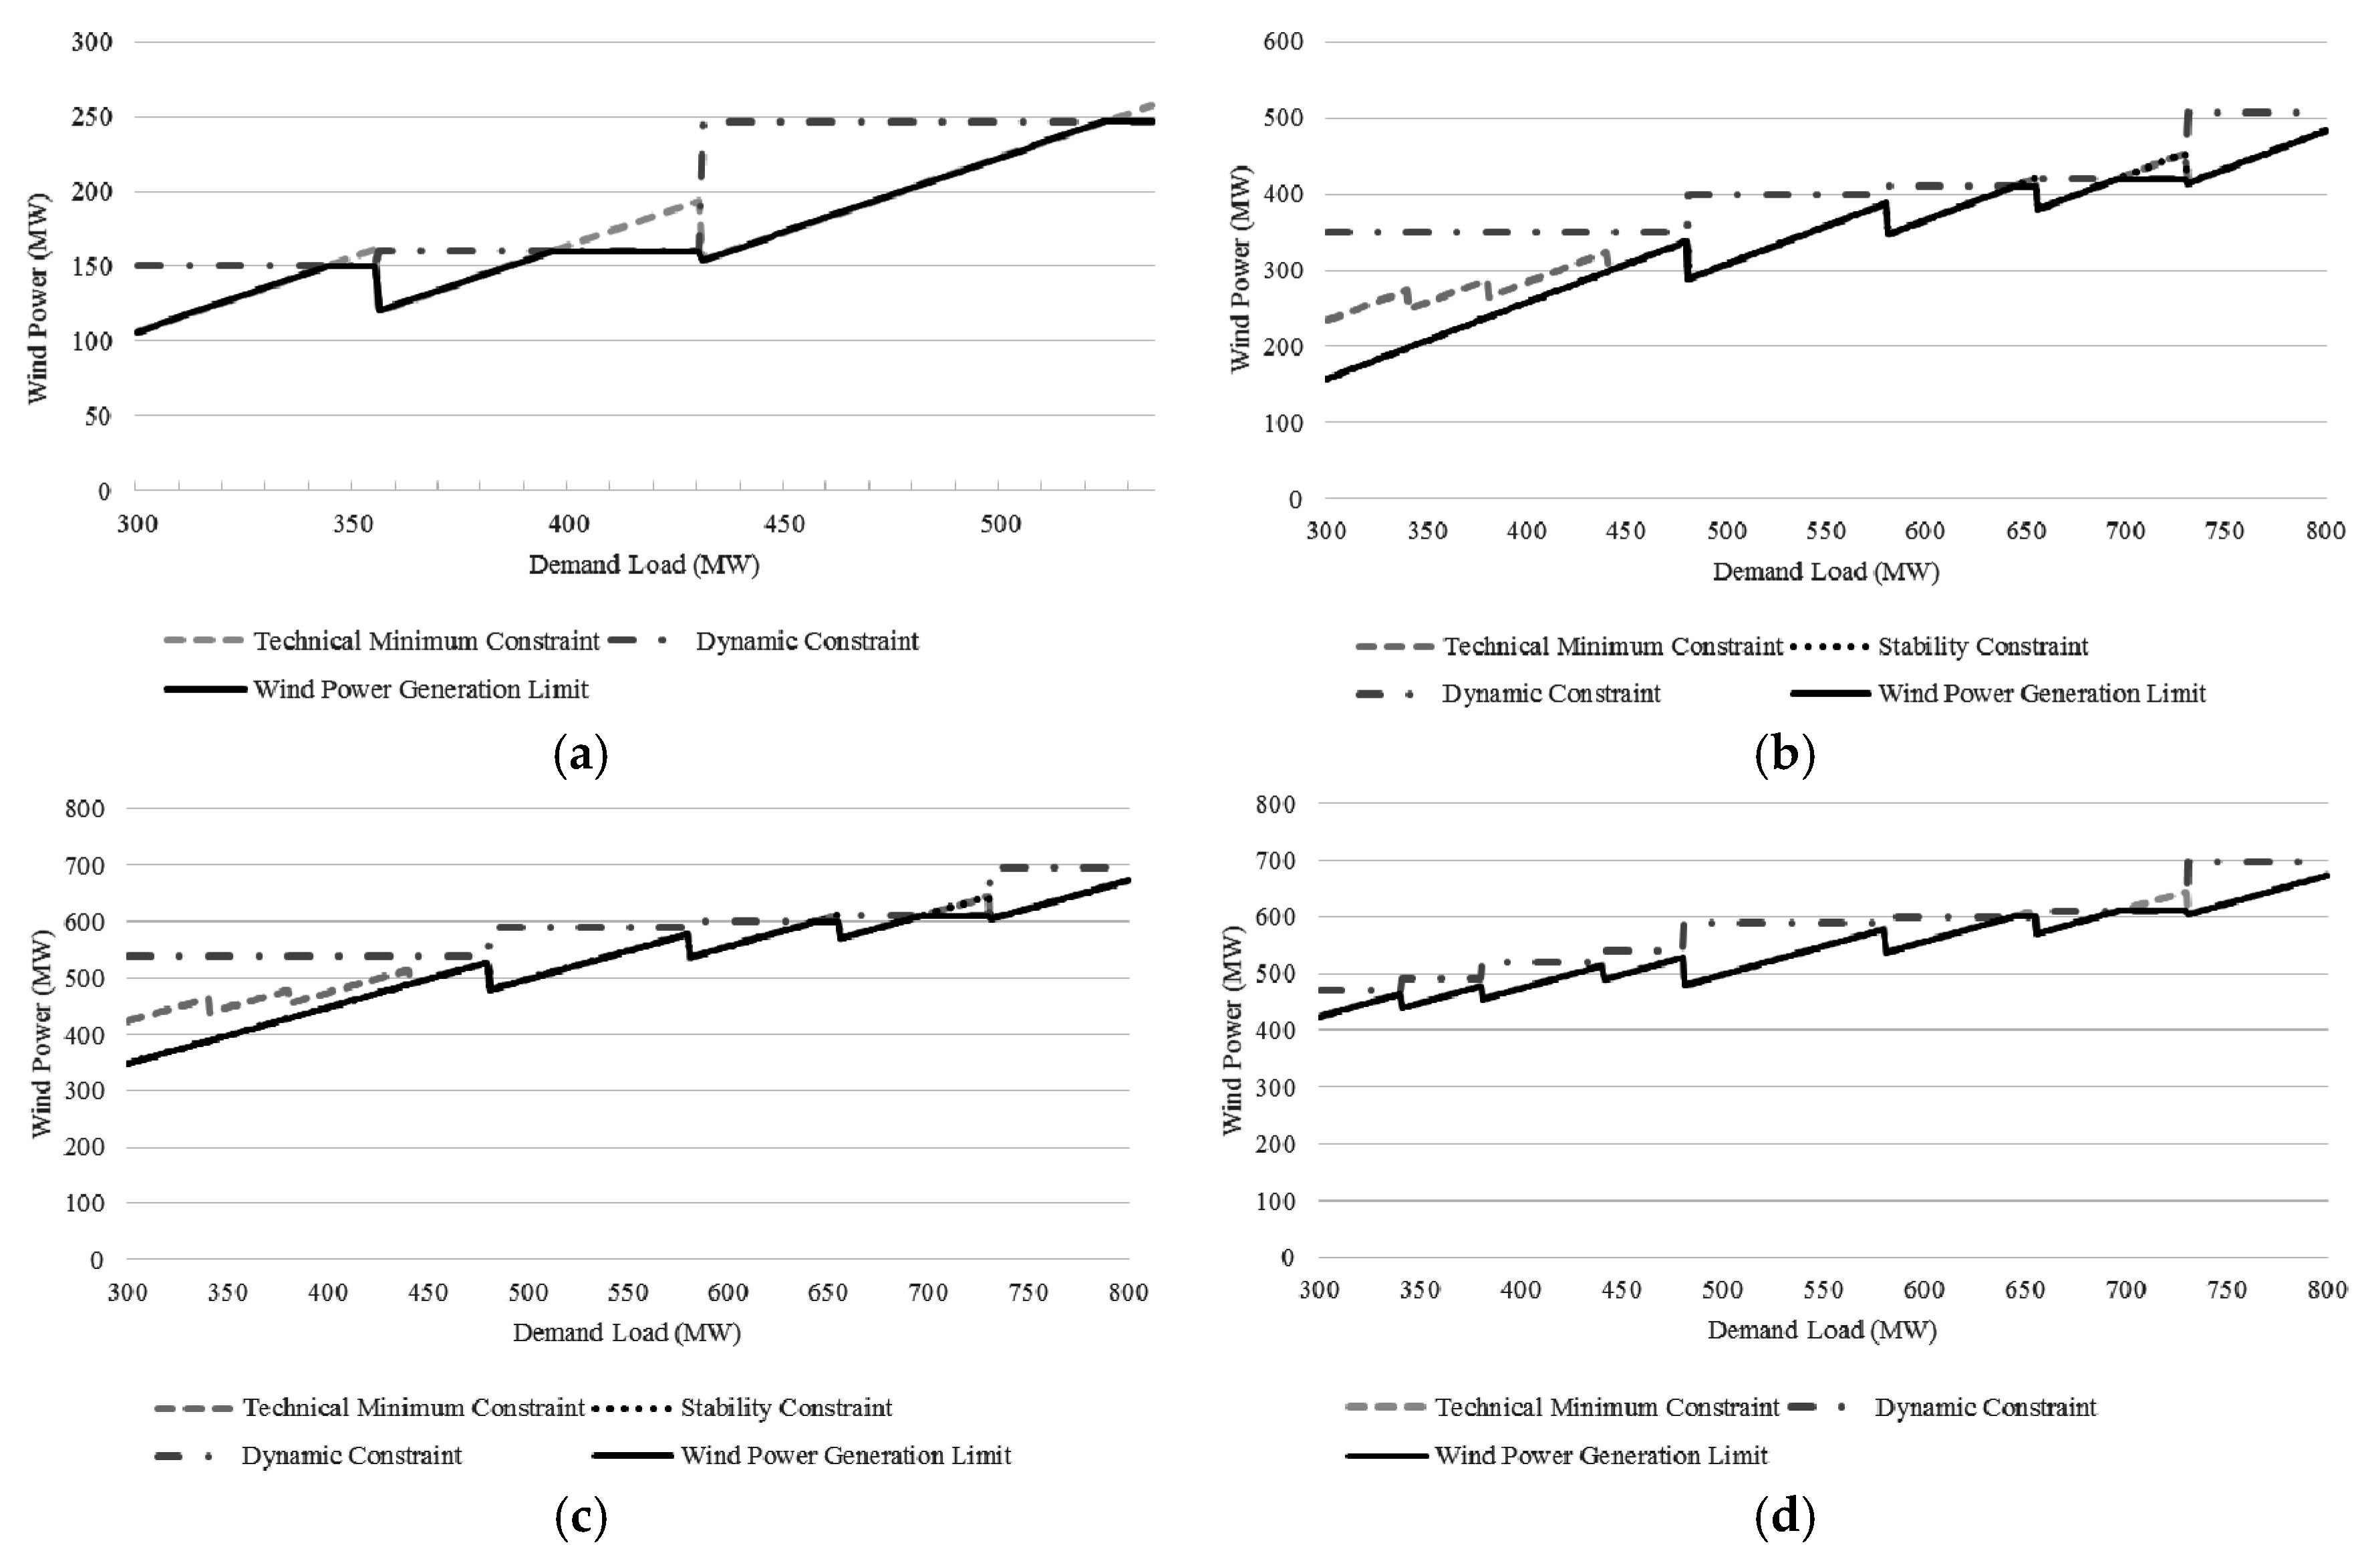
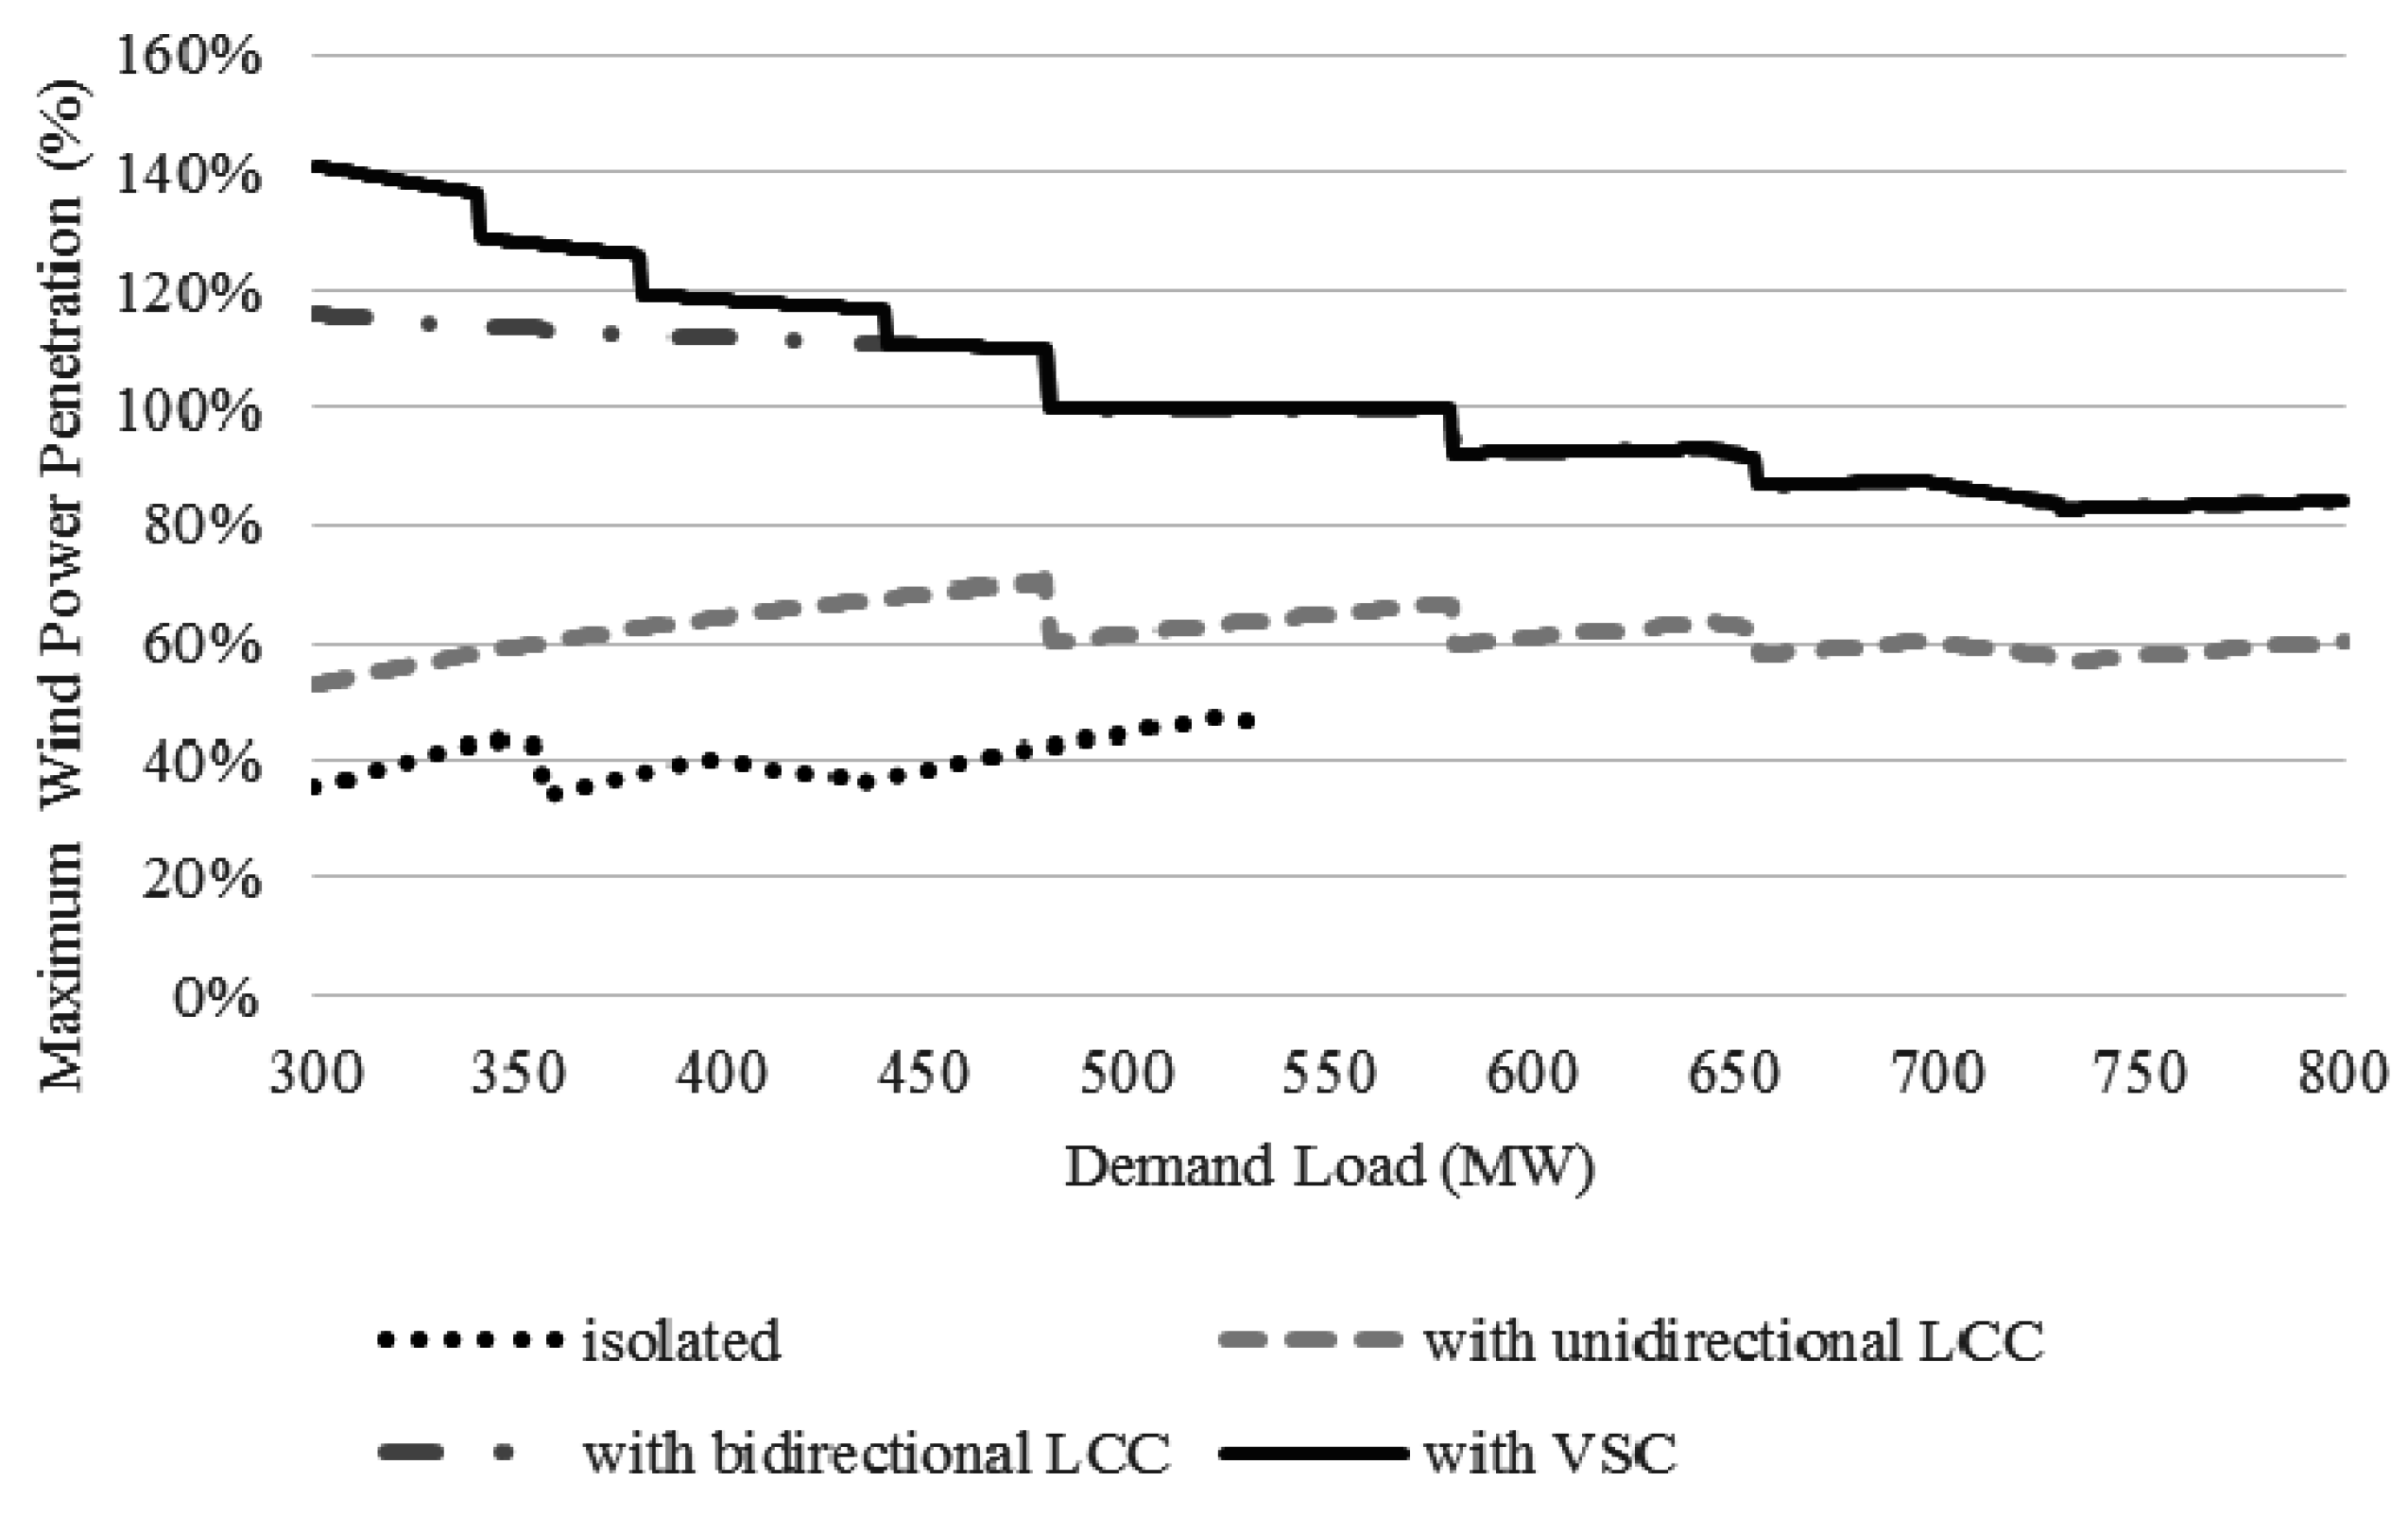
3.3. Maximum Wind Power Penetration Limit According to the Load Level

After the analysis of system reliability and stability constraints, the maximum wind power generation based on generator constraints and the HVDC operation point can be studied. The maximum fluctuation coefficient ( σ W ) of wind power generation in Jeju Island is 100%, considering a total loss of wind generation on the basis of the system operation rule of KPX [31]. As a result, the wind penetration limit according to the spinning reserve can be analyzed on the basis of Equations (13) and (14). According to the load level, the maximum wind power generation capacity is varied by the required generation mixture.
As shown in Figure 7a, only a small amount of wind power penetration is possible without any interconnections. The wind power penetration limit is mainly constrained by the technical minimum except the small part of dynamic constrained range by deficient spinning reserve. The unidirectional LCC HVDC system that is installed on Jeju Island for the current requires must-run generators to sustain the reliability and stability of the system. Especially, the limitation by stability constraint is calculated off-peak load level due to the weak AC power system characteristics. However, it is able to promote wind power penetration by a fast responsible capacity, as shown in Figure 7b. In the case of HVDC replacement for a bidirectional LCC or VSC HVDC system, the penetration level can be increased significantly, as shown in Figure 7c,d. The available wind power penetration rate based on Equation (23) of all cases is shown in Figure 8. The penetration rate is promoted by HVDC interconnection regardless of type. The significant gap between unidirectional and bidirectional LCC is caused by the permissible operation range described in Section 2.2. The difference of the penetration level exist between VSC and unidirectional LCC at off-peak load level. It is caused by that the stability constraint of the LCC HVDC leads to the more number of must-run thermal generators as explained above:
Penetration Rate = P W P W + P G + P DC
Figure 7. Maximum wind penetration in Jeju island, (a) w/o interconnection; (b) w/ unidirectional LCC HVDC; (c) w/ bidirectional LCC HVDC and (d) w/ VSC HVDC.
Energies 08 12425 g007
Figure 8. Wind power penetration rate according to HVDC interconnection.
Energies 08 12425 g008

4. Conclusions

It is a delicate problem for power system operators to implement an HVDC system or large-scale wind power generation in an island system. This paper describes an analytic model of power system operation including an LCC/VSC HVDC system to secure system reliability and stability, including N − 1 contingency analysis, power and voltage analysis, and effective inertia analysis. Subsequently, estimation was performed on the effect of each type of HVDC interconnection for the maximum wind power penetration limit considering the uncontrollable and variable characteristics of wind. The Jeju Island power system data and grid code of Korea was applied for the case study. As a result, there are significant differences depending on the types of HVDC in the must-run generator constraint to restrain system stability. Furthermore, a relation between the wind power penetration limit and the system constraints with a HVDC system was discovered. In addition to the above results, the superiority of the VSC HVDC system was ascertained for a wind power penetration level increase in an island power system. The analytic modeling of the maximum wind power penetration limit estimation depending on HVDC operation would be useful for an economic evaluation of HVDC system installation and the establishment of an optimal system operational strategy.

Acknowledgments

This work was supported by National Research Foundation of Korea (NRF) grant (No. NRF-2013R1A2A2A01067762) and Human Resources Development of KETEP Grant (No. 20134030200340) funded by the Korea government Ministry of Knowledge Economy.

Author Contributions

The authors have contributed equally in writing and revision of this manuscript.

Conflicts of Interest

The authors declare no conflict of interest.

Nomenclature

P G Total power generation of i-th generator
P G . i Power generation of i-th generator
P min . i Minimum active power generation limit of i-th generator
P max . i Maximum active power generation limit of i-th generator
U R i Ramp-up rate of i-th generator
U D i Ramp-down rate of i-th generator
t Ramp up/down time
P RU . i Generation ramp-up capacity of i-th generator
P RD . i Generation ramp-down capacity of i-th generator
P DC HVDC power transfer
P DC . rated Rated capacity of HVDC
τMinimum HVDC operation point coefficient (p.u.)
P USR Up spinning reserve capacity
P DSR Down spinning reserve capacity
σ W Wind power fluctuation coefficient
U AC terminal voltage
U d DC voltage
P L Demand load in the system
P W Total wind power generation in the system
P W . i Wind power generation of i-th wind farm
Q d Reactive power consumption of HVDC system
Q c Reactive power compensation by shunt element
V d 0 No-load DC voltage
I d DC current
αFiring(delay) angle
μOverlap angle
γExtinction angle
SCC Short circuit capacity at converter bus
H i Rotational inertia constant of i-th machine
S MVA . i MVA rating of i-th machine
f Frequency deviation (p.u)
P i Power mismatch (p.u)
f 0 System nominal frequency
t Power loss period
t f Fault duration time
t r Power recovery time
CCCombined cycle gas turbine power-plant
GTGas turbine power-plant
DPDiesel engine power-plant
TPThermal power-plant

References

  1. Kennedy, S. Wind power planning: Assessing long-term costs and benefits. Energy Policy 2005, 33, 1661–1675. [Google Scholar] [CrossRef]
  2. Snyder, B.; Kaiser, M.J. Ecological and economic cost-benefit analysis of offshore wind energy. Renew. Energy 2008, 34, 1567–1578. [Google Scholar] [CrossRef]
  3. Wind Energy—The Facts: Costs & Prices; The European Wind Energy Association (EWEA): Brussels, Belgium, 2009; Volume 2, pp. 94–110.
  4. The European Wind Energy Association (EWEA). Wind in Power: 2013; European Statistics: Brussels, Belgium, 2014. [Google Scholar]
  5. 2012 Wind Technologies Market Report; U.S. Department of Energy: Washington, DC, USA, 2013.
  6. ERCOT Grid Operations Wind Integration Report; ERCOT: Austin TX, USA, 2014.
  7. Clausen, N.; Bindner, H.; Frandsen, S.; Hansen, J.C.; Hansen, L.H.; Lundsager, P. Isolated Systems with Wind Power an Implementation Guideline; Risø National Laboratory Technical Report Riso-R-1257 (EN); Risø National Laboratory: Roskilde, Denmark, 2001. [Google Scholar]
  8. Weisser, D.; Garcia, R.S. Instantaneous wind energy penetration in isolated electricity grids: Concepts and review. Renew. Energy 2005, 30, 1299–1308. [Google Scholar] [CrossRef]
  9. Milligan, M.; Kirby, B. Impact of Electric Industry Structure on High Wind Penetration Potential; National Renewable Energy Laboratory: Golden, CO, USA, 2009. [Google Scholar]
  10. Peter, B.E.; Thomas, A.; Hans, A.; Paul, S.; Wilhelm, W.; JuanMa, R.G. System operation with high wind penetration. IEEE Power Energy Mag. 2005, 3, 65–74. [Google Scholar]
  11. Integration of Large Scale Wind Generation Using HVDC and Power Electronics; Conseil International des Grands Réseaux Électriques Working Group B4.39: Paris, France, 2009.
  12. Papathanassiou, S.A.; Boulaxis, N.G. Power limitations and energy yield evaluation for wind farms operating in island systems. Renew. Energy 2006, 31, 457–479. [Google Scholar] [CrossRef]
  13. Luo, C.; Far, H.G.; Banakar, H.; Keung, P.; Ooi, B. Estimation of wind penetration as limited by frequency deviation. IEEE Trans. Energy Convers. 2007, 22, 783–791. [Google Scholar] [CrossRef]
  14. Chen, C.-L.; Lee, T.-Y.; Jan, R.-M. Optimal wind-thermal coordination dispatch in isolated power systems with large integration of wind capacity. Energy Convers. Manag. 2006, 47, 3456–3472. [Google Scholar] [CrossRef]
  15. Francisco, D.; Andreas, S.; Oriol, G.; Roberto, V. A review of energy storage technologies for wind power applications. Renew. Sustain. Energy Rev. 2012, 16, 2154–2171. [Google Scholar]
  16. Shan, J.; Botterud, A.; Ryan, S.M. Impact of Demand Response on Thermal Generation Investment with High Wind Penetration. IEEE Trans. Smart Grid 2013, 4, 2374–2383. [Google Scholar]
  17. Margaris, I.D.; Papathanassiou, S.A.; Hatziargyriou, N.D.; Hansen, A.-D.; Sorensen, P. Frequency Control in Autonomous Power Systems with High Wind Power Penetration. IEEE Trans. Sustain. Energy 2012, 3, 189–199. [Google Scholar] [CrossRef]
  18. Nasrolahpour, E.; Ghasemi, H. A stochastic security constrained unit commitment model for reconfigurable networks with high wind power penetration. Electr. Power Syst. Res. 2015, 121, 341–350. [Google Scholar] [CrossRef]
  19. Lyu, Y.; Liang, J.; Yan, J.; Yu, Z.; Sun, S.; Lu, G. On-line probabilistic dynamic security assessment considering large scale wind power penetration. In Proceedings of the International Conference on Power System Technology (POWERCON), Chengdu, China, 20–22 October 2014; pp. 2635–2641.
  20. Liu, W.; Liu, L.; Xu, G.; Liang, F.; Yang, Y.; Zhang, W.; Wu, Y. A Novel Hybrid-Fuel Storage System of Compressed Air Energy for China. Energies 2014, 7, 4988–5010. [Google Scholar] [CrossRef]
  21. Barberis Negra, N.; Todorovic, J.; Ackermann, T. Loss evaluation of HVAC and HVDC transmission solutions for large offshore wind farms. Electr. Power Syst. Res. 2006, 76, 916–927. [Google Scholar] [CrossRef]
  22. Bresesti, P.; Kling, W.L.; Hendriks, R.L.; Vailati, R. HVDC Connection of Offshore Wind Farms to the Transmission System. IEEE Trans. Energy Convers. 2007, 22, 37–43. [Google Scholar] [CrossRef]
  23. Wang, L.; Thi, M. Comparative Stability Analysis of Offshore Wind and Marine-Current Farms Feeding Into a Power Grid Using HVDC Links and HVAC Line. IEEE Trans. Power Deliv. 2013, 28, 2162–2171. [Google Scholar] [CrossRef]
  24. Bahrman, M. Offshore Wind Connections: HVDC for Offshore Grids; UWIG Technical Workshop: Maui, HI, USA, 2011. [Google Scholar]
  25. Chou, C.; Wu, Y.; Han, G.; Lee, C. Comparative Evaluation of the HVDC and HVAC Links Integrated in a Large Offshore Wind Farm—An Actual Case Study in Taiwan. IEEE Trans. Ind. Appl. 2012, 48, 1639–1648. [Google Scholar] [CrossRef]
  26. Kim, C.; Sood, V.K.; Jang, G. HVDC Transmission; Wiley: Hoboken, NJ, USA, 2009. [Google Scholar]
  27. Banakar, H.; Luo, C.; Ooi, B.T. Impacts of Wind Power Minute-to-Minute Variations on Power System Operation. Electr. Power Syst. Res. 2008, 23, 150–160. [Google Scholar] [CrossRef]
  28. Zhang, L.; Harnefors, L.; Nee, H.P. Modeling and control of VSC-HVDC links connected to island systems. IEEE Trans. Power Syst. 2011, 26, 783–793. [Google Scholar] [CrossRef]
  29. Kim, E.; Kim, J.; Kim, S.; Choi, J.; Lee, K.; Kim, H. Impact Analysis of Wind Farms in the Jeju Island Power System. IEEE Syst. J. 2012, 6, 134–139. [Google Scholar] [CrossRef]
  30. Park, J.; Park, Y.; Moon, S. Instantaneous Wind Power Penetration in Jeju Island. In Proceedings of the IEEE Power Engineering Society General Meeting, Pittsburgh, PA, USA, 20–24 July 2008.
  31. A Long-Term View of Power System Operation; Korea Power Exchange: Seoul, Korea, 2013; pp. 251–268.
  32. Ackermann, T. Wind Power in Power Systems; John Wiley & Sons, Ltd.: Chichester, UK, 2005. [Google Scholar]
  33. Kundur, P. Power System Stability and Control; McGraw-Hill Education: Columbus, OH, USA, 1994. [Google Scholar]
  34. Western Electricity Coordinating Council. Operating Reserves; WECC Standard BAL-STD-002-0; Western Electricity Coordinating Council: Salt Lake City, UT, USA, 2007. [Google Scholar]
  35. On Voltage and Power Stability in AC/DC Systems; Conseil International des Grands Réseaux Électriques Working Group 14.05: Paris, France, 2003.
  36. Franken, B.; Andersson, G. Analysis of HVDC converters connected to weak AC systems. IEEE Trans. Power Syst. 1990, 5, 235–242. [Google Scholar] [CrossRef]
  37. Denis, L.H.A.; Andersson, G. Voltage stability analysis of multi-infeed HVDC systems. IEEE Trans. Power Deliv. 1997, 12, 1309–1318. [Google Scholar]
  38. IEEE Guide for Planning DC Links Terminating at AC Locations Having Low Short-Circuit Capacities; IEEE Standard 1204-1997; IEEE: Piscataway, NJ, USA, 1997.

