Review

Review of Physicochemical-Based Diagnostic Techniques for Assessing Insulation Condition in Aged Transformers

by
Janvier Sylvestre N’cho
1,
Issouf Fofana
2,*,
Yazid Hadjadj
2 and
Abderrahmane Beroual
3
1
Département Génie Électrique et Électronique, Institut National Polytechnique Houphouët Boigny (INP-HB), BP 1093 Yamoussoukro, Ivory Coast
2
Research Chair on the Aging of Power Network Infrastructure (ViAHT), Université du Québec à Chicoutimi, 555 Boulevard de l’Université, Chicoutimi, QC G7H 2B1, Canada
3
Ecole Centrale de Lyon, Université de Lyon, Ampère CNRS UMR 5005, 36 Avenue Guy de Collongue, 69134 Ecully, France
*
Author to whom correspondence should be addressed.
Energies 2016, 9(5), 367; https://doi.org/10.3390/en9050367
Submission received: 23 March 2016 / Revised: 23 April 2016 / Accepted: 3 May 2016 / Published: 13 May 2016
(This article belongs to the Special Issue Power Transformer Diagnostics, Monitoring and Design Features)

Abstract

:
A power transformer outage has a dramatic financial consequence not only for electric power systems utilities but also for interconnected customers. The service reliability of this important asset largely depends upon the condition of the oil-paper insulation. Therefore, by keeping the qualities of oil-paper insulation system in pristine condition, the maintenance planners can reduce the decline rate of internal faults. Accurate diagnostic methods for analyzing the condition of transformers are therefore essential. Currently, there are various electrical and physicochemical diagnostic techniques available for insulation condition monitoring of power transformers. This paper is aimed at the description, analysis and interpretation of modern physicochemical diagnostics techniques for assessing insulation condition in aged transformers. Since fields and laboratory experiences have shown that transformer oil contains about 70% of diagnostic information, the physicochemical analyses of oil samples can therefore be extremely useful in monitoring the condition of power transformers.

1. Introduction

Today’s power transformers constitute a major part of the capital equipment of power utilities all over the world. It is therefore important they function reliably. They are indispensable equipment for power generation plants, transmission systems and large industrial plants. Outage of power transformers while in service usually lead to significant revenue loss to the utility, potential environmental damage, explosion and fire hazards and expensive repairing or replacement costs. The cost of replacing the transformers varies from a few hundred dollars to several million dollars [1]. Early detection of problems can reduce repair costs by 75 percent and loss of revenue by 60 percent, and that annual cost savings equal to two percent of the price of a new transformer—i.e., approximately 40,000 to 80,000 US dollars (USD)—can be achieved [2]. Hence, it is desirable that the transformers should be utilized to the maximum extent consistent with adequate service life [3]. In order to reach such a device management, diagnostic techniques and condition monitoring are becoming increasingly important in assessing the condition of transformers and prevent incipient electrical failures. Any improved preventive maintenance procedures should help extending their life.
In these important machines, the Achilles heel is the insulation system, i.e.,: (a) insulation between the high voltage (HV) winding and the tank; (b) insulation between the HV and the low voltage (LV) windings; and (c) inter-phase insulation. These parts are the most sensitive to the insulation deterioration as they usually have the smallest margins in the dielectric strength. The life of the transformer is actually the life of the internal insulation system. Analysis of the insulating system, consisting of oil and paper provides information not only on the quality of the latter, but also can detect the warning signs of failure. The monitoring of the solid and liquid insulation in these machines is therefore of utmost importance [3]. By monitoring accurately the condition of the insulation, it is possible to detect on time incipient defects and avoid potential failures. Consequently, an effective approach to maintenance can be adopted and the optimum intervals determined for replacement. Common diagnostic techniques for transformers rely on testing based on physical, chemical, and electrical parameters. Physical measurements, in general, involve measurement of temperature, vibration, acoustic emission, etc. However, the diagnostic methods that give useful information on transformation insulation condition are chemical and electrical tests [3]. The term “diagnostics” indicates incorporation of advanced analysis that are capable of performing reliable assessment of equipment condition and suggesting actions to be taken. As each diagnosis method is developed and applied in real-life situations, it is always weighed up against other methods [3]. Methods that have been established over the years satisfy important criteria, among which [4]: sensitivity to important parameters of transformer condition, reproducibility of results over time and for different testing personnel, compensation of raw data for significant environmental effects like temperature, good correlation with other established methods availability of valuable information for the time and expense involved. The purposes of diagnostic testing are threefold: (a) to identify increased aging aspects; (b) to identify the cause of aging; and (c) to identify, if possible, the most appropriate corrective actions.
The life of the transformer being connected with that of its insulation, the evaluation of the insulation system condition is essential to assess the condition of the transformer when new and after several years of use. This evaluation necessarily involves both electrical and physicochemical techniques/diagnostic methods. The currently used techniques include modern methods and improved conventional techniques, allowing providing additional information on the condition of insulation. Figure 1 adapted from [5], sketches the functional based classification of oil properties. This review encompasses physicochemical-based diagnostic techniques for assessing insulation condition in aged transformers, while electrical-based diagnostic techniques are for concern in a companion paper submitted in this journal [6]. In addition to electrical methods, the physicochemical diagnostic methods are very important for the condition monitoring or for studying the degradation of electrical insulation in power transformer. This review is subdivided into traditional and modern diagnostic methods.

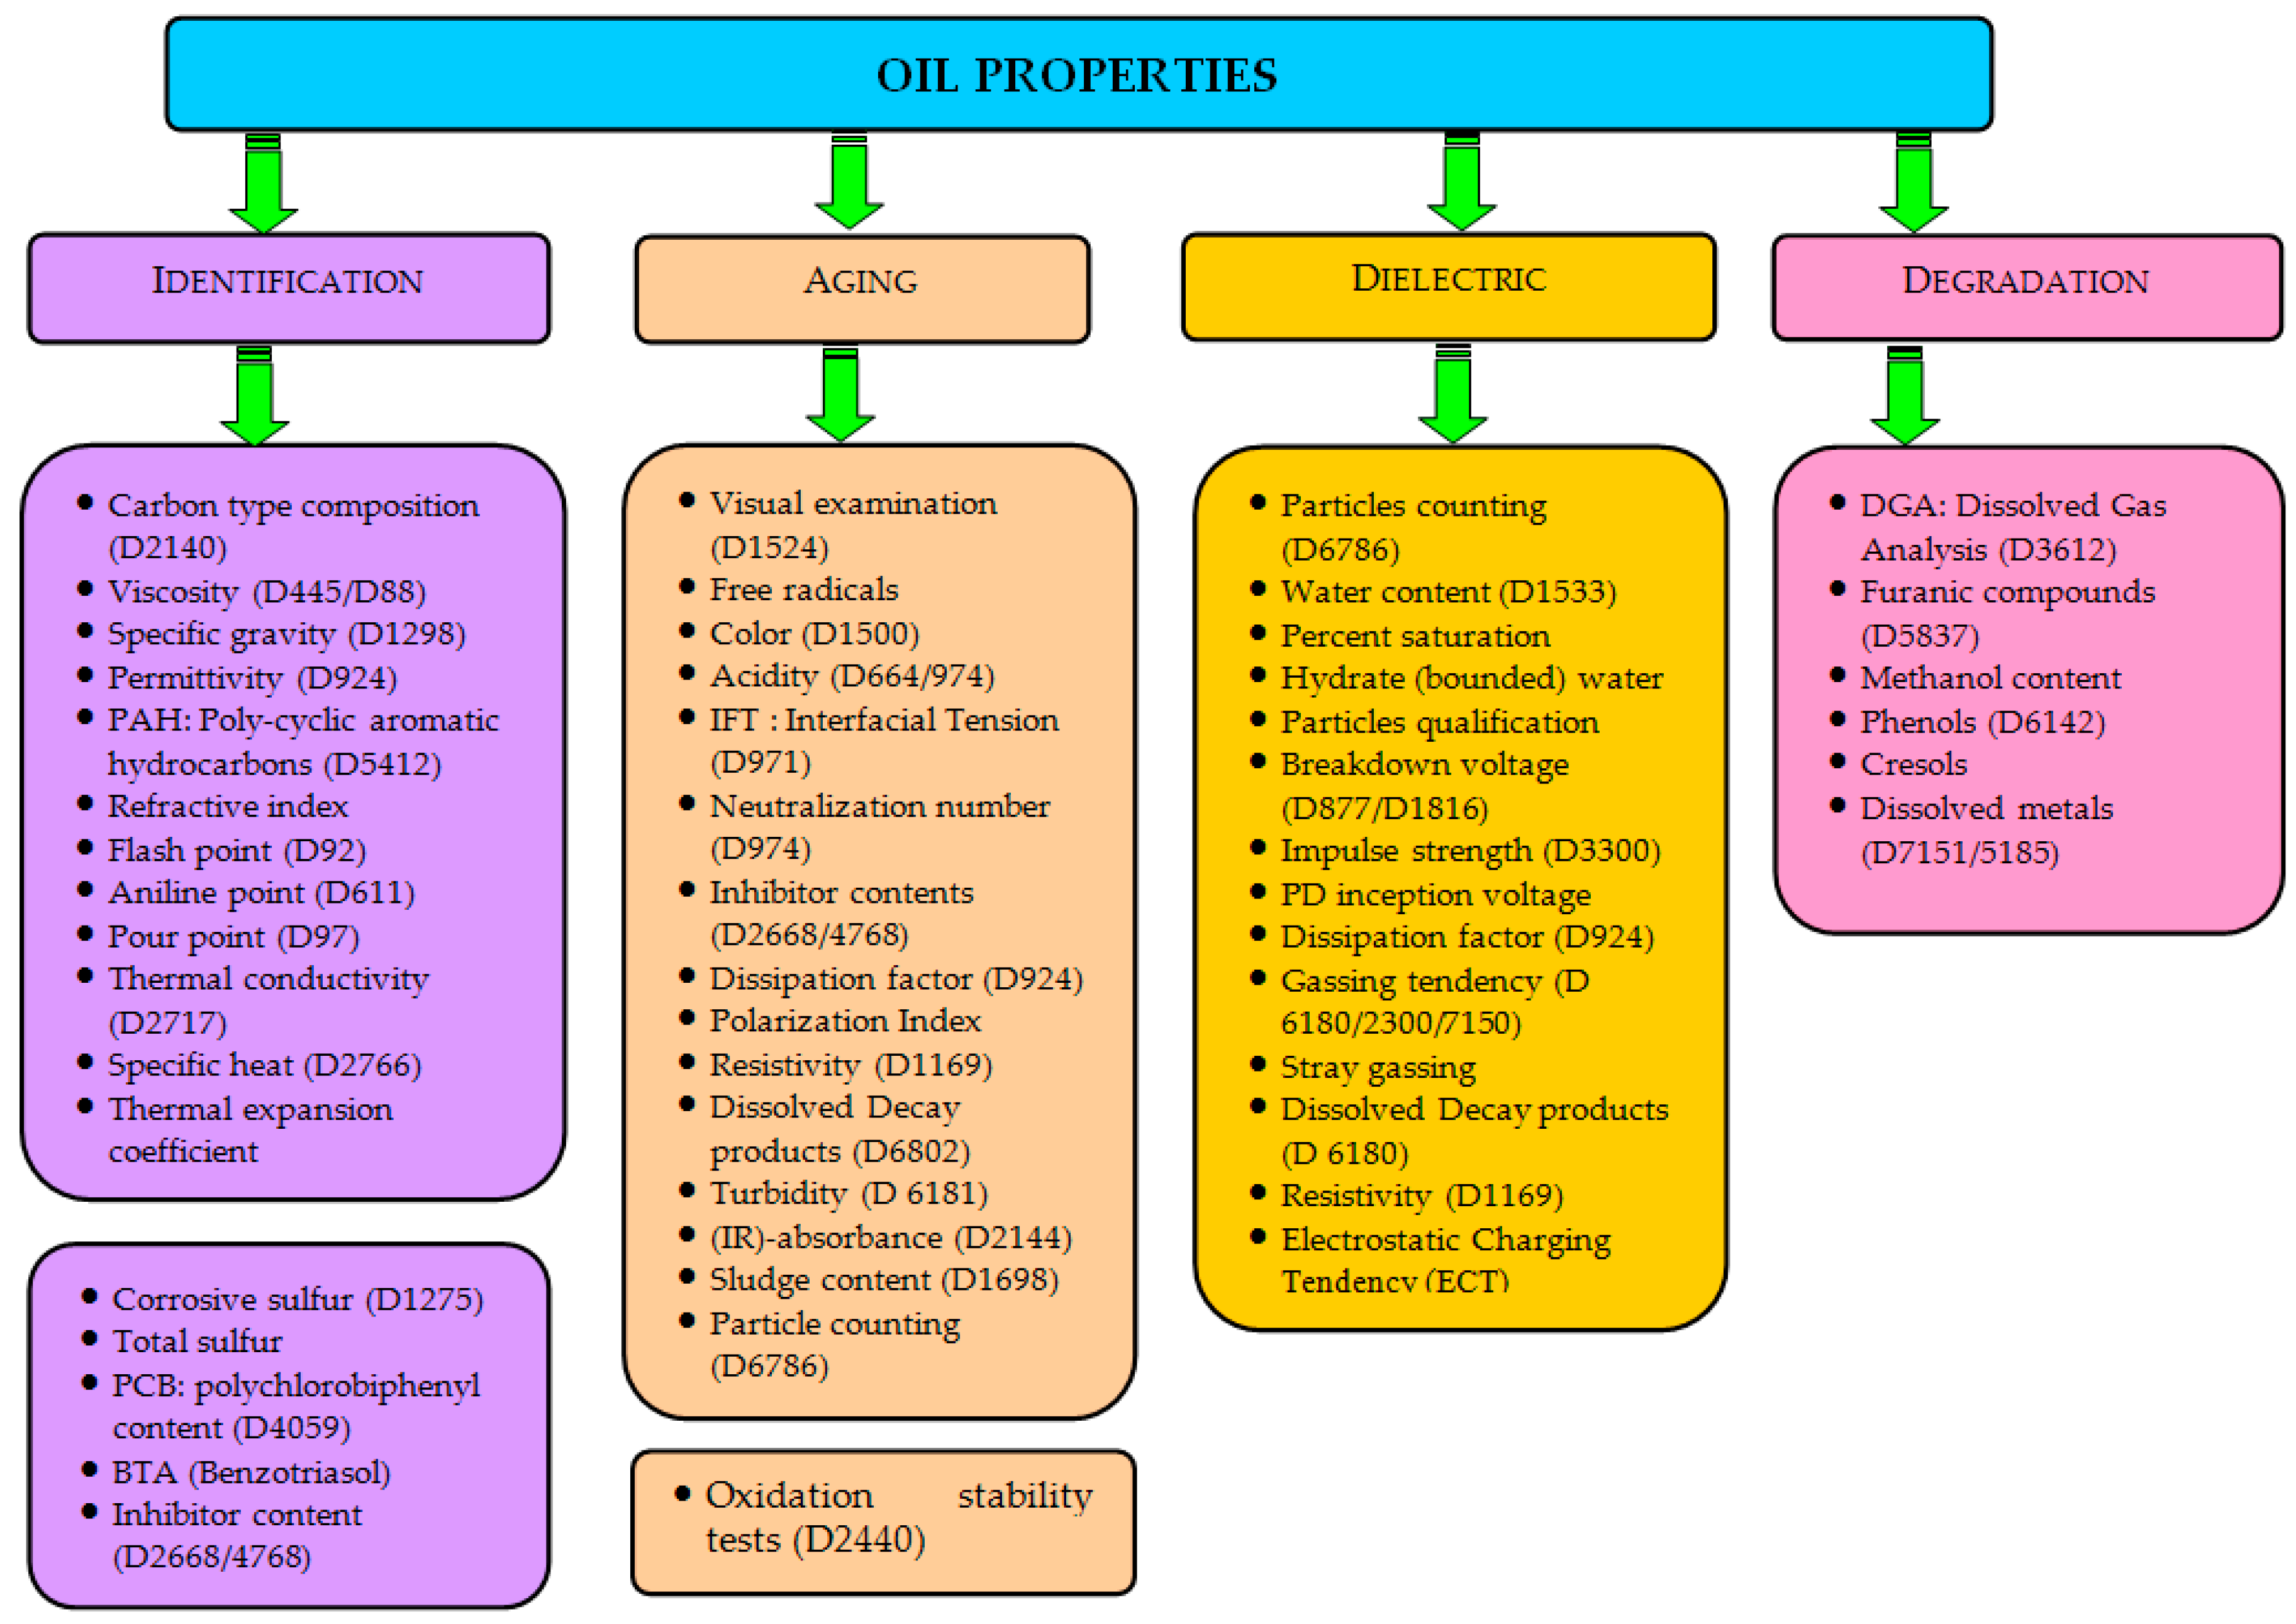
2. Traditional Diagnostics Techniques

2.1. Color/Visual Examination

Color [7] is often used as a qualitative method. The technique is based on the comparison of oil color to a standard colored and numbered disc [8]. An oil’s color comes from the light transmitting through it. Different colors are formed depending on the concentration and type of light-absorbing groups dissolved species in oil. Color of new oil is generally accepted as an index of the degree of refinement. For oils in service, an increasing or high color number is an indication of contamination, deterioration, or both. Oxidation is a common cause of an over-all darkening to occur. Comparisons between oil condition and color are reported in Table 1.
The visual examination [10] is applicable to electrical insulating liquids that have been used in transformers, oil circuit breakers, or other electrical apparatus as insulating or cooling media, or both. An oil sample is visually examined by passing a beam of light through it to determine transparency and identify foreign matters. Poor transparency, cloudiness, or the observation of particles indicates contamination such as moisture, sludge, or other foreign matter.

2.2. Particle Count

It is recognized that particles have a harmful effect on the dielectric strength of insulating liquids [11]. Large amount of particle contaminations can lead to transformer failure. It was reported that moisture in combination with particles reduces significantly the breakdown voltage of the oil and increases the risk of static electrification, partial discharge activity and tracking [12]. Particle size, type and shape are also contributing factors. The most detrimental particles are the conductive ones (metal, carbon, wet fiber, etc.). Particle identification and counting is an important procedure for condition monitoring [11,13].
Miners [14] reported the effect of particles and moisture on the breakdown voltage of insulating transformer oil using Verband der Elektrotechnik, Elektronik, Informationstechnik (VDE) electrodes. This author has considered different sizes and concentrations of iron, copper and cellulose fibers. He noticed very low breakdown strength for the combined effects of moisture and particles type, size and concentration. In a recent work presented at a The Council on Large Electric Systems (CIGRE) session [15], a comparison between the performance of ester liquids and mineral oil have shown that the breakdown voltages of both ester liquids and mineral oil decreased with the increase in cellulose particle-based content. However, it was found that the breakdown voltage of mineral oil is more sensitive to the particle contamination than ester liquids. This might be due to the higher viscosity of ester which slower the motion of metallic particles and therefore reduces breakdown occurrence [16]. Sarathi and Archana [17] investigated the role played by conducting particle in partial discharge activity under alternative current (AC) voltages by using an ultra-high frequency (UHF) technique. They have observed a partial discharge current pulse formation and frequency signal radiation due to particle movement, and when the applied voltage increased, the UHF signal magnitude formed due to particle movement increased.
A multiple sources of particles contamination have been reported by CIGRE Working Group 12.18 [13].
In new equipment, the insulating liquid may contain cellulose fibers, iron, aluminum, copper and other particles from the manufacturing process. In used transformer, sludge particles forms slowly during utilization at normal and overload temperatures. Carbon particles due to the localized overheating may also produce and migrate by leakage or other accident errors from the on load tap changer (OLTC) diverter to the bulk liquid compartment and contaminate the active parts. Pump bearing wear is considered as a typical source of metallic particles [13].
Actually, there are many methods for counting and determining the size and shape of particles. Such methods are based on the light extinction, light scattering, coulter principle or direct imaging. However, the automatic particle counters using light extinction are the most widespread for counting in hydrocarbons and lubricants. For transformer insulating liquids, the measurements are performed using standards such as American Society for Testing and Materials (ASTM) D6786 or International Electrotechnical Commission (IEC) 60970. These standards are based on the International Organization for Standardization (ISO) 11171 calibration. IEC 60422 [18] and CIGRE brochure 157 [11] provide some guidelines to judge the condition of oil based on the level of contamination. In 1983, Oommen published an interesting study on particle levels in 200 samples taken from field and factory units [19]. Atomic absorption spectroscopy was used to determine the content of iron, copper and others.

2.3. Inhibitor Content

Although insulating oils are carefully refined, the impact of mechanical, electrical, thermal and chemical stresses, produces a variety of degradation products. Most of new brand insulating oil contain small amount of unstable hydrocarbons. The electronegative character of oxygen makes it very effective to attack vulnerable hydrocarbons [20]. The oxidation rate is accelerated by temperature, oxygen and catalysts such as copper. The results to such reactions are the formation of hydro-peroxides which brown the oil. Insoluble molecules which may be adsorbed at the surface of cellulose fibers are formed. These impurities reduce life expectancy and reliability of in-service transformers. To reduce the impact of oxygen and enhance the oxidation stability, synthetic oxidation inhibitors are usually incorporated in the oil. Therefore, as long as the inhibitors are present, the oil will be protected against oxidation and therefore increase the expected lifetime of the insulation. The antioxidants perform better in these cleaner oils since they do not have to counteract the negative aspects of contaminants. However, as the service life proceed, the inhibitor will be consumed and when is gone the oxidation rate become higher. Since the anti-oxidant is a consumable material, the initial chemical stability of new insulating oil gradually decreases. Their amount has to be monitored and must be replenished if necessary. Thus, the determination of the inhibitor content is an important factor in maintaining long service life of insulating oil. Actually, phenolic inhibitors are often used in transformers. The commonly used inhibitors are 2,6-di-tert-butyl-paracresol (DBPC) and 2,6-di-tert-butyl-phenol (DBP) [12]. In recent study, Mehanna et al. [21] examined the characteristics of several inhibitors dissolved in mineral insulating oils including 2,6-di-tert-butyl-p-cresol (DBPC), 2,6-di-tert-butyl-phenol (DBP), dibenzyl disulfide (DBDS), 2-tert-butyl-p-cresol (2-t-BPC), N-phenyl-1-naphthylamine, 1,2,3-benzotriazol (BTA) and methylated-BTA. The obtained results confirmed that the DBPC and DBP are the most suitable to be used as inhibitors in transformer mineral oils. ASTM D3487 defines two types of mineral oils according to the inhibitors content (0.08% for type I and 0.3% for type II). Detection and measurements of the inhibitor content shall be done according to IEC 60666 Standard [22]. Three used analytical methods are presented in this standard, related to infrared spectrophotometry (IR), high performance liquid chromatography (HPLC) and gas chromatography-mass spectrometry (GC-MS).

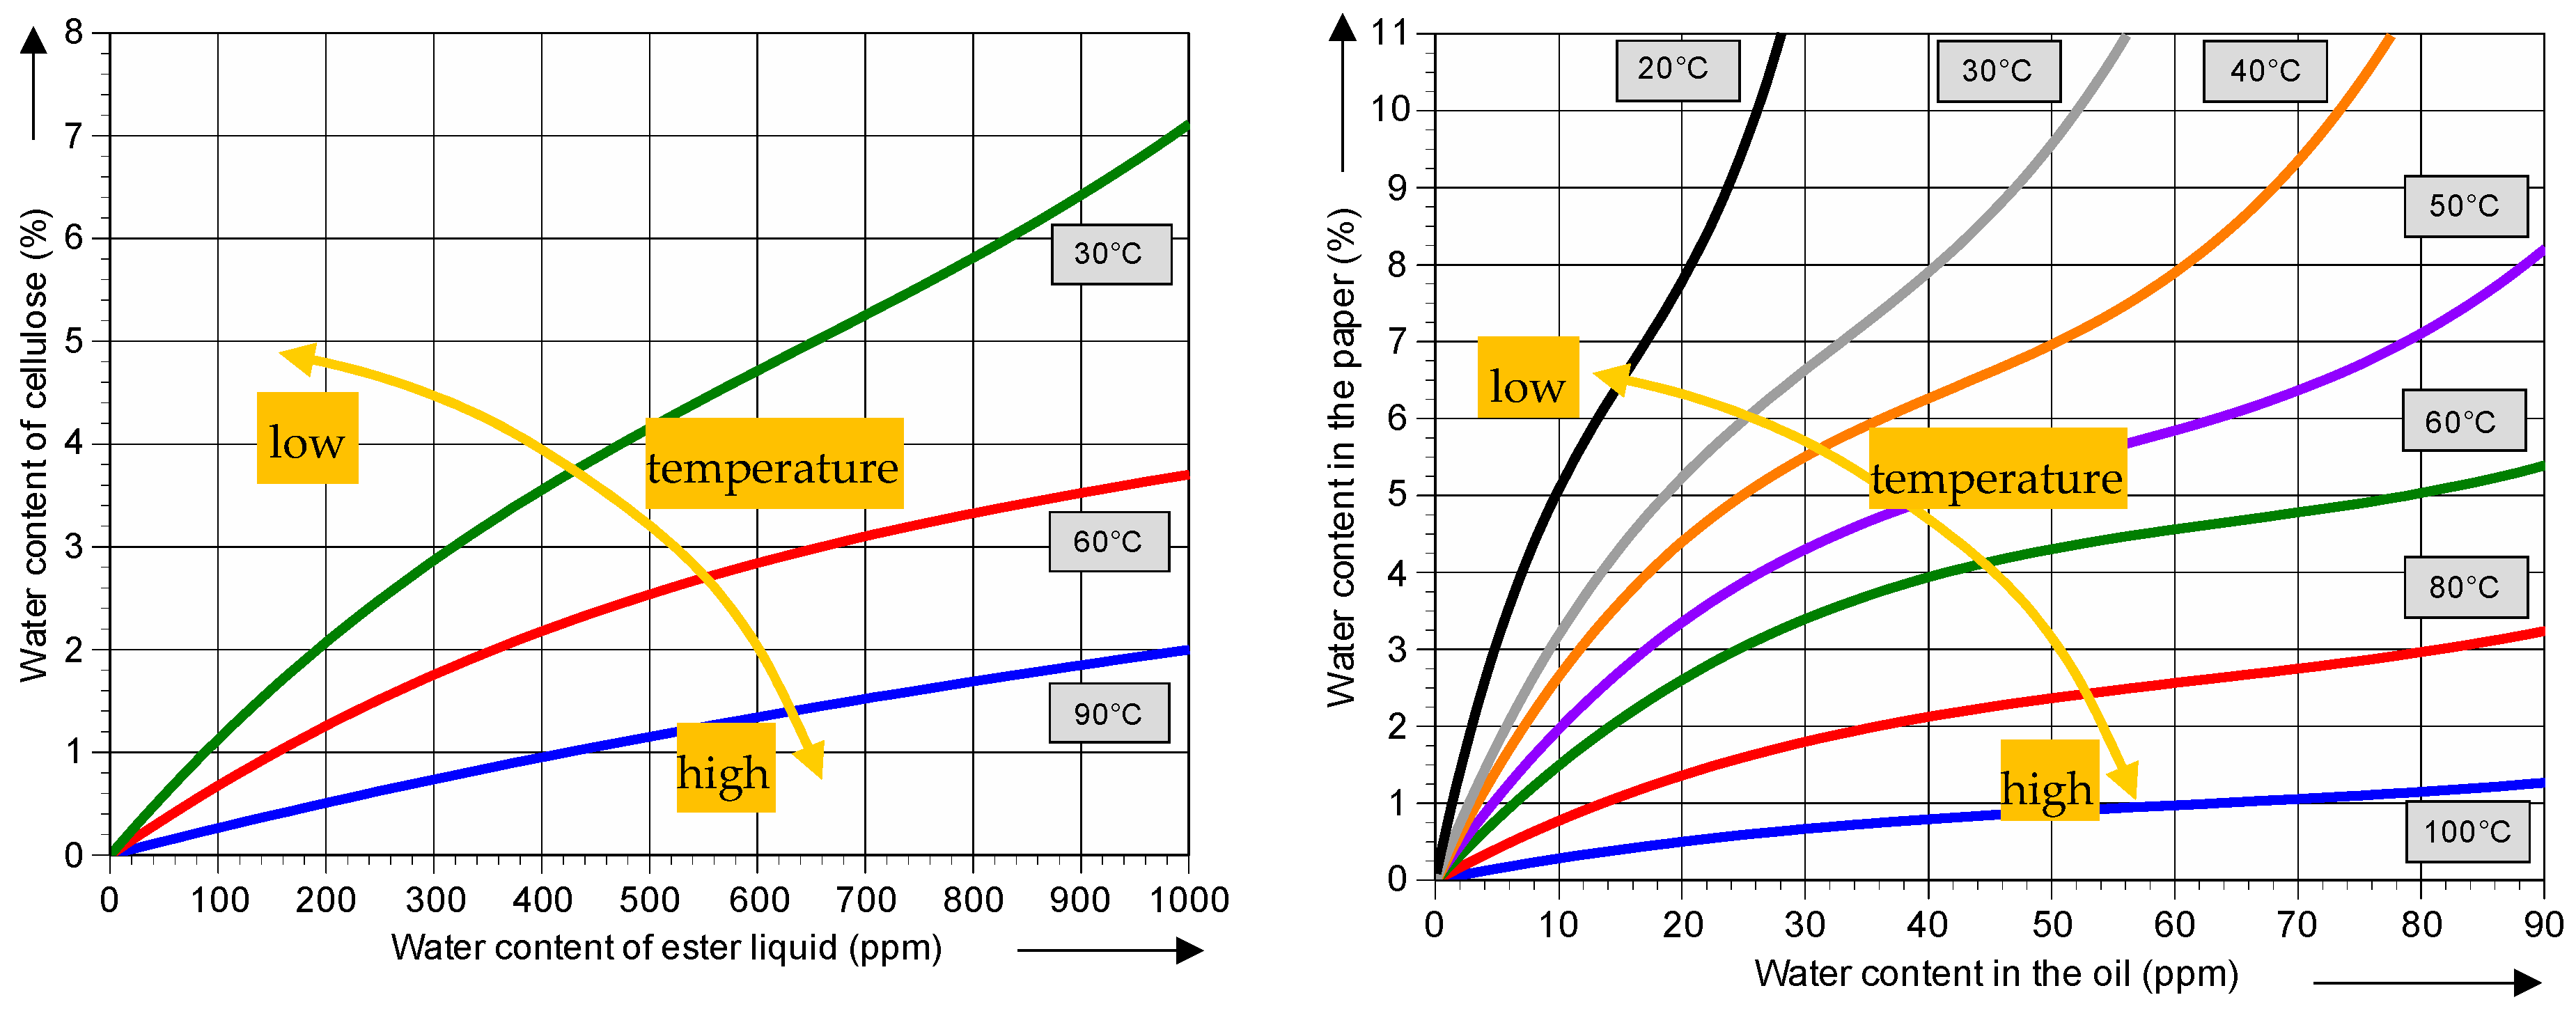
2.4. Moisture in Oil Determination

Moisture is considered enemy number one of transformer insulation. Each time the moisture is doubled in the solid insulation of a transformer, the life of the insulation is cut by one-half [23]. The presence of moisture in the solid and liquid insulation is known to play a critical role on transformer life [24,25]. The moisture in transformer is generated from several sources [12]: remaining moisture in insulation during manufacturing, humid air from outside during transportation and/or assembling in substation, humid air from outside through the breather (non-sealed), moisture ingress through gaskets, chemical decomposition of cellulose, moisture absorption from outside during some maintenance operations such as on site control of active part or bushing replacement, topping-up of oil level made with humid oil (non-dried). An accurate method of measuring very small amount of moisture in oil is the Karl Fischer Titration technique. This technique can indicate moisture content as low as 1–2 ppm [26,27]. As oils become very oxidized with increasing amounts of polar aging byproducts, their water solubility characteristics also increases. At elevated temperatures, some amount of hydrated compounds may transfer into dissolved water. Bonded water cannot be revealed by Karl Fischer (KF) titration. The KF method can therefore overestimate water content because iodine can react with peroxides, acids, and other impurities that may be present as a result of oil degradation [24,28]. The KF titration is therefore not very accurate for aged oils where active contaminants are accumulated capable of forming hydrates with bonded water [13].
The moisture content of oil can change quickly within an operational transformer. For on-site measurements, the water migration being commonly running, the transformer is in a non-equilibrium state. Direct measurement of moisture content in paper insulation (cellulose) is complex; moisture partitioning curves (Figure 2) between oil/ester and paper under equilibrium conditions have been reported by several authors [29,30,31].
These curves were used to estimate the moisture of paper by measuring moisture in oil at different temperatures. However, complications may arise due to fast dynamic diffusion processes. Another problem with the partitioning diagrams is that they are based on new oil/ester and do not take into account the effects of aging by-products found in aged transformers [32]. In a study conducted at Monash University under an Electric Power Research Institute (EPRI), USA sponsored project, a new method of moisture assessment in operating transformers was developed, based on a water-in-paper activity concept. The parameter of water-in-paper activity is used to access moisture conditions in both new and in service-aged transformer insulation systems. Another term, “active water content of paper (WCPA)”, was also introduced [33].
In the last decades, capacitive probes are in use for determining the relative moisture to saturation. Advantages of capacitive probes are follows: very convenient for onsite and online applications, possibility of continuous measurement, no error due to oil sampling, transportation and the type of oil and oil condition do not affect the measurement [26]. With continuous monitoring, diffusion time can be taken into account and significant improvement in the estimation of moisture content can be achieved [26].
Over the last decades, dielectric spectroscopic techniques have been used to assess moisture content inside the solid insulation. However, it must be emphasized that moisture and aging separation still constitute a challenging point in this domain [6,34,35].

2.5. Dissolved Gas Analysis (DGA)

During its use, power transformers insulation systems degrades under the effects of various stresses, leading to the generation of dissolved gases in oil. The identification of these gases can be very useful for determining defects in transformers and avoid unforeseen interruptions. According to ASTM Designation D 3612-02 [36], Section 1.2, indicates that the individual component gases that may be identified and determined include: hydrogen—H2, oxygen—O2, nitrogen—N2, carbon monoxide—CO, carbon dioxide—CO2, methane—CH4, ethane—C2H6, ethylene—C2H4, acetylene—C2H2, propane—C3H8 and propylene—C3H6. Except O2 and N2, all mentioned gases must have an unpaired electron when the breakdown occurs; this means that these gases are in fact the results of secondary chemical reaction. Actually, gas generation are caused by the breaking of hydrocarbon molecules due to electrical and/or thermal stresses. These gases are referred to as key gases. Among the used methods to detect and identify the generated gases, DGA is considered as the most informative method. Over the decades, Dissolved Gas Analysis (DGA) monitoring has become a very useful diagnostic tool and is being universally applied by the utilities or manufacturers for condition assessment of power transformer and in more recent years load tap-changers and bulk oil circuit. However, some drawbacks of the dissolved gas analysis have been underscored by The Institute of Electrical and Electronics Engineers (IEEE) Std. C57.104 [37] as follows: “Many techniques for the detection and the measurement of gases have been established. However, it must be recognized that analysis of these gases and interpretation of their significance is at this time not a science, but an art subject to variability”. Further, “The result of various ASTM testing round robins indicates that the analytical procedures for gas analysis are difficult, have poor precision, and can be wildly inaccurate, especially between laboratories”. Finally, “However, operators must be cautioned that, although the physical reasons for gas formation have a firm technical basis, interpretation of that data in term of the specific cause or causes is not an exact science, but is the result of empirical evidence from which rules for interpretation have been derived”.
Generally, dissolved key gases are always presented in transformer oils at some level [38]. The quantity of generated gases depends upon the type of fault. Some of key gases and their related faults are listed in Table 2.
When an increase in key gases concentration exceeds certain limits, additional gas analyses are recommended for determining defects type within the transformer. Several DGA interpretation methods are used in practice [3,37,40,41,42]. These interpretation methods are based on key gases, key ratios and graphical representations analysis. To date, about twenty empirical DGA interpretation methods have been developed:
  • Incipient Fault Types, Frank M. Clark, 1933–1962 [43]
  • Dörnenburg Ratios, E. Dörnenburg, 1967, 1970 [40]
  • Potthoff’s Scheme, K. Potthoff, 1969 [44]
  • Absolute limits, various sources, early 1970 [45]
  • Shank’s Visual Curve method, 1970s [46]
  • Trilinear Plot Method, 1970 [43]
  • Key Gas Method, David Pugh, 1974 [47]
  • Duval’s Triangle, Michel Duval, 1974 [42]
  • Rogers Ratios, R.R. Rogers, 1975 [41]
  • Glass Criterion, R.M Glass, 1977 [43]
  • Trend Analysis, various sources, early 1980s [45]
    -
    total volume per day
    -
    ppm per day
  • Church Logarithmic Nomograph, J.O. Church, 1980 [48]
  • Expert System Analysis, Richard Lowe, 1985 [49]
  • Expert System Monitor Program, Karen Barrett, 1989 [43]
  • IEEE C57.104, Limits, rates and total dissolved combustible gas (TDCG), 1978–1991 [37]
  • Artificial Neural Networks (ANNs) and Fuzzy Logic
    -
    X. Ding, E. Yao, Y. Liu and Paul Griffin, 1996 [50]
    -
    Vladimiro Miranda and Adriana Garcez Castro, 2004 [51]
    -
    Donald Lamontagne, 2006 [52]
  • IEC 60599 Ratios, Limits and gassing rates, 1999 [53]
  • Data mining and Log Transformation, Tony McGrail, 2000 [54]
  • Vector Algorithm, Nick Dominelli, Mike Lau and David Pugh, 2004 [43]
  • Duval’s Pentagon, Michel Duval, 2014 [55]
Among these methods, the most used are IEC, Rogers, Duval’ Triangle and the Key Gas method [43,56]. The ratio methods have the advantages that they are independent on the transformer oil volume. However, they are vulnerable to misinterpretation. For that reason, they should be always used in parallel with other methods such us the key gas methods. In addition, some DGA results using ration methods may fall outside ratio codes and no diagnosis can be achieved. The last problem of the ration methods is resolved by the Triangle method as it is a closed system rather than an open system. However, the Duval triangle method uses only the value of three gases, CH4, C2H4 and C2H2. In a recent work, Duval has proposed pentagon-based method to interpret the detected gas [55]. This method uses five combustible gases instead of three, CH4, C2H4, C2H2, C2H6 and H2. Therefore, a complementary Duval’s pentagon has been developed [57].
All of these methods still show a certain percentage of incorrect diagnoses. This is probably due to the fact that all of these techniques are based on heuristic in nature and not on scientific formulation. Some pitfalls of DGA testing were emphasized [43]:
  • Gases produced not as a result of incipient fault condition;
  • Leaking between tap changers and main tank;
  • Welding producing acetylene and other gases ;
  • Out-gassing of paints and gaskets (which are usually CO and CO2);
  • Galvanic reactions (i.e., steel + water + O2 = hydrogen production);
  • Lower voltage transformers having higher CO and CO2 values as a result of non-vacuum treatment, oxygen + heat;
  • Stray gassing characteristics;
  • Contaminants produce gases;
  • Decomposition of additives such as passivators can produce gases as well (H2 and CO2).
In recent works, the theoretical premise that some of contaminants in the oil may contribute to gassing was experimentally verified under laboratory conditions [39]. The results of these works have shown that oil born decay products may affect the diagnostics by DGA.
Another difficulty of DGA is that the absorption of any given gas in oil depends on the pressure and temperature of the oil, on the type of gas involved and the nature of the oil itself (whether antioxidants are present) [58].
Nowadays, several types of alternative liquids, mainly used in distribution transformers, are available. Due to their high degree of sustainability, there is a strong demand to use them in power transformers. A number of articles on the impact of alternative liquids on the dissolved gas analysis have been published [59,60]. CIGRE working group WG D1.32 has developed a new Duval triangle with modified diagnosis boundaries for DGA of alternative liquids [61].
The advantages and disadvantages [58] of DGA analysis for determining the gas content and the make-up of the gases are follows: no need to header space, extracts of gases from oil, require sophisticated equipment to extract the gases from the oil, applicable to all fluid containing components where it is possible to access the oil.
Even though DGA techniques are actually widely used, still some improvements are needed for accurate diagnostics. Since all the available methods are based on heuristic in nature and not based on scientific formulation, intelligent agent-based DGA diagnostic was proposed to reduce the risk of mistaken diagnostics and enhance accuracy [56]. Artificial intelligence (AI) is also being proposed to overcome the inconsistent interpretations of DGA results [62].

2.6. Acidity and Interfacial Tension (IFT) Analyses

The acid number (AN) of oil, measured in mg KOH/g, is a quantitative measure of the amount of acidic materials present in oil. It is determined by the amount of potassium hydroxide (KOH) in milligrams (mg) required to neutralize the acid in one gram of transformer oil. The AN measures both weak and strong organic and inorganic acids within the oil. As the oxidation level of in service oil increases, polar compounds, particularly organic acids form in the oil, therefore increasing the acid number. New transformer oils are practically free of acids. Used oil having a high acid number indicates that the oil is either oxidized or contaminated with materials such as varnish, paint, or other foreign matter. The AN is generally viewed as an indicator of nitration, oxidation and contamination, hence a tool of diagnostic. It is recommended that the oil be reclaimed when the acid number reaches 0.20 mg KOH/g [63].
The interfacial tension (IFT) of transformer oil is another effective diagnostic index that can be used to identify the degradation rate of insulating oil. It is expressed in dynes per centimeter required to rupture a small wire ring upward a distance of one centimeter through the oil-water interface [64]. When certain contaminants such as soaps, paints, varnishes, and oxidation products are present in the oil, the film strength of the oil is weakened, thus requiring less force to rupture. For oils in service, a decreasing value indicates the accumulation of contaminants, oxidation products, or both. The IFT is a precursor of objectionable oxidation products which may attack the insulation and interfere with the cooling of transformer windings. Good clean oil will make a very distinct line on the top of water and gives an IFT number of 40 to 50 dynes per centimeter. It is recommended to reclaim the oil when the IFT decreases down to 25 dynes per centimeter. At this level, the oil is very contaminated and must be reclaimed to prevent sludging, which begins at around 22 dynes per centimeter [65]. If oil is not reclaimed, sludge will settle on windings, insulation, cooling surfaces, etc., and cause loading and cooling problems. There is a definite relationship between the acid number and the IFT. Any increase in the AN is normally related to a drop in the IFT. Although lower values of IFT and AN is an unusual situation, it does occur because of contamination such as solid insulation materials, compounds from leaky pot heads or bushings, or from a source outside the transformer [66]. Field experiences have also revealed both aging indexes may failed in diagnosing incipient failures [67]. The 500-kV generator step-up units of Salto Grande were sealed and a periodic oil analyses procedure implemented. Measuring the interfacial tension and the organic acidity of oil, confirmed the lack of oxidation products while the analysis of the relative content of dissolved decay products (DDPs) in the oil by UV-vis spectrophotometry [68] has shown a higher content of dissolved oxidation decay products in the units with punctured rubber by bladders.

2.7. Paper Degradation Assessment

In transformer, one of the key maintenance “musts” is to ensure that the electrical system remains isolated through effective insulation. This is achieved through the use of insulating paper. It is critical to monitor the paper state by direct measurements to ensure that the paper continues to provide effective insulation for the transformer. However, direct analysis of the paper insulation is an invasive procedure that requires the transformer to be taken out of service.
Insulation paper is made from wood pulp by Kraft process and contains 90% cellulose, 6%–7% hemicellulose and 3%–4% lignin. Cellulose is a linear polymer comprising anydro d-glucopyranose units held together at the first and fourth carbon atoms through a glycosidic-linkage [69]. The monomer units are combined in long straight chains within the paper insulation and the number of monomer units in a polymer is known as degree of polymerization (DP) [3]. This parameter is mechanical strength of paper. The degree of polymerization, measured by viscometric method (DPv), represents the average number of glucose units per cellulose chain) [69,70].
This technique is accurate in evaluating the condition of paper. The measurement of DPv is used as a diagnostic tool for determining the condition of the solid insulation within a transformer. The DPv (average number of glucose units per cellulose chain) of insulation paper after manufacturing varies between 1000 and 1300 [71,72]. The mechanical strength of the paper is considered roughly constant between 1000 and 500. Below 500, the DPv drops linearly with the mechanical strength [73,74]. When correctly perform, the reproducibility of DP measurements are very good. The advantages and disadvantages of DP measurement are described in Table 3.
To overcome the problems related to direct measurement, many studies were conducted to develop indirect techniques for assessing the state of insulating paper. These techniques are based on the analysis of chemical indicators or markers present in oil due to the degradation of insulating paper. Most of the indirect methods investigated up to now were based on the analysis of the dissolved CO + CO2 in oil [75] and on the furanic compounds as an indicator of paper aging [76]. The ratio of CO and CO2 concentration is normally used as an indicator of thermal decomposition of cellulose [37,77]. The ratio of CO and CO2 is normally more about seven, while the respective values of CO2 and CO should be greater than 5000 ppm and 500 ppm in order to improve the certainty factor. However, the disadvantage of diagnosing paper insulation condition using CO/CO2 is that this method is not reliable since carbon oxides may be generated from the long-term oxidation of oil components or could present as a result of atmospheric leak [73,78].
Another alternative method of assessing paper degradation is the determination of furans compounds present in oil. The major furanic compounds that are released into the oil are as follows: 2-furfuraldehyde (2FAL), 5-hydroxy-methyl 2-furfuraldehyde (5H2F), 2-acetylfuran (2ACF), 5-methyl 2-furfuraldehyde (5M2F), and 2-furfuryl-alcohol (2FOL). These compounds result of paper oxidation and hydrolysis processes characterize the thermal decomposition of insulation paper [71]. Among the furan compounds, it was found that 2-furfuraldehyde (2FAL) is the most abundant; its concentration within the oil is related directly to the degree of polymerization value (DPv) and therefore to the mechanical strength of the solid insulation. However, as CO/CO2 analysis, some drawbacks have been observed for the Furan analysis. The major limitation is that the concentration of 2FAL is affected by oil replacement or by oil reconditioning processes [79]. Other sources influencing the concentration of 2FAL are linked to its thermal instability, the effect of moisture on the rate of production [73,78,80]. Some disadvantages of 2-FAL are its low sensitivity in the aging of thermally upgraded (TU) paper (more often used by new transformers), along with its exponential behavior [74]. The 2-FAL concentration in oil shows a noticeable increase only when paper is extremely aged (DPv ≤ 400) [81]. To overcome this drawback, several alternative chemical markers are being investigated an indirect detection of the insulation paper degradation. Among all the studied markers (acetone, acetaldehyde, butanol, 2-butanone and carbon disulfide...), Methanol (CH3OH) has shown the highest stability at different temperatures [82]. Consequently, methanol was of particular interest for monitoring paper depolymerization [83]. The use of methanol (CH3OH) has been reported for the first time in the literature by Jalbert et al. [83]. As reported by [81] the main advantage of this molecule over 2-FAL is its ability to be generated in the presence of thermally upgraded paper regardless of the temperature and the moisture present in the insulation. It could readily be used to sort out the problematic units of a given family and technology. In addition, contrary to carbon oxides, because of its high affinity for paper, methanol will tend to re-equilibrate in the oil after the latter has been regenerated. Annelore Schaut et al. reported that a linear correlation exists between D P ν and formation of Methanol even at early stages of its formation [84]. Arroyo et al. [74] reported the relationship between the generation of methanol and the number of scissions. It was proved that methanol is a robust indirect method for describing the condition of insulating paper. Another correlation between the methanol content within the fluid and the tensile index has been observed by the same authors. This method opens the door to a methodology for assessing the real condition of the paper in power transformers. Studies are still going on worldwide, the objective being the improvement of this finding that is fully mature.
Furanic concentration in oil can be quantified by using high performance liquid chromatography (HPLC) or gas chromatography-mass spectrometry (GC-MS).
High-performance liquid chromatograph (HPLC) is now one of the most powerful tools in analytical chemistry. They have the ability to separate and quantify the compounds that are present in any sample that can be dissolved in a liquid with detection levels approaching 0.01 trillionths of a gram (10−14 of a gram) [85]. The amount of furans present in oil could be a good indicator of the condition of cellulose insulation [3]. The measurement method of furan concentrations in oil has been described in [86,87].
The measurement is achieved in two phases [3]: solid stationary phase and mobile phase. In the solid stationary phase, 1–5 mL of oil is diluted with 5 mL of hexane and injected in a steel tube packed with particle of solid material. The commonly used solid in the stationary phase is octadecyl groups bonded to silica particles. It is then washed with 10 mL of hexane to remove the oil. Nitrogen is applied for 5 min to evaporate the hexane. The furans are then eluted with 1.5 mL acetonitrile. About 20 µL of the elute solution is then injected into the HPLC column. A solvent called the mobile phase is then pumped through the column. The solvent is a mixture of methanol and water. The flow of the mobile phase separates the furan components. The different extent to which the different furan components interact with the solid stationary phase and the mobile phase determines the extent of separation of furan components. The detector senses the components as they are eluted from the column. The results are usually reported in terms of parts per billion (ppb). Table 4 highlights the advantages and limitations of HPLC.
Determination of furan by HPLC with DP gives an indication of the remaining structural strength of the paper insulation and is an indication of the remaining life of the paper and the transformer itself. Lütke et al. [89] have shown that it is not possible to predict the remaining life of a transformer only based on the content of furanic compounds and that it is not possible to derive an exact DP value correlation from the furanic content. According to these authors, only one mosaic stone and only the sum of different procedures (DGA, humidity in oil and paper, etc.) with fingerprinting and trend analysis will enable the life assessment.
Alternative assessments based on FTIR spectroscopy, molecular weight measurement by gel permeation chromatography (GPC) and thermogravimetry analysis of cellulose paper insulation has also been reported [90,91]. However, their practical use is hampered by the difficulty in taking paper samples from an operating transformer.

2.8. Heat Transfer Properties

Key properties regarding heat transfer properties or heat transfer coefficient of the oil include pour point, viscosity profile, specific heat, relative density and thermal conductivity [92]. These properties determine the efficiency with which the fluid may cool the transformer windings. To evaluate the heat transfer coefficient, thermal conductivity, specific heat capacity kinematic viscosity and density, need to be measured at different temperatures.
High thermal conductivity (measured in watts per meter kelvin (W/(m·K))) is a primary limitation in the development of energy-efficient heat transfer fluids required in many industrial and commercial applications including power transformers. Thermal conductivity is essentially “the measure of the ability of a material to conduct heat” [93] or, more simply, the heat transfer rate. The higher the thermal conductivity is, the higher the fluid capability to transfer heat quickly from the transformer windings to the outside air is [94].
The specific heat (in Joule per Kelvin: J/K) also known as heat capacity is a thermodynamic property that is a measure of the amount of energy required to produce a given temperature change within a unit quantity of a given substance. It is used in engineering calculations that relate to the manner in which a given system may react to thermal stresses [95].
Viscosity is another important thermodynamic parameter in design calculations for heat transfer by either natural convection in smaller self-cooled transformers or forced convection in larger units with pumps and the impregnation process [96]. It is the resistance of oil to flow under the force of gravity. The SI unit is the meter squared per second also known as the Stoke ( m 2 s 1 or St). The more common term is the centistoke (cSt), which is a millimeter squared per second. The measurement at 40 °C is useful for early detection of oxidation, polymerization and thermal failure of the oil. Measurement at 100 °C has advantages in the detection of viscosity index improver shear down and its best suited for components that operate at high temperatures. Both temperatures may be employed where the calculation or change of the viscosity index is important and where multiples objectives need to be achieved [97].
Pour point (in °C), which represents the lowest temperature at which the oil can still flow [98], is another important parameter to consider in cold climates. This means that this temperature, oil flows and can transport heat away from windings and core.
The relative Density (or Specific gravity) is the ratio of weights of equal volumes of oil and water at a given temperature [99]. In natural convection cooled oil filled transformers, when the fluid temperature increases, its density reduces. The fluid rises upwards and transfers its heat to outside air through tank and radiators.
The heat transfer properties of oil used as a coolant influences heat transfer rates and consequently the temperature rise of an apparatus. The heat transfer properties of oil also influences the speed of moving parts in tap changers and circuit breakers. Oils of high viscosity oils are less desirable, especially in cold climates. The heat transfer properties of oil can be affected by polymerization, oxidation, formation of carbon and oxide insoluble [97]. Contaminants such as water, air, soot and oil admixtures can also worsens the heat transfer properties. Decay products deposit themselves on solid insulations and other parts, blocking ducts and concomitant overheating of the oil and windings. A fluid with low viscosity and density, higher thermal conductivity and specific heat capacity are important parameters for higher heat transfer coefficient.

2.9. Corrosive Sulfur

Scientifically, corrosive sulfur is defined as elemental sulfur and thermally unstable compounds in electrical insulating oil that can cause corrosion of certain metals such as copper and silver [100]. Sulfur is commonly found in crude oil. There are five basic groups of sulfur and sulfur compounds in crude oil [101]: elemental sulfur (S), mercaptans (R–SH), sulfides (R–S–R’), disulfides (R–S_S–R) and thiophenes. The aftereffects of the corrosive sulfur into transformers are disastrous. Corrosive sulfur affects not only adversely the conductor material and other metal surfaces but may have also drastic effects on paper insulation. Copper sulfide reduces electrical strength of conductor insulation. Copper sulfide deposits produce a low resistance path across and through the cellulose insulation and can lead to internal discharges and flashover. Recent work [102] showed that the amount of Cu2S deposition on insulation paper and copper wire surface increase with the aging time; sulfur corrosion of copper wires can reduce the permittivity of oil-paper insulation. The electrical breakdown strength of oil-paper insulation with copper sulfide depositions declines greatly, and this would lead to internal insulation failure of transformers. One of the main preventive measures used to address this problem is the addition of organic copper surface passivators to transformer oil. These passivators bind to copper surfaces and create an impermeable boundary between the bulk of the metal and the surrounding insulating cellulose and oil [103]. Passivators can be described as a chemical varnish of the windings that protects the copper from the oil and the oil from the copper. The most widely used is the Irgamet 39, a molecule currently recommended for use in transformers for preventing the copper dissolution. This molecule is made significantly less hydrophilic by amino-methylation and fully miscible with oils [103].

3. Modern Physicochemical Diagnostics Techniques

3.1. Fourier Transform Infrared Spectroscopy (FTIR)-Based Determinations

Fourier Transform Infrared (FTIR) spectroscopy is considered as a very powerful tool for monitoring the condition of lubricants and oils, since it can identifies compound and sample composition. Because each bond type has a unique wave-number fingerprint, it can be readily identified. This sensitivity to oil constituents can be used to trace almost all aging by-products. The concept is different from UV-vis spectroscopy techniques. UV-vis or UV/vis spectroscopy or ultraviolet-visible spectrophotometry refers to absorption spectroscopy or reflectance spectroscopy in the ultraviolet-visible spectral region. This principle consists in using light in the visible and adjacent (near-UV and near-infrared (NIR)) ranges. The absorption or reflectance in the visible range directly affects the perceived color of the chemical substance under investigation.
Infrared (IR) spectroscopy uses an electrically heated glow-bar as infrared radiation source; this radiation is passed through the sample to the detector. The chemical constituents of the sample absorb some of the infrared at reproducible and specific wavenumbers. The technique FTIR or Fourier Transform infrared uses something called the Michelson interferometer. This nifty device utilizes a moving mirror, whose speed is monitored by a laser, which also acts as a wavelength reference. The detector then measures the summation of all the frequencies over time resulting in a time dependent interference pattern called an interferogram. A computer algorithm called a Fast Fourier Transform is then used to convert this signal to an absorbance or transmission spectrum.
FTIR identify unknown materials; determine the quality or consistency of a sample and the amount of components in a mixture. Insulation oil used in power transformers consists of saturated hydrocarbons as paraffin and naphtene and can neither conduct current nor solute water. Oil conductivity depends on oil type and increases with aging by-products. Contaminants such as residues from refinery, pollution and particularly aging/oxidation products enable the oil to conduct ionic current. Oil oxidation/degradation by-products is subdivided into soluble (dissolved) and insoluble (suspended) products [104]:
  • the dissolved impurity particles are peroxide (R–OOR), alcohol (ROH), aldehyde (ROHO), ketone (RCO–R), organic acid (R–COOH), acid anhydride ((RC(O))2O) organic peroxide (ROOH), ester (R–COO–R′), metallic soap ((RCOO)nM) (M means metal atoms), etc.
  • the suspended impurity particles include asphaltic sludge, soap sludge, carbon sludge, etc.
Oxidation by-products (peroxide gas, water soluble acids, low molecular weight acids, fatty acids, water, alcohols, metallic soap, aldehydes, ketones, lacquers, sludges of asphaltene) change the chemical make-up of the oil to allow more water to be dissolved. FTIR determines the level of oxidation by a general response in the carbonyl (C=O) region of between 1800 to 1670 cm−1. In this region, infrared energy is absorbed due to the carbon oxygen bonds in the oxidized oil. Sulfur compounds are typically found in crude oils and may also be used as additives in lubricating oils to achieve certain desired properties. Sulfate by-products such as SO2 and SO3 are formed by the oxidation of these Sulfur containing compounds. Sulfates are measured by FTIR in the same way as oxidation and nitration, by monitoring the increase in their infrared absorbance characteristics, i.e., between 1180 and 1120 cm−1 [105].
The usefulness of FTIR in determining oxidation is dependent on the base oil used to formulate the fluid. Synthetic fluids often contain ester compounds which have a significant peak in the infrared spectra area where the oxidation level for mineral oils is measured. For this reason, it is important not to use FTIR results alone for diagnostics but instead to trend these results and view them in conjunction with other oil-related parameters like viscosity and AN [106]. More recently, some researchers developed FTIR detectors that allow detecting most of the gases of interest and quantify their amounts. These methods are capable of providing a greater understanding of the load, temperature, and time dependencies of generated gases [3]. Fourier transform infrared spectroscopy is preferred over dispersive or filter methods of infrared spectral analysis for several reasons:
  • It is a non-destructive technique;
  • It provides an accurate measurement method which requires no external calibration;
  • It can increase speed, collecting a scan every second;
  • It can increase sensitivity—one second scans can be co-added together to ratio out random noise;
  • It has greater optical throughput; and
  • It is mechanically simple with only one moving part.
Recently, alternative of determining moisture content in un-aged and aged mineral insulating oil samples by FTIR spectroscopy was proposed [107]. Accuracy, repeatability, and reproducibility of the FTIR method were assessed by analyzing a variety of oil samples, including new, thermally aged oils and oils taken from in-service transformers relative to their moisture content determined by KF. The key benefit from this approach would be that an FTIR equipped with an auto-sampler could provide a means of automating moisture analysis in a manner analogous to what has been done in the lubricant sector [108].

3.2. Combined Gas Chromatograph-Mass Spectrometry (GC-MS)-Based Testings

Gas chromatography/mass spectrometry (GC-MS) is an instrumental technique, consisting of a gas chromatograph (GC) coupled to a mass spectrometer (MS), by which complex mixtures of chemicals may be separated, identified and quantified. GC-MS analysis requires highly trained analysts and expensive equipment [109]. This makes it ideal for the analysis of the hundreds of relatively low molecular weight compounds found in environmental materials. The GC works on the principle that a mixture will separate into individual substances when heated [110,111]. The heated gases are carried through a column with an inert gas (such as helium). As the separated substances emerge from the column opening, they flow into the MS. Mass spectrometry identifies compounds by the mass of the analyzed molecule. A library of known mass spectra, covering several thousand compounds, is stored on a computer. Each compound has a unique or near unique mass spectrum that can be compared with a mass spectral database and thus identified [110,111]. Mass spectrometry is considered the only definitive analytical detector. To analyze a given compound by GC-MS, it must be sufficiently volatile and thermally stable. In addition, functionalized compounds may require chemical modification (derivatization) prior to analysis to eliminate undesirable adsorption effects that would otherwise affect the quality of the obtained data.

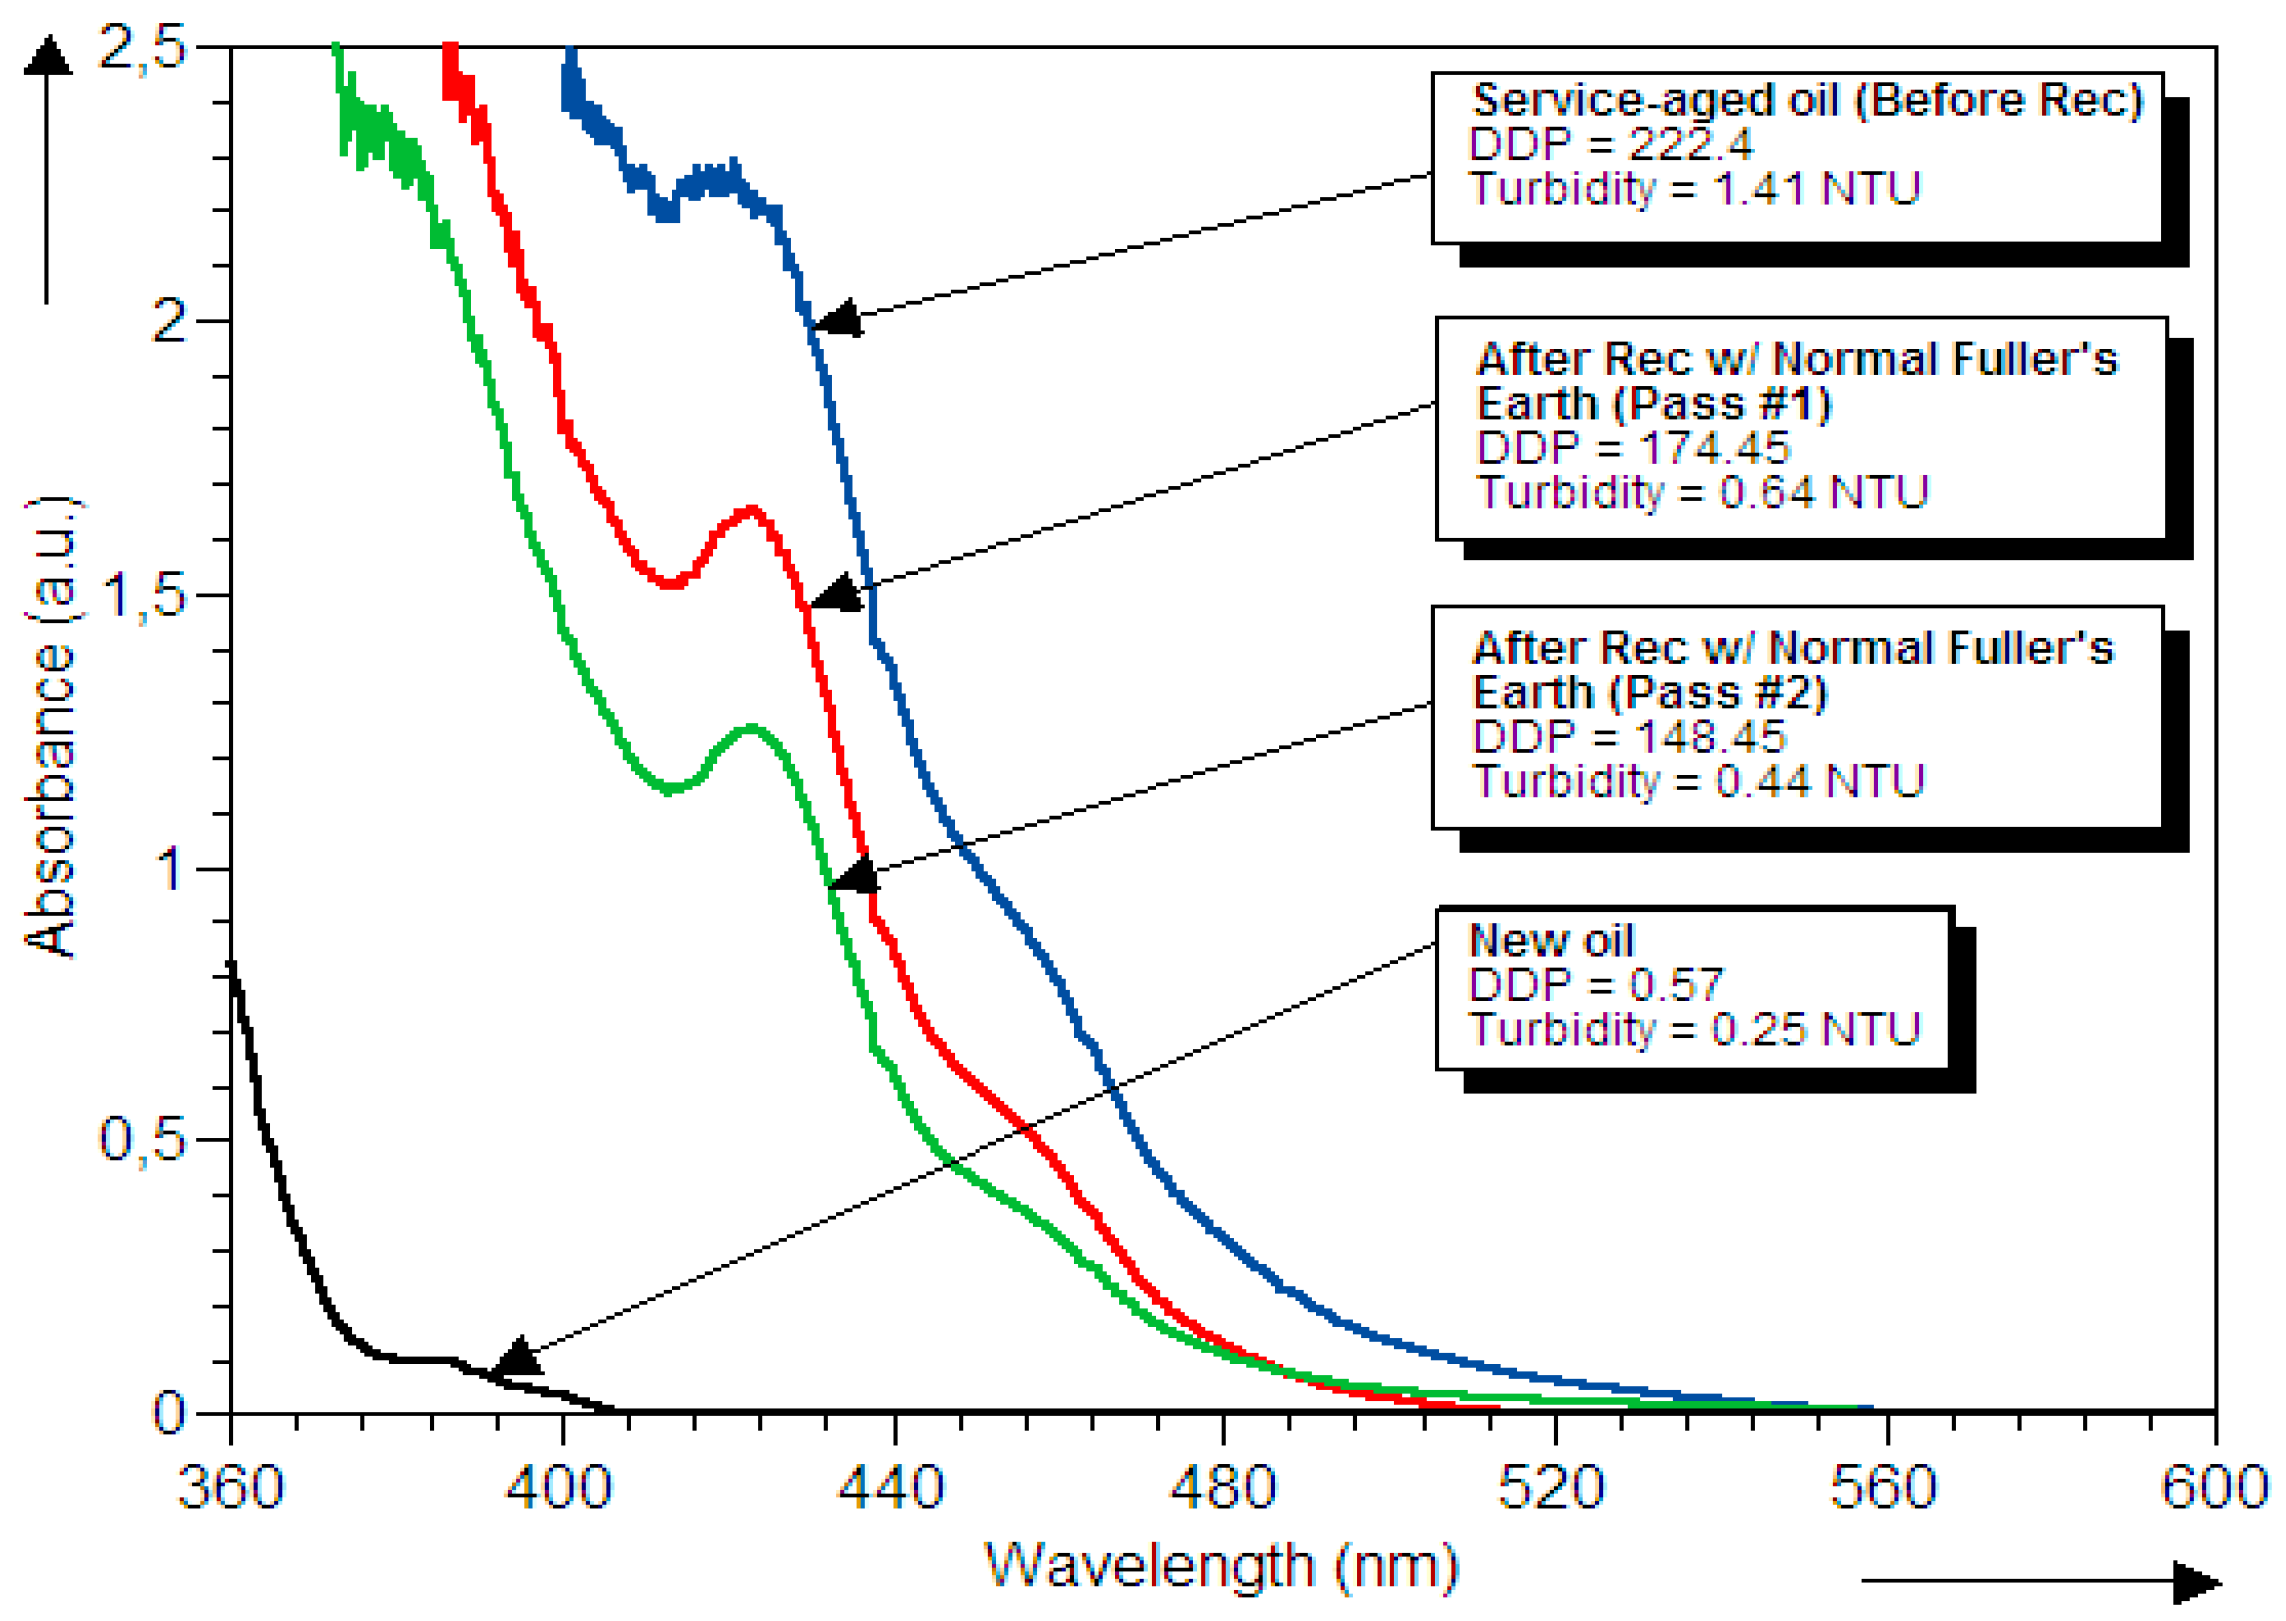
3.3. UV/Visible Spectroscopy-Based Testings

UV-visible spectroscopy is a technique that readily allows one to determine the concentrations of substances or the quantitative analysis of all molecules that absorb ultraviolet and visible electromagnetic radiation [112]. UV-visible spectrometers can be used to measure the absorbance of ultra violet or visible light by a sample, either at a single wavelength or perform a scan over a range in the spectrum. The UV region ranges from 190 to 400 nm and the visible region from 400 to 800 nm. The light source (a combination of tungsten/halogen and deuterium lamps) provides the visible and near ultraviolet radiation covering the 200–800 nm. The output from the light source is focused onto the diffraction grating which splits the incoming light into its component colors of different wavelengths, like a prism but more efficiently. For liquids the sample is held in an optically flat, transparent container called a cell or cuvette. The reference cell or cuvette contains the solvent in which the sample is dissolved and this is commonly referred to as the blank. The technique can be used both quantitatively and qualitatively. For each wavelength, the intensity of light passing through both a reference cell ( I 0 ) and the sample cell ( I ) is measured. The Bouguer-Lambert-Beer law forms the mathematical-physical basis of light-absorption measurements on gases and solutions in the UV-vis and IR region [113]:
log ( I 0 I ) = log ( 100 T ( % ) ) A = ε . c . d
where A = log ( I 0 I ) is the absorbance (absorbance does not have any units), T ( % ) = I 0 I . 100 is the transmittance, ε is the molar dedicated extinction coefficient, I 0 is the intensity of the monochromatic light entering the sample and I is the intensity of this light emerging from the sample; c is the concentration of the light-absorbing substance and d is the path-length of the sample in cm. The ASTM D 6802 [68] is used in transformer insulating oils. This method is based upon the observation that in the range of visible spectrum all brands of new insulating liquids are almost completely transparent to a monochromatic beam of light. On the contrary, when the fluid contains decay products, the absorbance curve, as determined by a scanning spectrophotometer, significantly shifts to longer wavelengths. The numerical integration of the area below these absorbance curves permits the relative content of dissolved oxidation decay products in the fluid samples. Under normal operating conditions, transformer oil deteriorates as a result of various stresses, electrical, chemical and thermal. This results in dissolved decay products which are the result of aging of the oil in service. The content of dissolved decay products in the insulating oil consists of a variety of compounds, such as peroxides, aldehydes, ketones, and organic acids each of which is partially adsorbed onto the large surface of the of the insulation paper leading to premature aging of transformers. This process occurs long before other less sensitive analytical methods may indicate. Therefore, the relative evaluation of the formation of by-products can be used as insulation aging indicator of oil/paper complex, as well as changes in the dielectric properties of the windings. Table 5 highlights the guidelines for DDP values, expressed in arbitrary unit (a.u.).
UV/vis spectroscopy was used to monitor decay products in reclaimed oils [115]. An example of the results from UV-vis spectroscopy is given in Figure 3 [115]. It shows the progress of service-aged oil reclamation process with two different types of Fuller’s earth.
Ultraviolet (UV) and visible spectrometers have been used the last 35 years and they became the most important analytical instrument in the modern day laboratory. In many applications, other techniques could be employed but none rival UV-visible spectrometry for its simplicity, versatility, speed, accuracy and cost-effectiveness. UV-visible spectrometers are available as single beam or double beam. The advantage of the double beam spectrophotometers is that they make it possible to differentiate measurements between the sample and the analytical blank. They are preferable to single beam model if the solutions are turbid. The bandwidth of the best devices can go down to 0.01 nm [116].
IFT measurements require trained person and some precautions as mentioned in the ASTM D971 to perform the measurements. To overcome this, a novel method based on using UV-vis spectroscopy combined with artificial intelligence models have been recently proposed to estimate the IFT of transformer oil [117]. It seems that this method gives good results. However, a greater number of samples are necessary to validate this method.
Recently, new approach based on spectroscopic analysis to estimate furan compounds has been proposed [118]. This method is based on UV-vis spectral response and artificial intelligence [119,120]. The results reported shows good correlation between furan concentrations in transformer oil and its spectral response parameters.
Another important UV-vis spectroscopy based technique is the free radicals determination. Free radicals play a major role in a wide variety of aging processes. The detection of these reactive species in oil may, in principle, provide useful information for monitoring oil degradation. The paramount importance of free radicals in the physical organic chemistry of mineral insulating oils has been underscored by John Tanaka at the Nineteenth Symposium on Electrical Insulation [121]. These by-products are deleterious to the transformer and catalyze further oxidation of the oil. Free radicals are very reactive and can adversely affect the chemical, physical, and dielectric properties of the insulating liquid [122,123]. The reactive free radical reagent, 2,2-diphenyl-1-picrylhydrazyl (DPPH), is added to a solution, the free radical concentration of which is to be determined [124]. The presence of free radicals in solution will increase the rate at which DPPH disappears from the background solution; the higher the free radical concentration in the test specimen, the faster DPPH disappears. The relative free radical concentration of an insulating oil test specimen is determined as follows [124]: initially, the absorbance of the background solution of known concentration is recorded. Subsequently the decreasing absorbance of the oil specimen added to the background solution is plotted. Finally the subtraction of the oil specimen absorbance from the background solution results in a display curve of the reaction. The absorbance at 240 s/4 min from the beginning of the reaction is reported [122]. This method is applicable to new, reclaimed, or used oils as well as naturally or artificially oxidized oil (the cause of aging can be chemical, physical, or electrical).

3.4. Turbidity Analysis

Turbidity is the cloudiness or haziness of a liquid caused by suspended solids that are usually invisible to the naked-eye. Usually, a liquid contains suspended solids that consist of many different particles of varying sizes. Some of the particles are large and heavy enough to eventually settle to the bottom of a container if a sample is left standing (these are the settle-able solids). The smaller particles will only settle slowly, if at all (these are the colloidal solids). It is these particles that cause the liquid to look turbid. The turbidity of a liquid uses the principle of the interaction between an incident light wave and a particle in suspension mainly generating phenomena of diffusion, reflection, absorption and refraction. This claimed particle size, kind, shape, refractive index and its intensity causes a dispersion of the incident light in all directions. Turbidity working principle is based on nephelometry. This latter is measured by photometry concentration of particles in a liquid by diffusion at 90°. When used in correlation with nephelometry and other angles, attenuation-angled photodetectors can assist in improving turbidity meter accuracy. This is often referred to as a ratio design. Ratio or ratiometric turbidity meters are still categorized under nephelometric technology as a 90° angle is used as the primary detector. With multiple photodetector angles, algorithms may be used to compensate for optical interferences and increase instrument sensitivity. The Standard Methods ratiometric method uses the following algorithm [125,126]:
T = I 90 d 0 . I t + d 1 . I f s + d 2 . I b s + d 3 . I 90
where T = turbidity in NTU (0–10,000); d 0 , d 1 , d 2 , d 3 = calibration coefficients; I 90 = 90 degree detector current; I t = transmitted detector current; I f s = forward scatter detector current; and I b s = back scatter detector current.
The ASTM Designation 6181 [127] method is an accurate optical laboratory technique developed to quantitatively determine the amount of microscopic solid suspension that may exist in both new and in-service fluids. Increasing turbidity signifies increasing fluid contamination. Other turbidity sources, such as water droplets or gas bubbles, are eliminated [127]. Under normal operating conditions, oil insulation/paper power transformers undergoes slow degradation process. The electrical, heat, aggressive behavior of dissolved oxygen and the catalytic effect of copper combine to accelerate this deterioration. Resulting degradation products are gradually changing the physical, chemical and dielectric properties of the insulating oil. Some are soluble in the dielectric fluid. However, secondary chemical reactions can generate insoluble solid particles, invisible and microscopic dimensions, known under the generic name “sludge”. These invisible suspensions are able to clog the pores of the paper insulation, which inhibits the ability of the oil to dissipate the thermal energy generated by the coils. It is therefore extremely important to detect these suspensions before the oil breakdown voltage is decreased. Measuring the amount of insoluble suspensions therefore appears to be very important, since these by-products clearly contribute to the insulation electrical and thermal degradation. Some guidelines for turbidity values are given in Table 6.
Different types of electronic turbidimeter are available. The use of multiple detectors can improve accuracy and decrease the interference from dissolved colored materials and stray light [128]. Their advantages and limitations are listed in Table 7.

4. Alternative Insulating Materials

The philosophy of power transformer design is founded on many years of research and development. However, in a world where everything evolves and changes rapidly, the key strategy must be based on the continuous improvement to each material involved in the design. Facing the paramount role played by temperature in the transformer degradation process, thermally-upgraded insulation was introduced more than 40 years ago to improve the stability of these critically important equipment in the transmission and distribution of electric energy. The effects of thermally-upgraded paper on the diagnostic techniques, such as furan analysis and chemical markers (alcohols) in the oil, are being investigated [74,89,129].
Even though thermally upgraded offers a 15° C higher temperature rating than normal Kraft paper, still the same basic limitations exist with cellulose (combination of high moisture absorption, auto-accelerating hydrolysis degradation in the presence of moisture, and relatively poor thermal stability) [130,131]. Another approach used aramid-based materials by Dupont, but high costs limit their use in most liquid-filled transformer applications. The Aramid paper (known by its trade name: Nomex) is mainly used as insulator for high temperatures applications such as traction transformers. To optimize cost and performance, hybrid insulation materials combining meta-aramid and cellulose have been proposed to provide incremental improvements in thermal stability. Several studies have been conducted to evaluate the performance of Aramid paper which has very good thermal properties [132,133,134]. To optimize costs and performance, hybrid insulation materials combining aramid and cellulose have been proposed to provide incremental improvements in thermal stability. The results of some works performed on hybrid insulation have shown that this type of insulation not only allows to increase the operating temperature [135], but also retard the degradation of insulating oil [136]. Recently, ASTM has developed a new standard test method for tensile testing of Aramid-based paper published as D7812, to be used for quality control [137].
A clear opportunity emerged to develop a flexible insulation material by 3M made by a wet-laid paper process (an organic binder, short cut fibers, and inorganic filler). Compared to Kraft paper, this flexible insulation provides [138]:
  • Low moisture absorption
  • Stable electrical properties in the presence of moisture
  • Increased thermal conductivity
  • Higher rated IEEE thermal class of 155 °C, which is a 50 °C improvement over Kraft—and a 35 °C improvement over thermally upgraded (TU) Kraft
  • Resistance to hydrolysis
  • Acceptable levels of mechanical and dielectric strength
In the last decades, environmental concerns are being considered as important factor to consider in the choice of insulation liquids. The impacts on the environment (toxicity) in terms of accidental release together with treatment at the end of life of insulation systems (recycling, reuse, disposal, incineration, landfilling...) are essential factors to consider. Many researches are therefore being directed towards environmentally friendly insulating liquids, as alternative to mineral oils [139]. Faced with the growing interest focused to “green insulating liquids”, many synthetic or vegetable based fluids are being investigated for application in power transformers. Even though Siemens delivered in 2014 the world’s first vegetable oil transformer in the 420 kV capacity range, research in this field is still at its earlier stage.
Throughout this article, the techniques described referred to mineral oil as this is something we are all familiar with. The properties of the alternatives fluids cannot be correlated directly to that of a mineral oil as their chemistries are very different [140]. They are so different, in fact, that ASTM has produced a new specification just for non-mineral oils [141,142]. IEC has also produced related specifications [142,143,144,145]. A Work Item (ASTM WK46195) by ASTM D27.02 subcommittee is developing a standard entitled: “New Specification for Synthetic Ester Fluids Used in Electrical Apparatus”. Related IEEE standards are also available [146,147,148].
Applicability of a number of electrical and physicochemical parameters, including acidity value, dielectric dissipation factor (DDF), viscosity and color for assessing the quality of these alternative fluids is possible (Table 8). For the most part, the same tests used to evaluate mineral oil are used to evaluate silicone, natural/synthetic esters [31,149]. It should be emphasized that results and the meaning of the tests are differently interpreted.

5. Conclusions

This review summarizes the main physicochemical diagnostics techniques and demonstrates their usefulness in transformers. The critical nature of transformers and the recognition that they need continuous maintenance and a thorough understanding of multiple potential failure processes has raised the importance of dielectric fluid analysis to the forefront. This has been driven by the need to obtain better and faster analyses and a better methodology of defining the health of the asset. These techniques can be summarized as follows:
  • HPLC is effective in the separation, detection and quantification of the furaldehydes produced as degradation by-products of paper.
  • GC-MS, the gas chromatography stage separates the various gaseous species, by preferential attraction to a feed column, prior to them being injected into a mass spectrometer for identification and quantification.
  • FTIR, this technique makes uses of the resonant vibrational frequencies of molecules to identify the structural groupings within a material. Its potential for characterizing the degree of degradation of oil/paper insulation is also emphasized.
  • The dissolved decay products uses a spectrophotometer to evaluate the absorbance curve of insulating fluids in the visible spectrum. The numerical integration of the area below the absorbance curves permits the relative content of dissolved oxidation decay products.
  • The Turbidity utilizes a ratio turbidimeter to evaluate the degree of contamination by solid particles in suspension produced either from external sources such as varnish and metallic particles from the materials used in transformers or internal chemical reactions such as oxidation. The IFT is affected by certain contaminants such as soaps, paints, varnishes, and oxidation products present in the oil. While IFT measurements require trained person and some precautions as mentioned in the ASTM D971 to perform, the measurements turbidity is very simple and quick.
  • Methanol is a promising chemical marker for early-stage paper degradation of in-service transformer. This marker could permit an easier estimation of the end-of-life of the transformer.
  • Free radicals measurement is possible by using reactive free radical reagent, 2,2-diphenyl-1-picrylhydrazyl (DPPH) added in oil.
The diagnostic methods presented in this review are usually applied to the mineral oil and standard insulating paper. However, currently there is considerable effort to establish diagnostic standards for biodegradable oil and thermally upgraded paper. As part of an overall maintenance strategy, these tests might therefore enhance the effectiveness of predictive maintenance procedures. This allows maintenance planners to make the best use of maintenance and replacement budgets, allocating funds to high-risk units.

Author Contributions

All authors contributed equally to the reported research and writing of the paper.

Conflicts of Interest

The authors declare no conflict of interest.

Abbreviations

The following abbreviations are used in this manuscript:
CIGRE
International Council of Large Electric Systems
ISO
International Organization for Standardization
ASTM
American Society for Testing and Materials
ASTM D
American Society for Testing and Materials Designation
IEC
International Electrotechnical Commission
IFT
Interfacial tension
AN
Acid number
LV
Low voltage
HV
high voltage
2FAL
2-furfuraldehyde
DP
Degree of polymerization
DPv
Degree of polymerization value
TDCG
Total dissolved combustible gas
TU
Thermal upgraded
DDP
Dissolved decay products
DDPH
2,2-Diphenyl-1-picrylhydrazyl
a.u.
Arbitrary unit
NTU
Nephelometric turbidity unit
VDE
Verband der Elektrotechnik, Elektronik, Informationstechnik
HPLC
High performance liquid chromatograph
FTIR
Fourier transform infrared spectroscopy
DGA
Dissolved gas analysis
NIR
Near infrared
GC-MS
Gas chromatography-mass spectrometry
GPC
Gel permeation chromatography
UMR
Unité Mixte de Recherche
CNRS
Centre National de la Recherche Scientifique
ViAHT
VIeillissement de l’Appareillage à Haute Tension
KF
Karl Fisher
DBPC
2,6-Di-tert-butyl-paracresol
DBP
2,6-Di-tert-butyl-phenol
OLTC
On load tap changer
UHF
Ultra-high frequency
WCPA
Active water content of paper
UV-vis
Ultraviolet and visible

References

  1. The Council on Large Electric Systems (CIGRE). CIGRE Technical Brochure 248; Economics of Transformer Management, CIGRE: Paris, France, 2004. [Google Scholar]
  2. Boss, P.; Lorin, P.; Viscardi, A.; Harley, J.W.; Isecke, J. Economical aspects and experiences of power transformer on-line monitoring. In CIGRE Session 2000; CIGRE: Paris, France, 2000. [Google Scholar]
  3. Chakravorti, S.; Dey, D.; Chatterjee, B. Recent Trends in the Condition Monitoring of Transformers: Theory, Implementation and Analysis; Springer-Verlag: London, UK, 2013. [Google Scholar]
  4. Fetherston, F.; Finlay, B. Power transformer condition assessment-the second century and beyond. In Proceedings of the Australasian Universities Power Engineering Conference (AUPEC), Perth, Australia, 23–26 September 2001.
  5. Fofana, I.; Zié, Y.; Farzaneh, M. Recent Advances in Dielectric Materials: Dielectric Response Methods for Diagnostics of Power Equipment; Nova Science Publishers Inc.: New York, NY, USA, 2009. [Google Scholar]
  6. Fofana, I.; Hadjadj, Y. Review of Electrical Diagnostic Techniques for Assessing Insulation condition in Aged Transformers. Energies 2016. submitted. [Google Scholar]
  7. The American Society for Testing and Materials (ASTM). Standard Test Method for ASTM Color of Petroleum Products (ASTM Color Scale); ASTM D1500-12; ASTM International: West Conshohocken, PA, USA, 2012. [Google Scholar]
  8. The American Society for Testing and Materials (ASTM). Standard Test Method for Color of Transparent Liquids (Gardner Color Scale); ASTM D1544-04; ASTM International: West Conshohocken, PA, USA, 2010. [Google Scholar]
  9. Hadjadj, Y.; Fofana, I.; Sabau, J.; Briosso, E. Assessing insulating oil degradation by means of turbidity and UV/VIS spectrophotometry measurements. IEEE Trans. Dielectr. Electr. Insul. 2015, 22, 2653–2660. [Google Scholar]
  10. The American Society for Testing and Materials (ASTM). Standard Test Method for Visual Examination of Used Electrical Insulating Liquids in the Field; ASTM D1524-15; ASTM International: West Conshohocken, PA, USA, 2015. [Google Scholar]
  11. CIGRE Technical Brochure 157. In Effect of Particles on Transformer Dielectric Strength; Final Report of CIGRE SC 12; WG 17 (Particles in Oil); CIGRE: Paris, France, 2000.
  12. CIGRE Working Group A2.34. Guide for Transformer Maintenance; CIGRE Report ISBN: 978-2-85873-134-3; CIGRE: Paris, France, 2011. [Google Scholar]
  13. Sokolov, V.; Laport, J.; Harley, J.; Goosen, P.; Guuinin, P. CIGRE Technical Brochure 227; Life Management Techniques for Power Transformers, Final Report of CIGRE SC A2 WG 18; CIGRE: Paris, France, 2002. [Google Scholar]
  14. Miners, K. Particles and Moisture Effect on Dielectric Strength of Transformer Oil using VDE Electrodes. IEEE Trans. Power Appar. Syst. 1982, PAS-101, 751–756. [Google Scholar] [CrossRef]
  15. Wang, Z.D.; Liu, Q.; Wang, X.; Yi, X.; Jarman, P.; Wilson, G.; Dyer, P. Ester Insulating Liquids for Power Transformers; CIGRE session A2-209; CIGRE: Paris, France, 2012. [Google Scholar]
  16. Wang, X.; Wang, Z.D.; Noakhes, J. Motion of conductive particles and the effect on AC breakdown strengths of esters. In Proceedings of the 2011 IEEE International Conference on Dielectric Liquids (ICDL), Trondheim, Norway, 26–30 June 2011; pp. 1–4.
  17. Sarathi, R.; Archana, M. Investigation of partial discharge activity by a conducting particle in transformer oil under harmonic AC voltages adopting UHF technique. IEEE Trans. Dielectr. Electr. Insul. 2012, 19, 1514–1520. [Google Scholar] [CrossRef]
  18. International Electrotechnical Commission (IEC). Mineral Insulating Oils in Electrical Equipment—Supervision and Maintenance Guidance (Annex B); IEC 60422:2005; IEC: Geneva, Switzerland, 2005. [Google Scholar]
  19. Oommen, T.V.; Petrie, E.M. Particle Contamination Levels in Oil-Filled Large Power Transformers. IEEE Trans. Power Appar. Syst. 1983, PAS-102, 1459–1465. [Google Scholar] [CrossRef]
  20. Ferguson, R.; Lobeiras, A.; Sabau, J. Suspended particles in the liquid insulation of aging power transformers. IEEE Electr. Insul. Mag. 2002, 18, 17–23. [Google Scholar] [CrossRef]
  21. Mehanna, N.; Jaber, A.; Oweimreen, G.; Abulkibash, A. Assessment of dibenzyl disulfide and other oxidation inhibitors in transformer mineral oils. IEEE Trans. Dielectr. Electr. Insul. 2014, 21, 1095–1099. [Google Scholar] [CrossRef]
  22. IEC. Detection and Determination of Specified Anti-Oxidant Additives in Insulating OilsIEC 60666:2010, 2nd ed.; IEC: Geneva, Switzerland, 2010. [Google Scholar]
  23. Facilities Instructions, Standards and Techniques (FIST) Volume 3–31, Transformer Diagnostics. June 2003. Available online: https://www.usbr.gov/power/data/fist/fist3_31/fist3-31.pdf (accessed on 3 February 2016).
  24. Arakelian, V.G.; Fofana, I. Water in Oil Filled High Voltage Equipment. Part I: States, Solubility and Equilibrium in Insulating Materials. IEEE Electr. Insul. Mag. 2007, 23, 15–27. [Google Scholar] [CrossRef]
  25. Webb, M. Water in oils. In Proceedings of IEE Colloquium on an Engineering Review of Liquid Insulation, London, UK, 7 January 1997; pp. 2/1–2/6.
  26. CIGRE Working Group A2.30. Moisture Equilibrium and Moisture Migration within Transformer Insulation Systems; CIGRE Report ISBN:978-2-85873-036-0; CIGRE: Paris, France, 2008. [Google Scholar]
  27. IEC 60814. In Insulating Liquids Oil-Impregnated Paper and Pressboard: Determination of Water by Automatic Coulometric Karl Fischer Titration; IEC: Geneva, Switzerland, 1997.
  28. Arakelian, V.G.; Fofana, I. Water in Oil Filled High Voltage Equipment. Part II: Water Content as Physico-chemical Tools for Insulation Condition Diagnosis. IEEE Electr. Insul. Mag. 2007, 23, 15–24. [Google Scholar] [CrossRef]
  29. Du, Y.; Zahn, M.; Lesieutre, B.C.; Mamishev, A.V. Moisture equilibrium in transformer paper-oil systems. IEEE Electr. Insul. Mag. 1999, 15, 11–20. [Google Scholar] [CrossRef]
  30. Oommen, T.V. Moisture equilibrium charts for transformer insulation drying practice. IEEE Trans. Power App. Syst. 1984, PAS-103, 3063–3067. [Google Scholar] [CrossRef]
  31. CIGRE Brochure 436. In Experiences in Service with New Insulating Liquids; CIGRE WG A2-35; CIGRE: Paris, France, 2010.
  32. Fofana, I. 50 Years in the Development of Insulating Liquids. IEEE Electr. Insul. Mag. 2013, 29, 13–25. [Google Scholar] [CrossRef]
  33. Davydov, V.G.; Roizman, O. Moisture assessment in power transformers: Lessons learned. Available online: http://www.vaisala.com/Vaisala%20Documents/Vaisala%20News%20Articles/VN160/VN160_AllPages.pdf (accessed on 3 February 2016).
  34. Betie, A.; Meghnefi, F.; Fofana, I.; Yeo, Z.; Ezzaidi, H. On the feasibility of aging and moisture of oil impregnated paper insulation discrimination from dielectric response measurements. IEEE Trans. Dielectr. Electr. Insul. 2015, 22, 2176–2184. [Google Scholar] [CrossRef]
  35. Saha, T.K.; Purkait, P. Understanding the impacts of moisture and thermal aging on transformer’s insulation by dielectric response and molecular weight measurements. IEEE Trans. Dielectr. Electr. Insul. 2008, 15, 568–582. [Google Scholar] [CrossRef]
  36. The American Society for Testing and Materials (ASTM). Standard Test Method for Analysis of Gases Dissolved in Electrical Insulating Oil by Gas Chromatography; ASTM D3612-02; ASTM International: West Conshohocken, PA, USA, 2009. [Google Scholar]
  37. The Institute of Electrical and Electronics Engineers (IEEE) Standard. IEEE Guide for the Interpretation of Gases Generated in Oil-Immersed Transformers—Section 1.2 Limitations; C57.104; IEEE: Piscataway, NJ, USA, 1991. [Google Scholar]
  38. IEEE Guide for the Detection and Determination of Generated Gases in Oil-Immersed Transformers and Their Relation to the Serviceability of the Equipment; ANSI/IEEE Std. C57.104-1978; IEEE: Piscataway, NJ, USA, 1978.
  39. Ghalkhani, M.; Fofana, I.; Bouaicha, A.; Hemmatjou, H. Influence of aging byproducts on the gassing tendency of transformer oils. In Proceedings of the 2012 Annual Report Conference on Electrical Insulation and Dielectric Phenomena (CEIDP), Montreal, QC, Canada, 14–17 October 2012; pp. 870–873.
  40. Dornenburg, E.; Strittmatter, W. Monitoring oil cooled transformers by gas analysis. Brown Boveri Rev. 1974, 61, 238–247. [Google Scholar]
  41. Rogers, R.R. IEEE and IEC codes to interpret incipient faults in transformers, using gas in oil analysis. IEEE Trans. Electr. Insul. 1978, 13, 349–354. [Google Scholar] [CrossRef]
  42. Duval, M. Fault gases formed in oil-filled breathing EHV power transformers: The interpretation of gas analysis data. IEEE Paper No. C74 476-8. In Proceedings of IEEE Summer Meeting, Anaheim, CA, USA, 14–19 July 1974.
  43. Lewand, L. Techniques for Interpretation of Data for DGA from Transformers. In Proceedings of IEEE/PES Transformers Committee Meeting, Montreal, QC, Canada, 26 October 2006.
  44. Muller, R.; Potthoff, K.; Soldner, K. The analysis of gases dissolved in the oil as a means of monitoring transformers and detecting incipient faults. Paper 12-02. In Proceedings of CIGRE 1970 Session, Paris, France, 24 August–2 September 1970.
  45. Carbonara, J.; Lynch, M.; Hunt, M.; Brazil, J. The transformer gas analyzer—A practical expert system for the diagnosis of operational faults in electrical transformers. In Proceedings of the American Power Conference, Chicago, IL, USA, 26 April 1994; Part I. Volume 56, pp. 342–347.
  46. Barraclough, B.; Bayley, E.; Davies, I.; Robinson, K.; Rogers, R.R.; Shanks, E. CEGB experience of the analysis of dissolved gas in transformer oil for the detection of incipient faults. In Proceedings of the IEE Conference on Diagnostic Testing of High Voltage Power Apparatus in Service, London, UK, 6–8 March 1973.
  47. Pugh, D.R. Advances in fault diagnosis by combustible gas analysis. In Proceedings of the Minutes of 41st International Conference of Doble Clients, Boston, MA, USA, 3–8 April 1974; pp. 10:1201–10:1208.
  48. Church, J.O.; Haupert, T.J.; Jacob, F. Analyze incipient faults with dissolved gas Nomograph. Electrical World 1987, 201, 40–44. [Google Scholar]
  49. Riese, C.E.; Stuart, J.D. A knowledge-engineering facility for building scientific expert systems. In Artificial Intelligence Applications in Chemistry; American Chemical Society: Washington, DC, USA, 1986; Volume 306, pp. 18–36. [Google Scholar]
  50. Ding, X.; Yao, E.; Liu, Y.; Griffin, P.J. ANN based transformer fault diagnosis using gas-in-oil analysis. In Proceedings of the 57th American Power Conference, Chicago, IL, USA, 18–20 April 1995.
  51. Miranda, V.; Castro, A.R.G. Improving the IEC table for transformer failure diagnosis with knowledge extraction from neural networks. IEEE Trans. Power Deliv. 2005, 20, 2509–2516. [Google Scholar] [CrossRef]
  52. Lamontagne, D.R. An artifical neural network approach to transformer dissolved gas analysis and problem notification at Arizona public service. In Proceedings of the EPRI Substation Equipment Diagnostics Conference XIV, San Diego, CA, USA, 16–19 July 2006.
  53. International Electrotechnical Commission. Mineral oil-filled electrical equipment in service—Guidance on the interpretation of dissolved and free gases analysis, IEC 60599; IEC: Geneva, Switzerland, 2015. [Google Scholar]
  54. McGrail, A.J.; Gulski, E.; Allan, D.; Birtwhistle, D.; Blackburn, T.R.; Groot, E.R.S. Data mining techniques to assess the condition of high voltage electrical plant. In Proceedings of International Conference on Large High Voltage Electric Systems, CIGRE Session No. 39, paper 12-02, Paris, France, 25–30 August 2002.
  55. Mansour, D.E.A. A new graphical technique for the interpretation of dissolved gas analysis in power transformers. In Proceedings of the 2012 Annual Report Conference on Electrical Insulation and Dielectric Phenomena (CEIDP), Montreal, QC, Canada, 14–17 October 2012; pp. 195–198.
  56. Akbari, A.; Setayeshmehr, A.; Borsi, H.; Gockenbach, E.; Fofana, I. Intelligent Agent-based System using Dissolved Gas Analysis to Detect Incipient Faults in Power Transformers. IEEE Electr. Insul. Mag. 2010, 26, 28–41. [Google Scholar] [CrossRef]
  57. Duval, M.; Lamarre, L. The Duval pentagon—A new complementary tool for the interpretation of dissolved gas analysis in transformers. IEEE Electr. Insul. Mag. 2014, 30, 9–12. [Google Scholar]
  58. Hepburn, D.M.; Shields, A.J.; Kemp, I.J. High voltage plant monitoring through oil/paper analysis. In Proceedings of the Eighth International Conference on Dielectric Materials, Measurements and Applications, Edinburgh, UK, 17–21 September 2000; pp. 218–223.
  59. Imad, U.K.; Wang, Z.; Cotton, I.; Northcote, S. Dissolved gas analysis of alternative fluids for power transformers. IEEE Electr. Insul. Mag. 2007, 23, 5–14. [Google Scholar] [CrossRef]
  60. Jovalekic, M.; Vukovic, D.; Tenbohlen, S. Dissolved gas analysis of alternative dielectric fluids under thermal and electrical stress. In Proceedings of the 2011 IEEE International Conference on Dielectric Liquids (ICDL), Trondheim, Norway, 26–30 June 2011; pp. 1–4.
  61. CIGRE. CIGRE Brochure 443. In DGA in Non-Mineral Oils and Load Tap Changers and Improved DGA Diagnosis Criteria, WG D1.32; CIGRE: Paris, France, 2010. [Google Scholar]
  62. Sharma, N.K.; Tiwari, P.K.; Sood, Y.R. Review of Artificial Intelligence Techniques Application to Dissolved Gas Analysis on Power Transformer. Int. J. Comput. Electr. Eng. 2011, 3, 577–582. [Google Scholar] [CrossRef]
  63. Myers, S.D.; Kelly, J.J.; Parrish, R.H. Transformer Maintenance Guide; Transformer Maintenance Institute: Akron, OH, USA, 1991. [Google Scholar]
  64. American Society for Testing and Materials (ASTM). Standard Test Method for Interfacial Tension of Oil against Water by the Ring Method. D 971. Available online: http://www.biolinscientific.com/zafepress.php?url=%2Fpdf%2FAttension%2FApplication%20Notes%2FAT_AN_10_astm.pdf (accessed on 12 February 2016).
  65. FIST Volume 3–5, Maintenance of Liquid Insulation: Mineral Oils and Askarels, 1992. Available online: http://www.worldcat.org/title/maintenance-of-liquid-insulation-mineral-oils-and-askarels/oclc/45032750 (accessed on 10 January 2016).
  66. Gray, I.A.R. A Guide to Transformer Oil Analysis. Available online: http://www.satcs.co.za/Transformer_Oil_Analysis.pdf (accessed on 10 November 2014).
  67. Industry news. Punctured Rubber Bladders Detected by New ASTM Oil Test. IEEE Electr. Insul. Mag. 2006, 22, 55. Available online: http://www.insoil.ca/video/Industry%20News(3).pdf?SID=f5c2662d5f5da6a739a858eab7ab92ac (accessed on 10 January 2016). [Google Scholar]
  68. The American Society for Testing and Materials (ASTM). Test Method for Determination of the Relative Content Of Dissolved Decay Products in Mineral Insulating Oils by Spectrophotometry; ASTM D6802-02; ASTM International: West Conshohocken, PA, USA, 2010. [Google Scholar]
  69. Shroff, D.H.; Stannett, A.W. A review of paper aging in power transformers. IEEE Proc. C 1985, 132, 312–319. [Google Scholar] [CrossRef]
  70. Emsley, A.M.; Stevens, G.C. Review of chemical indicators of degradation of cellulosic electrical paper insulation in oil-filled transformers. IEE Proc. Sci. Meas. Technol. 1994, 141, 324–334. [Google Scholar] [CrossRef]
  71. The American Society for Testing and Materials (ASTM). Standard Test Method for Measurement of Average Viscometric Degree of Polymerization of New and Aged Electrical Papers and Boards; ASTM D4243-99; ASTM International: West Conshohocken, PA, USA, 2009. [Google Scholar]
  72. Measurement of the Average Viscometric Degree of Polymerization of New and Aged Cellulosic Electrically Insulating Materials; IEC 60450; IEC: Geneva, Switzerland, 2007.
  73. Gilbert, R.; Jalbert, J.; Duchesne, S.; Tétreault, P.; Morin, B.; Denos, Y. Kinetics of the production of chain-end groups and methanol from the depolymerization of cellulose during the aging of paper/oil systems. Part 2: Thermally-upgraded insulating papers. Cellulose 2010, 17, 253–269. [Google Scholar] [CrossRef]
  74. Arroyo-Fernandez, O.H.; Fofana, I.; Jalbert, J.; Ryadi, M. Relationships between methanol marker and mechanical performance of electrical insulation papers for power transformers under accelerated thermal aging. IEEE Trans. Dielectr. Electr. Insul. 2015, 22, 3625–3632. [Google Scholar] [CrossRef]
  75. Tamura, R.; Anetai, H.; Ishii, T.; Kawamura, T. Diagnostic of aging deterioration of insulating paper. JIEE Proc. Pub. A 1981, 101, 30. [Google Scholar]
  76. Burton, P.J.; Graham, J.; Hall, A.C.; Laver, J.A.; Oliver, A.J. Recent developments by CEGB to improve the prediction and monitoring of transformer performance. In Proceedings of International Conference on Large High Voltage Electric Systems, CIGRE, paper 12-09, Paris, France, 29 August–6 September 1984.
  77. De Pablo, A. Furfural and aging: How are they related. In Proceedings of the IEE Colloquium on Insulating Liquids (Ref. No. 1999/119), Leatherhead, UK, 27 May 1999; pp. 5/1–5/4.
  78. Norazhar, A.B.; Abu-Siada, A.; Islam, S. A review on chemical diagnosis techniques for transformer paper insulation degradation. In Proceedings of The Australasian Universities Power Engineering Conference, Hobart, Australia, 29 September–3 October 2013.
  79. Lewand, L.R. Practical experience gained from furanic compound analysis. In Proceedings of the 73rd Annual International Doble Client Conference, Boston, MA, USA, 8–14 April 2006.
  80. Jalbert, J.; Gilbert, R.; Denos, Y.; Gervais, P. Chemical markers for the determination of power transformer insulating life, a step forward. Paper IM-3. In Proceeding of the 76th Annual International Doble Client Conference, Boston, MA, USA, 29 April–3 May 2009.
  81. Jalbert, J.; Gilbert, R.; Denos, Y.; Gervais, P. Methanol: A Novel Approach to Power Transformer Asset Management. IEEE Trans. Power Deliv. 2012, 27, 514–520. [Google Scholar] [CrossRef]
  82. Schaut, A.; Eeckhoudt, S. Identification of early stage paper degradation by methanol. Paper A2-107. In Proceedings of CIGRE 2012, Paris, France, 26–31 August 2012.
  83. Jalbert, J.; Gilbert, R.; Tétreault, P.; Morin, B.; Lessard-Déziel, D. Identification of a chemical indicator of the rupture of 1,4-β-glycosidic bonds of cellulose in an oil-impregnated insulating paper system. Cellulose 2007, 14, 295–309. [Google Scholar] [CrossRef]
  84. Schaut, A.; Autru, S.; Eeckhoudt, S. Applicability of methanol as new marker for paper degradation in power transformers. IEEE Trans. Dielectr. Electr. Insul. 2011, 18, 533–540. [Google Scholar] [CrossRef]
  85. Robinson, N. Liquid chromatography and its application in transformer oil analysis. Wearcheck Technical Bulletin 2012, 54. Available online: http://www.wearcheck.co.za/blog/item/35-liquid-chromatography-and-its-application-in-transformer-oil-analysis (accessed on 25 March 2016). [Google Scholar]
  86. Emsley, A.M.; Xiao, X.; Heywood, R.J.; Ali, M. Degradation of cellulosic insulation in power transformers. Part 2: Formation of furan products in insulating oil. IEE Proc. Sci. Meas. Technol. 2000, 147, 110–114. [Google Scholar] [CrossRef]
  87. Burton, P.J.; Carballiera, M.; Duval, M.; Fuller, J.; Graham, C.W.; De Pablo Samat, J.; Spicar, E. Applications of liquid chromatography to the analysis of electrical insulating materials. In Proceedings of the CIGRE International Conference on Large High Voltage Electrical Systems, Paris, France, 28 August–3 September 1998.
  88. Dong, M.W. Modern HPLC for Practicing Scientists; John Wiley & Sons, Inc.: Hoboken, NJ, USA, 2006. [Google Scholar]
  89. Lütke, H.; Höhlein, I.; Kachler, A.J. Transformer aging research on furanic compounds dissolved in insulating oil. Paper 15-302. In Proceedings of the CIGRE International Conference on Large High Voltage Electrical Systems, Paris, France, 25–30 August 2002.
  90. Łojewska, J.; Miśkowiec, P.; Łojewski, T.; Proniewicz, L.M. Cellulose oxidative and hydrolytic degradation: In situ FTIR approach. J. Polym. Degrad. Stab. 2005, 88, 512–520. [Google Scholar] [CrossRef]
  91. Saha, T.K.; Darveniza, M.; Hill, D.J.T.; Le, T.T. Electrical and chemical diagnostics of transformers insulation. B. Accelerated aged insulation samples. IEEE Trans. Power Deliv. 1997, 12, 1555–1561. [Google Scholar] [CrossRef]
  92. Krawiec, S.; Leath, S. Improved heat transfer capability using iso-paraffins versus naphthenics in transformers. August 2011. Available online: http://lubricants.petro-canada.ca/pdf/LUB2403E-ImprovedHeatTransfer.pdf (accessed on 22 February 2016).
  93. Paul, G.; Chopkar, M.; Manna, I.; Das, P.K. Techniques for measuring the thermal conductivity of nanofluids: A review. Renew. Sustain. Energy Rev. 2010, 14, 1913–1924. [Google Scholar] [CrossRef]
  94. American Society for Testing and Materials (ASTM). Standard Test Method for Thermal Conductivity, Thermal Diffusivity and Volumetric Heat Capacity of Engine Coolants and Related Fluids by Transient Hot Wire Liquid Thermal Conductivity Method; ASTM D7896-14; ASTM International: West Conshohocken, PA, USA, 2014. [Google Scholar]
  95. American Society for Testing and Materials (ASTM). Standard Test Method for Specific Heat of Liquids and Solids; ASTM D2766-95; ASTM International: West Conshohocken, PA, USA, 2009. [Google Scholar]
  96. Loiselle, L.; Fofana, I.; Sabau, J.; Magdaleno-Adame, S.; Olivares-Galvan, J.C. Comparative Studies of the Stability of Various Fluids under Electrical Discharge and Thermal Stresses. IEEE Trans. Dielectr. Electr. Insul. 2015, 22, 2491–2499. [Google Scholar]
  97. Evans, J.S. The ups and downs of viscosity. Wearcheck Technical Bulletin 2007, 38. Available online: http://www.wearcheck.co.za/downloads/bulletins/bulletin/tech38.pdf (accessed on 10 February 2016). [Google Scholar]
  98. American Society for Testing and Materials (ASTM). Standard Test Method for Pour Point of Petroleum Products; ASTM D97-16; ASTM International: West Conshohocken, PA, USA, 2016. [Google Scholar]
  99. American Society for Testing and Materials (ASTM). Standard Test Method for Density, Relative Density (Specific Gravity), or API Gravity of Crude Petroleum and Liquid Petroleum Products by Hydrometer Method; ASTM D1298-99; ASTM International: West Conshohocken, PA, USA, 1999. [Google Scholar]
  100. American Society for Testing and Materials (ASTM). Standard Terminology Relating to Electrical Insulating Liquids and Gases; ASTM D2864-10e1; ASTM International: West Conshohocken, PA, USA, 2010. [Google Scholar]
  101. Lewand, L.R. The Corrosive Sulphur in transformers and transformer oil. In Proceedings of the 69th Annual International Doble Client Conference, Boston, MA, USA, 7–12 April 2002.
  102. Li, J.; He, Z.; Bao, L.; Yang, L. Influences of Corrosive Sulfur on Copper Wires and Oil-paper Insulation in Transformers. Energies 2011, 4, 1563–1573. [Google Scholar] [CrossRef]
  103. Wiklund, P.; Levin, M.; Pahlavanpour, B. Copper dissolution and metal passivators in insulating oil. IEEE Electr. Insul. Mag. 2007, 23, 6–14. [Google Scholar] [CrossRef]
  104. N’cho, J.S.; Fofana, I.; Beroual, A.; Aka-Ngnui, T.; Sabau, J. Aged Oils Reclamation: Facts and Arguments based on Laboratory Studies. IEEE Trans. Dielectr. Electr. Insul. (TDEI) 2012, 19, 1583–1592. [Google Scholar] [CrossRef]
  105. Robinson, N. Monitoring oil degradation with infrared spectroscopy. Wearcheck Technical Bulletin 2000, (Issue 18). Available online: http://www.wearcheck.com.gh/downloads/bulletins/bulletin/tech18.pdf (accessed on 10 February 2016). [Google Scholar]
  106. Lara-Lee Lumley, S. CH4 can be worth so much more: the role of oil analysis in gas engine reliability (part 2). Wearcheck Technical Bulletin 2015, (Issue 61). Available online: http://www.wearcheck.co.za/shared/Technical%20Bulletin%2061%20LR.pdf (accessed on 10 February 2016). [Google Scholar]
  107. Hadjadj, Y.; Fofana, I.; van der Voort, F.R.; Bussieres, D. Potential of Determining Moisture Content in Mineral Insulating Oil by FTIR Spectroscopy. IEEE Electr. Insul. Mag. 2016, 32, 34–39. [Google Scholar] [CrossRef]
  108. van de Voort, F.R.; Tavassoli-Kafran, M.H.; Curtis, J.M. Stoichiometric determination of moisture in edible oils by Mid-FTIR Spectroscopy. Anal. Chim. Acta 2016, 918, 1–7. [Google Scholar] [CrossRef] [PubMed]
  109. Gray, I.A.R. Guide for Polychlorinated Biphenyl (PCB) Management of Insulating oil in South Africa. Available online: http://www.wearcheck.co.za/downloads/PCB%20information%202004.pdf (accessed on 22 February 2016).
  110. McMaster, M. GC/MS: A Practical User’s Guide, 2nd ed.; John Wiley & Sons, Inc.: Hoboken, NJ, USA, 2008. [Google Scholar]
  111. Hübschmann, H.-J. Handbook of GC/MS: Fundamentals and Applications; Wiley-VCH Verlag GmbH & Co. KGaA: Weinheim, Germany, 2015. [Google Scholar]
  112. Perkampus, H.H. UV-vis Spectroscopy and Its Applications; Springer Verlag: Berlin, Germany; London, UK, 1992. [Google Scholar]
  113. Kortüm, G. Kolometrie, Photometrie und Spektrometrie, Kap 1.5,4. Aufl; Springer: Berlin, Germany, 1962. [Google Scholar]
  114. Fofana, I.; Bouaicha, A.; Farzaneh, M.; Sabau, J.; Bussières, D. Decay Products in the Liquid Insulation of Power Transformers. IET Electr. Power Appl. 2010, 4, 177–184. [Google Scholar] [CrossRef]
  115. N’cho, J.S.; Beroual, A.; Fofana, I.; Aka-Ngnui, T.; Sabau, J. Verification of Oil Reclamation Process by Turbidity and Spectrophotometry Measurements. J. Energy Power Eng. 2012, 6, 703–712. [Google Scholar]
  116. Rouessac, F.; Rouessac, A.; Cruché, D.; Duverger-Arfuso, C.; Martel, A. Analyse Chimique: Méthodes et Techniques Instrumentales, 7th ed.; Dunod: Paris, France, 2009. [Google Scholar]
  117. Bakar, N.A.; Abu-Siada, A. A novel method of measuring transformer oil interfacial tension using UV-Vis spectroscopy. IEEE Electr. Insul. Mag. 2016, 32, 7–13. [Google Scholar] [CrossRef]
  118. Lai, S.P.; Siada, A.A.; Islam, S.M.; Lenco, G. Correlation between UV-vis spectral response and furan measurement of transformer oil. In Proceedings of the 2008 International Conference on Condition Monitoring and Diagnosis, Beijing, China, 21–24 April 2008.
  119. Abu-Siada, A.; Lai, S.P.; Islam, S.M. A Novel Fuzzy-Logic Approach for Furan Estimation in Transformer Oil. IEEE Trans. Power Deliv. 2012, 27, 469–474. [Google Scholar] [CrossRef]
  120. Sin Pin, L.; Abu-Siada, A.; Islam, S. Furan measurement in transformer oil by UV-vis spectral response using Fuzzy Logic. In Proceedings of the 5th International Conference on Electrical and Computer Engineering ICECE 2008, Dhaka, Bangladesh, 20–22 December 2008.
  121. Tanaka, J. Free radicals in electrical insulation. In Proceedings of the 19th Symposium of Electrical Insulating Materials, Osaka, Japan, 13–15 June 1986.
  122. Abdolall, K. Feasibility of free radical detection for condition assessment of oil/paper insulation of transformers. In Proceedings of the Conference Record of the 2008 IEEE International Symposium on Electrical Insulation (ISEI), Vancouver, BC, Canada, 9–12 June 2008; pp. 182–186.
  123. Pryor, W.A. Introduction to Free Radical Chemistry; Prentice Hall: Upper Saddle River, NJ, USA, 1966. [Google Scholar]
  124. Fofana, I.; Sabau, J.; Betie, A. Measurement of the relative Free radical content of Insulating Oils of Petroleum Origin. Energies 2015, 8, 7690–7702. [Google Scholar] [CrossRef]
  125. Standard Methods. Standard Methods for the Examination of Water and Wastewater, 19th ed.; American Public Health Association: Washington, DC, USA, 1995. [Google Scholar]
  126. Franson, M.H.; Eaton, A.D.; Clesceri, L.S.; Greenberg, A.E. (Eds.) American Public Health Association, AWWA, and Water Environment Federation; Port City Press: Baltimore, MD, USA, 1995.
  127. American Society for Testing and Materials (ASTM). Standard Test Method for Measurement of Turbidity in Mineral Insulating Oil of Petroleum Origin (Withdrawn 2012); ASTM D6181-03; ASTM International: West Conshohocken, PA, USA, 2005. [Google Scholar]
  128. Sabau, J.; Sadar, M. Determination of solid suspensions in electrical insulating oils by turbidimetry. In Proceedings of SAIT/CEA Technology Symposium, Calgary, AB, Canada, 11–12 June 1998.
  129. Yamagata, N.; Miyagi, K.; Oe, E. Diagnosis of thermal degradation for thermally upgraded paper in mineral oil. In Proceedings of the 2008 International Conference on Condition Monitoring and Diagnosis, Beijing, China, 21–24 April 2008.
  130. Moser, H.P.; Dahinden, V. Transformerboard II: Properties and Application of Transformerboard of Different Fibres; Scientia Electrica: Zurich, Switzerland, 1987. [Google Scholar]
  131. Miyagi, K.; Oe, E.; Yamagata, N. Evaluation of Aging for Thermally Upgraded Paper in Mineral Oil. J. Int. Counc. Electr. Eng. 2011, 1, 181–187. [Google Scholar] [CrossRef]
  132. Ul-Haq, S. Influence of moisture on dielectric strength in polyamide (aramid) paper. In Proceedings of the Annual Report Conference on Electrical Insulation and Dielectric Phenomena, Albuquerque, NM, USA, 19–22 October 2003; pp. 325–328.
  133. Endoo, K.; Uwano, Y.; Hiraishi, K.; Oonuma, T.; Uemura, R. Improvement of dielectric strength on transformer winding using new aramid paper. Electr. Eng. Jpn. 1995, 115, 41–51. [Google Scholar] [CrossRef]
  134. Filliben, S.A. New test method to evaluate the thermal aging of aramid materials. In Proceedings of the 30th Electrical Insulation Conference (EIC), Annapolis, MD, USA, 5–8 June 2011; pp. 449–453.
  135. Song, I.K.; Lee, B.S. Hybrid insulation enables better transformer design. In Transmission and Distribution World; Korea Electric Power Research Institute: Changwon, Korea, 2005; Volume 57, pp. 71–77. [Google Scholar]
  136. Kassi, K.S.; Fofana, I.; Meghnefi, F.; Yeo, Z. Impact of local overheating on conventional and hybrid insulations for power transformers. IEEE Trans. Dielectr. Electr. Insul. 2015, 22, 2543–2553. [Google Scholar]
  137. ASTM D7812-16, Standard Test Method for Tensile Testing of Aramid Paper; ASTM International: West Conshohocken, PA, USA, 2016.
  138. 3MTM. Properties and Benefits of 3M™ Liquid-Filled Transformer Insulation. Available online: http://multimedia.3m.com/mws/media/1098968O/3m-liquid-filled-transformer-insulation-white-paper.pdf (assessed on 21 April 2016).
  139. Bandara, K.; Ekanayake, C.; Saha, T.; Ma, H. Performance of Natural Ester as a Transformer Oil in Moisture-Rich Environments. Energies 2016, 9, 258. [Google Scholar] [CrossRef]
  140. Lewand, L. Laboratory Testing of Natural Ester Dielectric Liquids. Available online: http://www.netaworld.org/sites/default/files/public/neta-journals/ChemPerWtr04.pdf (accessed on 5 March 2016).
  141. American Society for Testing and Materials (ASTM). Standard Specification for Natural (Vegetable Oil) Ester Fluids Used in Electrical Apparatus; ASTM D6871-03; ASTM International: West Conshohocken, PA, USA, 2008. [Google Scholar]
  142. American Society for Testing and Materials (ASTM). Standard Specifications for Silicone Fluid Used for Electrical Insulation; ASTM D4652-05; ASTM International: West Conshohocken, PA, USA, 2012. [Google Scholar]
  143. IEC 61099. In Insulating Liquids—Specifications for Unused Synthetic Organic Esters for Electrical Purposes, 2nd ed.; IEC: Geneva, Switzerland, 2010; p. 28.
  144. IEC 62770. In Fluids for Electrotechnical Applications—Unused Natural Esters for Transformers and Similar Electrical Equipment, 1st ed.; IEC: Geneva, Switzerland, 2013; p. 34.
  145. IEC 60836. In Specifications for Unused Silicone Insulating Liquids for Electrotechnical Purposes, 3rd ed.; IEC: Geneva, Switzerland, 2015; p. 21.
  146. IEEE C57.147-2008. In Guide for Acceptance and Maintenance of Natural Ester Fluids in Transformers; IEEE: Piscataway, NJ, USA, 2008.
  147. IEEE C57.111-1989. In Guide for Acceptance of Silicone Insulating Fluid and Its Maintenance in Transformers; IEEE: Piscataway, NJ, USA, 1989.
  148. IEEE C57.155-2014. In Guide for Interpretation of Gases Generated in Natural Ester and Synthetic Ester Immersed Transformers; IEEE: Piscataway, NJ, USA, 2014.
  149. Muhamad, N.A.; Phung, B.T.; Blackburn, T.R. Application of common transformers faults diagnosis methods on biodegradable oil-filled transformers. Electr. Eng. 2012, 94, 207–216. [Google Scholar] [CrossRef]
Figure 1. Functional based classification of oil properties adapted from [5]. Specifications in brackets are ASTM (American Society for Testing and Materials) standards.
Energies 09 00367 g001
Figure 2. Equilibrium curves for moisture partition between oil and paper (ppm vs. water content of paper) [31].
Energies 09 00367 g002
Figure 3. Comparison between new oil and service-aged oil reclaimed with two different types of Fuller’s earth [115]. DDP, dissolved decay product; NTU, nephelometric turbidity unit; Rec, reclamation; Rec w/ Normal Fuller’s Earth, reclaimed with Normal Fuller’s Earth.
Energies 09 00367 g003
Table 1. Oil condition based on color comparisons [9].
Color Comparator NumberColorOil Condition
<7Pale yellowGood oil
7–10YellowProposition A oil
10–11Bright yellowService-aged oil
11–14AmberMarginal condition
14–15BrownBad condition
16–18Dark brownSevere condition (reclaimed oil)
>18BlackExtreme condition (scrap oil)
Table 2. Categories of key gases and general fault conditions [39].
Key GasesPotential Fault Type
Methane, ethane, ethylene and small amounts of acetyleneThermal condition involving the oil
Hydrogen, methane and small amounts of acetylene and ethanePartial discharge
Hydrogen, acetylene and ethyleneSustained arcing
Carbon monoxide and carbon dioxideThermal condition involving the paper
Table 3. Advantages and disadvantages of degree of polymerization (DP) measurement [3].
AdvantagesDisadvantages
Easy to make DP measurementsDirect analysis of the paper insulation is an invasive procedure that requires the transformer to be taken out of service
The mechanical strength of paper is related to the average DPThe type of paper and its final chemical treatment significantly influence the rate of degradation
Table 4. Advantages and limitations of high performance liquid chromatography (HPLC) [88].
AdvantagesLimitations
  • Rapid and precise quantitative analysis
  • Automated operation
  • High-sensitive detection
  • Quantitative sample recovery
  • Amenable to diverse samples
  • No universal detector
  • Less separation efficiency than capillary gas chromatography (GC)
  • More difficult for novices
Table 5. Guidelines for dissolved decay products (DDPs) [114].
Oil ConditionDDP (a.u.)
Good oils0–10
Proposition A oils10–25
Marginal oils 4–10
Bad oils25–50
Very bad oils50–300
Extremely bad oils>550
Table 6. Guidelines suggested for turbidity [114].
Oil ConditionTurbidity (NTU)
Good oils0–1
Proposition A oils1–4
Marginal oils 4–10
Bad oils10–30
Very bad oils30–150
Extremely bad oils>150
Table 7. Advantages and limitations of turbidimeter.
AdvantagesLimitations
  • Very accurate
  • Useful for measuring very low turbidity (less than 5 NTU)
  • High cost
  • Need power supply
  • Easily damaged
Table 8. Fluid testing methods adapted from [31]. Most commonly used IEC methods are in blue; most commonly used ASTM methods in red while standard not quoted but generally used are in black.
PropertiesMineral OilSynthetic EsterNatural EsterSilicone Fluid
Acidity IEC  62021 - 1 / IEC  62021 - 2 / ASTM D 974 IEC  62021 - 1 / IEC  62021 - 2 / ASTM D 974 ASTM D974 IEC  62021 - 1 / ASTM D 974
AppearanceISO 2049/ ASTM D 1524 ISO  2049 / ASTM D 1524 ASTM D1524 ISO  2049 / ASTM D 1524
Breakdown voltageIEC 60156/ASTM D1816 IEC  60156 / ASTM D 877 / D 1816 ASTM D877/D1816 IEC  60156 / ASTM D 877 / D 1816
ColourISO2049/ISO 2211/ ASTM D 1500 ISO  2211 / ASTM D 1500 ASTM D1500 ISO  2211 / ASTM D 1500
Corrosive sulphurIEC 62535/ASTM D1275-ASTM D1275-
Dielectric dissipation factor IEC  60247 / IEC  61620 / ASTM D 924 IEC  60247 / ASTM D 924 ASTM D924 IEC  60247 / ASTM D 924
Density ISO  3675 / ISO  12185 / ASTM D 1298 ISO  3675 / ASTM D 1298 ASTM D1298 ISO  3675 / ASTM D 1298
DGA analysisIEC 60567/ ASTM D 3612 CIGRE brochure 443ASTM D2945/ASTM D3284/ASTM D3612CIGRE brochure 443
Fire pointISO 2592/ ASTM D 92 ISO  2592 / ASTM D 92 ASTM D92 ISO  2592 / ASTM D 92
Flash point ISO  2719 / ISO  2592 / ASTM D 92 ISO  2719 / ISO  2592 / ASTM D 92 ASTM D92 ISO  2719 / ISO  2592 / ASTM D 92
Furanic compounds IEC  61198 / ASTM D 5837 ASTM D5837ASTM D5837ASTM D5837
Gassing tendency IEC  60628 / ASTM D 2300 / ASTM D6180 IEC  60628 / ASTM D 2300 / ASTM D6180 ASTM D 2300 / ASTM D6180 IEC  60628 / ASTM D 2300 / ASTM D6180
Interfacial tension ISO  6295 / ASTM D 971 ASTM D971ASTM D971ASTM D971
Kinematic viscosity ISO  3104 / ASTM D 445 ISO 3104ASTM D445ISO 3104
Kinematic viscosity at low temperatureIEC 61868---
Lightning impulse breakdownIEC 60897/ ASTM D 3300 -ASTM D3300 -
Oxidation stability IEC  61125 / IEC 62036/ ASTM D 2112 / ASTM D 2440 IEC 61125--
PCB content IEC  61619 / ASTM D 4059 -ASTM D4059-
Permittivity IEC  60247 / ASTM D 924 IEC  60247 / ASTM D 924 ASTM D924 IEC  60247 / ASTM D 924
Pour point ISO  3016 / ASTM D 97 ISO 3016ASTM D97ISO 3016
Refractive indexISO 5661ISO 5661-ISO 5661
Resistivity IEC  60247 / ASTM D 1169 IEC  60247 / ASTM D 97 ASTM D1169 IEC  60247 / ASTM D 97
Specific heatASTM D2766-ASTM D2766-
Stray gassingCIGRE brochure 296- -
Thermal conductivityASTM D2717-ASTM D2717-
Thermal Expansion coefficientASTM D1903-ASTM D1903-
Visual examinationASTM D1524-ASTM D1524-
Water content IEC  60814 / ASTM D 1533 IEC  60814 / ASTM D 1533 ASTM D1533 IEC  60814 / ASTM D 1533
ASTM, American Society for Testing and Materials; CIGRE, Council on Large Electric Systems; DGA, dissolved gas analysis; IEC, International Electrotechnical Commission; ISO, International Organization for Standardization; PCB, polychlorinated biphenyl.

