Article

Industrial Energy Consumption in Northeast China under the Revitalisation Strategy: A Decomposition and Policy Analysis

1
Northeast Institute of Geography and Agroecology, Chinese Academy of Sciences, Changchun 130102, Jilin, China
2
Department of Geography, Hong Kong Baptist University, Kowloon Tong, Hong Kong, China
3
School of Geography, The University of Melbourne, Melbourne, Victoria 3010, Australia
4
School of Geography, Shanxi Normal University, Linfen 041000, Shanxi, China
*
Author to whom correspondence should be addressed.
Energies 2016, 9(7), 549; https://doi.org/10.3390/en9070549
Submission received: 21 April 2016 / Revised: 15 June 2016 / Accepted: 7 July 2016 / Published: 18 July 2016

Abstract

:
While previous studies have examined China’s changing industrial energy consumption at the national level, this study argues that it is more useful, from a policy standpoint, to conduct a regional-level analysis owing to the significant regional disparity in industrialisation in the country. This study focuses particularly on Northeast China, where the implementation of the Northeast Revitalisation Strategy in 2003 has contributed to rapid reindustrialisation, which has a serious implication for industrial energy consumption. We decompose the region’s energy consumption changes into activity, structure, and intensity effects. Our results show that the intensity effect is not the only negative factor impacting industrial energy consumption during 2003–2012. The structure effect also has a negative impact on industrial energy consumption between 2005 and 2012. However, the negative impact of the two factors is weakening and not strong enough to counter the positive impact of the activity effect. This result highlights the problem of uncoordinated policy-making in Northeast China. The development strategy, which still depends highly on traditional heavy industries, is in conflict with the national strategy of energy conservation. The two conflicting objectives of industrial revitalization and energy conservation must be reconciled for sustainability in the long term. The study concludes with policy recommendations on how to achieve such reconciliation.

Graphical Abstract

1. Introduction

As the largest developing country undergoing rapid industrialisation, the industrial sector is the largest energy consumer in China. It accounted for 68.4% of the country’s total energy consumption in 2012 [1], which was much higher than the global average of 33% [2]. Hence, China has always focused on industrial energy conservation to achieve a low-carbon transition. During the 11th Five-Year Plan (2006–2010), China achieved a reduction of 26% in industrial energy intensity [3], defined as energy consumed for each unit of industrial output. In the 12th Five-Year Plan (2011–2015), the government aims to achieve a further reduction of 21% [3]. Despite these efforts, overall industrial energy consumption continues to increase at a rapid pace. In response, the government has begun to further strengthen control over total energy consumption, with an overarching target of capping it at 4 billion tons of Standard Coal Equivalent (SCE) by 2015 [4] and 4.8 billion tons of SCE by 2020 [5]. However, doing so poses great challenges to the economic development of some parts of China, such as the old industrial regions which depend on energy-intensive industries.
The problem of achieving a balance between industrial development and low-carbon transition is the most acute in Northeast Old Industrial Base (NOIB: Liaoning, Jilin, and Heilongjiang provinces), which was developed into China’s industrial heartland during the Maoist period. As Mao pursued a heavy industrialisation strategy, this region became a production base for coal, crude oil, pig iron, steel, automobiles, machine tools, tractors, and cement [6]. In 2012, the industrial sector accounted for 68.7% of the total energy consumption in NOIB, of which 97% was generated from fossil energy (a slight decrease from 99% in 2003), especially coal and oil [7,8,9,10,11,12]. The industrial dominance of the region, however, declined rapidly during the reform period. The region was severely affected after the central government shifted its focus to developing coastal regions and by a series of economic liberalisation reforms that bankrupted many uncompetitive state-owned enterprises [13]. From 1980 to 2004, the northeast’s percentages of gross national production and industrial production value decreased from 13.7% and 17.8% to 9.3% and 9.6%, respectively [14]. Whereas the coastal region prospered during the reform period, the northeast gradually declined into one of the largest rustbelts in China, if not in the world, characterised by a high level of unemployment, foreclosure, and economic stagnation.
In response to this situation, a regional development strategy known as the Northeast Old Industrial Base Revitalisation Strategy was implemented in 2003 by the central government with the goal of reviving the traditional industries in this region and transforming it into a new engine of economic growth. Different from strategies adopted in other rustbelts around the world, such as Lorraine in France, Kyushu in Japan, and Pittsburgh in the United States, the strategy seeks to reverse the decline by primarily upgrading existing industries rather than introducing new industries in the services sector [15]. During 2003–2012, the value added of the industrial sector grew at a rapid rate of 17.2% annually, which was higher than the national average of 15.4% [16,17]. The revitalisation of the industrial sector since 2003 has strong implication for energy consumption in the region. The annual energy consumption increased by only 1.6% during 1995–2003; however, this figure increased by 6.6% during 2003–2012 [7,8,9,10,11,12,18,19,20]. This rapid increase was sustained by increased energy imports from other regions: coal imports increased from 75.4 million tons in 2003 to 237.6 million tons in 2012, whereas oil imports increased from 36.7 million tons in 2003 to 46.5 million tons in 2012. In addition, the energy-related CO2 emission of the industrial sector rose from 464.5 million tons in 2003 to 822.8 million tons in 2009 [21]. The revitalisation of the industrial sector has become a challenge for China as it seeks to achieve energy security and transition to a low-carbon economy.
Since the industrial sector plays such a dominant role in the economic revitalization and energy conservation of NOIB, this study aims to examine the changes in industrial energy consumption and its driving factors since the implementation of the NOIB Revitalisation Strategy, so as to provide policy recommendations for a greener and more sustainable industrial revitalisation strategy. The remainder of this paper is organised as follows: Section 2 presents a literature review; Section 3 describes the research methodology including data collection and analysis; Section 4 presents the analysis results; and, finally, Section 5 concludes the study.

2. Literature Review

Since the early 1980s, many studies have attempted to quantify the relative impact of different factors on changes in energy consumption and related carbon emissions by using various kinds of decomposition models. China has been featured prominently in the discussion because of the rapid growth of energy consumption and carbon emissions. These studies can be categorised into two groups based on the scale of analysis (Table 1). Studies conducted at the national scale indicated that in the past three decades, China’s energy consumption and energy-related CO2 emissions increased rapidly with the exception of the late 1990s “sudden stagnancy” [22,23]. Despite differences in methods, timelines, and variables, the general consensus among this group of studies is that the increased CO2 emissions and energy consumption derived mainly from the growing energy demand due to the expansion of production scale, whereas the intensity effect was the major factor slowing the growth [22,23,24]. Improvements of energy efficiency in the industrial sector played the most important role in the evolution of China’s energy use [22]. Theoretically, the restructuring of the economy should be an effective way of reducing energy consumption. However, as China is still undergoing rapid industrialisation, studies have found that the structure effect only played an ambiguous or negligible role at the national scale [22,23,24,25,26,27]. As a result, changes in China’s industrial energy consumption are mostly determined by the trade-off between the positive scale effect and the negative intensity effect [24,25,26,27].
Studies conducted at the provincial scale indicated that total and per capita energy consumption have significant regional differences, with the eastern provinces much higher than their counterparts in central and western regions [28,29]. Contrasting studies conducted at the national scale, these provincial-level studies find that some driving factors, such as the intensity effect and the structure effect, exhibit consistently positive and negative effects, both spatially and temporally [28]. Furthermore, industrial energy consumption in some provinces behaves differently from the national norm. For example, some provinces in Eastern China, such as Beijng, have achieved significant progress in energy conservation by relocating their heavy industries and, therefore, the structure effect in these provinces is very significant [30]. These findings show that while studies conducted at the national scale are valuable, focusing exclusively at the country level masks regional differences. In fact, regional disparity in industrialisation is very significant in China. The structure of the economy in developed regions, such as Beijing and Shanghai, has already been transformed into the tertiary sector. In 2012, the tertiary sector accounted for 64% and 46% of total energy consumption in Beijing and Shanghai, respectively [31]. However, the industry sector remains the largest energy consumer in NOIB. Clearly, the deindustrialisation strategy pioneered by Beijing and Shanghai is difficult to be followed elsewhere in China, especially in poorer regions that depend on industrial revitalisation. The question, then, is how to reduce energy consumption in an industrialising NOIB. Answering this question would require a regional-level analysis. In this study, we conducted a regional analysis of NOIB to produce policy recommendations that are sensitive to local contexts.

3. Method

3.1. Decomposition Analysis Method

In the literature, two decomposition methods—the structural decomposition analysis (SDA) and the index decomposition analysis (IDA)—have been widely used to quantify the impact of different factors on changes in energy consumption and intensity. While many studies have conducted a comparative analysis of the two approaches, there is no consensus among them as to which of these is superior [32,33,34]. However, IDA has become more popular than SDA in analysing the drivers of energy use and energy-related emission because of the flexibility in problem formulation and data requirement [35].
In the variants of IDA approaches, including the Laspeyres index (LI) and logarithmic mean Divisia index (LMDI), three main components are usually considered: the scale of economic activities (the activity effect), the energy use per unit of activity (the intensity effect), and the economic structure (the structure effect). This study focuses on these three factors such that the results can be compared to previous studies. The total industrial energy consumption in year t(Et) can be factored as follows [35]:
E t = i E i t = i Y t × Y i t Y t × E i t Y i t = i Y t S i t I i t
where E i t refers to the energy consumption of sub-sector i in year t; Yt refers to the total output value of the industrial sector in year t; and Y i t , S i t , and I i t represent the output value, the output share and the energy intensity of sub-sector i in year t, respectively. Then, the industrial energy consumption variation ( Δ E ) from year 0 to year t can be rearranged as follows [35]:
Δ E = E t E 0 = Y e f f e c t + S e f f e c t + I e f f e c t + R e f f e c t
where Yeffect, Seffect, and Ieffect denote the effects associated with the activity effect, the structure effect, and the intensity effective, respectively. Reffect is the residual effect which accounts for unexplained variation. The contributions of Yeffect, Seffect, and Ieffect can be calculated using the following complete decomposition model [35]:
Y e f f e c t = Δ Y i S i 0 I i 0 + 1 2 Δ Y i ( Δ S i I i 0 + Δ I i S i 0 ) + 1 3 Δ Y i Δ I i Δ S i
S e f f e c t = Y 0 i Δ S i I i 0 + 1 2 i Δ S i ( Δ Y I i 0 + Δ I i Y 0 ) + 1 3 Δ Y i Δ I i Δ S i
I e f f e c t = Y 0 i Δ I i S i 0 + 1 2 i Δ I i ( Δ Y S i 0 + Δ S i Y 0 ) + 1 3 Δ Y i Δ I i Δ S i

3.2. Data Collection and Description

The raw data used in this study were mainly collected from the Statistical Yearbook of Jilin (2004–2013), Heilongjiang (2004–2013), and Liaoning provinces (2004–2013). In addition, because this source did not have some data for Liaoning province, we collected this data from the Liaoning Economic Census Yearbook (2008) and China Industry Economy Statistical Yearbooks (2010–2012). The following section provides a detailed description of the data used in this study.
(1) The economic activities for the industrial sector and subsectors are measured by gross output value of industrial enterprises that report annual sales revenue of over five million CNY. To eliminate the effects of price inflation over the study period, all value are converted to constant 2003 prices by using the ex-factory price index of industrial products released by the Statistical Yearbooks of the three provinces.
(2) The output value and energy consumption data were recorded for 39 sub-sectors during 2003–2011. However, 41 sub-sectors were included in the 2012 data. The two new sub-sectors were the mining support industry and the metal products, machinery, and equipment repair industry. We eliminated these two sub-sectors since the data for them were not recorded for 2003–2011. This elimination should not have any significant impact on our analysis, owing to minimal shares of these sub-sectors in the output value and energy consumption of the entire industrial sector.
(3) The energy types considered in this study include 17 types of fossil-fuel energy and two types of secondary energy, namely electricity and heat generated from the combustion of fossil fuels. The final consumption of various forms of energy is converted into Standard Coal Equivalent (SCE) by using conversion factors extracted from the Chinese Energy Statistical Yearbook.

4. Results

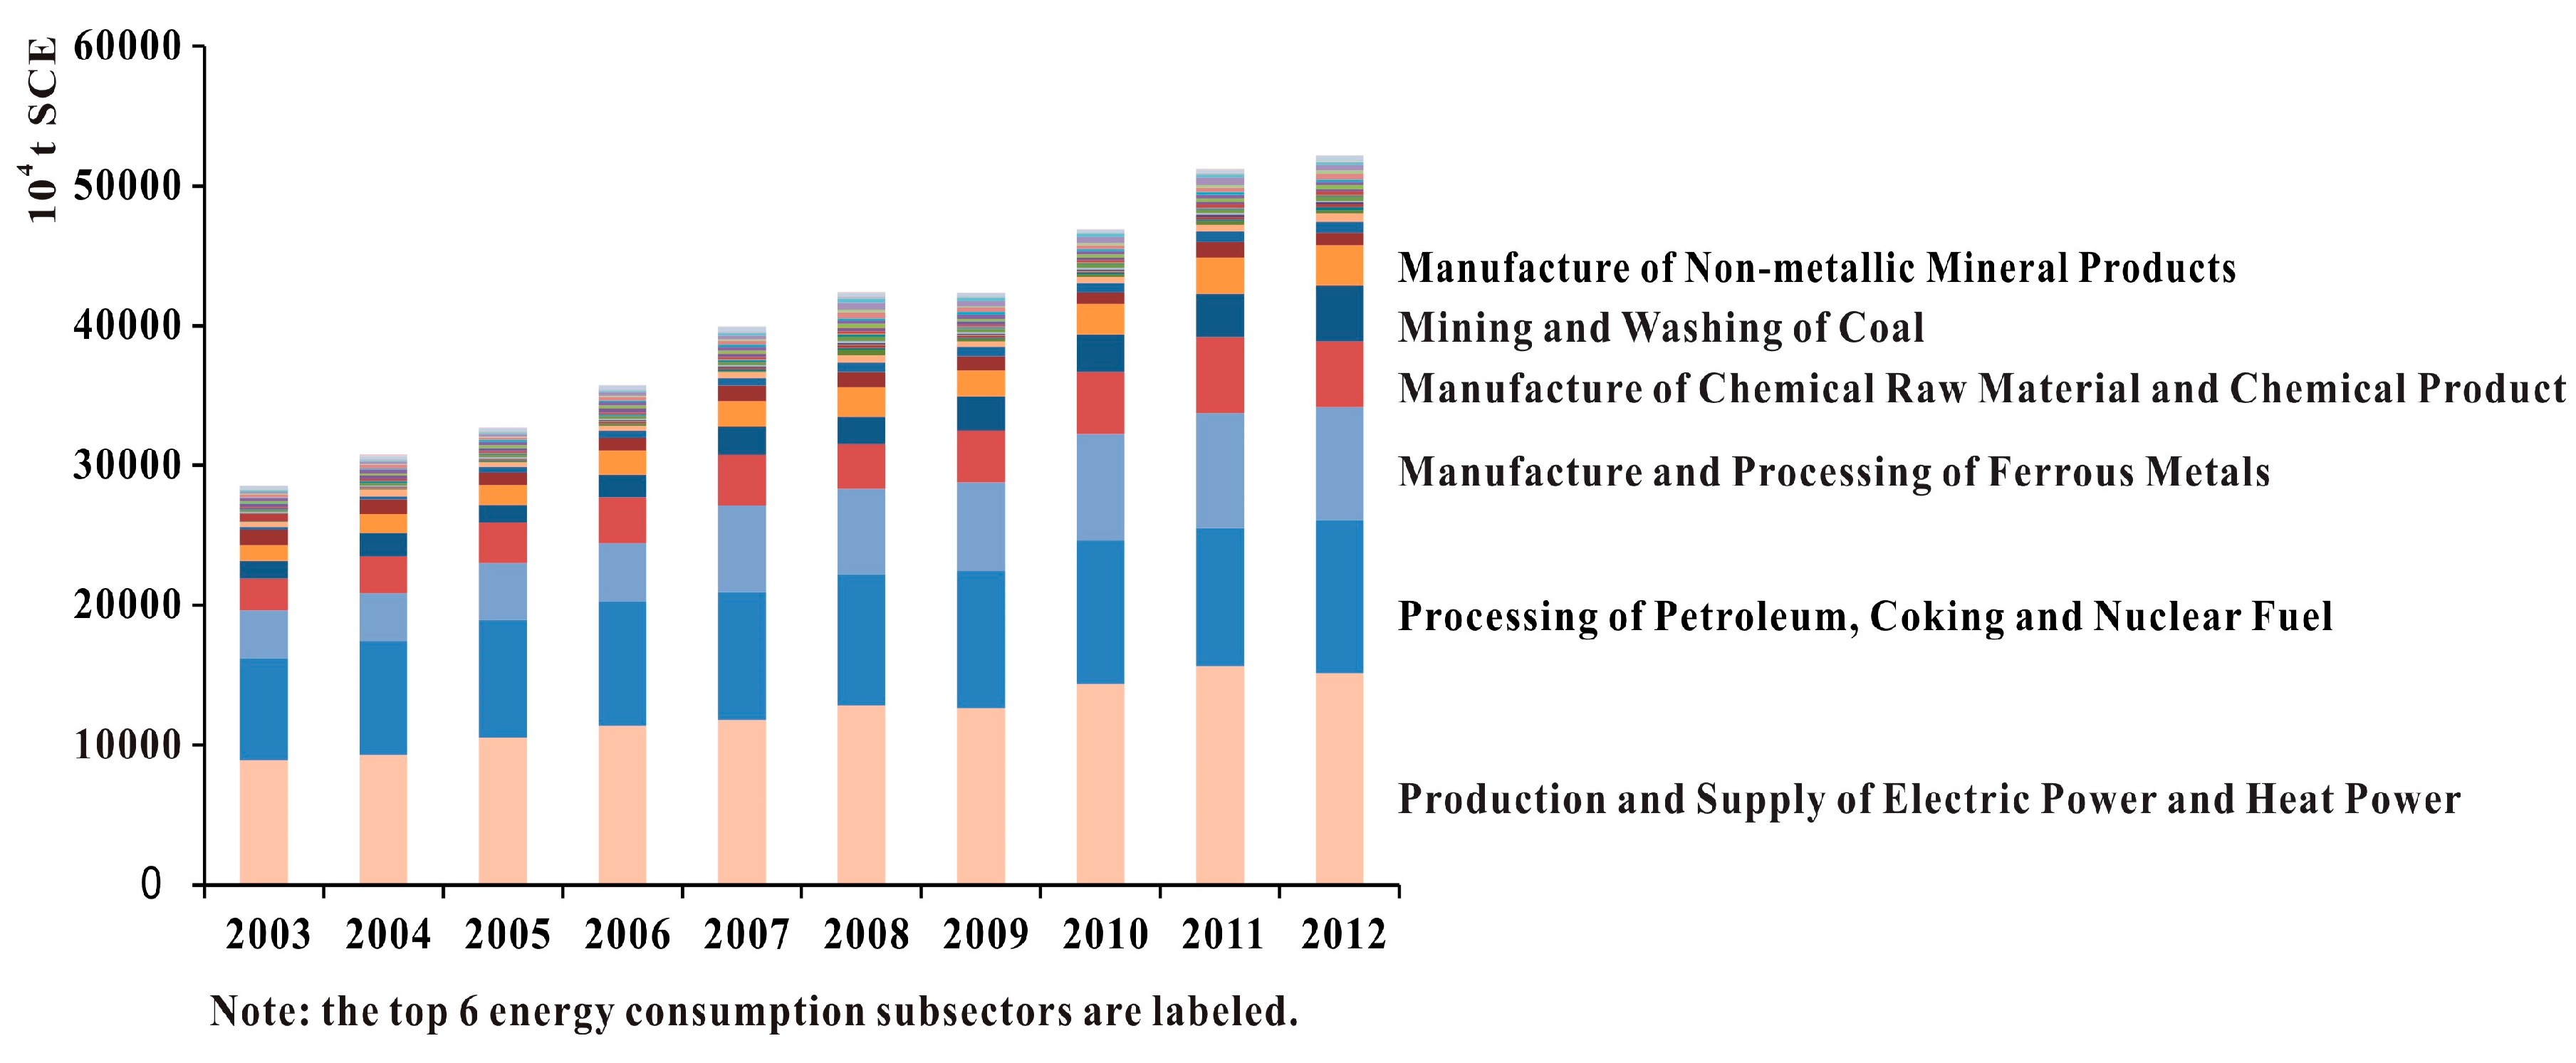
4.1. Changes of Energy Consumption

Since the implementation of the Northeast Revitalisation Strategy, energy consumption increased from 286 to 522 million tons of SCE, an increase of 236 million tons of SCE (Figure 1). As a result, industrial CO2 emissions increased by 587.4 million tons, which was 1.26 times higher than 2003 [21] (Table 2). Moreover, energy consumption differs significantly among industrial sectors, with six specific sectors showing an significantly increasing trend: (1) electricity and heating; (2) manufacture and processing of ferrous metals; (3) processing of petroleum, coke, and nuclear fuel; (4) mining and washing of coal; (5) manufacture of chemical raw materials and products; and (6) manufacture of non-metallic mineral products. Although these industries account for 91.1% of the increase in industrial energy consumption, their relative importance to the region has not increased significantly. In fact, the economic importance of the three sectors that exhibited the strongest growth in energy consumption (electricity and heating; manufacture and processing of ferrous metals; and processing of petroleum, coke, and nuclear fuel) has declined (Figure 2). In other words, energy consumption increased in the northeast in spite of, rather than because of, the relative decline in energy-intensive industries.

4.2. Impacts of Different Factors

The decomposition analysis results show that the rising energy consumption of the industrial sector during 2003–2012 is mainly driven by Yeffect (the activity effect, Table 2). The enormous growth of industrial output has increased industrial energy consumption by 762.3 million tons of SCE, which represents 323.6% of the total rising energy consumption. In addition, Seffect (the structure effect) also contributed to the upsurge of industrial energy consumption before 2005. However, after 2005, the structure effect helped in reducing industrial energy consumption. From 2005 to 2011, the structure effect contributed to 55% of the total energy savings. Further, Ieffect (the intensity effect) reduced industrial energy consumption, except during 2010–2011. The intensity effect was the largest contributor to energy conservation, but the size of the effect fluctuated substantially. Together, Seffect and Ieffect, reduced industrial energy consumption by 526.7 million tons of SCE during 2003–2012. Overall, the curbing effect of the two factors failed to offset the driving effect of rapid industrial output growth and have shown a weakening trend since 2009. Figure 3 illustrates the real change in industrial energy consumption and the trend of the change resulting from Yeffect for 2003–2012. It can be seen that the energy conservation amount from Seffect and Ieffect increased steadily from 2003 to 2009. Thereafter, however, this figure decreased sharply from 2009 to 2011. Such a trend reflects that the energy conservation results were not as satisfactory after 2009.

4.2.1. The Activity Effect

The expansion of industrial activity is, by far, the most important factor driving industrial energy consumption growth. Owing to the intensive supports from the central government sincethe revitalisation strategy, the NOIB has seen a rapid industrial revitalization for more than ten years. Investment projects and supportive polices were effective in stimulating the industrial revival of the northeast: the total value of industrial output increased from 1124 billion CNY in 2003 to 5549 billion CNY in 2012 [10,11,12,18,19,20]. The revival has been especially prominent since 2005, and the regional industrial output value increased rapidly (Figure 4). As shown in Table 2, the contribution of Yeffect on industrial energy consumption has increased dramatically since 2005.
The output value of all sub-sectors increased during this period. The 10 fastest growing industries are mostly heavy industries, which account for 69.4% of the total growth in output (Table 3). This shows that the northeast region continues to be dependent on heavy industries. Apart from these energy-intensive sectors, transportation machinery and equipment and agricultural processing enjoyed rapid growth without significantly affecting energy consumption.
After 10 years of industrial boom, the northeast region has once again slowed down recently. In 2014, the industrial value-added growth for Liaoning, Jilin, and Heilongjiang provinces were 4.8%, 6.6%, and 2.9%, respectively, which was far below the national average of 8.3%. Consequently, the central government has recently announced its intention to implement more stimulus programmes. However, given that such implementation would take time and that the domestic demand for energy-intensive products is likely to continue to decline, the increase in energy consumption associated with Yeffect is likely to slow down in the near future.

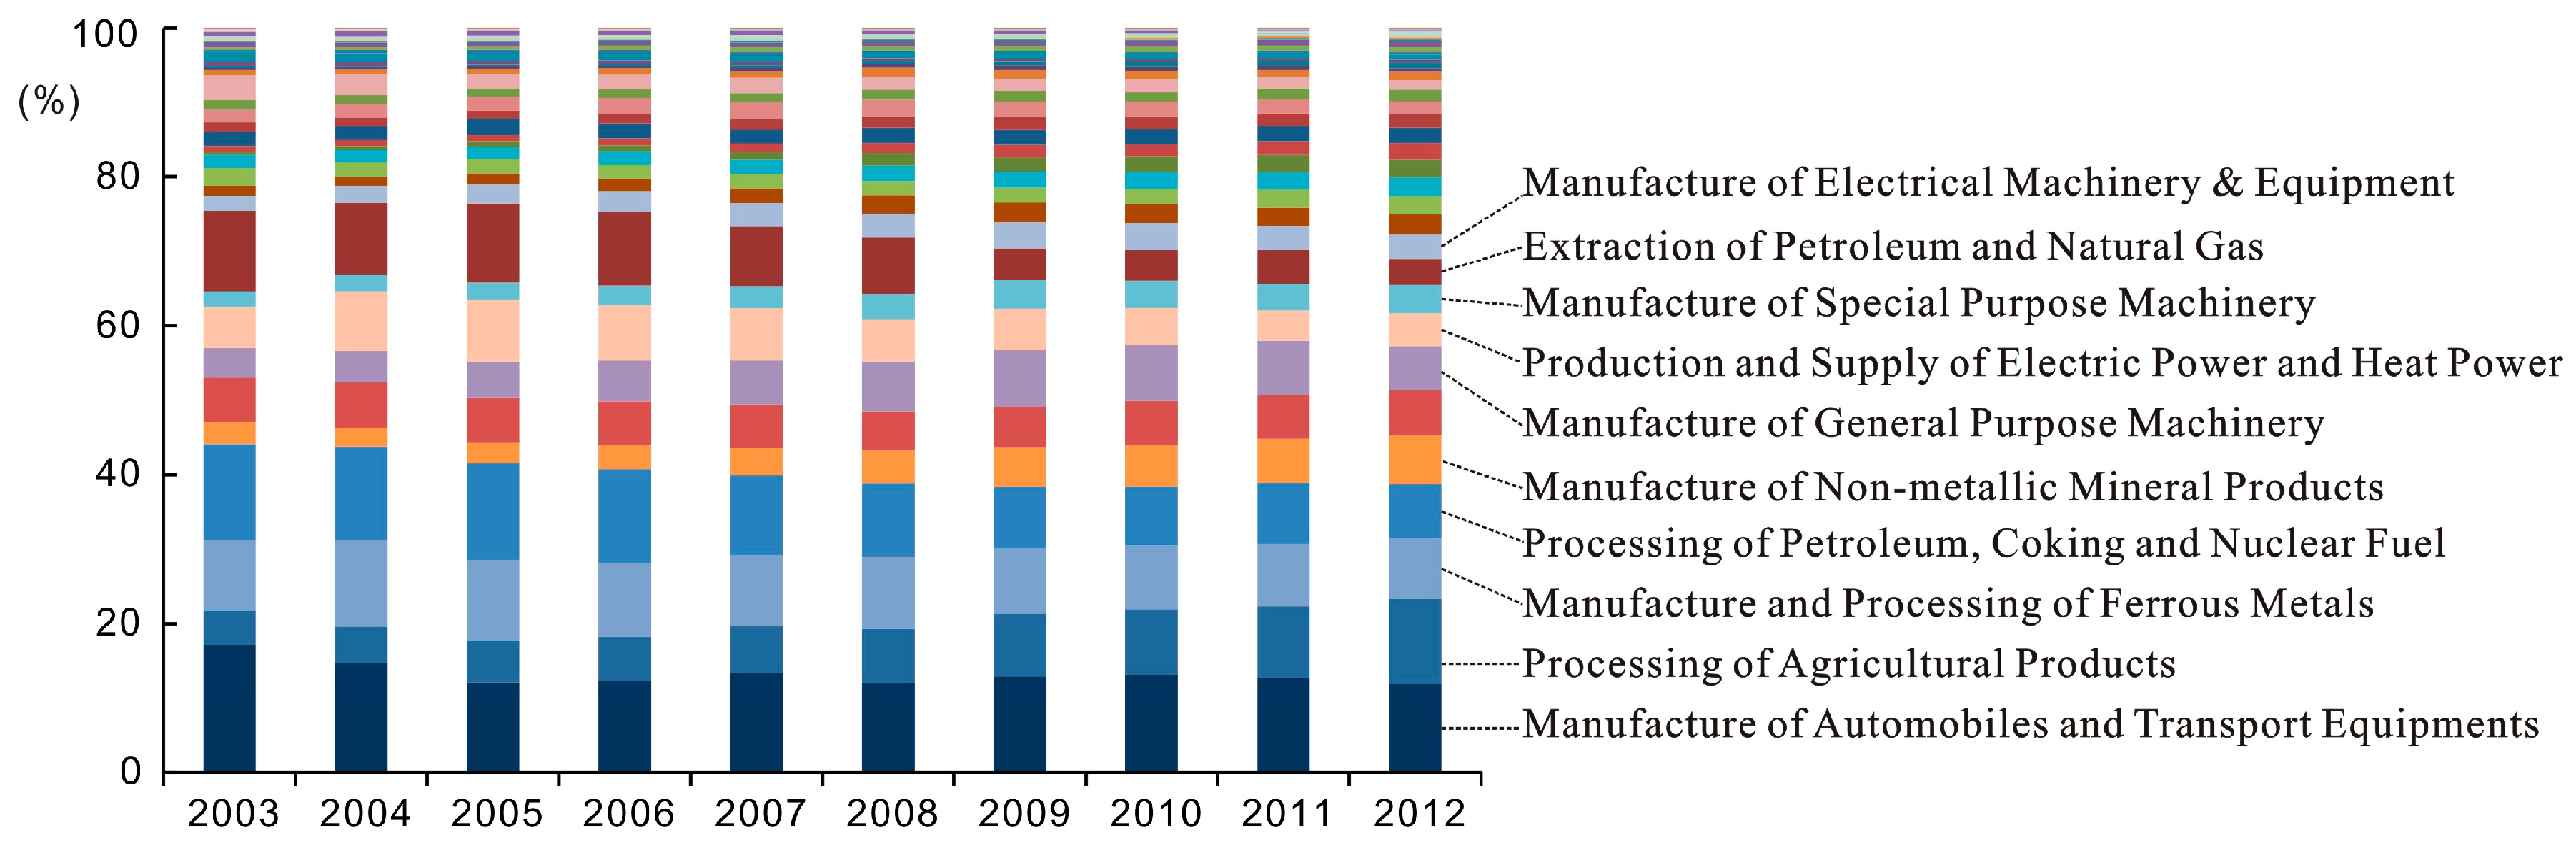
4.2.2. The Structure Effect

Since the inception of the revitalisation plan, the northeast region has experienced a limited degree of restructuring of industrial composition. The most notable change is observed in the light industries, whose share in the industrial output value increased from 18.1% in 2003 to 24.2% in 2012. During the same period, the share of heavy industries declined slightly by 6.1%, especially in the mining, energy, and raw material processing sectors, whereas that of the equipment manufacturing industry increased. As shown in Figure 5, the share of extraction of petroleum and natural gas, production, and supply of electric power and heat power, and manufacture and processing of ferrous metals decreased from 38.7% in 2003 to 23.2% in 2012. However, the share of manufacture of general purpose machinery, manufacture of special purpose machinery, manufacture of electrical machinery and equipment, and other equipment manufacturing increased from 8.1% in 2003 to 13.1% in 2012. The overall trend shows a shift in industrial structure away from the most energy-intensive industries, and this shift contributed to industrial energy conservation in the northeast. However, the shift was not prominent from 2003 to 2005, and gradually slowed down since 2009, which weakens the contribution of Seffect in reducing industrial energy consumption.
Similar to other rustbelts worldwide, the lock-in effect is a factor at play in the northeast. Under the revitalisation strategy, the central government prioritised support for equipment manufacturing, raw material production, and other traditional industries, reducing room for the emergence of new industries. As shown in Figure 5, with the exception of agricultural products processing, new industries contributed only marginally to the economy. In 2012, the northeast still had a significant share of the heavy industries sector which accounted for over 75.8% of industrial output value, which is 4% higher than the national average. Breaking through the lock-in effects to change the economic structure of the northeast has important implications for energy consumption of the region.

4.2.3. The Intensity Effect

Ieffect was the leading factor contributing to a slowdown of industrial energy consumption growth. Energy consumption per 10,000 CNY of industrial output value decreased from 2.54 tons of SCE in 2003 to 0.94 tons of SCE in 2012 (Figure 4). The most favourable results can be observed in the following energy-intensive sectors: electricity and heating, coal mining and washing, processing of petroleum, coke, and nuclear fuel, and the manufacture of chemical raw materials and products. This decline of energy intensity is closely related to the initiatives taken by the government to promote energy efficiency since the 11th Five-Year Plan (2006–2010), including the elimination of small coal-fired units, the implementation of the Thousand Enterprises Energy Conservation Programme, and the elimination of backward production capacity [36,37]. However, the decline in energy intensity has slowed down, especially post-2009 and, therefore, the impact of Ieffect on industrial energy consumption is weakening. This suggests that the industrial energy intensity improvement in NOIB is less sensitive to administrative and engineering measures as the lowest hanging fruits have been picked.
Actually, the industrial energy intensity in NOIB is still 1. times that of the national average, although it has been greatly improved since the implementation of the revitalization strategy. Currently, a large number of enterprises in NOIB, particularly the smaller and less-resourceful enterprises, lack an energy conservation specialist and have not conducted an energy audit. Due to this, these enterprises might not have sufficient information on energy conservation. Therefore, overcoming information barriers on energy conservation, especially for the smaller and less-resourceful enterprises, should receive more attention in further improvement of industrial energy intensity in NOIB.

5. Conclusions and Discussion

This study examined the changes in industrial energy consumption in Northeast China over the 2003–2012 period. We decomposed the industrial energy consumption changes into the activity effect, structure effect, and intensity effects. Our results indicate that the northeast region has almost doubled its industrial energy consumption due to the rapid expansion of industrial activity, and that the cumulative intensity effect is stronger than the structure effect in conserving energy. This finding is similar to studies conducted at the national level [25,26,27]. This similarity suggests that the improvement in energy efficiency has been the main driving force of energy conservation at both the national and regional levels. However, our analysis also shows that the intensity effect is not the only reason for energy conservation in industrial sector of Northeast China. In fact, the structure effect has a stronger impact than the intensity effect on industrial energy consumption from 2005–2011. This finding is different from previous observations at the national level, which found that the structure effect either has a positive [25] or ambiguous [26,27] impact on industrial energy consumption. Therefore, a shift in industrial composition has begun to make a contribution on energy conservation at the regional, but not the national, level. However, the negative impact of the two factors is weakening and not strong enough to counter the positive impact of the activity effect on such consumption.
From a policy perspective, this paper highlights the problem of uncoordinated policy-making at the regional level: the development strategy still depends highly on traditional heavy industries in the northeast, which is in conflict with to the goal of energy conservation. These two conflicting objectives, industrial revitalisation and energy conservation, must be reconciled. As a developing economy, the northeast cannot rely on deindustrialisation to achieve low-carbon development. On the other hand, the economic revival of the northeast should not be achieved at the cost of the fast-growing energy consumption and CO2 emission. The bottom line is that the strategy to revitalise traditional heavy industries has become increasingly ineffective. The overall picture suggests that China’s national economic structure is changing and, consequently, the demand for heavy industries, such as cement and steel, would decrease. Continuing the existing revitalisation strategy would eventually lead to overcapacity and overproduction. Therefore, in addition to improving energy efficiency, it is vital for the northeast to adapt its revitalisation strategy towards the development of new technologically-driven industries to achieve a low-carbon transition in the industry sector.
This study suggests certain policy measures to help achieve these objectives. First, strict control should be imposed on the expansion of energy-intensive industries. Currently, the top six energy-consuming industries in Northeast China consume 87.8% of total industrial energy consumption; however, they only account for 34.4% of the total industrial output value. Therefore, to achieve low energy intensity and high production efficiency, the first step has to start from the energy-intensive industries. This can be achieved through administrative means, such as forced closure and investment restriction, or through economic measures, such as imposing higher electricity tariffs.
Second, foster the development of new technologically driven industries. To achieve a low-carbon industrial transition of Northeast China, more fiscal and regulatory supports from the central government should be provided to foster the development of new technologically-driven industries, such as processing of agricultural products, manufacture of equipment, etc., as these industries consume less energy and generate more output value.
Third, the energy efficiency of existing industries should be improved. This is particularly important in the case of small enterprises thus far neglected by the government in its energy conservation efforts [38]. In addition to administrative measures and financial support, we recommend providing small enterprises with more support to overcome information barriers, such as a free or subsidized energy audit. In addition, the government could consider imposing a tax on coal consumption to reflect externality costs. Currently, most industries in the northeast use coal and the imposition of this tax would force industries to become more energy efficient and switch to cleaner fuels, such as natural gas and renewable energy.
Fourth, the application of non-fossil energy should be promoted to control the fast growth of CO2 emission. Up to now, the proportion of non-fossil energy in total industrial energy consumption of Jilin, Liaoning, and Heilongjiang is still very low, which is expected to reach 9.8% [39], 4.5% [40], and 3.8% [41], respectively, by 2015 (the national average was 9.8% in 2013 and is required to rise to 15% by 2020 [5]). Actually, Northeast China has abundant renewable and clean energy, such as wind power, water power, geo-thermal energy, and nuclear power. However, there are many constraints on the effective utilization of the non-fossil energy. For example, Northeast China is a key area of wind farm development. However, because of a weak grid structure and a power structure dominated by coal-fired power plants, a significant amount of electricity is lost to curtailment [42].

Acknowledgments

This work was supported by National Natural Science Foundation of China (No. 41001097 and 41571152) and China Scholarship Council.

Author Contributions

He Li conceived and designed the basic frame. He Li and Kevin Lo carried out the main body of research and analyzed data with guidance from Mark Wang, Pingyu Zhang and Longyi Xue. He Li wrote the paper, Kevin Lo, Mark Wang, Pingyu Zhang and Longyi Xue reviewed the work and improved the paper continuously.

Conflicts of Interest

The authors declare no conflict of interest.

References

  1. National Bureau of Statistics. China Energy Statistical Yearbook 2013; China Statistics Press: Beijing, China, 2013.
  2. Trudeau, N.; Tam, C.; Graczyk, D.; Taylor, P. Energy transition for industry: India and the global context. In IEA Energy Papers; No. 2011/02; Organisation of Economic Co-operation and Development (OECD) Publishing: Paris, France, 2011. [Google Scholar]
  3. Ministry of Industry and Information Technology of China. The “12th Five-Year” Plan for Industrial Energy Saving of China. 2012. Available online: http://www.bjeit.gov.cn/zwgk/zcfg/gjflfggfxwj/83820.htm (accessed on 20 March 2016). [Google Scholar]
  4. The State Council of China. The “12th Five-Year” Plan for Energy Consumption of China. 2013. Available online: http://www.gov.cn/zwgk/2013-01/23/content_2318554.htm (accessed on 20 March 2016). [Google Scholar]
  5. General Office of the State Council of China. Strategic Plan for Energy Consumption of China: 2014–2020. 2014. Available online: http://www.gov.cn/zhengce/content/2014-11/19/content_9222.htm (accessed on 20 March 2016). [Google Scholar]
  6. Zhang, P. Revitalizing old industrial base of Northeast China: Process, policy and challenge. Chin. Geogr. Sci. 2008, 18, 109–118. [Google Scholar] [CrossRef]
  7. Statistical Bureau of Jilin Province. Statistical Yearbook of Jilin Province 1996; China Statistics Press: Beijing, China, 1996.
  8. Statistical Bureau of Liaoning Province. Statistical Yearbook of Liaoning Province 1996; China Statistics Press: Beijing, China, 1996.
  9. Statistical Bureau of Heilongjiang Province. Statistical Yearbook of Heilongjiang Province 1996; China Statistics Press: Beijing, China, 1996.
  10. Statistical Bureau of Jilin Province. Statistical Yearbook of Jilin Province 2013; China Statistics Press: Beijing, China, 2013.
  11. Statistical Bureau of Liaoning Province. Statistical Yearbook of Liaoning Province 2013; China Statistics Press: Beijing, China, 2013.
  12. Statistical Bureau of Heilongjiang Province. Statistical Yearbook of Heilongjiang Province 2013; China Statistics Press: Beijing, China, 2013.
  13. Li, H.; Lo, K.; Wang, M. Economic transformation of mining cities in transition economies: Lessons from Daqing, Northeast China. Int. Dev. Plan. Rev. 2015, 37, 311–328. [Google Scholar] [CrossRef]
  14. Wang, L.; Wei, H. Strategy and Policy of Economic Regeneration in Northeast China; Social Sciences Academic Press: Beijing, China, 2005. [Google Scholar]
  15. Wang, M.; Cheng, Z.; Zhang, P.; Tong, L.; Ma, Y. Old Industrial Cities Seeking New Road of Reindustrialisation: Models of Revitalising Northeast China; World Scientific Publishing: Singapore, 2013. [Google Scholar]
  16. National Bureau of Statistics of China. China Statistical Yearbook 2004; China Statistics Press: Beijing, China, 2004.
  17. National Bureau of Statistics of China. China Statistical Yearbook 2013; China Statistics Press: Beijing, China, 2013.
  18. Statistical Bureau of Jilin Province. Statistical Yearbook of Jilin Province 2004; China Statistics Press: Beijing, China, 2004.
  19. Statistical Bureau of Liaoning Province. Statistical Yearbook of Liaoning Province 2004; China Statistics Press: Beijing, China, 2004.
  20. Statistical Bureau of Heilongjiang Province. Statistical Yearbook of Heilongjiang Province 2004; China Statistics Press: Beijing, China, 2004.
  21. Li, H. Evolution and Decomposition Analysis of Industrial CO2 Emissions in Northeast China: 1995–2009. Resour. Sci. 2012, 34, 309–315. [Google Scholar]
  22. Wu, L.; Kaneko, S.; Matsuoka, S. Driving forces behind the stagnancy of China’s energy-related CO2 emissions from 1996 to 1999: The relative importance of structural change, intensity change and scale change. Energy Policy 2005, 33, 319–335. [Google Scholar] [CrossRef]
  23. Wu, L.; Kaneko, S.; Matsuoka, S. Dynamics of energy-related CO2 emissions in China during 1980 to 2002: The relative importance of energy supply-side and demand-side effects. Energy Policy 2006, 34, 3549–3572. [Google Scholar] [CrossRef]
  24. Yuan, R.; Zhao, T. Changes in CO2 emissions from China’s energy-intensive industries: A subsystem input–output decomposition analysis. J. Clean. Prod. 2016, 117, 98–109. [Google Scholar] [CrossRef]
  25. Zhao, X.; Ma, C.; Hong, D. Why did China’s energy intensity increase during 1998–2006: Decomposition and policy analysis. Energy Policy 2010, 38, 1379–1388. [Google Scholar] [CrossRef]
  26. Ke, J.; Price, L.; Ohshita, S.; Fridley, D.; Khanna, N.; Zhou, N.; Levine, M.D. China’s industrial energy consumption trends and impacts of the Top-1000 Enterprises Energy-Saving Program and the Ten Key Energy-Saving Projects. Energy Policy 2012, 50, 562–569. [Google Scholar] [CrossRef]
  27. Liu, N.; Ma, Z.; Kang, J. Changes in carbon intensity in China’s industrial sector: Decomposition and attribution analysis. Energy Policy 2015, 87, 28–38. [Google Scholar] [CrossRef]
  28. Chen, L.; Yang, Z. A spatio-temporal decomposition analysis of energy-related CO2 emission growth in China. J. Clean. Prod. 2015, 103, 49–60. [Google Scholar] [CrossRef]
  29. Wang, S.; Li, G.; Feng, K. CO2, economic growth, and energy consumption in China’s provinces: Investigating the spatiotemporal and econometric characteristics of China’s CO2 emissions. Ecol. Indic. 2016, 69, 184–195. [Google Scholar] [CrossRef]
  30. Li, A.; Hu, M.; Wang, M.; Cao, Y. Energy consumption and CO2 emissions in Eastern and Central China: A temporal and a cross-regional decomposition analysis. Technol. Forecast. Soc. Chang. 2016, 103, 284–297. [Google Scholar] [CrossRef]
  31. Zhang, W.; Li, K.; Zhou, D.; Zhang, W.; Gao, H. Decomposition of intensity of energy-related CO2 emission in Chinese provinces using the LMDI method. Energy Policy 2016, 92, 369–381. [Google Scholar] [CrossRef]
  32. Ang, B.W. Decomposition analysis for policymaking in energy: which is the preferred method? Energy Policy 2004, 32, 1131–1139. [Google Scholar] [CrossRef]
  33. Hoekstra, R.; van Den Bergh, J.C. Comparing structural decomposition analysis and index. Energy Econ. 2003, 25, 39–64. [Google Scholar] [CrossRef]
  34. Su, B.; Ang, B. Structural decomposition analysis applied to energy and emissions: Some methodological developments. Energy Econ. 2012, 34, 177–188. [Google Scholar] [CrossRef]
  35. Sun, J.W. Changes in energy consumption and energy intensity: A complete decomposition model. Energy Econ. 1998, 20, 85–100. [Google Scholar] [CrossRef]
  36. Lo, K. A critical review of China’s rapidly developing renewable energy and energy efficiency policies. Renew. Sustain. Energy Rev. 2014, 29, 508–516. [Google Scholar] [CrossRef]
  37. Lo, K.; Li, H.; Wang, M. Energy conservation in China’s energy-intensive enterprises: An empirical study of the Ten-Thousand Enterprises Program. Energy Sustain. Dev. 2015, 27, 105–111. [Google Scholar] [CrossRef]
  38. Kostka, G.; Moslener, U.; Andreas, J. Barriers to increasing energy efficiency: Evidence from small-and medium-sized enterprises in China. J. Clean. Prod. 2013, 57, 59–68. [Google Scholar] [CrossRef]
  39. Government of Jilin Province. The “12th Five-Year” Plan for Economic and Social Development in Jilin Province. 2011. Available online: http://www.jl.gov.cn/zjjl/fzgh_47966/201502/t20150205_1933899.html#e (accessed on 20 March 2016). [Google Scholar]
  40. Government of Liaoning Province. The “12th Five-Year”Plan for Economic and Social Development in Liaoning Province. 2011. Available online: http://www.ln.gov.cn/zfxx/fzgh/ztgh/201110/t20111009_723938.html (accessed on 20 March 2016). [Google Scholar]
  41. Government of Heilongjiang Province. The Implementation Plan for Energy Saving and Emission Reduction in Heilongjiang Province 2014–2015. 2014. Available online: http://www.hlj.gov.cn/wjfg/system/2014/12/12/010698047.shtml (accessed on 20 March 2016). [Google Scholar]
  42. Zhao, X.; Zhang, S.; Yang, R.; Wang, M. Constraints on the effective utilization of wind power in China: An illustration from the northeast China grid. Renew. Sustain. Energy Rev. 2012, 16, 4508–4514. [Google Scholar] [CrossRef]
Figure 1. The industrial energy consumption of NOIB by subsector, 2003–2012.
Energies 09 00549 g001
Figure 2. The output value share of top six energy-consuming subsectors in 2003–2012.
Energies 09 00549 g002
Figure 3. Real change and trend of change in industrial energy consumption 2003–2012.
Energies 09 00549 g003
Figure 4. The output value and energy intensity of industrial sector 2003–2012.
Energies 09 00549 g004
Figure 5. The structural shrift of industrial sector 2003–2012. Note: The subsectors with significant proportion change are labelled.
Energies 09 00549 g005
Table 1. Summary of drivers on energy consumption and carbon emission of China’s economic sectors.
ScaleRef.MethodFactorsConclusion
National scale[22]Three-level perfect decompositionintensity effect, structure effect, sectoral-specific activity intensity effect, sectoral-specific activity size effectEnergy-related CO2 emissions in China in 1985–1999 were driven by a trade-off between the positive sectoral-specific scale effects and the negative energy intensity effects. Structural change accounted for only a small portion.
[23]Overall energy system model23 factors on energy demand side and energy supply sideIncrease in C-TPES before 1996 were mainly driven by changes on the energy demand side, declined C-TPES in 1996–2000 attributed to the acceleration of efficiency improvements in end-use and transformation sectors.
[24]Subsystem input–output decomposition analysisemissions intensity effect, the technological effect and the demand effect The technological effect was the main contributor to decrease the CO2 emissions in energy-intensive industries during 2005–2010. The emissions intensities had positive effects on reducing the CO2 emissions in energy-intensive industries. The increased CO2 emissions mainly derived from the demand effect.
[25]LMDI methodoutput effect, structural effect, intensity effectIndustrial energy savings over 1998-2006 were mainly the results of efficiency improvement, whereas the expansion of production scale and the shift towards a heavier industrial structure contributed to an increase in overall energy consumption.
[26]LMDI methodactivity effect, intensity effect, structural effectThe production effect was the dominant cause of the rapid growth in industrial energy consumption from 1996 to 2010, the intensity effect was the major factors slowing the growth of industrial energy consumption, while the cumulative structure effect was negligible.
[27]LMDI methodemission coefficient effect, energy intensity effect, and structure effectThe energy intensity effect was the dominant factor in reducing carbon intensity of industrial sector in 1996–2012, the structure effect did not show a strong impact on carbon intensity, the emission coefficient effect gradually increased the carbon intensity.
Provincial scale[28]Three-level perfect decompositionintensity effect, structure effect, sectoral-specific activity intensity effect, sectoral-specific activity size effectEnergy intensity of production sector was the dominant negative driving factor from 1995 to 2011, the changes of economic structure in most of the provinces favored the growth of CO2 emissions, but the contribution value was not obvious.
[29]Econometric modelseconomic growthA long-run, bidirectional, positive relationship exists between economic growth, energy consumption, and CO2 emissions during 1995–2012.
[30]LMDI methodeconomic structure effects, energy efficiency effects, energy structure effects and CO2 emission coefficient effectsIn 1990–2010, energy efficiency effects remained the primary driving force to the downward trend of CO2 emissions per unit of GDP by region, economic structure effects contributed more and more to increase the levels of CO2 emissions per unit of GDP in most studied regions.
[31]LMDI methodcarbon emission density and energy consumption intensityDue to the rapid development of the heavy industrial sectors, Carbon emission intensity (CI) did not decrease in 2003–2005, Energy intensity (EI) is the more significant driver for decrease of CI in 1995–2012.The most contribution of EI's decrease came from secondary industries.
Table 2. Impact of different factors on the changes of industrial energy consumption in NOIB, 2003–2012.
YearYeffectSeffect IeffectActual Change (104t SCE)Change of CO2 Emission (104 t)
Contribution Value (104t CE)Contribution Rate (%)Contribution Value (104t CE)Contribution Rate (%)Contribution Value (104t CE)Contribution Rate (%)
2003–20046178.6277.23598.5161.4−7548.0−338.62229.15557.1
2004–20054962.3256.4743.238.4−3769.8−194.71935.74825.7
2005–20066642.0220.1−1700.6−56.3−1923.1−63.73018.37524.6
2006–20077631.0180.6−2202.8−52.1−1203.0−28.54225.310,533.7
2007–20087537.9307.7−2918.7−119.2−2169.8−88.62449.36106.1
2008–20097709.835,416.6−2296.0−10,546.9−5392.1−24,969.721.854.3
2009–20108026.9177.6−1846.0−40.9−1662.2−36.84518.611,264.9
2010–20115359.1125.1−2450.1−57.21376.232.14285.310,683.3
2011–20129819.31013.5−95.5−9.9−8755.0−903.7968.82415.2
2003–201276,233.8323.6−8973.7−38.1−43,699.5−185.523,560.658,736.6
Note: CO2 emission is estimated based on the carbon emission coefficients issued by the Ministry of Environmental Protection of China.
Table 3. Top 10 fastest growing industries during 2003–2012.
Industrial Sector/SubsectorsOutput Value (Billion Yuan)Increase of Output Value (Billion Yuan)
20032012
Industrial sector1124.95549.14424.2
Processing of agricultural products51.9639.8587.9
Manufacture of automobiles and transport equipment192.9656.7463.8
Manufacture and processing of ferrous metals105.7444.9339.2
Manufacture of non-metallic mineral products32.8362.8330.0
Manufacture of general purpose machinery44.6329.8285.2
Manufacture of chemical raw material and chemical products67.0336.6269.6
Processing of petroleum, coking and nuclear fuel146.0406.9260.9
Manufacture of special purpose machinery23.3214.1190.8
Production and supply of electric power and heat power62.3246.2183.9
Manufacture of electrical machinery & equipment23.7180.6156.9
Proportion (%)66.768.869.4
Note: Output value in 2003 constant price.

