
Organic Carbon Stock in Mineral Soils in Cropland and Grassland in Latvia
by
 , and
, and
Guna Petaja
*,
Ieva Ivbule
,
Zaiga Anna Zvaigzne
,
Dana Purviņa
,
Emīls Mārtiņš Upenieks
,
Ieva Līcīte
and
Andis Lazdiņš
Latvian State Forest Research Institute ‘Silava’, Riga Street 111, LV-2169 Salaspils, Latvia
*
Author to whom correspondence should be addressed.
Environments 2024, 11(4), 73; https://doi.org/10.3390/environments11040073
Submission received: 12 February 2024
/
Revised: 23 March 2024
/
Accepted: 29 March 2024
/
Published: 3 April 2024
(This article belongs to the Special Issue Soil Organic Carbon Assessment, 2nd Edition)
Abstract
:This study aimed to assess soil organic carbon (SOC) concentration and stock in mineral soils in cropland and grassland in Latvia, considering soil groups and texture classes. It covered 197 sites across Latvia (152 in cropland, 45 in grassland). Soil profile description and sampling (at depths of 0–10 cm, 10–20 cm, and 20–40 cm) were conducted between 2021 and 2023. Laboratory analyses included soil bulk density (SBD), total carbon (TC), total nitrogen (TN), carbonate content, pH, and extractable phosphorus (P), potassium (K), calcium (Ca), and magnesium (Mg). SOC stock was calculated, and correlations with other soil parameters were determined. In cropland sites, Arenosols and Stagnosols had the lowest SOC concentration and stock, while Gleysols and Phaeozems had the highest. In grassland sites, Retisols exhibited the lowest SOC concentration in the 0–20 cm layer, while Planosols had the highest SOC concentration in this layer. Conversely, in the 20–40 cm layer, Retisols showed the highest SOC concentration, while Gleysols had the lowest concentration. Regarding SOC stock in grassland sites, Planosols exhibited the highest values, while the lowest values were observed for Retisols and Umbrisols. Contrary to our hypothesis that grassland exhibits higher SOC stock than cropland, our results show the reverse for Phaeozems, the dominant WRB soil group in this study: a higher average SOC concentration and stock in cropland compared to grassland. However, very low occurrence of some soil groups and lack of some soil groups for grassland sites hinders the correct interpretation of these results, and further investigations are required in future studies.
1. Introduction
The significance of soils in the global carbon (C) cycle and the acknowledgement of the necessity to mitigate greenhouse gas (GHG) emissions from agriculture have been steadily growing [1]. Worldwide, soils contain around 2135 Gt of organic C within the top meter, making them the primary terrestrial repository of this essential element [2]. Nevertheless, factors like land use and management practices, combined with increasing temperatures attributed to climate change, have the potential to prompt a shift in soils from being C stores to emerging as notable sources of atmospheric carbon dioxide (CO2) [3,4,5]. Minor alterations in soil organic carbon (SOC) stock can have a substantial impact on atmospheric C concentration, with a ratio of 1 Pg of soil C corresponding to 0.47 ppm of atmospheric CO2 [6]. Evidence from diverse long-term soil-monitoring initiatives and field experiments conducted across Europe indicates a decline in SOC content in numerous agricultural soils [7,8,9,10]. Nonetheless, there is a consensus that SOC losses can be reversed, and C accumulation can be enhanced through specific agricultural practices. Such practices have the potential to contribute to improved soil fertility and enhanced delivery of ecosystem services [11,12]. Currently, 11% of Europe’s overall GHG emissions originate from agriculture [13]. Urgent actions are needed to implement measures that reduce and offset these emissions to meet climate change mitigation targets. In this particular context, the European Commission is enhancing the role of the land use, land use change, and forestry (LULUCF) sector to support the European Union’s (EU) heightened climate goals. It acknowledges the imperative to reverse the current decline in C stocks [14]. The EU Soil Strategy 2030, titled ‘Reaping the benefits of healthy soils for people, food, nature, and climate’, recognizes that implementing targeted and consistent sustainable soil management practices can contribute to achieving climate neutrality. Ensuring the health of agricultural soils by augmenting the SOC stored in them is vital for reaching climate goals [1,15].
Although soils also contain a noteworthy amount of inorganic C, this study concentrates on SOC due to its purported substantial potential in climate change mitigation and its positive influence on diverse soil functions [16,17]. SOC is a mixture of carbonaceous compounds, encompassing the remnants of plant and animal residues, living microbial biomass, byproducts of microbial processes, and organo-mineral complexes [12]. It is one of the quantifiable components of soil organic matter (SOM), which remains in the soil after materials of living organisms undergo partial decomposition. SOC serves as a regulator for crucial ecosystem services, including nutrient provisioning, water-holding capacity, soil drainage, soil stability, and the modulation of GHG emissions, which can either mitigate or accelerate climate change [18,19]. The amount of total organic carbon (TOC) stored in the soil is determined by the balance between inputs, such as litterfall and rhizodeposition, and losses, primarily resulting from the microbial decomposition of SOM. Additionally, SOM vary between different types of soils. When considering WRB major soil groups, Phaeozems, along with Chernozems, Kastanozems and Umbrisols are characterized by pronounced accumulation of organic matter in the mineral topsoil. Phaozems, in particular, typically contain approximately 5% of SOM, making them well suitable for agriculture [20]. Umbrisols have moderate-to-high amounts of organic matter [21].
Prior research suggests that SOC stock is influenced by various interacting factors, including land use, management practices, and soil groups. The soil assessment module within the LUCAS (Land Use and Cover Area Frame Survey) program encompasses SOC stocks of different land uses across Europe; however, soil groups are not distinguished in this study. Other studies show that SOC stocks exhibit significant variations across different soils [22,23,24]. Also, studies previously carried out in the Baltic states showed that SOC concentration and stock vary across WRB soil groups and land uses [25,26,27]. Several studies suggest a significant depletion of SOC in the majority of cropland soils, while grasslands tend to have higher SOC contents than croplands [28,29]. Grasslands contribute more plant-derived C inputs, particularly belowground, owing to increased rates of root turnover and consistent soil coverage [30,31]. The persistent soil cover and the lack of disruption from tillage restrict soil C outputs by minimizing soil erosion and enhancing physical protection [32]. Soil aeration holds significant importance due to its close association with both organic matter input and the rate of organic matter decomposition. Tillage practices in cropland systems often lead to increased soil aeration due to mechanical disturbance, leading to the depletion of soil organic matter through oxidation [33]. However, there are studies indicating that enhanced soil aeration results in increased SOC content due to enhanced root growth. There’s a certain level of aeration that should not be exceeded [33,34]. Grasslands typically experience less disruption from tillage, preserving soil structure and reducing soil aeration. This limited soil aeration in grasslands helps to retain organic matter by slowing down decomposition rates, contributing to the higher SOC contents observed in grassland soils compared to certain cropland soils [35]. Other studies, though, indicate that adopting reduced tillage practices may not necessarily result in an increase in SOC stocks. Instead, it is likely to cause a redistribution of SOC [36,37]. A recent European study indicated that reduced tillage increased SOC stock in the topsoil (0–10/15 cm) and the deepest soil layer measured (70–100 cm), but decreased it in the intermediate soil layers [38]. While several studies suggest that grassland has a higher SOC stock compared to cropland, depending on management practices, SOC stock in cropland can be relatively high and even exceed that in grassland [39,40,41]. Incorporating cover crops into crop rotations has been suggested as a promising strategy to enhance SOC stocks in cropland, primarily through the introduction of additional C inputs from plant residues into the soil [42,43].
Previous investigations have also demonstrated an association between soil texture and SOC content. Clayey soils, characterized by finer textures and electrically charged surfaces, have a higher capacity for SOM attachment, promoting aggregation and trapping particulate SOM within microaggregates. This extends the residence time of SOM and increases SOC content [44,45]. In contrast, sandy soils, with limited adhesion and cohesion, facilitate faster OM decomposition due to larger particles and slower aggregation, leading to accelerated SOC turnover [44,46]. Clayey soils benefit from protection by the clay- and silt-sized fraction, enhancing stability. Soil aggregation fosters the stabilization of SOC by establishing physical barriers between decomposers and SOM. However, if there is an optimal level of aggregation, C sequestration might not escalate even with an increase in C input to the soil [41]. Additionally, the sensitivity to site variables, such as climate and topography, is influenced by the size and protective mechanisms of soil aggregates [47]. Long-term agricultural management studies consistently highlight heightened SOC accumulation in the clay fraction, where a greater proportion of SOM becomes bound to fine mineral particles, decelerating its decomposition [48,49]. Short-term litter decomposition studies reinforce the role of soil texture, showing a decline in SOC decomposition rates with increased clay content [50]. Therefore, the percentage of clay content emerges as a reliable predictor of SOC dynamics [51].
The objective of the study was to assess SOC concentration and stocks in mineral soils, both in cropland and grassland, in Latvia, depending on the WRB international soil classification system and soil texture class. Additionally, the study aimed to explore the relationships between SOC and other soil chemical properties—soil total nitrogen (TN), extractable content of potassium (K), calcium (Ca), magnesium (Mg) and phosphorus (P) concentrations, as well as soil pH (H+ concentration). Based on the results of previous studies in Lithuania and Latvia, as well as studies outside the Baltic states, we hypothesized that SOC is significantly higher in grassland, compared to cropland.
The assessment of C sequestration potential for specific measures, along with their potential environmental and socio-economic impacts, faces limitations due to pronounced regional variations. These differences stem from distinct soil types and climate conditions in various regions. Consequently, comparing total SOC stocks between different countries is rarely feasible, and the precise evaluation of national SOC stock change factors becomes essential. The findings of the study will aid in mitigating climate change, in accordance with both international and European goals and reporting requirements. The updated national soil data will enrich climate-related data for incorporation into policies, bolstering proficiency in sustainable soil management practices.
2. Materials and Methods
2.1. Study Sites
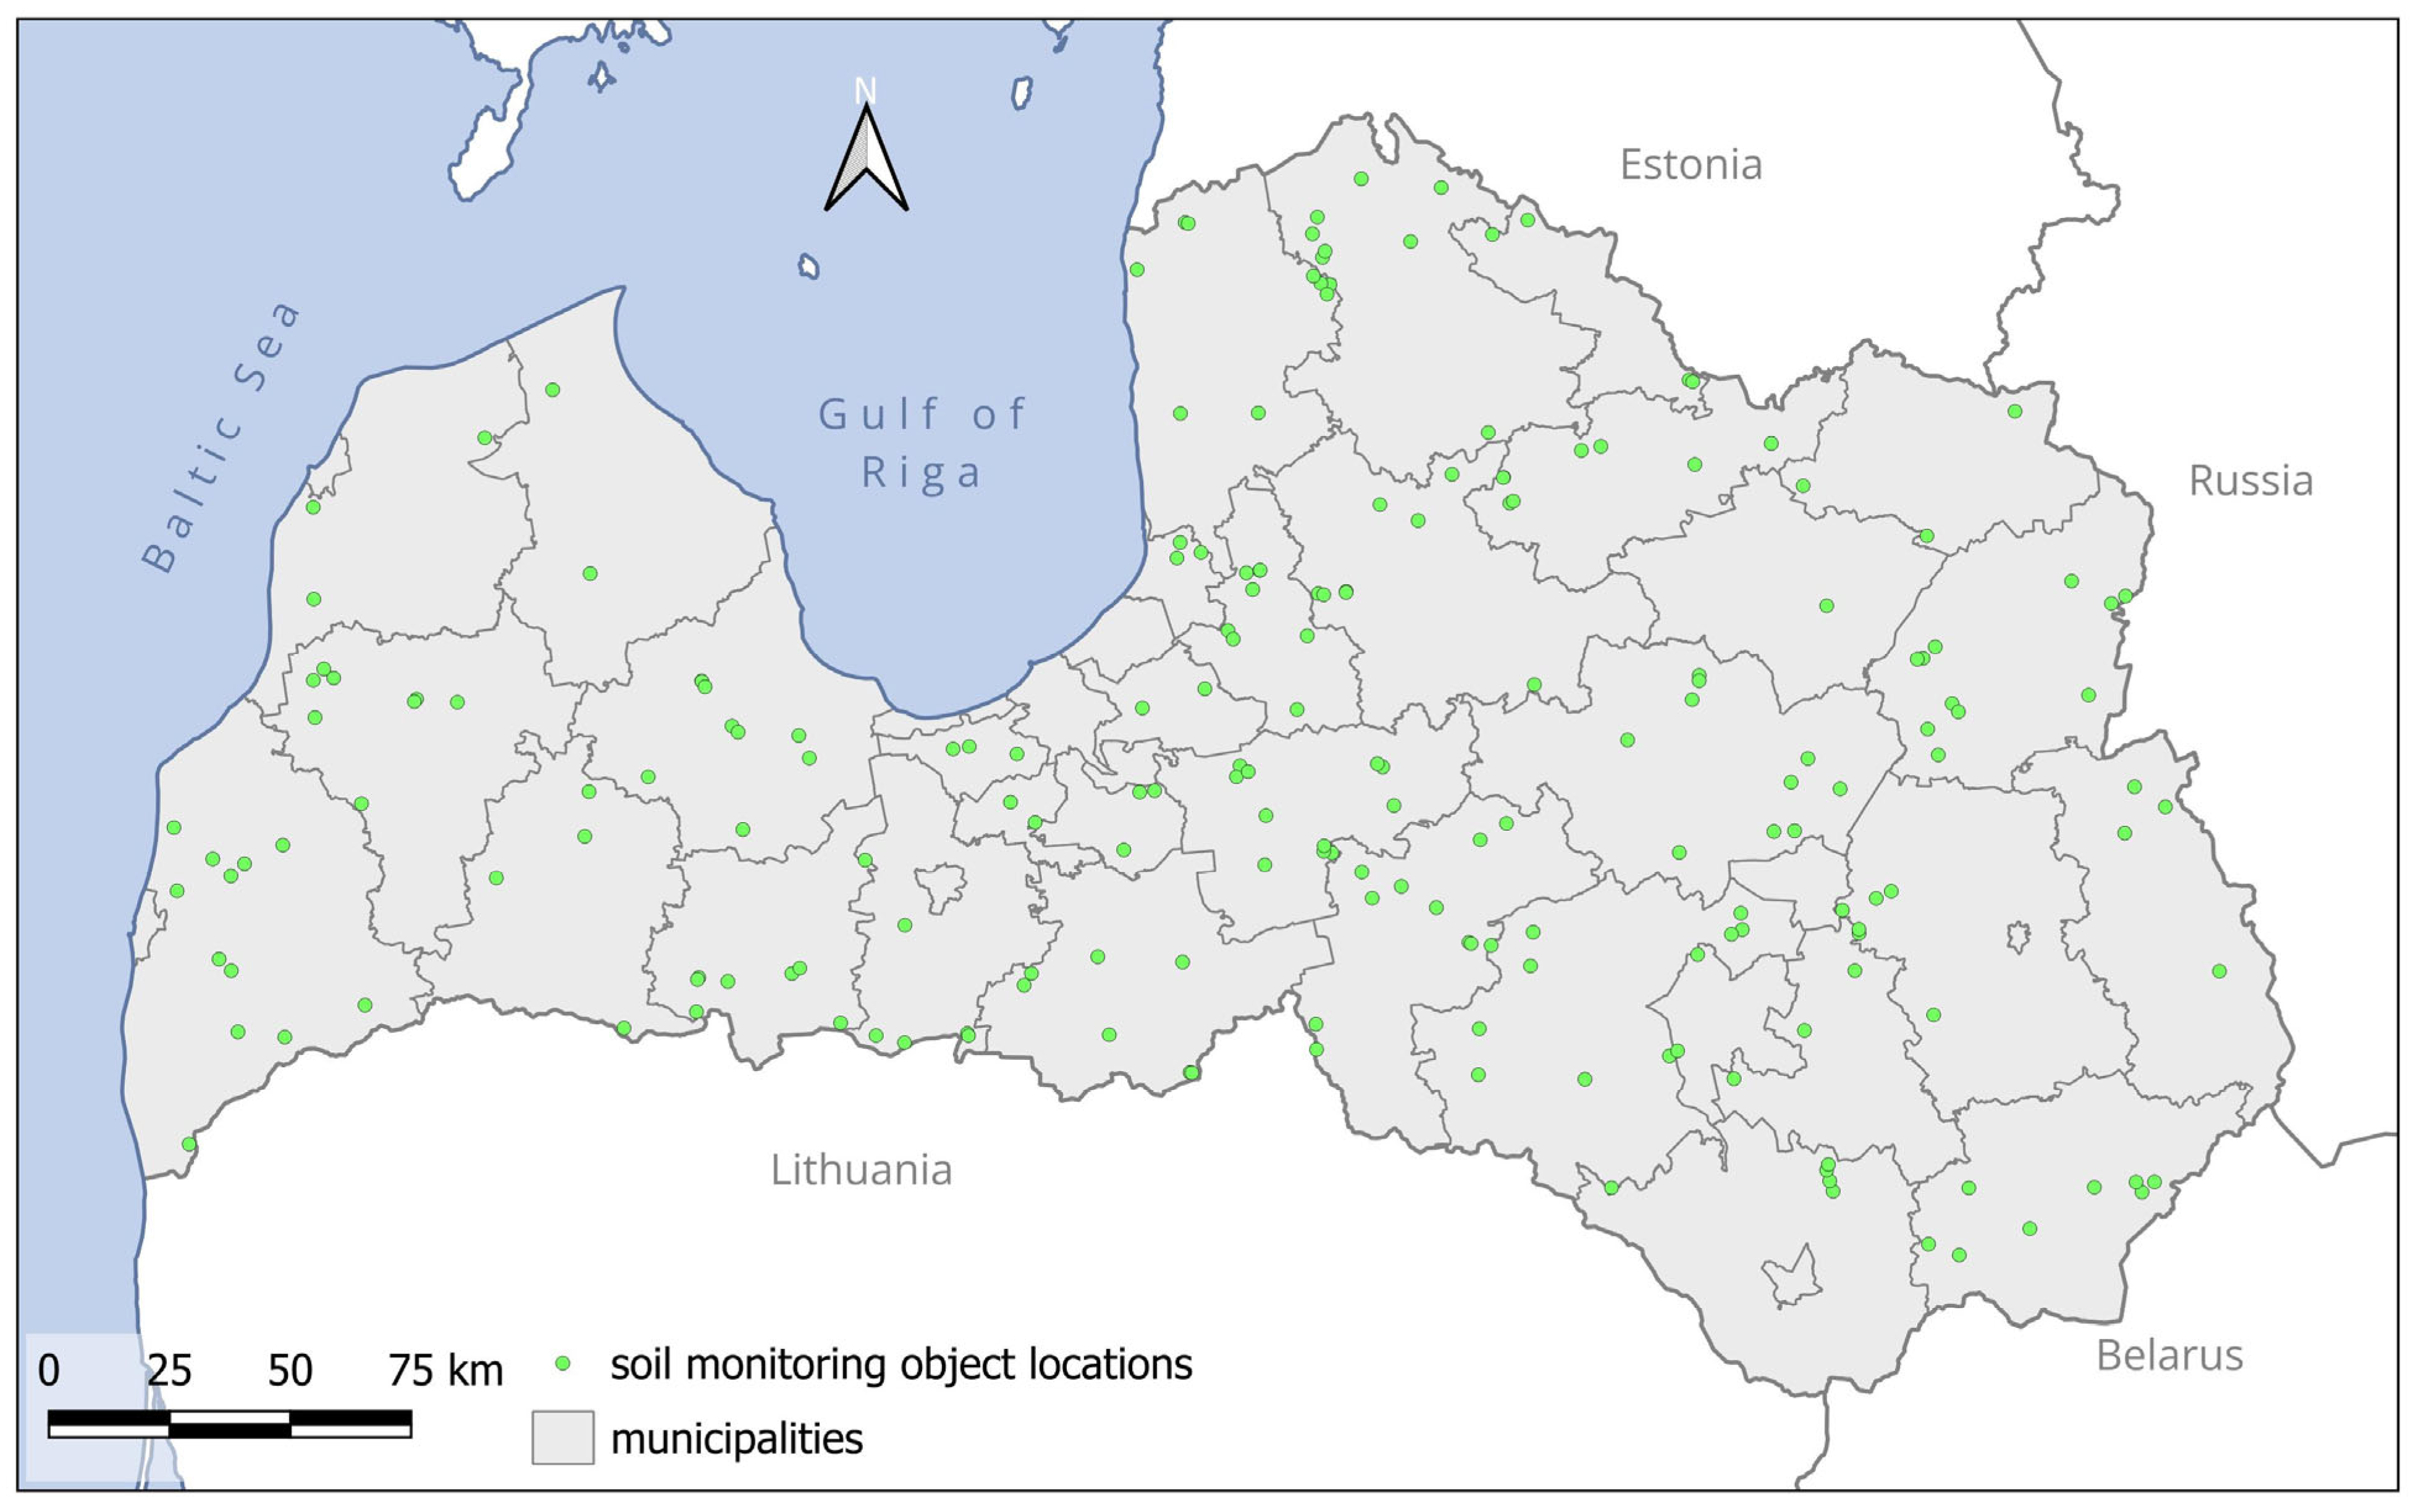
The study included 197 study sites (152 sites in cropland and 45 sites in grassland) distributed uniformly across agricultural lands with mineral soils throughout Latvia (Figure 1). Sites were evenly distributed between plains and hills, with a notable concentration in the middle terrain in both topographical categories. Few objects were identified in the highest or lowest sections of hills and plains.
Latvia belongs to the hemiboreal zone. In Latvia, the average annual air temperature, based on the climatic standard norm for 1991–2020, stands at +6.8 °C, with an average annual precipitation of 685.6 mm. The annual mean air temperature in Latvia was 7.0 °C in 2021 and 7.3 °C in 2022. Correspondingly, the annual precipitation for these years was 676.3 mm and 685.8 mm, respectively. In 2023, Latvia experienced an average air temperature of +7.8 °C, with a total precipitation of 761.1 mm, which differs significantly from the climatic standard norm (1991–2020) in Latvia [52].
2.2. Soil Sampling and Soil Profile Description
Soil sampling and soil profile description were implemented for each study site from 2021 to 2023. The initial step involved soil sampling at a depth of at least 1 m using a soil auger. In cases where the approach using the soil auger did not yield sufficient information for identifying soil horizons, pits were excavated with a shovel, exposing a soil profile.
Soil horizons were identified through morphological characteristics, texture, and determination of calcium carbonate using 10% HCl. Soil texture classes were determined according to Food and Agricultural Organization (FAO) guidelines for soil description and ISO 13320:2020 [53,54]. Soil samples were collected from each site at three distinct depths (0–10 cm, 10–20 cm, and 20–40 cm) employing a soil auger and transported to the laboratory for analysis.
The soil data were summarized in an SPSS database. Soil material type, whether mineral or organic, was determined based on the definitions provided by the World Reference Base for Soil Resources (WRB) (2022): soil is identified as mineral material when the OC content is less than 20%. Major soil groups were identified using a modified version of the WRB 2022 International soil classification system [20].
2.3. Soil Analyses
In the laboratory, the coarse fraction (>2 mm) was separated through sieving after determination of sample volume, and further analyses were done with the fine (<2 mm) fraction. Later, the volumetric stock of the elements was calculated to the whole sample volume, including the coarse fraction, assuming that the coarse soil fraction did not contain SOC and nitrogen. The analysis included the determination of various parameters: soil pH (KCl, potentiometric method) was assessed according to LVS EN ISO 10390:2022 [55]; total carbon (TC) and total nitrogen (TN) content were determined using the dry combustion method (elemental analysis) in accordance with LVS ISO 10694:2006 and ISO 11261:1995 [56,57], respectively; carbonate content was determined through the volumetric method as outlined in LVS ISO 10693:2014 [58]; the contents of HNO3-extractable phosphorus (P), as well as the metals potassium (K), calcium (Ca), and magnesium (Mg), were determined using inductively coupled plasma-optical emission spectrometry (ICP-OES). The SOC content was determined by subtracting the carbonate-C content from the total carbon (TC) content. Soil bulk density (SBD) was measured according to LVS ISO 11272:2017 [59]. The soil cylinder method was applied. Dry mass (dried at 105 °C) of 100 cm3 of undisturbed soil samples were prepared.
2.4. Calculations and Statistical Analyses
SOC stock was calculated according to the following equation:
where:
SOCS = SOC × SBD × H × (1 − P2mm) × 100−1,
- SOCS represents the soil organic carbon stock per unit area, measured in t ha−1,
- SOC is the organic carbon content in the soil, expressed in g kg−1,
- SBD denotes the soil bulk density, measured in megagrams (Mg) per cubic meter (m−3),
- H represents the thickness of the soil layer, expressed in meters (m),
- P2mm is the content of particles larger than 2 mm in the soil, presented as a percentage (%).
The data for soil organic carbon (SOC) and other soil chemical parameters underwent a normality assessment through the Shapiro–Wilk test. Our data were non-normally distributed; therefore, we used a non-parametric method, the Mann–Whitney U test. To explore the relationships between SOC and soil pH, and the values of C/N ratio, TN, P, K, Ca, and Mg, Spearman correlation analysis was employed. Statistical significance for the conducted tests was defined as p < 0.05. The data analysis was performed using RStudio (R version 4.2.0).
3. Results
3.1. WRB Soil Groups in Study Sites in Cropland and Grassland
In total, nine distinct soil groups (Arenosols, Gleysols, Luvisols, Phaeozems, Planosols, Regosols, Retisols, Stagnosols, and Umbrisols) according to the WRB classification [20] were identified in study sites in cropland and grassland. The distribution of each major soil group in cropland and grassland is presented in Table 1.
3.2. Soil Organic Carbon Concentration in Cropland and Grassland, Depending on the WRB Soil Group
Regarding study sites in cropland, the highest average SOC concentration in the 0–10 and 0–20 layers was found for Gleysols, and in the 20–40 cm soil layer, for Phaeozems, while the lowest SOC concentration in the upper layers was found for Arenosols, but in the 20-40 cm layer - for Stagnosols. The descriptive statistics of the SOC concentration in different layers of soil in cropland, depending on the soil group, are shown in Table 2.
Statistically significant differences were found between Phaeozems and Luvisols (p < 0.05 for the 0–10 cm and 20–40 cm layers, p < 0.005 for the 0–20 cm layer), as well as Phaeozems and Regosols (p < 0.05 for the 20–40 cm layer). p values of the Mann–Whitney U test are shown in Table 3.
Regarding study sites in grassland, the highest average SOC concentrations in the 0–20 cm soil layer were found for Planosols, while in the 20–40 cm soil layer, for Retisols. The lowest concentrations in the 0-10 and 0–20 cm soil layers were found for Retisols, while in the 20–40 cm layer, for Gleysols. No statistically significant differences in SOC concentration were found between the soil groups (p > 0.05); however, statistical methods could only be applied in the case of Luvisols and Phaeozems due to the small number of sites represented by other soil groups. The descriptive statistics of the SOC concentration in different layers of soil in grassland, depending on the soil group, are shown in Table 4.
When comparing SOC concentrations between the two land uses, specifically the soil groups Luvisols and Phaeozems (these soil groups were the most common among the study sites), the concentration for Luvisols was higher in grassland, but for Phaeozems, in cropland. However, statistically significant differences were observed for only Luvisols in the 0–20 cm layer (p = 0.026).
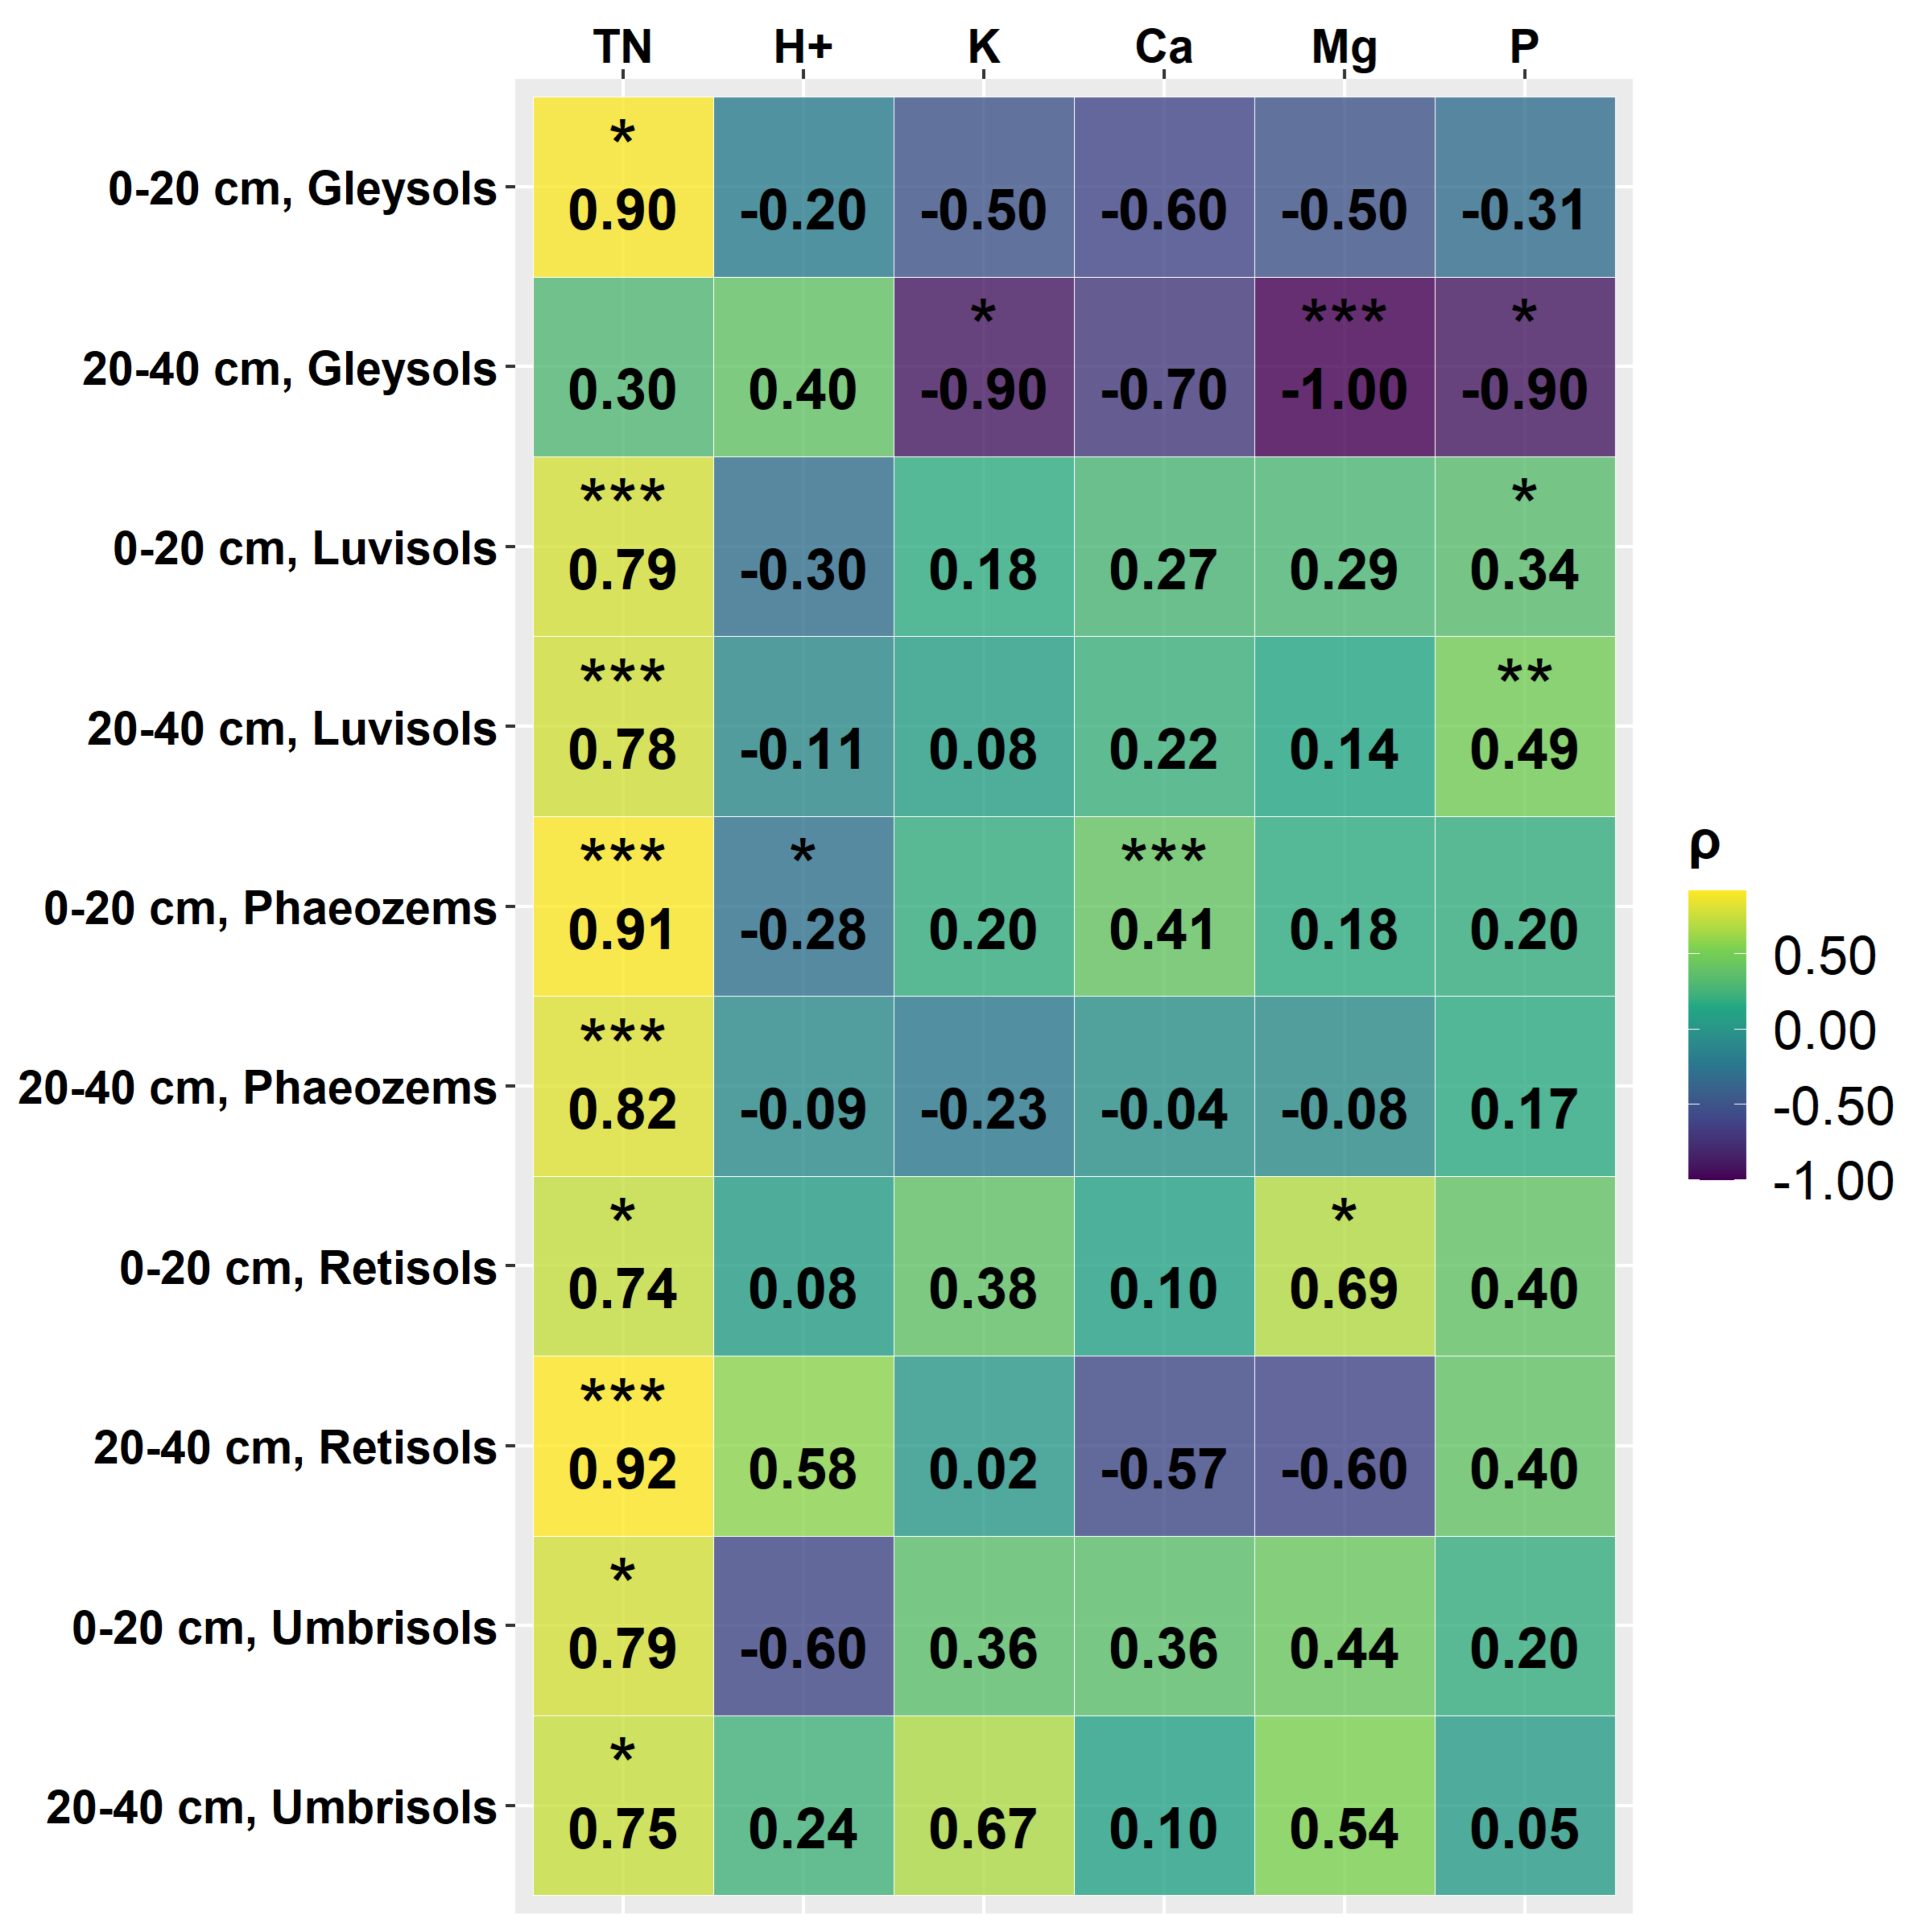
When estimating correlations between SOC concentrations and other soil chemical variables in study sites in cropland, very strong (|ρ| ≥ 0.8), significant correlations were found between SOC concentration and TN content in the soil. These correlations were observed in the 0–20 cm layer of Gleysols, the 0–20 cm and 20–40 cm layers of Luvisols, the 0–20 cm and 20–40 cm layers of Phaeozems, the 0–20 cm and 20–40 cm layers of Retisols, as well as the 0–20 cm layer of Umbrisols. Statistically significant strong, negative correlations were observed for Gleysols in the 20–40 cm layer between SOC concentration and soil K, Ca, and P concentrations. Additionally, positive, strong (|ρ| ≥ 0.6), significant correlation was identified between SOC concentration and TN content in the 20–40 cm layer of Umbrisols. Moderate (|ρ| ≥ 0.4) significant correlations were found between SOC concentration and C/N ratio in the 20–40 cm layer of Phaeozems, SOC concentration and soil Ca concentration the 0–20 cm layer of Phaeozems, and between SOC concentration and soil P concentration in the 20–40 cm layer of Luvisols. Also, several weak (0.2 ≤ |ρ| < 0.4), but significant, correlations have been observed. Spearman correlation coefficients and their significance are shown in Figure 2.
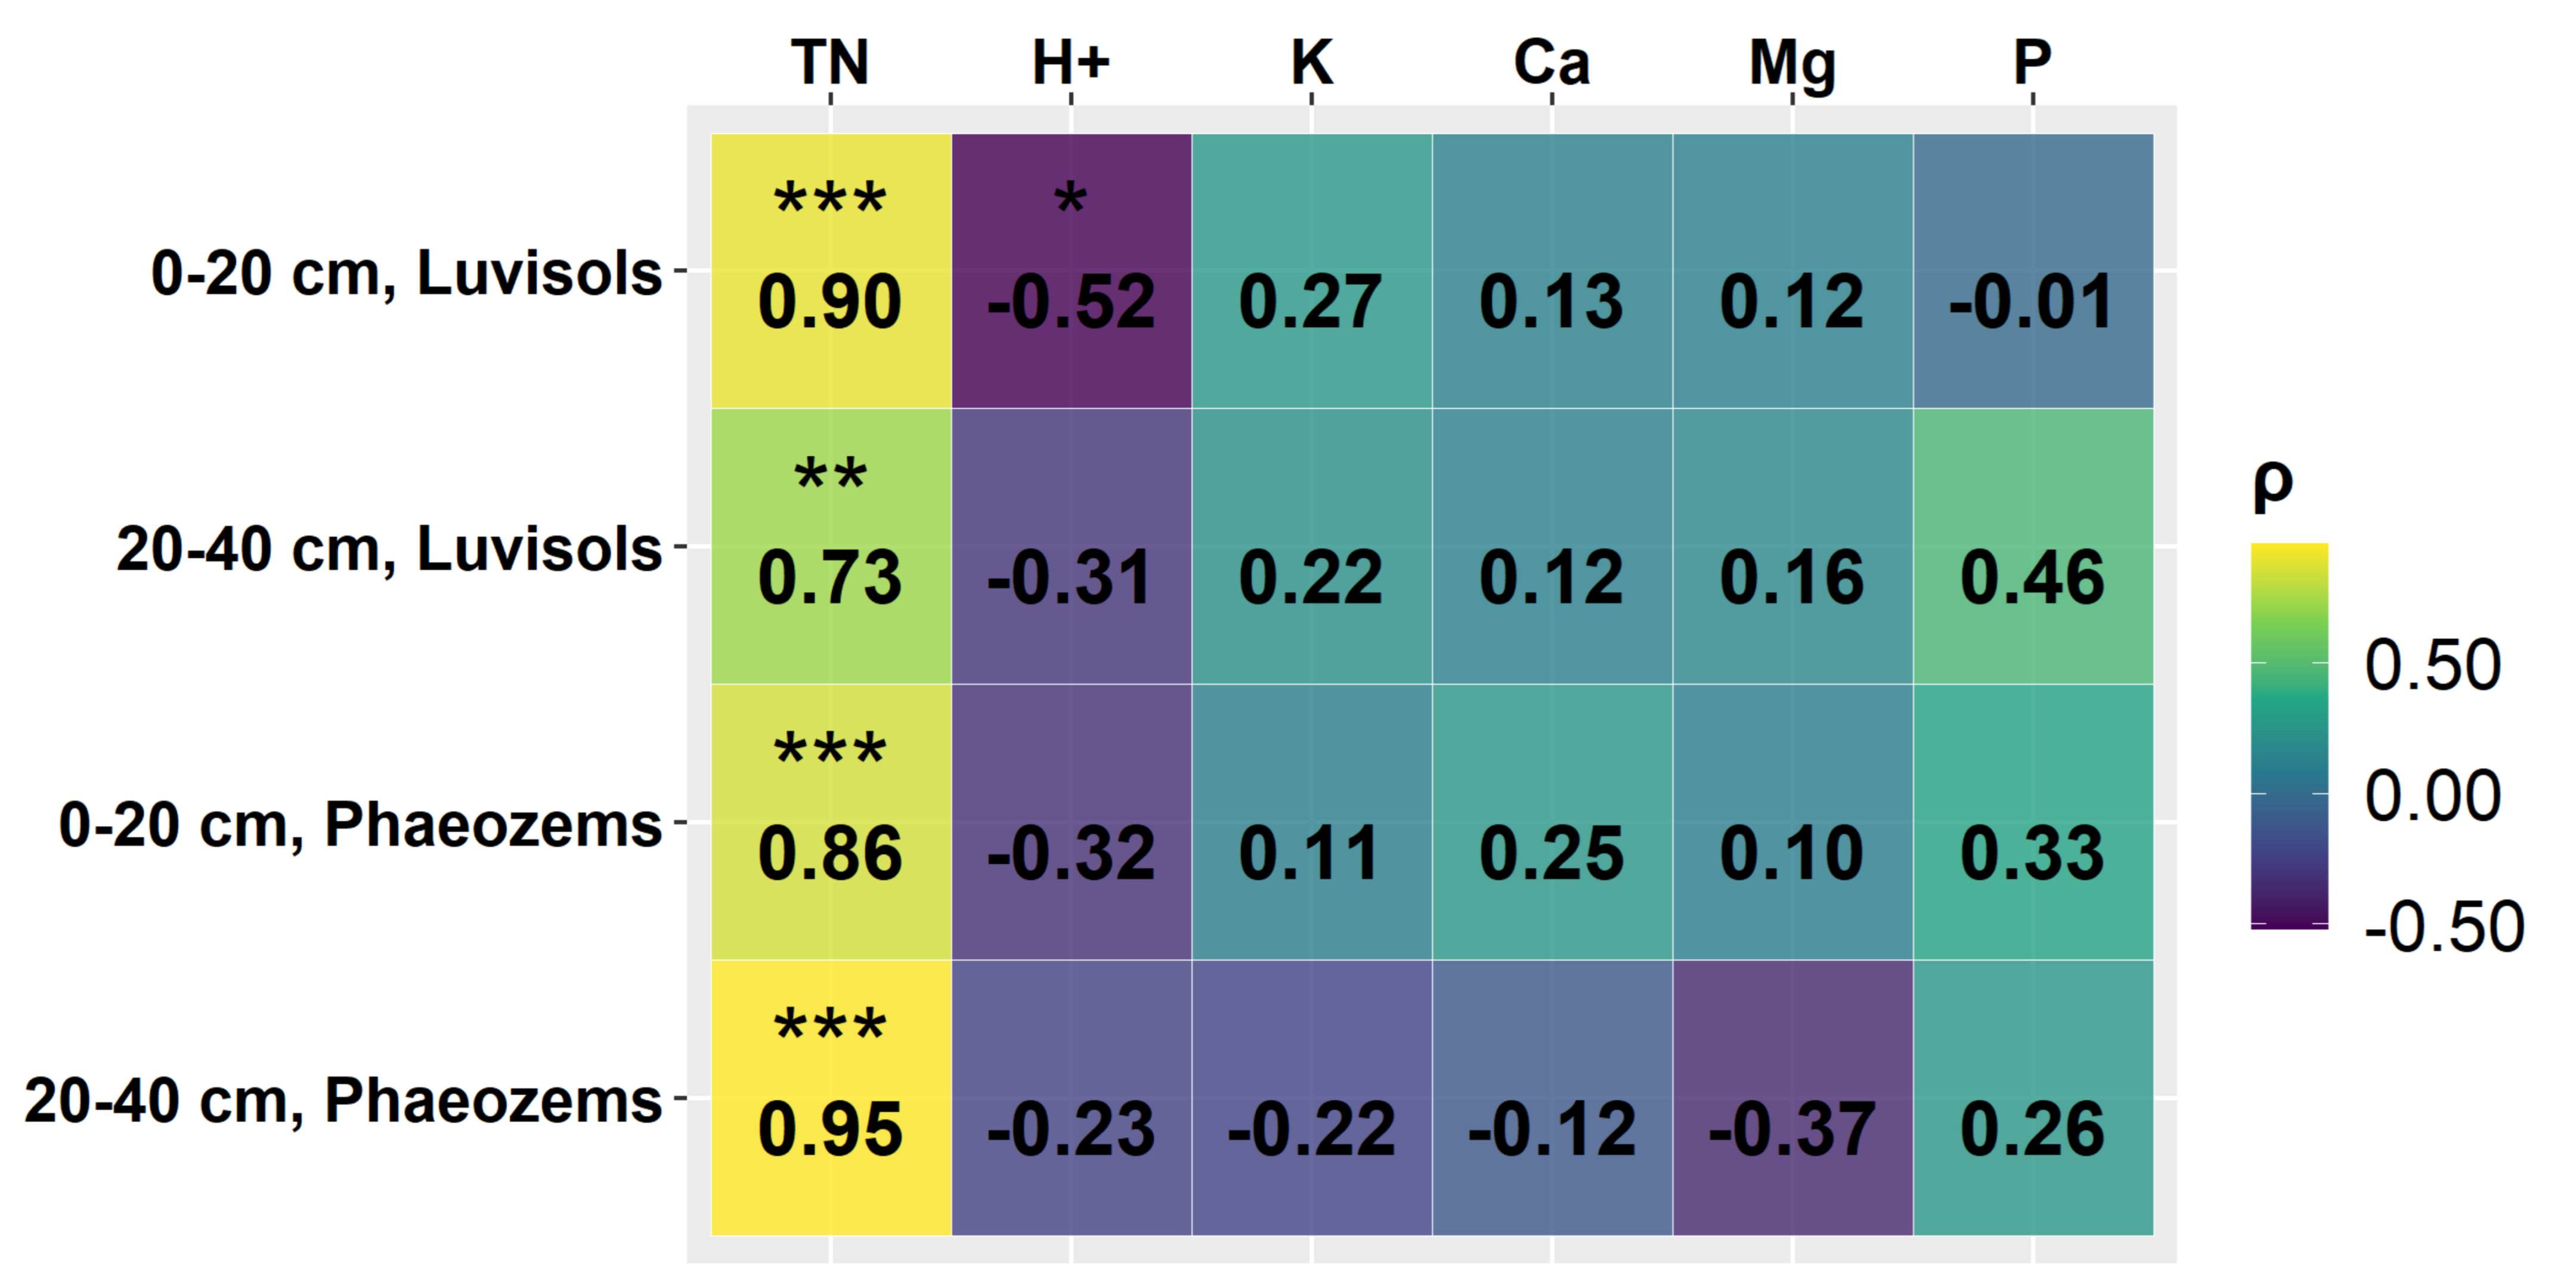
When estimating correlations between SOC concentrations and other soil chemical variables in study sites in grassland, very strong, significant correlations were found between SOC concentration and TN content in the soil. These correlations were observed in the 0–20 cm layer of Luvisols, and the 0–20 cm and 20–40 cm layers of Phaeozems. Strong significant positive correlations were also found between soil SOC and C/N ratio in the 20–40 cm layer of both Luvisols and Phaeozems. A moderate significant correlation was found between SOC concentration and soil H+ concentration in the 0–20 cm layer of Luvisols. Spearman correlation coefficients and their significance are shown in Figure 3.
3.3. Soil Chemical Parameters and Bulk Density in Cropland and Grassland, Depending on the WRB Soil Group
Regarding study sites in cropland, the highest average soil pH in the 0–20 and 20–40 cm soil layers was found for Stagnosols, and the lowest for Luvisols. The descriptive statistics of the soil pH in different layers of soil in cropland, depending on the major WRB soil group, are shown in Table 5.
Regarding study sites in grassland, the highest average soil pH in all the soil layers was found for Phaeozems, and the lowest for Luvisols. The descriptive statistics of the soil pH in different layers of soil in grassland, depending on the major WRB soil group, are shown in Table 6.
Regarding study sites in cropland, the highest average soil TN concentration in the 0–10 cm soil layer was found for Gleysols, in the 0–20 cm and 20–40 cm layers, for Phaeozems, and the lowest for Stagnosols. The descriptive statistics of the soil TN concentration in different layers of soil in cropland, depending on the major WRB soil group, are shown in Table 7.
Regarding study sites in grassland, the highest average soil TN concentration in the 0–10 and 0–20 cm soil layers was found for Luvisols, and in the 20–40 cm layer, for Phaeozems. The lowest average concentration in all the layers was observed for Umbrisols. For other groups besides Luvisols and Phaeozems in the 20–40 cm layer, the TN concentrations were considerably lower than for Luvisols and Phaeozems. The descriptive statistics of the soil TN concentration in different layers of soil in grassland, depending on the major WRB soil group, are shown in Table 8.
Regarding study sites in cropland, the highest average soil K concentration in the 0–10 cm and 20–40 cm layers was found for Regosols, while in the 0–20 cm layer, for Luvisols. The lowest concentration across the layers 0–10 and 20–40 cm was found for Umbrisols, but in the 0–20 cm layer, for Regosols. The descriptive statistics of the K concentration in different layers of soil in cropland, depending on the major WRB soil group, are shown in Table 9.
Regarding study sites in grassland, the highest average soil K concentration in the 0–20 cm layer was found for Stagnsols, and in the 20–40 cm layer, for Planosols, but the lowest concentration in both layers was found for Retisols. The descriptive statistics of the K concentration in different layers of soil in grassland, depending on the major WRB soil group, are shown in Table 10.
Regarding study sites in cropland, the highest average soil P concentration in the 0–20 cm and 20–40 cm layers was found for Gleysols, and the lowest for Stagnosols. The descriptive statistics of the P concentration in different layers of soil in cropland, depending on the major WRB soil group, are shown in Table 11.
Regarding study sites in grassland, the highest average soil P concentration in the 0–20 cm and 20–40 cm layers was found for Phaeozems, and the lowest for Retisols. The descriptive statistics of the P concentration in different layers of soil in grassland, depending on the major WRB soil group, are shown in Table 12.
Regarding study sites in cropland, the highest average soil C concentration in the 0–20 cm and 20–40 cm layers was found for Arenosols, and the lowest for Umbrisols. The descriptive statistics of the Ca concentration in different layers of soil in cropland, depending on the major WRB soil group, are shown in Table 13.
Regarding study sites in grassland, the highest average soil Ca concentration in the 0–20 cm and 20–40 cm layers was found for Phaeozems, and the lowest for Retisols. The descriptive statistics of the Ca concentration in different layers of soil in grassland, depending on the major WRB soil group, are shown in Table 14.
Regarding study sites in cropland, the highest average soil Mg concentration in the 0–20 cm layer was found for Gleysols, and in the 20–40 cm layer for Stagnosols, while the lowest in both layers was found for Umbrisols. The descriptive statistics of the Mg concentration in different layers of soil in cropland, depending on the major WRB soil group, are shown in Table 15.
Regarding study sites in grassland, the highest average soil Mg concentration in the 0–20 cm layer was found for Stagnosols, and in the 20–40 cm layer for Planosols, while the lowest concentration in both layers was found for Retisols. The descriptive statistics of the Mg concentration in different layers of soil in grassland, depending on the major WRB soil group, are shown in Table 16.
Regarding study sites in cropland, the highest average SBD in the 0–20 cm layer was found for Arenosols, and in the 20–40 cm layer for Luvisols, while the lowest in the 0–10 cm and 20–40 cm layers was found for Umbrisols and in the 0–20 cm layer for Gleysols. The descriptive statistics of the SBD in different layers of soil in cropland, depending on the major WRB soil group, are shown in Table 17.
Regarding study sites in grassland, the differences in the average SBD between Luvisols and Phaeozems were negligible in both soil layers; however, the variation between different sites was higher for Luvisols. The lowest SBD for the upper layers was found for Planosols, and for the 20–40 cm layer for Retisols. The highest SBD in the upper soil layers was found for Umbrisols, and in the 20–40 cm layer for Planosols. The descriptive statistics of the SBD in different layers of soil in grassland, depending on the major WRB soil group, are shown in Table 18.
3.4. Soil Organic Carbon Stock in Cropland and Grassland, Depending on the Major WRB Soil Group
The average SOC stock in the 0–40 cm soil layer in cropland, without considering WRB soil groups, amounted to 82.78 t ha−1, while in grassland, it was 76.95 t ha−1. Regarding cropland sites, the highest average SOC stocks in the 0–10 cm and 0–20 cm layers were found for Gleysols, and considering the whole 0–40 cm layer – for Phaeozems. The lowest SOC stocks in the 0–10 cm and 0–20 cm layers were found for Arenosols, while, considering the whole 0–40 cm profile, for Stagnosols. The descriptive statistics of the SOC stock in different layers of soil in cropland, depending on the soil group, are shown in Table 19.
Statistically significant differences were found between Phaeozems and Luvisols (p < 0.05 for the 0–10 cm layer, p < 0.005 for the 0–20 cm layer and 0–40 cm layer) and Phaeozems and Regosols (p < 0.05 for the 0–40 cm layer). p values of the Mann–Whitney U test are shown in Table 20.
Regarding grassland sites, the highest average SOC stocks in the 0–10 cm, 0–20 cm, and 0–40 cm layers were found for Planosols, and the lowest in the 0–10 cm and 0–20 cm for Retisols, while, considering the whole 0–40 cm profile, for Umbrisols. Statistically significant differences between the soil groups were not found. The descriptive statistics of the SOC stock in different layers of soil in grassland, depending on the soil group, are shown in Table 21.
When comparing carbon stocks between study sites in cropland and grassland with the WRB soil groups Luvisols and Phaeozems, Phaeozems exhibit higher carbon stocks in cropland sites, while in grassland sites, Luvisols show higher carbon stocks. Statistically significant differences were found for Luvisols in the 0–10 cm layer (p = 0.016).
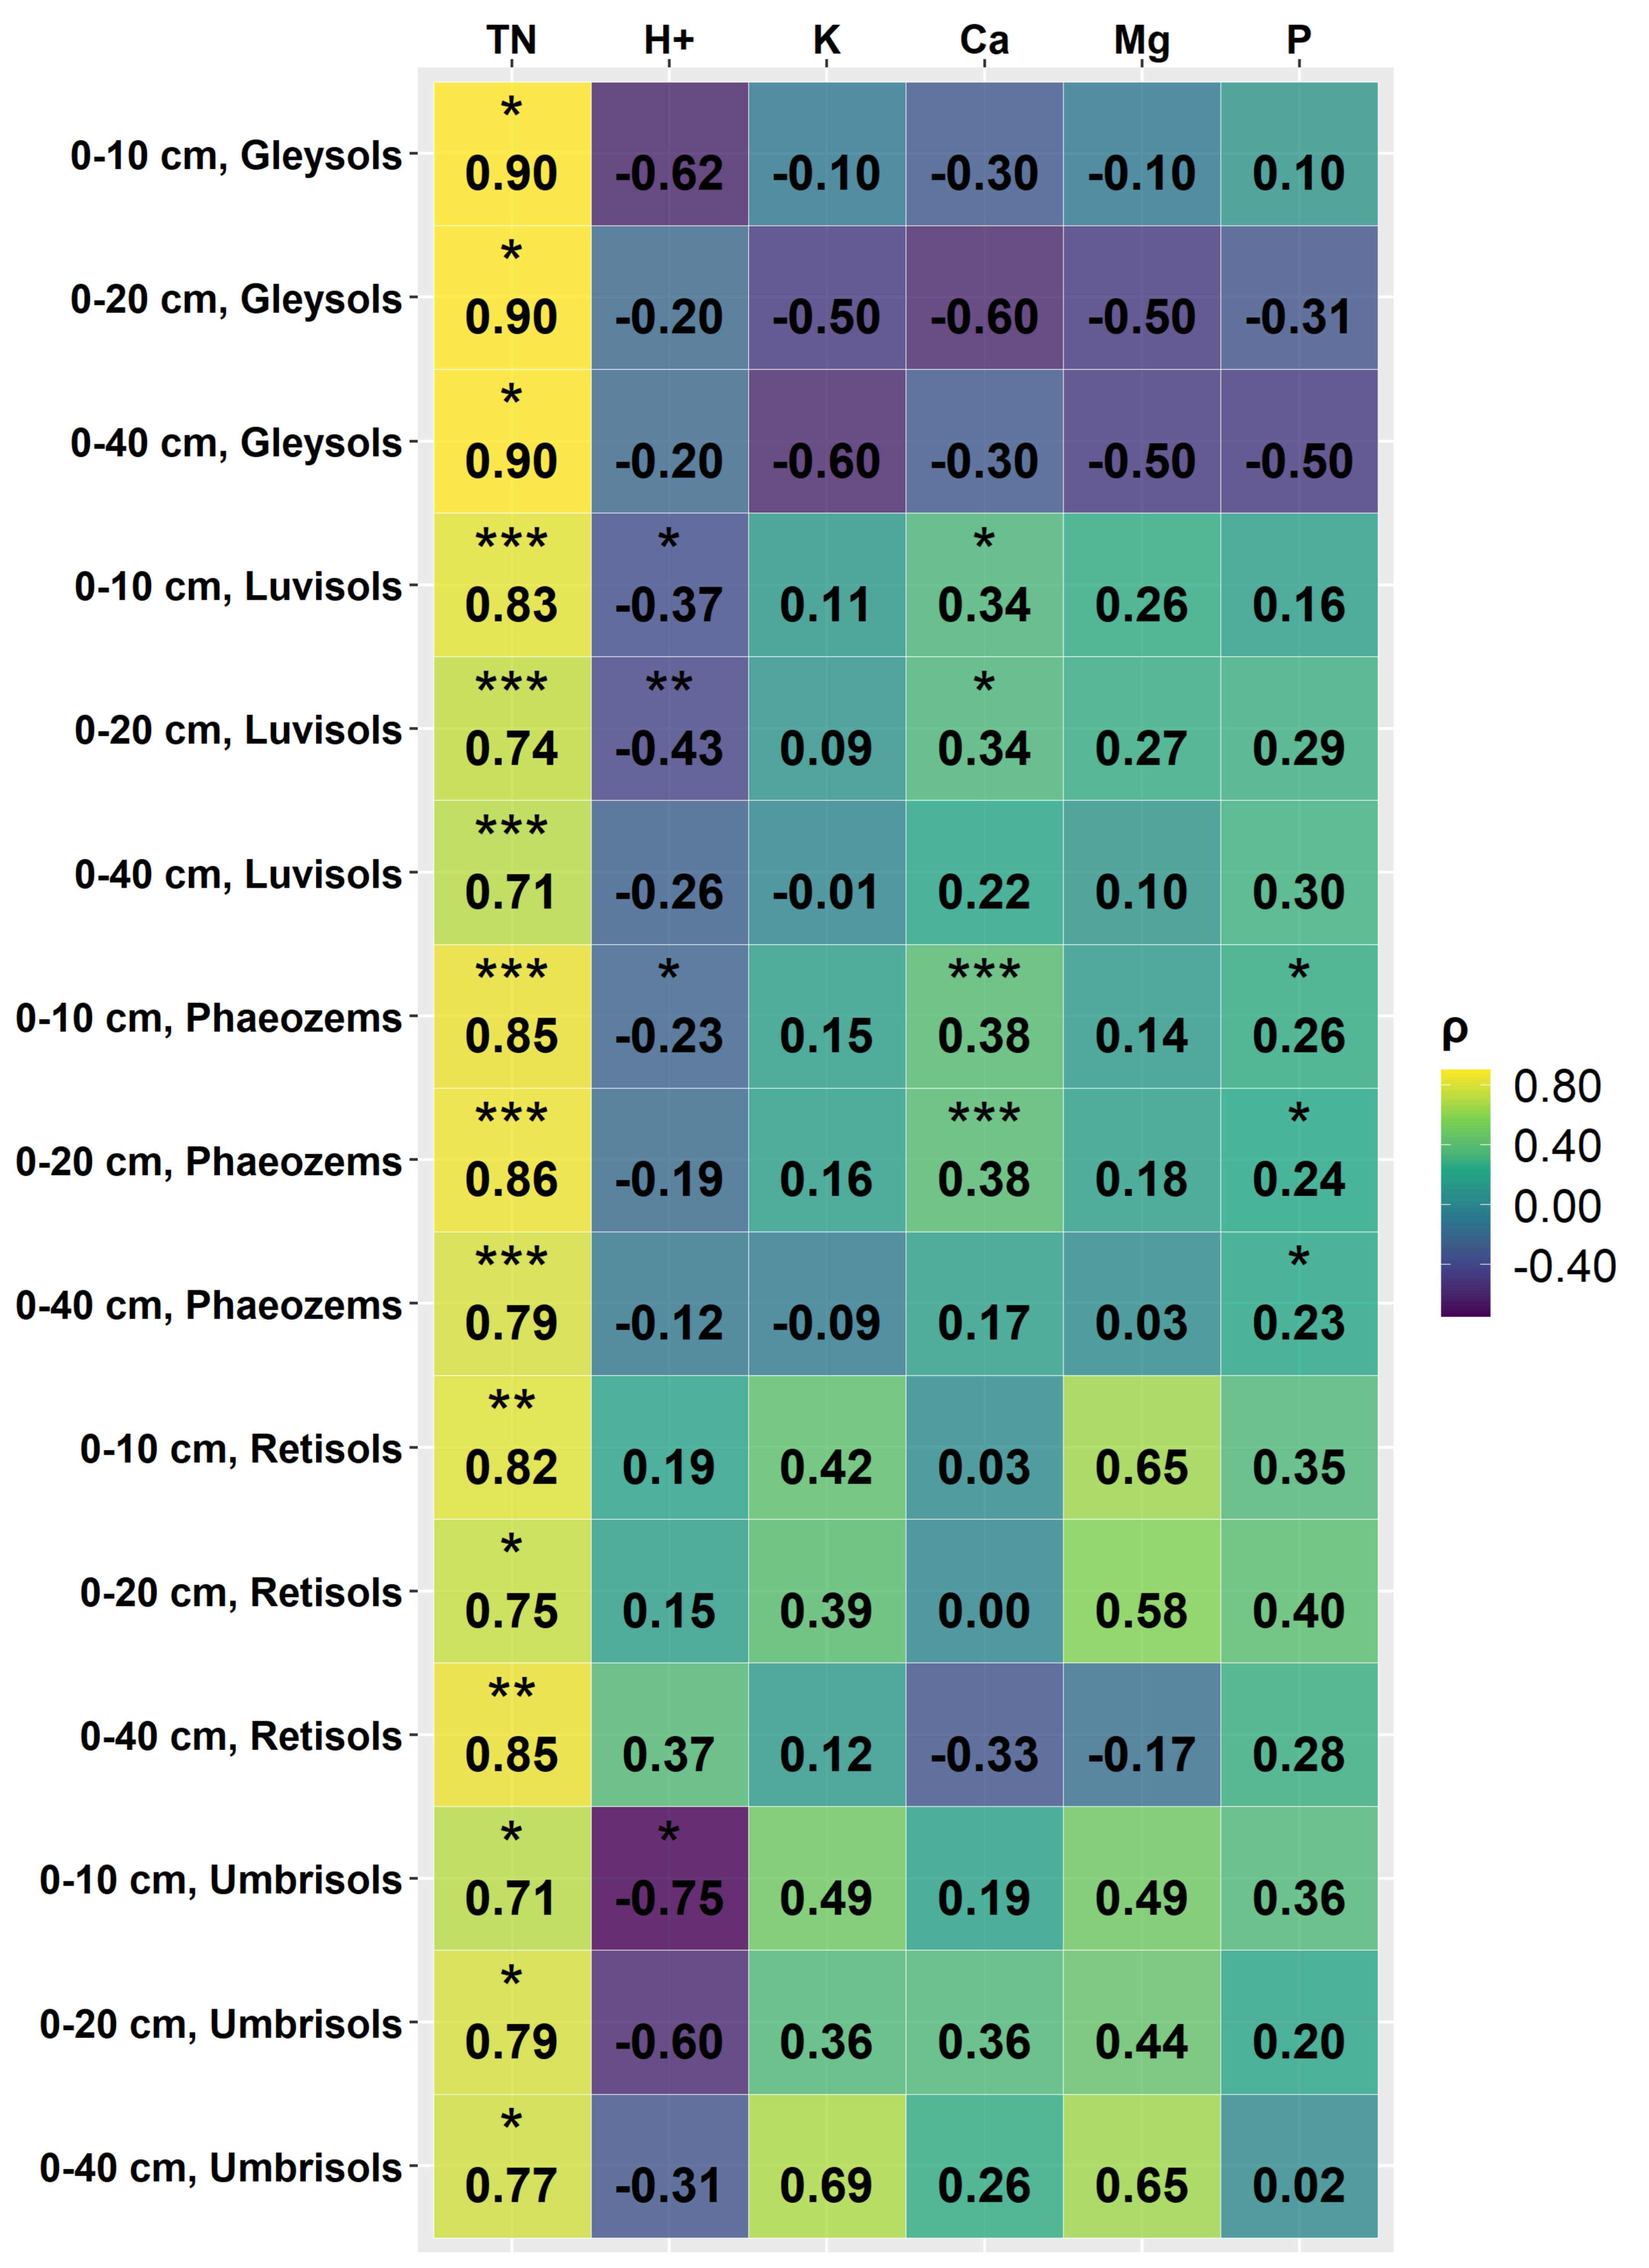
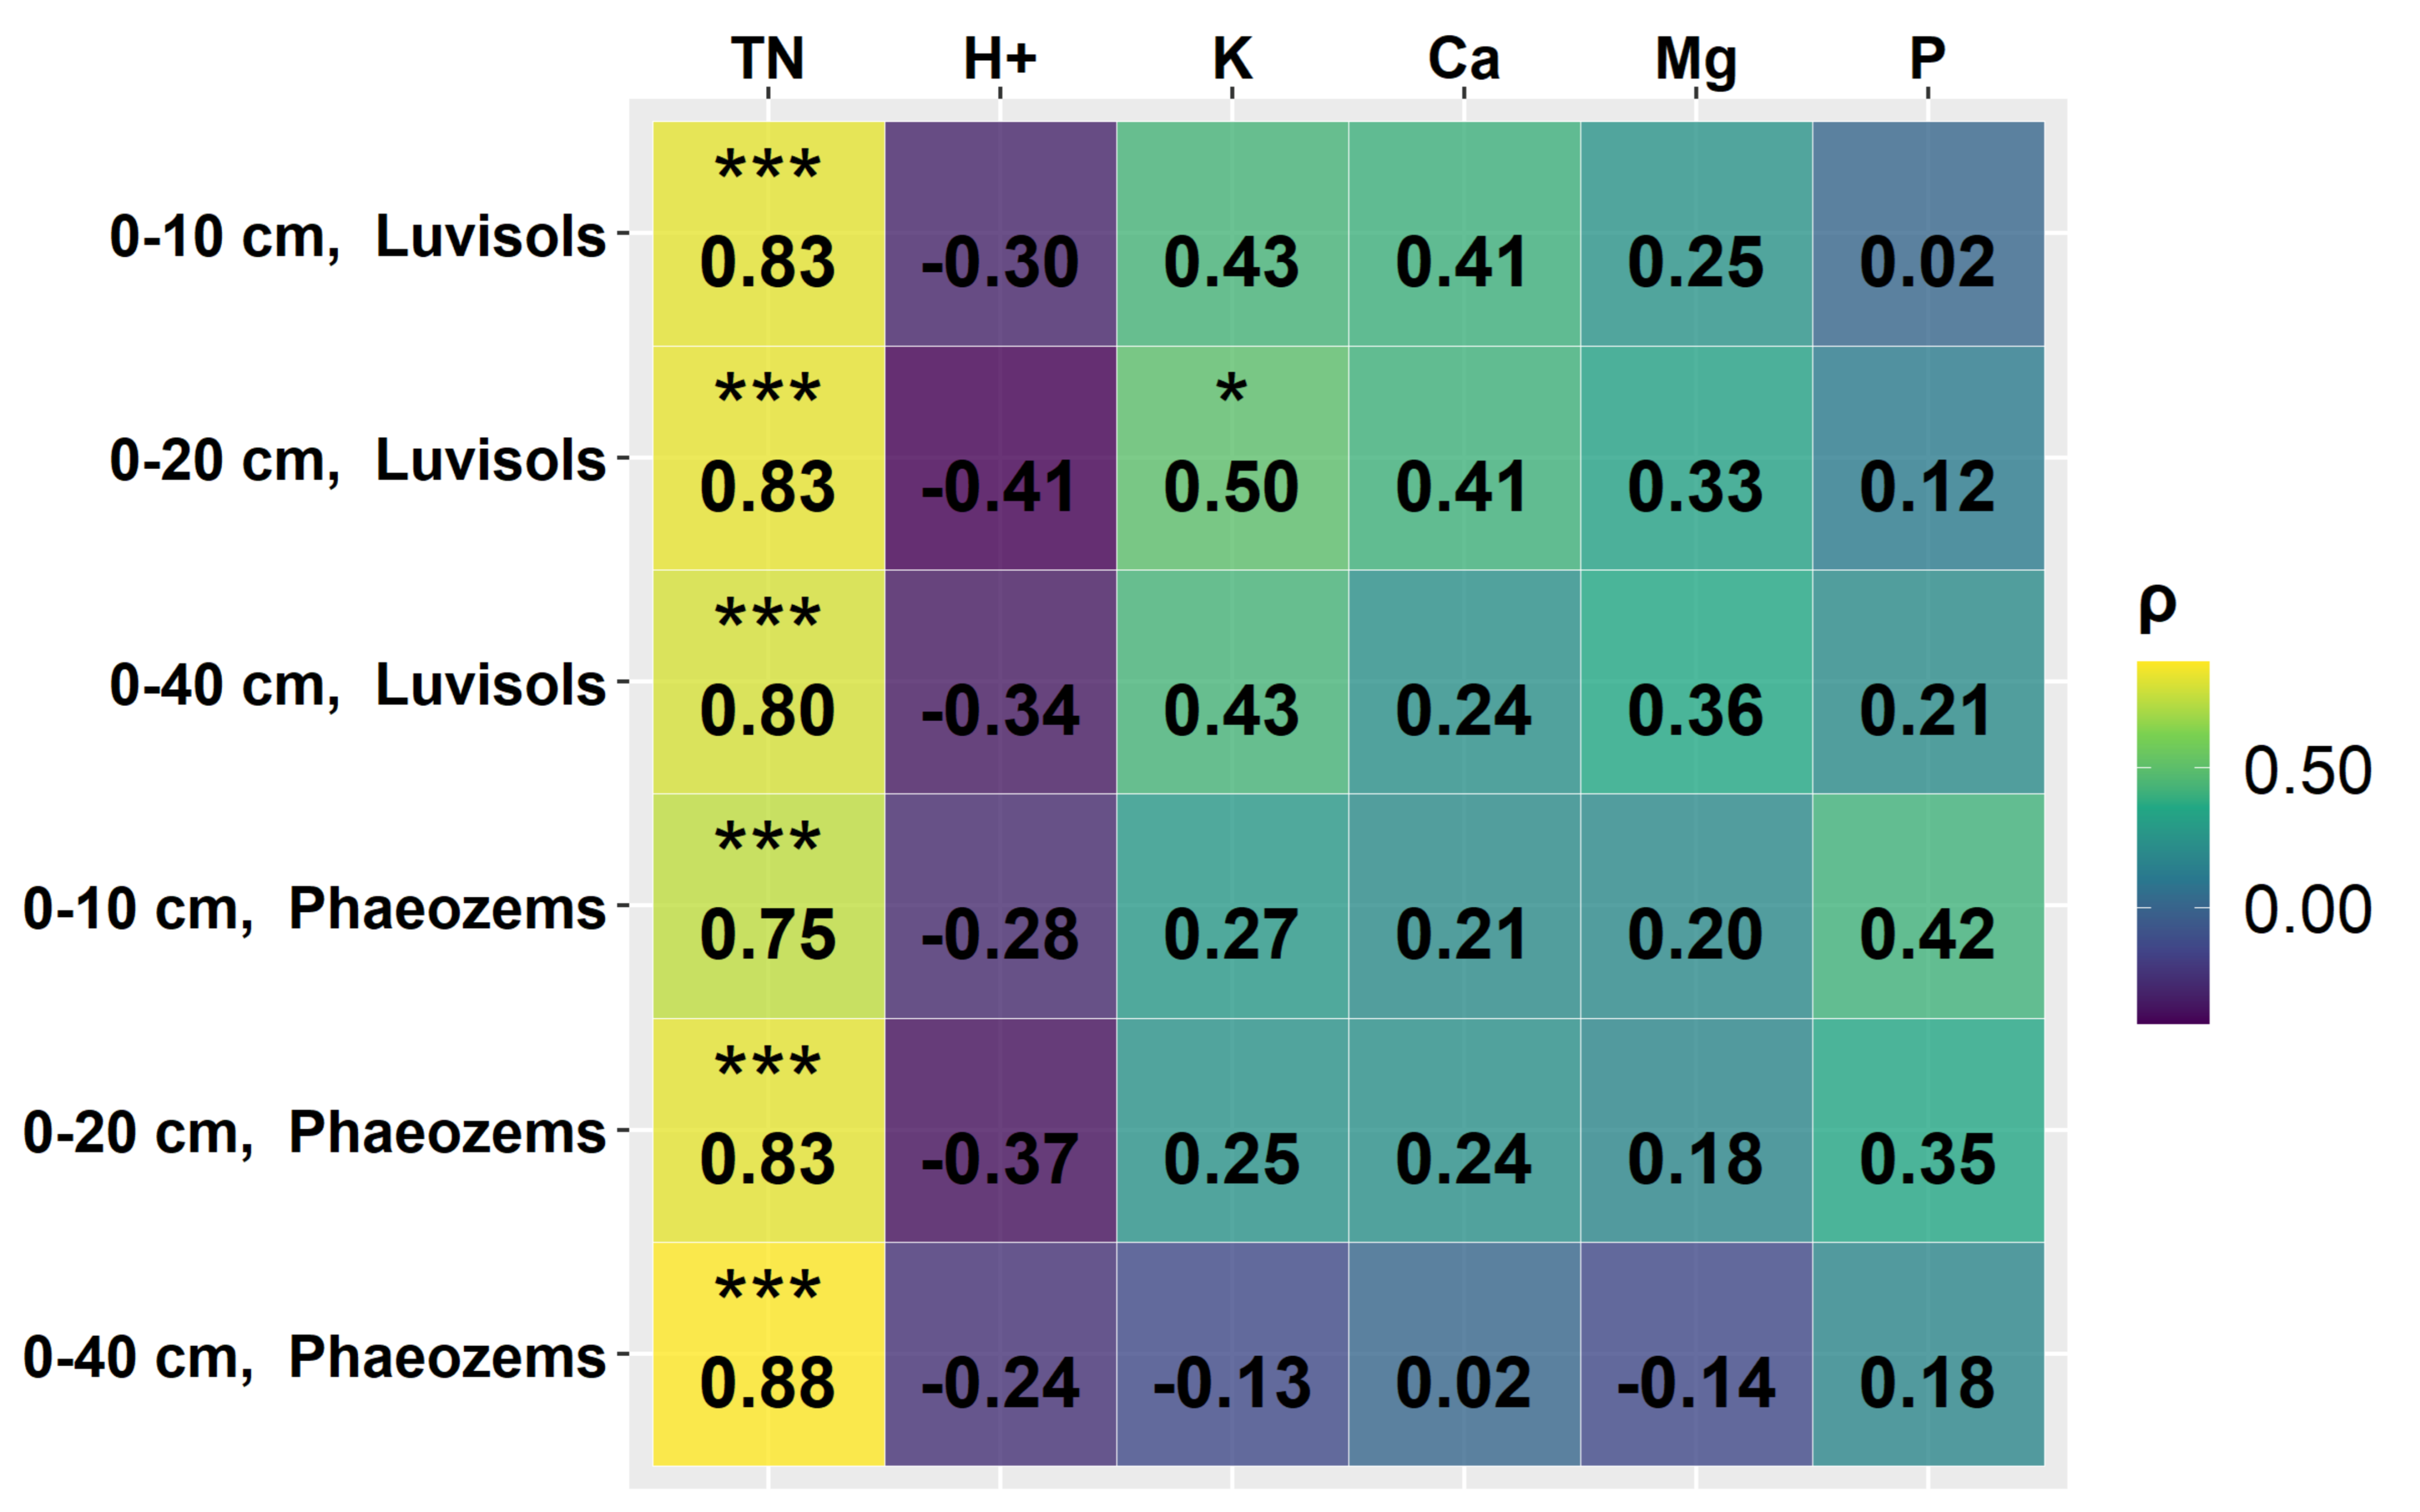
When estimating correlations between OC stocks and other soil chemical parameters in study sites in cropland, very strong (|ρ| ≥ 0.8), significant correlations were found between OC stock and TN content in the soil for Gleysols and Phaeozems (all layers), the 0–10 cm layer of Luvisols, the 0–10 cm and 0–40 cm layers of Retisols, as well as the 0–20 cm and 0–40 cm layers of Umbrisols. Positive, strong (|ρ| ≥ 0.6), significant correlations were identified between OC stock and TN content in the 0–20 and 0–40 cm layers of Luvisols, the 0–20 cm layer of Retisols, and the 0–20 cm layer of Umbrisols. Additionally, a positive, strong, significant correlation was found between the SOC stock and soil pH in the 0–10 cm layer of Umbrisols. A positive, moderate, significant correlation was found between SOC stock and soil pH in the 0–20 cm layer of Luvisols. Several weak but statistically significant positive correlations were identified. These include: between SOC stock and between SOC stock, Ca, and P concentrations for Phaeozems (0–10 cm and 0–20 cm layers); and between SOC stock and P concentration for Retisols (0–10 cm layer). Statistically significant, negative correlations were found between SOC stock and soil H+ concentration for Luvisols (0–10 and 0–20 cm layers) and Phaeozems (0–10 cm layer). Spearman correlation coefficients and their significance are shown in Figure 4.
When estimating correlations between OC stocks and other soil chemical properties in study sites in grassland, very strong, significant correlations were found between OC stock and TN content in the soil for all layers of Luvisols and Phaeozems. Moderate significant correlations were found between OC stock and C/N ratio in the 0–40 cm layer of Luvisols and the 0–40 cm layer of Phaeozems. Spearman correlation coefficients and their significance are shown in Figure 5.
3.5. Soil Organic Carbon Stock in Cropland and Grassland, Depending on Soil Texture Classes
Regarding cropland sites, the highest average SOC stocks in the 0–10 cm and 20–40 cm layers were found for soils with silt texture, but the lowest for loamy sand-textured soils in all the layers. Statistically significant differences were found between the 0–10 cm layers of texture classes silt and silt loam (p = 0.012). The descriptive statistics of the SOC stock in different layers of soil in cropland, depending on the soil texture class, are shown in Table 22.
In grassland sites, soils with a silt texture exhibited the highest average OC stocks in the 0–10 cm layer, while soils with a silt loam texture showed the highest stocks in the 10–20 cm layer, and soils with a loamy sand texture had the highest stocks in the 20–40 cm layer. Conversely, the lowest average SOC stocks were found in soils with a sandy loam texture in the 10–20 cm and 20–40 cm layers, and in soils with a loamy sand texture in the 0–10 cm layer. Statistically significant differences were found between the texture classes silt and sandy loam in the 0–10 cm and 10–20 cm layers (p = 0.011 and p = 0.013, respectively). Additionally, significant differences were found between soils with a silt loam and a sandy loam texture in the 10–20 cm layer (p = 0.0023) as well as between soils with a silt loam and a silt texture in the 0–10 cm layer (p = 0.029). The descriptive statistics of the SOC stock in different layers of soil in grassland, depending on the soil texture class, are shown in Table 23.
When comparing SOC stocks among cropland and grassland study sites with different soil textures, it was observed that soils with a sandy loam texture exhibited higher SOC stocks in cropland sites across all soil layers compared to grassland sites. On the other hand, soils with a silt loam texture showed higher SOC stocks in grassland sites in the 0–10 cm and 10–20 cm layers but in the 20–40 cm layer in cropland sites. Loamy sand-textured soils had higher SOC stocks in cropland sites in the 0–10 cm and 10–20 cm layers but higher stocks in the 20–40 cm layer in grassland sites. Additionally, soils with a silt texture showed higher SOC stocks in grassland sites within the 0–10 cm layer, but lower stocks in the remaining layers, compared to cropland. Statistically significant differences were found only between cropland and grassland for soils with sandy loam texture in the 10–20 cm layer (p = 0.0059).
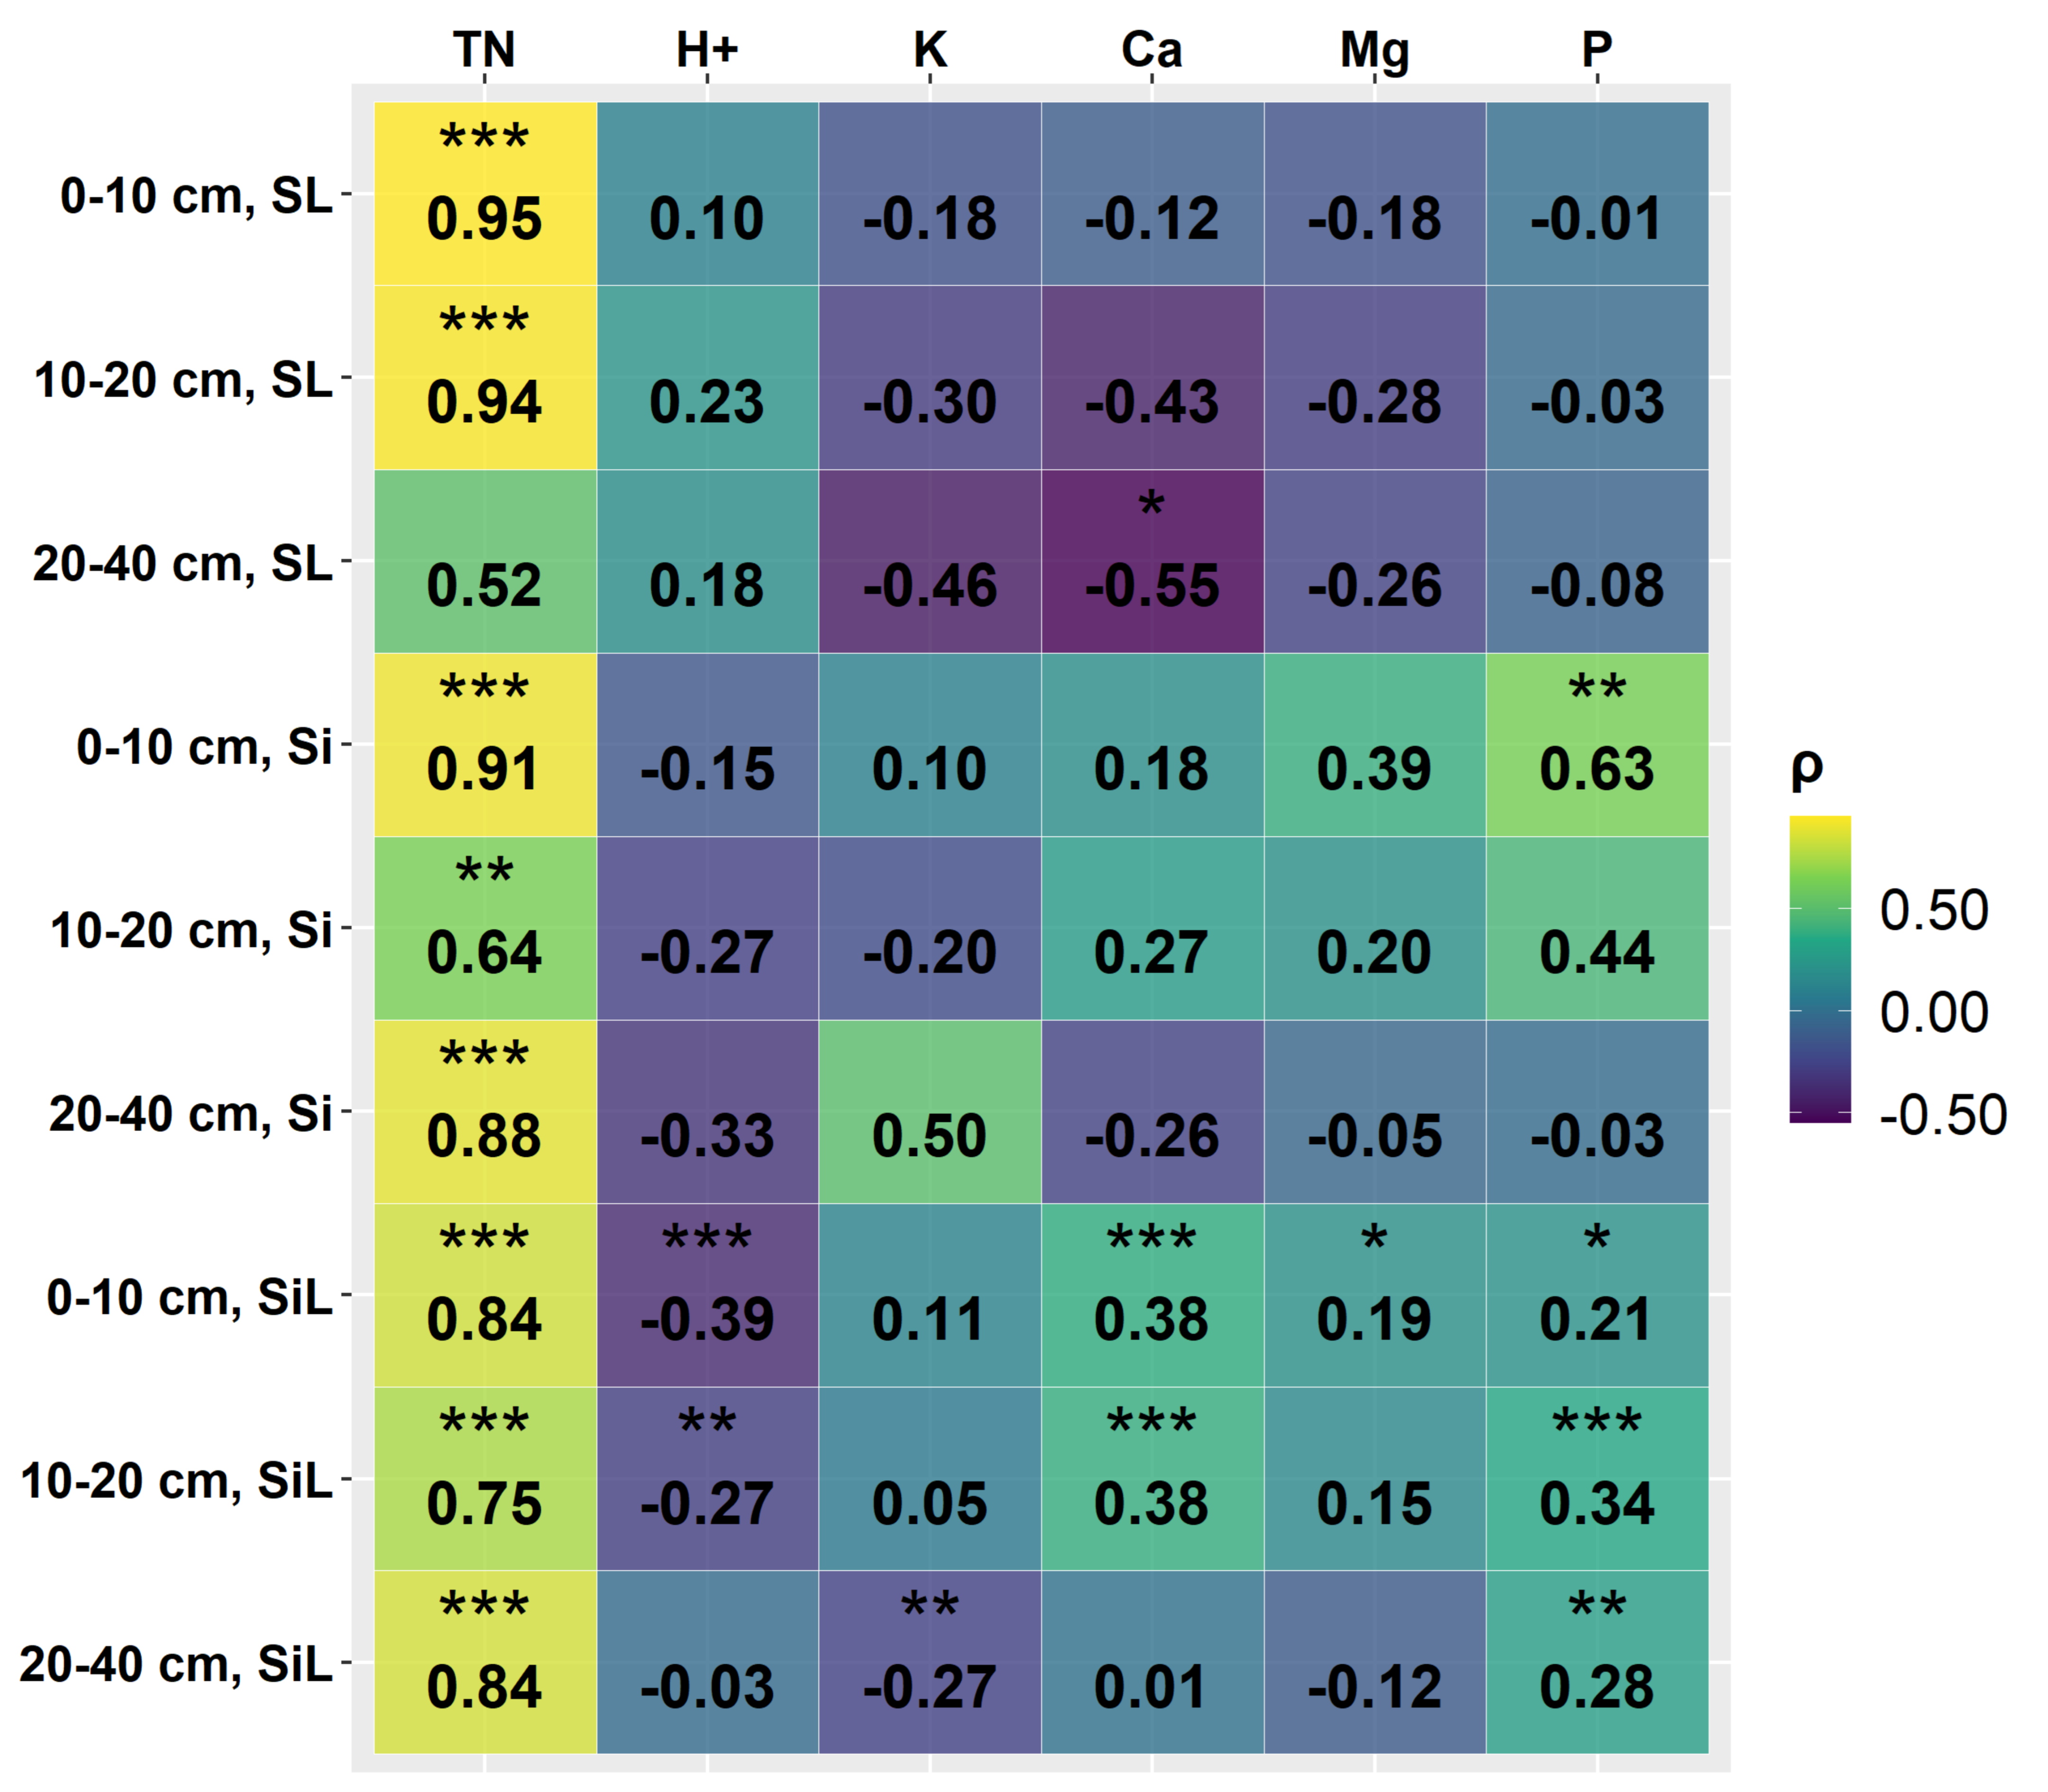
When estimating correlations in cropland study sites, very strong, positive, and statistically significant correlations were found between SOC stock and soil TN content across most soil texture classes, except for sandy loam texture in the 20–40 cm layer and silt texture in the 10–20 cm layer. Positive, strong correlations, also statistically significant, were identified between SOC stock and TN content in the 10–20 cm layer for soils with silt texture. Similarly, significant, positive, and strong correlations were found between SOC stock and soil C/N ratio in the 20–40 cm layer, both for soils with sandy loam and silt textures. Additionally, a significant, positive, and strong correlation was observed between SOC stock and soil P content in the 0–10 cm layer of soils with silt texture. Moreover, significant, positive, and moderate correlations were found between SOC stock and C/N ratio in the 10–20 cm layer, as well as for soils with silt loam texture in the 20–40 cm layer. Significant, positive, and moderate correlations were found between SOC and soil Ca content in the 20–40 cm layer of soils with sandy loam texture, and between SOC stock and soil P content in the 0–10 cm layer for soils with silt texture. Furthermore, a significant, moderate, and negative correlation was found between SOC stock and soil Ca content in the 20–40 cm layer for soils with sandy loam texture. Also, several weak, but statistically significant, correlations have been identified. Spearman correlation coefficients and their significance are shown in Figure 6.
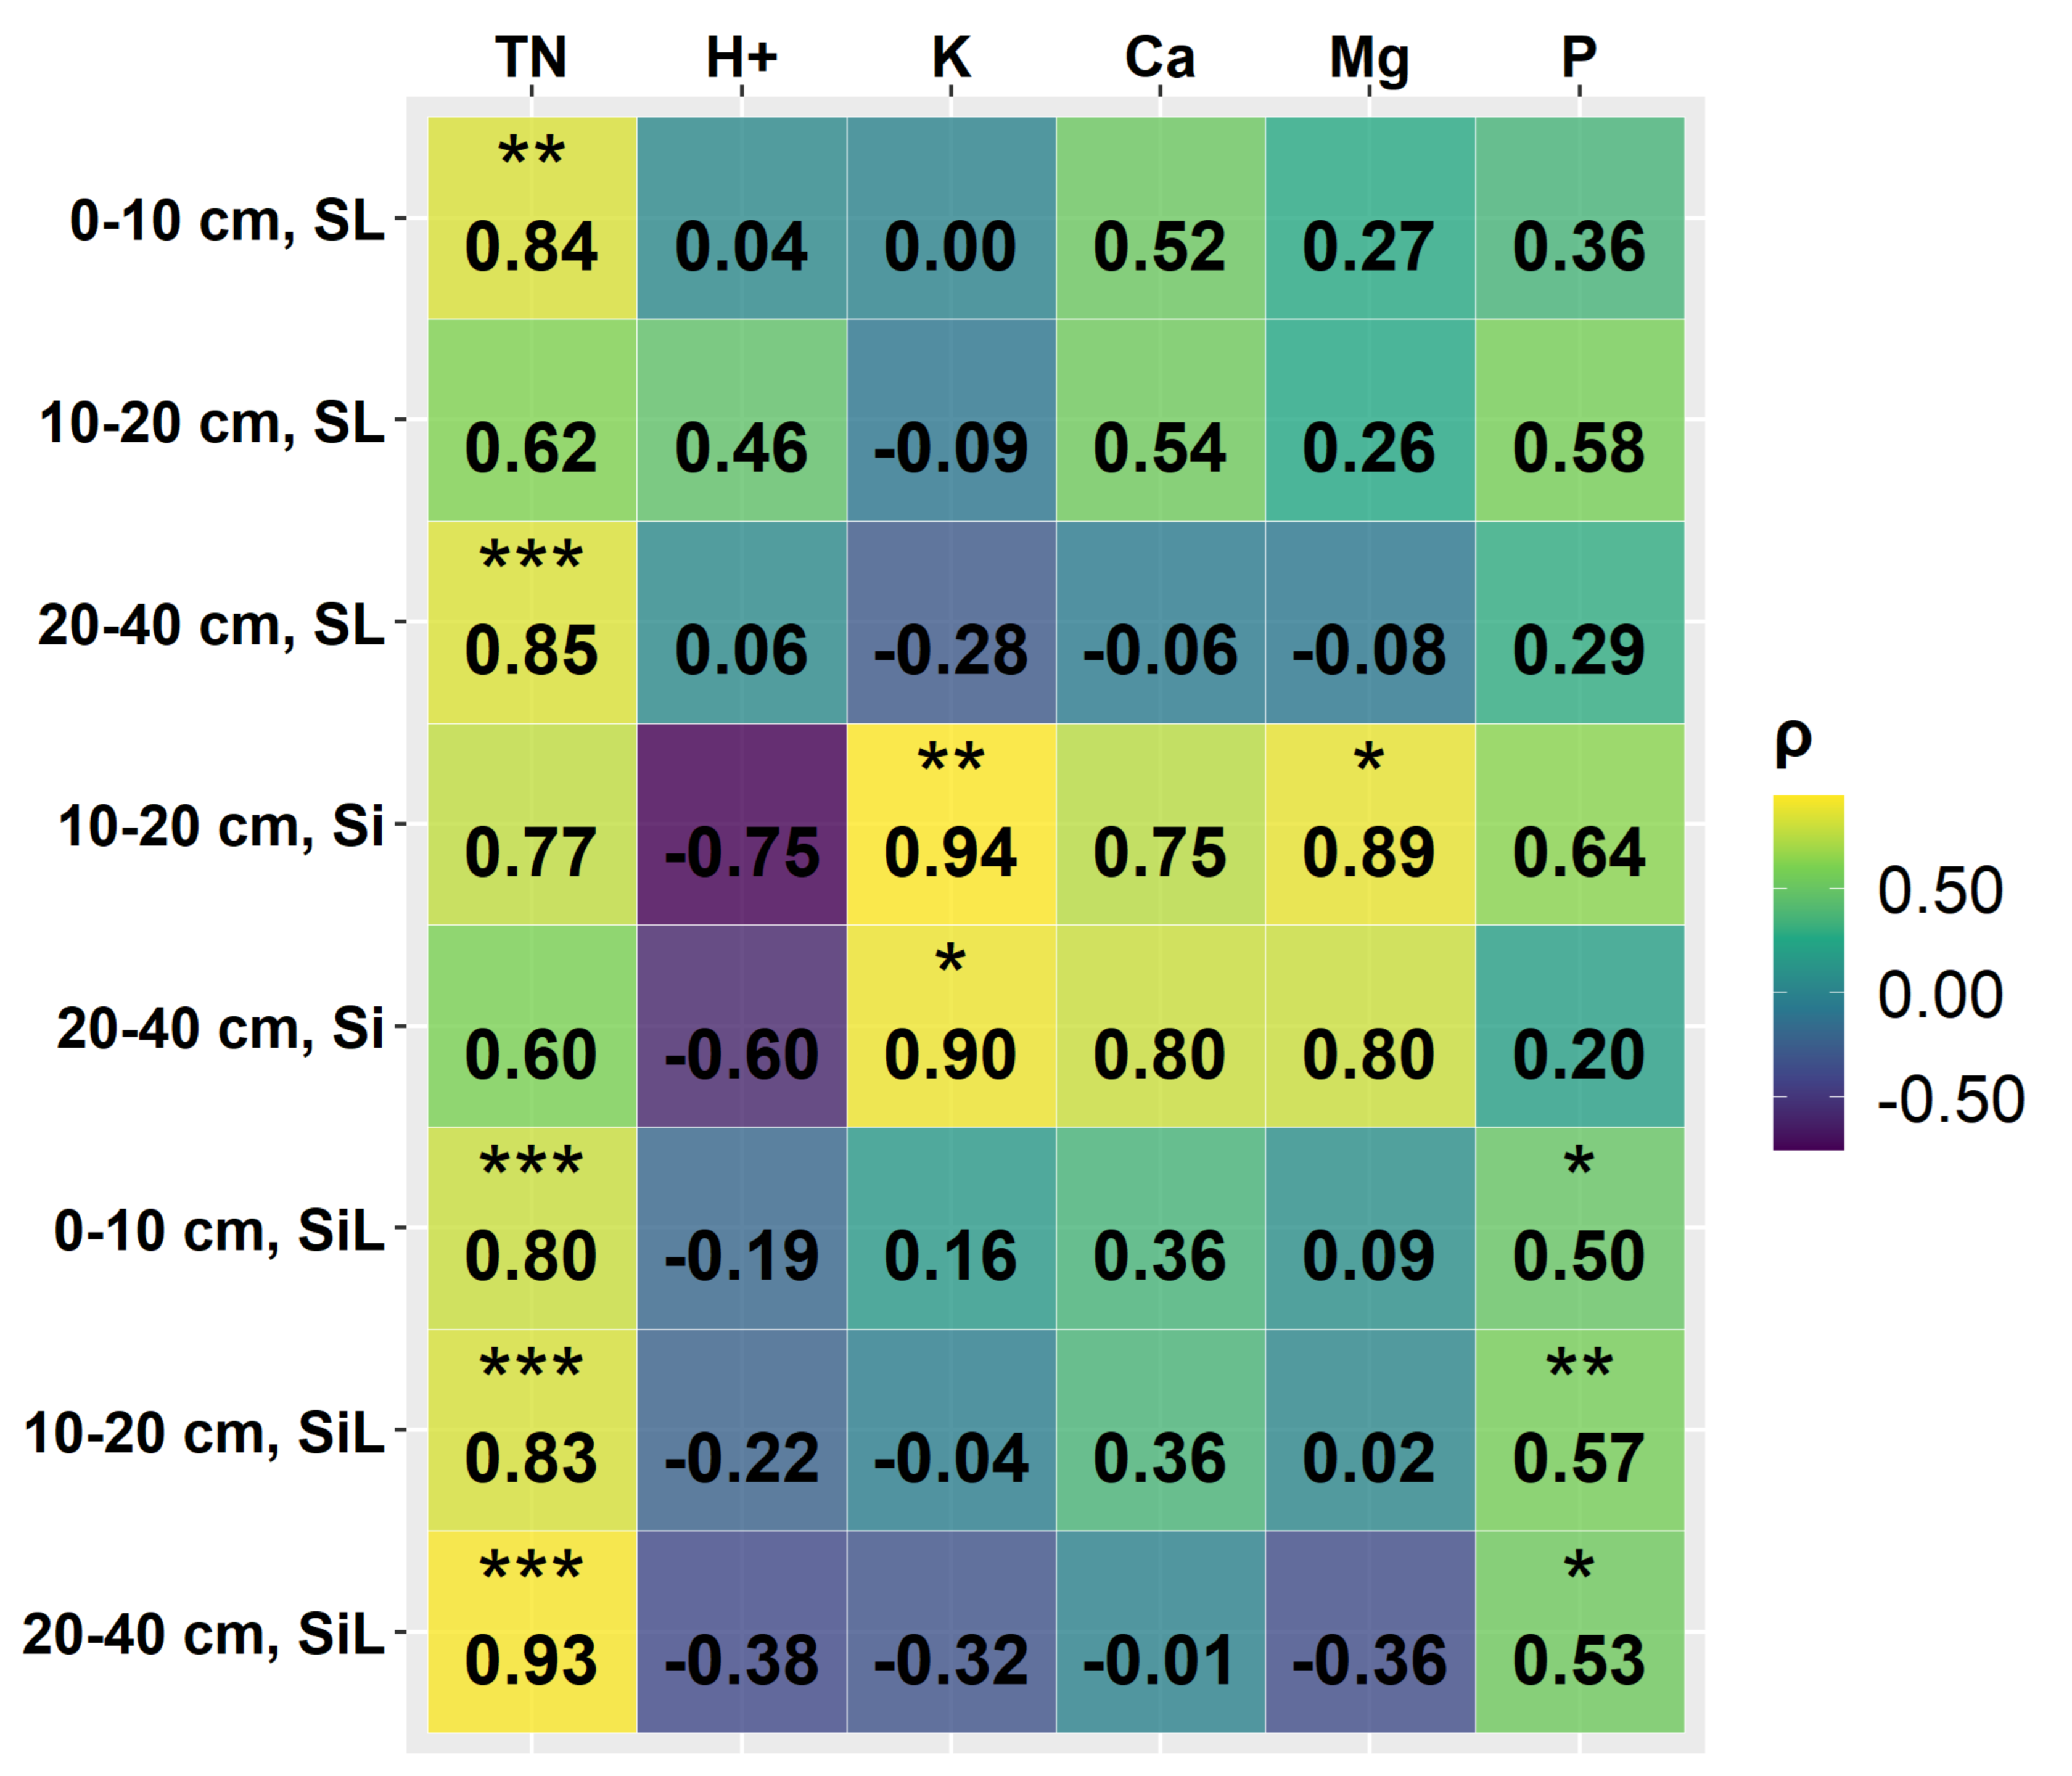
When estimating correlations for grassland study sites, very strong, positive, and statistically significant correlations were found between SOC stock and soil TN content across most soil texture classes, except for soils with sandy loam texture in the 10–20 cm layer and soils with silt texture in the 10–20 cm and 20–40 cm layers. Positive, very strong, and statistically significant correlations were found between SOC stock and soil K content in soils with silt texture in the 10–20 cm and 20–40 cm layers. Additionally, significant correlations were found between SOC stock, soil Mg content in soils with silt texture in the 10–20 cm layer and soil C/N ratio in soils with silt loam texture in the 20–40 cm layer. Significant, positive, and moderate correlations were identified between SOC stock and soil and C/N ratio for soils with silt loam texture in the 10–20 cm layer, as well as between SOC stock and soil P content for soils with silt texture in all the layers. Spearman correlation coefficients and their significance are shown in Figure 7.
4. Discussion
While in this study, the predominant soil group is Phaeozems (53.90% of cropland and 51.16% of grassland sites), some studies estimate that they are not among the prevalent soil groups in agricultural land in Latvia and are mainly present in well-cultivated fields. Luvisols, the second most prevalent soil group in our study (23.38% of cropland and 37.21% of grassland sites) are prevalent in lands of different uses throughout Latvia, including agricultural lands. Other prevalent soil groups in Latvia are Cambisols, Arenosols, Planosols, Stagnosols, and Retisols, while in our study, they represent only 1–5% of study sites; however, our study includes only agricultural land, which constitutes 30% of the total land area [60,61]. Due to the differences in the Latvian and WRB classification systems, it is difficult to precisely estimate the prevalence of each WRB soil group in Latvia.
According to the Land Use and Coverage Area frame Survey (LUCAS) 2018 Soil Module report, the SOC concentration in the 0–20 cm soil layer averaged 18.3 g kg−1 in cropland sites and 40.2 g kg−1 in grassland across Europe, displaying a trend of an increase in concentration from southeastern to northwestern climatic zones. The highest OC content within the soil profile was observed in the boreal to sub-boreal zone for both cropland (55.1 g kg−1) and grassland (75.0 g kg−1) [62]. These values exceed our estimates, particularly in the case of grassland. It is important to note that these results cannot be accurately compared to our findings, as the LUCAS report did not account for different soil groups, and it did not differentiate between organic and mineral soils. A study carried out in Lithuania assessed SOC concentrations in grasslands within Natura 2000 protected areas and agrarian lands covered with grasses. Results showed a consistent decline in SOC concentrations with increasing depth across all treatments. The highest values were found in the 0–10 cm soil layer in the pre-mainland section of the middle reaches of the Nevėžis, Lithuania (76.8 g kg−1) and in old semi-natural pasture (49.5 g kg−1) [63]. However, another Lithuanian study reported differing results, stating that mean SOC concentration in the 0–10 cm soil layer in grasslands ranged from 0.73% in former arable land to 8.31% in the pre-mainland section [64]. A more recent study in Lithuania revealed that SOC concentration and stock in topsoil for most of soil groups was higher in grassland compared to cropland [26]. In the Lithuanian study, the SOC concentrations for the soil groups Luvisols + Retisols, Planosols, Arenosols, and Gleysols are slightly higher than our estimates. In relation to grassland sites, our estimates are lower than the values reported in the Lithuanian study and those for cropland. Additionally, our study did not include representations of Arenosols in the grassland sites. Arenosols are sandy soils and are often unsuitable for agricultural use. The distribution of SOC in the soil profile is not uniform and is influenced by various factors such as the type of vegetation, land use, and other variables like changes in ploughing depth and the application of manure [65]. Around 40% of the total C in the upper meter is concentrated in the topsoil [66]. There is a limited understanding of C dynamics in deeper soil layers, and the factors influencing the vertical distribution of SOC remain poorly elucidated. In our study, SOC concentrations were higher in the 0–20 cm layer, compared to the 20–40 cm layer, which is a well-known tendency for most of mineral soils. Also, an earlier study conducted in Latvia indicated that the majority of soil C is concentrated in the upper 0–20 cm layer. Our SOC concentration values are with the range of their results [27].
According to our results in cropland, the second lowest stock was observed in Arenosols, and the highest in Phaeozems. The lowest stock was observed for Stagnosols; however, it was also the rarest soil group among cropland sites. In the Lithuanian study, the mean SOC stock in the topsoil (0–30 cm) exhibited variations, ranging from 56 t ha−1 in Arenosols to 118 t ha−1 in Cambisols, among mineral forest soils [26]. In the grassland sites of our study, the highest average SOC stock was found for Luvisols, while in the Lithuanian study, in mineral soils of grasslands, the highest average SOC stock was found in Gleysols [26]. As mentioned earlier, the small number of replicates may have affected the results. Our SOC stock estimates for Arenosols, Gleysols, Luvisols, and Retisols in cropland sites are lower than those of the Lithuanian study. In our study, SOC stock for the 0–40 cm layer increases in the following order: Stagnosols, Arenosols, Regosols, Luvisols, Umbrisols, Retisols, Gleysols, Planosols, and Phaeozems. According to the Intergovernmental Panel on Climate Change (IPCC) Guidelines for National Greenhouse Gas Inventories, the SOC stock in the soil at a depth of 0–30 cm in cropland areas may vary. In regions characterized by fertile loam and clay soils where manure is regularly applied, SOC stock could range from 94.4 t ha−1 to 58.7 t ha−1 in areas where manure is not utilized. Similarly, in grassland areas, the SOC stock ranges from 95 to 71 t ha−1 [1]. Our estimates are within the range of the IPCC values, except for the group with the lowest stock value in cropland sites, Stagnosols. When comparing our results to an earlier study carried out in Latvia, in cropland, the average SOC stock was also the lowest for Stagnosols [27]. Compared to this earlier study, our values are similar for Arenosols, Luvisols, and Stagnosols, and lower for the rest of the groups in both cropland and grassland sites. In a study carried out in Estonia, the total SOC stock in grassland was higher than in cropland. The highest SOC stock in the topsoil among mineral soils was found for Gleysols, while the lowest SOC stock was found for Regosols [25].
In our study, soil texture classes characterized by high clay content were notably absent. SOC exhibited variation not only across different textures but also within layers of soils belonging to the same texture class. The highest SOC stocks for both cropland and grassland sites were identified in soils with a silt texture. Additionally, soils with a silt loam texture displayed the second- to third-largest average SOC stocks, despite having the highest clay fraction among the soil texture classes considered in this study. In comparison to a prior study conducted in Latvia, the average SOC stocks in our study were lower [27]. Furthermore, unlike the earlier research, where grassland consistently exhibited higher SOC levels across various texture classes, no such trend was observed in our study. Notably, SOC was significantly higher in cropland for soils with a sandy loam texture, particularly in the 10–20 cm layer. Factors beyond soil texture may have played a role in SOC dynamics in our study, such as land management practices, climate and environmental conditions, vegetation type and productivity, and soil moisture regime.
SOC, TN, and C/N ratio are pivotal factors in maintaining soil fertility, and their values exhibit a close association with the use of fertilizers [67]. When evaluating SOC stock based on both WRB groups and texture classes, a very strong or strong significant correlation between SOC stock and soil TN concentration was found in the majority of cases. Previous studies show that the higher the content of SOC, the greater the soil’s capacity to retain N. Maintaining optimal soil organic matter content is essential for managing soil fertility, particularly in regulating the availability of N. As SOM decomposes, it releases nutrients, including N, thereby enhancing nutrient retention and overall soil fertility [68].
For most soil groups in both cropland and grassland sites, correlations between SOC concentration and stock and H+ in soil were negative. Given that pH is the negative logarithm of H+ concentration, the relationship between soil pH and SOC should be assessed inversely. The factors that could potentially contribute to the observed pattern of higher SOC content in soils with higher pH levels are: optimal microbial activity, neutral to slightly acidic conditions, and organic matter stability in neutral to slightly alkaline conditions; increased cation exchange capacity (CEC) leading to greater retention of SOM; enhanced plant productivity and organic matter input; and pH-mediated mineralization rates favoring SOC accumulation. However, the correlations are weak and mostly not significant. In our study, moderate, statistically significant, negative correlations were observed only between SOC and H+ in grassland sites, specifically within Luvisols in the 0–20 cm layer. Additionally, significant negative correlations were identified between SOC stock and H+ concentration in cropland sites, particularly within Luvisols in the 0–20 cm layer.
On a global scale, there exists a positive correlation between exchangeable Ca, primarily located on clay minerals, and SOC content, especially in soils with a slightly acidic to alkaline pH [69,70]. Soils of the WRB group Phaeozems are within the slightly acidic to neutral range. The conventional explanation for this correlation suggests that soil Ca can diminish the bioavailability of soil SOC and enhance SOC stocks through the promotion of physicochemical interactions between organic compounds and minerals. These interactions include processes such as sorption, co-precipitation, complexation, and occlusion within aggregates [71]. In our study, significant positive correlations were found only in cropland sites, between SOC concentration and Ca concentration for Phaeozems, in the 0–20 cm layer, and between SOC stock and Ca concentration for Phaeozems, in the layers 0–20 cm and 20–40 cm. Regarding grassland sites, only Luvisols and Phaeozems are with the range of IPCC values; however, this could be due to high data variation and the small number of replicates for other groups.
P, along with N and K, is a vital plant nutrient, playing a central role in the C cycle within terrestrial ecosystems [72]. SOM plays a crucial role in controlling soil P dynamics and facilitating the production of phytoavailable P. Nevertheless, explanations for soil P dynamics frequently emphasize the influence of factors such as soil pH, clay content, and elemental compositions like Ca, iron, and aluminum. A substantial quantity of P is known to be stored within SOM. For instance, the storage of 1000 kg of SOC sequesters approximately 13 kg of P in the topsoil and around 22 kg of P in the subsoil of croplands [73]. In our study, the correlations between SOC stock and soil P concentration were mostly positive and weak; however, in some cases, for cropland sites, these correlations were statistically significant. Regarding SOC concentration, a very strong, negative correlation between this measure and P concentration was observed for Gleysols in the 20–40 cm layer. In this soil group and layer, also significant, negative, strong correlations between SOC concentration and K and Mg concentrations were observed. The observed correlations could be related to clay content in Gleysols. Clay minerals have a significant influence on soil nutrient dynamics due to their high surface area and cation exchange capacity, reducing the availability of nutrients like K and Mg for plant uptake. Also, Gleysols often have poor drainage and waterlogging, which can affect nutrient dynamics. Waterlogged conditions can exacerbate nutrient leaching, especially in soils with high clay content, leading to reduced concentrations of K and Mg in the soil solution and negative correlations with SOC. A moderate significant correlation was observed for cropland sites, in Luvisols in the 20–40 cm layer, between SOC concentration and P concentration. A study conducted in Sweden indicates that fine-textured soils contain higher concentrations of organic P compared to coarse-textured soils. In our study, in soils with silt loam texture, there were significant positive correlations between SOC stock and soil P concentration in all the layers [74]. However, the correlations were only moderate in grassland sites, while in cropland sites, the correlations were weak. Cropland and grassland sites undergo different management practices; therefore, soil P dynamics can differ. Cropland soils normally experience more frequent tillage, pesticide application, and fertilizer use, which could affect the retention and cycling of P in the soil. Also, the clay content in soils with silt loam texture is still low, and only higher than that of soils with silt texture [44].
The average SOC stock in the 0–40 cm soil layer in cropland, without considering soil group, amounted to 82.78 t ha−1, while in grassland, it was 76.95 t ha−1. Although cropland soils are subjected to SOC losses resulting from soil disruption through tillage, other practices, such as the application of organic and mineral fertilizers, can enhance SOC stocks and the protection of SOC [27,73,74]. The potential explanation for higher SOC stocks in Phaozems—the dominant major WRB soil group of our study—could be agricultural practices that enhance SOC retention.
5. Conclusions
Our results indicate that for Phaeozems, the dominant major WRB soil group in this study (53.3% of all the surveyed sites), the average concentration and stock of SOC were higher in cropland sites compared to grassland sites. Although the difference was not statistically significant, the higher SOC stock in cropland could possibly indicate that appropriate management practices such as crop rotation, intercropping, and manure application have been implemented to compensate for the SOC losses. However, due to the low occurrence of soil groups other than Phaeozems in the study sites, the obtained SOC concentration and stock values for these soil groups may be considered inconclusive and require further investigation in future studies.
Author Contributions
Conceptualization, G.P. and I.L.; methodology, G.P.; software, G.P.; validation, Z.A.Z. and D.P.; formal analysis, D.P.; investigation, E.M.U. and I.I.; resources, A.L.; data curation, E.M.U.; writing—original draft preparation, G.P.; writing—review and editing, I.I. and G.P.; visualization, G.P.; supervision, I.L.; project administration, I.L.; funding acquisition, A.L. All authors have read and agreed to the published version of the manuscript.
Funding
This research was funded by the Norwegian Financial Mechanism for 2014–2021, grant number 2021/6e-JP/SAD (ZM Nr.2021/20). The APC was funded by the Latvian State Forest Research Institute ‘Silava’.
Data Availability Statement
Data are available upon request made to the corresponding author, Guna Petaja.
Acknowledgments
The contributions of E.U., A.L., Z.Z., D.P., and G.P. were supported by the European Regional Development Fund project “Evaluation of factors affecting greenhouse gas (GHG) emissions reduction potential in cropland and grassland with organic soils” (No. 1.1.1.1/21/A/031). The contribution of I.L. was supported by the EU LIFE Programme project “Demonstration of climate change mitigation potential of nutrient rich organic soils in Baltic States and Finland” (LIFE OrgBalt, LIFE18 CCM/LV/001158). Authors are grateful to the Laboratory of forest environment for the contribution.
Conflicts of Interest
The authors declare no conflicts of interest.
References
- IPCC. Global warming of 1.5 °C. In An IPCC Special Report on the Impacts of Global Warming of 1.5 °C above Pre-Industrial Levels and Related Global Greenhouse Gas Emission Pathways, in the Context of Strengthening the Global Response to the Threat of Climate Change, Sustainable Development, and Efforts to Eradicate Poverty; Masson-Delmotte, V., Zhai, P., Pörtner, H.-O., Roberts, D., Skea, J., Shukla, P.R., Pirani, A., Moufouma-Okia, W., Péan, C., Pidcock, R., et al., Eds.; IPCC: Geneva, Switzerland, 2018. [Google Scholar]
- De Rosa, D.; Ballabio, C.; Lugato, E.; Jones, A.; Panagos, P. Soil organic carbon stocks in European croplands and grasslands: How much have we lost in the past decade? Glob. Chang. Biol. 2023, 30, e16992. [Google Scholar] [CrossRef] [PubMed]
- Rodrigues, L.; Hardy, B.; Huyghebeart, B.; Fohrafellner, J.; Fornara, D.; Barančíková, G.; Bárcena, T.G.; De Boever, M.; Di Bene, C.; Feizienė, D.; et al. Achievable agricultural soil carbon sequestration across Europe from country-specific estimates. Glob. Chang. Biol. 2021, 27, 6363–6380. [Google Scholar] [CrossRef] [PubMed]
- Lal, R. Soil carbon sequestration to mitigate climate change. Geoderma 2004, 123, 1–22. [Google Scholar] [CrossRef]
- Zhao, F.; Wu, Y.; Hui, J.; Sivakumar, B.; Meng, X.; Liu, S. Projected soil organic carbon loss in response to climate warming and soil water content in a loess watershed. Carbon Balance Manag. 2021, 16, 24. [Google Scholar] [CrossRef] [PubMed]
- Lal, R. Beyond COP 21: Potential and challenges of the “4 per Thousand” initiative. J. Soil Water Conserv. 2016, 71, 20A–25A. [Google Scholar] [CrossRef]
- Spohn, M.; Braun, S.; Sierra, C.A. Continuous decrease in soil organic matter despite increased plant productivity in an 80-years-old phosphorus-addition experiment. Commun. Earth Environ. 2023, 4, 251. [Google Scholar] [CrossRef]
- Bellamy, P.H.; Loveland, P.J.; Bradley, R.I.; Lark, R.M.; Kirk, G.J.D. Carbon losses from all soils across England and Wales 1978–2003. Nature 2005, 437, 245–248. [Google Scholar] [CrossRef] [PubMed]
- Heikkinen, J.; Keskinen, R.; Kostensalo, J.; Nuutinen, V. Climate change induces carbon loss of arable mineral soils in boreal conditions. Glob. Chang. Biol. 2023, 28, 3960–3973. [Google Scholar] [CrossRef]
- Keel, S.G.; Anken, T.; Büchi, L.; Chervet, A.; Fliessbach, A.; Flisch, R.; Huguenin-Elie, O.; Mäder, P.; Mayer, J.; Sinaj, S.; et al. Loss of soil organic carbon in Swiss long-term agricultural experiments over a wide range of management practices. Agric. Ecosyst. Environ. 2019, 286, 106654. [Google Scholar] [CrossRef]
- Baveye, P.C.; Schnee, L.S.; Boivin, P.; Laba, M.; Radulovich, R. Soil organic matter research and climate change: Merely re-storing carbon versus restoring soil functions. Front. Environ. Sci. 2020, 8, 579904. [Google Scholar] [CrossRef]
- Lal, R. Digging deeper: A holistic perspective of factors affecting soil organic carbon sequestration in agroecosystems. Glob. Chang. Biol. 2018, 24, 3285–3301. [Google Scholar] [CrossRef] [PubMed]
- EU NIR. Annual European Union Greenhouse Gas Inventory 1990–2019 and Inventory Report 2021 (National Inventory Reports (NIR)); European Commission, DG Climate Action European Environment Agency: Copenhagen, Denmark, 2021. [Google Scholar]
- McGrath, M.J.; Petrescu, A.M.R.; Peylin, P.; Andrew, R.M.; Matthews, B.; Dentener, F.; Balkovič, J.; Bastrikov, V.; Becker, M.; Broquet, G.; et al. The consolidated European synthesis of CO2 emissions and removals for EU27 and UK: 1990–2020. Earth Syst. Sci. Data Discuss. 2023, 15, 4295–4370. [Google Scholar] [CrossRef]
- European Commission. (2021, November 17). EU Soil Strategy for 2030: Reaping the Benefits of Healthy Soils for People, Food, Nature and Climate (Communication No. COM(2021) 699 Final; SWD(2021) 323 Final). Available online: https://eur-lex.europa.eu/legal-content/EN/TXT/PDF/?uri=CELEX:52021DC0699 (accessed on 17 January 2024).
- Lal, R.; Monger, C.; Nave, L.; Smith, P. The role of soil in regulation of climate. Philos. Trans. R. Soc. Lond B Biol. Sci. 2021, 376, 20210084. [Google Scholar] [CrossRef]
- Sommer, R.; Bossio, D. Dynamics and climate change mitigation potential of soil organic carbon sequestration. J. Environ. Manag. 2014, 144, 83–87. [Google Scholar] [CrossRef]
- Davidson, E.A.; Janssens, I.A. Temperature sensitivity of soil carbon decomposition and feedbacks to climate change. Nature 2006, 440, 165–173. [Google Scholar] [CrossRef]
- Jackson, R.B.; Lajtha, K.; Crow, S.E.; Hugelius, G.; Kramer, M.G.; Piñeiro, G. The 811 Ecology of Soil Carbon: Pools, Vulnerabilities, and Biotic and Abiotic Controls. Annu. Rev. Ecol. Evol. Syst. 2017, 48, 419–445. [Google Scholar] [CrossRef]
- IUSS Working Group WRB. World Reference Base for Soil Resources. International Soil Classification System for Naming Soils and Creating Legends for Soil Maps, 4th ed.; International Union of Soil Sciences (IUSS): Vienna, Austria, 2022. [Google Scholar]
- ISRIC. Umbrisols. Available online: https://www.isric.org/sites/default/files/major_soils_of_the_world/set9/um/umbrisol.pdf (accessed on 22 March 2024).
- Mayer, M.; Prescott, C.E.; Abaker, W.E.A.; Augusto, L.; Cécillon, L.; Ferreira, G.W.D.; James, J.; Jandl, R.; Katzensteiner, K.; Laclau, J.-P.; et al. Tamm Review: Influence of forest management activities on soil organic carbon stocks: A knowledge synthesis. For. Ecol. Manag. 2020, 466, 118127. [Google Scholar] [CrossRef]
- Wiesmeier, M.; Prietzel, J.; Barthold, F.; Spörlein, P.; Geuß, U.; Hangen, E.; Reischl, A.; Schilling, B.; von Lützow, M.; Kögel-Knabner, I. Storage and drivers of organic carbon in forest soils of southeast Germany (Bavaria)—Implications for carbon sequestration. For. Ecol. Manag. 2013, 295, 162–172. [Google Scholar] [CrossRef]
- Wiesmeier, M.; Urbanski, L.; Hobley, E.; Lang, B.; von Lützow, M.; Marin-Spiotta, E.; van Wesemael, B.; Rabot, E.; Ließ, M.; Garcia-Franco, N.; et al. Soil organic carbon storage as a key function of soils—A review of drivers and indicators at various scales. Geoderma 2019, 333, 149–162. [Google Scholar] [CrossRef]
- Kõlli, R.; Ellermaee, O.; Köster, T.; Lemetti, I.; Asi, E.; Kauer, K. Stocks of organic carbon in Estonian soils. Est. J. Earth Sci. 2009, 58, 95–108. [Google Scholar]
- Armolaitis, K.; Varnagirytė-Kabašinskienė, I.; Žemaitis, P.; Stakėnas, V.; Beniušis, R.; Kulbokas, G.; Urbaitis, G. Evaluation of organic carbon stocks in mineral and organic soils in Lithuania. Soil Use Manag. 2022, 38, 355–368. [Google Scholar] [CrossRef]
- Bardule, A.; Lupikis, A.; Butlers, A.; Lazdins, A. Organic carbon stock in different types of mineral soils in cropland and grassland in Latvia. Zemdirbyste 2017, 104, 3–8. [Google Scholar] [CrossRef]
- Sanderman, J.; Hengl, T.; Fiske, G.J. Soil carbon debt of 12,000 years of human land use. Proc. Natl. Acad. Sci. USA 2017, 114, 9575–9580. [Google Scholar] [CrossRef]
- Guillaume, T.; Bragazza, L.; Levasseur, C.; Libohova, Z.; Sinaj, S. Long-term soil organic carbon dynamics in temperate cropland-grassland systems. Agric. Ecosyst. Environ. 2021, 305, 107184. [Google Scholar]
- Soussana, J.F.; Allard, V.; Pilegaard, K.; Ambus, P.; Amman, C.; Campbell, C.; Ceschia, E.; Clifton-Brown, J.; Czobel, S.; Domingues, R.; et al. Full accounting of the greenhouse gas (CO2, N2O, CH4) budget of nine European grassland sites. Agric. Ecosyst. Environ. 2007, 121, 121–134. [Google Scholar] [CrossRef]
- Poeplau, C.; Don, A. Carbon sequestration in agricultural soils via cultivation of cover crops—A meta-analysis. Agric. Ecosyst. Environ. 2015, 200, 33–41. [Google Scholar] [CrossRef]
- Van Oost, K.; Quine, T.A.; Govers, G.; De Gryze, S.; Six, J.; Harden, J.W.; Ritchie, J.C.; McCarty, G.W.; Heckrath, G.; Kosmas, C.; et al. The impact of agricultural soil erosion on the global carbon cycle. Science 2007, 318, 626–629. [Google Scholar] [CrossRef] [PubMed]
- Colombi, T.; Walder, F.; Büchi, L.; Sommer, M.; Liu, K.; Six, J.; Van der Heijden, M.; Charles, R.; Keller, T. Organic carbon content in arable soil-aeration matters. SOIL Discuss. 2018. [Google Scholar] [CrossRef]
- Reynolds, W.D.; Drury, C.F.; Yang, X.M.; Tan, C.S. Optimal soil physical quality inferred through structural regression and parameter interactions. Geoderma 2018, 146, 466–474. [Google Scholar] [CrossRef]
- Khan, A.R. Influence of Tillage on Soil Aeration. J. Agron. Crop Sci. 2008, 177, 253–259. [Google Scholar] [CrossRef]
- Haddaway, N.R.; Hedlund, K.; Jackson, L.E.; Katterer, T.; Lugato, E.; Thomsen, I.K.; Jørgensen, H.B.; Isberg, P.E. How does tillage intensity affect soil organic carbon? A systematic review. Environ. Evid. 2017, 6, 30. [Google Scholar] [CrossRef]
- Powlson, D.S.; Stirling, C.M.; Jat, M.L.; Gerard, B.G.; Palm, C.A.; Sanchez, P.A.; Cassman, K.G. Limited potential of no-till agriculture for climate change mitigation. Nat. Clim. Chang. 2014, 4, 678–683. [Google Scholar] [CrossRef]
- Krauss, M.; Wiesmeier, M.; Don, A.; Cuperus, F.; Gattinger, A.; Gruber, S.; Haagsma, W.K.; Peigné, J.; Chiodelli Palazzoli, M.; Schulz, F.; et al. Reduced tillage in organic farming affects soil organic carbon stocks in temperate Europe. Soil Tillage Res. 2022, 216, 105262. [Google Scholar] [CrossRef]
- Stewart, C.E.; Paustian, K.; Conant, R.T.; Plante, A.F.; Six, J. Soil carbon saturation: Concept, evidence and evaluation. Biogeochemistry 2007, 86, 19–31. [Google Scholar] [CrossRef]
- Gocke, M.I.; Guigue, J.; Bauke, S.L.; Barkusky, D.; Baumecker, M.; Berns, A.E.; Hobley, E.; Honermeier, B.; Kögel-Knabner, I.; Koszinski, S.; et al. Interactive effects of agricultural management on soil organic carbon accrual: A synthesis of long-term field experiments in Germany. Geoderma 2023, 438, 116616. [Google Scholar] [CrossRef]
- Chung, H.; Grove, J.H.; Six, J. Indications for soil carbon saturation in a temperate agroecosystem. Soil Sci. Soc. Am. J. 2008, 72, 1132–1139. [Google Scholar] [CrossRef]
- Van Eerd, L.L.; Chahal, I.; Peng, Y.; Awrey, J. Influence of cover crops at the four spheres: A review of ecosystem services, potential barriers, and future directions for North America. Sci. Total Environ. 2023, 858, 159990. [Google Scholar] [CrossRef]
- Kaye, J.P.; Quemada, M. Using cover crops to mitigate and adapt to climate change: A review. Agron. Sustain. Dev. 2017, 37, 4. [Google Scholar] [CrossRef]
- Osman, K.T. Physical Properties of Soil. In Soils; Springer: Dordrecht, The Netherlands, 2013. [Google Scholar]
- Schweizer, S.A.; Mueller, C.W.; Höschen, C.; Ivanov, P.; Kögel-Knabner, I. The role of clay content and mineral surface area for soil organic carbon storage in an arable toposequence. Biogeochemistry 2021, 156, 401–420. [Google Scholar] [CrossRef]
- Jolivet, C.; Arrouays, D.; Lévêque, J.; Andreux, F.; Chenu, C. Organic carbon dynamics in soil particle-size separates of sandy Spodosols when forest is cleared for maize cropping. Eur. J. Soil Sci. 2003, 54, 257–268. [Google Scholar] [CrossRef]
- Tan, Z.X.; Lal, R.; Smeck, N.E.; Calhoun, F.G. Relationships between surface soil organic carbon pool and site variables. Geoderma 2004, 121, 187–195. [Google Scholar] [CrossRef]
- Johannes, A.; Matter, A.; Schulin, R.; Weisskopf, P.; Baveye, P.C.; Boivin, P. Optimal organic carbon values for soil structure quality of arable soils. Does clay content matter? Geoderma 2017, 302, 14–21. [Google Scholar] [CrossRef]
- Krull, E.; Baldock, J.; Skjemstad, J. Importance of mechanisms and processes of the stabilisation of soil organic matter for modelling carbon turnover. Funct. Plant Biol. 2003, 30, 207–222. [Google Scholar] [CrossRef] [PubMed]
- Giardina, C.P.; Ryan, M.G.; Hubbard, R.M.; Binkley, D. Tree species and soil textural controls on carbon and nitrogen mineralization rates. Soil Sci. Soc. Am. J. 2001, 65, 1272–1279. [Google Scholar] [CrossRef]
- Nichols, J.D. Relation of organic carbon to soil properties and climate in the Southern Great Plains. Soil Sci. Soc. Am. J. 1984, 48, 1382–1384. [Google Scholar] [CrossRef]
- Latvian Environment, Geology and Meteorology Centre. Climate Portal. Available online: https://klimats.meteo.lv/klimats/latvijas_klimats/ (accessed on 19 January 2024).
- Food and Agriculture Organization. Guidelines for Soil Description; Food and Agriculture Organization of the United Nations: Rome, Italy, 2006; 97p. [Google Scholar]
- ISO 13320:2020; Particle Size Analysis. Laser Diffraction Methods. International Organization for Standardization (ISO): Geneva, Switzerland, 2020.
- LVS EN ISO 10390:2022; Soil, Treated Biowaste and Sludge–Determination of pH (ISO 10390:2021). Latvian Standards: Riga, Latvia, 2022.
- LVS ISO 10694:2006; Soil Quality–Determination of Organic and Total Carbon after Dry Combustion (Elementary Analysis). Latvian Standards: Riga, Latvia, 2006.
- ISO 11261:1995; Soil Quality. Determination of Total Nitrogen. Modified Kjeldahl Method. International Organization for Stan-dardization (ISO): Geneva, Switzerland, 1995.
- LVS ISO 10693:2014; Soil Quality–Determination of Carbonate Content—Volumetric Method (ISO 10693:1995). Latvian Standards: Riga, Latvia, 2014.
- LVS ISO 11272:2017; Soil Quality—Determination of Dry Bulk Denssity. Latvian Standards: Riga, Latvia, 2017.
- Latvija Zeme Daba Tauta Valsts; Nikodemus, O.; Kļaviņš, M.; Krišjāne, Z.; Zelčs, V. (Eds.) Latvijas Universitātes Akadēmiskais Apgāds: Rīga, Latvia, 2018; 752p. [Google Scholar]
- Oļģerts Nikodemus “Latvijas Augsnes”. Nacionālā Enciklopēdija. Available online: https://enciklopedija.lv/skirklis/26023-Latvijas-augsnes (accessed on 21 March 2024).
- Fernandez-Ugalde, O.; Scarpa, S.; Orgiazzi, A.; Panagos, P.; Van Liedekerke, M.; Marechal, A.; Jones, A. LUCAS 2018 Soil Module. Presentation of Dataset and Results; EUR 31144 EN; Publications Office of the European Union: Luxembourg, 2022; ISBN 978-92-76-54832-4. [Google Scholar]
- Liaudanskienė, I.; Šlepetienė, A.; Šlepetys, J.; Stukonis, V. Evaluation of soil organic carbon stability in grasslands of protected areas and arable lands applying chemo-destructive fractionation. Zemdirbyste 2013, 100, 339–348. [Google Scholar] [CrossRef]
- Šlepetienė, A.; Liaudanskienė, I.; Šlepetys, J.; Stukonis, V.; Jokubauskaitė, I. Soil carbon, nitrogen and phosphorus distribution in grassland systems, important for landscape and environment. J. Environ. Eng. Landsc. Manag. 2013, 21, 263–272. [Google Scholar] [CrossRef]
- Meersmans, J.; van Wesemael, B.; Goidts, E.; Van Molle, M.; De Baets, S.; De Ridder, F. Spatial analysis of soil organic carbon evolution in Belgian croplands and grasslands, 1960–2006. Glob. Chang. Biol. 2011, 17, 466–479. [Google Scholar] [CrossRef]
- Baisden, W.T.; Parfitt, R.L. Bomb 14C enrichment indicates decadal C pool in deep soil? Biogeochemistry 2007, 85, 59–68. [Google Scholar] [CrossRef]
- Li, C.; Aluko, O.O.; Yuan, G.; Li, J.; Liu, H. The responses of soil organic carbon and total nitrogen to chemical nitrogen fertilizers reduction base on a meta-analysis. Sci. Rep. 2022, 12, 16326. [Google Scholar] [CrossRef]
- Wibowo, H.; Kasno, A. Soil organic carbon and total nitrogen dynamics in paddy soils on the Java Island, Indonesia. IOP Conf. Ser. Earth Environ. Sci. 2021, 648, 012192. [Google Scholar] [CrossRef]
- Wang, T.; Flint, S.; Palmer, J. Magnesium and calcium ions: Roles in bacterial cell attachment and biofilm structure maturation. Biofouling 2019, 35, 959–974. [Google Scholar] [CrossRef] [PubMed]
- Shabtai, I.A.; Wilhelm, R.C.; Schweizer, S.A.; Höschen, C.; Buckley, D.H.; Lehmann, J. Calcium promotes persistent soil organic matter by altering microbial transformation of plant litter. Nat. Commun. 2023, 14, 6609. [Google Scholar] [CrossRef] [PubMed]
- Rasmussen, C.; Heckman, K.; Wieder, W.R.; Keiluweit, M.; Lawrence, C.R.; Berhe, A.A.; Blankinship, J.C.; Crow, S.E.; Druhan, J.L.; Hicks Pries, C.E.; et al. Beyond clay: Towards an improved set of variables for predicting soil organic matter content. Biogeochemistry 2018, 137, 297–306. [Google Scholar] [CrossRef]
- Tiessen, H.; Stewart, J.W.B.; Cole, C.V. Pathways of phosphorus transformations in soils of differing pedogénesis. Soil Sci. Soc. Am. J. 1984, 48, 853–858. [Google Scholar] [CrossRef]
- Spohn, M. Increasing the organic carbon stocks in mineral soils sequesters large amounts of phosphorus. Glob. Chang. Biol. 2020, 26, 4169–4177. [Google Scholar] [CrossRef]
- Spohn, M.; Stendahl, J. Carbon, nitrogen, and phosphorus stoichiometry of organic matter in Swedish forest soils and its relationship with climate, tree species, and soil texture. Biogeosciences 2022, 19, 2171–2186. [Google Scholar] [CrossRef]
Figure 1.
Distribution of study sites in cropland and grassland across Latvia.

Figure 2.
Spearman correlation coefficients (ρ) between SOC concentrations and other soil chemical parameters in study sites in cropland. Significance levels are indicated with asterisks (*: 0.01 ≤ p < 0.05, **: 0.001 ≤ p < 0.01, ***: p < 0.001). The color gradient illustrates correlations, with a transition from the strongest positive (yellow) to the strongest negative (purple).

Figure 3.
Spearman correlation coefficients (ρ) between SOC concentrations and other soil chemical parameters in study sites in grassland. Significance levels are indicated with asterisks (*: 0.01 ≤ p < 0.05, **: 0.001 ≤ p < 0.01, ***: p < 0.001). The color gradient illustrates correlations, with a transition from the strongest positive (yellow) to the strongest negative (purple).

Figure 4.
Spearman correlation coefficients (ρ) between SOC stock and other soil chemical parameters in different WRB groups and soil layers in study sites in cropland. Significance levels are indicated with asterisks (*: 0.01 ≤ p < 0.05, **: 0.001 ≤ p < 0.01, ***: p < 0.001). The color gradient illustrates correlations, with a transition from the strongest positive (yellow) to the strongest negative (purple).

Figure 5.
Spearman correlation coefficients (ρ) between SOC stock and other soil chemical parameters in study sites in grassland. Significance levels are indicated with asterisks (*: 0.01 ≤ p < 0.05, ***: p < 0.001). The color gradient illustrates correlations, with a transition from the strongest positive (yellow) to the strongest negative (purple).

Figure 6.
Spearman correlation coefficients (ρ) between SOC stock and other soil chemical parameters stratified by soil texture groups and soil layers in study sites in cropland. Significance levels are indicated with asterisks (*: 0.01 ≤ p < 0.05, **: 0.001 ≤ p < 0.01, ***: p < 0.001). The color gradient illustrates correlations, with a transition from the strongest positive (yellow) to the strongest negative (purple).

Figure 7.
Spearman correlation coefficients (ρ) between SOC stock and other soil chemical parameters stratified by soil texture groups and soil layers in study sites in grassland. Significance levels are indicated with asterisks (*: 0.01 ≤ p < 0.05, **: 0.001 ≤ p < 0.01, ***: p < 0.001). The color gradient illustrates correlations, with a transition from the strongest positive (yellow) to the strongest negative (purple).


Table 1.
Occurrence of each WRB soil group in the study sites in cropland and grassland.
| WRB Soil Group | USDA Soil Taxonomy Unit | Occurrence in the Study Sites, % | ||
|---|---|---|---|---|
| Cropland (n = 152) | Grassland (n = 45) | Overall Distribution (n = 197) | ||
| Arenosols | Entisols | 1.30% | - | 1.02% |
| Gleysols | Entisols, Inceptisols, Mollisols | 3.25% | 2.33% | 3.05% |
| Luvisols | Alfisols | 23.38% | 37.21% | 26.40% |
| Phaeozems | Udolls (Mollisols) | 53.90% | 51.16% | 53.30% |
| Planosols | Alfisols-Abruptic Albaqualf pp. | 1.30% | 2.33% | 1.52% |
| Regosols | Entisols | 2.60% | - | 2.03% |
| Retisols | Entisols | 5.84% | 2.33% | 5.08% |
| Stagnosols | the wet suborders of Alfisols, Utisols, Entisols, Inceptisols, Mollisols | 0.65% | 2.33% | 1.02% |
| Umbrisols | Inceptisols | 5.84% | 2.33% | 5.08% |
Table 2.
Descriptive statistics of SOC concentration across various WRB soil groups and depths in cropland.
Table 2.
Descriptive statistics of SOC concentration across various WRB soil groups and depths in cropland.
| WRB Soil Groups | SOC Concentration (g kg−1) | ||||||||
|---|---|---|---|---|---|---|---|---|---|
| 0–10 cm | 0–20 cm | 20–40 cm | |||||||
| Mean ± SEM | Median | Min–Max | Mean ± SEM | Median | Min–Max | Mean ± SEM | Median | Min–Max | |
| Arenosols | 12.85 ± 1.55 | 12.85 | 11.30–14.40 | 10.73 ± 2.07 | 10.73 | 8.65–12.8 | 6.95 ± 0.15 | 6.95 | 6.8–7.10 |
| Gleysols | 20.48 ± 6.32 | 15.70 | 9.00–45.00 | 19.38 ± 6.02 | 14.15 | 8.5–42.6 | 8.64 ± 2.00 | 8 | 3.4–15.60 |
| Luvisols | 13.96 ± 0.75 | 13.40 | 8.20–26.20 | 13.18 ± 0.68 | 12.28 | 8.1–26.2 | 8.67 ± 0.78 | 8.65 | 1.4–19.80 |
| Phaeozems | 18.38 ± 1.52 | 15.15 | 6.00–118.60 | 17.99 ± 1.43 | 15.05 | 6.15–116.25 | 12.38 ± 0.89 | 12.20 | 1.9–48.90 |
| Planosols | 14.60 ± 4.30 | 14.60 | 10.30–18.90 | 14.83 ± 4.18 | 14.83 | 10.65–19 | 13.05 ± 4.95 | 13.05 | 8.1–18 |
| Regosols | 15.08 ± 2.56 | 13.30 | 11.30–22.40 | 14.29 ± 2.13 | 12.75 | 11.3–20.35 | 4.80 ± 0.92 | 4.35 | 3.3–7.20 |
| Retisols | 15.42 ± 1.22 | 13.50 | 12.30–22.90 | 14.63 ± 1.23 | 12.65 | 10.6–21.35 | 9.06 ± 1.72 | 8.80 | 2.3–18.20 |
| Stagnosols | 12.90 | - | - | 12.70 | - | - | 2.40 | - | - |
| Umbrisols | 15.78 ± 2.02 | 13.65 | 10.50–24.50 | 17.76 ± 2.47 | 14.25 | 9.4–30.75 | 8.19 ± 1.68 | 7.20 | 1.6–18.10 |
Table 3.
p-values for comparing SOC concentrations among different WRB soil groups and layers using the Mann–Whitney U test. Statistically significant values (p < 0.05) are indicated in bold.
Table 3.
p-values for comparing SOC concentrations among different WRB soil groups and layers using the Mann–Whitney U test. Statistically significant values (p < 0.05) are indicated in bold.
| WRB Soil Groups | 0–10 cm | 0–20 cm | 20–40 cm |
|---|---|---|---|
| Luvisols vs. Gleysols | 0.1620 | 0.2831 | 0.3811 |
| Luvisols vs. Phaeozems | 0.0199 | 0.0021 | 0.0074 |
| Luvisols vs. Regosols | 0.8110 | 0.8113 | 0.2251 |
| Luvisols vs. Retisols | 0.1900 | 0.2554 | 0.6651 |
| Luvisols vs. Umbrisols | 0.5110 | 0.2801 | 0.7912 |
| Phaeozems vs. Gleysols | 0.7051 | 0.9430 | 0.9143 |
| Phaeozems vs. Regosols | 0.4972 | 0.3670 | 0.0190 |
| Phaeozems vs. Retisols | 0.9691 | 0.4462 | 0.2221 |
| Phaeozems vs. Umbrisols | 0.4941 | 0.7031 | 0.0582 |
| Gleysols vs. Regosols | 0.5563 | 0.7301 | 0.4101 |
| Gleysols vs. Retisols | 0.7972 | 0.7970 | 0.5182 |
| Gleysols vs. Umbrisols | 0.4381 | 0.7973 | 0.6991 |
| Regosols vs. Gleysols | 0.5560 | 0.7301 | 0.4133 |
| Regosols vs. Umbrisols | 0.9401 | 0.8252 | 0.4144 |
| Regosols vs. Retisols | 0.5035 | 0.7101 | 0.1992 |
| Retisols vs. Umbrisols | 0.4364 | 1.0000 | 0.7961 |
Table 4.
Descriptive statistics of SOC concentration across various soil groups and depths in grassland.
Table 4.
Descriptive statistics of SOC concentration across various soil groups and depths in grassland.
| WRB Soil Groups | SOC Concentration (g kg−1) | ||||||||
|---|---|---|---|---|---|---|---|---|---|
| 0–10 cm | 0–20 cm | 20–40 cm | |||||||
| Mean ± SEM | Median | Min–Max | Mean ± SEM | Median | Min–Max | Mean ± SEM | Median | Min–Max | |
| Gleysols | 13.40 | - | - | 10.35 | - | - | 1.20 | - | - |
| Planosols | 47.50 | - | - | 44.40 | - | - | 4.50 | - | - |
| Retisols | 8.30 | - | - | 6.00 | - | - | 12.30 | - | - |
| Stagnosols | 9.80 | - | - | 9.40 | - | - | 6.00 | - | - |
| Umbrisols | 9.20 | - | - | 7.75 | - | - | 2.10 | - | - |
| Luvisols | 23.97 ± 4.54 | 20.30 | 6.90–89.60 | 16.88 ± 1.52 | 16.73 | 6.2–28.7 | 8.84 ± 1.29 | 9.35 | 0.8–17.9 |
| Phaeozems | 17.42 ± 1.15 | 17.50 | 9.00–26.50 | 15.95 ± 1.17 | 15.23 | 8.4–27.8 | 10.93 ± 1.56 | 10.35 | 2–27.9 |
Table 5.
Descriptive statistics of soil pH across various soil groups and depths in cropland study sites.
Table 5.
Descriptive statistics of soil pH across various soil groups and depths in cropland study sites.
| WRB Soil Groups | Soil pH (KCl) | ||||||||
|---|---|---|---|---|---|---|---|---|---|
| 0–10 cm | 0–20 cm | 20–40 cm | |||||||
| Mean ± SEM | Median | Min–Max | Mean ± SEM | Median | Min–Max | Mean ± SEM | Median | Min–Max | |
| Arenosols | 6.55 ± 1.15 | 6.55 | 5.40–7.70 | 6.30 ± 1.55 | 6.30 | 4.75–7.85 | 6.25 ± 1.55 | 6.25 | 4.7–7.8 |
| Gleysols | 6.12 ± 0.42 | 5.5 | 5.30–7.30 | 6.09 ± 0.46 | 5.65 | 5.2–7.40 | 6.00 ± 0.45 | 6.20 | 4.9–7.3 |
| Luvisols | 5.54 ± 0.16 | 5.4 | 4.00–7.60 | 5.56 ± 0.16 | 5.35 | 4.15–7.65 | 5.59 ± 0.17 | 5.40 | 4–7.9 |
| Phaeozems | 6.18 ± 0.09 | 6.15 | 4.30–7.60 | 6.20 ± 0.09 | 6.10 | 4.35–7.70 | 6.24 ± 0.10 | 6.30 | 3.9–7.8 |
| Planosols | 6.45 ± 0.35 | 6.45 | 6.10–6.80 | 6.45 ± 0.30 | 6.45 | 6.15–6.75 | 6.45 ± 0.15 | 6.45 | 6.3–6.6 |
| Regosols | 6.35 ± 0.56 | 6.45 | 5.10–7.40 | 6.35 ± 0.56 | 6.38 | 5.15–7.50 | 6.25 ± 0.66 | 6.00 | 5.1–7.9 |
| Retisols | 6.23 ± 0.32 | 5.9 | 5.00–7.50 | 6.26 ± 0.33 | 6.00 | 5.05–7.55 | 6.42 ± 0.33 | 6.40 | 5.2–7.7 |
| Stagnosols | 6.70 | - | - | 6.75 | - | - | 7.00 | - | - |
| Umbrisols | 5.44 ± 0.21 | 5.5 | 4.70–6.20 | 5.41 ± 0.20 | 5.43 | 4.65–6.20 | 5.51 ± 0.17 | 5.40 | 4.7–6.1 |
Table 6.
Descriptive statistics of soil pH across various soil groups and depths in grassland study sites.
Table 6.
Descriptive statistics of soil pH across various soil groups and depths in grassland study sites.
| WRB Soil Groups | pH | ||||||||
|---|---|---|---|---|---|---|---|---|---|
| 0–10 cm | 0–20 cm | 20–40 cm | |||||||
| Mean ± SEM | Median | Min–Max | Mean ± SEM | Median | Min–Max | Mean ± SE | Median | Min–Max | |
| Gleysols, | 7.20 | - | - | - | - | - | - | - | - |
| Planosols | 5.20 | - | - | - | - | - | - | - | - |
| Retisols | 5.60 | - | - | - | - | - | - | - | - |
| Stagnosols | 4.90 | - | - | - | - | - | - | - | - |
| Umbrisols | 6.80 | - | - | - | - | - | - | - | - |
| Luvisols | 5.88 ± 0.95 | - | - | 5.87 ± 0.23 | 5.70 | 4.20–7.80 | 5.81 ± 0.29 | 5.50 | 4.10–8.60 |
| Phaeozems | 6.14 ± 0.85 | - | - | 6.17 ± 0.19 | 6.20 | 4.75–7.60 | 6.29 ± 0.22 | 6.40 | 4.80–8.10 |
Table 7.
Descriptive statistics of the TN concentration across various WRB soil groups and depths in cropland.
Table 7.
Descriptive statistics of the TN concentration across various WRB soil groups and depths in cropland.
| WRB Soil Groups | TN Concentration (g kg−1) | ||||||||
|---|---|---|---|---|---|---|---|---|---|
| 0–10 cm | 0–20 cm | 20–40 cm | |||||||
| Mean ± SEM | Median | Min–Max | Mean ± SEM | Median | Min–Max | Mean ± SEM | Median | Min–Max | |
| Arenosols | 1.30 ± 0.10 | 1.30 | 1.20–1.40 | 1.13 ± 0.13 | 1.125 | 1–1.25 | 0.75 ± 0.15 | 0.75 | 0.6–0.9 |
| Gleysols | 1.76 ± 0.43 | 1.60 | 0.90–3.30 | 1.64 ± 0.43 | 1.20 | 0.8–3.15 | 0.72 ± 0.17 | 0.70 | 0.3–1.2 |
| Luvisols | 1.45 ± 0.07 | 1.40 | 0.80–2.40 | 1.34 ± 0.06 | 1.25 | 0.7–2.3 | 0.93 ± 0.07 | 0.90 | 0.3–2.1 |
| Phaeozems | 1.76 ± 0.09 | 1.55 | 0.60–4.70 | 1.74 ± 0.09 | 1.60 | 0.6–4.65 | 1.24 ± 0.08 | 1.21 | 0.2–3.5 |
| Planosols | 1.50 ± 0.30 | 1.50 | 1.20–1.80 | 1.53 ± 0.33 | 1.53 | 1.2–1.85 | 1.35 ± 0.35 | 1.35 | 1–1.7 |
| Regosols | 1.63 ± 0.23 | 1.45 | 1.30–2.30 | 1.58 ± 0.18 | 1.50 | 1.25–2.05 | 0.70 ± 0.15 | 0.75 | 0.3–1 |
| Retisols | 1.66 ± 0.12 | 1.60 | 1.10–2.30 | 1.59 ± 0.11 | 1.50 | 1.25–2.25 | 1.03 ± 0.22 | 1.20 | 0.2–2.2 |
| Stagnosols | 1.20 | - | - | 1.15 | - | 1.15–1.15 | 0.40 | - | 0.4 |
| Umbrisols | 1.63 ± 0.25 | 1.25 | 1.10–30 | 1.46 ± 0.19 | 1.20 | 0.8–2.4 | 0.85 ± 0.17 | 0.9 | 0.3–1.7 |
Table 8.
Descriptive statistics of the TN concentration across various WRB soil groups and depths in grassland.
Table 8.
Descriptive statistics of the TN concentration across various WRB soil groups and depths in grassland.
| WRB Soil Groups | TN Concentration (g kg−1) | ||||||||
|---|---|---|---|---|---|---|---|---|---|
| 0–10 cm | 0–20 cm | 20–40 cm | |||||||
| Mean ± SEM | Median | Min–Max | Mean ± SEM | Median | Min–Max | Mean ± SE | Median | Min–Max | |
| Gleysols | 1.60 | - | - | 1.20 | 0.40 | ||||
| Plansols | 4.60 | - | - | 4.25 | - | - | 0.60 | - | - |
| Retisols | 1.00 | - | - | 0.90 | - | - | 0.60 | - | - |
| Stagnosols | 1.20 | - | - | 1.15 | - | - | 0.80 | - | - |
| Umbrisols | 1.10 | - | - | 0.90 | - | - | 0.20 | - | - |
| Luvisols | 2.26 ± 0.37 | 1.8 | 0.70–7.1 | 1.96 ± 0.31 | 1.80 | 0.75–6.35 | 0.98 ± 0.11 | 1.00 | 0.30–1.80 |
| Phaeozems | 1.71 ± 0.10 | 1.8 | 0.90–2.5 | 1.61 ± 0.10 | 1.65 | 0.80–2.55 | 1.11 ± 0.13 | 1.00 | 0.20–2.30 |
Table 9.
Descriptive statistics of the K concentration across various WRB soil groups and depths in cropland.
Table 9.
Descriptive statistics of the K concentration across various WRB soil groups and depths in cropland.
| WRB Soil Groups | K Concentration (g kg−1) | ||||||||
|---|---|---|---|---|---|---|---|---|---|
| 0–10 cm | 0–20 cm | 20–40 cm | |||||||
| Mean ± SEM | Median | Min–Max | Mean ± SEM | Median | Min–Max | Mean ± SEM | Median | Min–Max | |
| Arenosols | 1.50 ± 0.20 | 1.50 | 1.30–1.70 | 2.24 ± 0.20 | 1.50 | 1.30–1.70 | 1.27 ± 0.06 | 1.27 | 1.21–1.33 |
| Gleysols | 4.48 ± 1.40 | 3.60 | 0.60–8.90 | 2.80 ± 1.40 | 3.60 | 0.60–8.90 | 4.13 ± 1.19 | 4.50 | 0.44–7.19 |
| Luvisols | 2.25 ± 0.25 | 1.60 | 0.80–5.50 | 4.48 ± 0.25 | 1.60 | 0.80–5.50 | 2.74 ± 0.40 | 1.80 | 0.64–10.91 |
| Phaeozems | 1.99 ± 0.16 | 1.70 | 0.20–9.10 | 2.25 ± 0.16 | 1.70 | 0.20–9.10 | 2.01 ± 0.13 | 1.74 | 0.20–7.88 |
| Planosols | 1.60 ± 0.20 | 1.60 | 1.40–1.80 | 2.01 ± 0.20 | 1.60 | 1.40–1.80 | 2.24 ± 0.34 | 2.24 | 1.90–2.57 |
| Regosols | 4.08 ± 0.89 | 4.00 | 2.10–6.20 | 1.60 ± 0.89 | 4.00 | 2.10–6.20 | 4.69 ± 1.06 | 4.68 | 2.10–7.28 |
| Retisols | 3.03 ± 0.53 | 2.30 | 1.40–5.80 | 4.08 ± 0.53 | 2.30 | 1.40–5.80 | 2.84 ± 0.47 | 2.49 | 1.49–5.36 |
| Stagnosols | 3.00 | - | - | 3.03 | - | - | 4.60 | - | - |
| Umbrisols | 1.24 ± 0.39 | 0.85 | 0.30–3.50 | 3.00 ± 0.39 | 0.85 | 0.30–3.50 | 1.21 ± 0.39 | 0.85 | 0.23–3.50 |
Table 10.
Descriptive statistics of the K concentration across various WRB soil groups and depths in grassland.
Table 10.
Descriptive statistics of the K concentration across various WRB soil groups and depths in grassland.
| WRB Soil Groups | K Concentration (g kg−1) | ||||||||
|---|---|---|---|---|---|---|---|---|---|
| 0–10 cm | 0–20 cm | 20–40 cm | |||||||
| Mean ± SEM | Median | Min–Max | Mean ± SEM | Median | Min–Max | Mean ± SE | Median | Min–Max | |
| Gleysols | 1.80 | - | - | 1.80 | - | - | 2.12 | - | - |
| Planosols | 2.80 | - | - | 2.80 | - | - | 4.33 | - | - |
| Retisols | 0.70 | - | - | 0.70 | - | - | 0.55 | - | - |
| Stagnosols | 5.20 | - | - | 5.20 | - | - | 3.67 | - | - |
| Umbrisols | 1.80 | - | - | 1.80 | - | - | 3.84 | - | - |
| Luvisols | 2.16 ± 0.36 | 1.70 | 0.60–5.60 | 2.18 ± 0.37 | 1.70 | 0.60–5.60 | 2.78 ± 0.49 | 2.74 | 0.72–7.00 |
| Phaeozems | 1.35 ± 0.15 | 1.25 | 0.50–2.80 | 1.35 ± 0.15 | 1.20 | 0.50–2.80 | 1.65 ± 0.22 | 1.35 | 0.42–3.64 |
Table 11.
Descriptive statistics of the P concentration across various WRB soil groups and depths in cropland.
Table 11.
Descriptive statistics of the P concentration across various WRB soil groups and depths in cropland.
| WRB Soil Groups | Soil P Concentration (g kg−1) | |||||
|---|---|---|---|---|---|---|
| 0–20 cm | 20–40 cm | |||||
| Mean ± SEM | Median | Min–Max | Mean ± SEM | Median | Min–Max | |
| Arenosols | 0.50 ± 0.10 | 0.50 | 0.40–0.60 | 0.38 ± 0.12 | 0.38 | 0.26–0.50 |
| Gleysols | 0.78 ± 0.20 | 0.80 | 0.30–1.50 | 0.56 ± 0.17 | 0.53 | 0.19–1.15 |
| Luvisols | 0.59 ± 0.14 | 0.50 | 0.20–5.20 | 0.38 ± 0.03 | 0.38 | 0.17–0.75 |
| Phaeozems | 0.55 ± 0.03 | 0.50 | 0.20–2.20 | 0.47 ± 0.03 | 0.40 | 0.09–2.20 |
| Planosols | 0.40 ± 0.10 | 0.40 | 0.30–0.50 | 0.43 ± 0.07 | 0.43 | 0.36–0.50 |
| Regosols | 0.45 ± 0.05 | 0.40 | 0.40–0.60 | 0.44 ± 0.06 | 0.39 | 0.36–0.60 |
| Retisols | 0.56 ± 0.13 | 0.40 | 0.30–1.50 | 0.53 ± 0.16 | 0.33 | 0.27–1.72 |
| Stagnosols | 0.20 | - | - | 0.28 | - | - |
| Umbrisols | 0.71 ± 0.15 | 0.60 | 0.30–1.40 | 0.51 ± 0.14 | 0.40 | 0.12–1.40 |
Table 12.
Descriptive statistics of the P concentration across various WRB soil groups and depths in grassland.
Table 12.
Descriptive statistics of the P concentration across various WRB soil groups and depths in grassland.
| WRB Soil Groups | P Concentration (g kg−1) | |||||
|---|---|---|---|---|---|---|
| 0–20 cm | 20–40 cm | |||||
| Mean ± SEM | Median | Min–Max | Mean ± SE | Median | Min–Max | |
| Gleysols | 0.20 | - | - | 0.12 | - | - |
| Planosols | 0.70 | - | - | 0.34 | - | - |
| Retisols | 0.20 | - | - | 0.10 | - | - |
| Stagnosols | 0.30 | - | - | 0.12 | - | - |
| Umbrisols | 0.40 | - | - | 0.23 | - | - |
| Luvisols | 0.57 ± 0.16 | 0.40 | 0.20–3.02 | 0.53 ± 0.19 | 0.31 | 0.16–3.50 |
| Phaeozems | 0.53 ± 0.06 | 0.50 | 0.20–1.60 | 0.44 ± 0.06 | 0.36 | 0.20–1.40 |
Table 13.
Descriptive statistics of the Ca concentration across various WRB soil groups and depths in cropland.
Table 13.
Descriptive statistics of the Ca concentration across various WRB soil groups and depths in cropland.
| WRB Soil Groups | Soil Ca Concentration (g kg−1) | |||||
|---|---|---|---|---|---|---|
| 0–20 cm | 20–40 cm | |||||
| Mean ± SEM | Median | Min–Max | Mean ± SEM | Median | Min–Max | |
| Arenosols | 8.90 ± 8.00 | 8.90 | 0.90–16.90 | 19.90 ± 19.05 | 19.90 | 0.85–38.95 |
| Gleysols | 6.68 ± 2.18 | 7.30 | 1.00–12.40 | 5.59 ± 1.68 | 6.45 | 0.63–10.00 |
| Luvisols | 2.19 ± 0.28 | 1.70 | 0.60–7.60 | 2.34 ± 0.43 | 1.60 | 0.60–13.64 |
| Phaeozems | 4.33 ± 0.55 | 2.85 | 0.90–29.00 | 5.38 ± 1.03 | 2.50 | 0.40–63.92 |
| Planosols | 2.20 ± 0.90 | 2.20 | 1.30–3.10 | 2.59 ± 0.48 | 2.59 | 2.11–3.06 |
| Regosols | 4.20 ± 1.56 | 3.30 | 1.60–8.60 | 3.93 ± 1.32 | 3.29 | 1.60–7.55 |
| Retisols | 4.23 ± 1.44 | 2.50 | 1.40–15.40 | 8.14 ± 2.96 | 3.19 | 1.65–21.92 |
| Stagnosols | 2.60 | - | - | 32.12 | - | - |
| Umbrisols | 2.28 ± 0.42 | 1.80 | 1.10–4.00 | 1.67 ± 0.43 | 1.17 | 0.51–4.00 |
Table 14.
Descriptive statistics of the Ca concentration across various WRB soil groups and depths in grassland.
Table 14.
Descriptive statistics of the Ca concentration across various WRB soil groups and depths in grassland.
| WRB Soil Groups | Ca Concentration (g kg−1) | |||||
|---|---|---|---|---|---|---|
| 0–20 cm | 20–40 cm | |||||
| Mean ± SEM | Median | Min–Max | Mean ± SE | Median | Min–Max | |
| Gleysols | 1.60 | - | - | 1.28 | - | - |
| Planosols | 4.60 | - | - | 3.07 | - | - |
| Retisols | 0.70 | - | - | 0.40 | - | - |
| Stagnosols | 1.80 | - | - | 0.90 | - | - |
| Umbrisols | 1.10 | - | - | 1.10 | - | - |
| Luvisols | 4.14 ± 1.48 | 1.90 | 0.70–22.82 | 4.66 ± 1.77 | 2.20 | 0.53–25.88 |
| Phaeozems | 7.01 ± 2.69 | 2.60 | 1.10–48.7 | 5.60 ± 2.45 | 2.25 | 0.88–48.4 |
Table 15.
Descriptive statistics of the Mg concentration across various WRB soil groups and depths in cropland.
Table 15.
Descriptive statistics of the Mg concentration across various WRB soil groups and depths in cropland.
| WRB Soil Groups | Mg Concentration (g kg−1) | |||||
|---|---|---|---|---|---|---|
| 0–20 cm | 20–40 cm | |||||
| Mean ± SEM | Median | Min–Max | Mean ± SEM | Median | Min–Max | |
| Arenosols | 3.55 ± 2.35 | 3.55 | 1.20–5.90 | 4.52 ± 3.27 | 4.52 | 1.25–7.79 |
| Gleysols | 4.74 ± 1.56 | 3.80 | 0.40–9.60 | 4.98 ± 1.21 | 5.40 | 0.40–7.44 |
| Luvisols | 2.46 ± 0.25 | 1.90 | 0.80–6.60 | 2.63 ± 0.32 | 2.05 | 0.20–7.42 |
| Phaeozems | 3.10 ± 0.38 | 2.15 | 0.30–28.50 | 3.41 ± 0.42 | 2.30 | 0.13–28.50 |
| Planosols | 2.75 ± 0.25 | 2.75 | 2.50–3.00 | 4.37 ± 1.67 | 4.37 | 2.70–6.03 |
| Regosols | 4.15 ± 0.76 | 4.55 | 2.00–5.50 | 4.74 ± 0.95 | 5.35 | 2.00–6.25 |
| Retisols | 3.54 ± 0.57 | 2.80 | 1.50–6.10 | 4.31 ± 0.61 | 4.99 | 2.30–7.11 |
| Stagnosols | 2.90 | - | - | 12.34 | - | - |
| Umbrisols | 1.33 ± 0.52 | 0.70 | 0.20–4.70 | 1.35 ± 0.53 | 0.79 | 0.12–4.70 |
Table 16.
Descriptive statistics of the Mg concentration across various WRB soil groups and depths in grassland.
Table 16.
Descriptive statistics of the Mg concentration across various WRB soil groups and depths in grassland.
| WRB Soil Groups | Mg Concentration (g kg−1) | |||||
|---|---|---|---|---|---|---|
| 0–20 cm | 20–40 cm | |||||
| Mean ± SEM | Median | Min–Max | Mean ± SE | Median | Min–Max | |
| Gleysols | 2.30 | - | - | 3.02 | - | - |
| Planosols | 3.80 | - | - | 5.87 | - | - |
| Retisols | 0.60 | - | - | 0.35 | - | - |
| Stagnosols | 4.10 | - | - | 2.57 | - | - |
| Umbrisols | 1.90 | - | - | 5.86 | - | - |
| Luvisols | 2.85 ± 0.57 | 1.80 | 0.60–8.70 | 4.54 ± 1.30 | 3.44 | 0.98–21.70 |
| Phaeozems | 2.89 ± 0.63 | 2.00 | 0.50–11.50 | 2.97 ± 0.41 | 2.53 | 0.75–8.30 |
Table 17.
Descriptive statistics of the SBD across various WRB soil groups and depths in cropland.
| WRB Soil Groups | SBD Mg m−3 | ||||||||
|---|---|---|---|---|---|---|---|---|---|
| 0–10 cm | 0–20 cm | 20–40 cm | |||||||
| Mean ± SEM | Median | Min–Max | Mean ± SEM | Median | Min–Max | Mean ± SEM | Median | Min–Max | |
| Arenosols | 1.53 ± 0.16 | 1.53 | 1.37–1.70 | 1.60 ± 0.10 | 1.60 | 1.51–1.70 | 1.67 ± 0.003 | 1.67 | 1.667–1.672 |
| Gleysols | 1.48 ± 0.13 | 1.42 | 1.17–1.95 | 1.31 ± 0.13 | 1.50 | 1.17–1.94 | 1.75 ± 0.14 | 1.70 | 1.37–2.07 |
| Luvisols | 1.46 ± 0.02 | 1.47 | 1.22–1.72 | 1.55 ± 0.02 | 1.57 | 1.29–1.95 | 1.78 ± 0.03 | 1.75 | 1.45–2.36 |
| Phaeozems | 1.43 ± 0.02 | 1.44 | 0.74–1.86 | 1.57 ± 0.02 | 1.54 | 0.76–1.87 | 1.66 ± 0.02 | 1.67 | 1.16–2.04 |
| Planosols | 1.50 ± 0.01 | 1.50 | 1.49–1.51 | 1.51 ± 0.07 | 1.60 | 1.51–1.65 | 1.74 ± 0.23 | 1.74 | 1.51–1.97 |
| Regosols | 1.43 ± 0.06 | 1.44 | 1.30–1.52 | 1.58 ± 0.03 | 1.50 | 1.44–1.59 | 1.67 ± 0.04 | 1.69 | 1.54–1.73 |
| Retisols | 1.48 ± 0.04 | 1.45 | 1.33–1.64 | 1.51 ± 0.03 | 1.52 | 1.44–1.69 | 1.65 ± 0.05 | 1.67 | 1.39–1.89 |
| Stagnosols | 1.56 | - | - | 1.53 | - | - | - | - | - |
| Umbrisols | 1.35 ± 0.05 | 1.36 | 1.13–1.51 | 1.60 ± 0.04 | 1.41 | 1.25–1.59 | 1.56 ± 0.03 | 1.54 | 1.47–1.74 |
Table 18.
Descriptive statistics of the SBD across various WRB soil groups and depths in grassland.
| WRB Soil Groups | SBD Mg m−3 | ||||||||
|---|---|---|---|---|---|---|---|---|---|
| 0–10 cm | 0–20 cm | 20–40 cm | |||||||
| Mean ± SEM | Median | Min–Max | Mean ± SEM | Median | Min–Max | Mean ± SE | Median | Min–Max | |
| Gleysols | 1.36 | - | - | 1.50 | - | - | 1.75 | - | - |
| Planosols | 1.14 | - | - | 1.19 | - | - | 1.82 | - | - |
| Retisols | 1.38 | - | - | 1.40 | - | - | 1.54 | - | - |
| Stagnosols | 1.45 | - | - | 1.51 | - | - | 1.65 | - | - |
| Umbrisols | 1.50 | - | - | 1.58 | - | - | 1.65 | - | - |
| Luvisols | 1.34 ± 0.06 | 1.35 | 0.73–1.83 | 1.44 ± 0.06 | 1.46 | 0.78–1.82 | 1.61 ± 0.05 | 1.64 | 1.06–1.90 |
| Phaeozems | 1.33 ± 0.05 | 1.40 | 0.66–1.57 | 1.46 ± 0.03 | 1.52 | 1.13–1.70 | 1.63 ± 0.03 | 1.61 | 1.46–1.91 |
Table 19.
Descriptive statistics of the SOC stock across various WRB soil groups and depths in cropland.
Table 19.
Descriptive statistics of the SOC stock across various WRB soil groups and depths in cropland.
| WRB Soil Groups | SOC Stock, t ha−1 | ||||||||
|---|---|---|---|---|---|---|---|---|---|
| 0–10 cm | 0–20 cm | 0–40 cm | |||||||
| Mean ± SEM | Median | Min–Max | Mean ± SEM | Median | Min–Max | Mean ± SEM | Median | Min–Max | |
| Arenosols | 19.44 ± 0.26 | 19.44 | 19.19–19.70 | 33.84 ± 4.36 | 33.84 | 29.48–38.20 | 57.03 ± 4.98 | 57.03 | 52.05–62.01 |
| Gleysols | 27.86 ± 6.33 | 22.31 | 17.47–52.46 | 55.02 ± 12.21 | 41.55 | 32.91–99.86 | 84.48 ± 14.51 | 90.01 | 46.92–127.14 |
| Luvisols | 20.09 ± 0.91 | 18.58 | 11.59–32.31 | 40.57 ± 1.71 | 38.73 | 24.83–67.58 | 70.88 ± 3.65 | 70.32 | 32.66–128.38 |
| Phaeozems | 24.68 ± 1.21 | 21.94 | 9.89–87.32 | 51.06 ± 2.43 | 47.08 | 21.32–176.64 | 90.49 ± 4.19 | 81.67 | 36.70–225.02 |
| Planosols | 21.92 ± 6.62 | 21.92 | 15.30–28.55 | 46.21 ± 11.04 | 46.21 | 35.16–57.25 | 89.33 ± 22.29 | 89.33 | 67.04–111.62 |
| Regosols | 21.40 ± 3.43 | 19.85 | 15.33–30.58 | 42.67 ± 5.61 | 39.76 | 33.00–58.17 | 58.55 ± 4.59 | 58.45 | 47.49–69.81 |
| Retisols | 22.59 ± 1.53 | 21.35 | 17.82–32.89 | 44.40 ± 3.08 | 40.47 | 32.06–61.83 | 74.00 ± 7.56 | 73.19 | 40.70–112.45 |
| Stagnosols | 20.14 | 20.14 | 20.14–20.14 | 40.70 | 40.70 | 40.70 | 48.45 | 48.45 | 48.45 |
| Umbrisols | 21.97 ± 2.23 | 19.92 | 14.14–31.87 | 47.52 ± 5.30 | 42.08 | 29.78–72.11 | 73.00 ± 8.01 | 65.73 | 39.34–108.64 |
Table 20.
p-values of statistical significance for comparing SOC stock among different WRB soil groups and layers using the Mann–Whitney U test. Statistically significant values are indicated in bold.
Table 20.
p-values of statistical significance for comparing SOC stock among different WRB soil groups and layers using the Mann–Whitney U test. Statistically significant values are indicated in bold.
| WRB Soil Groups | 0–10 cm | 0–20 cm | 0–40 cm |
|---|---|---|---|
| Luvisols vs. Gleysols | 0.1231 | 0.1764 | 0.7124 |
| Luvisols vs. Phaeozems | 0.0201 | 0.0035 | 0.0048 |
| Luvisols vs. Regosols | 0.8451 | 0.6482 | 0.0601 |
| Luvisols vs. Retisols | 0.2932 | 0.4931 | 0.9893 |
| Luvisols vs. Umbrisols | 0.6250 | 0.1630 | 0.3202 |
| Phaeozems vs. Gleysols | 0.3062 | 0.6931 | 0.7230 |
| Phaeozems vs. Regosols | 0.5103 | 0.2618 | 0.0211 |
| Phaeozems vs. Retisols | 0.9581 | 0.2225 | 0.2323 |
| Phaeozems vs. Umbrisols | 0.5280 | 0.9161 | 0.0741 |
| Gleysols vs. Regosols | 0.4861 | 0.4861 | 0.0571 |
| Gleysols vs. Retisols | 0.3302 | 0.5034 | 0.8251 |
| Gleysols vs. Umbrisols | 0.2601 | 0.6045 | 0.3302 |
| Regosols vs. Gleysols | 0.4863 | 0.4862 | 0.0571 |
| Regosols vs. Umbrisols | 0.9402 | 0.5031 | 0.2603 |
| Regosols vs. Retisols | 0.5031 | 0.8250 | 0.1991 |
| Retisols vs. Umbrisols | 0.4363 | 0.4361 | 0.4890 |
Table 21.
Descriptive statistics of the SOC stock across various WRB soil groups and depths in grassland.
Table 21.
Descriptive statistics of the SOC stock across various WRB soil groups and depths in grassland.
| WRB Soil Groups | SOC Stock, t ha−1 | ||||||||
|---|---|---|---|---|---|---|---|---|---|
| 0–10 cm | 0–20 cm | 0–40 cm | |||||||
| Mean ± SEM | Median | Min–Max | Mean ± SEM | Median | Min–Max | Mean ± SEM | Median | Min–Max | |
| Gleysols | 18.31 | - | - | 30.28 | - | - | 34.33 | - | - |
| Planosols | 53.89 | - | - | 105.33 | - | - | 121.79 | - | - |
| Retisols | 11.41 | - | - | 16.73 | - | - | 54.47 | - | - |
| Stagnosols | 14.27 | - | - | 28.34 | - | - | 48.01 | - | - |
| Umbrisols | 13.80 | - | - | 24.35 | - | - | 31.30 | - | - |
| Luvisols | 26.74 ± 2.59 | 25.58 | 11.02–50.90 | 48.22 ± 3.93 | 46.43 | 20.45–79.57 | 76.66 ± 7.03 | 72.32 | 23.12–127.68 |
| Phaeozems | 22.88 ± 1.83 | 21.23 | 8.65–41.63 | 46.41 ± 3.60 | 42.00 | 26.79–87.67 | 81.47 ± 7.98 | 78.02 | 34.10–171.40 |
Table 22.
Descriptive statistics of the SOC stock across various soil texture classes and depths in cropland.
Table 22.
Descriptive statistics of the SOC stock across various soil texture classes and depths in cropland.
| Texture Class | SOC Stock, t ha−1 | ||||||||
|---|---|---|---|---|---|---|---|---|---|
| 0–10 cm | 10–20 cm | 20–40 cm | |||||||
| Mean ± SEM | Median | Min–Max | Mean ± SEM | Median | Min–Max | Mean ± SEM | Median | Min–Max | |
| Loamy sand | 18.97 ± 2.48 | 20.39 | 14.14–22.37 | 20.63 ± 8.22 | 20.20 | 6.62–35.08 | 23.88 ± 10.96 | 28.22 | 8.69–45.16 |
| Sand | - | - | - | - | - | - | 25.08 ± 12.10 | 18.83 | 7.96–48.45 |
| Silt | 27.02 ± 1.87 | 21.09 | 15.33–43.85 | 26.05 ± 2.44 | 25.32 | 13.91–45.26 | 38.17 ± 4.82 | 35.71 | 8.65–69.60 |
| Silt Loam | 22.33 ± 0.74 | 20.70 | 9.89–56.65 | 24.06 ± 0.80 | 22.19 | 10.29–56.74 | 35.41 ± 1.99 | 34.36 | 4.71–121.74 |
| Sandy Loam | 26.87 ± 4.44 | 20.80 | 11.13–87.32 | 27.59 ± 4.85 | 21.86 | 12.47–89.32 | 34.89 ± 3.69 | 17.79 | 14.25–58.73 |
Table 23.
Descriptive statistics of the SOC stock across various soil texture classes and depths in grassland.
Table 23.
Descriptive statistics of the SOC stock across various soil texture classes and depths in grassland.
| Texture Class | SOC Stock, t ha−1 | ||||||||
|---|---|---|---|---|---|---|---|---|---|
| 0–10 cm | 10–20 cm | 20–40 cm | |||||||
| Mean ± SEM | Median | Min–Max | Mean ± SEM | Median | Min–Max | Mean ± SEM | Median | Min–Max | |
| Loamy Sand | 14.90 ± 3.48 | 14.90 | 11.41–18.38 | 14.37 ± 9.05 | 14.37 | 5.32–23.42 | 41.89 ± 10.84 | 41.89 | 31.05–52.73 |
| Silt | 39.01 ± 4.84 | 37.26 | 30.59–50.90 | 22.76 ± 2.30 | 24.95 | 15.35–28.67 | 36.06 ± 3.82 | 30.86 | 28.65–48.11 |
| Silt Loam | 25.26 ± 1.97 | 22.93 | 8.65–53.89 | 24.80 ± 1.91 | 23.25 | 11.97–51.44 | 32.50 ± 4.69 | 31.24 | 4.06–83.73 |
| Sandy Loam | 19.33 ± 2.12 | 17.95 | 11.02–32.89 | 13.48 ± 1.74 | 12.80 | 9.43–21.56 | 23.65 ± 4.57 | 26.43 | 2.67–50.62 |
Disclaimer/Publisher’s Note: The statements, opinions and data contained in all publications are solely those of the individual author(s) and contributor(s) and not of MDPI and/or the editor(s). MDPI and/or the editor(s) disclaim responsibility for any injury to people or property resulting from any ideas, methods, instructions or products referred to in the content. |
© 2024 by the authors. Licensee MDPI, Basel, Switzerland. This article is an open access article distributed under the terms and conditions of the Creative Commons Attribution (CC BY) license (https://creativecommons.org/licenses/by/4.0/).
Share and Cite
MDPI and ACS Style
Petaja, G.; Ivbule, I.; Zvaigzne, Z.A.; Purviņa, D.; Upenieks, E.M.; Līcīte, I.; Lazdiņš, A. Organic Carbon Stock in Mineral Soils in Cropland and Grassland in Latvia. Environments 2024, 11, 73. https://doi.org/10.3390/environments11040073
AMA Style
Petaja G, Ivbule I, Zvaigzne ZA, Purviņa D, Upenieks EM, Līcīte I, Lazdiņš A. Organic Carbon Stock in Mineral Soils in Cropland and Grassland in Latvia. Environments. 2024; 11(4):73. https://doi.org/10.3390/environments11040073
Chicago/Turabian StylePetaja, Guna, Ieva Ivbule, Zaiga Anna Zvaigzne, Dana Purviņa, Emīls Mārtiņš Upenieks, Ieva Līcīte, and Andis Lazdiņš. 2024. "Organic Carbon Stock in Mineral Soils in Cropland and Grassland in Latvia" Environments 11, no. 4: 73. https://doi.org/10.3390/environments11040073
Note that from the first issue of 2016, this journal uses article numbers instead of page numbers. See further details here.