Carbon Pools in Old-Growth Scots Pine Stands in Hemiboreal Latvia


1
Latvian State Forest Research Institute Silava, Rīgas street 111, LV-2169 Salaspils, Latvia
2
Department of Silviculture, Forest faculty, Latvia University of Life Sciences and Technologies, Liela 2, LV-3001 Jelgava, Latvia
*
Author to whom correspondence should be addressed.
Forests 2019, 10(10), 911; https://doi.org/10.3390/f10100911
Submission received: 1 August 2019
/
Revised: 6 October 2019
/
Accepted: 16 October 2019
/
Published: 16 October 2019
(This article belongs to the Section Forest Ecology and Management)
Abstract
:Old-growth forests are widely recognised for the benefits they provide for biodiversity; however, a more comprehensive understanding of their role in climate change mitigation must still be established to find the optimal balance between different forest ecosystem services at a national or regional scale. Very few studies have assessed carbon pools in old-growth Scots pine (Pinus sylvestris L.)-dominated boreal forests, and none have been conducted in hemiboreal forests. Therefore, we assessed the carbon storage of the living tree biomass, deadwood, forest floor (soil organic horizon, including all litter and decomposed wood), and mineral soil in 25 hemiboreal old-growth (163–218 years) unmanaged Scots pine stands in Latvia. The studied stands were without known records of any major natural or human-made disturbance in the visible past. Our results show, that the total ecosystem carbon pool (excluding ground vegetation) was 291.2 ± 54.2 Mg C ha−1, which was primarily composed of living tree biomass (59%), followed by mineral soil (31%), deadwood (5%), and the forest floor (5%). Within the studied stand age group, the total carbon pool remained stable; however, interchanges among the carbon pools, i.e., living biomass and laying deadwood, did occur.
1. Introduction
Carbon sequestration and storage is one of the essential ecosystem services provided by forests, which has great potential to mitigate climate change [1,2]. Boreal forests store approximately one-third of global terrestrial carbon and therefore are highly important in this context [3]. The carbon sequestration in forests is affected by climate [4], soil [5], and natural disturbance [6], along with forest stand characteristics, such as tree species composition [7], age [8,9], and silviculture practices [10,11,12,13].
The total ecosystem carbon (TEC) is stored in different pools (above- and below-ground tree biomass, deadwood, forest floor, and soil), and the dynamics of these pools depend on forest development stage [14]. Generally, the TEC pool increases with stand age and is closely related to site productivity [4,5]. Dynamics of TEC pools can be abruptly altered following stand-replacing natural or human-made disturbances. Following windthrow or fire events, a large proportion of live tree biomass is turned into deadwood, while following clear-cut, a large proportion of live biomass is removed from the site [15,16].
The old-growth forests are important from ecosystem functioning and biodiversity aspects [17]. The long and intensive exploitation of European forests has heavily shaped the distribution, structure, and composition of these ecosystems. In Europe, old-growth forests with natural structures are rare, mainly preserved in distant areas, where forest management operations have been unprofitable due to challenging terrain or low productivity [17,18].
Globally, old-growth boreal and temperate forests serve as a major carbon sink [4]. In some specific conditions for a certain period, old-growth forests might become carbon neutral [19] or even a carbon source, when net carbon balance becomes negative [20]. In Europe, several studies have investigated ecosystem carbon pools in stands dominated by old-growth Norway spruce (Picea abies (L.) Karst.) [14,16,21,22]. These studies show that live tree biomass and soil are the largest carbon pools [14,16,21,22]. Among these studies, the lowest TEC (175 Mg ha−1) was estimated in old-growth boreal forests [16], the highest TEC (> 400 Mg ha−1) in Central European forests [14,22], and moderate estimates (240 Mg C ha−1) in hemiboreal forests [21], implying that TEC pools change according to latitudinal position. Similar observations are reported from southern boreal forests in Canada, where depending on site productivity the TEC pools ranged from 120 to 725 Mg C ha−1 [23]. The soil organic carbon (SOC) pool in old-growth forests can increase over time [24] or remain rather stable [14,22], which likely depends on soil and climate conditions, as well as on forest stand characteristics. The deadwood carbon pool in old-growth forests is related to tree morality rates, and generally increases with stand age [22]. Forest floor carbon pools are usually one the of the smallest TEC pools, closely related to site productivity and decomposition rates [14,16,22].
The dominant tree species is a significant factor influencing TEC dynamics [25]. Scots pine (Pinus sylvestris L.) is a long-living common tree species in Northern Europe [26]. Yet, knowledge of TEC pools in old-growth Scots pine stands is scarce, as the majority of studies have assessed TEC in old-growth Norway spruce stands [14,16,21,22]. Therefore, the aim of our study was to assess the main carbon pools (living tree biomass, deadwood, forest floor, and mineral soil) in hemiboreal old-growth (>160 years) Scots pine forests in Latvia. Gained insight into the TEC of old-growth forests could be used to develop balanced management strategies for protected forests as well as to maximise climate change mitigation through adaptive forest management strategies [1,27,28].
Studies have shown that in old-growth Norway spruce-dominated stands, the total carbon pool remained stable between stand ages of 116 to 145 years [22]. Considering the low annual growth rates of Scots pine trees older than 100 years [29] and the absence of evidence of recent natural or human-made disturbances in studied stands, we hypothesised that the TEC pool of old growth Scots pine forests would not change in stands aged between 163 and 218 years.
2. Materials and Methods
2.1. Study Area
Latvia is located in the hemiboreal region within a moderately cool and moist climate [26]. According to data from the Latvian Environment, Geology and Meteorology Centre, the mean annual temperature is +5 °C, ranging from around −5 °C in January to +17 °C in July. The mean annual precipitation is 550–850 mm; about 500 mm falls during the growing season (April to October). According to the National Forest Inventory data, Scots pine is the second-most common tree species in Latvia, occurring in 874,000 ha or 26% of the total forest area. The largest proportion of Scots pine grows on sandy (19%) or sandy loam (37%) soils. The sampling plots were established in the Hylocomniosa forest site type, which is characterised by medium-rich sandy loam soils with a normal moisture regime [30]. In this forest site type, 36% of the area is occupied by pine-dominated forests. In Latvia, the majority (85%) of the forests older than 120 years are dominated by Scots pine.
2.2. Fieldwork
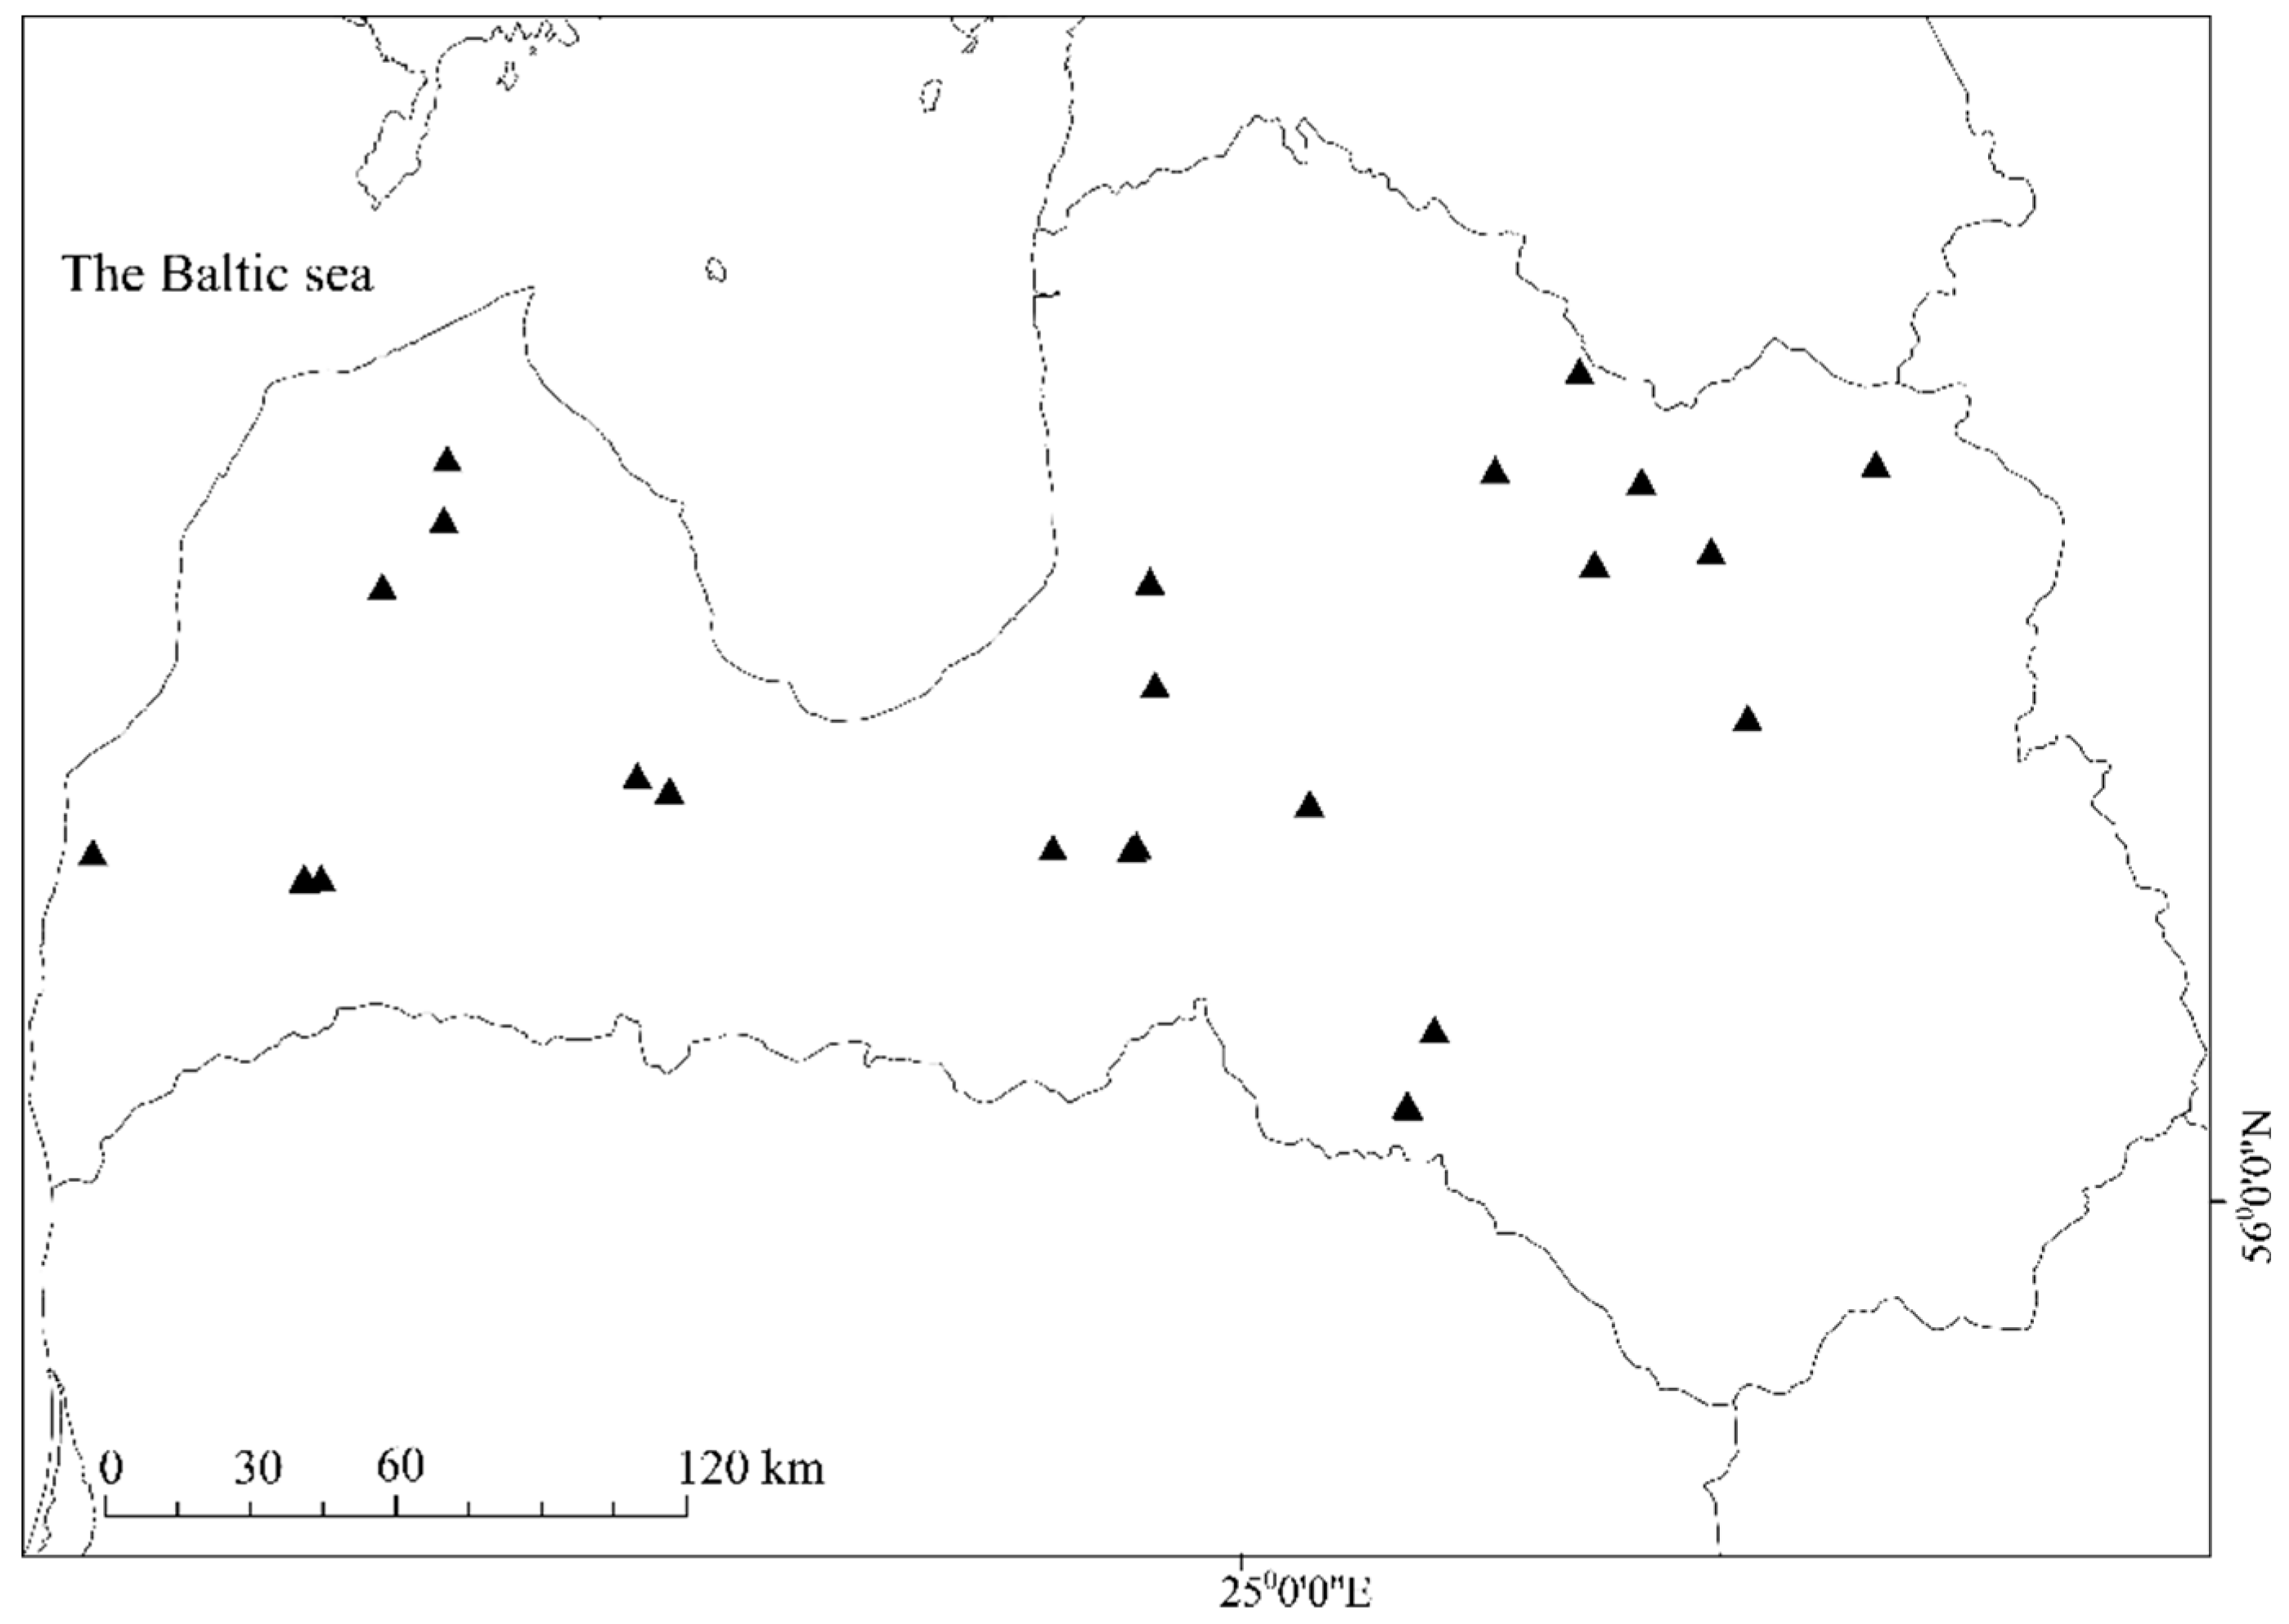
The methodology used for the fieldwork and the data analysis is the same as was published in 2018 by Ķēniņa et al. [21], where old-growth Norway spruce stands were analysed. In total, 25 stands were stratified from the set of potential areas using the following criteria: age > 160 years, dominance of Scots pine (> 50% out of the basal area), location (> 5 km from villages and > 1 km from roads), and no documented information or field observations indicating past management activities (e.g., stumps), and growing in mesotrophic soil conditions (Hylocomniosa forest type) in protected areas in Latvia (Figure 1). The mean stand age (± 95% confidence interval) in our study was 179 ± 7 years, ranging between 163 and 218 years.
Six to eight circular sampling plots of 500 m2 (143 sample plots in total) were placed systematically in each stand. In these sampling plots, the tree species and diameter at breast height (DBH) were recorded for all the living and standing dead trees of DBH ≥ 6.1 cm and for lying deadwood of DBH ≥ 14.1 cm. In the centre of the large sampling plots (500 m2), smaller subplots (25 m2) were placed, where living trees of DBH 2.1 to 6.0 cm and laying deadwood of DBH 6.1 to 14.0 cm were recorded.
The tree height was measured for three to five living trees of each species in each canopy layer and for all snags (dead trees with broken tops). For lying deadwood sections within the sample plot, we recorded the tree species (if possible), stage of decay in five classes [31], diameter at both ends, and length.
Soil samples were taken outside the large sampling plot (500 m2) at random location points, at least 2 m from large trees. At each stand, soil samples were taken from 3 points. In total, 18 stands were sampled. From the stands, which were located nearby, only a single stand was sampled. At each point, the forest floor (soil organic horizon, including all litter and decomposed wood) [12,15] and mineral soil samples were taken. At each place, a profile pit (60 cm × 120 cm × 90 cm) was created, where mineral soil samples at fixed depths (0–10 cm; 10–20 cm; 20–40 cm, and 40–80 cm) were taken using a metal cylinder (100 cm3). A single soil sample was taken per each fixed depth. Physical and chemical analyses of the obtained samples (e.g., bulk density, total carbon content, and carbonate content) were conducted in the Forest Environment Laboratory at the Latvian State Forest Research Institute ‘Silava’, following the reference method by Fleck et al. [32].
2.3. Data Analysis
The height of living and standing dead trees was calculated using Näslund’s and Gaffrey’s models [33]. The volume of living trees and standing dead trees with the tops was calculated according to Liepa [34], using the measured tree height and DBH values with the respective coefficients for the tree species as follows:
where v is the stem volume (m3); L denotes stem length (m); d indicates tree diameter at breast height (DBH; cm); lg denotes the logarithm of base 10; and ψ, α, β, and φ are the coefficients for tree species. The coefficients for the Scots pine are the following: Ψ is 1.6541 × 10⁴, α is 0.56582, β is 0.25924, and φ is 1.59689.
Snags and lying deadwood were calculated according to the formula for a cylinder. The living tree biomass (above- and below-ground) was estimated from the DBH and tree height for individual trees based on the local biomass equation [35]. The living tree biomass carbon pool was calculated using the living tree biomass values multiplied by the carbon content of 50% [36,37].
The deadwood carbon pool was calculated based on deadwood volume estimations, decay class-specific density, and carbon content for the main tree species in hemiboreal forests [31]. The mineral soil carbon/forest floor carbon was obtained by multiplying the organic carbon concentration (the difference between the total carbon content and inorganic carbon content) with the soil mass in the respective layers/mass of the forest floor [22,38].
Relationships between the living tree biomass and deadwood carbon pools were analysed using a linear mixed-effects (LME) model as implemented in R (3.5.0 library lme4) [39]. The total deadwood carbon and the lying deadwood carbon data were log transformed to meet assumptions of variance homogeneity and normality. The stand was treated as a random effect to account for the possible correlation between the plots of one stand.
3. Results
3.1. Volume
The mean standing volume of old-growth pine stands was 570.9 ± 22.2 m3 ha−1 (ranging from 241.0 to 837.5 m3 ha−1), and the mean basal area was 45.3 ± 1.6 m2 ha−1. The height of the upper tree layer ranged from 23.9 to 34.8 m, with a mean value of 31.1 ± 0.4 m.
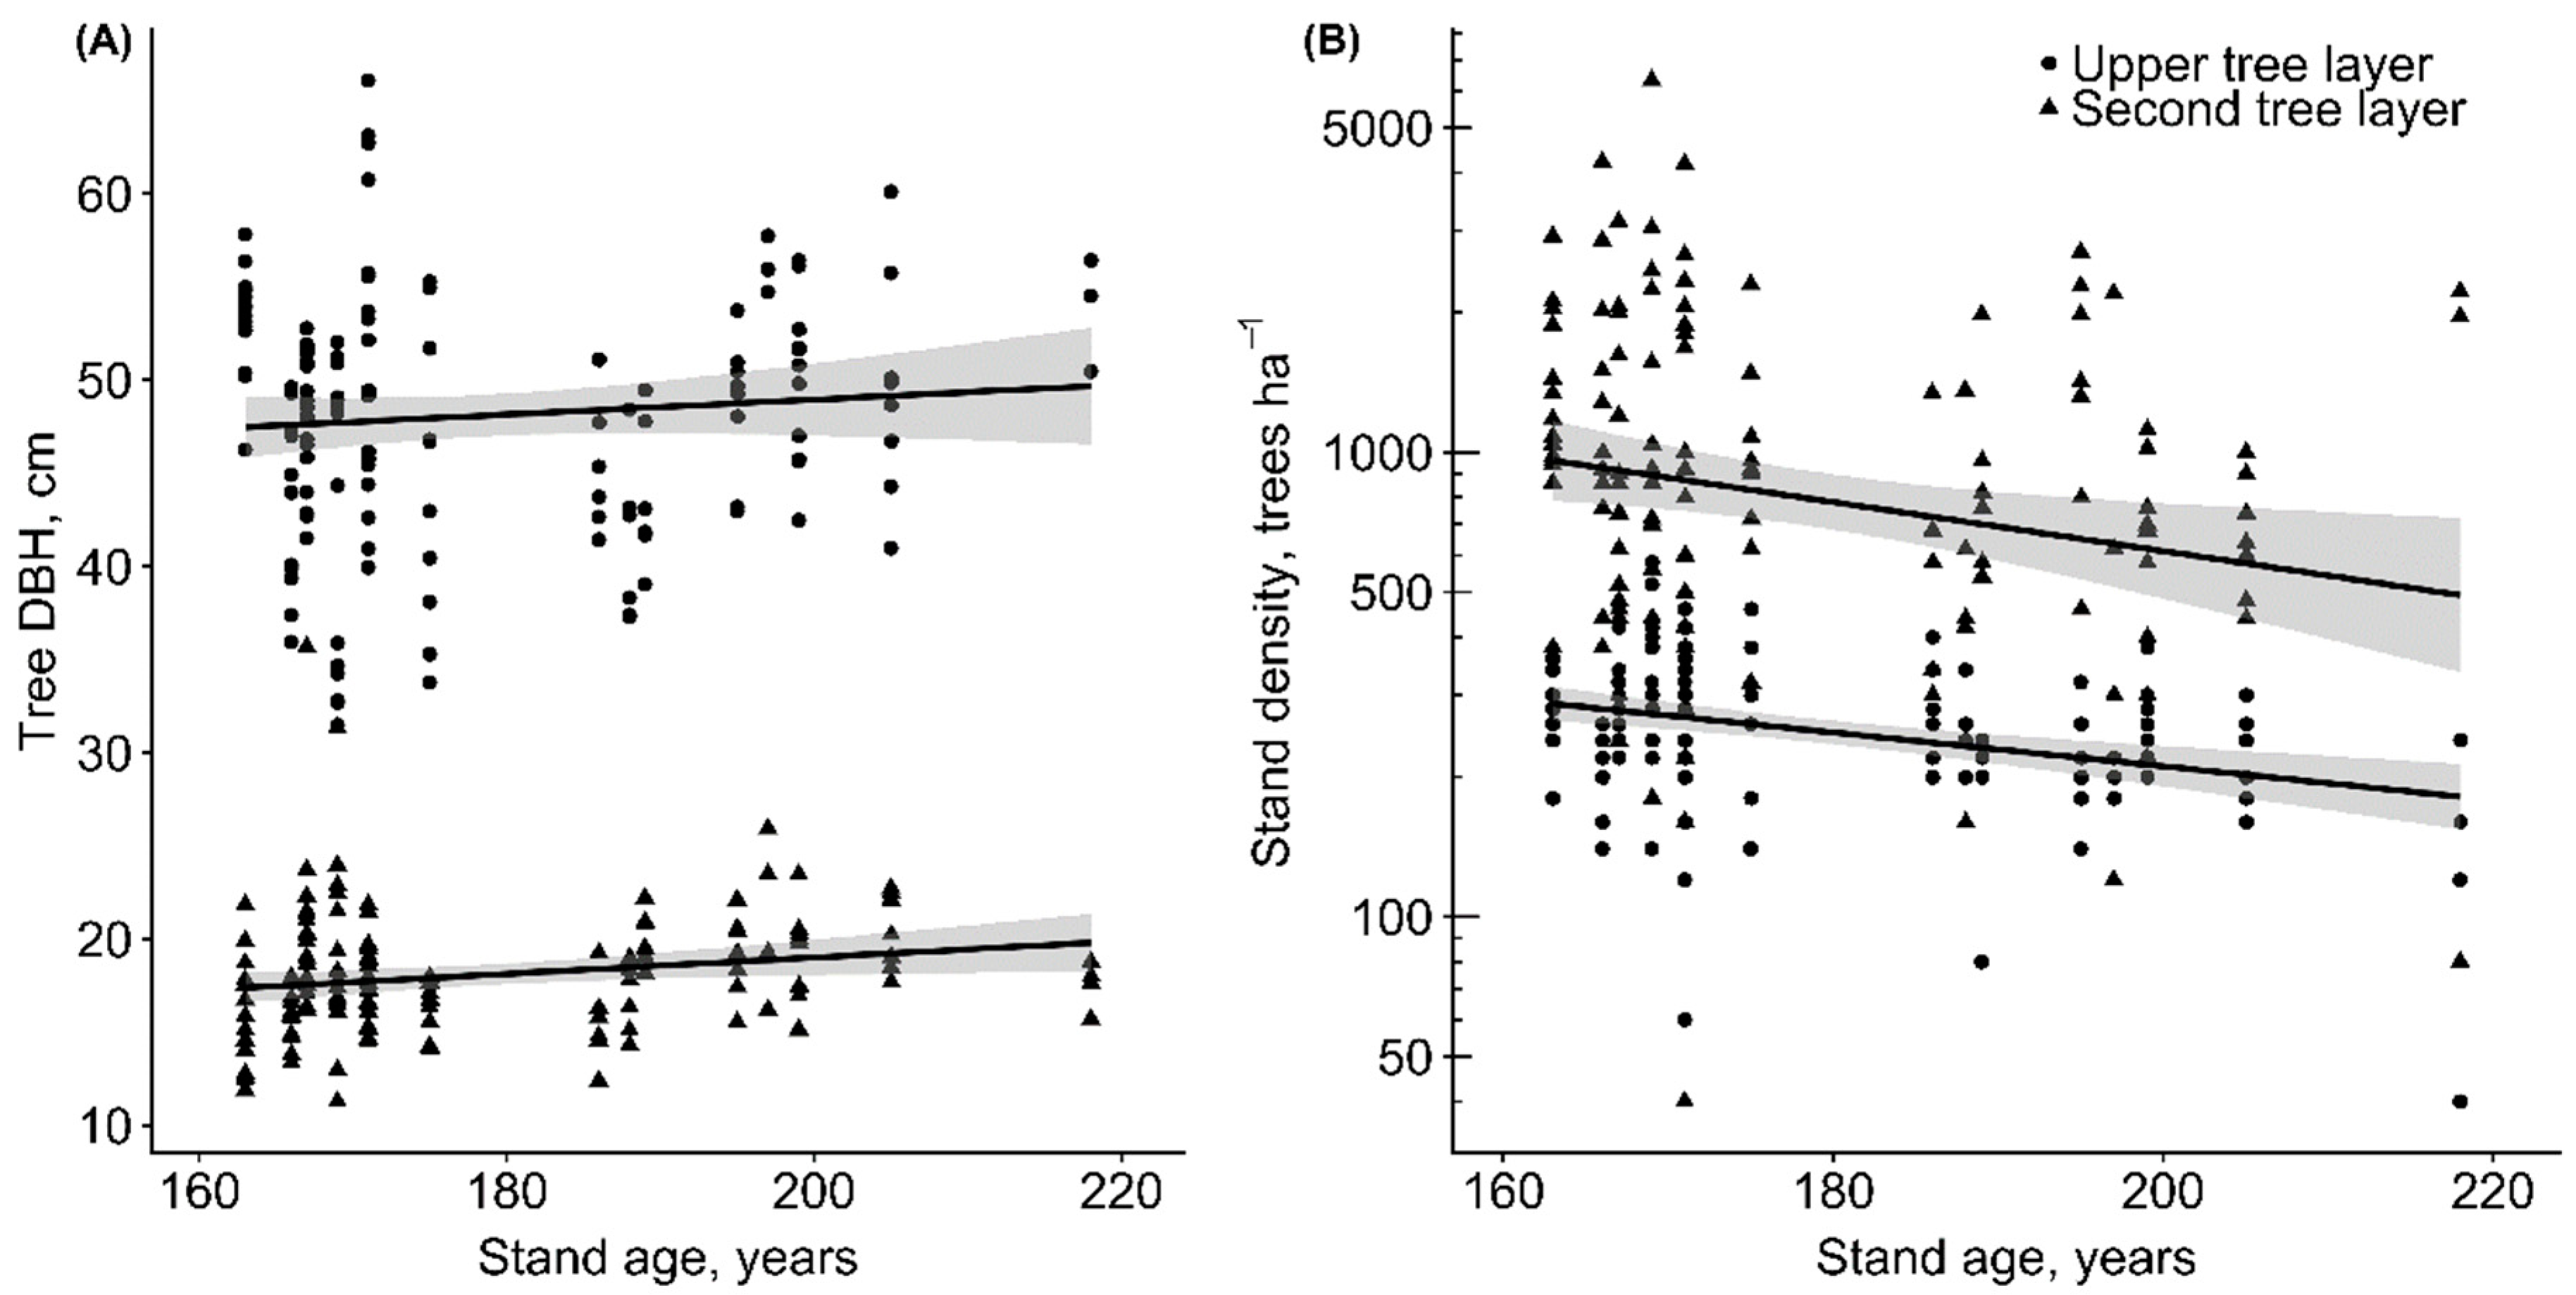
The tree DBH of the upper and second tree layers also had a considerable range with a mean of 48.0 ± 1.2 cm and 18.1 ± 0.6 cm, respectively. The mean stand density in the upper tree layer was 268 ± 15 ha−1, of which 140 ± 11 ha−1 were pines. In the second tree layer, the mean stand density was 1084 ± 153 ha−1; it was dominated by Norway spruce (630 ± 96 ha−1 on average) (Figure 2).
The mean stock of deadwood was 98.4 ± 14.4 m3 ha−1 (ranging from 0 to 483.2 m3 ha−1) comprising 44.3 ± 10.9 m3 ha−1 lying dead logs, 42.7 ± 6.8 m3 ha−1 standing dead trees, and 11.5 ± 2.7 m3 ha−1 snags.
3.2. Carbon Pools
The TEC pool was 291.2 ± 54.2 Mg C ha−1, representing the sum of mean values for carbon pools of living tree biomass, deadwood, forest floor, and mineral soil pools delivered from the data obtained in this study, except ground vegetation, which was not addressed in this study (Table 1). Neither the carbon pool of living tree biomass nor deadwood was significantly related to the stand age, according to the LME model.
The mean carbon pool of living tree biomass was 171.2 ± 6.1 Mg C ha−1, 64% of which was found in the stem biomass. The carbon pool in the above-ground biomass varied between 57.6 Mg C ha−1 and 196.4 Mg C ha−1. The share of the below-ground biomass carbon pool in the living tree biomass varied between 19% and 23%, with a mean of 21% ± 0.1%.
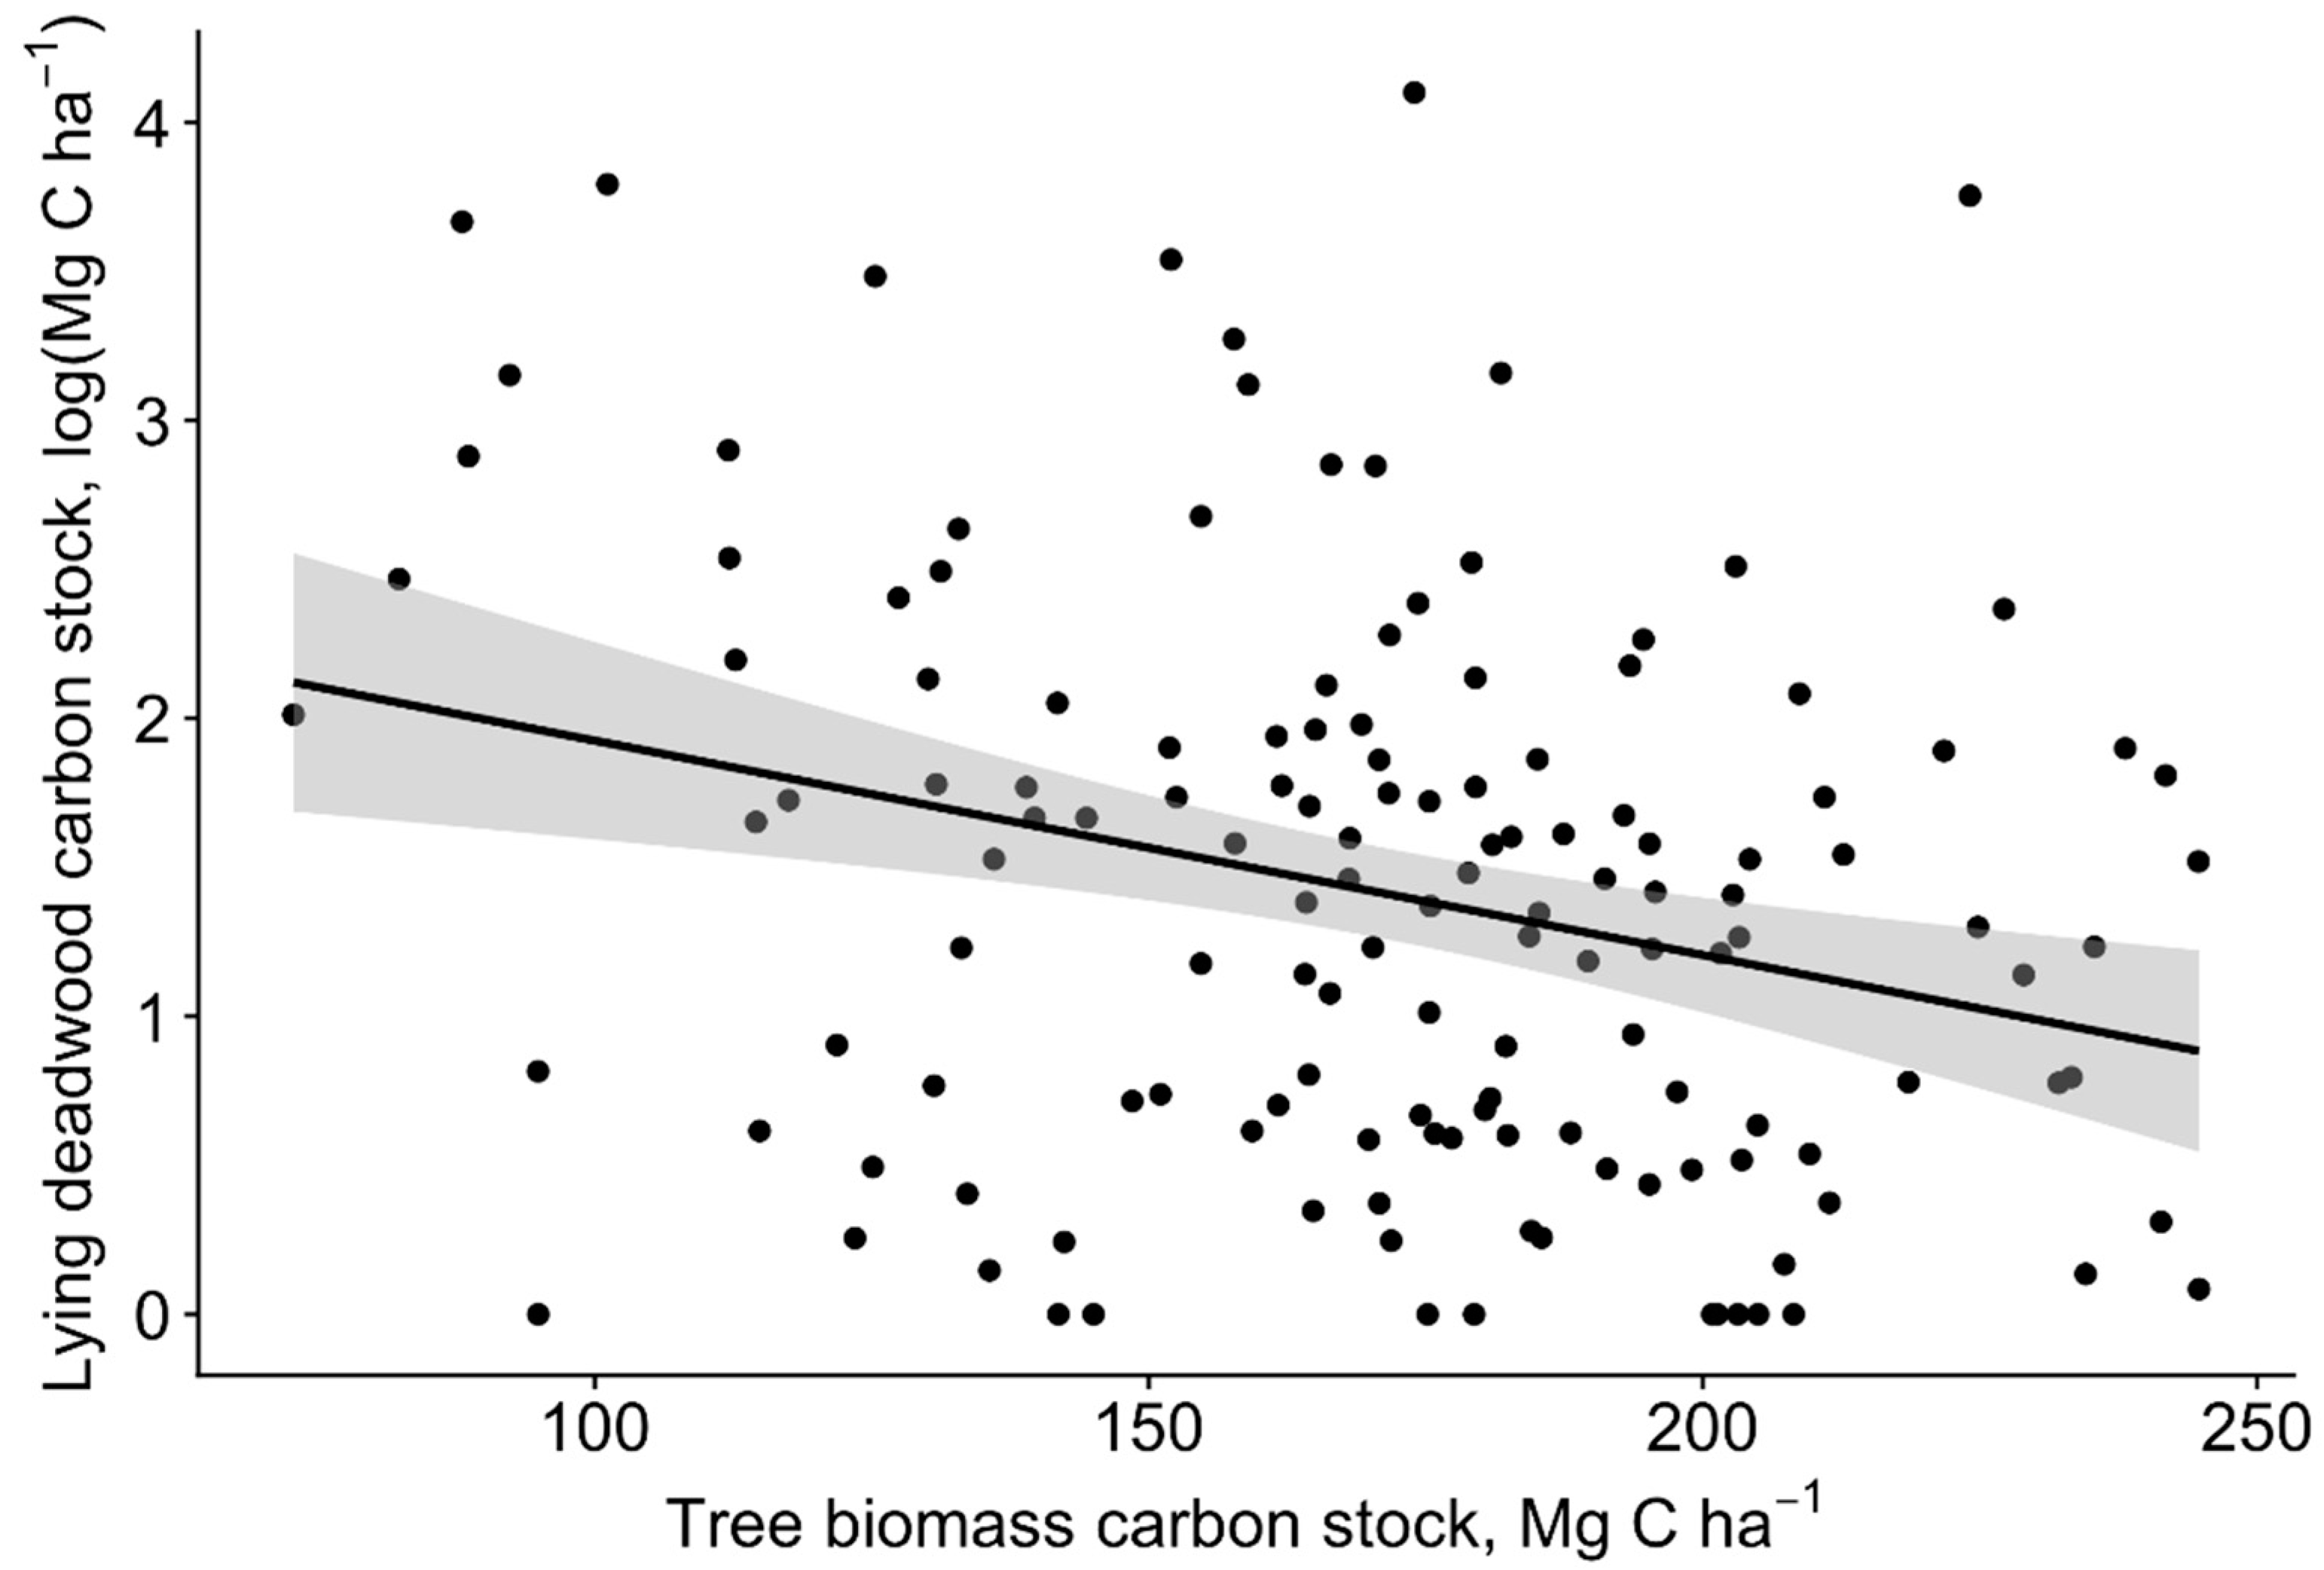
The total deadwood carbon pool was highly variable among the sample plots, ranging from 0.5 Mg C ha−1 to 74.6 Mg C ha−1 (mean 14.8 ± 2.1 Mg C ha−1); deadwood was absent in four sample plots. The results show no relationship between carbon pools of living tree biomass and the total deadwood (slope = −0.003, t-value = −244, p = 0.151) using the LME model. The total carbon pools of living tree biomass were significantly negatively related to the total lying deadwood carbon pool (slope = −0.007, t-value = −3.279, p = 0.001; Figure 3).
Overall, the share of the carbon pool from the total deadwood carbon pool was higher in the standing dead trees than in the lying deadwood, approximately 48.0% vs. 40.0%, respectively. The smallest mean carbon pool of deadwood was in snags (1.8 ± 0.4 Mg C ha−1).
Both forest floor and mineral soil (0–80 cm) carbon pool variability was high. The mean values were 15.2 ± 7.1 Mg C ha−1 and 90.0 ± 38.9 Mg C ha−1, respectively. The carbon pool of mineral soil (0–80 cm) ranged from 33.8 Mg C ha−1 to 301.5 Mg C ha−1 with 15.2 ± 6.7 Mg C ha−1 in the upper 0–10 cm layer and 42.3 ± 38.3 Mg C ha−1 in the 40–80 cm layer. The mean bulk density in the upper 0–10 cm layer was 963 kg m3 (ranging from 63 to 1481 kg m3), in the 10–20 cm layer 1143 kg m3 (ranging from 63 to 1657 kg m3), in the 20–40 cm layer 1295 kg m3 (ranging from 81 to 2061 kg m3), and in the 40–80 cm layer 1485 kg m3 (ranging from 865 to 2486 kg m3).
Almost 60% of the total ecosystem carbon in old-growth pine stands was found in the living tree biomass, which represented the largest forest carbon pool. Mineral soil was the second-largest carbon pool, comprising up to 31% of the total ecosystem carbon. Both the forest floor and deadwood were marginal carbon pools. Comparing stands within the studied stand age group (163–218 years) did not show any notable trend of changes in the size of forest carbon pools with ageing.
4. Discussion
Forest carbon pools generally vary with stand age [8,40,41]; however, in our study, we focused on the old-growth stands, specifically assessing the age range of 163–218 years. Our results showed that the forest carbon pools did not change significantly over the analysed period. Similar observations were reported by Seedre et al. [22] for a montane old-growth Norway spruce stand (116–145 years) in the Bohemian Forest in the Czech Republic. In our study, the lack of significant changes in the TEC pool, over the analysed stand age range, implies that these forests might be carbon neutral or even sources [22]. In old-growth forests, the net ecosystem productivity (NEP) is low due to the slow increase of living biomass [20], and combined with a rather large amount of decomposing deadwood [22] can lead to negative NEP. Yet, a carbon exchange study is needed to precisely assess the NEP balance in these sites.
Our results suggest, that old-growth Scots pine-dominated forests are important carbon stores with a mean of 291 ± 54.2 Mg C ha−1. Slightly lower TEC values have been obtained in old-growth hemiboreal Norway spruce stands (range of 225 to 249 Mg C ha−1) [21]. Overall, TEC pools in old-growth hemiboreal forests are considerably larger than in old-growth boreal forests [16]. In our study, similar to other studies [16,21,22], the largest carbon pool was the living tree biomass. Our results showed that in older stands there were fewer but larger individual trees (Figure 2). Hence, in older stands the importance of individual tree contributions to TEC increases, and in the case of dieback of a few trees, the proportion between different carbon pools can be considerably altered.
The forest floor and deadwood were the two smallest carbon pools (each 5% of TEC). In our study, the estimated mean forest floor carbon pool (15.2 ± 7.1 Mg C ha−1) was considerably lower than the estimated forest carbon pool in Scots pine-dominated forests (82–132 years) in Estonia (mean 80 Mg ha−1, ranging from 5–120 Mg ha−1) [42]. The huge variation of forest floor carbon pools in pine-dominated hemiboreal forests is likely driven by a large variation in litter production [22] and site ecological conditions [42].
In our study, the deadwood carbon pool was highly variable, with a mean of 14.8 ± 2.1 Mg C ha−1. The mean deadwood carbon pool values corresponded well with the results (approximately 17 Mg C ha−1) from old-growth boreal forests in northwest Russia [43], but considerably higher values were observed in over-mature Norway spruce stands in Central Europe (approximately 49 Mg C ha−1) [14]. The basis for deadwood formation is stand yield and density, which most likely explains observed differences with Central European forests [13,40]. In our study, the lying deadwood carbon pool slightly (p = 0.04) decreased with an increasing living tree biomass carbon pool (Figure 3). We assume that a higher volume of long-lasting deadwood likely hinders the tree regeneration and growth. Studies show that dead standing Scots pine trees, in particular, can stand for several decades following their death [44,45], leaving a long-lasting effect on microsite conditions.
In our study, widely ranging SOC pools (34–302 Mg C ha−1) were similar to other observations, which concluded, that these pools are highly variable, particularly within the boreal zone [40,46]. Studies show that soil organic carbon depends not only on climate conditions but also on the soil texture (physical and chemical properties), the time since the last disturbance (human-made/natural), the parent material, and the vegetation [5,47,48].
The assessed values of carbon pools in our study potentially represent the upper limit of carbon pools characterising undisturbed hemiboreal old-growth Scots pine stands (i.e., the situation where most of the dominated cohorts in the stand are old Scots pines). Studies show that Scots pines can reach a notably older age than those of our study, and such old stands are usually associated with slow growth determined by poor soil conditions (e.g., bogs) or harsh climatic conditions (e.g., northern boreal forests). Thus, the total biomass most likely is lower than that of our study. Succession in boreal forests, changing the dominant cohort of trees (old-growth to younger), can be a lengthy process associated with lower standing biomass [49]. Although living biomass might decline in old-growth forests, carbon accumulation continues in soil and deadwood pools [24,50].
5. Conclusions
In hemiboreal old-growth Scots pine stands on mesotrophic soils, the living tree biomass and mineral soil were estimated to be the main carbon pools, which, however, appeared unaffected by age (within the age range of 163–218 years). The carbon pool values in our study potentially represent the upper limit of carbon pools in undisturbed hemiboreal old-growth Scots pine stands, which can be used in carbon modelling and long-term silviculture management planning. Considering the large local/regional variance in different carbon pools (deadwood, forest floor and soil) in old-growth pine forests, more research is needed to assess the effect of ecological local/regional factors that control the carbon sequestration.
Author Contributions
Ā.J. conceived of the original research idea and contributed to the experimental design. I.J. and L.Ķ. were responsible for the data collection. L.Ķ. and L.L. analysed the data. D.Z. critically reviewed and edited the manuscript. L.Ķ. had the main responsibility of writing the manuscript with contributions from other co-authors.
Funding
This research was funded by the Joint Stock Company Latvia’s State Forests project assessment of greenhouse gas emissions and CO2 sequestration in old forest stands.
Conflicts of Interest
The authors declare no conflict of interest.
References
- Park, A.; Puettmann, K.; Wilson, E.; Messier, C.; Kames, S.; Dhar, A. Can boreal and temperate forest management be adapted to the uncertainties of 21st century climate change? Crit. Rev. Plant Sci. 2014, 33, 251–285. [Google Scholar] [CrossRef]
- Birdsey, R.; Pan, Y. Trends in management of the world’s forests and impacts on carbon stocks. For. Ecol. Manag. 2015, 355, 83–90. [Google Scholar] [CrossRef]
- Bradshaw, C.J.A.; Warkentin, I.G. Global estimates of boreal forest carbon stocks and flux. Glob. Planet. Chang. 2015, 128, 24–30. [Google Scholar] [CrossRef]
- Luyssaert, S.; Schulze, E.D.; Börner, A.; Knohl, A.; Hessenmöller, D.; Law, B.E.; Ciais, P.; Grace, J. Old-growth forests as global carbon sinks. Nature 2008, 455, 213–215. [Google Scholar] [CrossRef] [PubMed]
- Angst, G.; Messinger, J.; Greiner, M.; Häusler, W.; Hertel, D.; Kirfel, K.; Kögel-Knabner, I.; Leuschner, C.; Rethemeyer, J.; Mueller, C.W. Soil organic carbon stocks in topsoil and subsoil controlled by parent material, carbon input in the rhizosphere, and microbial-derived compounds. Soil Biol. Biochem. 2018, 122, 19–30. [Google Scholar] [CrossRef]
- Bond-Lamberty, B.; Peckham, S.D.; Ahl, D.E.; Gower, S.T. The dominance of fire in determining carbon balance of the central Canadian boreal forest. Nature 2007, 450, 89–92. [Google Scholar] [CrossRef] [PubMed]
- Nord-Larsen, T.; Vesterdal, L.; Bentsen, N.S.; Larsen, J.B. Ecosystem carbon stocks and their temporal resilience in a semi-natural beech-dominated forest. For. Ecol. Manag. 2019, 447, 67–76. [Google Scholar] [CrossRef]
- Wei, Y.; Li, M.; Chen, H.; Lewis, B.J.; Yu, D.; Zhou, L.; Zhou, W.; Fang, X.; Zhao, W.; Dai, L. Variation in carbon storage and its distribution by stand age and forest type in boreal and temperate forests in northeastern China. PLoS ONE 2013, 8, e72201. [Google Scholar] [CrossRef]
- Uri, V.; Kukumägi, M.; Aosaar, J.; Varik, M.; Becker, H.; Aun, K.; Krasnova, A.; Morozov, G.; Ostonen, I.; Mander, Ü.; et al. The carbon balance of a six-year-old Scots pine (Pinus sylvestris L.) ecosystem estimated by different methods. For. Ecol. Manag. 2019, 433, 248–262. [Google Scholar] [CrossRef]
- Liski, J.; Lehtonen, A.; Palosuo, T.; Peltoniemi, M.; Eggers, T.; Muukkonen, P.; Mäkipää, R. Carbon accumulation in Finland’s forests 1922–2004#x2014;An estimate obtained by combination of forest inventory data with modelling of biomass, litter and soil. Ann. For. Sci. 2006, 63, 687–697. [Google Scholar] [CrossRef]
- Jandl, R.; Lindner, M.; Vesterdal, L.; Bauwens, B.; Baritz, R.; Hagedorn, F.; Johnson, D.W.; Minkkinen, K.; Byrne, K.A. How strongly can forest management influence soil carbon sequestration? Geoderma 2007, 137, 253–268. [Google Scholar] [CrossRef]
- Bravo-Oviedo, A.; Ruiz-Peinado, R.; Modrego, P.; Alonso, R.; Montero, G. Forest thinning impact on carbon stock and soil condition in Southern European populations of P. sylvestris L. For. Ecol. Manag. 2015, 357, 259–267. [Google Scholar] [CrossRef]
- Moreno-Fernández, D.; Díaz-Pinés, E.; Barbeito, I.; Sánchez-González, M.; Montes, F.; Rubio, A.; Cañellas, I. Temporal carbon dynamics over the rotation period of two alternative management systems in Mediterranean mountain Scots pine forests. For. Ecol. Manag. 2015, 348, 186–195. [Google Scholar] [CrossRef]
- Jacob, M.; Bade, C.; Calvete, H.; Dittrich, S.; Leuschner, C.; Hauck, M. Significance of over-mature and decaying trees for carbon stocks in a Central European natural spruce forest. Ecosystems 2013, 16, 336–346. [Google Scholar] [CrossRef]
- Seedre, M.; Shrestha, B.M.; Chen, H.Y.H.; Colombo, S.; Jõgiste, K. Carbon dynamics of North American boreal forest after stand replacing wildfire and clearcut logging. J. For. Res. 2011, 16, 168–183. [Google Scholar] [CrossRef]
- Finér, L.; Mannerkoski, H.; Piirainen, S.; Starr, M. Carbon and nitrogen pools in an old-growth, Norway spruce mixed forest in eastern Finland and changes associated with clear-cutting. For. Ecol. Manag. 2003, 174, 51–63. [Google Scholar] [CrossRef]
- Sabatini, F.M.; Burrascano, S.; Keeton, W.S.; Levers, C.; Lindner, M.; Pötzschner, F.; Verkerk, P.J.; Bauhus, J.; Buchwald, E.; Chaskovsky, O.; et al. Where are Europe’s last primary forests? Divers. Distrib. 2018, 24, 1426–1439. [Google Scholar] [CrossRef]
- Kitenberga, M.; Drobyshev, I.; Elferts, D.; Matisons, R.; Adamovics, A.; Katrevics, J.; Niklasson, M.; Jansons, A. A mixture of human and climatic effects shapes the 250-year long fire history of a semi-natural pine dominated landscape of Northern Latvia. For. Ecol. Manag. 2019, 441, 192–201. [Google Scholar] [CrossRef]
- Seedre, M.; Taylor, A.R.; Brassard, B.W.; Chen, H.Y.H.; Jõgiste, K. Recovery of ecosystem carbon stocks in young boreal forests: A comparison of harvesting and wildfire disturbance. Ecosystems 2014, 17, 851–863. [Google Scholar] [CrossRef]
- Taylor, A.R.; Seedre, M.; Brassard, B.W.; Chen, H.Y.H. Decline in net ecosystem productivity following canopy transition to late-succession forests. Ecosystems 2014, 17, 778–791. [Google Scholar] [CrossRef]
- Ķēniņa, L.; Elferts, D.; Bāders, E.; Jansons, Ā. Carbon pools in a hemiboreal over-mature Norway Spruce stands. Forests 2018, 9, 435. [Google Scholar] [CrossRef]
- Seedre, M.; Kopáček, J.; Janda, P.; Bače, R.; Svoboda, M. Carbon pools in a montane old-growth Norway spruce ecosystem in Bohemian Forest: Effects of stand age and elevation. For. Ecol. Manag. 2015, 346, 106–113. [Google Scholar] [CrossRef]
- Kranabetter, J.M. Site carbon storage along productivity gradients of a late-seral southern boreal forest. Can. J. For. Res. 2008, 39, 1053–1060. [Google Scholar] [CrossRef]
- Zhou, G.; Liu, S.; Li, Z.; Zhang, D.; Tang, X.; Zhou, C.; Yan, J.; Mo, J. Old-growth forests can accumulate carbon in soils. Science 2006, 314, 1417. [Google Scholar] [CrossRef]
- Shanin, V.; Komarov, A.; Mäkipää, R. Tree species composition affects productivity and carbon dynamics of different site types in boreal forests. Eur. J. For. Res. 2014, 133, 273–286. [Google Scholar] [CrossRef]
- Ahti, T.; Hämet-Ahti, L.; Jalas, J. Vegetation zones and their sections in north-western Europe. Ann. Bot. Fenn. 1968, 5, 169–211. [Google Scholar]
- Schelhaas, M.J.; Nabuurs, G.J.; Hengeveld, G.; Reyer, C.; Hanewinkel, M.; Zimmermann, N.E.; Cullmann, D. Alternative forest management strategies to account for climate change-induced productivity and species suitability changes in Europe. Reg. Environ. Chang. 2015, 15, 1581–1594. [Google Scholar] [CrossRef] [Green Version]
- Triviño, M.; Pohjanmies, T.; Mazziotta, A.; Juutinen, A.; Podkopaev, D.; Le Tortorec, E.; Mönkkönen, M. Optimizing management to enhance multifunctionality in a boreal forest landscape. J. Appl. Ecol. 2017, 54, 61–70. [Google Scholar] [CrossRef]
- Jansons, A.; Matisons, R.; Zadina, M.; Sisenis, L.; Jansons, J. The effect of climatic factors on height increment of Scots pine in sites differing by continentality in Latvia. Silva Fenn. 2015, 49, 14. [Google Scholar] [CrossRef]
- Bušs, K. Fundamentals of Forest Classification in Latvia SSR; LRZTIPI: Rīga, Latvia, 1976; p. 24. (In Latvian) [Google Scholar]
- Köster, K.; Metslaid, M.; Engelhart, J.; Köster, E. Dead wood basic density, and the concentration of carbon and nitrogen for main tree species in managed hemiboreal forests. For. Ecol. Manag. 2015, 354, 35–42. [Google Scholar] [CrossRef]
- Fleck, S.; Cools, N.; De Vos, B.; Meesenburg, H.; Fischer, R. The Level II aggregated forest soil condition database links soil physicochemical and hydraulic properties with long-term observations of forest condition in Europe. Ann. For. Sci. 2016, 73, 945–957. [Google Scholar] [CrossRef] [Green Version]
- Sharma, R.P.; Vacek, Z.; Vacek, S. Nonlinear mixed effect height-diameter model for mixed species forests in the central part of the Czech Republic. J. For. Sci. 2016, 62, 470–484. [Google Scholar] [CrossRef] [Green Version]
- Liepa, I. Tree Growth Study; LLU: Jelgava, Latvia, 1996; p. 31. (In Latvian) [Google Scholar]
- Liepiņš, J.; Lazdiņš, A.; Liepiņš, K. Equations for estimating above- and belowground biomass of Norway spruce, Scots pine, birch spp. and European aspen in Latvia. Scand. J. For. Res. 2018, 33, 58–70. [Google Scholar] [CrossRef]
- Thomas, S.C.; Martin, A.R. Carbon content of tree tissues: A synthesis. Forests 2012, 3, 332–352. [Google Scholar] [CrossRef]
- Neumann, M.; Moreno, A.; Mues, V.; Härkönen, S.; Mura, M.; Bouriaud, O.; Lang, M.; Achten, W.M.J.; Thivolle-Cazat, A.; Bronisz, K.; et al. Comparison of carbon estimation methods for European forests. For. Ecol. Manag. 2016, 361, 397–420. [Google Scholar] [CrossRef]
- Baritz, R.; Seufert, G.; Montanarella, L.; van Ranst, E. Carbon concentrations and stocks in forest soils of Europe. For. Ecol. Manag. 2010, 260, 262–277. [Google Scholar] [CrossRef]
- Bates, D.; Mächler, M.; Bolker, B.; Walker, S. Fitting linear mixed-effects models using lme4. J. Stat. Softw. 2015, 67, 1–48. [Google Scholar] [CrossRef]
- Pregitzer, K.S.; Euskirchen, E.S. Carbon cycling and storage in world forests: Biome patterns related to forest age. Glob. Chang. Biol. 2004, 10, 2052–2077. [Google Scholar] [CrossRef]
- Lee, J.; Tolunay, D.; Makineci, E.; Çömez, A.; Son, Y.M.; Kim, R.; Son, Y. Estimating the age-dependent changes in carbon stocks of Scots pine (Pinus sylvestris L.) stands in Turkey. Ann. For. Sci. 2016, 73, 523–531. [Google Scholar] [CrossRef]
- Kriiska, K.; Frey, J.; Asi, E.; Kabral, N.; Uri, V.; Aosaar, J.; Varik, M.; Napa, Ü.; Apuhtin, V.; Timmusk, T.; et al. Variation in annual carbon fluxes affecting the SOC pool in hemiboreal coniferous forests in Estonia. For. Ecol. Manag. 2019, 433, 419–430. [Google Scholar] [CrossRef]
- Krankina, O.N.; Harmon, M.E. Dynamics of the dead wood carbon pool in northwestern Russian boreal forests. Water Air Soil Pollut. 1995, 82, 227–238. [Google Scholar] [CrossRef]
- Rouvinen, S.; Kuuluvainen, T.; Siitonen, J. Tree mortality in a Pinus sylvestris dominated boreal forest landscape in Vienansalo wilderness, eastern Fennoscandia. Silva Fenn. 2002, 36, 554. [Google Scholar] [CrossRef]
- Kuuluvainen, T.; Aakala, T.; Várkonyi, G. Dead standing pine trees in a boreal forest landscape in the Kalevala National Park, northern Fennoscandia: Amount, population characteristics and spatial pattern. For. Ecosyst. 2017, 4. [Google Scholar] [CrossRef]
- Lutter, R.; Kõlli, R.; Tullus, A.; Tullus, H. Ecosystem carbon stocks of Estonian premature and mature managed forests: Effects of site conditions and overstorey tree species. Eur. J. For. Res. 2019, 138, 125–142. [Google Scholar] [CrossRef]
- Callesen, I.; Liski, J.; Raulund-Rasmussen, K.; Olsson, M.T.; Tau-Strand, L.; Vesterdal, L.; Westman, C.J. Soil carbon stores in Nordic well-drained forest soils relationships with climate and texture class. Glob. Chang. Biol. 2003, 9, 358–370. [Google Scholar] [CrossRef]
- Krasnova, A.; Kukumägi, M.; Mander, Ü.; Torga, R.; Krasnov, D.; Noe, M.; Ostonen, I.; Püttsepp, Ü.; Killian, H.; Uri, V.; et al. Carbon exchange in a hemiboreal mixed forest in relation to tree species composition. Agric. For. Meteorol. 2019, 275, 11–23. [Google Scholar] [CrossRef]
- Martin, M.; Fenton, N.; Morin, H. Structural diversity and dynamics of boreal old-growth forests case study in Eastern Canada. For. Ecol. Manag. 2018, 422, 125–136. [Google Scholar] [CrossRef]
- Ciais, P.; Janssens, I.; Shvidenko, A.; Wirth, C.; Malhi, Y.; Grace, J.; Schulze, E.D.; Heimann, M.; Phillips, O.; Dolman, A.J. The potential for rising CO2 to account for the observed uptake of carbon by tropical, temperate and boreal forest biomes. In The Carbon Balance of Forest Biomes; Griffith, H., Jarvis, P., Eds.; Taylor & Francis: London, UK, 2005; pp. 109–150. [Google Scholar]
Figure 1.
Location of the sampled old-growth Scots pine-dominated stands in the territory of Latvia.
Figure 1.
Location of the sampled old-growth Scots pine-dominated stands in the territory of Latvia.

Figure 2.
(A) The mean tree diameter at breast height (DBH) and (B) stand density versus stand age in the upper and second tree layers in old-growth Scots pine-dominated sampling plots (n = 143).
Figure 2.
(A) The mean tree diameter at breast height (DBH) and (B) stand density versus stand age in the upper and second tree layers in old-growth Scots pine-dominated sampling plots (n = 143).

Figure 3.
Changes in the lying deadwood carbon stock with the increasing carbon stock of the living tree biomass in the sampled old-growth pine stands ± 95% confidence interval (n = 143).
Figure 3.
Changes in the lying deadwood carbon stock with the increasing carbon stock of the living tree biomass in the sampled old-growth pine stands ± 95% confidence interval (n = 143).


Table 1.
Carbon pool size (Mg C ha−1) ± 95% confidence interval (CI) with the percentage of the pool from the total ecosystem carbon.
Table 1.
Carbon pool size (Mg C ha−1) ± 95% confidence interval (CI) with the percentage of the pool from the total ecosystem carbon.
| Carbon Pool | Mean ± CI | % |
|---|---|---|
| Above-ground tree biomass | 135.8 ± 4.9 | 47 |
| Below-ground tree biomass | 35.4 ± 1.2 | 12 |
| Living tree biomass (n = 143) | 171.2 ± 6.1 | 59 |
| Lying deadwood | 5.9 ± 1.5 | 2 |
| Standing dead trees | 7.1 ± 1.2 | 2 |
| Snags | 1.8 ± 0.4 | 1 |
| Total deadwood (n = 143) | 14.8 ± 2.1 | 5 |
| Forest floor (n = 18) | 15.2 ± 7.1 | 5 |
| Mineral soil (0–80 cm; n = 18) | 90.0 ± 38.9 | 31 |
| Total ecosystem carbon1 | 291.2 ± 54.2 | 100 |
1 Except ground vegetation.
© 2019 by the authors. Licensee MDPI, Basel, Switzerland. This article is an open access article distributed under the terms and conditions of the Creative Commons Attribution (CC BY) license (http://creativecommons.org/licenses/by/4.0/).
Share and Cite
MDPI and ACS Style
Ķēniņa, L.; Jaunslaviete, I.; Liepa, L.; Zute, D.; Jansons, Ā. Carbon Pools in Old-Growth Scots Pine Stands in Hemiboreal Latvia. Forests 2019, 10, 911. https://doi.org/10.3390/f10100911
AMA Style
Ķēniņa L, Jaunslaviete I, Liepa L, Zute D, Jansons Ā. Carbon Pools in Old-Growth Scots Pine Stands in Hemiboreal Latvia. Forests. 2019; 10(10):911. https://doi.org/10.3390/f10100911
Chicago/Turabian StyleĶēniņa, Laura, Ieva Jaunslaviete, Līga Liepa, Daiga Zute, and Āris Jansons. 2019. "Carbon Pools in Old-Growth Scots Pine Stands in Hemiboreal Latvia" Forests 10, no. 10: 911. https://doi.org/10.3390/f10100911
Note that from the first issue of 2016, this journal uses article numbers instead of page numbers. See further details here.