Leaf Physiological Responses to Drought Stress and Community Assembly in an Asian Savanna


1
Department of Forest Inventory and Sustainable Forest Management, Silviculture Research Institute, Vietnamese Academy of Forest Sciences, No. 46, Duc Thang, Bac Tu Liem, Ha Noi 100000, Vietnam
2
School of Ecosystem and Forest Sciences, The University of Melbourne, 500 Yarra Boulevard, Richmond, VIC 3121, Australia
*
Author to whom correspondence should be addressed.
Forests 2019, 10(12), 1119; https://doi.org/10.3390/f10121119
Submission received: 3 November 2019
/
Revised: 15 November 2019
/
Accepted: 6 December 2019
/
Published: 8 December 2019
(This article belongs to the Section Forest Ecophysiology and Biology)
Abstract
:Deciduous dipterocarp forest (DDF) is the most extensive forest type in continental Southeast Asia, but across much of its range is functionally more similar to tropical savannas than tropical forests. We investigated water relations and drought responses of the four dominant tree species (two Shorea and two Dipterocarpus species) of the DDF in central Vietnam to determine how they responded to prolonged periods of drought stress. We quantified leaf water relations in nursery- and field-grown seedlings of the four species and conducted a dry-down experiment on 258 seedlings to study leaf water potential and morphological responses of the seedlings following the drought stress. The two Shorea and two Dipterocarpus species differed significantly in leaf water potential at turgor loss point and osmotic potential at full turgor, but they showed similar responses to drought stress. All species shed leaves and suffered from stem loss when exposed to water potentials lower than their turgor loss point (approximately −1.7 MPa for Dipterocarpus and −2.6 MPa for Shorea species). Upon rewatering, all species resprouted vigorously regardless of the degree of leaf or stem loss, resulting in only 2% whole-plant mortality rate. Our results suggest that none of the four deciduous dipterocarp species is drought tolerant in terms of their water relations; instead, they employ drought-adaptive strategies such as leaf shedding and vigorous resprouting. Given that all species showed similar drought avoidance and drought-adaptive strategies, it is unlikely that seasonal drought directly influences the patterns of species assembly in the DDF of Southeast Asia.
1. Introduction
Drought-induced tree mortality is a significant issue in tropical wet forests [1,2,3,4,5]. Large areas of the tropics experience seasonal droughts each year and tree species in these areas have evolved mechanisms to cope with low water availability during the annual dry season. These mechanisms range from the molecular level such as the involvement of drought-tolerant genes and proteins [6] to cell functioning at low water availability [7] and leaf-level physiological responses such as stomatal closure [8,9] and osmotic adjustment [10]. Plant-level adaptive traits such as leaf shedding, development of deep roots, and the ability to resprout [7,11,12,13,14] also play a critical role in drought stress tolerance. While many studies on tree physiological adaptations to drought in seasonally dry tropical ecosystems have been conducted in America, Australia, and Africa (e.g., [11,15,16,17]), relatively few have examined the seasonal forests in the tropics of Asia. Unlike the American and African seasonal tropics, vast expanses of the Asian seasonal tropics are dominated by a handful of closely related species, specifically the deciduous dipterocarps [18,19,20,21].
The deciduous dipterocarp forests (DDF) of continental Southeast Asia share many features common to savannas in Australia, Africa, and South America [19,22,23]. The forests occur in a seasonal climate with a distinct dry season of 4–7 months each year in which <100 mm of rain falls per month [24,25]. The DDF is characterized by a discontinuous tree layer with a continuous grass layer and the occurrence of frequent, but low-intensity, prescribed fire in the dry season following a long period of drought [26]. Most of the deciduous dipterocarp species have the ability to resprout following drought and fire in the dry season [22,23]. At the stand level, the DDF is dominated by four species of Dipterocarpaceae: Dipterocarpus obtusifolius Teysm. ex Miq., D. tuberculatus Roxb, Shorea obtusa Wall. ex Blume, and S. siamensis (Kurz) Miq. These species often form distinct communities where only one or two of the four species account for a large proportion (up to >90%) of the tree density and basal area in a community [24,25,27,28,29]. Shorea-dominated communities in the DDF are typically associated with drier sites, while Dipterocarpus-dominated communities (especially with Dipterocarpus obtusifolius) are often associated with moister sites [24,25,27,28]. We hypothesized that the species distribution patterns are associated with inherent physiological differences among the species, particularly at the seedling stage, in terms of their tolerance of the low water availability during the annual dry season.
Severe drought may cause far greater effects on the growth and mortality of seedlings than adult trees because seedlings are more vulnerable to drought stress due to their small and shallow root system and limited carbohydrate reserves [12,30]. Dry-down experiments are often used to study responses of seedlings to various degrees of drought stress [7,12,15,30]. This experimental approach can reveal the link between physiological traits (such as water potential) and drought stress performances of seedlings (such as leaf retention or survival). This allows us to understand the extent to which drought stress is either tolerated (low water potential and high leaf retention) or avoided (high water potential and low leaf retention). In addition, it may show the link between drought stress and other physiological traits that are used as tolerance indicators, such as the water potential at turgor loss point (Ψtlp), a key trait for understanding species’ responses to drought stress [31]. Moreover, the responses of seedlings following drought-stress experiments may reveal other morphological mechanisms and adaptations that support our understanding of drought resistance of the deciduous dipterocarp species.
To better understand the influence of drought stress in the dry season on the deciduous dipterocarp species, we addressed three specific questions:
- How do leaf water relations differ among the four dominant deciduous dipterocarp species;
- How do the four species differ in their physiological responses to drought stress in response to a progressive dry-down; and
- Are there other adaptive traits such as leaf shedding or resprouting among the four species that mitigate the impacts of seasonal drought?
Based on these results, we considered how differences in drought responses could be linked to the observed species distribution patterns across moisture gradients in the DDF.
2. Materials and Methods
2.1. Study Site and Species
The study was conducted at YokDon National Park (YDNP), Dak Lak Province, in the Central Highlands of Vietnam (12.702° N and 107.716° E). YokDon National Park is one of the largest national parks in Vietnam, covering 115,545 ha [32]. DDF is the dominant vegetation type within this landscape and accounts for approximately 80% of YDNP’s area [32]. YokDon National Park experiences a strongly seasonal climate with mean annual rainfall of 1573 mm [33]. The dry season lasts from November to April and typically receives <100 mm rainfall [33].
The DDF shares many of the common features of savannas [22] but has historically been classified as a forest in regional forest classification systems [22,34,35]. Structurally, the DDF is characterized by a low-density tree layer and a continuous layer of grasses, forbs, and seedlings of the canopy tree species [24,25,27,28,36]. The DDF has relatively low tree species richness with 3–16 tree species of ≥1 cm DBH (Diameter at Breast Height) found in a network of 0.04 ha plots at YDNP [29]. Four species of the Dipterocarpaceae (Dipterocarpus obtusifolius, D. tuberculatus, Shorea obtusa, and S. siamensis) dominate the basal area and tree density of the canopy layer [24,25,28,29,36]. All four species are completely deciduous in the dry season, have thick bark as adults, and can resprout as seedlings. During the dry season, most other canopy tree species in the DDF may be leafless for 1–2 weeks up to six months [35], while the grass and seedling layers often dry out and become flammable [26].
2.2. Experimental Design
2.2.1. Material Preparations
In 2014 we collected seeds of the four dominant dipterocarp species soon after they dispersed in the peak of seed dispersal season: April (D. obtusifolius), May (D. tuberculatus and S. siamensis), and early June (S. obtusa). Right after seed collection, all seeds were soaked in water and kept moist until they germinated. It took 3–4 days for most Shorea seeds to germinate, whereas Dipterocarpus seeds germinated sporadically over 1–3 weeks. In an open-top nursery, the germinated seeds were planted in individual polybags (9 cm diameter × 16 cm height) filled with sandy loam soils collected from nearby forests. The seedlings were grown in the nursery for two wet seasons and one dry season before the start of the experiments at the beginning of the second dry season (i.e., November 2015 when the seedlings were 18 months old). We conducted the experiment on seedlings during their second dry season because most seedlings were too small (S. obtusa) or had too few leaves (D. obtusifolius and D. tuberculatus) for experimentation during their first dry season when they were 6–7 months old. In the nursery, the seedlings did not receive any fertilizers and relied on natural rain during the wet season. During the first dry season, they were manually watered every 2–4 days to keep them alive. However, during the first dry season, there was a period of three weeks during which the seedlings did not receive any water. During this period, many seedlings experienced drought stress and shed their leaves and/or lost their stems. This accidental dry period created conditions similar to the drought stress that seedlings in the field experience during the annual dry season. The 18-month-old seedlings in the nursery were used for both the water relations measurements and the dry-down experiment.
2.2.2. Water Relations
The drought tolerance of the four deciduous dipterocarp species was assessed based on leaf water relations [37,38] from pressure–volume (pV) curves. These included water potential at turgor loss point (Ψtlp), osmotic potential at full turgor (πo), relative water content at turgor loss point (RWCtlp), and bulk modulus of elasticity (ε).
Pressure–volume (pV) curves were developed for five well-watered D. obtusifolius, seven D. tuberculatus, nine S. obtusa, and eight S. siamensis nursery-grown seedlings using the bench drying method [39]. We used a single leaf from each seedling for our measurements, except for S. obtusa for which a single shoot (usually with 2–3 leaves) was used because the leaf petioles were too short to use in the pressure chamber. However, for brevity we refer to this as the leaf sample throughout. The water potential in the nursery was measured with a pressure chamber (Model 1000, PMS Instrument Company, Albany, OR, USA) from 21 November 2015 to 19 December 2015 (i.e., at the beginning of the 2015–2016 dry season).
One healthy fully expanded leaf was cut from each seedling and immediately weighed to 0.001 g and immersed in water for at least three hours for full rehydration. After rehydration, the leaf was dried and weighed to obtain the turgid weight. The leaf was then pressurized in the pressure chamber for one measurement and weighed again to determine the leaf’s weight reduction due to water loss. We measured one leaf at a time and the first five measurements were usually done within 10–15 min. After all measurements of a single leaf were completed, the leaves were oven-dried at 40 °C for 48 h or until no further weight loss occurred. The dry weight of the leaf was later used to determine the relative water content (RWC) using the equation: RWC = [(Fresh weight − Dry weight)/(Turgid weight − Dry weight)]*100. The Ψ, RWC, and leaf weight data were then fitted in a pV-curve-fitting spreadsheet (\http://www.landflux.org/resources/PV_Curve_Fitting_5.6.xls) for both the nonlinear and linear sections of each pV curve. The curve fitting was based on the method described by Schulte and Hinckley [40]. Fitting the curves allowed us to calculate water relation traits such as Ψtlp, πo, RWCtlp, and ε.
To investigate whether the leaf water relations quantified in the nursery seedlings were comparable to seedlings grown under field conditions, we also measured pV curves for eight D. obtusifolius, nine D. tuberculatus, six S. obtusa, and five S. siamensis seedlings that had been outplanted into the field as part of a separate experiment. All nursery and outplanted seedlings were grown from the same seed collections (i.e., same source and age) and measured for pV curves in the same period with the same pressure chamber. The outplanted seedlings had grown for two months in the nursery (after germination) and were then outplanted in the DDF 16 months prior to measurement. Most of the outplanted seedlings also lost their above-ground stems in the first dry season under natural conditions. However, they all resprouted in the following wet season, resulting in multiple stems field seedlings. Neither fertilizers nor supplementary water was applied to the field-grown seedlings.
2.2.3. Water Potential and Drought Stress Performances in a Dry-Down Experiment
In addition to quantifying intrinsic leaf water relations, we conducted a dry-down experiment to examine the differences in species-specific responses to potentially terminal drought. We conducted this experiment at the same time as the measurements of the leaf water relations using seedlings from the same source and of the same age.
Before the start of the experiment, we counted the number of stems, measured basal diameter and height, and photographed each seedling. If the seedlings had multiple stems, only the largest stem was measured. At the start of the experiment, the mean stem diameters of the four species ranged from 3.1 to 3.5 mm and did not differ significantly; however, their heights ranged from 17.6 to 23.8 cm and were significantly different (Table S1). After taking the pre-experiment size measurements, we randomly divided the seedlings of each species into control and treatment groups. The control group was watered every two days, while water was withheld from the treatment group until the end of the experiment.
Drought stress was manifested in various visual symptoms on the seedlings. We used simple qualitative measures to categorize observed drought stress into five discrete wilting stages (WS) (Table 1, for example, in Figure S1). The categorization of leaf visual symptoms into wilting stages was based on previous studies by Engelbrecht et al. [12], Tyree [30], and Baltzer et al. [7], as well as our previous experience examining drought stress responses of these four species. We monitored all treatment seedlings every day for leaf visual symptoms of drought stress and identified their wilting stages. This allowed us to identify seedlings from each wilting stage to be sampled over the course of the six-week experiment. The number of seedlings measured at each wilting stage is presented in Table S2.
On each seedling, we used one leaf for predawn and another leaf for midday measurement. Since the shoots of S. obtusa were used for the measurement, we used multistemmed seedlings so that the predawn and midday water potential could be measured on the same seedling. Where multistemmed seedlings were not available, we used a pair of single-stemmed seedlings that were visually at the same wilting stage. In total, we used 287 healthy seedlings (of which there were 28 pairs of S. obtusa and one pair of D. obtusifolius) for the dry-down experiment. All the predawn water potential measurements were collected before dawn, while the midday water potential measurements were obtained between 12:30 and 16:40 h with most of the measurements taken between 12:30 and 15:30 h. The dry-down experiment took 20 days to complete, with the first measurements conducted at seven days after the watering had stopped. We acknowledge that the experiment conditions the seedlings were subjected to led to rapid and severe stress. It is likely that seedlings in the field would dry out more slowly during the dry season.
After the completion of the midday water potential measurements, the seedlings were returned to the nursery and rewatered at the end of the same day. They were subsequently rewatered every two days thereafter. Within 1–2 weeks of regular watering, most of the treatment seedlings had shed all remaining leaves and begun to resprout. After one month of regular irrigation, we used criteria described in Table 2 to record the leaf, stem, and resprouting status of the seedlings. We confirmed the responses of all 287 seedlings by comparing their (leaf, stem, resprouting, and survival) status prior to the experiment and at the end of the experiment via their before and after photograph.
2.3. Data Analyses
We used ANOVA to compare seedling size, water relations (Ψtlp, πo, RWCtlp, and ε), and Ψpre and Ψmid among the four species. Where the ANOVA results were significant, we used Tukey’s HSD (Honestly Significant Difference) post hoc tests for further comparison between the groups.
To explore the factors that may affect the probability of above-ground mortality following drought stress, we used general linear models (GLMs) with a binomial error structure and a logit link function. Above-ground mortality (alive/dead) was used as the response variable, while species, wilting stage, seedling size, and the number of stems per seedling before the experiment were used as explanatory variables. We also used a GLM to investigate the relationship between basal resprouting (present/absent) and seedling size, species, wilting stage, and stem status. For all model analyses, we first fit a model that included all potential explanatory variables and then removed nonsignificant variables to simplify the models. The best models were selected based on Akaike’s Information Criterion (AIC). All the analyses were performed in R (version 3.3.3, [41]).
3. Results
3.1. Leaf Water Relations
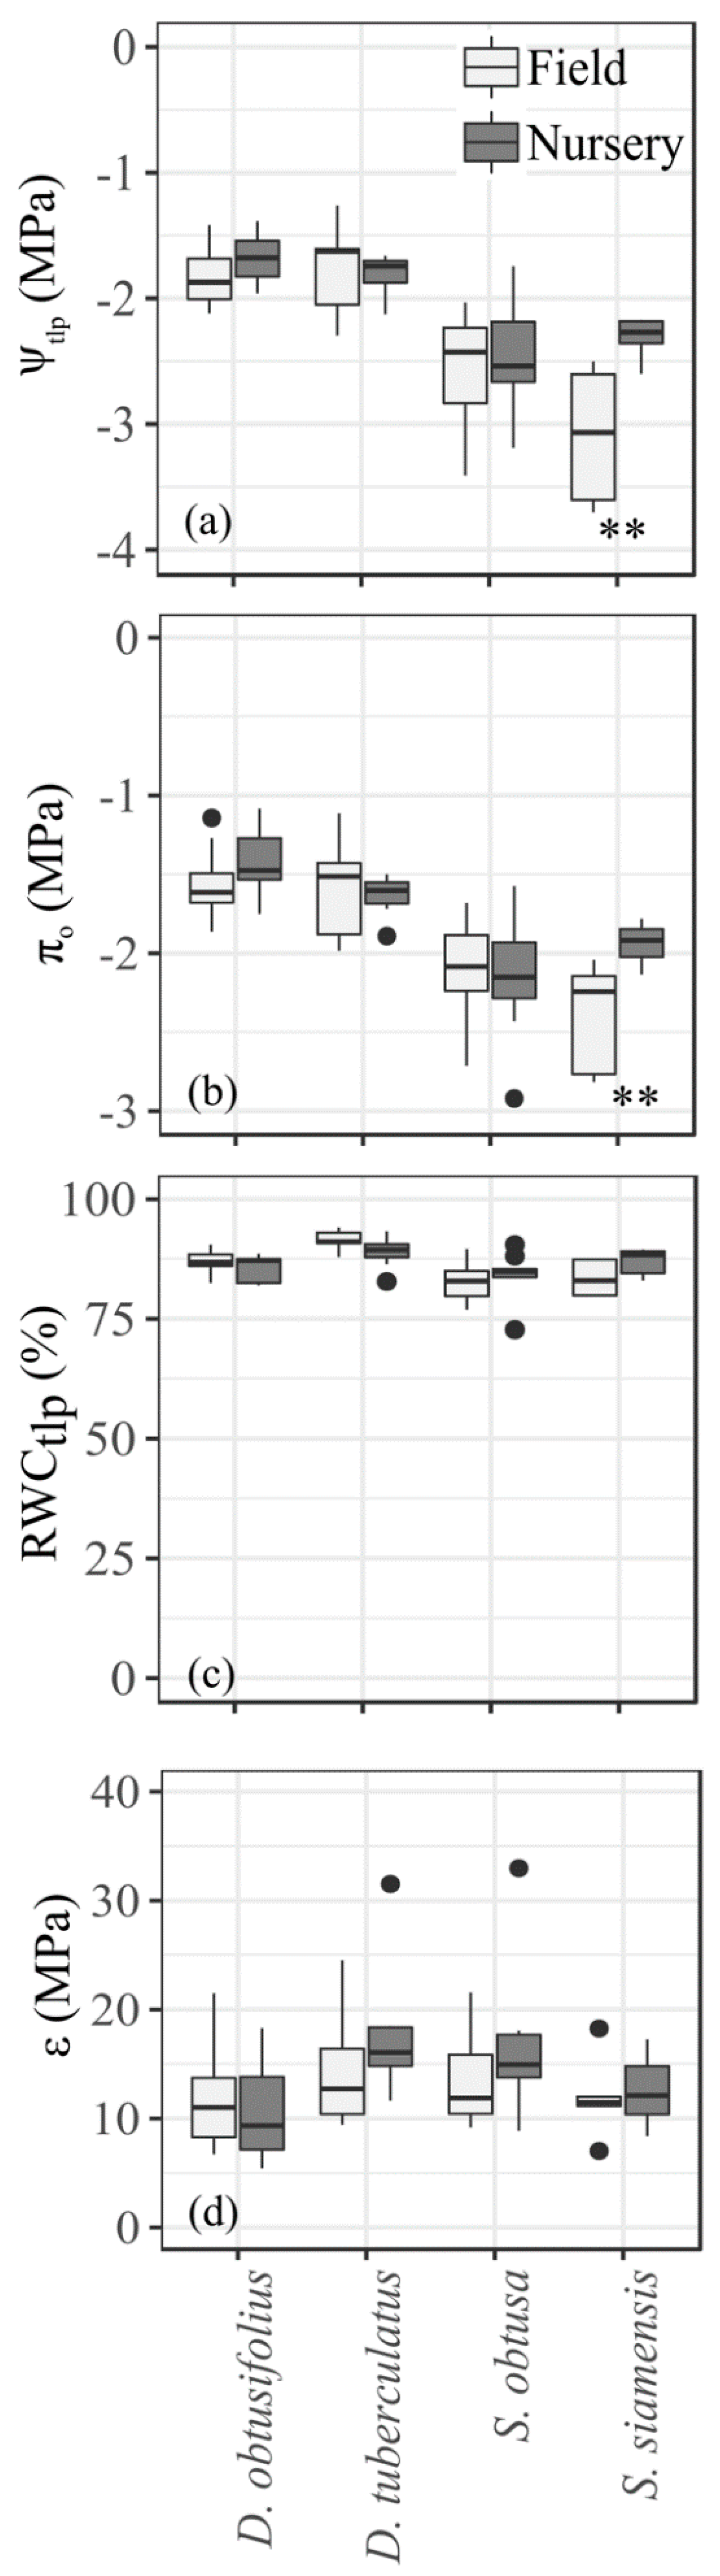
Leaf water relations of the nursery and field seedlings were not significantly different for three out of the four species (Figure 1). The exception was S. siamensis, where Ψtlp and πo were significantly more negative for seedlings outplanted in the field than those grown in the nursery (Figure 1a,b). When we pooled the data from the field and nursery seedlings, we found that the Ψtlp of the two Shorea species (−2.69 MPa for S. obtusa and −2.53 MPa for S. siamensis) was significantly more negative than that of the two Dipterocarpus species (−1.78 MPa for D. tuberculatus and −1.75 MPa for D. obtusifolius) (p < 0.001, df = 3, F = 19.4). Similarly, the πo of the two Shorea species (−2.12 MPa for S. obtusa and −2.16 MPa for S. siamensis) was significantly more negative than that of the two Dipterocarpus species (−1.60 MPa for D. tuberculatus and −1.49 MPa for D. obtusifolius) (p < 0.001, df = 3, F = 17.2). Pooling the data for all species, Ψtlp had a strong linear relationship with πo (R2 = 0.94, p < 0.001, intercept = 0.278 and slope = 0.721).
The relative water content at turgor loss point (RWCtlp) of field seedlings analyzed separately (p = 0.0001, df = 3, F = 10.7) or pooled together of the field with nursery seedlings (p = 0.0004, df = 3, F = 9.4) differed significantly (Figure 1c). However, there was no significant difference in RWCtlp among nursery seedlings (p = 0.08, df = 3, F = 2.5). All four dipterocarp species lost their turgor at relatively high water content (~77%–94%) (Figure 1c) and had moderately elastic cell walls. The bulk modulus of elasticity (ε) of the pooled data was not significantly different among the four species (p = 0.08, df = 3, F = 2.4) (Figure 1d).
3.2. Water Potential at Wilting Stages
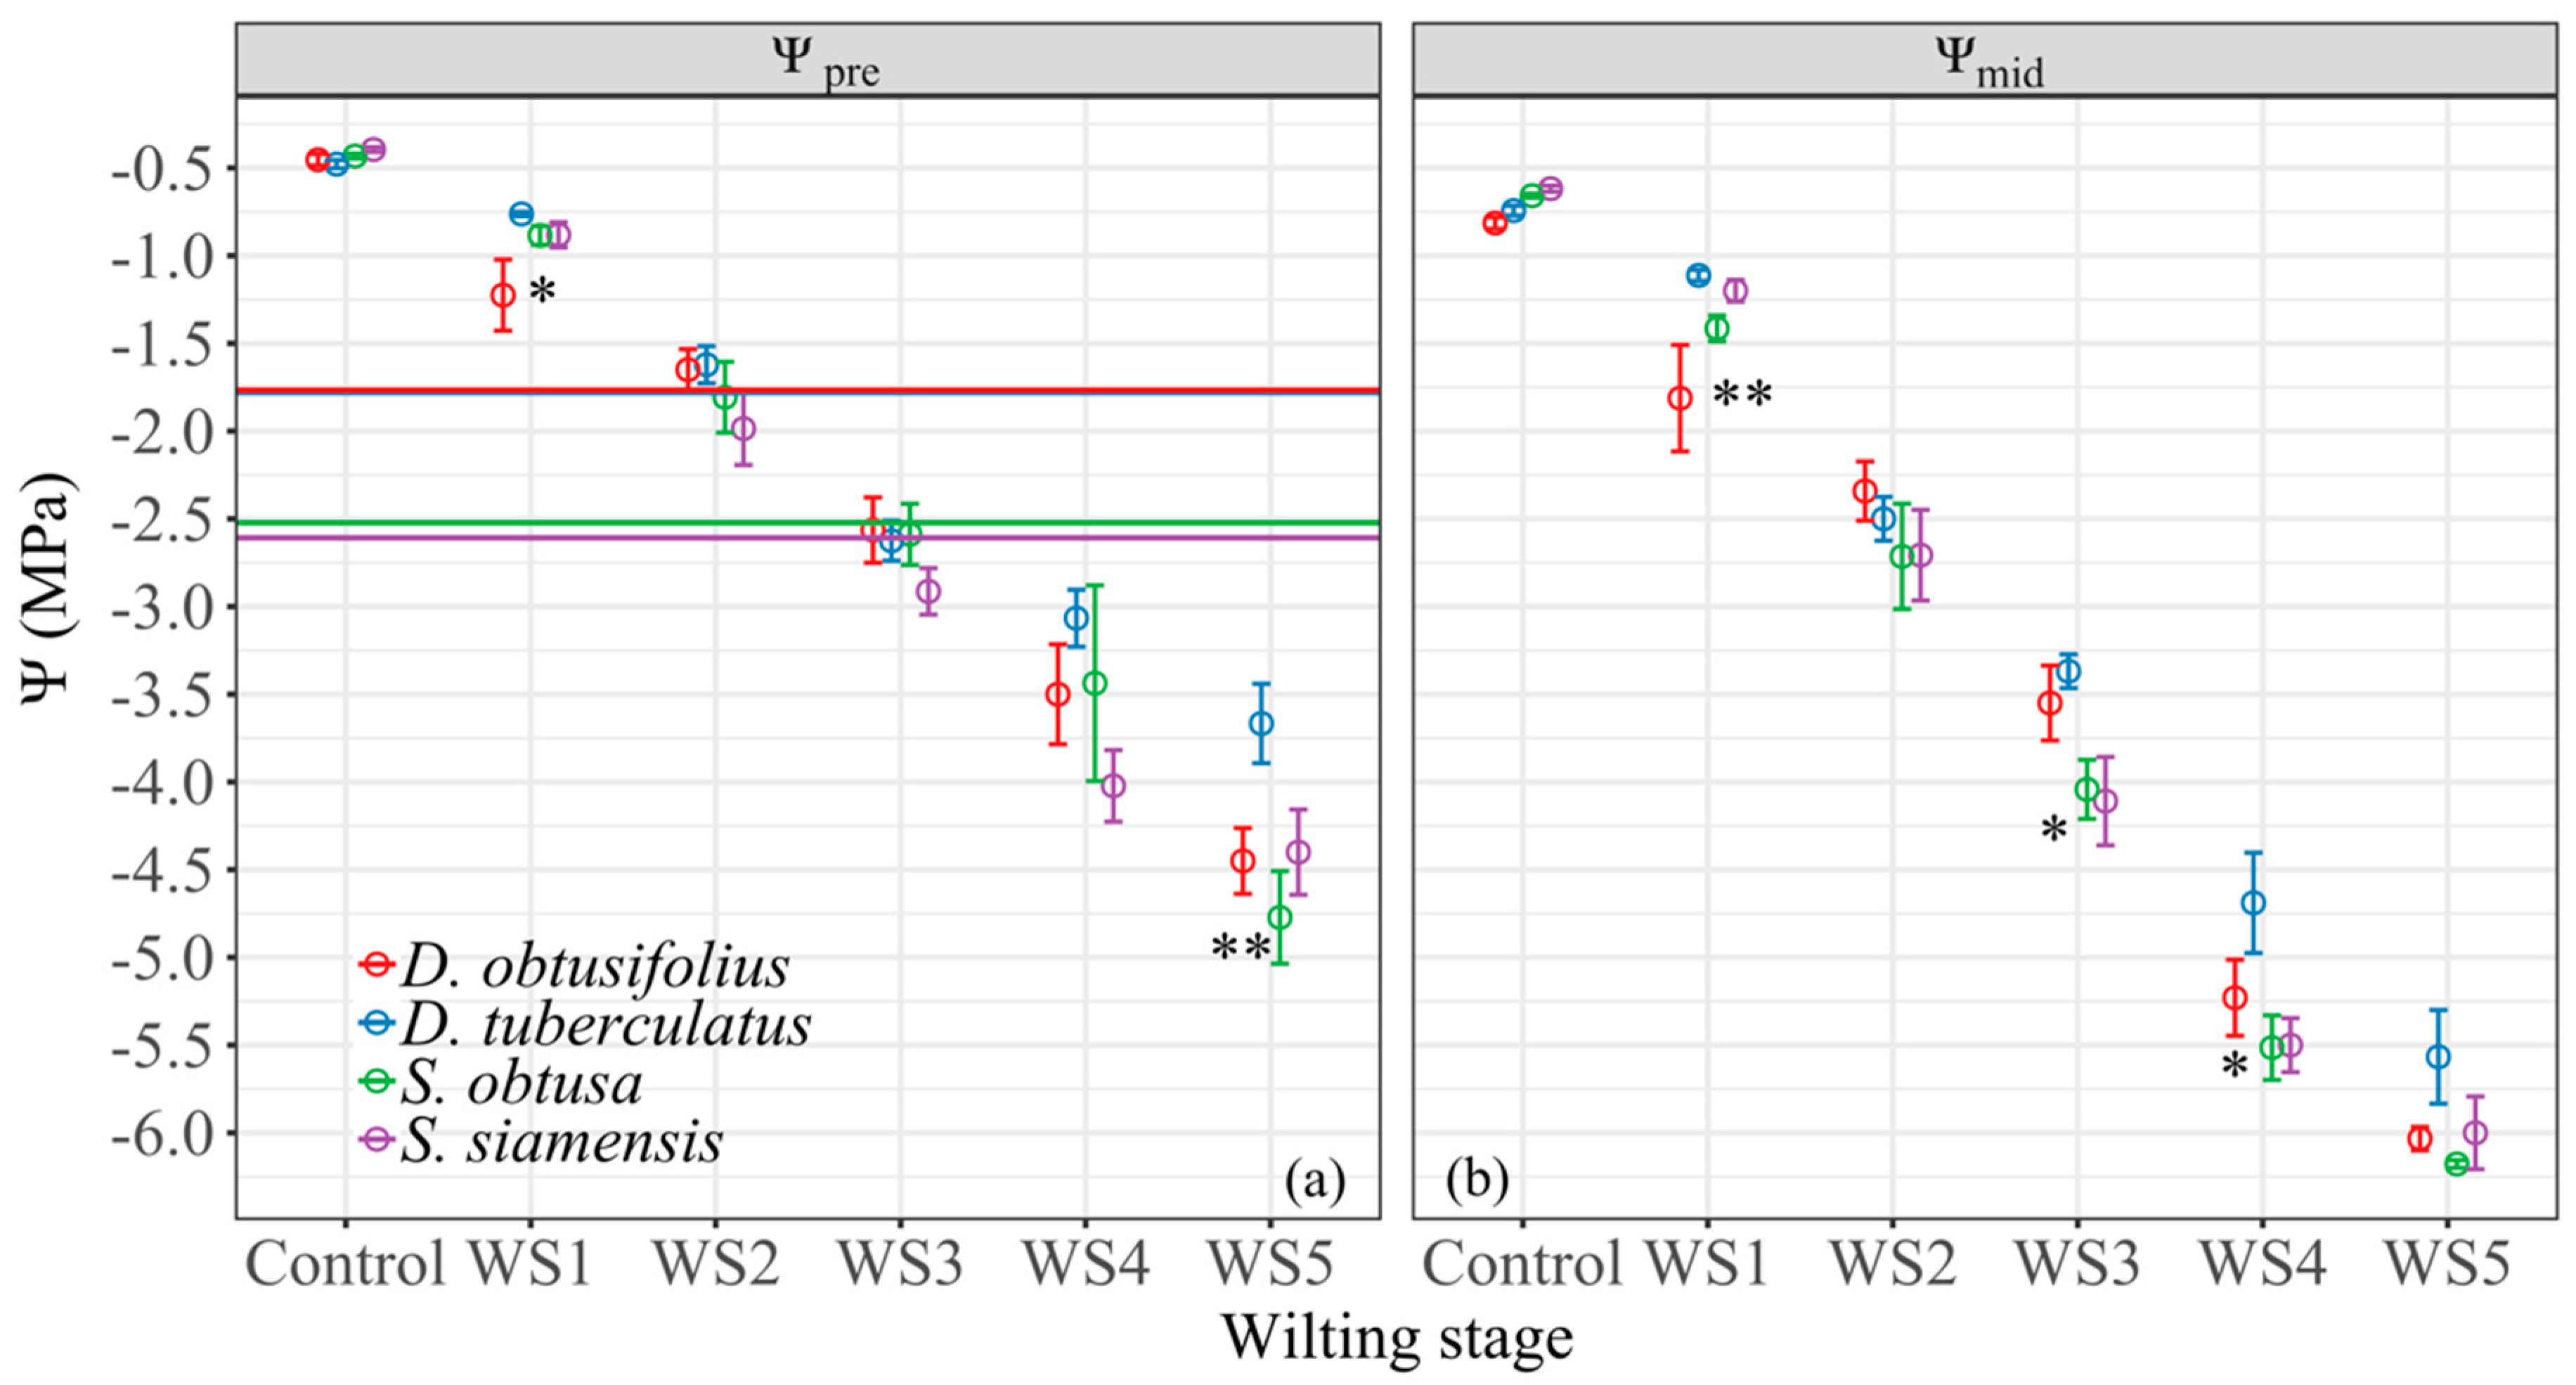
Over the course of the dry-down experiment, both Ψpre and Ψmid of all four species became more negative as the wilting stages increased (Figure 2). As a result, the difference between the Ψpre and Ψmid increased for all four species as the wilting stage increased. The greatest differences were observed in wilting stages 4 and 5 (Figure 2). Generally, the Ψpre and Ψmid of the Shorea species tended to be more negative than those of the Dipterocarpus species (particularly D. tuberculatus), but these differences were generally not significant (Figure 2). At wilting stage 1, the difference in Ψpre and Ψmid was largely driven by one outlier of D. obtusifolius for which the visual symptoms were graded wilting stage 1 but the measured Ψ values were low. Both Dipterocarpus species lost their turgor at −1.7 MPa, which was equivalent to the Ψpre at wilting stage 2, whereas the Shorea species lost turgor at −2.6 MPa, equivalent to the Ψpre at wilting stage 3 (Figure 2a).
3.3. Leaf and Stem Responses following Drought Stress
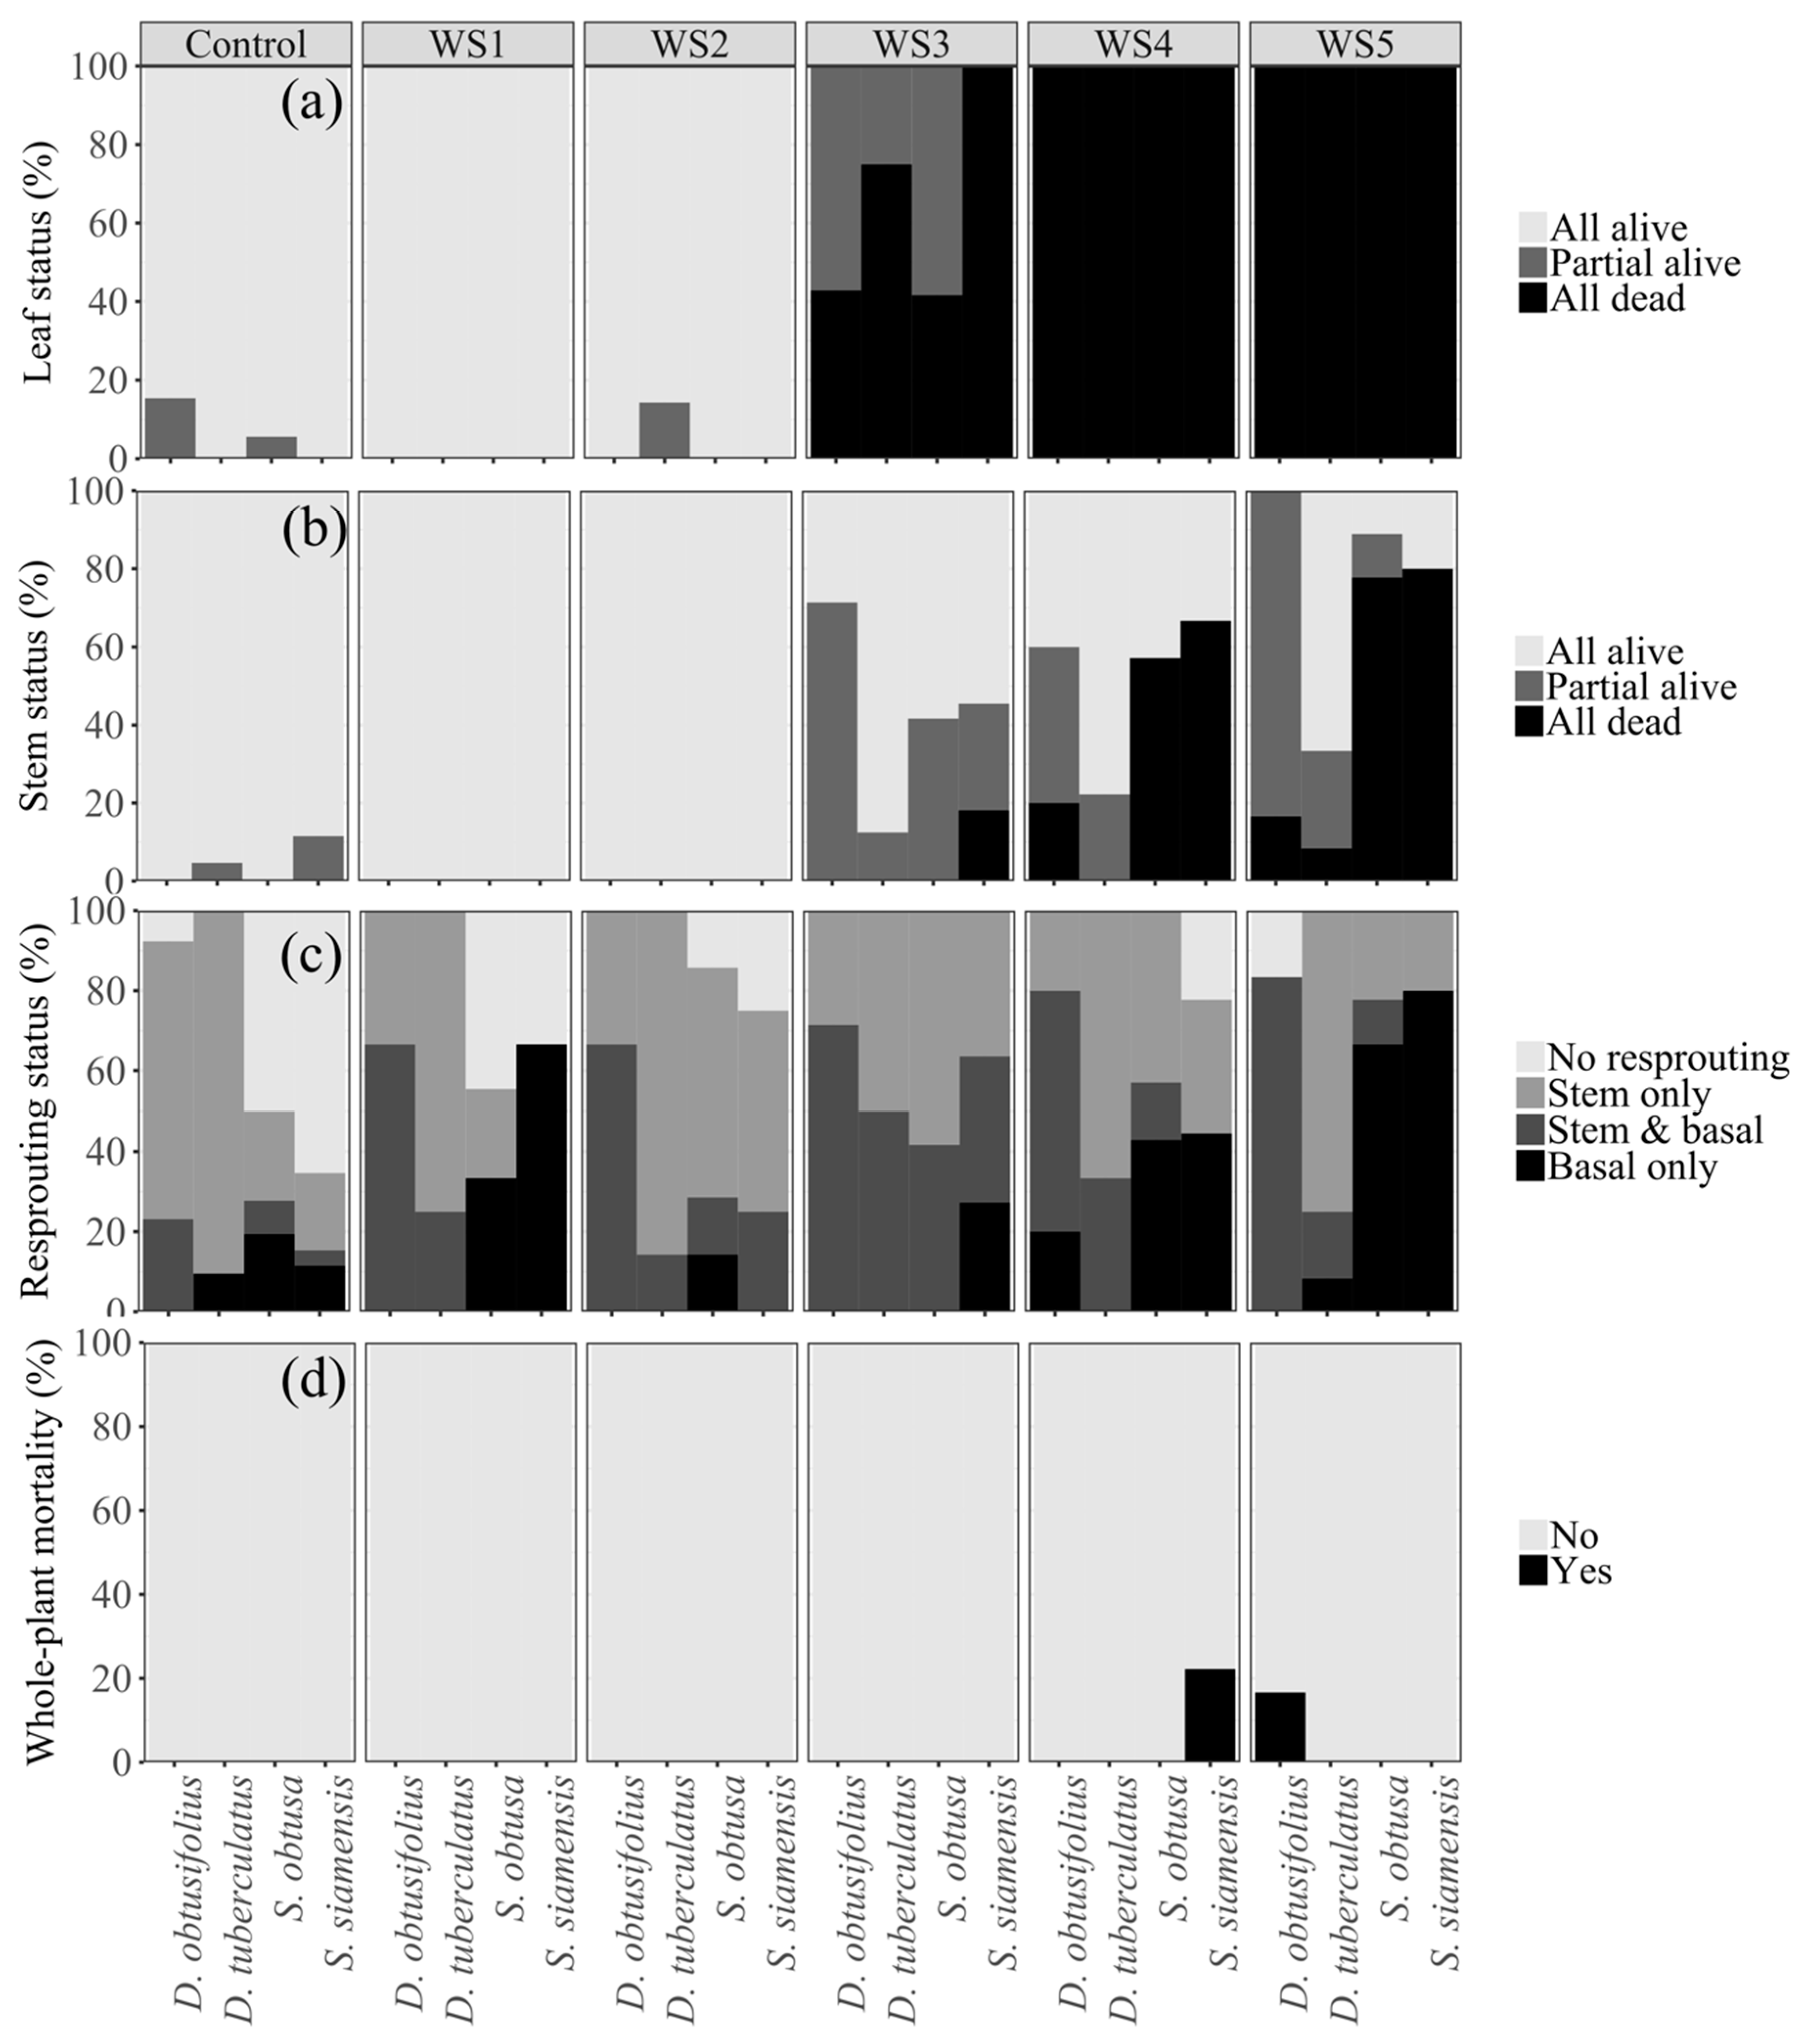
The water level experienced at wilting stages (WS) 1 and 2 generally did not affect the leaves and stems of the seedlings (Figure 3a). However, at WS 3, water deficit was severe enough to lead to the partial or complete loss of leaves and, in some cases, all stems of the seedlings (Figure 3a). At WS 4 and 5, water deficit led to the loss of all leaves in all species and, in many cases, to the loss of all stems (Figure 3a,b). Shorea species were likely to lose all of their stems, whereas Dipterocarpus species typically did not (Figure 3b).
In total in WS 3–5, 27 seedlings lost at least one stem and another 26 seedlings completely lost all stems. The probability of above-ground mortality was best explained by a combination of wilting stages, species, and initial basal diameter (Table 3).
3.4. Seedling Resprouting and Whole-Plant Mortality after Reirrigation
Regardless of the leaf or stem status at the end of each wilting stage, both control and treatment seedlings resprouted vigorously after rewatering (Figure 3c). Many seedlings initiated new shoots within 10 days and most resprouted within 2–3 weeks. Within one month of rewatering, many seedlings had produced 5–6 new shoots, some of which were already >10 cm tall. Noticeably, seedlings of Shorea species were likely to resprout from the base because they were more likely to experience complete stem loss (Figure 3c). In contrast, Dipterocarpus seedlings, particularly D. tuberculatus, often produced new shoots (or leaves) on the existing stems, as their thicker stems were more likely to have survived the drought stress (Figure 3c,d). The vigorous resprouting resulted in a low whole-plant mortality rate for all treatment seedlings (Figure 3d). Only three out of the 153 seedlings (2%) in the treatment died (i.e., did not resprout). The probability of basal resprouting was not significantly affected by wilting stage; rather, it was best explained by a combination of species, stem status after the treatment, and the number of stems prior to the experiment (Table 3).
4. Discussion
Our study is one of the first to investigate the water relations and seasonal drought responses of the four dominant tree species in the widespread deciduous dipterocarp forests of continental Southeast Asia. We observed significant differences in Ψtlp and πo among the two genera, Shorea and Dipterocarpus, suggesting potential differences in responses to drought stress conditions between them. However, all species responded relatively similarly to drought stress in the dry-down experiment. Once the leaf Ψ decreased below the turgor loss point (at WS 2 or WS 3), all four species rapidly proceeded to shed their leaves and then lose their stem(s) (Figure 3a,b). However, the resprouting ability of all four species after rewatering resulted in a very low overall mortality rate (~2%).
4.1. Physiological Drought Tolerance Traits and Drought Stress Performances
Strategies that plants use to persist in conditions of water stress can be divided into three groups: drought escape, drought avoidance, and drought tolerance [42]. Drought tolerance strategies are related to physiological mechanisms (e.g., water relations). In the present study, the similarities in Ψtlp measured between field and nursery seedlings (Figure 1) suggested that the values of Ψtlp were representative for three out of the four deciduous dipterocarp species. The discrepancy of Ψtlp and πo between nursery and field seedlings of S. siamensis was significant; however, we were unable to relate this to any potential causes. The Ψtlp of the two Dipterocarpus species in our study was comparable to the Ψtlp of deciduous species in other seasonally dry tropical forests (e.g., Fu et al. [43] and Brodribb et al. [16]). Similarly, πo of the two Shorea species was comparable to that of tropical dry forest species in South America (e.g., Sobrado [44]). However, it appears that in tropical dry forests, deciduous species tend to have less negative Ψtlp than evergreen species (e.g., deciduous: −1.65 ± 0.12 vs. evergreen: −2.82 ± 0.32 MPa in Fu et al. [43] and deciduous: −1.37 to −1.82 vs. evergreen: −2.21 to −3.12 MPa in Brodribb et al. [16]).
The deciduous dipterocarp species in the present study are four of only six deciduous species of the Dipterocarpaceae family [18,45], which includes 520 species mainly occurring across the tropics of continental and insular Southeast Asia [46]. Our data suggest that the Ψtlp of the deciduous Dipterocarpus (−1.7 MPa) and Shorea (−2.6 MPa) species were substantially more negative than the values reported for evergreen dipterocarp species from aseasonal tropical forests (range: −1 to −1.4 MPa) [7]. However, the Ψtlp of the Dipterocarpus species in the present study was comparable to the Ψtlp of Parashorea species (−1.85 MPa) that occurs widely in seasonally dry tropical forests [7].
Many studies demonstrated that Ψtlp is a key predictor of drought tolerance and that greater drought tolerance is associated with more negative Ψtlp [38,47,48]. In the present study, we found that the Shorea species generally had Ψtlp and πo ~0.5 MPa more negative than the Dipterocarpus species. However, this did not result in the Shorea species being more drought tolerant than the Dipterocarpus species in the dry-down experiment. In fact, all species showed a high vulnerability to drought stress.
The dry-down experiment showed that the level of drought stress at WS 2 did not affect the leaves or stems of the seedlings, yet drought stress at WS 3, equivalent to Ψ = −2.5–4.2 MPa (Figure 2), was severe enough to render the leaf hydraulic systems dysfunctional. Similarly, drought stress at WS 4 and WS 5 not only caused complete leaf loss but also the majority of stem damage (i.e., complete failure of stem hydraulic systems). The increasing level of leaf shrinkage as drought stress increased supports the findings of Scoffoni et al. [49] who demonstrated that leaf thickness consistently decreased as the leaf water potential decreased (i.e., more negative). These results support the hypothesis that leaf morphological response is a reliable indicator of drought stress level.
4.2. Drought Adaptive Traits and Seedling Survival
Many studies in seasonally dry tropical ecosystems (e.g., Reich and Borchert [11], Hoffmann et al. [50], Poorter and Markesteijn [13]) have emphasized the importance of drought adaptive traits for the persistence of tree species. These traits include leaf shedding during the dry season, formation of taproots, and the ability to vigorously resprout [11,12,14]. Leaf shedding has been demonstrated as a critical trait that allows species to survive at lower water availability by avoiding water loss through leaves [7,11,12,13,14]. Poorter and Markesteijn [13] showed that leaf shedding contributed 69% to the drought survival of seedling species in tropical forests. In the DDF, leaf shedding is a typical strategy that is observed in saplings and adults [51]. In the field, we observed that the outplanted seedlings of the four species also lost leaves in the dry season before the annual fires occurred, thereby confirming that drought avoidance is the key to their ultimate survival. Thus, drought avoidance is likely a key strategy that enables seedlings of the four deciduous dipterocarp species to survive drought stress during the annual dry season.
Our results suggested that although the probability of whole-plant mortality was significantly affected by wilting stage (i.e., the level of drought stress), the probability of resprouting was not (Figure 3c). The vigorous resprouting ability was critically important to maintain the high whole-plant survival rate among seedlings of the four species. Although 53 out of 101 treatment seedlings (i.e., 52%) at WS 3–5 (Table S1) lost at least one stem during the dry-down experiment, their resprouting ability resulted in a whole-plant mortality rate of only 2%. Similarly, in the field, in the absence of fire (i.e., drought only), Nguyen et al. [26] found that 31% of juveniles experienced stem loss, but after accounting for resprouting, only 14.6% experienced whole-plant mortality. The resilience of the four deciduous dipterocarp species to seasonal drought stress may explain their widespread occurrence in the landscapes of continental Southeast Asia.
The two Dipterocarpus species, despite having significantly higher (i.e., less negative) Ψtlp and πo than the two Shorea species, were more likely to maintain at least one stem even at the highest drought stress level (Figure 3b). In contrast, the two Shorea species often lost all of their stems at the same wilting stage. All four species showed an ability to resprout; however, Shorea species were more likely to resprout from the root collar, whereas Dipterocarpus species tended to produce new shoots and leaves from their stems. Our results suggest that the ability to resprout vigorously following drought-induced leaf or stem loss is likely to be a key strategy allowing individuals of the four deciduous dipterocarp species to persist through the annual drought cycle. This is consistent with studies from other regions with seasonally dry tropical forests (e.g., Schutz et al. [52], Clarke et al. [53]). Although resprouting ability is a powerful trait that reduces the whole-plant mortality rate, it may only be useful under normal drought stress conditions. During more intense and prolonged drought, when the below-ground organs may encounter hydraulic dysfunction [54], seedlings may not be able to resprout, leading to whole-plant mortality. This may be more serious for 1–2-year-old seedlings because their carbohydrate reserves are lower due to lower biomass compared to larger saplings and trees that often also do not show large seasonal variations in carbohydrate reserves [55,56].
4.3. Drought Stress and Community Assembly Patterns
Field observations across the region suggest that Shorea-dominated communities are often associated with drier sites, while Dipterocarpus-dominated communities (especially D. obtusifolius) are often found on moister sites [24,25,27,28,29]. Our results on water relations provide some support for this observation because the two Shorea species had significantly lower Ψtlp and therefore a greater inherent physiological drought tolerance than the Dipterocarpus species. However, the responses of the four species in the dry-down experiment suggested that Ψtlp was not a good indicator of drought resistance. The vigorous resprouting ability of all species regardless of drought stress level indicated that drought-induced mortality is unlikely to cause complete recruitment failure of any of the deciduous dipterocarp species in a normal dry season. Instead, factors other than drought such as seed dispersal (e.g., seed arrival, seed germination, and seedling growth) and fire [26] may play greater roles in observed associations between species and sites.
As prescribed fire occurs almost annually in the DDF at our study site [32], the interaction between fire and drought may be an important environmental filter to the community assembly. In this context, drought may indirectly affect community assembly patterns by influencing seedling growth. Of the four species, D. tuberculatus had the highest Ψtlp (i.e., most positive), but also had the highest stem survival. As such, D. tuberculatus seedlings were less likely to have to regrow from basal sprouts and could develop larger and taller stems more consistently over multiple dry seasons. This would significantly increase its chance of escaping fire [26] and is consistent with the observed high abundance of D. tuberculatus across the landscape of our study site [29].
5. Conclusions
In seasonally dry tropical forests, physiological and morphological adaptations may allow tree species to persist despite prolonged annual droughts. Using nursery and field measurements, combined with experimental drought forcing, we conclude that morphological adaptations, such as leaf shedding and vigorous resprouting, were more important for the persistence of the deciduous dipterocarp species than physiological drought tolerance traits. Seedlings of all four deciduous dipterocarp species followed a similar drought avoidance strategy in which they shed all of their leaves after reaching turgor loss point and then resprouted vigorously when water was subsequently made available to them. Given that all species employed the same mechanism, it is unlikely that drought is a key driver of the community assembly patterns observed in the DDF.
Supplementary Materials
The following are available online at https://www.mdpi.com/1999-4907/10/12/1119/s1, Figure S1: Wilting stages before the water potential measurement of Dipterocarpus tuberculatus (row 1) and Shorea obtusa (row 3) and the same seedlings at one month after irrigation (row 2, D. tuberculatus vs. row 4, S. obtusa), Table S1: Number of seedlings and seedling size of the four deciduous dipterocarp species at the start of the dry-down experiment. Values followed by the same letter are not significantly different (p = 0.05), Table S2: Number of seedlings measured in each wilting stage.
Author Contributions
T.T.N., P.J.B., and S.K.A. conceived the ideas and designed the experiment. T.T.N. collected the data. T.T.N. performed the analyses with contributions from S.K.A. and P.J.B. T.T.N. led the writing with substantial contributions of S.K.A. and P.J.B.
Funding
This research is one part of Thuy T. Nguyen’s PhD thesis that was funded by an Australian Leadership Award from the Department of Foreign Affairs and Trade (DFAT), Australia. Patrick J. Baker was supported by an Australian Research Council Future Fellowship (FT120100715).
Acknowledgments
The authors would like to thank Hai Nguyen, Quyet Nguyen, Thanh Nguyen, Trang Nguyen, Phuong Nguyen, Hieu Phung and Dua Luong for their help before and during preparation of the experiment. We thank Heidi Zimmer for help with the pressure chamber and Gregor Sanders for help with fitting the pV curves. We are particularly grateful to YokDon National Park and its staff for the use of their nursery and facilities.
Conflicts of Interest
The authors declare no conflict of interest.
References
- Condit, R.; Hubbell, S.P.; Foster, R.B. Mortality Rates of 205 Neotropical Tree and Shrub Species and the Impact of a Severe Drought. Ecol. Monogr. 1995, 65, 419–439. [Google Scholar] [CrossRef]
- Condit, R. Ecological Implications of Changes in Drought Patterns: Shifts in Forest Composition in Panama. Clim. Chang. 1998, 39, 413–427. [Google Scholar] [CrossRef]
- Delissio, L.J.; Primack, R.B. The impact of drought on the population dynamics of canopy-tree seedlings in an aseasonal Malaysian rain forest. J. Trop. Ecol. 2003, 19, 489–500. [Google Scholar] [CrossRef] [Green Version]
- Engelbrecht, B.M.J.; Kursar, T.A.; Tyree, M.T. Drought effects on seedling survival in a tropical moist forest. Trees 2005, 19, 312–321. [Google Scholar] [CrossRef]
- Phillips, O.L.; van der Heijden, G.; Lewis, S.L.; Lopez-Gonzalez, G.; Aragão, L.E.O.C.; Lloyd, J.; Malhi, Y.; Monteagudo, A.; Almeida, S.; Dávila, E.Á.; et al. Drought-mortality relationships for tropical forests. New Phytol. 2010, 187, 631–646. [Google Scholar] [CrossRef] [Green Version]
- Li, X.; Liu, F. Drought Stress Memory and Drought Stress Tolerance in Plants: Biochemical and Molecular Basis. In Drought Stress Tolerance in Plants; Hossain, M.A., Wani, S.H., Bhattacharjee, S., Burritt, D.J., Tran, L.-S.P., Eds.; Springer International Publishing: Cham, Switzerland, 2016; Volume 1, pp. 17–44. [Google Scholar]
- Baltzer, J.L.; Davies, S.J.; Bunyavejchewin, S.; Noor, N.S.M. The role of desiccation tolerance in determining tree species distributions along the Malay–Thai Peninsula. Funct. Ecol. 2008, 22, 221–231. [Google Scholar] [CrossRef]
- Jones, H.G.; Sutherland, R.A. Stomatal control of xylem embolism. Plant Cell Environ. 1991, 14, 607–612. [Google Scholar] [CrossRef]
- Garkoti, S.C.; Zobel, D.B.; Singh, S.P. Variation in drought response of sal (Shorea robusta) seedlings. Tree Physiol. 2003, 23, 1021–1030. [Google Scholar] [CrossRef] [Green Version]
- Cao, K.-F. Water relations and gas exchange of tropical saplings during a prolonged drought in a Bornean heath forest, with reference to root architecture. J. Trop. Ecol. 2000, 16, 101–116. [Google Scholar] [CrossRef]
- Reich, P.B.; Borchert, R. Water Stress and Tree Phenology in a Tropical Dry Forest in the Lowlands of Costa Rica. J. Ecol. 1984, 72, 61–74. [Google Scholar] [CrossRef]
- Engelbrecht, B.M.J.; Kursar, T.A. Comparative drought-resistance of seedlings of 28 species of co-occurring tropical woody plants. Oecologia 2003, 136, 383–393. [Google Scholar] [CrossRef] [PubMed]
- Poorter, L.; Markesteijn, L. Seedling Traits Determine Drought Tolerance of Tropical Tree Species. Biotropica 2008, 40, 321–331. [Google Scholar] [CrossRef]
- Pausas, J.G.; Pratt, R.B.; Keeley, J.E.; Jacobsen, A.L.; Ramirez, A.R.; Vilagrosa, A.; Paula, S.; Kaneakua-Pia, I.N.; Davis, S.D. Towards understanding resprouting at the global scale. New Phytol. 2015, 209, 945–954. [Google Scholar] [CrossRef] [PubMed] [Green Version]
- Blackman, C.J.; Creek, D.; Maier, C.; Aspinwall, M.J.; Drake, J.E.; Pfautsch, S.; O’Grady, A.; Delzon, S.; Medlyn, B.E.; Tissue, D.T.; et al. Drought response strategies and hydraulic traits contribute to mechanistic understanding of plant dry-down to hydraulic failure. Tree Physiol. 2019, 197, 1–15. [Google Scholar] [CrossRef]
- Brodribb, T.J.; Holbrook, N.M.; Edwards, E.J.; Gutiérrez, M.V. Relations between stomatal closure, leaf turgor and xylem vulnerability in eight tropical dry forest trees. Plant Cell Environ. 2003, 26, 443–450. [Google Scholar] [CrossRef] [Green Version]
- Hesla, B.I.; Tieszen, H.L.; Boutton, T.W. Seasonal water relations of savanna shrubs and grasses in Kenya, East Africa. J. Arid Environ. 1985, 8, 15–31. [Google Scholar] [CrossRef]
- Rundel, P.W. Dry forest ecosystems of Thailand. In Seasonally Dry Tropical Forests; Bullock, S.H., Mooney, H.A., Medina, E., Eds.; Island Press/Center for Resource Economics, Cambridge University Press: Cambridge, UK, 1995; pp. 93–123. [Google Scholar]
- Stott, P. The savanna forests of mainland southeast Asia: An ecological survey. Prog. Phys. Geog. 1984, 8, 315–335. [Google Scholar] [CrossRef]
- Champion, H.; Seth, S. A revised survey of the forest types of India; Gov. India Press: Delhi, India, 1968.
- Ashton, P.S. Toward a regional classification of the humid tropics of Asia. Tropics 1991, 1, 1–12. [Google Scholar] [CrossRef] [Green Version]
- Ratnam, J.; Bond, W.J.; Fensham, R.J.; Hoffmann, W.A.; Archibald, S.; Lehmann, C.E.R.; Anderson, M.T.; Higgins, S.I.; Sankaran, M. When is a forest a savanna, and why does it matter? Global. Ecol. Biogeogr. 2011, 20, 653–660. [Google Scholar] [CrossRef]
- Ratnam, J.; Tomlinson, K.W.; Rasquinha, D.N.; Sankaran, M. Savannahs of Asia: Antiquity, biogeography, and an uncertain future. Phil. Trans. 2016, 371, 20150305. [Google Scholar] [CrossRef]
- Bunyavejchewin, S. Canopy structure of the dry dipterocarp forest of Thailand. Thai For. Bull. 1983, 14, 1–132. [Google Scholar]
- Dinh, D.Q. Contribution to Study on Natural Regeneration of the Deciduous Dipterocarp Forest in Easup, Dak Lak Province, Vietnam. Ph.D. Thesis, Forest Science Institute of Vietnam, Hanoi, Vietnam, 1993. [Google Scholar]
- Nguyen, T.T.; Murphy, B.P.; Baker, P.J. The existence of a fire-mediated tree-recruitment bottleneck in an Asian savanna. J. Biogeogr. 2019, 46, 745–756. [Google Scholar] [CrossRef]
- Ogawa, H.; Yoda, K.; Kira, T.; Ogino, K.; Shidel, T.; Ratanawongse, D.; Apasutaya, C. Comparative Ecological Studies on Three Main Types of Forest Vegetation in Thailand. I. Structure and Floristic Composition. Nat. Life Southeast Asia 1965, 4, 13–48. [Google Scholar]
- Kutintara, U. Structure of the dry Dipterocarp Forest. Ph.D. Thesis, Colorado State University, Fort Collins, CO, USA, 1975. [Google Scholar]
- Nguyen, T.T.; Baker, P.J. Structure and composition of deciduous dipterocarp forest in Central Vietnam: Patterns of species dominance and regeneration failure. Plant Ecol. Divers. 2016, 9, 589–601. [Google Scholar] [CrossRef]
- Tyree, M.T.; Engelbrecht, B.M.J.; Vargas, G.; Kursar, T.A. Desiccation Tolerance of Five Tropical Seedlings in Panama. Relationship to a Field Assessment of Drought Performance. Plant Physiol. 2003, 132, 1439–1447. [Google Scholar] [CrossRef] [Green Version]
- Bartlett, M.K.; Zhang, Y.; Yang, J.; Kreidler, N.; Sun, S.W.; Lin, L.; Hu, Y.H.; Cao, K.F.; Sack, L. Drought tolerance as a driver of tropical forest assembly: Resolving spatial signatures for multiple processes. Ecology 2016, 97, 503–514. [Google Scholar] [CrossRef] [Green Version]
- Ho, V.C. Study on Solutions for Biodiversity Conservation of YokDon National Park. Ph.D. Thesis, Vietnam Forestry University, Hanoi, Vietnam, 2008; pp. 1–216. [Google Scholar]
- Van Tan, P.; Thanh, N.D.; Van Hiep, N. A review of evidence of recent climate change in the Central Highlands of Vietnam. Coffee Clim. Enabling Eff. Response 2013, 1–49. [Google Scholar]
- Sankaran, M.; Ratnam, J. African and Asian Savannas. In Encyclopedia of Biodiversity; Elsevier: Amsterdam, The Netherlands, 2013; pp. 58–74. [Google Scholar]
- Parr, C.L.; Lehmann, C.E.R.; Bond, W.J.; Hoffmann, W.A.; Andersen, A.N. Tropical grassy biomes: Misunderstood, neglected, and under threat. Trends Ecol. Evol. 2014, 29, 205–213. [Google Scholar] [CrossRef]
- Tran, C.V. Study on Applicability of Mathematical Simulation for Structural and Dynamic Properties of Deciduous Dipterocarp Forest in the Central Highlands of Vietnam. Ph.D. Thesis, Forest Science Institute of Vietnam, Hanoi, Vietnam, 1991. [Google Scholar]
- Tyree, M.T.; Hammel, H.T. The Measurement of the Turgor Pressure and the Water Relations of Plants by the Pressure-bomb Technique. J. Exp. Bot. 1972, 23, 267–282. [Google Scholar] [CrossRef]
- Bartlett, M.K.; Scoffoni, C.; Sack, L. The determinants of leaf turgor loss point and prediction of drought tolerance of species and biomes: A global meta-analysis. Ecol. Lett. 2012, 15, 393–405. [Google Scholar] [CrossRef]
- Turner, N.C. Measurement of plant water status by the pressure chamber technique. Irrig. Sci. 1998, 9, 289–308. [Google Scholar] [CrossRef]
- Schulte, P.J.; Hinckley, T.M. A comparison of pressure-volume curve data analysis techniques. J. Exp. Bot. 1985, 36, 1590–1602. [Google Scholar] [CrossRef]
- R Core Team. R: A language and environment for statistical computing. R Foundation for Statistical Computing, Vienna, Austria. 2018. Available online: https://www.R-project.org (accessed on 24 May 2018).
- Levitt, J.V. Responses of Plants to Environmental Stresses; Academic Press: New York, NY, USA, 1972. [Google Scholar]
- Fu, P.-L.; Jiang, Y.-J.; Wang, A.-Y.; Brodribb, T.J.; Zhang, J.-L.; Zhu, S.-D.; Cao, K.-F. Stem hydraulic traits and leaf water-stress tolerance are co-ordinated with the leaf phenology of angiosperm trees in an Asian tropical dry karst forest. Ann. Bot. 2012, 110, 189–199. [Google Scholar] [CrossRef] [PubMed] [Green Version]
- Sobrado, M.A. Aspects of tissue water relations and seasonal changes of leaf water potential components of evergreen and deciduous species coexisting in tropical dry forests. Oecologia 1986, 68, 413–416. [Google Scholar] [CrossRef]
- Stott, P. Stability and stress in the savanna forests of mainland South-East Asia. J. Trop. For. Sci. 1990, 17, 373–383. [Google Scholar] [CrossRef]
- Shukla, A.; Mehrotra, R.C.; Guleria, J.S. Emergence and extinction of Dipterocarpaceae in western India with reference to climate change: Fossil wood evidences. J. Earth Syst. Sci. 2013, 122, 1373–1386. [Google Scholar] [CrossRef] [Green Version]
- Lenz, T.I.; Wright, I.J.; Westoby, M. Interrelations among pressure-volume curve traits across species and water availability gradients. Physiol. Plant. 2006, 127, 423–433. [Google Scholar] [CrossRef]
- Lambers, H.; Chapin, F.S.; Pons, T.L. Plant Physiological Ecology; Springer: Berlin/Heidelberg, Germany, 2008; pp. 1–624. [Google Scholar]
- Scoffoni, C.; Vuong, C.; Diep, S.; Cochard, H.; Sack, L. Leaf shrinkage with dehydration: Coordination with hydraulic vulnerability and drought tolerance. Plant Physiol. 2014, 164, 1772–1788. [Google Scholar] [CrossRef] [Green Version]
- Hoffmann, W.A.; Orthen, B.; Franco, A.C. Constraints to seedling success of savanna and forest trees across the savanna-forest boundary. Oecologia 2004, 140, 252–260. [Google Scholar] [CrossRef]
- Bunyavejchewin, S.; Baker, P.J.; Davies, S.J. Seasonally Dry Tropical Forests in Continental Southeast Asia: Structure, Composition, and Dynamics. In The Ecology and Conservation of Seasonally Dry Forests in Asia; McShea, W.J., Davies, S.J., Bhumpakphan, N., Eds.; Smithsonian Institution Scholarly Press: Washington, DC, USA, 2011; pp. 9–35. [Google Scholar]
- Schutz, A.E.N.; Bond, W.J.; Cramer, M.D. Juggling carbon: Allocation patterns of a dominant tree in a fire-prone savanna. Oecologia 2009, 160, 235–246. [Google Scholar] [CrossRef]
- Clarke, P.J.; Lawes, M.J.; Midgley, J.J.; Lamont, B.B.; Ojeda, F.; Burrows, G.E.; Enright, N.J.; Knox, K.J.E. Resprouting as a key functional trait: How buds, protection and resources drive persistence after fire. New Phytol. 2012, 197, 19–35. [Google Scholar] [CrossRef] [Green Version]
- Zeppel, M.J.B.; Harrison, S.P.; Adams, H.D.; Kelley, D.I.; Li, G.; Tissue, D.T.; Dawson, T.E.; Fensham, R.; Medlyn, B.E.; Palmer, A.; et al. Drought and resprouting plants. New Phytol. 2014, 206, 583–589. [Google Scholar] [CrossRef]
- Smith, M.G.; Arndt, S.K.; Miller, R.E.; Kasel, S.; Bennett, L.T. Trees use more non-structural carbohydrate reserves during epicormic than basal resprouting. Tree Physiol. 2018, 38, 1779–1791. [Google Scholar] [CrossRef]
- Smith, M.G.; Miller, R.E.; Arndt, S.K.; Kasel, S.; Bennett, L.T. Whole-tree distribution and temporal variation of non-structural carbohydrates in broadleaf evergreen trees. Tree Physiol. 2017, 31, 1–12. [Google Scholar] [CrossRef] [Green Version]
Figure 1.
Water relations of Ψtlp (a), πo (b), RWCtlp (c), and ε (d) calculated from pV curves of 18-month-old seedlings of the four deciduous dipterocarp species grown under nursery and field conditions. Asterisks (**) indicate a significant difference at p = 0.01 between nursery- and field-grown seedlings of the same species.

Figure 2.
Means of Ψpre (a) and Ψmid (b) of the four dipterocarp species at five wilting stages. Horizontal lines indicate Ψtlp for each species. Asterisks (* and **) indicate significant difference among species in Ψpre or Ψmid within the same wilting stage at the 0.05 and 0.01 probability levels, respectively.

Figure 3.
Leaf, stem, resprouting, and mortality responses across the five wilting stages one month after rewatering for each of the deciduous dipterocarp species. Detailed information on the criteria to rate the responses is presented in Table 2.
Figure 3.
Leaf, stem, resprouting, and mortality responses across the five wilting stages one month after rewatering for each of the deciduous dipterocarp species. Detailed information on the criteria to rate the responses is presented in Table 2.


Table 1.
Description of leaf visual symptoms associated with five wilting stages.
| Wilting Stage | Leaf Visual Symptoms |
|---|---|
| WS1 | Leaves look healthy with no signs of wilting |
| WS2 | Leaves become softer, slight changes to leaf angle |
| WS3 | Leaves soft, nearly parallel with stem, brighter color, slightly curved |
| WS4 | Slightly crunchy, curved, dried, necrotic tissue, brighter or brown |
| WS5 | Very dried, curved, brighter or brown |
Table 2.
Criteria for rating leaf and stem responses at one month after rewatering.
| Status | Rating | Criteria |
|---|---|---|
| Leaf | All dead | All remaining leaves or the only remaining leaf from the measurements were dead |
| Partially alive | At least one of the remaining leaves from the measurements was alive | |
| All alive | All remaining leaves or the only remaining leaf from the measurements were alive | |
| Stem | All dead | All multiple or single stems were dead |
| Partially alive | At least one of the multiple stems was alive | |
| All alive | All the multiple stems or single stem were alive | |
| Resprouting | No resprouting | No new shoot/leaves emerged |
| Stem only | New shoots/leaves only emerged from the stems/seedling tops | |
| Stem and basal | New shoots/leaves emerged from both the base and stems/ seedling tops | |
| Basal only | New shoots only emerged from the base |
Table 3.
Comparison of general linear models with above-ground mortality or basal resprouting as the explanatory variable. Stem status and wilting stages are defined in Table 2. Bolded models are the best models based on AIC criteria. Where models had equivalent or near-equivalent AIC, we selected the model with the fewest parameters.
| Models Explaining the Above-Ground Mortality | df | AIC |
|---|---|---|
| Model1: D + H + D*H + Species + Wilting stage + No. of stem | 134 | 80 |
| Model2: D + H + D*H + Species + Wilting stage | 135 | 78 |
| Model3: D + H + D*H + Species | 139 | 126 |
| Model4: D + H + D*H + Wilting stage | 138 | 93 |
| Model5: D + Species + Wilting stage | 137 | 75 |
| Model6: H + Species + Wilting stage | 137 | 84 |
| Model7: Species + Wilting stage | 138 | 83 |
| Model of Resprouting after Treatment | ||
| Model1: D + H + D*H + Species + Wilting stage + No. of stem + Stem status | 132 | 180 |
| Model2: D + H + D*H + Species + Writing stage + No. of stem | 134 | 193 |
| Model3: D + H + D*H + Species + Wilting stage + Stem status | 133 | 185 |
| Model4: D + H + D*H + Species + No. of stem + Stem status | 136 | 177 |
| Model5: D + H + D*H + No. of stem + Stem status | 139 | 178 |
| Model6: D + Species + No. of stem + Stem status | 138 | 176 |
| Model7: H + Species + No. of stem + Stem status | 138 | 177 |
| Model8: H*Species + No. of stem + Stem status | 135 | 181 |
| Model9: D*Species + No. of stem + Stem status | 135 | 179 |
| Model10: Species + No. of stem + Stem status | 139 | 175 |
| Model11: No. of stem + Stem status | 140 | 178 |
| Model12: Species + Stem status | 140 | 178 |
© 2019 by the authors. Licensee MDPI, Basel, Switzerland. This article is an open access article distributed under the terms and conditions of the Creative Commons Attribution (CC BY) license (http://creativecommons.org/licenses/by/4.0/).
Share and Cite
MDPI and ACS Style
Nguyen, T.T.; Arndt, S.K.; Baker, P.J. Leaf Physiological Responses to Drought Stress and Community Assembly in an Asian Savanna. Forests 2019, 10, 1119. https://doi.org/10.3390/f10121119
AMA Style
Nguyen TT, Arndt SK, Baker PJ. Leaf Physiological Responses to Drought Stress and Community Assembly in an Asian Savanna. Forests. 2019; 10(12):1119. https://doi.org/10.3390/f10121119
Chicago/Turabian StyleNguyen, Thuy T., Stefan K. Arndt, and Patrick J. Baker. 2019. "Leaf Physiological Responses to Drought Stress and Community Assembly in an Asian Savanna" Forests 10, no. 12: 1119. https://doi.org/10.3390/f10121119
Note that from the first issue of 2016, this journal uses article numbers instead of page numbers. See further details here.