Genetically Determined Differences in Annual Shoot Elongation of Young Norway Spruce


Latvian State Forest Research Institute ‘Silava’, Rigas Street 111, LV-2169 Salaspils, Latvia
*
Author to whom correspondence should be addressed.
Forests 2020, 11(12), 1260; https://doi.org/10.3390/f11121260
Submission received: 25 October 2020
/
Revised: 19 November 2020
/
Accepted: 25 November 2020
/
Published: 26 November 2020
(This article belongs to the Section Forest Ecology and Management)
Abstract
:The annual shoot elongation could be described by a non-linear growth model to characterize differences in its dynamics among spruce genotypes, the effect of each shoot elongation phase on the total shoot length, and the genetic differences for a particular growth phase. The terminal shoot length was measured in two open-pollinated progeny trials of Norway spruce on average once per week during the ninth growing season. For the analysis, 10% of families with the longest annual increment (shoot) and 10% with the shortest were selected for each trial. The Gompertz model was fitted to individual tree data, and the mean values of its coefficients for each group of families were obtained. Family significantly (p < 0.001) affected total shoot length and all growth rhythm parameters, with similar trends reported in both studied sites. Heritability of Gompertz model coefficients in most cases exceeded that of the tree height. The superior10% of families started shoot elongation slightly but non-significantly earlier (all p > 0.05) than the other groups of families and had more intense shoot elongation (mm per day) during the entire growing season. A strong negative relation was found between the slope coefficient of the cumulative shoot elongation lines and the total height increment. The group of families with the longest increment had flatter relative shoot elongation lines, indicating relatively more evenly distributed growth within the growing season. In contrast, families with the shortest increment tended to accumulate a higher proportion of height increment during the active growth phase and reduced relative growth intensity more rapidly. The 10% of families with the largest annual increment showed superior characteristics in all shoot elongation phases, resulting in 30–40% longer shoots compared to the 10% of families with the smallest annual increment. The significant differences in Gompertz model coefficients indicate that genotypes with favorable growth patterns might be selected.
1. Introduction
Norway spruce (Picea abies (L.) Karst.) is the most economically important tree species in Northern Europe, constituting about one-third of the wood resources in the region [1]. The genetic improvement of spruce began in the late 1940s [2]. Since then, the selection of superior genotypes has notably improved yield and stem quality. The reported gain for best-performing families is 21–25% for height [3] and 10–25% for stem volume [2] compared to unimproved trees. Hence, breeding has led to a reduced rotation length by 5–10 years and an increased net present value by 30–400% in Norway [2] and has increased the internal rate of return by 5.2–8.3% in Sweden [4].
In Northern Europe, climate change is associated with an extended vegetation period [5] that could enhance forest productivity but is counteracted by limitations due to early/late frosts [6,7]. Therefore, tree survival and vitality, especially at a young age, largely depend on the synchronicity between the growth rhythm and climate. The growth onset and cessation are partly genetically determined [8,9,10], and growth timing and duration differ among provenances, families, and clones [11,12]. An application of the improved (suitable) forest regeneration material could mitigate the adverse effects of the changing climate on forestry [13,14]. Hence, traits related to adaptability have gained increased importance in tree breeding [15,16].
Superior height growth is the main trait used for genotype selection for various reasons. An early height growth provides information on the growth potential of the tested material [17,18,19], has reasonably high heritability [20,21,22,23], and is the earliest well-expressed trait [17]. Tree height is less affected by the environment and competition than other easily measurable characteristics, such as stem diameter [24], and is used to express site productivity through site index [25,26]. Total tree height is compounded by yearly height increments. Annual height growth variation has not been extensively studied, presumably due to the technical limitations in measurements, with some insights into inter-annual variation related to meteorological conditions (e.g., [27,28,29]) and seasonal dynamics of height growth (e.g., [30,31,32]).
The intra-annual height growth rhythm follows a sigmoid pattern that could be described using non-linear growth models, such as Gompertz’s model [33]. This model’s coefficients describe three growth phases (growth onset, active growth, and growth cessation), providing data to assess the growth dynamics between families of a particular species, the effect of each divided phase on the total shoot length, and the genetic (family) differences for a particular growth phase. Based on this knowledge, genotypes with desired traits (e.g., larger height increment) could be selected more precisely.
In this study, we aimed to characterize the genetically determined differences of annual shoot elongation dynamics for superior and inferior families. We hypothesized that a higher shoot length is formed for trees with an earlier growth onset and more intense elongation at the beginning of the growth period.
2. Materials and Methods
The elongation of the terminal shoot was studied in two open-pollinated progeny trials of Norway spruce (Picea abies (L.) Karst.) in the central region of Latvia, in Ķegums (56°46′ N, 24°48′ E) and Ozolnieki (56°43′ N, 23°46′ E) municipalities (throughout the paper “Rembate” and “Jelgava,” respectively).
The Rembate trial was located on abandoned agricultural land, corresponding to the Oxalidosa forest type (local classification by Bušs [34]). The trial was established in 2005, planting three-year-old bare-rooted seedlings, representing a total of 104 families in three or four replications of 24 tree plots (four rows of six trees) with a spacing of 2 × 2.5 m. In total, 9485 trees were planted in the trial, with an average of 91 progenies per family.
The Jelgava trial was established in forest land on drained peat soil, corresponding to the Myrtillosa mel. forest type [34]. The trial was established in 2006, planting two-year-old bare-rooted seedlings, representing a total of 60 families in three or four replications of 12 tree plots (three rows of four trees) with a spacing of 3 × 2 m. In total, 2736 trees were planted in the trial, with an average of 46 progenies per family. Each trial consisted of a different set of open-pollinated families of plus-trees selected across Latvia.
In both trials, measurements of the current year terminal shoot length were done during the ninth growing season (age from seed). In May, trials were monitored every second day to determine the time of budburst, that is, when about half of the trial trees had started bud flush. The shoot length was measured by a single person once per week for randomly selected trees, omitting trees with damages (browsed, pest infected, or lost top shoot). Measurements were stopped when about half of the trial trees had a weekly increment less than 3 mm. The monitored period was 61 days in Rembate and 59 days in Jelgava. In total, 1766 trees from 88 families in Rembate (on average, 20 trees per family) and 1239 trees from 59 families in Jelgava (on average, 21 trees per family) were measured.
In each trial, families were ranked according to their mean shoot length. We selected 10% of the superior and 10% of inferior families, considering the number of families per trial and the commonly used selection intensity in tree breeding practices in Latvia. The divided groups of families are referred to as “superior10%”, “inferior10%”, and “rest” throughout the paper. The coefficients of the Gompertz model (1) were calculated for each tree. The Gompertz model fits the sigmoidal curve of the annual shoot elongation and is commonly used in biological studies [33]. The model divides the growth curve into three phases: lag, exponential, and stationary growth. The model coefficient α represents the maximal value at the stationary phase (upper asymptote), coefficient β describes the length of the lag phase, and coefficient k is the growth rate (affects the slope) at the exponential growth phase [33]. Trees that had outlier values of Gompertz model coefficients were omitted from further analysis (seven trees in Rembate and 17 trees in Jelgava). For each group of families, the arithmetic mean coefficients of the model, mean height increment, mean shoot elongation, and cumulative shoot elongation were calculated:
where SL is the shoot length, α is the asymptote parameter, β is the displacement parameter, k is the maximum relative intensity, and A the day of measurements.
The estimates of narrow-sense individual-tree heritability (h2) for the Gompertz model coefficients (α, β, and k) and tree variables (tree height and total shoot length) were calculated as:
where , , and are the estimated variance components of the family, family × replication interaction, and the residual, respectively.
The coefficients of additive genetic variation (CVa) for the Gompertz model coefficients (α, β, and k) and tree variables (tree height and total shoot length) were estimated as:
where is the estimated variance components of the family and is the phenotypic mean.
Linear mixed-effects models (LME) as implemented in R 4.0.3 [35] packages lme4 [36] and lmerTest [37] were used to test the influence of the group of families (superior10%, inferior10%, and rest) on the Gompertz model coefficients (α, β, and k) and tree variables (tree height and total shoot length). As there were multiple trees per plot and multiple plots per family, family and plot identification numbers (ID) were used as nested random factors in the models:
where yijk is the tree level response variable of the kth tree from the ith group of families in the kth plot, nested within the jth replication, Pi is the fixed effect of the ith site, pjk is the random effect (intercept) of the kth plot within the family, and ɛijk is the experimental error.
Residuals plots were used to assess heteroscedasticity. Problems with heteroscedasticity were found for models of coefficients β and k, so those variables were log-transformed. A comparison among the estimated marginal means as implemented in R package emmeans [38] was used to compare levels of factor group of families (superior10%, inferior10%, and rest) if the LME showed a significant effect. In the lmerTest models where the influences of family on coefficients and tree variables were tested, only the sample plot ID was used as a random factor.
The Spearman correlation coefficients between Gompertz model coefficients (α, β, and k) and total shoot length were calculated. A correlation analysis was conducted using two data levels: (1) all data for the Rembate and Jelgava trials separately, and (2) the mean family values for the Rembate and Jelgava trials separately.
3. Results
The measurements of the terminal shoot length were successfully fitted to the Gompertz model, obtaining coefficients describing shoot elongation (Figure 1A). In both trials, the family had a significant effect (all p < 0.001) on total shoot length and on the coefficients of growth onset, cessation, and maximal relative growth intensity.
Shoot elongation patterns showed differences among the divided groups of families (Table 1), and the trend was consistent in both studied sites. The maximum value of the shoot length (described by model coefficient α) differed significantly (p < 0.001) between the groups of families in both trials. The difference in total shoot length between the superior10% (largest annual increment) and inferior10% (lowest annual increment) families was 42% (624 ± 26 vs. 362 ± 21 mm) in Rembate and 29% (662 ± 26 vs. 468 ± 33 mm) in Jelgava.
In both trials, the model coefficient β (describing the lag of the growth onset) was slightly but non-significantly lower (all p > 0.05) for the superior10% families, indicating a similar timing of the start of the height increment as those of other groups of families (Table 1).
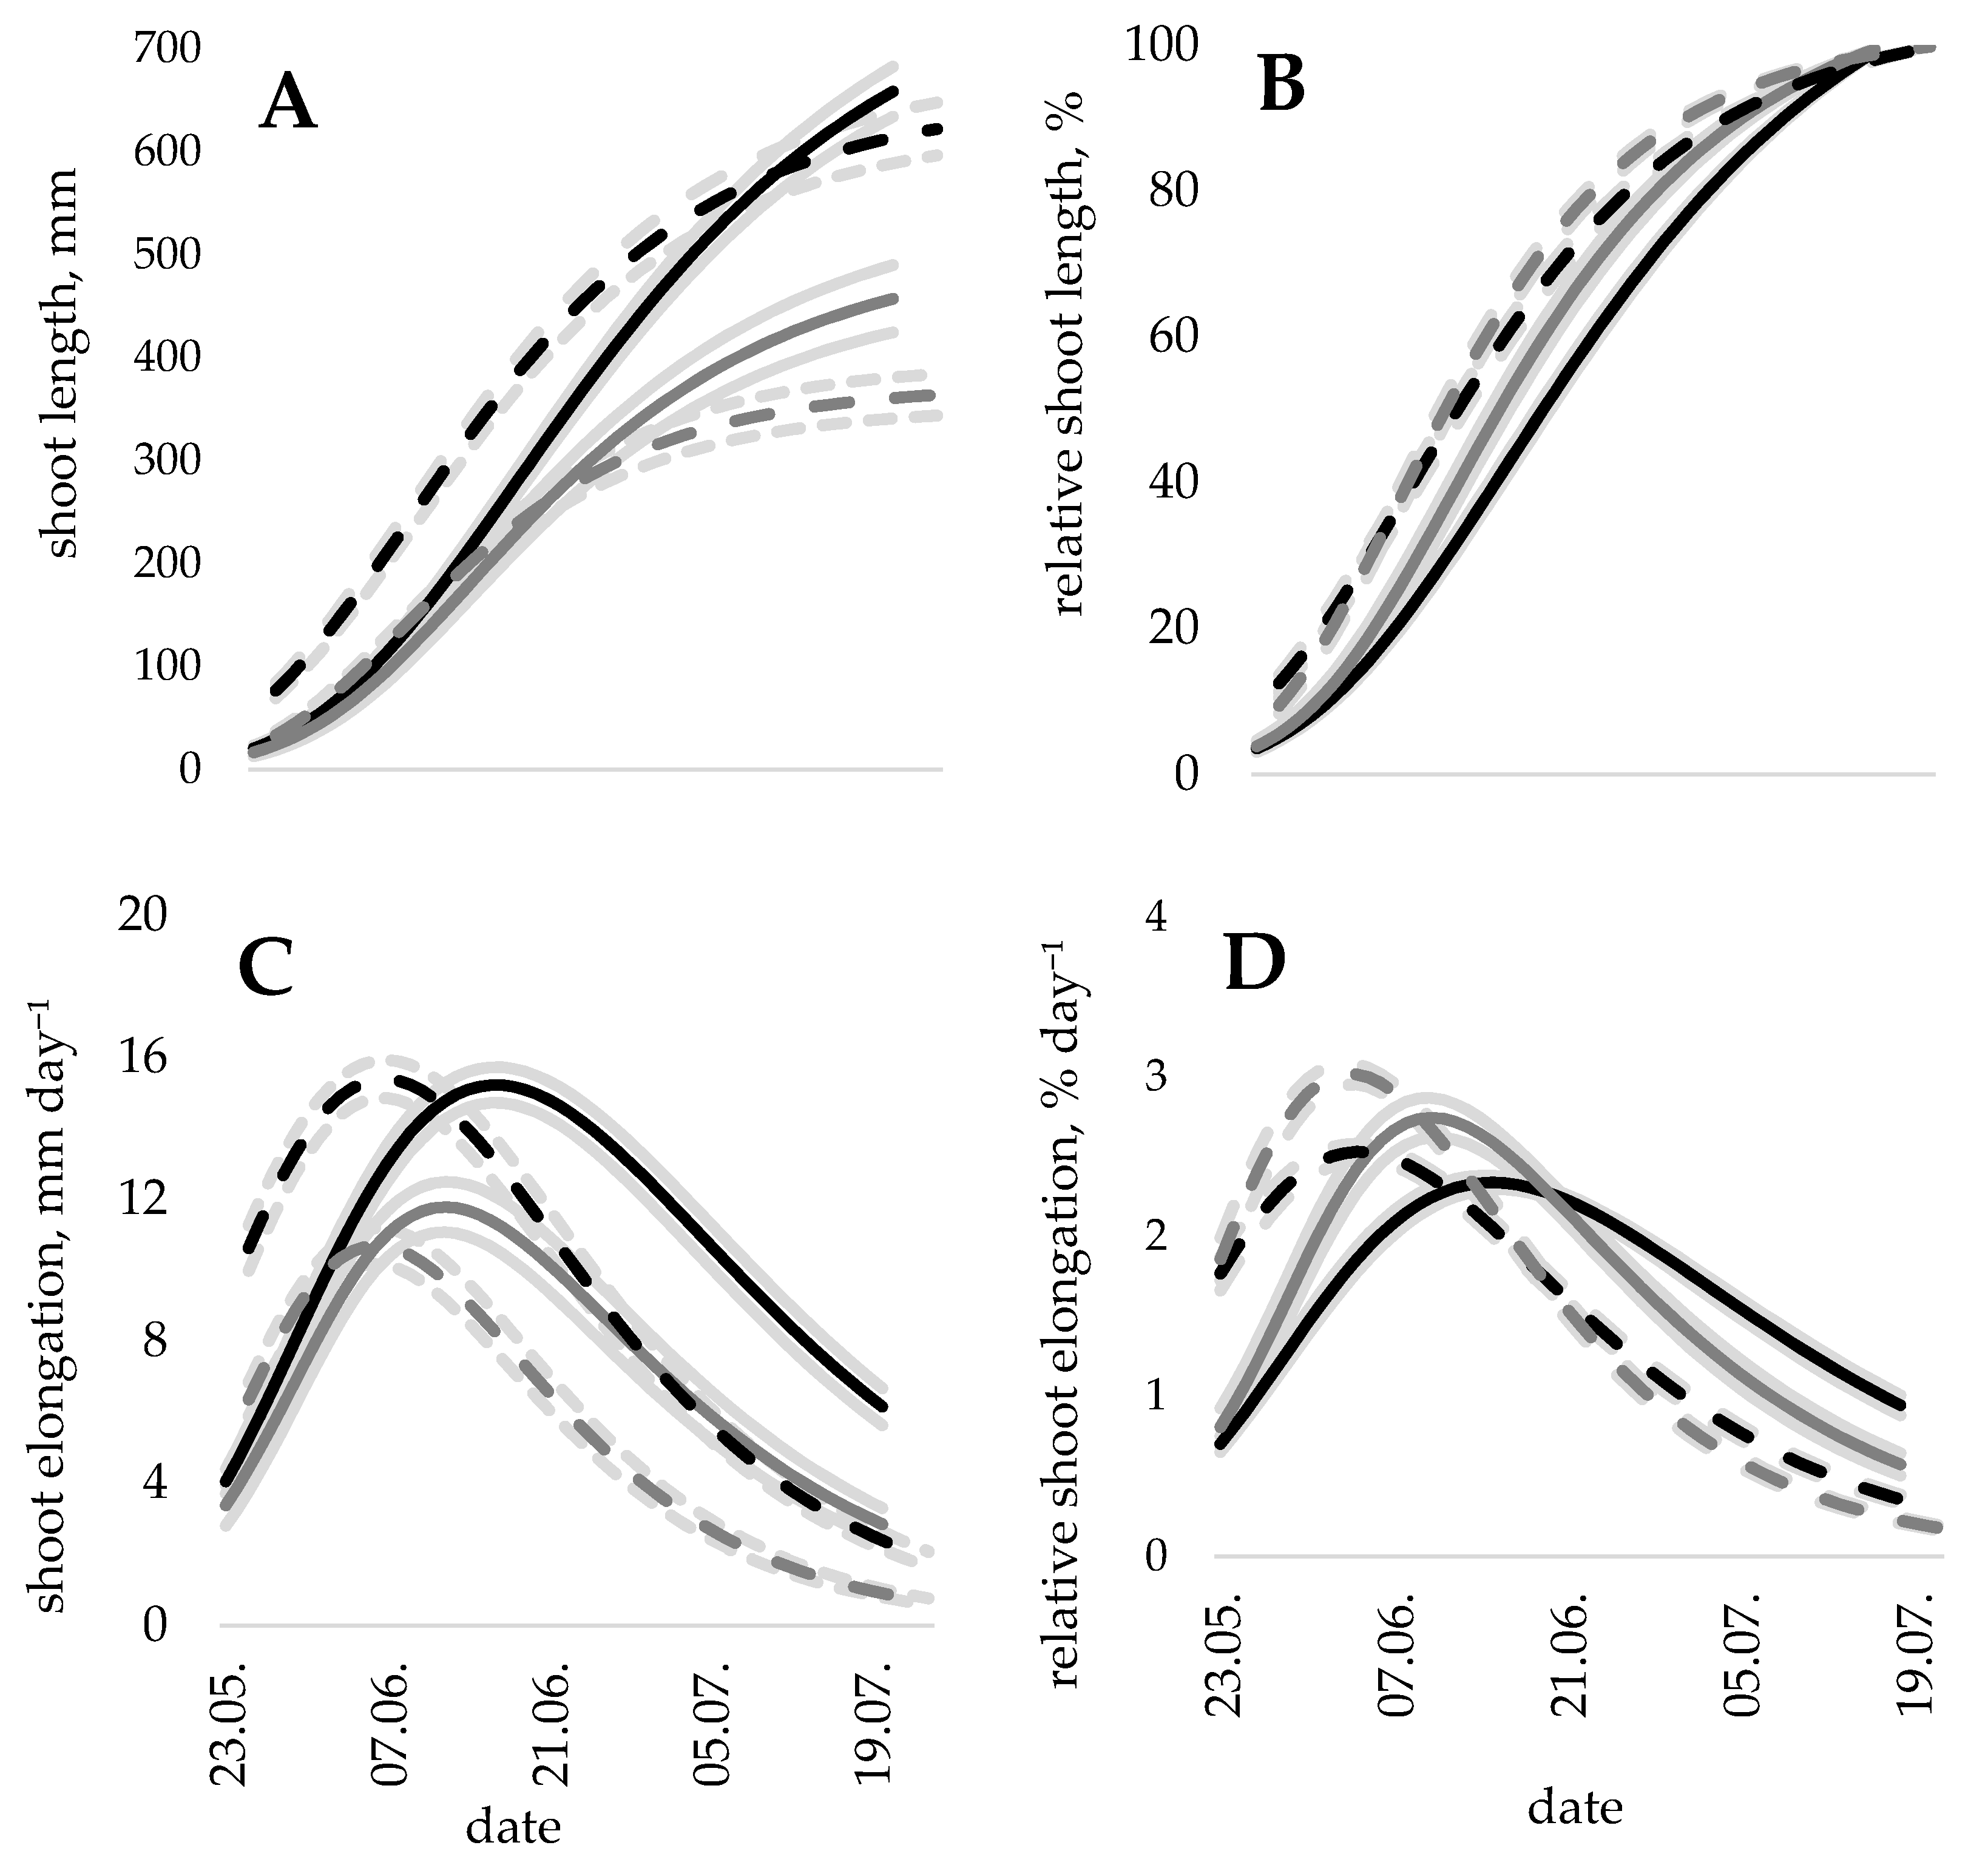
Corresponding to differences in total height increment, groups of superior10% families had higher (all p < 0.001) mean growth intensity than groups of rest and inferior10% of families. Shoot elongation (mm per day) of the superior10% families was consistently higher in comparison to the inferior10% families during the entire growing season (Figure 1C). Moreover, shoot elongation of the superior10% families peaked slightly later. For inferior10% families, the peak of elongation was delayed one day in Rembate and four days in Jelgava (Figure 1C).
At the peak of the maximal shoot growth (7th of June in Rembate and 16th of June in Jelgava), the superior10% families had formed 39% and 40% of the total shoot length, respectively. For the inferior10% families, 36% of the total shoot length in Rembate and 38% in Jelgava were formed at the peak of the maximal shoot growth.
The slope of cumulative shoot elongation lines (described by the model coefficient k), however, had an opposite trend to growth intensity (Table 1), with a strong negative relation between the slope coefficient and the total height increment at the individual tree level (r = −0.71 in Rembate and r = −0.66 in Jelgava, both p < 0.001). This relation remained at the family mean level (r = −0.75 in Rembate and r = −0.61 in Jelgava, both p < 0.001), and the slope of the cumulative shoot elongation lines was flatter for groups with a larger annual increment (Figure 1B).
The heritability coefficient (h2) for tree height was 0.24 ± 0.10 (± standard error) in Rembate and 0.31 ± 0.09 (± standard error) in Jelgava (Table 2). The heritability coefficients of the distinct growth phases (described by Gompertz model coefficients) were higher in the Rembate trial than in the Jelgava trial. They were higher for relative growth intensity during the active growth phase (coefficient k) and lag of the growth onset (coefficient β) than for the maximal value of shoot length. The coefficient of additive genetic variance (CVa) was the highest for β, reaching 17% in both trials. All other analyzed growth parameters (coefficients of Gompertz model, tree height, and total shoot length) had an additive genetic variance of 4–8% (Table 2).
4. Discussion
In this study, individual tree data on current year shoot elongation were fitted to the Gompertz model, and the mean parameters of 10% of families with the largest annual increment, 10% of families with the shortest annual increment, and the rest of families were assessed. During the growing season, height growth is not constant, and the obtained results reveal genetic differences (among families) for the biological shoot elongation trend with slow growth during the elongation onset and cessation and high growth intensity in the middle of the growth period [28,39].
Trees in the studied trials started growth at a distinct time, and trees in the Rembate trial had earlier growth onset than trees in Jelgava. The growth rhythm parameters are controlled by environmental factors [40,41,42,43]. However, considering the small distance between the sites (about 70 km), the lag in growth onset could be related to differences in microclimatic conditions [44] or the represented set of families rather than by meteorological conditions.
Within each trial, groups of families followed similar shoot elongation patterns, and significant differences in growth rhythm were found between groups of families. The time lag of the growth onset was non-significantly different between groups of families, indicating no effect of the earlier start of shoot elongation on total shoot length. Similarly, a weak relation or no relation between growth onset and annual shoot length was found in earlier findings on Norway spruce [31,45]. The estimated Gompertz parameter on growth onset characterizes the time lag between the start of the shoot elongation to the curve inflection point for active growth. Earlier bud flush is typically related to frost damages [46]. However, trees with earlier shoot elongation are not necessarily exposed to frost damage, since the pattern of height growth intensity after the budburst varies between the families. The small difference in the time lag of growth onset between families could also be related to the origin of the parent material. All tested material was from the open-pollinated families of locally selected plus-trees, which usually adapt well to climate due to their earlier start of growth and avoidance of frost damage [47].
As expected, superior10% families showed faster shoot elongation during the beginning of the growing season, probably associated with a high proportion of the remobilized stored nutrients during the bud break [48,49]. However, superior families also had relatively more evenly distributed growth within the growing season in comparison to families with a lower annual increment that tended to accumulate a higher proportion of height increment during the active growth phase. Accordingly, superior families maintained higher relative growth intensity during the second half of the growing season, while inferior10% families reduced their relative growth intensity more rapidly.
We found no differences in the shoot elongation period, although it has been found to be moderately related to annual shoot length [45] and the primary factor explaining 80% of shoot length variation among provenances in Norway spruce provenance trials [30]. In accordance with our obtained results, the growth rate was found to determine shoot length for Latvian provenances planted in provenance trials in Norway [30]. Similarly, the growth rate in the middle of the active elongation period is shown to be strongly related to the annual shoot length [45]. However, the active growth period’s slope coefficient was negatively linked with shoot length (Figure 1B), indicating the greater importance of the active growth period for families with shorter annual increments. Similar results are observed among spruce provenances, and those with shorter annual increment had higher (above mean) rates of elongation [30]. During the active shoot elongation phase, growth is determined more by the environment than by genetics [32]; therefore, slow-growing families are more prone to influences from yearly meteorological conditions.
Observations at the individual tree level have also shown differences in growth rhythm related to tree status within stand [28]. Within the same stand, dominant spruce trees have a more even elongation rate during the growing season, while suppressed trees have delayed growth initiation and a high elongation rate [28]. Our results revealed a similar pattern, as tree height could be used as an indicator for tree status within a trial and is directly affected by shoot length. However, while a correlation between tree height and total shoot length was strong in Rembate, in Jelgava this link was rather weak, indicating the effect of other factors (e.g., initial stage of a competition) on tree growth. Spruce at a young age might form proleptic shoots, and the relation between tree height and annual shoot length might be diminished, as this additional shoot increment adds to the total tree height. The studied trials are established on forest types likely to promote the occurrence of proleptic shoots [50]. However, we did observe a sudden increase in shoot elongation during the observed period.
Most of the Gompertz model coefficients had reasonably high h2, although differences in the coefficient values between groups of families were relatively small. The estimated heritability of Gompertz model coefficients in most cases exceeded that of tree height. Our obtained heritability for tree height was similar between the trials and is within a range of those calculated for a height of Pinus pinaster at the age of 10 years [51] and for Pinus sylvestris at the age of 11 to 20 years [52]. A considerably higher heritability of the upper asymptotic height and maximum growth rate was found in a study of Picea glauca during the first growing season [17], but it represents free growth as opposed to the predetermined growth analyzed in the current study. The estimated heritability coefficients of growth rhythm parameters had rather different levels between the trials. A large variation in narrow-sense heritability and genetic coefficient of variation for growth parameters between trials was also found in other studies [8,53], indicating the effect of trial conditions and the included set of families on parameters describing the genetic determination of the particular traits.
Overall, the more vigorous families started to grow earlier, grew faster and at a more stable rate, and ceased growth later. The parameters of the growth curves presented in this study are based on the growth curve fitted for one season and thus require some caution. First, the cumulative shoot elongation’s seasonal dynamic varies by year [28], as the annual shoot elongation is susceptible to short-term environmental variation [54]. Second, genetic correlations among height growth traits are not stable and change with tree development, at least at a young age [31,55]. Therefore, the obtained relationships among growth parameters should be verified over a longer time span and, preferably, a larger set of genotypes. The obtained results, however, offer valuable insights into genetic differences in growth dynamics that could be applicable to the selection of genotypes with superior height growth.
5. Conclusions
The juvenile shoot elongation patterns for Norway spruce families are genetically determined, and families with larger shoot lengths have higher growth intensity at the active growth phase that remains higher later in the growing season than that of families with shorter annual increments. The significant differences in Gompertz model coefficients indicate that genotypes with favorable growth patterns might be selected to improve the volume production and adaption to climate change.
Author Contributions
Conceptualization, Ā.J. and B.J.; methodology, B.J., U.N., and Ā.J.; formal analysis, S.Š. and B.J.; data curation, B.J. and U.N.; writing—original draft preparation, B.J. and S.Š.; writing—review and editing, R.M. and A.J.; All authors have read and agreed to the published version of the manuscript.
Funding
This research was funded by ERDF grant number 1.2.1.1/18/A/004.
Acknowledgments
The study was carried out as a part of the Forest Competence Centre (ERDF) project “Technology for early diagnostics of genetically determined variation of resilience-related trait for Norway spruce” (1.2.1.1/18/A/004), and part of the material was collected in Latvian state forests (LVM) project “Tree breeding for selection of superior forest reproductive material”.
Conflicts of Interest
The authors declare no conflict of interest.
References
- Rytter, L.; Johansson, K.; Karlsson, B.; Lars-Göran, S. Tree Species, Genetics and Regeneration for Bioenergy Feedstock in Northern Europe. In Forest BioEnergy Production: Management, Carbon Sequestration and Adaptation; Kellomäki, S., Kilpeläinen, A., Alam, A., Eds.; Springer Science & Business Media: New York, NY, USA, 2013; pp. 7–37. [Google Scholar]
- Jansson, G.; Hansen, J.K.; Haapanen, M.; Kvaalen, H.; Steffenrem, A. The genetic and economic gains from forest tree breeding programmes in Scandinavia and Finland. Scand. J. For. Res. 2017, 32, 273–286. [Google Scholar] [CrossRef]
- Liziniewicz, M.; Karlsson, B.; Helmersson, A. Improved varieties perform well in realized genetic gain trials with Norway spruce seed sources in southern Sweden. Scand. J. For. Res. 2019, 34, 409–416. [Google Scholar] [CrossRef]
- Simonsen, R.; Rosvall, O.; Gong, P.; Wibe, S. Profitability of measures to increase forest growth. For. Policy Econ. 2010, 12, 473–482. [Google Scholar] [CrossRef]
- Park, T.; Ganguly, S.; Tømmervik, H.; Euskirchen, E.S.; Høgda, K.A.; Karlsen, S.R.; Brovkin, V.; Nemani, R.R.; Myneni, R.B. Changes in growing season duration and productivity of northern vegetation inferred from long-term remote sensing data. Environ. Res. Lett. 2016, 11. [Google Scholar] [CrossRef]
- Hänninen, H. Climate warming and the risk of frost damage to boreal forest trees: Identification of critical ecophysiological traits. Tree Physiol. 2006, 26, 889–898. [Google Scholar] [CrossRef] [Green Version]
- Liu, Q.; Piao, S.; Janssens, I.A.; Fu, Y.; Peng, S.; Lian, X.; Ciais, P.; Myneni, R.B.; Peñuelas, J.; Wang, T. Extension of the growing season increases vegetation exposure to frost. Nat. Commun. 2018, 9. [Google Scholar] [CrossRef] [Green Version]
- Hannerz, M.; Sonesson, J.; Ekberg, I. Genetic correlations between growth and growth rhythm observed in a short-term test and performance in long-term field trials of Norway spruce. Can. J. For. Res. 1999, 29, 768–778. [Google Scholar] [CrossRef]
- Hannerz, M. Evaluation of temperature models for predicting bud burst in Norway spruce. Can. J. For. Res. 1999, 29, 9–19. [Google Scholar] [CrossRef]
- Mihai, G.; Curtu, A.L.; Garbacea, P.; Alexandru, A.M.; Mirancea, I.; Teodosiu, M. Genetic variation and inheritance of bud flushing in a Norway spruce seed orchard established in Romania. In Proceedings of the Biennial International Symposium “Forest and sustainable development”, Brașov, Romania, 25–27 October 2018; Borz, S.A., Curtu, A.L., Mușat, E.C., Eds.; Transilvania University Press: Brașov, Romania, 2019; pp. 73–82. [Google Scholar]
- Skrøppa, T.; Hylen, G.; Dietrichson, J. Relationships between wood density components and juvenile height growth and growth rhythm traits for Norway spruce provenances and families. Silvae Genet. 1999, 48, 235–239. [Google Scholar]
- Skrøppa, T.; Steffenrem, A. Genetic variation in phenology and growth among and within Norway spruce populations from two altitudinal transects in mid-Norway. Silva Fenn. 2019, 53, 1–19. [Google Scholar] [CrossRef]
- Lindner, M. Developing adaptive forest management strategies to cope with climate. Tree Physiol. 2000, 20, 299–307. [Google Scholar] [CrossRef] [PubMed] [Green Version]
- Bolte, A.; Ammer, C.; Löf, M.; Madsen, P.; Nabuurs, G.J.; Schall, P.; Spathelf, P.; Rock, J. Adaptive forest management in central Europe: Climate change impacts, strategies and integrative concept. Scand. J. For. Res. 2009, 24, 473–482. [Google Scholar] [CrossRef]
- Zeltinš, P.; Katrevičs, J.; Gailis, A.; Maaten, T.; Desaine, I.; Jansons, A. Adaptation capacity of norway spruce provenances in Western Latvia. Forests 2019, 10, 840. [Google Scholar] [CrossRef] [Green Version]
- Isabel, N.; Holliday, J.A.; Aitken, S.N. Forest genomics: Advancing climate adaptation, forest health, productivity, and conservation. Evol. Appl. 2020, 13, 3–10. [Google Scholar] [CrossRef] [PubMed] [Green Version]
- Rweyongeza, D.M.; Yeh, F.C.; Dhir, N.K. Genetic parameters for seasonal height and height growth curves of white spruce seedlings and their implications to early selection. For. Ecol. Manag. 2004, 187, 159–172. [Google Scholar] [CrossRef]
- Liziniewicz, M.; Berlin, M.; Karlsson, B. Early assessments are reliable indicators for future volume production in Norway spruce (Picea abies L. Karst) genetic field trials. For. Ecol. Manag. 2018, 411, 75–81. [Google Scholar] [CrossRef]
- Liziniewicz, M.; Berlin, M. Differences in growth and areal production between Norway spruce (Picea abies L. Karst) regeneration material representing different levels of genetic improvement. For. Ecol. Manag. 2019, 435, 158–169. [Google Scholar] [CrossRef]
- Jansson, G.; Danusevičius, D.; Grotehusman, H.; Kowalczyk, J.; Krajmerova, D.; Skrøppa, T.; Wolf, H. Norway spruce (Picea abies (L.) H.Karst.). In Forest Tree Breeding in Europe: Current State-of-the-Art and Perspectives; Pâques, L.E., Ed.; Springer Science & Business Media: Dordrecht, The Netherlands, 2013; pp. 123–176. [Google Scholar]
- Hannrup, B.; Cahalan, C.; Chantre, G.; Grabner, M.; Karlsson, B.; Le Bayon, I.; Jones, G.L.; Müller, U.; Pereira, H.; Rodrigues, J.C.; et al. Genetic parameters of growth and wood quality traits in Picea abies. Scand. J. For. Res. 2004, 19, 14–29. [Google Scholar] [CrossRef]
- Kowalczyk, J. Comparison of phenotypic and genetic selections in Scots pine (Pinus sylvestris L.) single tree plot half-sib progeny tests. Dendrobiology 2005, 53, 45–56. [Google Scholar]
- Kroon, J.; Ericsson, T.; Jansson, G.; Andersson, B. Patterns of genetic parameters for height in field genetic tests of Picea abies and Pinus sylvestris in Sweden. Tree Genet. Genomes 2011, 7, 1099–1111. [Google Scholar] [CrossRef]
- Skovsgaard, J.P.; Vanclay, J.K. Forest site productivity: A review of the evolution of dendrometric concepts for even-aged stands. Forestry 2008, 81, 13–31. [Google Scholar] [CrossRef] [Green Version]
- Johansson, T. Site index curves for Norway spruce (Picea abies (L.) karst.) planted on abandoned farm land. New For. 1996, 11, 9–29. [Google Scholar] [CrossRef]
- Perin, J.Ô.; Hébert, J.; Brostaux, Y.; Lejeune, P.; Claessens, H. Modelling the top-height growth and site index of Norway spruce in Southern Belgium. For. Ecol. Manag. 2013, 298, 62–70. [Google Scholar] [CrossRef]
- Levanič, T.; Gričar, J.; Gagen, M.; Jalkanen, R.; Loader, N.J.; McCarroll, D.; Oven, P.; Robertson, I. The climate sensitivity of Norway spruce (Picea abies (L.) Karst.) in the southeastern European Alps. Trees Struct. Funct. 2009, 23, 169–180. [Google Scholar] [CrossRef] [Green Version]
- Konôpka, B.; Pajtík, J.; Bošela, M.; Hlásny, T.; Sitková, Z. Inter-and intra-annual dynamics of height increment in young beech and spruce stands in relation to tree size and weather conditions. For. J. 2014, 60, 51–59. [Google Scholar] [CrossRef] [Green Version]
- Carles, S.; Boyer Groulx, D.; Lamhamedi, M.S.; Rainville, A.; Beaulieu, J.; Bernier, P.; Bousquet, J.; Deblois, J.; Margolis, H.A. Family variation in the morphology and physiology of white spruce (Picea glauca) seedlings in response to elevated CO2 and temperature. J. Sustain. For. 2015, 34, 169–198. [Google Scholar] [CrossRef]
- Skrøppa, T.; Magnussen, S. Provenance variation in shoot growth components of Norway spruce. Silvae Genet. 1993, 42, 111–120. [Google Scholar]
- Ekberg, I.; Eriksson, G.; Namkoong, G.; Nilsson, C.; Norell, L. Genetic correlations for growth rhythm and growth capacity at ages 3–8 years in provenance hybrids of Picea abies. Scand. J. For. Res. 1994, 9, 25–33. [Google Scholar] [CrossRef]
- Matisons, R.; Zeltiņš, P.; Danusevičius, D.; Džeriņa, B.; Desaine, I.; Jansons, Ā. Genetic control of intra-annual height growth in 6-year-old norway spruce progenies in Latvia. iForest 2019, 12, 214–219. [Google Scholar] [CrossRef]
- Tjørve, K.M.C.; Tjørve, E. The use of Gompertz models in growth analyses, and new Gompertz-model approach: An addition to the Unified-Richards family. PLoS ONE 2017, 12, e0178691. [Google Scholar] [CrossRef]
- Bušs, K. Forest ecosystem classification in Latvia. Proc. Latv. Acad. Sci. Sect. B Nat. Exact Appl. Sci. 1997, 51, 204–218. [Google Scholar]
- R Core Team, R. The R Project for Statistical Computing. Available online: https://www.r-project.org/ (accessed on 11 November 2020).
- Bates, D.; Mächler, M.; Bolker, B.M.; Walker, S.C. Fitting linear mixed-effects models using lme4. J. Stat. Softw. 2015, 67, 1–48. [Google Scholar] [CrossRef]
- Kuznetsova, A.; Brockhoff, P.B.; Christensen, R.H.B. lmerTest package: Tests in linear mixed effects models. J. Stat. Softw. 2017, 82, 1–26. [Google Scholar] [CrossRef] [Green Version]
- Lenth, R.; Buerkner, P.; Herve, M.; LOve, J.; Riebl, H.; Singmann, H. CRAN—Package Emmeans. Available online: https://cran.r-project.org/web/packages/emmeans/index.html (accessed on 11 November 2020).
- Seo, J.W.; Salminen, H.; Jalkanen, R.; Eckstein, D. Chronological coherence between intra-annual height and radial growth of scots pine (Pinus sylvestris L.) in the northern boreal zone of Finland. Balt. For. 2010, 16, 57–65. [Google Scholar]
- Partanen, J.; Koski, V.; Hänninen, H. Effects of photoperiod and temperature on the timing of bud burst in Norway spruce (Picea abies). Tree Physiol. 1998, 18, 811–816. [Google Scholar] [CrossRef]
- Sutinen, S.; Partanen, J.; Viherä-Aarnio, A.; Häkkinen, R. Development and growth of primordial shoots in Norway spruce buds before visible bud burst in relation to time and temperature in the field. Tree Physiol. 2012, 32, 987–997. [Google Scholar] [CrossRef]
- Fløistad, I.S.; Granhus, A. Timing and duration of short-day treatment influence morphology and second bud flush in Picea abies seedlings. Silva Fenn. 2013, 47, 1–10. [Google Scholar] [CrossRef]
- Floistad, I.S.; Granhus, A. Morphology and phenology in picea abies seedlings in response to split short-day treatments. Balt. For. 2019, 25, 38–44. [Google Scholar] [CrossRef]
- Saksa, T.; Heiskanen, J.; Miina, J.; Tuomola, J.; Kolström, T. Multilevel modelling of height growth in young Norway spruce plantations in southern Finland. Silva Fenn. 2005, 39, 143–153. [Google Scholar] [CrossRef] [Green Version]
- Worrall, J. Seasonal, daily, and hourly growth of height and radius in Norway spruce. Can. J. For. Res. 1973, 3, 501–511. [Google Scholar] [CrossRef]
- Langvall, O.; Nilsson, U.; Örlander, G. Frost damage to planted Norway spruce seedlings—Influence of site preparation and seedling type. For. Ecol. Manag. 2001, 141, 223–235. [Google Scholar] [CrossRef]
- Leinonen, I.; Hänninen, H. Adaptation of the timing of bud burst of Norway spruce to temperate and boreal climates. Silva Fenn. 2002, 36, 695–701. [Google Scholar] [CrossRef] [Green Version]
- Hoch, G.; Richter, A.; Körner, C. Non-structural carbon compounds in temperate forest trees. Plant Cell Environ. 2003, 26, 1067–1081. [Google Scholar] [CrossRef]
- Villar-Salvador, P.; Uscola, M.; Jacobs, D.F. The role of stored carbohydrates and nitrogen in the growth and stress tolerance of planted forest trees. New For. 2015, 46, 813–839. [Google Scholar] [CrossRef]
- Katrevics, J.; Neimane, U.; Dzerina, B.; Kitenberga, M.; Jansons, J.; Jansons, A. Environmental factors affecting formation of lammas shoots in young stands of Norway spruce (Picea abies Karst.) in Latvia. iForest 2018, 11, 809–815. [Google Scholar] [CrossRef]
- Danjon, F. Heritabilities and genetic correlations for estimated growth curve parameters in maritime pine. Theor. Appl. Genet. 1994, 89, 911–921. [Google Scholar] [CrossRef] [PubMed]
- Haapanen, M.; Veiling, P.; Annala, M.-L. Progeny trial estimates of genetic parameters for growth and quality traits in Scots pine. Silva Fenn. 1997, 31, 3–12. [Google Scholar] [CrossRef]
- Karlsson, B.; Högberg, K. Genotypic parameters and clone x site interaction in clone tests of Norway spruce (Picea abies (L.) Karst.). For. Genet. 1998, 5, 21–30. [Google Scholar]
- Rweyongeza, D.M.; Yeh, F.C.; Dhir, N.K. Genetic parameters for bud flushing and growth characteristics of white spruce seedlings. Silvae Genet. 2010, 59, 151–158. [Google Scholar] [CrossRef] [Green Version]
- Ununger, J.; Ekberg, I.; Kang, H. Genetic control and age-related changes of juvenile growth characters in Picea abies. Scand. J. For. Res. 1988, 3, 55–66. [Google Scholar] [CrossRef]
Figure 1.
(A) the total shoot length and (B) relative shoot length, (C) shoot elongation and (D) relative shoot elongation (±95% confidence level indicated by shadow along the curves) for 10% of fastest-growing (black lines) and 10% of slowest-growing (grey lines) families in Rembate (dashed lines) and Jelgava (solid lines) trials.


Table 1.
Gompertz model coefficients, total shoot length (±95% confidence level), and growth intensity of families in Rembate and Jelgava. The groups of 10% of the superior, 10% of the inferior, and the rest families were divided according to their mean shoot length. α—asymptote parameter; β—displacement parameter; k—maximum relative intensity; SL—shoot length; GI–growth intensity; R—Rembate; J—Jelgava. Different letters within the same column and trial indicate significant (p < 0.05) difference between the groups.
| Trial | Group of Families | Gompertz Model Coefficients | SL, mm | GI, mm day−1 | ||
|---|---|---|---|---|---|---|
| α | β | k | ||||
| R | superior10% | 652 ± 29 a | 2.54 ± 0.12 a | 0.071 ± 0.002 a | 624 ± 26 a | 10.2 ± 0.4 a |
| rest | 518 ± 10 b | 2.83 ± 0.05 a | 0.079 ± 0.001 b | 499 ± 9 b | 8.1 ± 0.1 b | |
| inferior10% | 373 ± 21 c | 2.93 ± 0.14 a | 0.087 ± 0.002 c | 362 ± 21 c | 5.9 ± 0.3 c | |
| J | superior10% | 754 ± 36 a | 4.15 ± 0.14 a | 0.057 ± 0.002 a | 662 ± 26 a | 11.3 ± 0.4 a |
| rest | 636 ± 13 b | 4.21 ± 0.08 a | 0.065 ± 0.001 b | 558 ± 10 b | 9.4 ± 0.2 b | |
| inferior10% | 520 ± 41 b | 4.59 ± 0.31 a | 0.073 ± 0.004 c | 468 ± 33 c | 7.8 ± 0.6 c | |
Table 2.
Heritability coefficient (h2) and coefficient of additive genetic variance (CVa) for Gompertz model coefficients (α, β, and k) and tree variables (tree height and total shoot length) in the Rembate and Jelgava trials. SE—standard error; α–asymptote parameter; β—displacement parameter; k—maximum relative intensity.
| Trial | Parameters | h2 ± SE | CVa, % |
|---|---|---|---|
| Rembate | α | 0.21 ± 0.011 | 8 |
| β | 0.97 ± 0.08 | 17 | |
| k | 0.30 ± 0.10 | 5 | |
| Tree height | 0.24 ± 0.10 | 7 | |
| Shoot length | 0.23 ± 0.11 | 8 | |
| Jelgava | α | 0.03 ± 0.05 | 6 |
| β | 0.16 ± 0.06 | 17 | |
| k | 0.19 ± 0.08 | 7 | |
| Tree height | 0.31 ± 0.09 | 7 | |
| Shoot length | 0.08 ± 0.10 | 4 |
Publisher’s Note: MDPI stays neutral with regard to jurisdictional claims in published maps and institutional affiliations. |
© 2020 by the authors. Licensee MDPI, Basel, Switzerland. This article is an open access article distributed under the terms and conditions of the Creative Commons Attribution (CC BY) license (http://creativecommons.org/licenses/by/4.0/).
Share and Cite
MDPI and ACS Style
Jansone, B.; Neimane, U.; Šēnhofa, S.; Matisons, R.; Jansons, Ā. Genetically Determined Differences in Annual Shoot Elongation of Young Norway Spruce. Forests 2020, 11, 1260. https://doi.org/10.3390/f11121260
AMA Style
Jansone B, Neimane U, Šēnhofa S, Matisons R, Jansons Ā. Genetically Determined Differences in Annual Shoot Elongation of Young Norway Spruce. Forests. 2020; 11(12):1260. https://doi.org/10.3390/f11121260
Chicago/Turabian StyleJansone, Baiba, Una Neimane, Silva Šēnhofa, Roberts Matisons, and Āris Jansons. 2020. "Genetically Determined Differences in Annual Shoot Elongation of Young Norway Spruce" Forests 11, no. 12: 1260. https://doi.org/10.3390/f11121260
Note that from the first issue of 2016, this journal uses article numbers instead of page numbers. See further details here.