Article

Evaluation of Soil Organic Layers Thickness and Soil Organic Carbon Stock in Hemiboreal Forests in Latvia

Latvian State Forest Research Institute ‘Silava’, Rigas str. 111, LV-2169 Salaspils, Latvia
*
Author to whom correspondence should be addressed.
Forests 2021, 12(7), 840; https://doi.org/10.3390/f12070840
Submission received: 7 June 2021 / Revised: 15 June 2021 / Accepted: 19 June 2021 / Published: 25 June 2021
(This article belongs to the Section Forest Ecology and Management)

Abstract

:
In the forest land of many European countries, including hemiboreal Latvia, organic soils are considered to be large sources of greenhouse gas (GHG) emissions. At the same time, growing efforts are expected in the near future to decrease emissions from the Land Use, Land Use Change and Forestry sector, including lands with organic soils to achieve enhanced contributions to the emissions and removals balance target set by the Paris Agreement. This paper aims to describe the distribution of organic soil layer thickness in forest land based on national forest inventory data and to evaluate soil organic carbon stock in Latvian forests classified as land with organic soil. The average thickness of the forest floor (organic material consisting of undecomposed or partially decomposed litter, O horizon) was greatest in coniferous forests with wet mineral soil, and decreased with increasing soil fertility. However, forest stand characteristics, including basal area and age, were weak predictors of O horizon thickness. In forests with organic soil, a lower proportion of soil organic matter layer (H horizon) in the top 70 cm soil layer, but a higher soil organic carbon stock both in the 0–30 cm layer and in the 0–100 cm layer was found in drained organic soils than in wet organic soils. Furthermore, the distribution of the soil H horizon thickness across different forest site types highlighted the potential overestimation of area of drained organic soils in Latvian forest land reported within the National GHG Inventory.

1. Introduction

The carbon (C) stock in the world’s forests including soil, live biomass, deadwood, and litter is estimated to be 861 ± 66 Gt C [1]. Globally, almost half of the total organic carbon (OC) in forest ecosystems is stored in the forest floor and in soils down to 1 m depth [1,2]. De Vos et al. (2015) estimated that forests in the European Union store ~3.7 Gt C in forest floors and ~22 Gt C in soils down to 1 m depth [3]. In general, soil organic carbon (SOC) stock reflects the equilibrium between inputs of organic matter produced mainly by overstory trees and understory vegetation to soils and the loss of C through decomposition, biotic respiration, leaching and erosion of soil organic matter [2]. As SOC stored and cycled in forests is a considerable share of the global C stock [1,4], even negligible changes in the SOC stock induced, for instance, by land management or climate change could have large impacts on the atmospheric carbon dioxide (CO2) concentration and thereby accelerate global warming [5,6,7].
Although organic soils, especially in drained areas, are large sources of greenhouse gas (GHG) emissions in forest land of many European countries [8], forests are expected to increase CO2 removals and to decrease GHG emissions [3,4,9] to achieve implementation of the climate change mitigation goals, such as those set by the Paris Agreement [10] and formulated in long-term low GHG emission development strategies of the European Union (Resolution on the European Green Deal) [11] and its member states (including the Strategy of Latvia for the Achievement of Climate Neutrality by 2050 [12]). Therefore, international and national policymakers developing policy targets to limit GHG concentrations in the atmosphere, experts and institutions performing National GHG inventories, as well as policy implementers and forest managers require accurate data of past and current SOC stocks in forest soils and more knowledge to predict the potential future role of forest in GHG emissions and CO2 sequestration [1,9,13]. A detailed review of the literature of the influence of forest management activities on SOC stocks and the key drivers and indicators for soil C stocks can be found in Mayer et al. (2020) and Wiesmeier et al. (2019), respectively [2,14].
The soil cover of the Baltic States is characterised by high diversity due to the varied composition of geological deposits and parent materials, diverse water conditions, and a comparatively large share of organic soils [15,16]. In Latvia, soils developed and evolved during the Holocene after the deglaciation of the territory are thus relatively young [16,17]. Forests are situated on soils formed on varying, mostly unconsolidated Quaternary deposits, and in some places on weakly consolidated pre-Quaternary terrigenous or hard carbonate sedimentary rocks [18]. Within the National GHG Inventory, the total reported forest area in Latvia (including afforested lands) was 3243.60 kha (50.2% of the total country area) in 2019 [19]. The distribution of organic soils in forest land is quantified based on the distribution of forest site types (data provided by the national forest inventory (NFI)) according to the national forest site type classification system [20], in addition to other ecosystem attributes, forest site typologies integrate soil types (organic or mineral) and soil moisture conditions (naturally dry, naturally wet or drained). Four forest site types with wet organic soils (upper organic soil or peat layers exceeding 30 cm thickness) and four forest site types with drained organic soils (upper organic soil or peat layers exceeding 20 cm thickness) are distinguished in Latvia [21], differing from one another in their distribution, structure, properties and the ways that they are used and managed. Forest site types with organic soil are linked to Histosols due to similar determination criteria [18], although the Intergovernmental Panel on Climate Change (IPCC) definition of organic soils [22] covers a much wider range of soils than the Histosols group [23].
In Latvia, drained organic soils in forest land (384.76 kha in 2019) are considered a key source of GHG emissions in the Land Use, Land Use Change, and Forestry (LULUCF) sector [19]. As Latvian forest typology is based on a combination of different ecosystem attributes and soil characteristics that may vary significantly within the boundaries of one compartment, the use of the distribution of forest site types to evaluate the area of organic soils in forest land in Latvia may introduce some error into the assessment of total GHG emissions from drained organic soils. The growing need to make recommendations for climate change mitigation measures in the LULUCF sector requires highly accurate evaluation of the SOC stock in forests and characterisation of the distribution of organic soils across different forest site types. This paper aims to describe the thickness of organic soil layers (O and H horizons) in all forest site types (both with mineral and organic soils) and to evaluate SOC stock in Latvian forests classified as land with organic soil to overall improve the National GHG Inventory.

2. Materials and Methods

2.1. Study Area

Our study was conducted in hemiboreal forests in Latvia. The hemiboreal zone is a transitional zone between the boreal and temperate forest of nemoral Europe, characterised by the coexistence of boreal coniferous species on poor soils and temperate broadleaved tree species on the most fertile soils [24]. According to data from the Latvian Environment, Geology and Meteorology Centre, the average annual air temperatures in the territory range from +5.2~+ 5.3 °C in the Alūksne and Vidzeme highlands to +6.8~+ 7.4 °C on the Baltic Sea coast. The warmest month of the year is July, with an average air temperature of +17.4 °C and an average maximum of +22.3 °C. February is the coldest month of the year, with an average air temperature of −3.7 °C and an average minimum air temperature of −6.6 °C. The annual precipitation in Latvia is 692 mm. The months with the highest precipitation are August and July, with averages of 77 and 76 mm, while the driest is April with an average of 34 mm.

2.2. Measurements of Soil Organic Layer Thickness in Forest Land

Soil organic layers were stratified into forest floor and peat layers (O and H horizons, respectively) according to the World Reference Base for Soil Resources (WRB) [25]. O horizon was defined as horizon dominated by organic material consisting of undecomposed or partially decomposed litter, such as leaves, needles, twigs, moss, and lichens, which has accumulated on the surface; it may be on top of either mineral or organic soils [25]. H horizon was defined as horizon dominated by organic material, formed from accumulations of undecomposed or partially decomposed organic material at the soil surface which may be under water; it may be on top of mineral soils or at any depth beneath the surface if it is buried [25].
The thicknesses of the O and H horizons were measured for 4599 NFI plots (Table 1) in forest land, evenly covering the whole country area in 2017–2019 (within the third cycle of the NFI). The thicknesses of the O and H horizons were measured at 4 points outside the plots: the measuring points were located approximately 1 m from the edge of the plot on the N, E, S, and W sides corresponding to azimuth angles of 0°, 90°, 180° and 270°. Measurements were made using a probe with a length of 70 cm. The thicknesses of the O and H horizons were measured using an undisturbed soil sample and ruler (accuracy 0.1 cm).

2.3. Soil Sampling and Analyses

For physico-chemical analyses, soil was sampled in 174 sample plots located in forest land with organic soil according to the national forest site type classification system [20] simultaneously meeting the organic soil criteria set by definition of IPCC [22]. O horizons were sampled separately using a square probe with an area of 100 cm2. Fixed-depth sampling was applied to H horizon and mineral soil layers underlying the peat layer. Two replicates at 0–10 cm, 10–20 cm, 20–30 cm, 30–40 cm, 40–50 cm and 50–100 cm depth were taken using undisturbed soil sample probes (100 cm³ volume steel cylinders) [26]. The 0 cm reference is at the top of the peat layer (H horizon) [26]. Soil sampling was carried out in 2012–2019.
Soil samples were prepared and analysed in the Laboratory of Forest Environment at the Latvian State Forest Research Institute ‘Silava’ following the reference methods outlined in Part X of the ICP Forests Manual on Sampling and Analysis of Soil [26]. The soil samples were prepared for analysis according to the LVS ISO 11464:2006 standard [27]. The following physico-chemical parameters were determined in the soil samples: soil bulk density (BD, kg m−3) according to LVS ISO 11272:2017 [28], coarse fragments and fine earth fraction of soil (diameter (D) < 2 mm) according to LVS ISO 11277:2020 [29], total carbon (TC) concentration using elementary analysis (dry combustion) according to LVS ISO 10694:2006 [30], and carbonate concentration using an Eijkelkamp calcimeter according to ISO 10693:1995 [31]. The OC concentration (g kg−1) in soil was calculated as the difference between TC concentration and inorganic carbon (carbonate) concentration. For chemical analyses, the fine earth fraction of soil (D < 2 mm) was used.

2.4. Soil Organic Carbon Stock Calculation

To compute the SOC stock in each individual organic soil layer down to 1 m depth (SOCLAY, t C ha−1), equation No. 1 was applied [3]:
SOCLAY = (OC × BD × THICKNESS × (1 − (Pcf/100)))/ucf,
where OC is the OC concentration in the fine earth of the layer, g kg−1; BD is the soil bulk density, kg m−3; THICKNESS is the layer thickness, cm; Pcf is the proportion of coarse fragments, %; and ucf is a unit correction factor of 10,000. The SOC stock below 1 m depth was not estimated.
To estimate SOC stock in forest land with organic soils at the national level, data on the distribution of forest site types in Latvia provided by NFI [32] were used.

2.5. Statistical Analysis

Data on soil organic layer thickness and SOC stock is pooled in groups according to forest site types, which integrate within themselves soil type (organic or mineral) and soil moisture conditions (naturally dry, naturally wet or drained) according to the national forest site type classification system [20]. Pairwise t-tests (pairwise comparisons using t-tests with pooled standard deviations (SD)) were used to evaluate differences in the thickness of soil organic layers and SOC stock between individual forest site types and pooled groups of forest site types according to soil types and moisture conditions. Correlations between the thickness of soil organic layers and stand characteristics were tested with Pearson’s r. Both pairwise t-tests and Pearson’s r were conducted using a significance level of p < 0.05. All statistical analyses were carried out using R [33].

3. Results

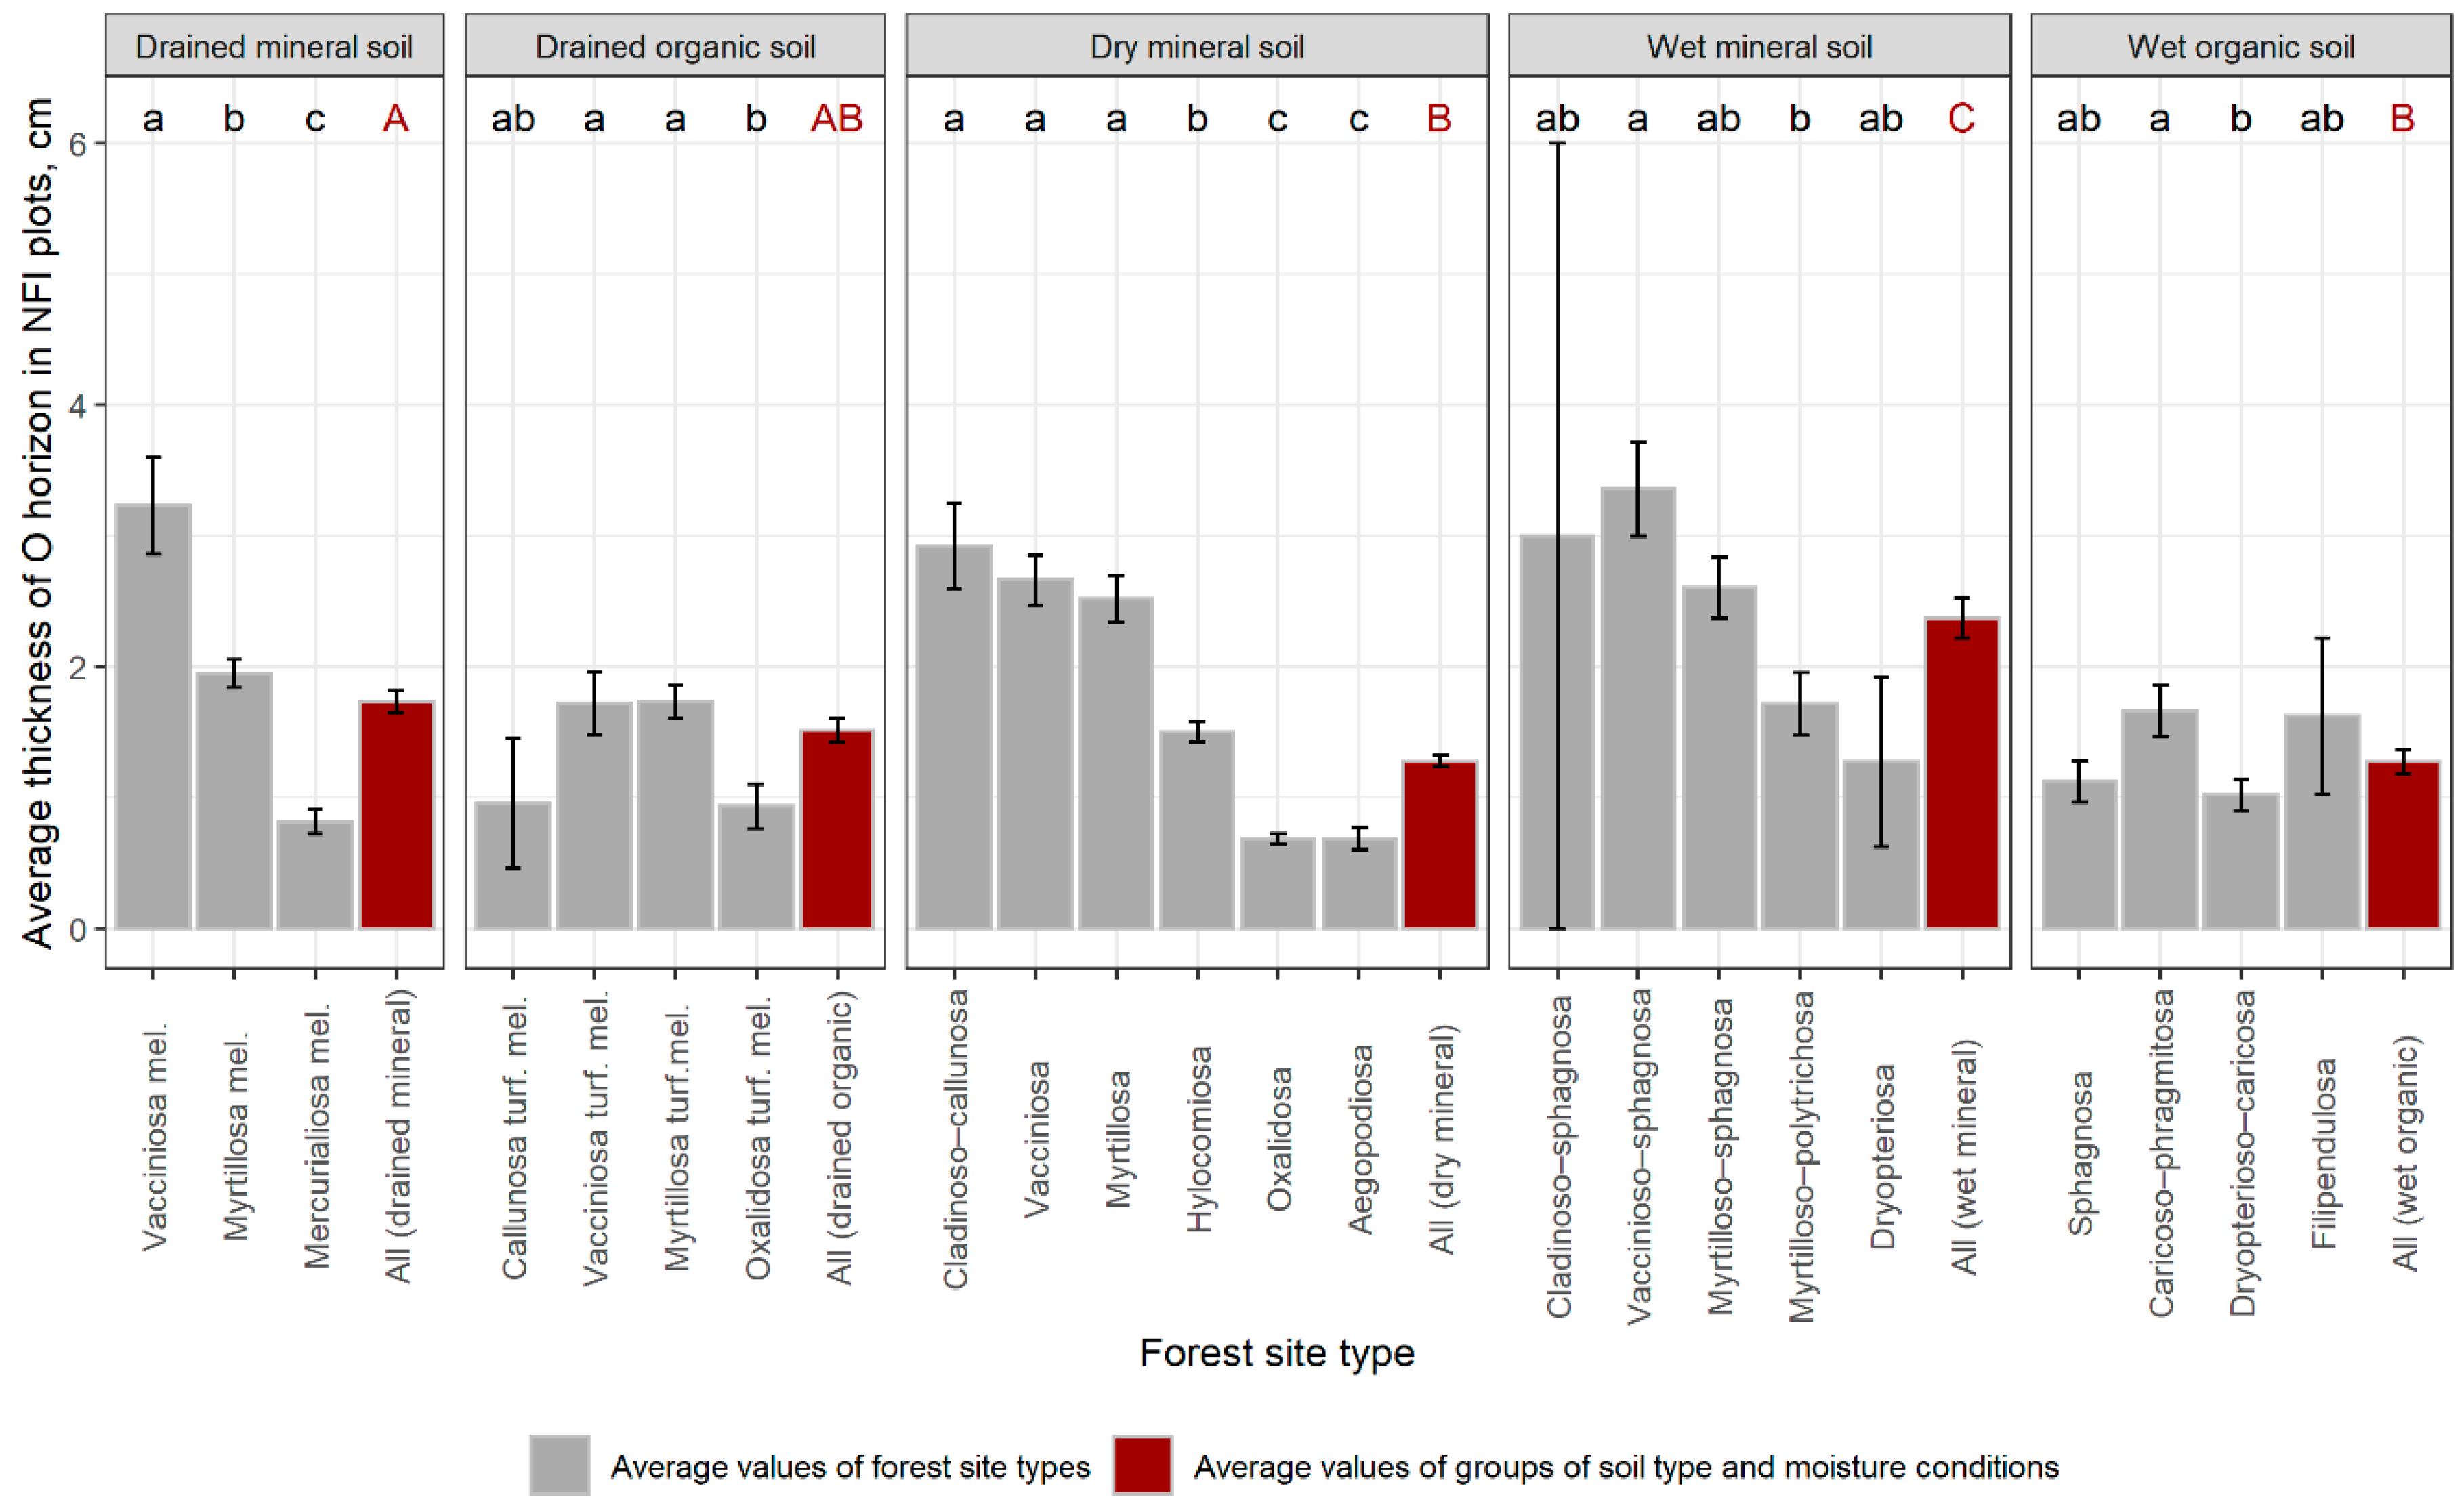
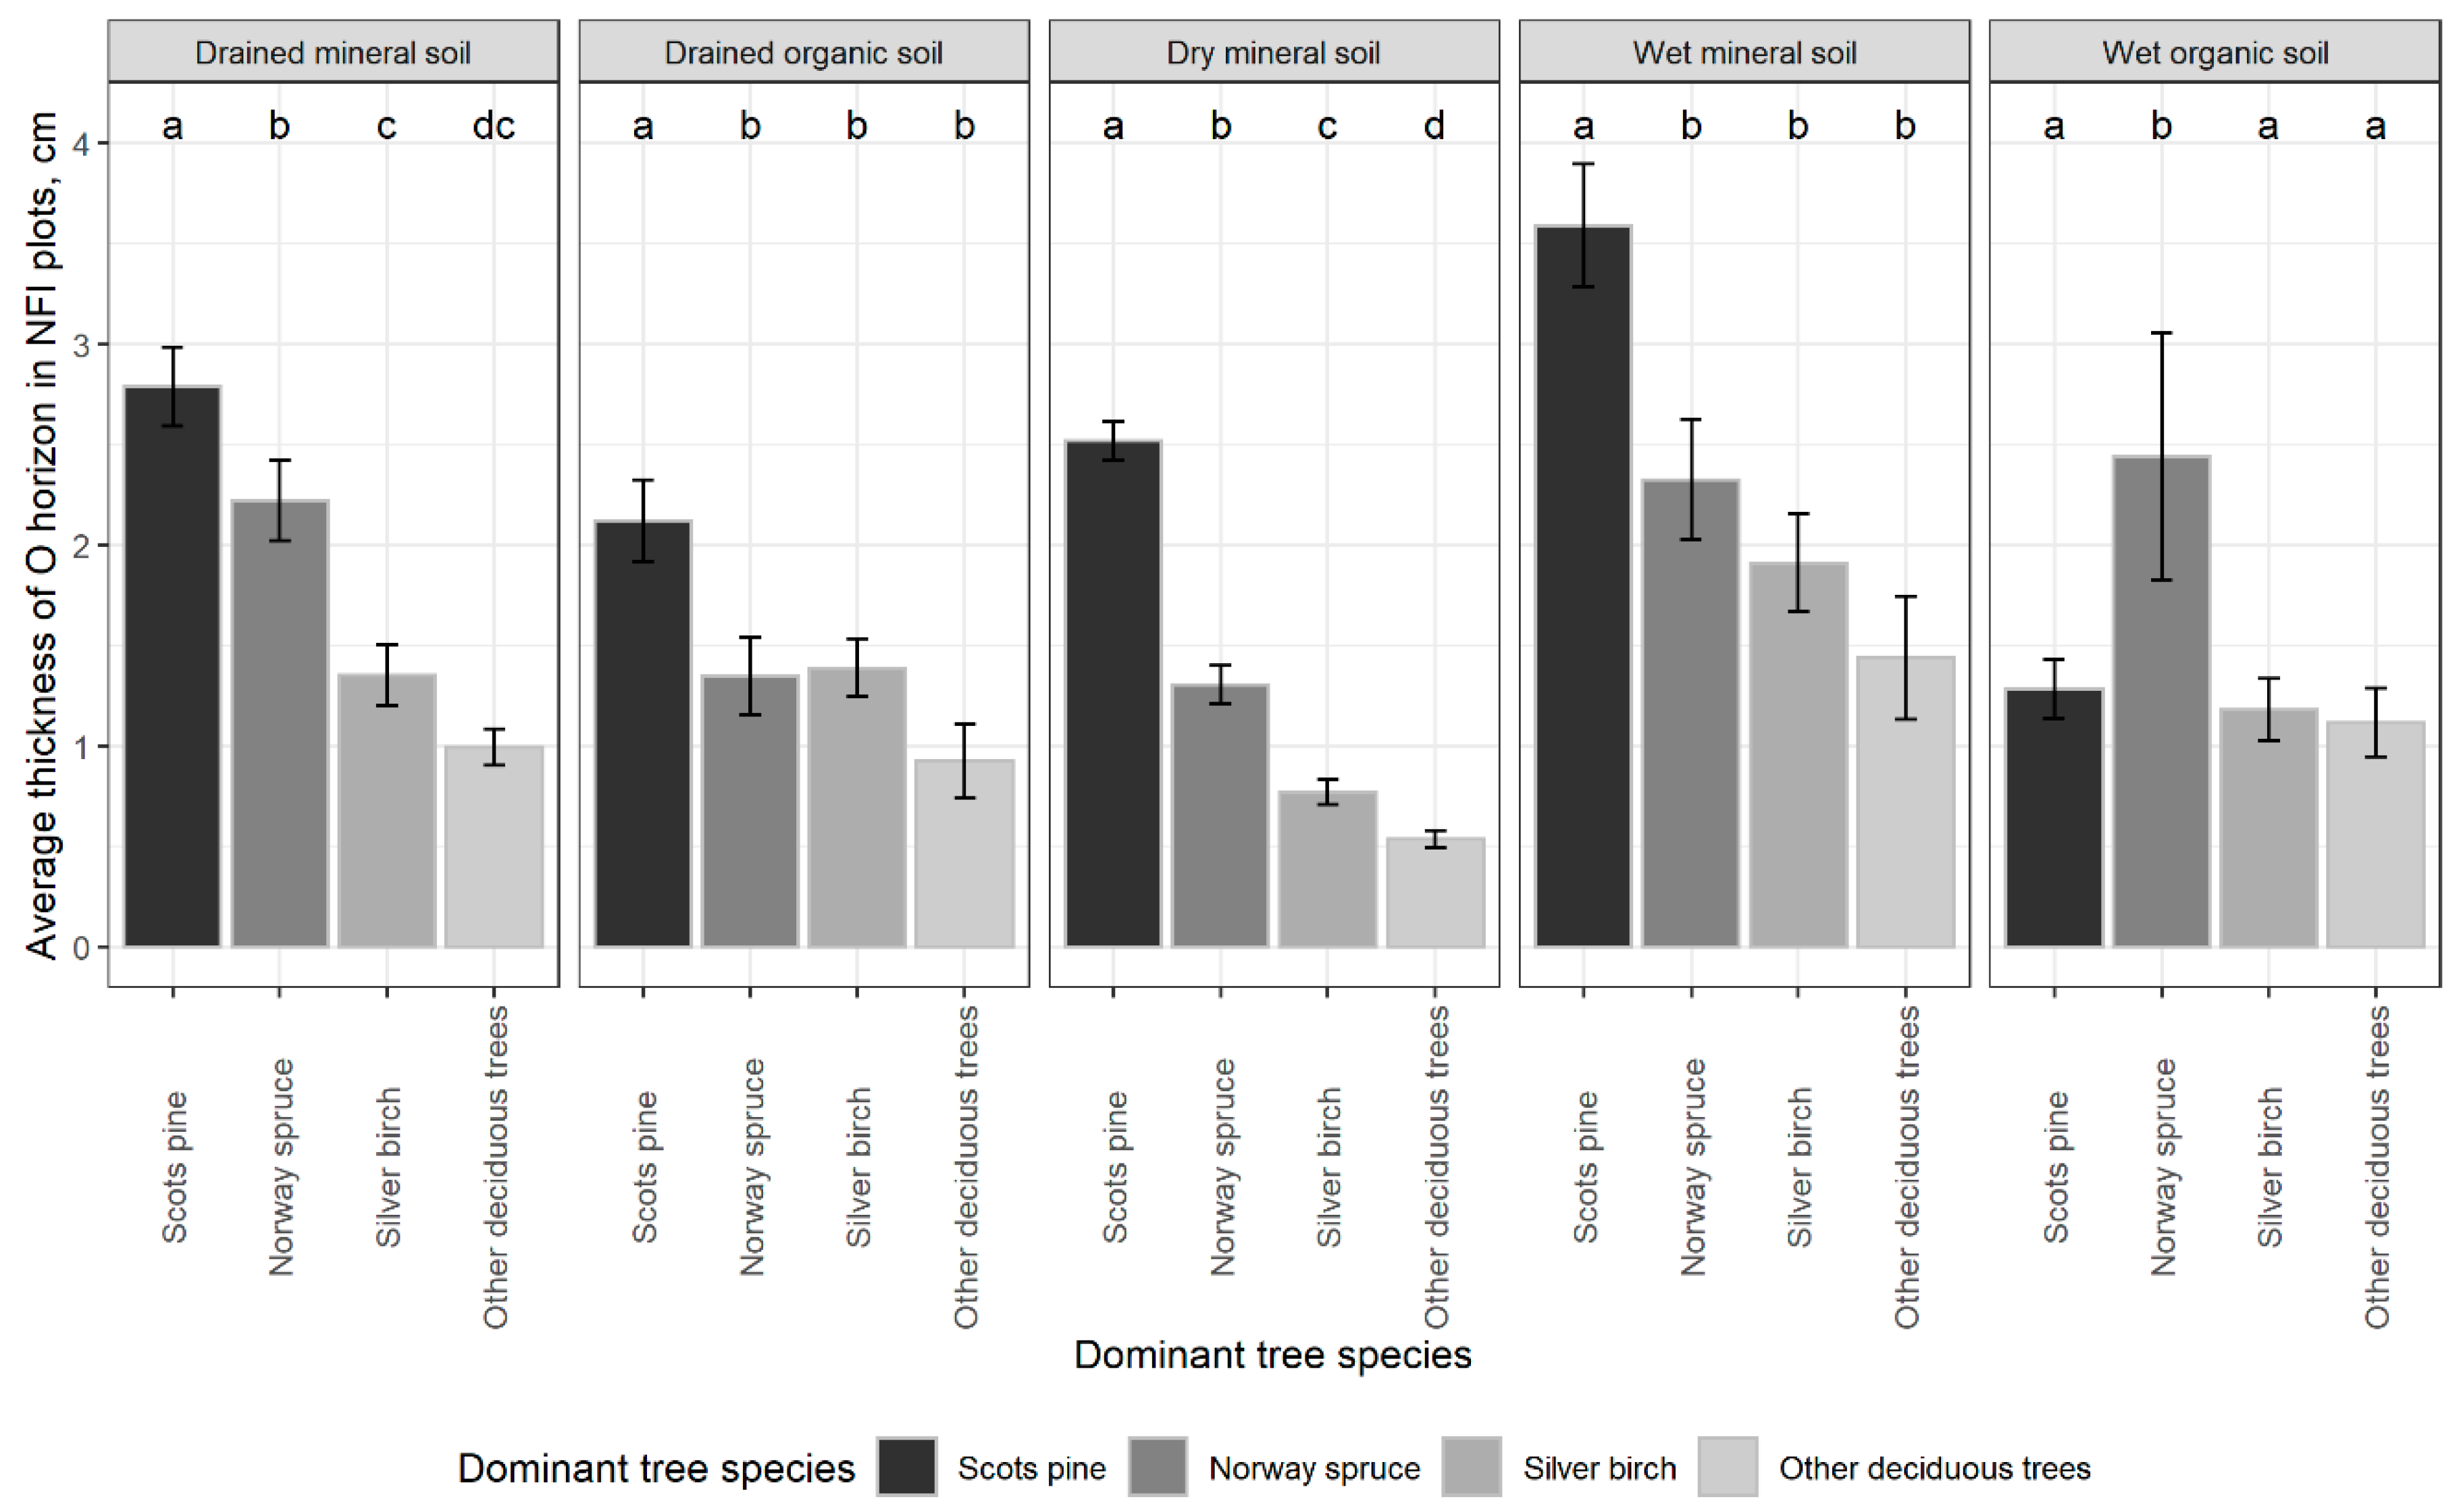
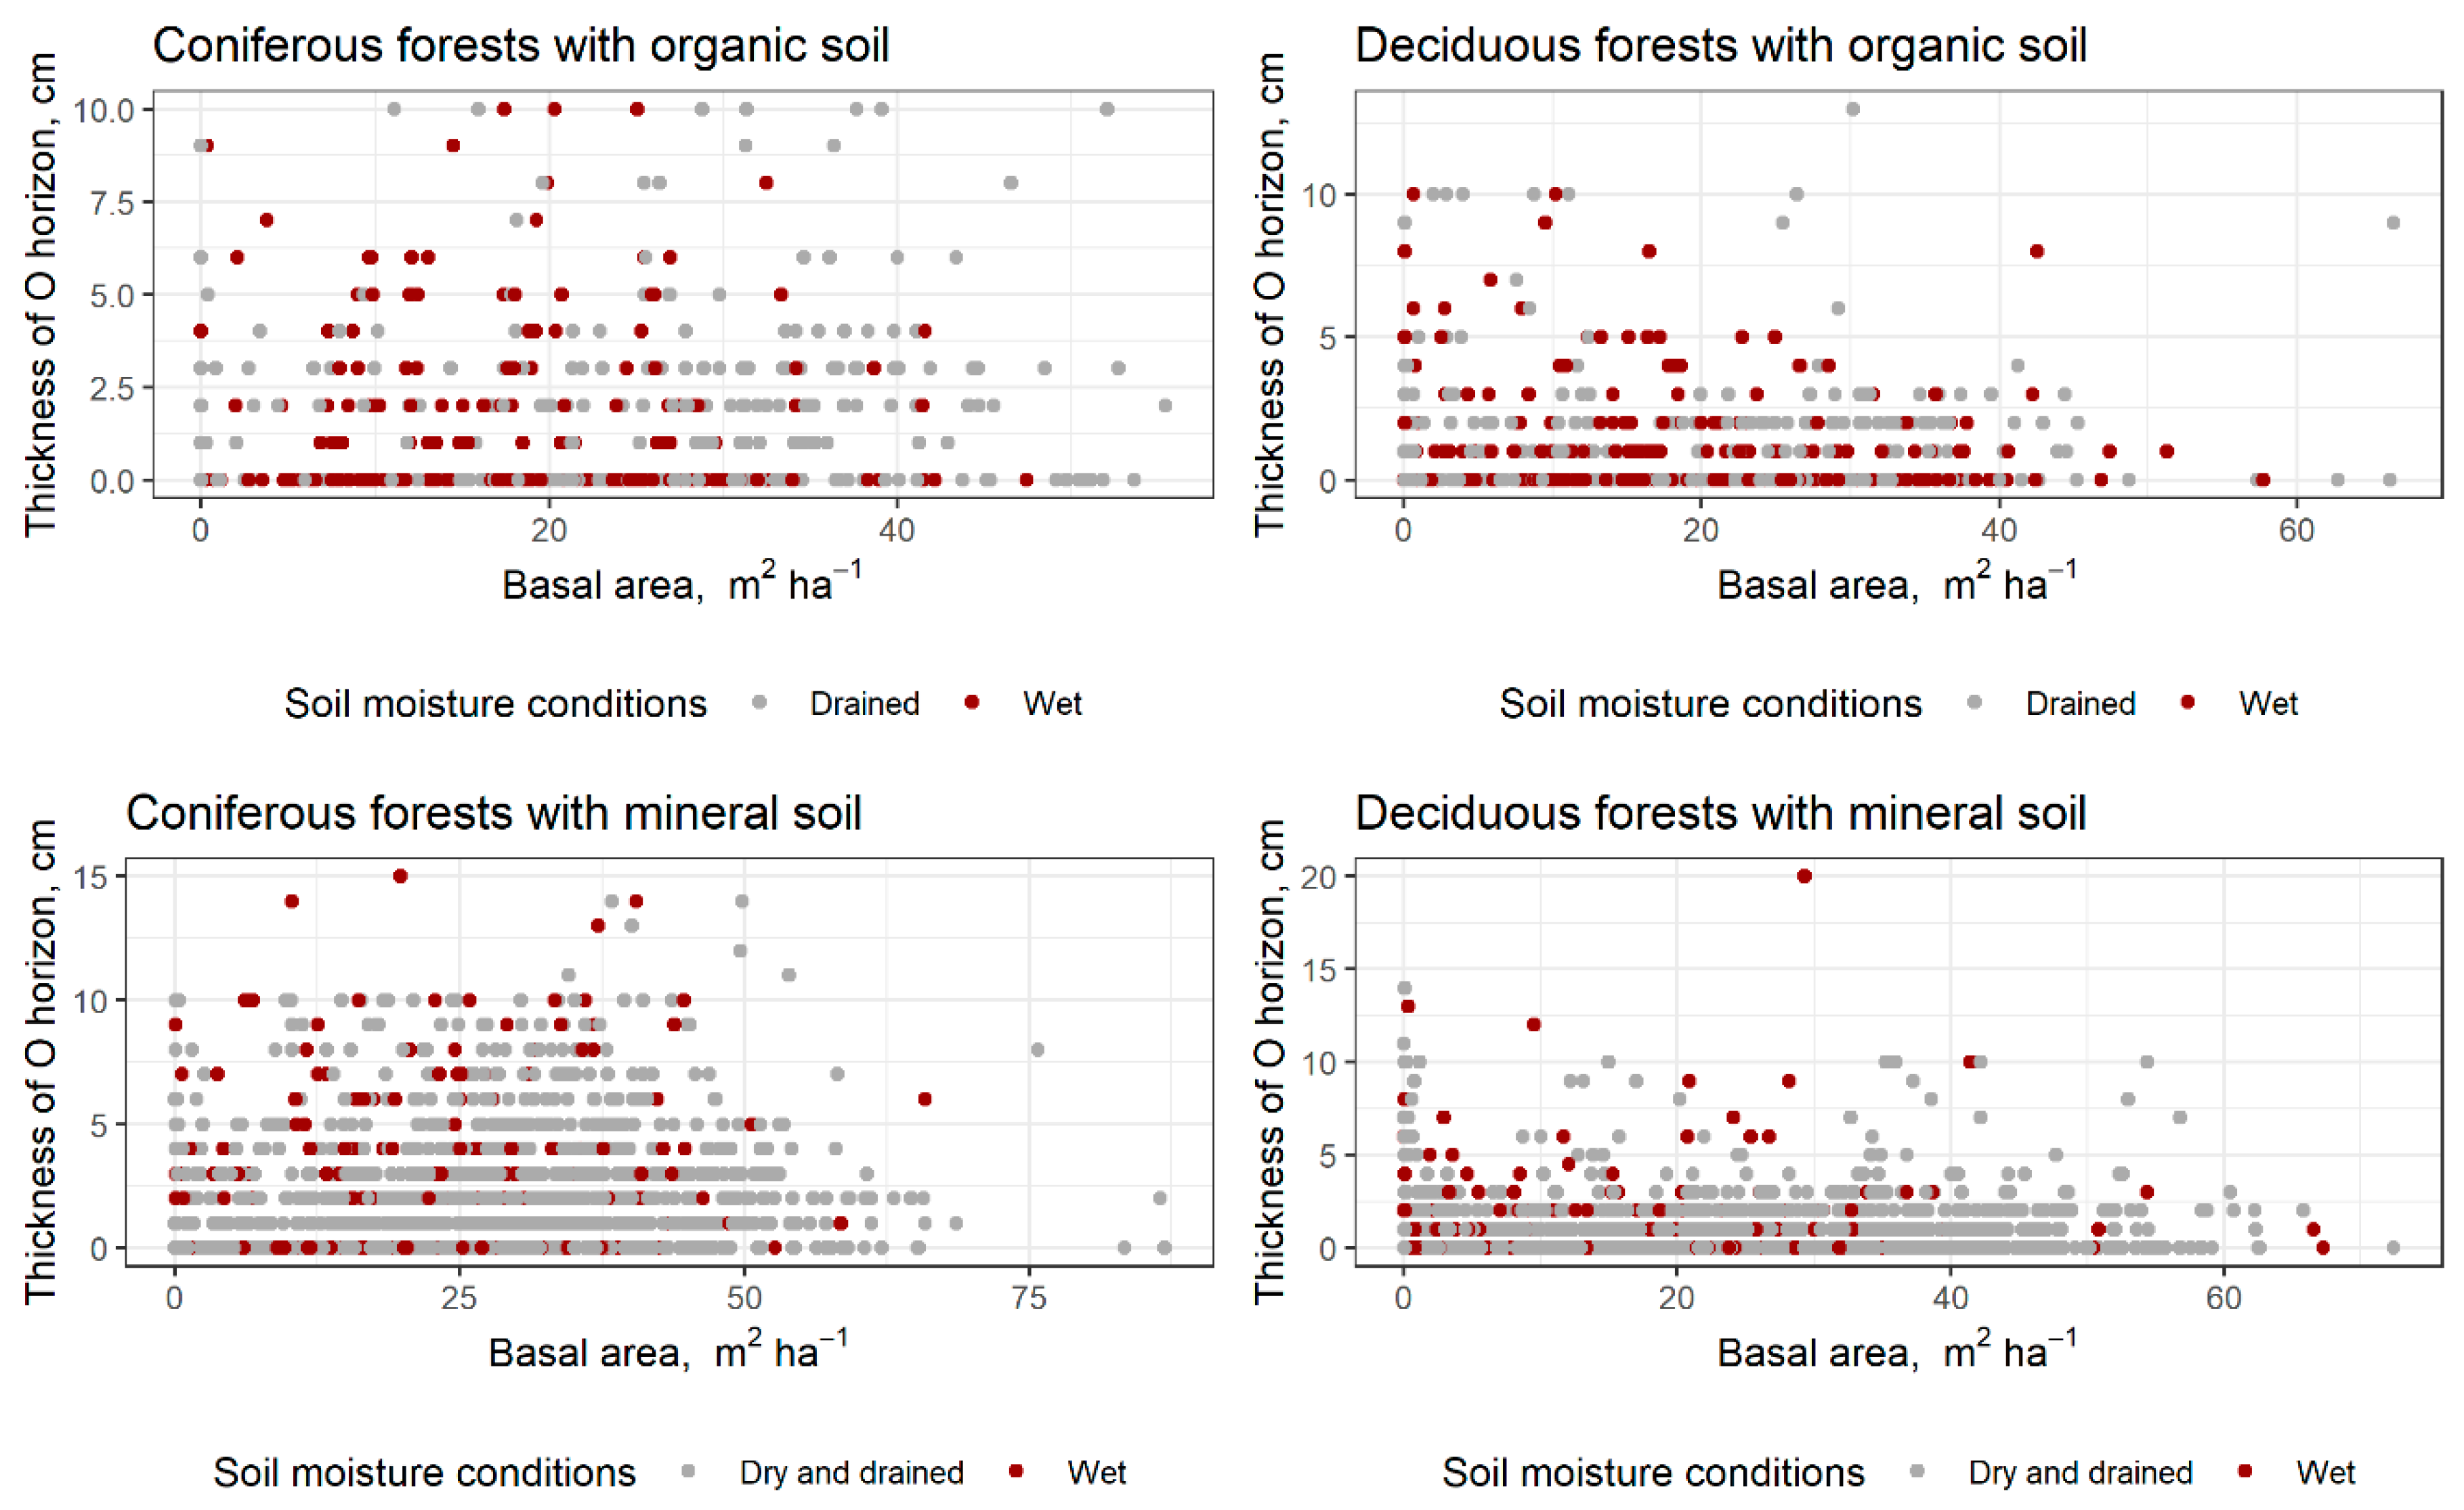
3.1. Thickness of Organic Soil Layers in Forest Land

NFI data shows that the thickness of the O horizon in forest land in Latvia ranged up to 20 cm (detected in Myrtilloso–polytrichosa stands dominated by black alder (Alnus glutinosa (L.) Gaertn.)). When differences between each individual forest site type (Figure 1) were compared, the highest average thickness of the O horizon was found in Vaccinioso–sphagnosa stands (3.4 ± 0.4 cm). When differences in the O horizon thickness between average values of groups of soil types and moisture conditions were compared, the highest average thickness of the O horizon (2.4 ± 0.2 cm) occurred in forests with wet mineral soil. Furthermore, the average thickness of the O horizon in forests with wet mineral soil was statistically significantly higher than in other groups of soil types and moisture conditions (p < 0.001). In forest land with mineral soil, the average thickness of the O horizon varies with soil fertility: the average thickness of the O horizon decreases with increasing soil fertility. Such a trend is not observed in forest land with organic soils.
Figure 2 shows the average thickness of the O horizon in forest land in Latvia by dominant tree species. In forest land with mineral soil, the highest average thickness of the O horizon was detected in stands dominated by Scots pine (Pinus sylvestris L.) (2.7 ± 0.1 cm) followed by stands dominated by Norway spruce (Picea abies (L.) H.Karst.) (1.7 ± 0.1 cm). Furthermore, in forest land with mineral soil, the average thickness of the O horizon in stands dominated by Scots pine was statistically significantly higher than in stands with other dominant tree species (p < 0.001). In forest land with drained organic soil, the highest average thickness of the O horizon (2.1 ± 0.2 cm) was detected in stands dominated by Scots pine (p < 0.022) as well, but in forest land with wet organic soil, the highest average thickness of the O horizon (2.4 ± 0.6 cm) was detected in stands dominated by Norway spruce, furthermore, statistically significant difference between this and other dominant tree species (p < 0.030) was found.
No significant correlations were found between the thickness of the O horizon and forest stand characteristics such as basal area, standing volume, site index or age of the dominant tree species (Figure 3).
Figure 4 shows the proportion of the H horizon in the top 70 cm soil layer in forest land in Latvia by forest site type. As expected, a higher proportion of the H horizon in the top 70 cm was detected in land classified as forest land with organic soil (p < 0.001). If differences between individual forest site types are compared, the highest average proportion of the H horizon in the top 70 cm soil layer was detected in Callunosa turf. mel. stands characterised by drained organic soil (90 ± 6% of the top 70 cm soil layer). However, in general, a higher average proportion of the H horizon in the top 70 cm soil layer was detected in forests with wet organic soils (67 ± 2% of the top 70 cm) if compared with forests with drained organic soils (54 ± 2% of the top 70 cm). Furthermore, in forest land with organic soil (both in drained and wet conditions), the average proportion of the H horizon in the top 70 cm soil layer decreases with increasing soil fertility.
In forests with mineral soil, a statistically higher average proportion of the H horizon in the top 70 cm soil layer was detected in wet conditions (12 ± 1% of the top 70 cm) compared with forests with drained (4.4 ± 0.4% of the top 70 cm) and dry (2.0 ± 0.2% of the top 70 cm) mineral soils (p < 0.001).
In total, in forest land with mineral soil, the thickness of the H horizon was >20 cm in 3.5% of all NFI plots; relatively higher proportions were detected especially in wet mineral soils where the thickness of the H horizon was >20 cm, making up 12.9% of all NFI plots with wet mineral soils (Figure 5). In forest land with organic soils, as expected, the thickness of the H horizon was >20 cm in most NFI plots; nevertheless, in a relatively high proportion of NFI plots, the thickness of the H horizon was <20 cm (33.9% of all NFI plots with drained organic soils and 25.9% of all NFI plots with wet organic soils). The thickness of the H horizon was >70 cm in 0.6% of all NFI plots classified as plots with mineral soils, in 24.3% of all NFI plots classified as plots with drained organic soils and in 38.0% of all NFI plots classified as plots with wet organic soils (Figure 5).

3.2. Soil Organic Carbon Stock in Forest Land with Organic Soil

In forest land with organic soil with an H horizon > 20 cm, the average OC concentration in the O horizon (Table S1) ranged between 490.6 g kg−1 (Dryopterioso–caricosa) and 554.9 g kg−1 (Vacciniosa turf. mel.). In the 0–20 cm soil layer, the average OC concentration variation was wider and ranged from 415.2 g kg−1 (Oxalidosa turf. mel., 10–20 cm soil layer) to 539.7 g kg−1 (Vacciniosa turf. mel., 10–20 cm soil layer). The average mass of the O horizon per area unit (Table S2) ranged from 12.7 g 100 cm−2 (Filipendulosa) to 45.0 g 100 cm−2 (Sphagnosa), but the average soil bulk density in the 0–20 cm soil layer ranged from 77.1 kg m−3 (Sphagnosa, 0–10 cm soil layer) to 302.5 kg m−3 (Oxalidosa turf. mel., 10–20 cm soil layer).
Figure 6 shows the SOC stock per area unit in the O horizon, in the 0–30 cm layer, and in the 0–100 cm layer in forest land with organic soils (H horizon > 20 cm) in Latvia by forest site types. In the O horizon in forest land with wet organic soils, the forest site type average SOC stock ranged up to 23.9 ± 0.7 t C ha−1 in Sphagnosa stands (which had the lowest soil fertility in the group of wet organic soils). The weighted average SOC stock in the O horizon, which takes into account the distribution of forest site types in Latvia according to the NFI data, was 17.7 ± 2.3 t C ha−1. In forest land with drained organic soil, forest site type average SOC stock varied up to 19.8 ± 2.8 t C ha−1 in Myrtillosa turf. mel. stands, while the weighted average SOC stock in the O horizon, considering the distribution of forest site types, was 17.4 ± 1.1 t C ha−1.
In the 0–30 cm layer, the forest site type average SOC stock ranged up to 319.7 ± 21.9 t C ha−1 (in Filipendulosa stands), while the weighted average SOC stock in the 0–30 cm layer that considers the distribution of forest site types in Latvia according to the NFI data was 256.0 ± 7.8 t C ha−1 in drained organic soils and 189.3 ± 9.3 t C ha−1 in wet organic soils. Forest site type average SOC stock in the top 100 cm ranged up to 642.1 ± 91.3 t C ha−1 (also in Filipendulosa stands), and the weighted average SOC stock in the 0–100 cm layer was 546.5 ± 22.3 t C ha−1 in drained organic soils and 371.3 ± 20.9 t C ha−1 in wet organic soils.
Both in the 0–30 cm soil layer and in the 0–100 cm soil layer, a statistically significantly higher average SOC carbon stock per area unit was found in drained organic soils if compared with forests with wet organic soils (p < 0.001). Furthermore, both in the 0–30 cm soil layer and in the 0–100 cm soil layer, average SOC stock increases significantly with increasing soil fertility, especially in forest land with wet organic soil (Figure 6).
Within the 0–100 cm layer, vertical SOC distribution showed that ~50% (ranging from 42 to 57%) of soil OC was stored in the upper 30 cm of the soil. The national-level assessment of SOC carbon stock in forest land with organic soils is summarised in Table 2.

4. Discussion

Sequestration and storage of C in organic soil layers in forest land is currently discussed for many reasons, but recently the main emphasis has been on the achievement of climate change mitigation targets in the framework of international and national climate neutrality strategies by 2050.

4.1. Thickness of the O Horizon

The results presented in this study demonstrate that the O horizon thickness in coniferous forests is higher than in deciduous forests, with statistically significant differences were observed in all groups of soil type and moisture conditions except in wet organic soils. In Latvia, silver Birch (Betula pendula Roth; the dominant deciduous tree species in the country) has a slightly higher production rate of litter than coniferous tree species [34]. In the present study, production and decomposition of litter were not directly measured, but the thinner O horizon and lower mass of the O horizon per area unit in deciduous forests indicated faster decomposition of litter in the deciduous stands compared with the spruce and pine stands. Slower decomposition of coniferous litter can be explained by higher lignin content (e.g., [35,36]), although lignin concentrations vary within species (e.g., [37]). The soil moisture condition strongly influences the O horizon thickness. For instance, in forests with mineral soils, a statistically higher O horizon thickness was found in wet soils than in dry and drained soils both for coniferous and deciduous forests. This is related to a lower water table in dry and drained areas leading to an increase in the air-filled porosity of the organic matter layers, which in turn affects microbial processes and thus decomposition rates [38], whereas in wet soils decomposition is anaerobic and generally slow (e.g., [39]). In contrast, in forests with organic soil, a higher O horizon thickness was found in drained soils than in wet soils (although the difference was not statistically significant). This is explained by increased soil fertility after drainage [40] followed by increased tree biomass growth and higher litter production rates in drained soils [41,42] compensating for accelerated organic matter decomposition [38,43,44], as forest floor mass is the difference between litter accumulation (production) and decomposition [45]. The results presented in this study demonstrate that, in forest land with mineral soil, the average thickness of the O horizon decreases with increasing soil fertility. In addition, the differences in thickness and mass of the O horizon between stands in similar conditions can be explained by differences in the chemical composition of litter (soluble substances and labile compounds of litter are rapidly degraded, but cellulose and lignin decompose slowly [46]), root activity [7], bacteria and ectomycorrhizal fungal symbionts (e.g., [47]), microclimate, temperature (e.g., [48]) and presence of earthworms (e.g., [49]). When assessing the potential impact of climate change in the Baltic basin (higher annual average temperature and precipitation), it is hypothesised that changes in climate would result in higher N content in litter (a lower C/N ratio) and lower decomposition, and thus a considerable increase in organic matter accumulation [37].
A relatively large number of studies, both large-scale and regional, have found that the main drivers of forest litter production are climate (temperature and precipitation) and biomass abundance [50,51]. We tested correlations between the O horizon thickness and stand characteristics, but no significant relationships were found, although relationships between the litter production and stand characteristics such as basal area were previously found in hemiboreal regions [34]. This indirectly confirms the importance of decomposition rate on O horizon thickness and mass in forest land.

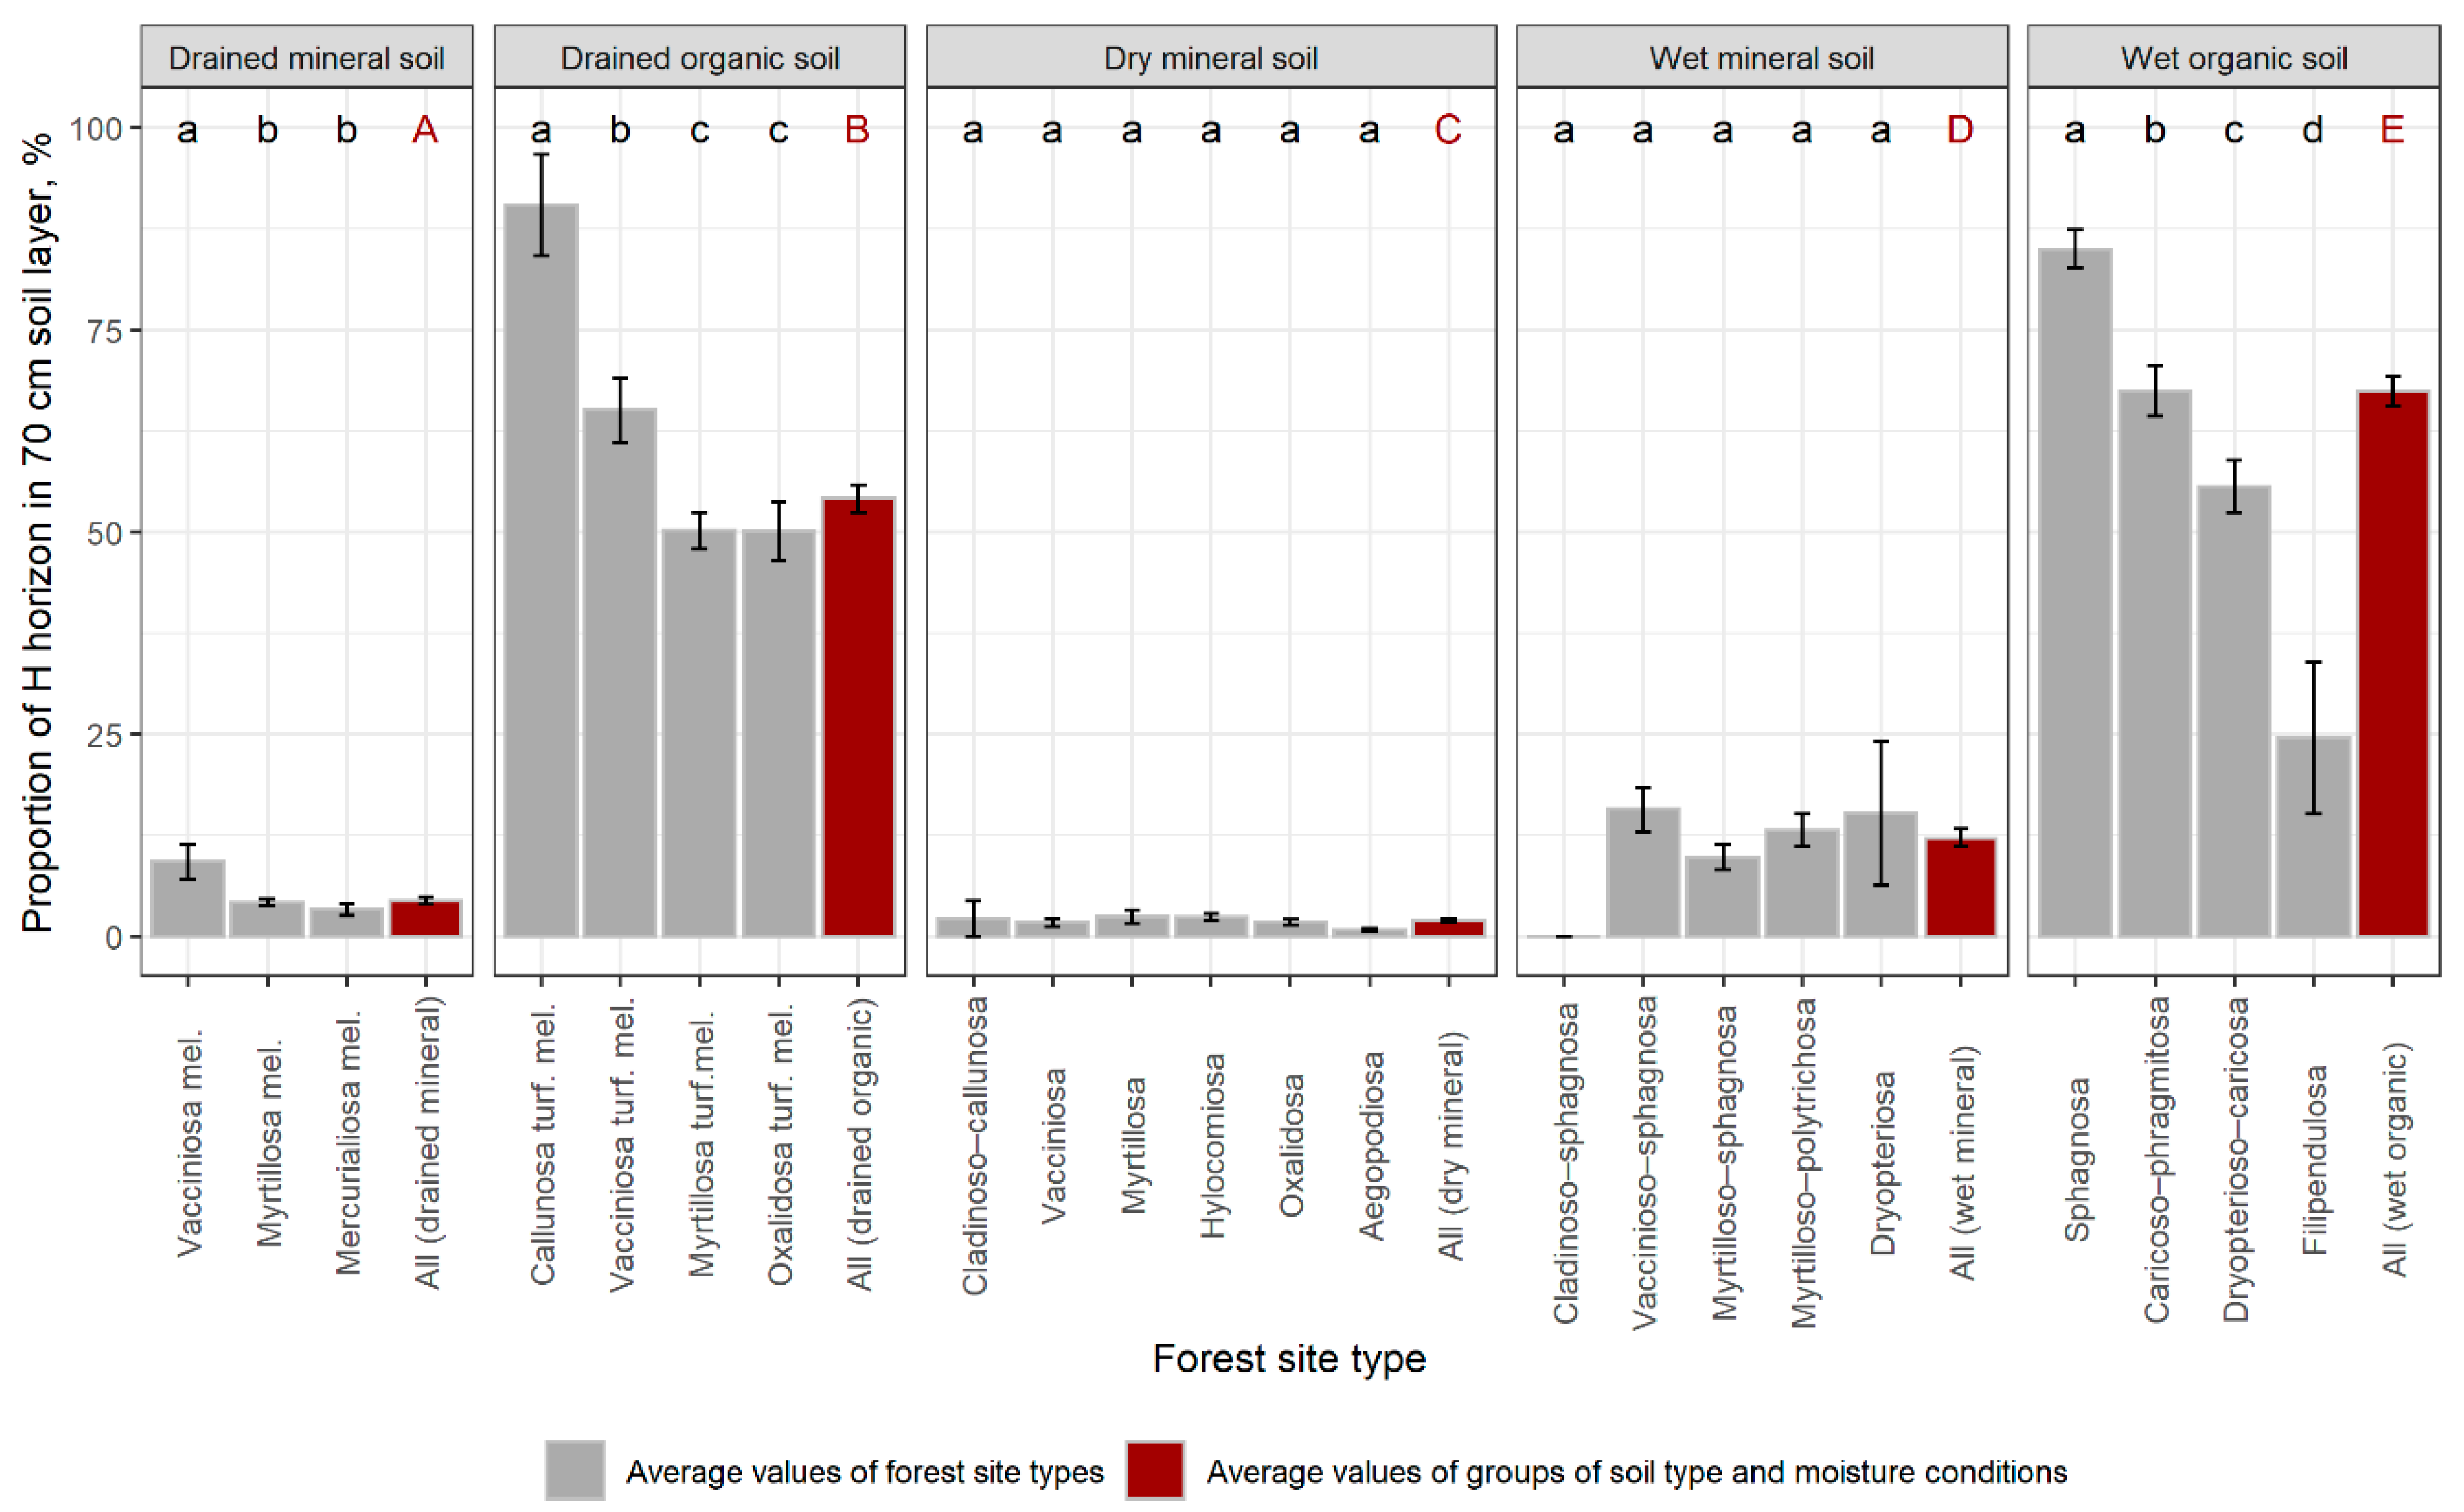
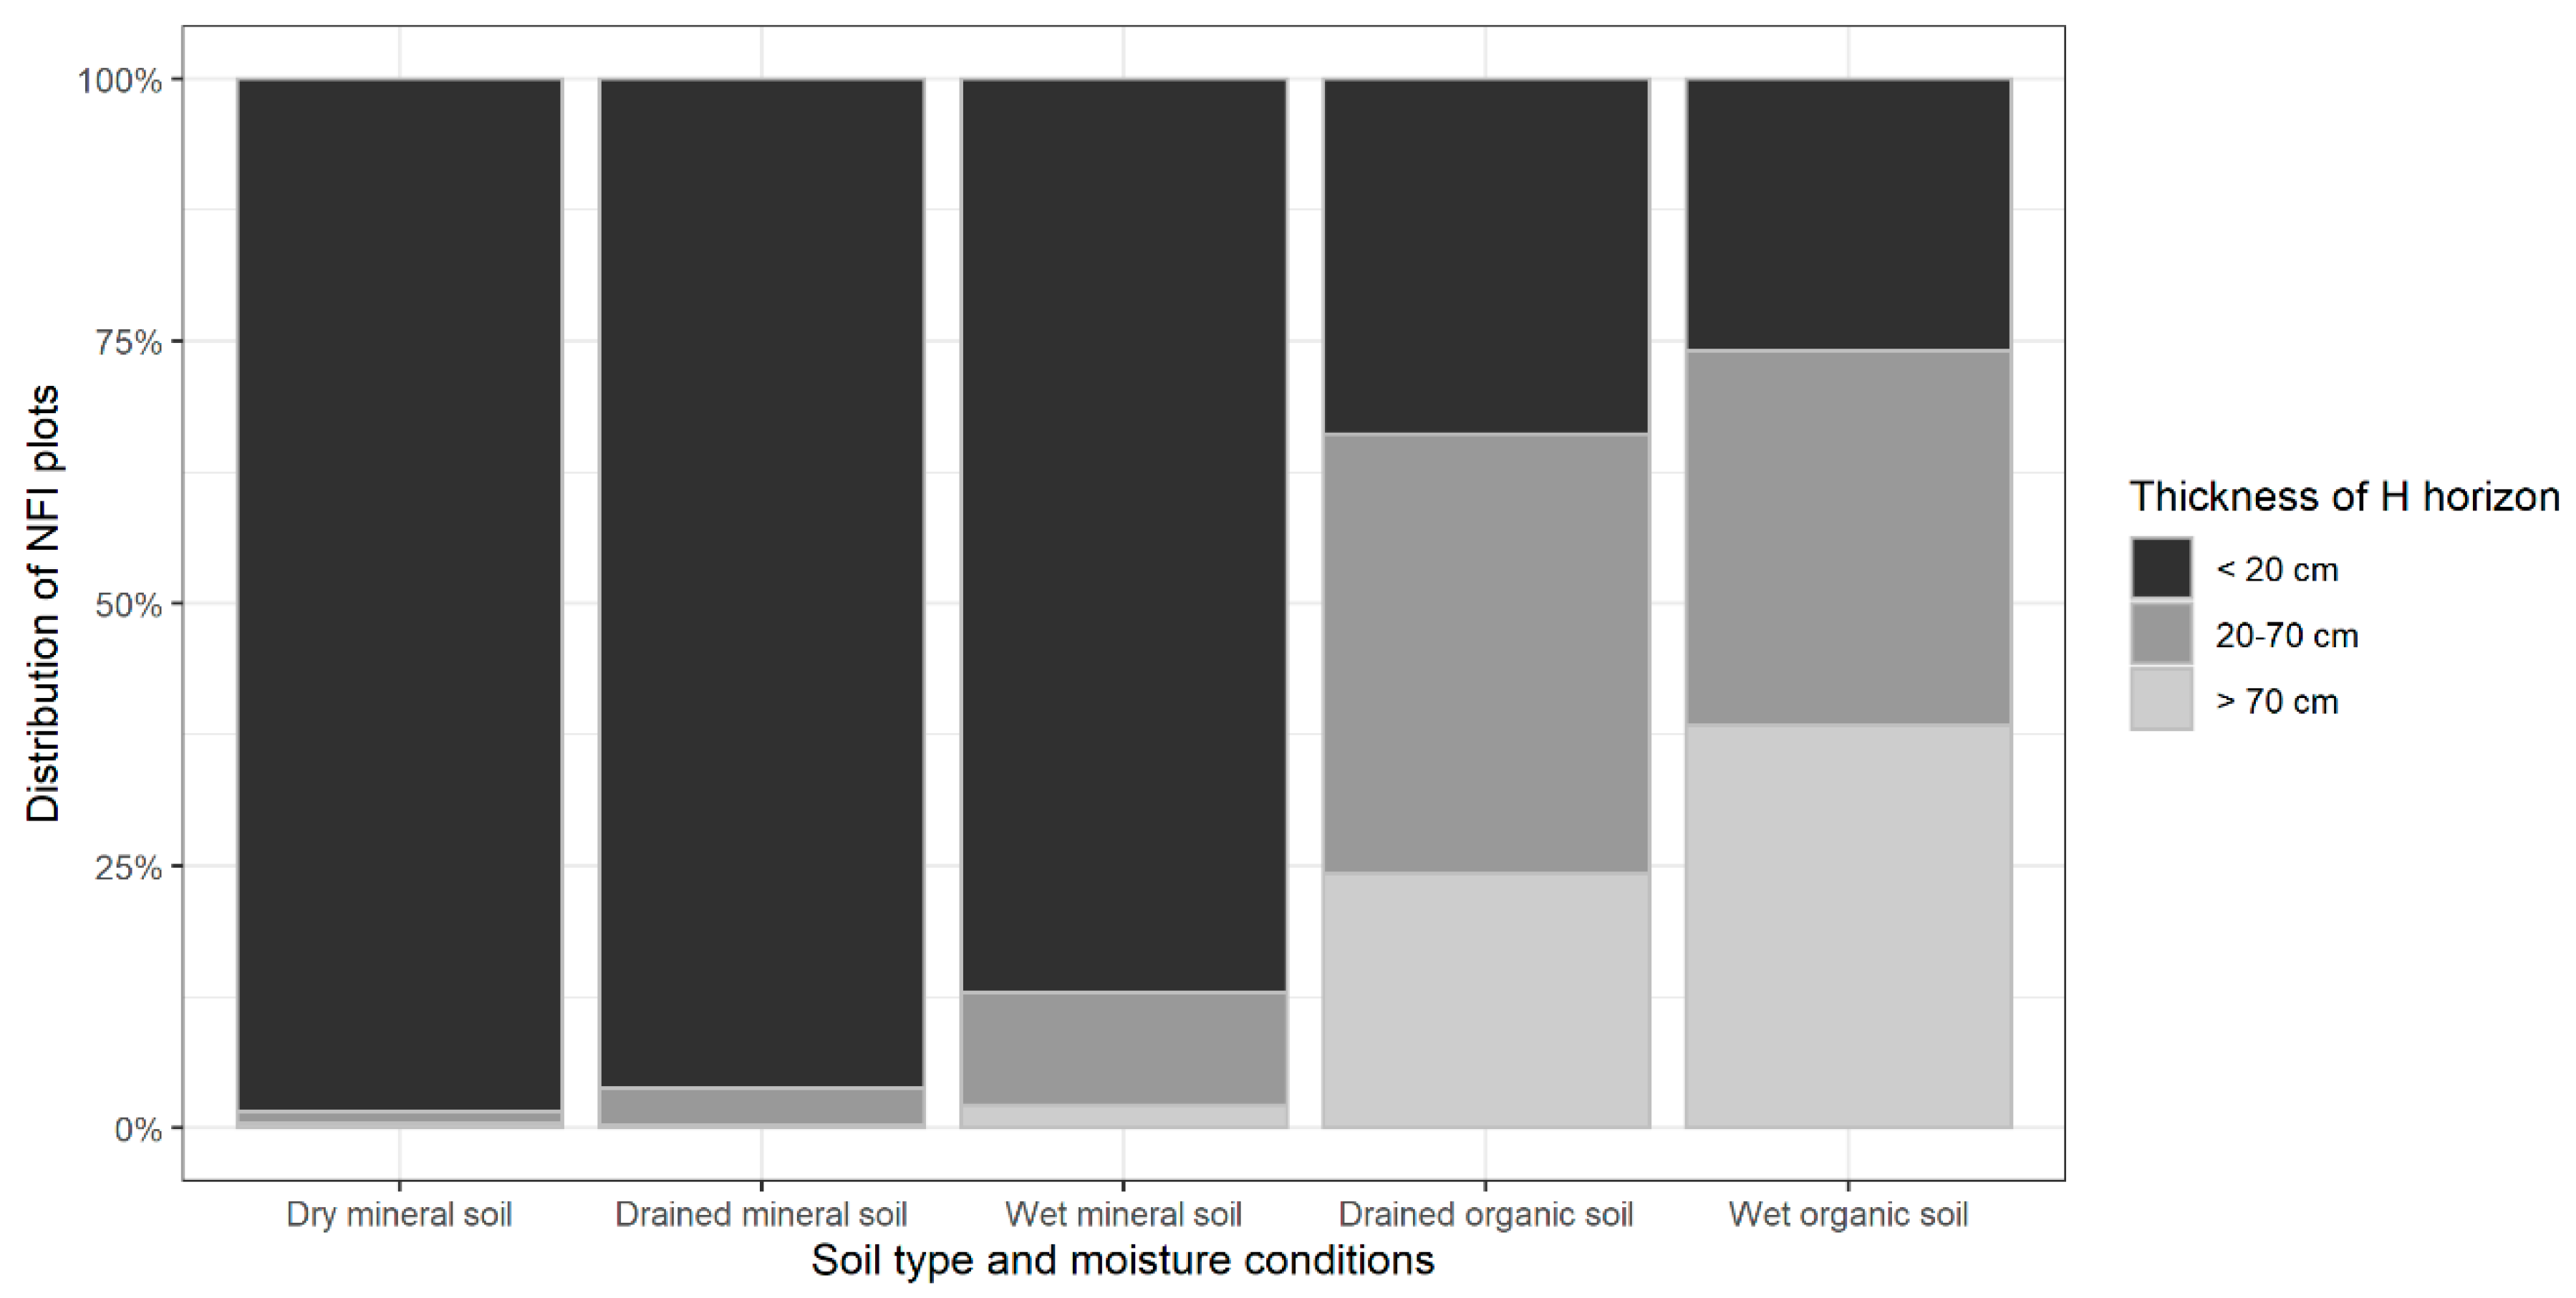
4.2. Thickness of the H Horizon

Although the national forest site type classification system states that forest land is classified as land with organic soils if the organic soil or peat layer is thicker than 30 cm in wet conditions and thicker than 20 cm in drained conditions [20], evaluation of the distribution of the H horizon thickness in NFI plots in forest land revealed that in 30% of forest land classified as land with drained organic soil, the H horizon was thinner than 20 cm, whereas in 4% of forest land classified as land with drained mineral soil, the H horizon was thicker than 20 cm. This is related to the unevenness of organic soil layer thickness in forest land; furthermore, previous forest soil research in Latvia has revealed that spatial distribution correlations do not always exist between forest site types, soil groups and prefix qualifiers according to the international WRB soil classification [18]. In addition, NFI plots are located in a regular grid regardless of major landforms, position and microtopography, and therefore soil at sampling points may not always be representative of the dominant soil type in the area as a whole.
As the specific IPCC definition of organic soils complies neither with the WRB soil classification nor with the Latvia Soil Classification, use of regular soil survey materials, to assess the area of organic soils within the National GHG Inventory, is either not possible or remains complicated [23]. In Latvia, within the National GHG Inventory, emissions from drained organic soils in forest land are estimated using NFI data on the area of drained organic soils based on the distribution of forest site types. In 2019, the total reported area of drained organic soils in forest land remaining forest land was 383.95 kha [19]. Taking into account the distribution of H horizon thicknesses estimated within this study, the corrected area of drained organic soil with an H horizon >20 cm was 274.67 kha in 2019 (less than reported in Latvia’s National GHG Inventory by 28.5%). Within the Latvia’s National GHG Inventory, GHG emissions from drained organic soils in forest land are estimated based on multiplying the area of organic soils by the relevant emission factors. Thus, overestimation of areas of organic soils in forest land could most likely reflect the overestimation of GHG emissions from drained organic soils in forest land in Latvia by approximately 360 kt CO2 eq. (the sum of CO2, CH4 and N2O emissions from soil and CH4 emissions from drainage ditches calculated according to the methodology used in the Latvia’s National GHG Inventory [19]) in 2019.

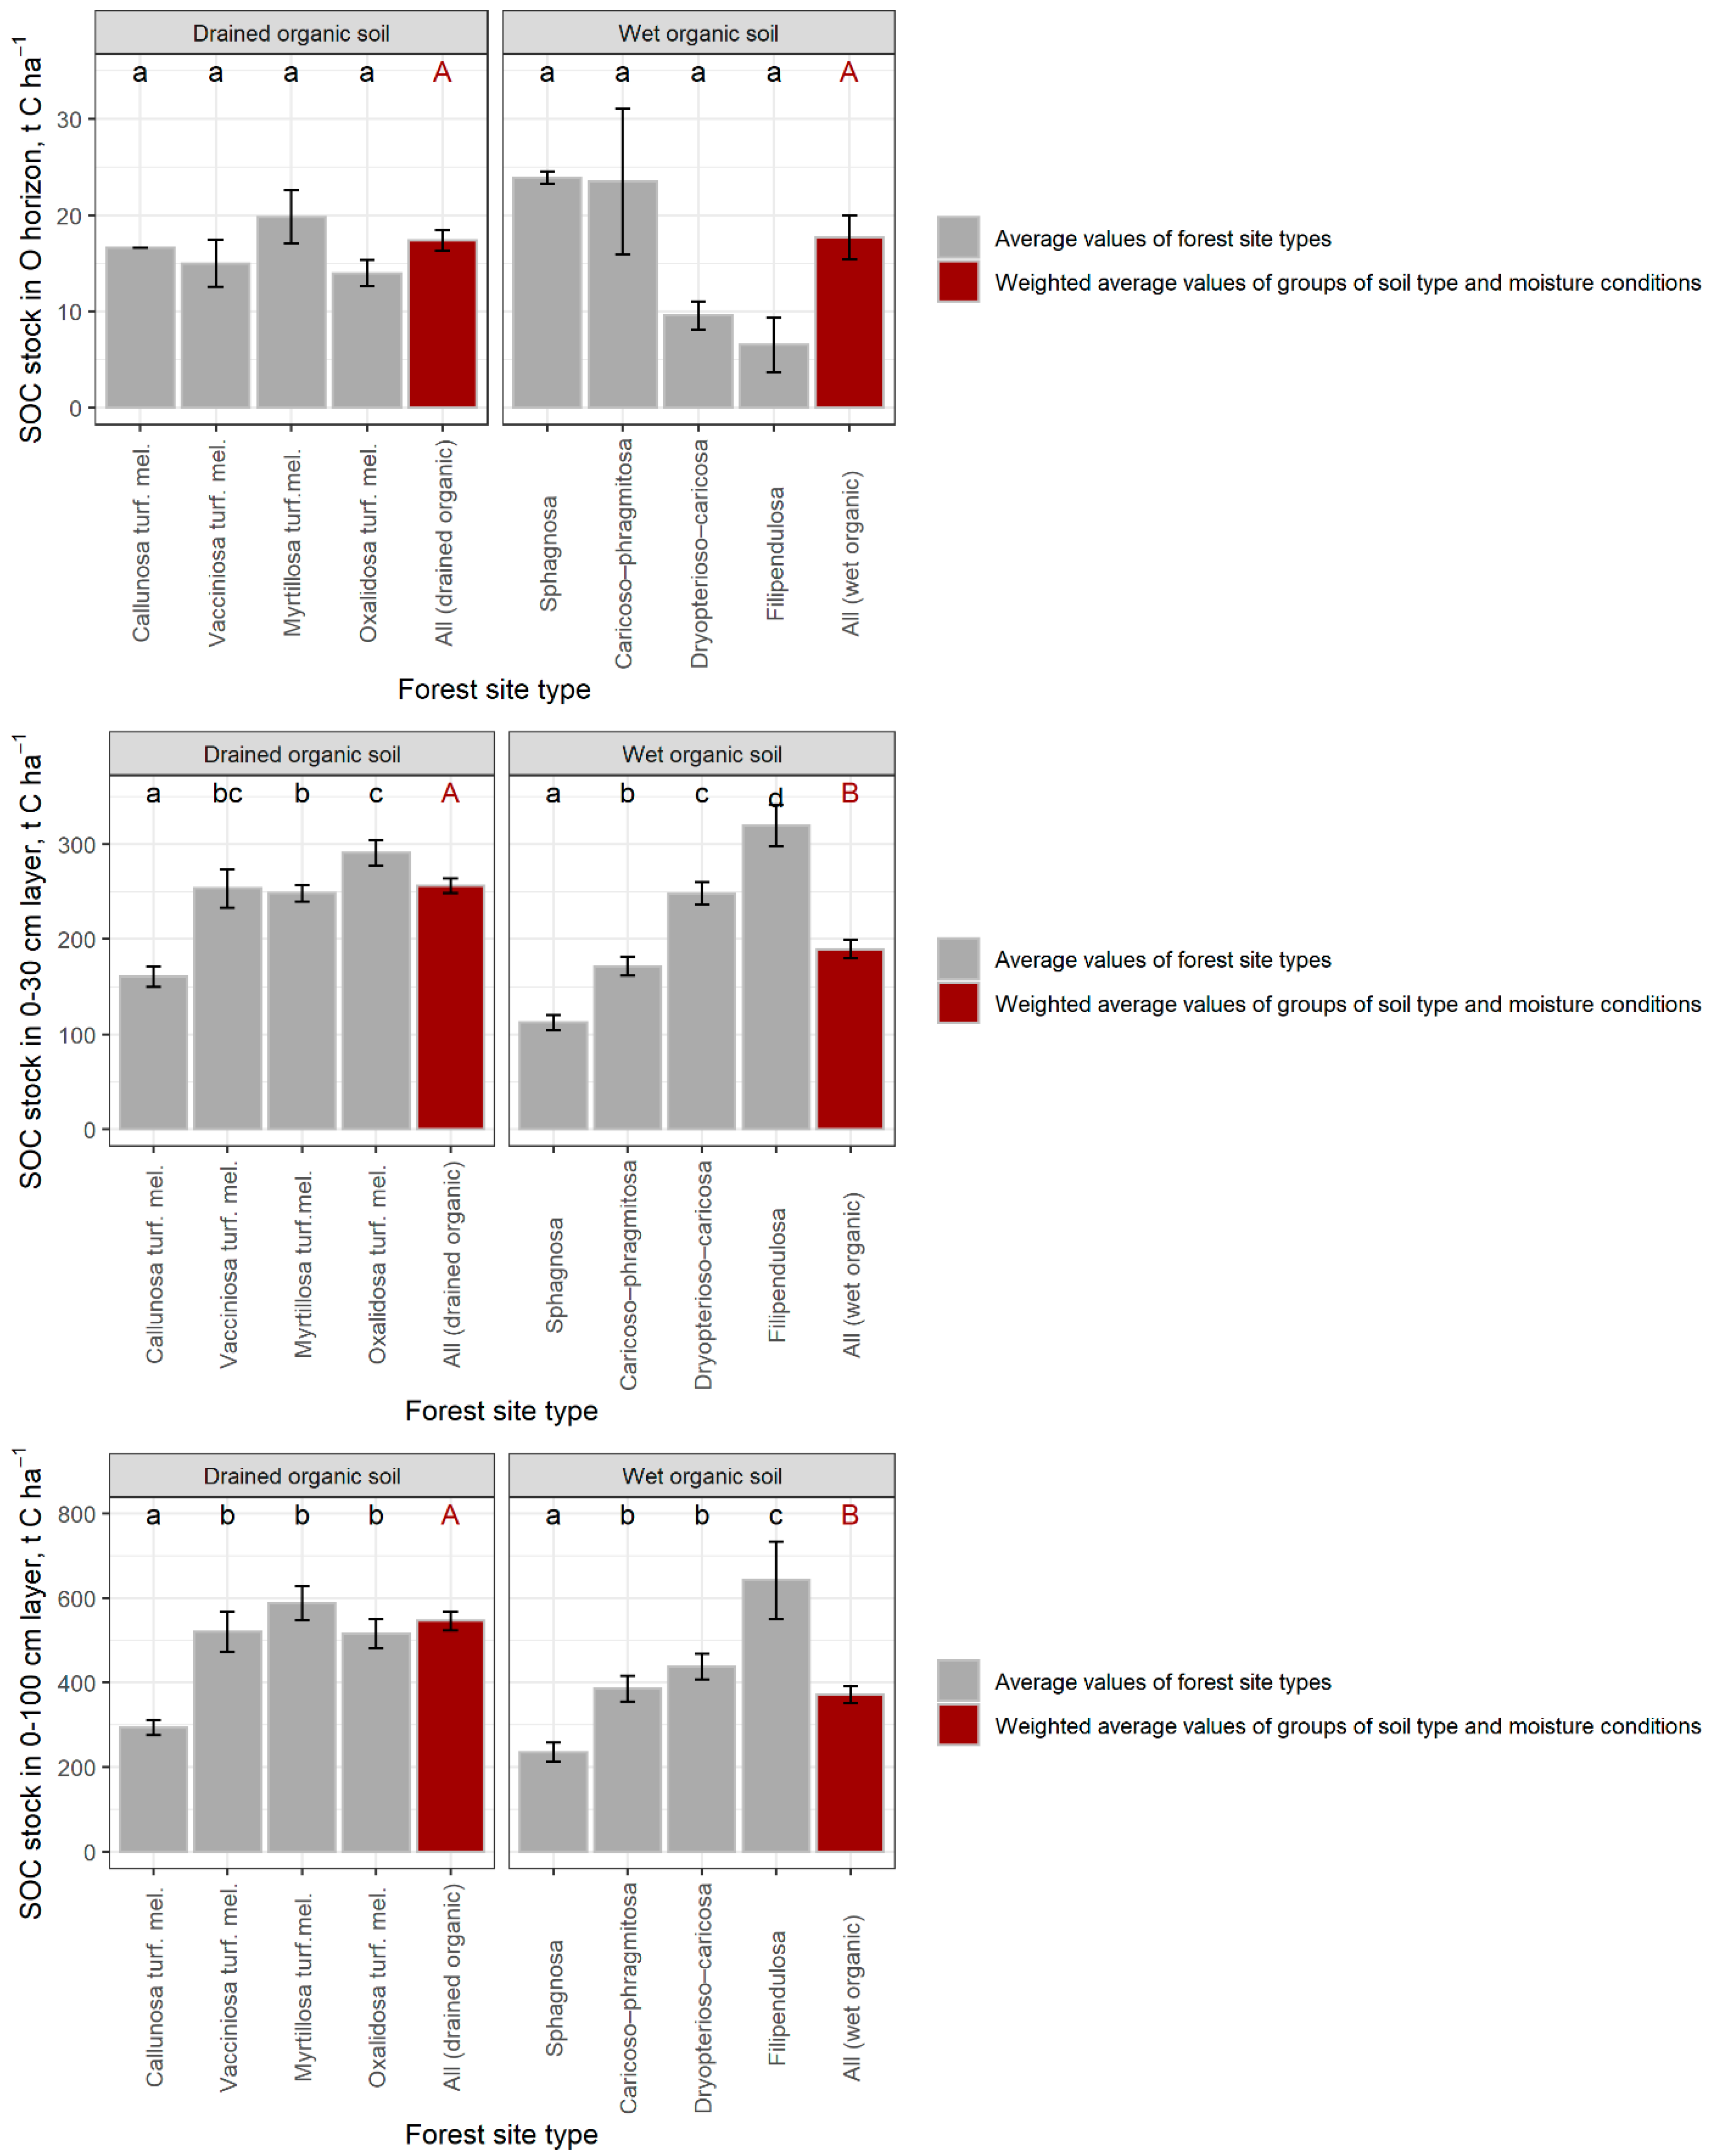
4.3. Soil Organic Carbon Stock in Forests with Organic Soils

In forest landscapes, variations in the determining factors of soil formation, i.e., parent material, topography, long-term interactions with organic matter input, organisms, dominant tree species, and climate and disturbances, result in large variability in SOC stocks [52]. De Vos et al. (2015) assessed SOC stocks based on data originating from 22 EU countries belonging to the UN/ECE ICP Forests Monitoring Level I network [3]. They estimated that the average SOC stock is 22.1 t C ha−1 in forest floors and 578 t C ha−1 in peat soils in the top 1 m [3]. In Latvia, Butlers and Lazdins (2020), in an earlier study of forests with organic soil, estimated that the largest values of OC stock in the O horizon were found in coniferous forests: up to 24.8 t C ha−1 in Norway spruce forests (~13 decades in age) and up to 20.5 t C ha−1 in Scots pine forests (~8 decades in age) [53]. They also concluded that C stock dynamics in the O horizon depend on the forest age according to polynomial regression, which demonstrates lower C stocks in young stands and an increase of C in mature forests with a subsequent decrease in decaying forests [53]. We calculated that the weighted average SOC stock in the O horizon, taking into account the distribution of forest site types in Latvia, was 17.7 ± 2.3 t C ha−1 in wet organic soils and 17.4 ± 1.1 t C ha−1 in forests with drained organic soil. The weighted average SOC stock in the 0–100 cm layer, considering the distribution of forest site types, was 546.5 ± 22.3 t C ha−1 in drained organic soils and 371.3 ± 20.9 t C ha−1 in wet organic soils. A higher soil bulk density and a lower proportion of the H horizon in the top 70 cm soil layer, but a higher SOC stock both in the 0–30 cm layer and in the 0–100 cm layer, were found in drained organic soils than in wet organic soils. This indicates a potential subsidence of organic matter caused mainly by physical shrinkage after drainage [43,54]. The weighted average soil bulk density in 0–10 cm soil layer in drained organic soils exceeded the soil bulk density in wet organic soils by 31 kg m−3, and the difference between drained and wet organic soils increased up to 96 kg m−3 in 40–50 cm depth. These differences in soil bulk density resulted in higher weighted average SOC stock in the 0–100 cm soil layer in drained organic soils by ~175 t C ha−1 in total (97% of this value is due to differences in soil bulk density). It must be considered that SOC stock below 1-m depth was not estimated and this limits interpretations of the management (drainage) impact on SOC stocks in organic soils. In general, conclusions concerning drainage impact on SOC stock in organic soils in the boreal and hemiboreal vegetation zone are contradictory. For instance, Simola et al. (2009) reported a marked decrease of peat mass (C loses) in drained forestry peatlands in Finland [55]. Several other studies also carried out in the boreal and hemiboreal vegetation zone have revealed that SOC stock in forests with organic soils can remain stable or even continue to increase after drainage [42,43,56,57,58], but in warmer climate (temperate) regions, drained organic soil is mostly a net source of GHG emissions (e.g., [9]).
According to the results of this study, in Latvia, in forest land with organic soil (735.7 kha [32]), the total estimated SOC stock in the O horizon was 12.9 Mt C, but was 343.5 Mt C in the upper 100 cm soil layer. Butlers and Lazdins (2020) recently estimated that the total C stock in organic soil layers, including the litter layer and peat in the upper 70 cm soil layer (excluding potential C stock in mineral soil layers underlying the peat layer), in forests with organic soils in Latvia is 242 Mt C [53]. This indicates a considerable SOC stock stored under organic soil layers (litter and peat layers) up to 100 cm deep. The EU Forest Focus BioSoil study [59,60] approximated the total SOC stock in the O horizon and 0–80 cm soil layer in Latvia (at all forest site types both with mineral and organic soil) as ~754 Mt C [59]. Although SOC stock per unit area in forest land with mineral soil in Latvia is considerably lower (~ 195 t C ha−1 in the upper 80 cm [59]) than estimated within this study for forests with organic soil, most of the total SOC stock is located in forests with mineral soil, as forests with mineral soil cover most (2505.5 kha or 77%) of the total forest area in the country (3241.2 kha [32]).

5. Conclusions

In hemiboreal forests in Latvia, the highest average thickness of the O horizon was detected in coniferous forests with wet mineral soil. The average thickness of the O horizon in forests with mineral soil decreased with increasing soil fertility, but forest stand characteristics were weak predictors of O horizon thickness. By contrast, in forests with organic soil, higher O horizon thicknesses were found in drained soils than in wet soils, indicating that accelerated organic matter decomposition in drained soils [38,43,44] can be compensated by increased tree biomass growth followed by higher litter production rates [41,52] as a result of increased soil fertility after drainage [40].
In forests with drained organic soil, soil physico-chemical parameters (especially soil bulk density) indicate a potential subsidence of organic matter, caused mainly by physical shrinkage after drainage. Furthermore, distribution of the soil H horizon thickness across different forest site types highlighted the potential for overestimation of the area of organic soils and thus GHG emissions from drained organic soils in forest land in Latvia by approximately 360 kt CO2 eq. in 2019 within the National GHG Inventory.

Supplementary Materials

The following are available online at https://www.mdpi.com/article/10.3390/f12070840/s1, Table S1: Organic carbon concentrations in soil in forest land with organic soil in Latvia, Table S2: Soil bulk density in forest land with organic soil in Latvia.

Author Contributions

Conceptualization, A.L.; methodology, A.L.; data curation, U.Z., R.P., A.J., A.A., and Ģ.R.; writing—original draft preparation, A.B. (Arta Bārdule); writing—review and editing, A.L., A.B. (Aldis Butlers) and I.L.; visualization, A.B. (Arta Bārdule); supervision, A.L.; project administration, I.L. All authors have read and agreed to the published version of the manuscript.

Funding

This research was funded by LIFE Programme of the European Union and the State Regional Development Agency of Latvia, grant number No. LIFE18CCM/LV/001158.

Acknowledgments

The study was implemented within the scope of the project “Demonstration of climate change mitigation measures in nutrients rich drained organic soils in Baltic States and Finland (LIFE OrgBalt)”, Grant agreement No. LIFE18CCM/LV/001158.

Conflicts of Interest

The authors declare no conflict of interest. The funders had no role in the design of the study; in the collection, analyses, or interpretation of data; in the writing of the manuscript, or in the decision to publish the results.

References

  1. Pan, Y.; Birdsey, R.A.; Fang, J.; Houghton, R.; Kauppi, P.E.; Kurz, W.A.; Phillips, O.L.; Shvidenko, A.; Lewis, S.L.; Canadell, J.G.; et al. A large and persistent carbon sink in the world’s forests. Science 2011, 333, 988–993. [Google Scholar] [CrossRef] [Green Version]
  2. Mayer, M.; Prescott, C.E.; Abaker, W.E.A.; Augusto, L.; Cécillon, L.; Ferreira, G.W.D.; James, J.; Jandl, R.; Katzensteiner, K.; Laclau, J.-P.; et al. Tamm review: Influence of forest management activities on soil organic carbon stocks: A knowledge synthesis. For. Ecol. Manag. 2020, 466, 118127. [Google Scholar] [CrossRef]
  3. De Vos, B.; Cools, N.; Ilvesniemi, H.; Vesterdal, L.; Vanguelova, E.; Carnicelli, S. Benchmark values for forest soil carbon stocks in Europe: Results from a large scale forest soil survey. Geoderma 2015, 251, 33–46. [Google Scholar] [CrossRef]
  4. Price, S.P.; Bradford, M.A.; Ashton, M.S. Characterizing organic carbon stocks and flows in forest soils. In Managing Forest Carbon in a Changing Climate; Ashton, M., Tyrrell, M., Spalding, D., Gentry, B., Eds.; Springer: Dordrecht, The Netherlands, 2012; pp. 7–30. [Google Scholar] [CrossRef]
  5. Schils, R.L.M.; Kuikman, P.; Liski, J.; van Oijen, M.; Smith, P.; Webb, J.; Alm, J.; Somogyi, Z.; van den Akker, J.; Billett, M.; et al. Review of Existing Information on the Interrelations between Soil and Climate Change; European Commission: Brussels, Belgium, 2008; pp. 21–41. [Google Scholar]
  6. Smith, P. Land use change and soil organic carbon dynamics. Nutr. Cycl. Agroecosyst. 2008, 81, 169–178. [Google Scholar] [CrossRef]
  7. Adamczyk, B.; Sietiö, O.M.; Straková, P.; Prommer, J.; Wild, B.; Hagner, M.; Pihlatie, M.; Fritze, H.; Richter, A.; Heinonsalo., J. Plant roots increase both decomposition and stable organic matter formation in boreal forest soil. Nat. Commun. 2019, 10, 3982. [Google Scholar] [CrossRef] [PubMed] [Green Version]
  8. Tubiello, F.N.; Biancalani, R.; Salvatore, M.; Rossi, S.; Conchedda, G. A worldwide assessment of greenhouse gas emissions from drained organic soils. Sustainability 2016, 8, 371. [Google Scholar] [CrossRef] [Green Version]
  9. Tiemeyer, B.; Freibauer, A.; Borraz, E.A.; Augustin, J.; Bechtold, M.; Beetz, S.; Beyer, C.; Ebli, M.; Eickenscheidt, T.; Fiedler, S.; et al. A new methodology for organic soils in national greenhouse gas inventories: Data synthesis, derivation and application. Ecol. Indic. 2020, 109, 105838. [Google Scholar] [CrossRef]
  10. UNFCCC. Paris Agreement. Available online: https://unfccc.int/process/conferences/pastconferences/paris-climate-change-conference-november-2015/paris-agreement (accessed on 25 March 2021).
  11. European Commission. The European Green Deal. Available online: https://eur-lex.europa.eu/resource.html?uri=cellar:b828d165-1c22-11ea-8c1f-01aa75ed71a1.0002.02/DOC_1&format=PDF (accessed on 25 March 2021).
  12. Ministry of Environmental Protection and Regional Development of Latvia. Informative Report: Strategy of Latvia for the Achievement of Climate Neutrality by 2050. Available online: https://unfccc.int/sites/default/files/resource/LTS1_Latvia.pdf (accessed on 25 March 2021).
  13. Eglin, T.; Martin, M.; Maurice, D.; Nicolas, M.; Perrier, C.; Buitrago, M.; Landmann, G. Collecting and using data on forest soils. Rev. For. Fr. LXVI 2014, 159–170. [Google Scholar] [CrossRef] [Green Version]
  14. Wiesmeier, M.; Urbanski, L.; Hobley, E.; Lang, B.; von Luetzow, M.; Marin-Spiotta, E.; van Wesemael, B.; Rabot, E.; Liess, M.; Garcia-Franco, N. Soil organic carbon storage as a key function of soils—A review of drivers and indicators at various scales. Geoderma 2019, 333, 149–162. [Google Scholar] [CrossRef]
  15. De Vos, B.; Cools, N. Second European Forest Soil Condition Report, Volume I: Results of the BioSoil Soil Survey; Research Institute for Nature and Forest: Brussel, Belgium, 2011; p. 369. [Google Scholar]
  16. Kasparinskis, R.; Astover, A.; Reintam, E.; Krievāns, M.; Zelčs, V.; Nikodemus, O.; Kārklņš, A.; Rotkovska, I.; Amatniece, V.; Bārdiņa, E.; et al. International WRB Soil Classification Field Workshop in Latvia and Estonia, Guidebook; University of Latvia: Riga, Latvia; Estonian University of Life Sciences: Tartu, Estonia, 2017; p. 115. [Google Scholar]
  17. Kārkliņš, A.; Gemste, I.; Mežals, H.; Nikodemus, O.; Skujāns, R. Taxonomy of Latvia Soils; Latvijas Lauksaimniecības Universitāte: Jelgava, Latvia, 2009; p. 240. [Google Scholar]
  18. Kasparinskis, R. Diversity of Forest Soils and Its Influencing Factors in Latvia. Ph.D. Thesis, University of Latvia, Riga, Latvia, 18 May 2012. [Google Scholar]
  19. Latvia’s National Inventory Report 2021. Available online: https://unfccc.int/ghg-inventories-annex-i-parties/2021 (accessed on 25 March 2021).
  20. Bušs, K. Forest Ecology and Typology; Zinātne: Rīga, Latvija, 1981; p. 64. [Google Scholar]
  21. Zālītis, P. Preconditions for Forestry; LVMI Silava: Rīga, Latvija, 2006; p. 219. [Google Scholar]
  22. IPCC 2006. 2006. 2006 IPCC Guidelines for national greenhouse gas Inventories. In IPCC National Greenhouse Gas Inventories Programme; Eggleston, H.S., Buendia, L., Miwa, K., Ngara, T., Tanabe, K., Eds.; IGES: Kanagawa, Japan, 2006. [Google Scholar]
  23. Kārkliņš, A. Organic soils in the context of green house gas inventory. In Proceedings of the Zinātniski Praktiskā Konference Līdzsvarota Lauksaimniecība, Jelgava, Latvia, 25–26 February 2016; LLU: Jelgava, Latvia, 2016; pp. 40–44. [Google Scholar]
  24. European Environment Agency. European Forest Types. Categories and Types for Sustainable Forest Management Reporting and Policy, 2nd ed.; EEA: Copenhagen, Denmark, 2007; pp. 43–46. [Google Scholar]
  25. FAO. World Reference Base for Soil Resources; Food and Agriculture Organization of the United Nations: Rome, Italy, 1998. [Google Scholar]
  26. Cools, N.; De Vos, B. Part X: Sampling and analysis of soil. In Manual on Methods and Criteria for Harmonized Sampling, Assessment, Monitoring and Analysis of the Effects of Air Pollution on Forests; UNECE ICP Forests Programme Co-ordinating Centre, Ed.; Thünen Institute of Forest Ecosystems: Eberswalde, Germany, 2011; p. 29. [Google Scholar]
  27. LVS ISO 11464:2006. Soil Quality–Pretreatment of Samples for Physico-Chemical Analysis; LVS/STK/25 Vides kvalitāte, Latvia; International Organization for Standardization: Geneva, Switzerland, 2006; p. 14. [Google Scholar]
  28. LVS ISO 11272:2017. Soil Quality–Determination of Dry Bulk Density; ISO/TC 190/SC 3 Chemical Methods and Soil Characteristics, Latvia; International Organization for Standardization: Geneva, Switzerland, 2017; p. 23. [Google Scholar]
  29. LVS ISO 11277:2020. Soil Quality–Determination of Particle Size Distribution in Mineral Soil Material–Method by Sieving and Sedimentation; ISO/TC 190 Soil Quality, Latvia; International Organization for Standardization: Geneva, Switzerland, 2020; p. 37. [Google Scholar]
  30. LVS ISO 10694:2006. Soil Quality–Determination of Organic and Total Carbon after Dry Combustion (Elementary Analysis); LVS/STK/25 Vides kvalitāte, Latvia; International Organization for Standardization: Geneva, Switzerland, 2006; p. 12. [Google Scholar]
  31. ISO 10693:1995. Soil Quality–Determination of Carbonate Content–Volumetric Method; LVS Standartizācijas Nodaļa, Latvijas Standarts; International Organization for Standardization: Geneva, Switzerland, 1995; p. 8. [Google Scholar]
  32. National Forest Inventory. Available online: http://www.silava.lv/petijumi/nacionlais-mea-monitorings.aspx (accessed on 25 March 2021).
  33. The R Project for Statistical Computing. Available online: https://www.r-project.org/ (accessed on 25 March 2021).
  34. Bārdule, A.; Petaja, G.; Butlers, A.; Purviņa, D.; Lazdiņš, A. Estimation of litter input in hemi-boreal forests with drained organic soils for improvement of GHG inventories. Balt. For. under review.
  35. Hobbie, S.E.; Reich, P.B.; Oleksyn, J.; Ogdahl, M.; Zytkowiak, R.; Hale, C.; Karolewski, P. Tree species effects on decomposition and forest floor dynamics in a common garden. Ecology 2006, 87, 2288–2297. [Google Scholar] [CrossRef]
  36. Jacob, M.; Viedenz, K.; Polle, A.; Thomas, F.M. Leaf litter decomposition in temperate deciduous forest stands with a decreasing fraction of beech (fagus sylvatica). Oecologia 2010, 164, 1083–1094. [Google Scholar] [CrossRef] [PubMed] [Green Version]
  37. Berg, B.; Meentemeyer, V. Litter quality in a north European transect versus carbon storage potential. Plant. Soil 2002, 242, 83–92. [Google Scholar] [CrossRef]
  38. Holden, J.; Chapman, P.J.; Labadz, J.C. Artificial drainage of peatlands: Hydrological and hydrochemical process and wetland restoration. Prog. Phys. Geogr. 2004, 28, 95–123. [Google Scholar] [CrossRef] [Green Version]
  39. Straková, P.; Anttila, J.; Spetz, P.; Kitunen, V.; Tapanila, T.; Laiho, R. Litter quality and its response to water level drawdown in boreal peatlands at plant species and community level. Plant. Soil 2010, 335, 501–520. [Google Scholar] [CrossRef]
  40. Nikodemus, O.; Kļaviņš, M.; Krišjāne, Z.; Zelčs, V. Latvija. Zeme, Daba, Tauta, Valsts; Latvijas Universitātes Akadēmiskais apgāds: Rīga, Latvia, 2018; p. 752. [Google Scholar]
  41. Laiho, R.; Vasander, H.; Penttilä, T.; Laine, J. Dynamics of plant-mediated organic matter and nutrient cycling following water-level draw-down in boreal peatlands. Glob. Biogeochem. Cycles 2003, 17, 22-1–22-11. [Google Scholar] [CrossRef]
  42. Minkkinen, K.; Laine, J. Long-term effect of forest drainage on the peat carbon stores of pine mires in Finland. Can. J. For. Res. 1998, 28, 1267–1275. [Google Scholar] [CrossRef]
  43. Lupiķis, A.; Lazdiņš, A. Soil carbon stock changes in transitional mire drained for forestry in Latvia: A case study. Res. Rural Dev. 2017, 1, 55–61. [Google Scholar] [CrossRef]
  44. Szajdak, L.W.; Jezierski, A.; Wegner, K.; Meysner, T.; Szczepański, M. Influence of drainage on peat organic matter: Implications for development, stability, and transformation. Molecules 2020, 25, 2587. [Google Scholar] [CrossRef]
  45. Briggs, R.D. Soil development and properties. In Encyclopedia of Forest Sciences, 1st ed.; Evans, J., Youngquist, J., Eds.; Elsevier Ltd.: Amsterdam, The Netherlands; Academic Press: Cambridge, MA, USA, 2004; pp. 1223–1227. [Google Scholar]
  46. Fioretto, A.; Di Nardo, C.; Papa, S.; Fuggi, A. Lignin and cellulose degradation and nitrogen dynamics during decomposition of three leaf litter species in a Mediterranean ecosystem. Soil Biol. Biochem. 2005, 37, 1083–1091. [Google Scholar] [CrossRef]
  47. Nicolás, C.; Martin-Bertelsen, T.; Floudas, D.; Bentzer, J.; Smits, M.; Johansson, T.; Troein, C.; Persson, P.; Tunlid, A. The soil organic matter decomposition mechanisms in ectomycorrhizal fungi are tuned for liberating soil organic nitrogen. ISME J. 2019, 13, 977–988. [Google Scholar] [CrossRef] [Green Version]
  48. Salah, Y.M.S.; Scholes, M.C. Effect of temperature and litter quality on decomposition rate of Pinus patula needle litter. Procedia Environ. Sci. 2011, 6, 180–193. [Google Scholar] [CrossRef] [Green Version]
  49. Tucker Serniak, L. The effects of earthworms on carbon dynamics in forest soils. Ref. Modul. Earth Syst. Environ. Sci. 2017. [Google Scholar] [CrossRef]
  50. Liu, C.; Westman, C.J.; Berg, B.; Kutsch, W.; Wang, G.Z.; Man, R.; Ilvesniemi, H. Variation in litterfall-climate relationships between coniferous and broadleaf forests in Eurasia. Glob. Ecol. Biogeogr. 2004, 13, 105–114. [Google Scholar] [CrossRef]
  51. Neumann, M.; Ukonmaanaho, L.; Johnson, J.; Benham, S.; Vesterdal, L.; Novotný, R.; Verstraeten, A.; Lundin, L.; Thimonier, A.; Michopoulos, P.; et al. Quantifying carbon and nutrient input from litterfall in European forests using field observations and modeling. Glob. Biogeochem. Cycles 2018, 32, 784–798. [Google Scholar] [CrossRef]
  52. Dalsgaard, L.; Lange, H.; Strand, L.T.; Callesen, I.; Kynding Borgen, S.; Liski, J.; Rasmus, A. Underestimation of boreal forest soil carbon stocks related to soil classification and drainage. Can. J. For. Res. 2016, 46, 1413–1425. [Google Scholar] [CrossRef]
  53. Butlers, A.; Lazdins, A. Carbon stock in litter and organic soil in drained and naturally wet forest lands in Latvia. Res. Rural Dev. 2020, 35, 47–54. [Google Scholar] [CrossRef]
  54. Casselgård, M. Effects of 100 Years of Drainage on Peat Properties in a Drained Peatland Forests in Northern Sweden. Master’s Thesis, Swedish University of Agricultural Science, Umeå, Sweden, 2020. [Google Scholar]
  55. Simola, H.; Pitkänen, A.; Turunen, J. Carbon loss in drained forestry peatlands in Finland, estimated by re-sampling peatlands surveyed in the 1980s. Eur. J. Soil Sci. 2012, 63, 798–807. [Google Scholar] [CrossRef]
  56. Flanagan, L.B.; Syed, K.H. Stimulation of both photosynthesis and respiration in response to warmer and drier conditions in a boreal peatland ecosystem. Glob. Chang. Biol. 2011, 17, 2271–2287. [Google Scholar] [CrossRef]
  57. Lohila, A.; Minkkinen, K.; Aurela, M.; Tuovinen, J.-P.; Penttilä, T.; Ojanen, P.; Laurila, T. Greenhouse gas flux measurements in a forestry-drained peatland indicate a large carbon sink. Biogeosciences 2011, 8, 3203–3218. [Google Scholar] [CrossRef] [Green Version]
  58. Ojanen, P.; Minkkinen, K.; Alm, J.; Penttilä, T. Soil–atmosphere CO2, CH4 and N2O fluxes in boreal forestry-drained peatlands. For. Ecol. Manag. 2010, 260, 411–421. [Google Scholar] [CrossRef]
  59. Bārdule, A.; Bāders, E.; Stola, J.; Lazdiņš, A. Forest soil characteristic in Latvia according results of the demonstration project BioSoil. Mežzinātne 2009, 20, 105–124. [Google Scholar]
  60. Hiederer, R.; Micheli, E.; Durrant, T. Evaluation of the BioSoil Demonstration Project-Soil Data Analysis, EUR 24729 EN; Publication Office of the European Union: Ispra, Italy, 2011; p. 155. [Google Scholar]
Figure 1. Average thickness of the O horizon in forest land in Latvia by forest site types. The division into groups based on soil types and moisture conditions is based on forest site types according to the national forest classification. Error bars represent standard errors. Different lower-case letters (black) show statistically significant differences (p < 0.05, α = 0.05) in average values between forest site types within a group of soil type and moisture conditions; different upper-case letters (red) show statistically significant differences (p < 0.05, α = 0.05) in average values between different groups of soil type and moisture conditions.
Forests 12 00840 g001
Figure 2. Average thickness of the O horizon in forest land in Latvia by dominant tree species (Scots pine (Pinus sylvestris L.), Norway spruce (Picea abies (L.) H.Karst.), silver Birch (Betula pendula Roth) and other deciduous trees). The division into groups based on soil types and moisture conditions is based on forest site types according to the national forest classification. Error bars represent standard errors. Different lower-case letters show statistically significant differences (p < 0.05, α = 0.05) in average values between different dominant tree species within a group of soil type and moisture conditions.
Forests 12 00840 g002
Figure 3. Distribution of thickness of the O horizon in forest land in Latvia depending on basal area. The division into groups based on soil types and moisture conditions is based on forest site types according to the national forest classification.
Forests 12 00840 g003
Figure 4. Proportion of the H horizon in the top 70 cm soil layer in forest land in Latvia. The division into groups based on soil types and moisture conditions is based on forest site types according to the national forest classification. Error bars represent standard errors. Different lower-case letters (black) show statistically significant differences (p < 0.05, α = 0.05) in average values between forest site types within a group of soil type and moisture conditions; different upper-case letters (red) show statistically significant differences (p < 0.05, α = 0.05) in average values between different groups of soil type and moisture conditions.
Forests 12 00840 g004
Figure 5. Distribution of NFI plots based on the thickness of the H horizon in forest land in Latvia. The division into groups based on soil types and moisture conditions is based on forest site types according to the national forest classification.
Forests 12 00840 g005
Figure 6. SOC stock per unit area in the O horizon, in the 0–30 cm layer and in the 0–100 cm layer in forest land with organic soils in Latvia. The division into groups of soil moisture conditions is based on forest site type according to the national forest classification. Error bars represent standard errors. Different lower-case letters (black) show statistically significant differences (p < 0.05, α = 0.05) in average values between forest site types within a group of soil type and moisture conditions; different upper-case letters (red) show statistically significant differences (p < 0.05, α = 0.05) in weighted average values between different groups of soil type and moisture conditions.
Forests 12 00840 g006
Table 1. Characteristics of plots in forest land where soil organic layer thickness was measured (NFI plots) and soil was sampled for physico-chemical analyses.
Soil Type and Moisture Conditions 1Forest Site
Types 2
Relative
Soil
Fertility 3
Characteristics of NFI Plots 4 Where Thickness of Soil Organic Layers Was MeasuredSoil
Sampling 6
Number of NFI PlotsAverage Age 5 (min–max)Average Standing Volume ± S.E. (min–max), m3 ha−1Number of Plots
Dry mineral soilCladinoso–callunosavery low4270 (18–165)163 ± 15 (10–466)-
Vacciniosalow14867 (1–165)213 ± 11 (<0.1–595)-
Myrtillosalow15768 (1–170)268 ± 14 (<0.1–696)-
Hylocomiosamedium81853 (1–201)259 ± 8 (<0.1–1123)-
Oxalidosaabove average95038 (1–182)216 ± 6 (<0.1–1753)-
Aegopodiosahigh15156 (1–173)264 ± 15 (<0.1–836)-
Naturally wet mineral soilCladinoso–sphagnosavery low242 (31–53)75 ± 50 (25–125)-
Vaccinioso–sphagnosalow7353 (2–153)140 ± 13 (<0.1–395)-
Myrtilloso–sphagnosamedium17854 (1–193)204 ± 13 (<0.1–780)-
Myrtilloso–polytrichosaabove average15445 (1–181)187 ± 12 (<0.1–567)-
Dryopteriosahigh1147 (10–80)248 ± 57 (7–525)-
Drained mineral soilCallunosa mel.low225 (24–25)64 ± 20 (44–83)-
Vacciniosa mel.medium6960 (1–141)259 ± 20 (<0.1–645)-
Myrtillosa mel.above average51148 (1–182)247 ± 9 (<0.1–1046)-
Mercurialiosa mel.high23640 (1–103)223 ± 13 (<0.1–1458)-
Naturally wet organic soilSphagnosalow13776 (3–178)88 ± 6 (<0.1–373)13
Caricoso–phragmitosamedium16864 (1–168)147 ± 8 (<0.1–445)28
Dryopterioso–caricosahigh19547 (4–143)172 ± 10 (<0.1–643)25
Filipendulosahigh857 (31–91)243 ± 64 (28–523)5
Drained organic soilCallunosa turf. mel.low2257 (27–210)110 ± 14 (9–294)13
Vacciniosa turf. mel.medium10267 (1–190)202 ± 13 (<0.1–577)17
Myrtillosa turf.mel.high32756 (1–195)229 ± 10 (<0.1–759)36
Oxalidosa turf. mel.high13844 (2–129)208 ± 14 (<0.1–916)37
Totalallall459951 (1–210)220 ± 3 (<0.1–1753)174
1 Based on forest site type according to the national forest classification system [20]. 2 According to the national forest classification system [20]. 3 According to Kārkliņš et al. (2009) [17] based on the national forest classification system [20]. 4 Plots in forest land (excluding clear cut areas and afforested agricultural land). 5 Age of the dominant tree species in overstorey. 6 Soil sampling for physico-chemical analyses.
Table 2. National-level assessment of soil organic carbon stock in the O horizon, in the 0–30 cm layer and in the 0–100 cm layer in forest land with organic soils in Latvia.
Soil Type and Moisture Conditions 1Forest Site Types 2Relative Soil Fertility 3Total Area in Latvia, Kha 4Soil Organic Carbon Stock, Mt C
O Horizon0–30 cm0–100 cm
Naturally wet organic soilSphagnosalow87.62.099.8620.65
Caricoso–phragmitosamedium105.52.4818.0640.72
Dryopterioso–caricosahigh137.31.3234.0760.17
Filipendulosahigh4.20.031.352.71
total-334.65.9263.34124.25
Drained organic soilCallunosa turf. mel.low17.20.292.775.05
Vacciniosa turf. mel.medium68.41.0317.3235.58
Myrtillosa turf.mel.high216.44.2953.77127.46
Oxalidosa turf. mel.high99.01.3828.8351.12
total-401.16.99102.69219.20
Totalall-735.712.90166.02343.45
1 Based on forest site type according to the national forest classification system [20]. 2 According to the national forest classification system [20]. 3 According to Kārkliņš et al. (2009) [17] based on the national forest classification system [20]. 4 NFI data [32].
Publisher’s Note: MDPI stays neutral with regard to jurisdictional claims in published maps and institutional affiliations.

