

Carbon Budget of Undrained and Drained Nutrient-Rich Organic Forest Soil

Latvian State Forest Research Institute ‘Silava’ (LSFRI Silava), Rigas Str. 111, LV-2169 Salaspils, Latvia
*
Author to whom correspondence should be addressed.
Forests 2022, 13(11), 1790; https://doi.org/10.3390/f13111790
Submission received: 30 September 2022
/
Revised: 19 October 2022
/
Accepted: 26 October 2022
/
Published: 28 October 2022
(This article belongs to the Special Issue Nutrient Cycling through the Forest and Soil System)
Abstract
:The impact of the moisture regime on the carbon budget of organic soils with different nutrient statuses has not been fully studied in hemiboreal forests thus far. This study evaluated soil carbon (C) stock changes in forests with drained and undrained nutrient-rich organic soils by estimating C loss through respiration and C input through the litter. The study sites included forest stands dominated by Norway spruce (Picea abies), silver birch (Betula pendula), black alder (Alnus glutinosa), and clear-cuts. Soil respiration was measured using the chamber method, and to estimate the soil C input by litter—the biomass and the C content of the foliar litter, ground vegetation, and fine-root production were measured. The soil in forest stands acted as a C sink. The carbon dioxide (CO2) removal rates of 0.4 ± 0.4 t C ha−1 year−1 and 0.1 ± 0.4 t C ha−1 year−1 were estimated for undrained and drained soil in forest stands, respectively. The soil in the clear-cuts acted as a CO2 source, and the annual emissions ranged from 0.4 ± 0.4 t C ha−1 year−1 in undrained to 0.9 ± 0.7 t C ha−1 year−1 in drained conditions. The reason for the soil in clear-cuts being a C source was increased C loss by respiration and reduced soil C input by litter. Furthermore, the mean soil C input by ground vegetation biomass in the clear-cuts was considerably higher than in the forest stands, which did not compensate for the increase in soil respiration and the absence of C input by foliar litter and the fine roots of trees. The results of the study on annual soil C stock changes can be used as an emission factor in national greenhouse gas inventories of forest land in the hemiboreal zone.
1. Introduction
In accordance with the Paris Agreement, the European Union, including Latvia, has committed to achieving climate neutrality by 2050. These policy targets promote seeking forest management practices that contribute to C sequestration [1,2,3,4], reflected in the topicality of related studies, including the estimation of ecosystem greenhouse gas (GHG) balance. Reducing the GHG emissions from the main national sources, such as the transport, energy, and agriculture sectors, which currently account for around 88% of Latvia’s total GHG emissions, will not be sufficient to achieve the climate neutrality target set by Paris Agreement. To compensate for the irreducible GHG emissions in these sectors, the land use, land-use change, and forestry (LULUCF) sector must ensure the equivalent sequestration of carbon dioxide (CO2). Boreal forests are often identified as ecosystems with carbon (C) sequestration potential [5]. Therefore, forest land is the only land-use category of the LULUCF sector in which an increased rate of CO2 sequestration by the implementation of climate change mitigation measures has the potential to offset the country’s total GHG emissions.
Efforts to achieve the C sequestration and GHG mitigation potential of the forest ecosystem can be implemented with targeted activities that promote C sequestration in biomass, soil, and harvested wood products, as well as by replacing fossil fuels with biomass. The role of forest management in tree biomass C sequestration is well understood and modeled, but understanding the process of C sequestration and assessing changes in the C stock of the soil remain limited [6]. Previous studies show that climate change mitigation measures targeted at organic soil management are often the most effective, but the climate change mitigation potential of organic soils is not being used fully [7,8]; this is largely related to the lack of knowledge. The most frequently identified climate change mitigation measures related to the management of organic forest soils are the afforestation of organic soils and the restoration of the natural moisture regime [9]. However, there is a lack of scientific evidence that the restoration of the natural moisture regime of organic soils promotes reductions in GHG emissions and an increase in the C sink of the boreal forest ecosystem in the current climate conditions. GHG emissions from undrained forest soil are not within the scope of the national GHG inventory (Inventory) reports, hindering interest in such studies. However, quantitative awareness of such emissions is crucial for the comparison of carbon stock change (CSC) of drained organic soil relative to undrained soil to fully understand the climate impact of drainage and to enable possibilities of implementing the potentially most effective climate change mitigation measures in forest land management. The drainage of organic soils is often considered a climate-harmful management practice, although knowledge of annual soil GHG emissions is highly uncertain [8]. Currently, there is a lack of common understanding of the impact of soil drainage on forest ecosystem GHG emissions and the C balance. Some studies indicate that the drainage of nutrient-poor organic soils in boreal forests has a significant impact on ecosystem CO2 sequestration [10], while the drainage of nutrient-rich organic soils may turn forest ecosystems into GHG emission sources when soil C and nitrogen (N) loss is not compensated by increased forest growth [11].
The most commonly mentioned shortcoming of previous scientific articles on net CO2 emissions from forests with drained organic soils in boreal and temperate climate regions is a necessity to subtract below- and above-ground biomass respiration from the reported results and incorporate litter production or decomposition rates [8]. Thus, the results reported require further processing or additional data to enable the quantification of annual soil CSC. Another shortcoming is the uneven site spatial coverage of the previous studies. Most of the organic soil CSC estimate results were obtained from drained boreal peatland studies carried out in Finland, while most of the study sites representing a temperate zone are located in the southern part of Sweden [8]. The results of organic soil CSC estimates in the Baltic states representing hemiboreal forests are reported by four articles on drained peatlands [12,13,14,15]. Despite the fact that the availability of study results on drained organic forest soils has increased, they are still scarce, considering the variability of the factors affecting CSC in forest ecosystems. No CSC estimates of undrained organic forest soils have been reported in the region, as studies on undrained organic soils are usually carried out in pristine or recently recultivated peatlands.
According to the acknowledgment that there is a lack of studies evaluating the impact of different long-term soil moisture regimes on soil CSC [8] and observations that organic forest soil CO2 emissions can be comparably higher in forest sites with increased soil fertility [16], room for improvement in the Inventory and capabilities to plan climate change mitigation measures is recognized. The estimated GHG emissions of 1.7 million t CO2 equivalents (14.4% of the total emissions of Latvia) from drained organic soil in the forest land category in 2020 [17] show the significance of accurate organic soil emission estimates in the national Inventory. The currently applied country-specific emission factor (0.52 t C ha−1 year−1) for the estimation of CO2 emissions from drained organic soil in forest lands in Latvia is developed by the C stock inventory method conducted in forests with nutrient-poor to moderately rich (Callunosa turf. Mel., Vacciniosa turf. Mel. Additionally, Myrtillosa turf. Mel.) soils according to the national forest site type classification [18]. The country-specific emission factor is applied to all organic soils in forests, while according to the national forest inventory, the share of drained (17%) and undrained (4%) forest site types with nutrient-rich organic soils, where potentially higher soil CO2 emissions may be expected, is 21%. Therefore, the currently used emission factor may introduce accuracy errors in the estimations.
This study aimed to estimate the CSC of drained and undrained nutrient-rich organic soils using empirical data on soil CO2 emissions and soil C input by:
- Foliar litter (LF);
- Ground vegetation (above- and below-ground biomass of herbs and grasses, GV);
- Fine roots of trees (FR);
- Moss and dwarf shrubs.
This study contributes to the improvement of the national GHG inventory and provides a scientifically valid assessment of potential soil drainage effects on CO2 emissions to support decision-making on climate change mitigation measures.
2. Materials and Methods
2.1. Study Site Description
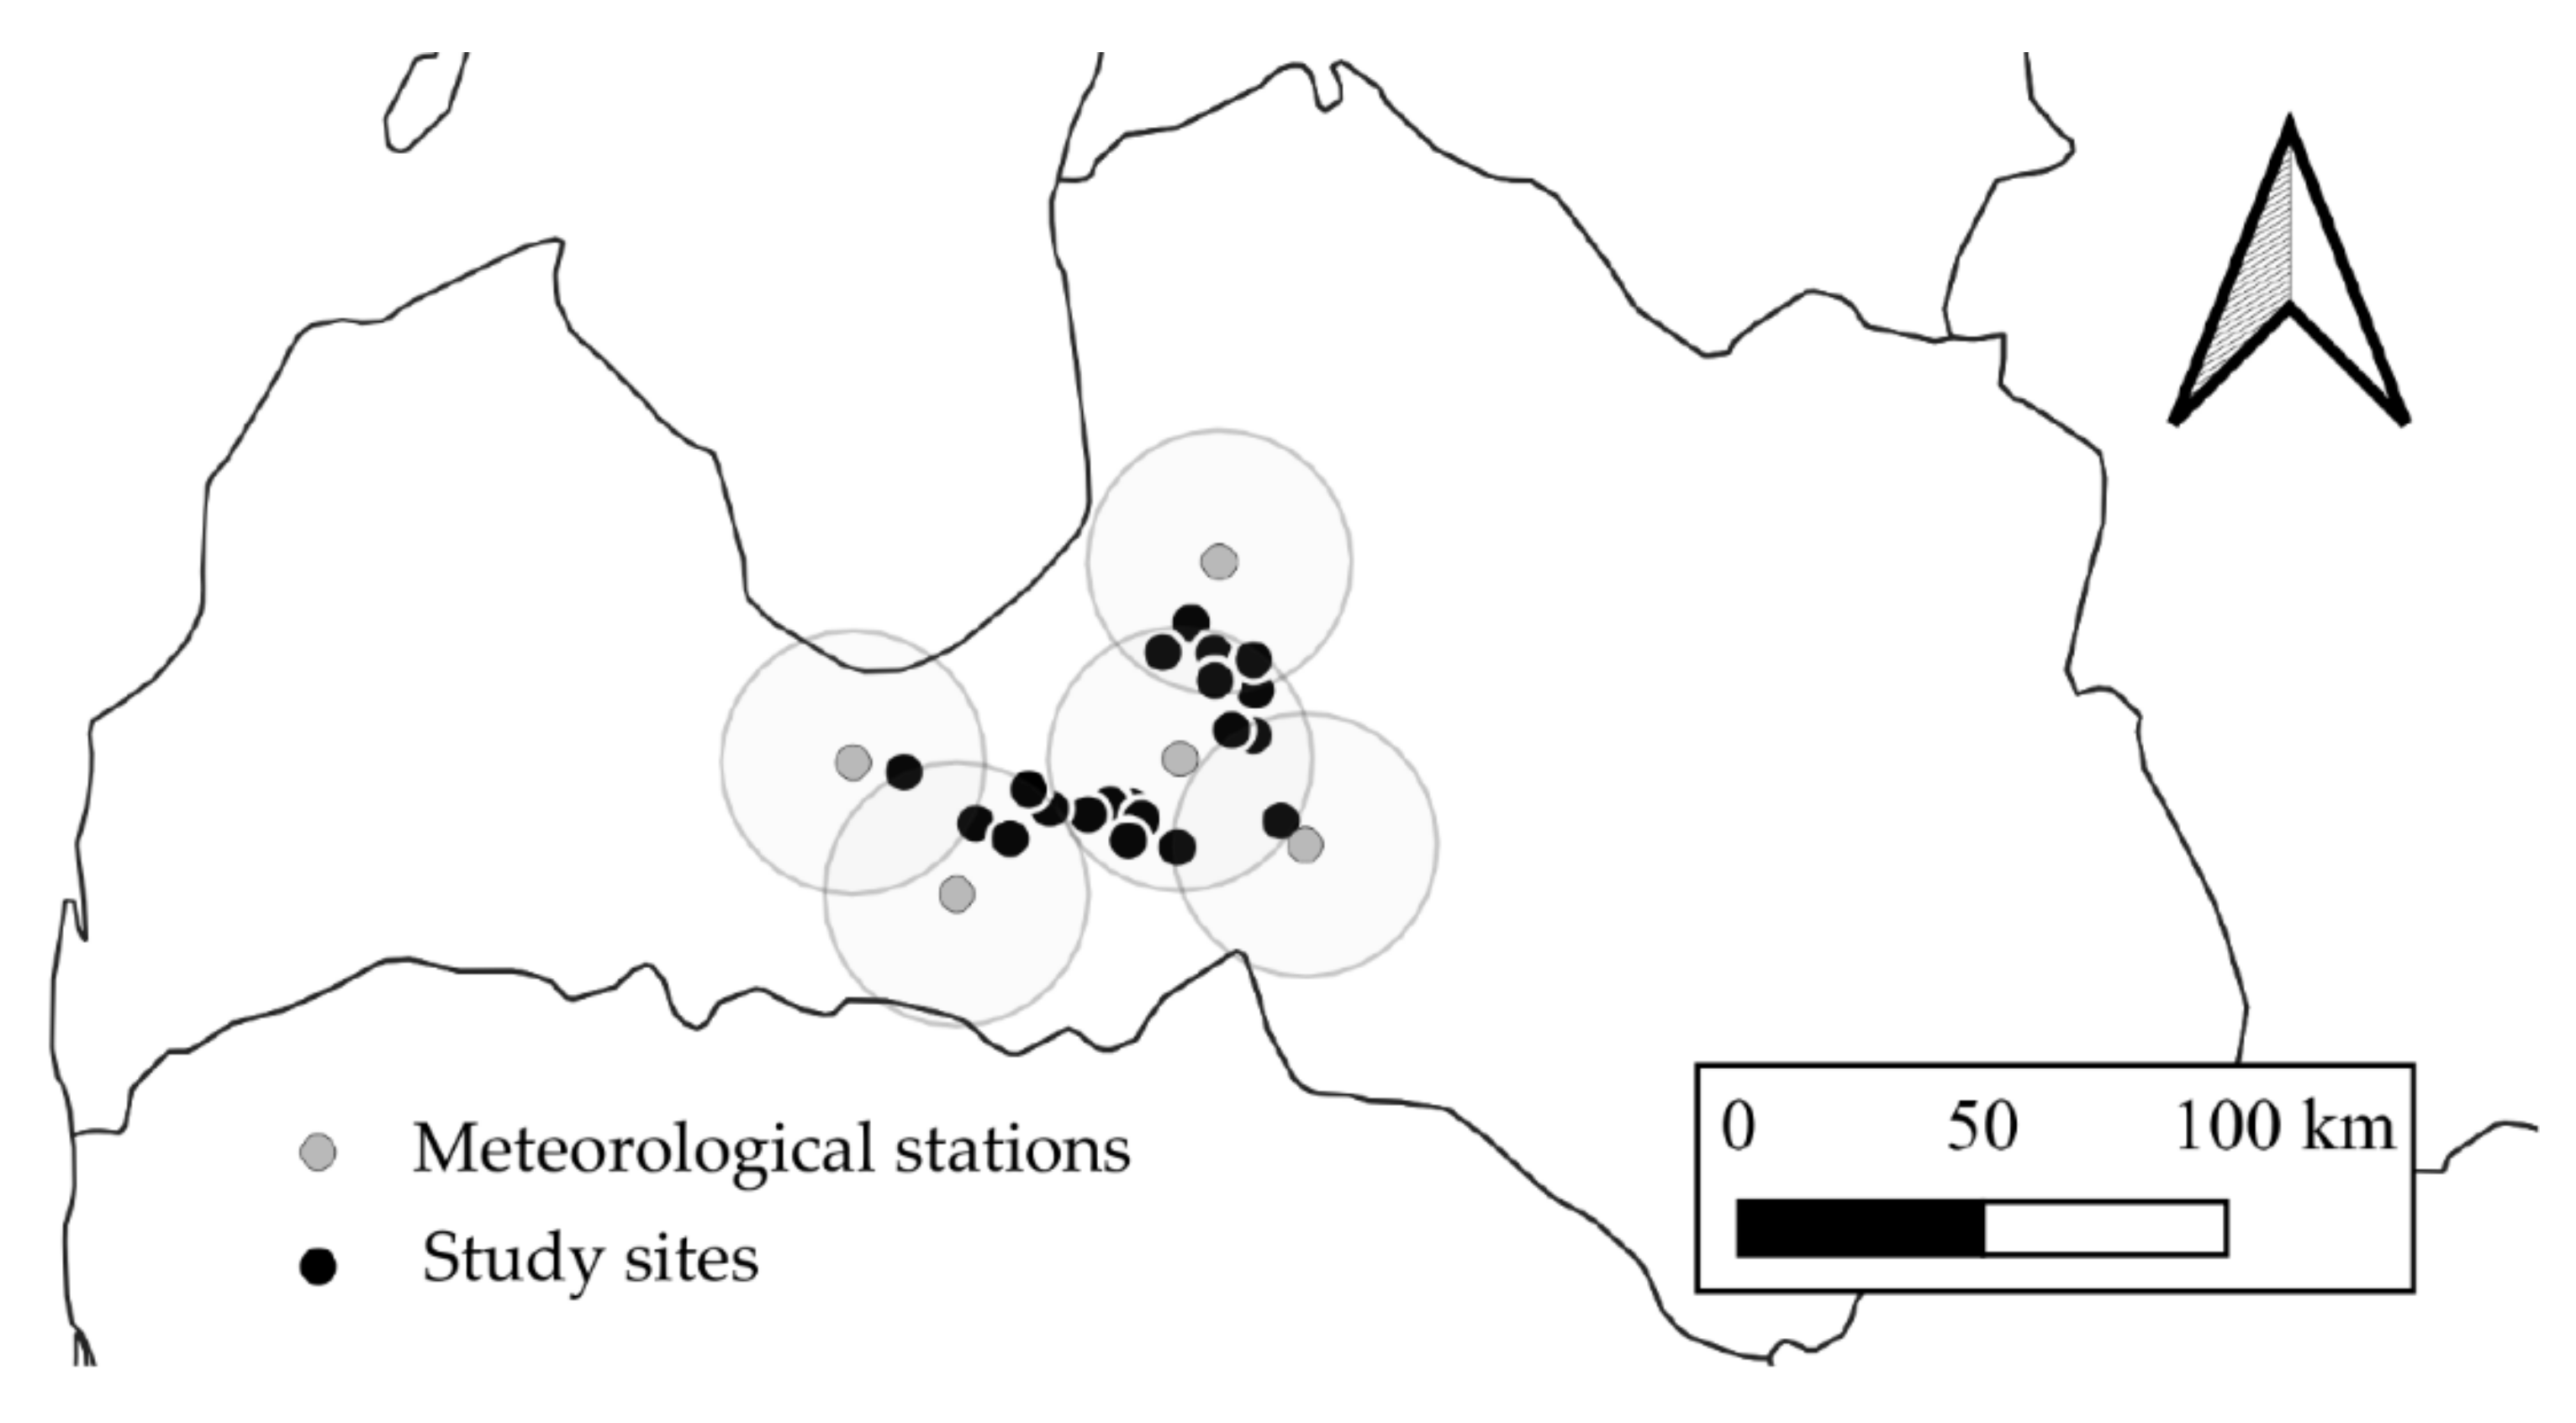
The study was carried out in central Latvia (Figure 1) on the forest stands of a hemiboreal zone with undrained (Dryopterioso-caricosa and Filipendulosa) and drained (Oxalidosa turf. mel.) forest site types characterized by nutrient-rich organic soil. For the forest stands to be accepted as study sites, the compliance with drainage status, the average peat layer depth (>30 cm in undrained sites and >20 cm in drained sites), and the characteristic vegetation, as defined in the national forest site type classification (Table 1), were analyzed. One round sample plot (500 m2) was established in each of the selected study sites. The distance to the nearest drainage ditches from the sample plots was at least 300 m and 100 m in the study sites with undrained and drained soil, respectively.
During the collection of the empirical data (from October 2019 to June 2021), the air temperature in the study sites ranged from 8.0 ± 0.7 °C to 31.4 ± 0.1 °C (mean 9.2 ± 0.8 °C) and the annual precipitation ranged from 472 mm to 860 mm (average 668 ± 136 mm) according to the data provided by the meteorological stations of the Latvian Environment, Geology, and Meteorology Centre (distance from study site less than 30 km).
The scope of the study included 31 forest stands in total, with the dominant tree species being Norway spruce (Picea abies (L.) Karsten), silver birch (Betula pendula Roth), and black alder (Alnus glutinosai (L.) Gärtner) at different stages of stand development (hereafter spruce, birch, and alder, respectively), from clear-cuts to mature stands (Table 2). The results of the individual peat-layer thickness measurement replicates varied from 23 cm to ≥100 cm (mean 75 ± 7 cm) in the undrained sites and from 25 cm to ≥100 cm (mean 54 ± 12 cm) in the drained sites.
2.2. Sampling and Laboratory Analysis of Soil and Soil Flux
Soil CO2 flux monitoring was conducted using the manual closed static nontransparent chamber method [19] for 12 consecutive months. Chamber collars were installed at a depth of 5 cm in 5 replicates in each study site. During collar installation, root damage and disturbance of the litter layer were avoided as much as feasible, and GV was left intact throughout the whole monitoring period. Therefore, the flux monitoring represents the CO2 exchange between the soil surface (including vegetation enclosed in the chamber) and the atmosphere, the sum of soil heterotrophic respiration, and the autotrophic respiration of roots and aboveground ground vegetation (Rfloor), respectively. Soil flux was sampled with an interval of 4 weeks from the chambers in each of the collar positions immediately and at 10, 20, and 30 min after positioning the chambers on the collars. The samples were collected using underpressurized (0.3 mbar) glass vials and tested using the gas chromatography method [20]. The atmosphere and soil temperature at a 5 cm depth (Ts), as well as the groundwater level (using a PVC pipe installed up to a depth of 140 cm), were recorded during the soil flux sampling.
The soil samples were collected with 100 cm3 cores from fixed soil depths of 0–10 and 10–20 cm in 2 replicates [21]. The soil samples were prepared according to LVS ISO 11464:2005, and the bulk density was determined according to LVS ISO 11272:2017. The soil chemical parameters were determined using standard methods (Table 3). The content of organic C was calculated by subtracting the value of carbonate C from the total C value. In addition, the soil organic C/total N ratio (C/N ratio) was calculated as a proxy to characterize the decomposition of soil organic matter.
2.3. Estimation of Soil Respiration
The acquired analysis results of the CO2 concentration in the chambers during soil flux sampling were used to calculate the slope values of the linear regression equations characterizing the gas concentration changes over time. The instantaneous Rfloor was calculated using the following equation:
where Rfloor is the instantaneous Rfloor, µg CO2 m2 h−1; M is the molar mass of CO2, 44.01 g mol−1; R is the universal gas constant, 8.314 m3 Pa K−1⋅mol−1; P is the assumption of air pressure inside the chamber, 101,300, Pa; T is the air temperature, K; V is the chamber volume, 0.063 m3; slope is the CO2 concentration changes over time, ppm h−1; and A is the collar area, 0.1995 m2.
The annual Rfloor was estimated by summing the calculated hourly Rfloor. We calculated the hourly Rfloor by interpolating the measured instantaneous Rfloor using the R10 and Q10 parameters [22,23,24], the relationship between the atmospheric temperature and Ts evaluated within the study and the hourly average air temperature data from the nearest meteorological stations. The hourly Rfloor was calculated using the following equation:
where Rfloor is the hourly Rfloor, kg CO2 ha−1 h−1; R10 is the Rfloor at a soil temperature of 10 °C, kg CO ha−1 h−1; Q10 is the temperature sensitivity; and TS is the soil temperature, °C.
The following equation (R2 = 0.81, p < 0.001), elaborated by the results from previous studies [25], was used to recalculate the annual Rfloor to soil heterotrophic respiration (Rhet):
where Rhet is soil heterotrophic respiration, t CO2 ha−1 year−1, and Rs is soil respiration, t CO2 ha−1 year−1.
The annual Rfloor and Rhet were estimated by stratifying the empirical data acquired in the study according to soil moisture regime (undrained and drained), forest land status (forest stand or clear-cut), and forest type (deciduous or coniferous) to allow the application of study the results for the improvement of the national GHG inventory.
2.4. Estimation of Soil C Input by Litter
The LF samples for the estimation of the annual LF biomass were collected using five conically shaped litter traps (surface area 0.5 m2) installed in each study site according to the manual methods and criteria for harmonized sampling, assessment, monitoring, and analysis of the effects of air pollution on forests, prepared on behalf of the Programme Co-ordinating Centre and Task Force of ICP Forests [26]. The samples were collected for 12 consecutive months with an interval of 4 weeks.
Separate above- (aGV) and below-ground ground vegetation (bGV) samples were collected in 4 replicates from 20 cm × 20 cm square fields in each study site at the end of the vegetation season when the vegetation biomass had peaked [23]. The FR production samples were collected using the modified ingrowth core method based on a flexible polyester cylindrical bag (diameter 35 mm) with a mesh size of 2 cm × 2 cm installed 60 cm deep in the soil in three replicates in each study site [27,28]. Mesh bags were installed in autumn and removed from the soil after a year by cutting the roots around the bag. The roots of trees were removed from the collected bGV samples, while the roots of GV were removed from the collected FR samples. The soil particles from both types of below-ground biomass samples were removed by wet sieving.
The litter sample dry matter was determined by oven drying (70 °C) the samples; the C content was analyzed by dry combustion using an element analyzer according to LVS ISO 10694:2006. It was assumed that the biomass of the collected foliar litter, GV, and FR production was equal to the annual mortality and respective soil C input:
where Cinput is the annual soil C input by litter, t ha−1 year−1; m is the dry matter of litter, t; C is the C content of litter, %; and S is the area of the litter sampler (cross-sectional area of root ingrowth bag, area of LF trap, and area of GV collection field), m2.
2.5. Estimation of Forest Soil Annual CSC
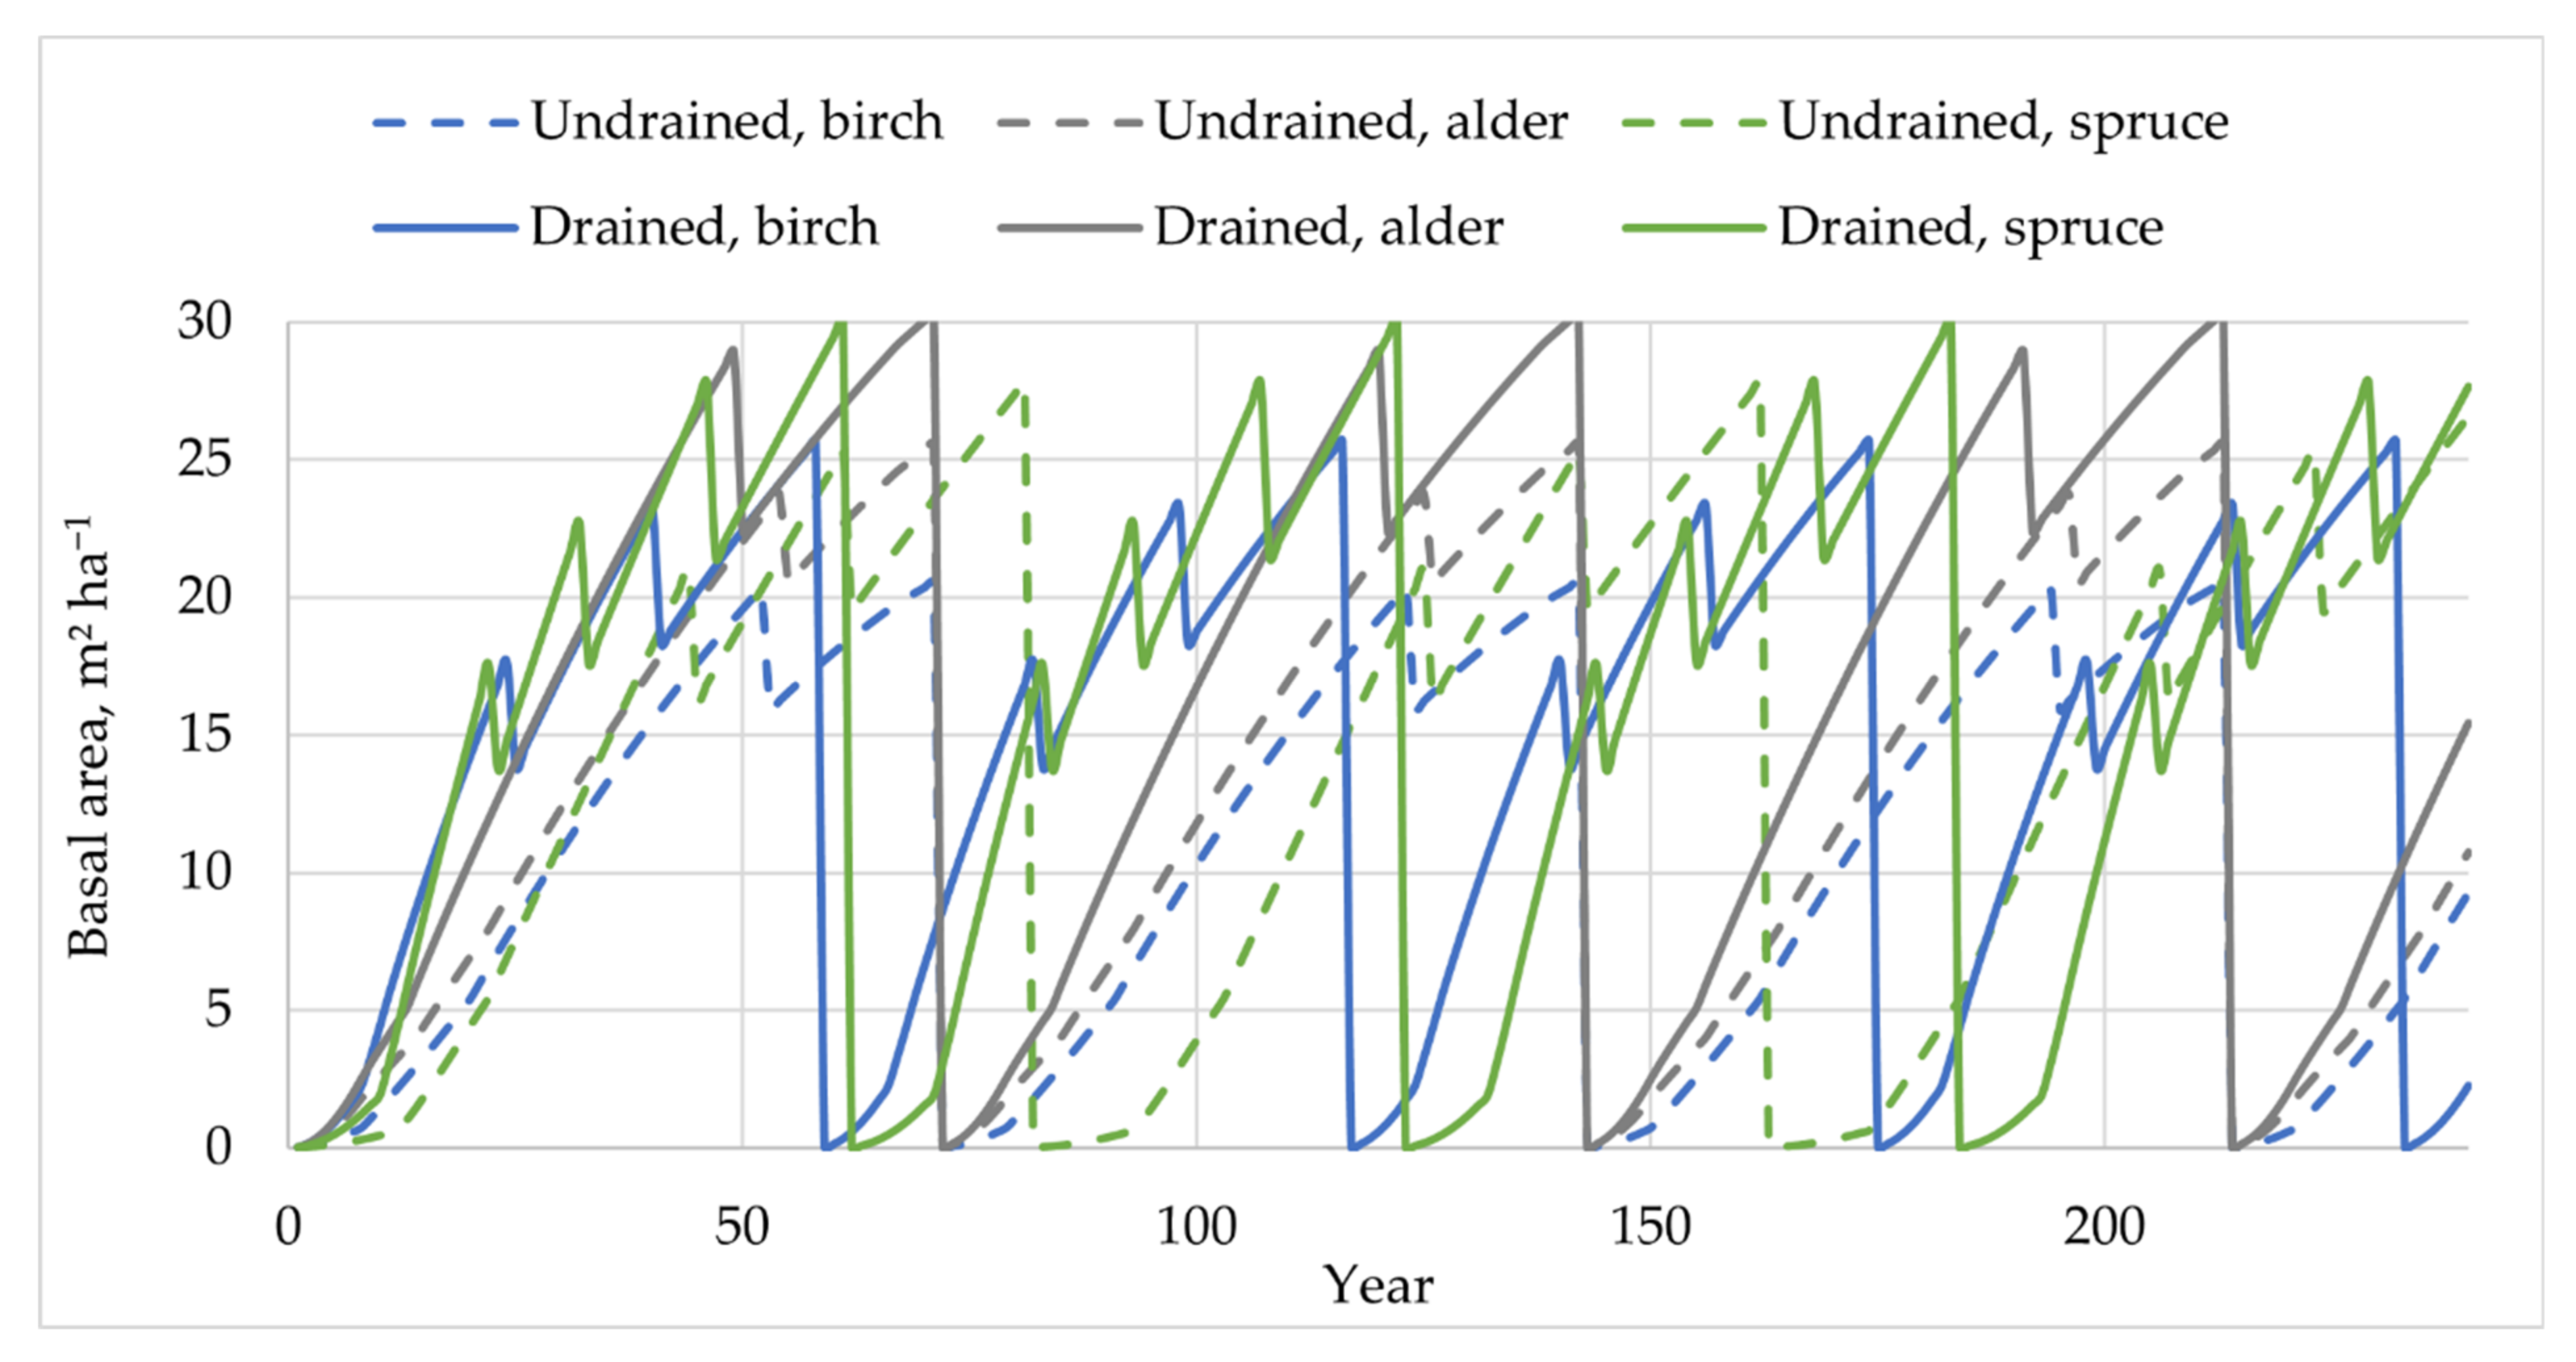
The soil CSC was calculated as the sum of the soil C input by annual biomass mortality (LF, GV, FR, mosses, and shrubs) and soil C loss by Rhet. The estimated soil CSC was expressed as the mean annual CSC within 240 years of forest management in a business-as-usual scenario. Assumptions of yearly stand age and basal area development within a period of 240 years of forest management (including the impact of harvesting), which were used as variables for the annual soil CSC calculations (Figure 2), are based on the National Forest Inventory data and national stand growth models [29,30,31,32].
The assumptions of the yearly dynamics of the basal area were used as variables for the calculation of the annual soil C input according to the study results. The annual LF C input was calculated using equations for the relationship between the basal area and C content in the annual LF biomass, while the annual soil C input by FR and GV was estimated according to forest land status (forest stand or clear-cut). It was assumed that forest stand or clear-cut status could be determined by the national stand basal area thresholds identifying unproductive stands: 6, 4, and 5 m2 ha−1 for spruce, birch, and alder stands, respectively.
The study results for soil C input and Rhet are supplemented by data on the annual litter biomass of dwarf shrubs and mosses. The biomass of shrubs and mosses was calculated using the equations elaborated within a study conducted in boreal forests [33]:
where B(spruce)shrubs and B(broadleaves)shrubs are the aboveground biomass of shrubs in coniferous stands and broadleaves forests (kg ha−1), respectively. B(spruce)moss is the aboveground biomass of moss in coniferous forests (kg ha−1), and B(broadleaves)moss-is the aboveground moss biomass in deciduous forests (kg ha−1). A is stand age (years).
The annual soil C input by shrubs and mosses was calculated with the assumption that the share of C in the biomass was 47.5% [34] and by multiplying the biomass values with a turnover rate of 0.25 and 0.33 for shrubs and mosses, respectively [33]. It was assumed that 70% of the total C input by dwarf shrubs and mosses contributed to belowground biomass mortality [35,36,37].
2.6. Statistical Analysis
Statistical analyses were carried out using R (R version 4.0.3; RStudio version 2022.07.1 + 554). A Mann–Whitney U test was used to compare the differences between the two data groups. The correlations were tested with Spearman’s ρ. A significance level of α = 0.05 was applied in all the tests. The uncertainty of the study results was expressed with confidence intervals (α = 0.05).
3. Results
3.1. Soil Characteristics of the Study Sites
The mean organic C content in the top 20 cm of the soil in the studied stands with drained soil was 48.7 ± 4.0% and 45.5 ± 4.3% in stands with undrained soil. Thus, the soil in the studied stands complies with the definition of organic soil [38]. The mean soil C/N ratios in the drained and undrained soil were 19.4 ± 2.8 and 19.2 ± 2.9, and the soil bulk densities were 420 ± 40 kg m−3 and 435 ± 43 kg m−3, respectively.
3.2. Soil Respiration
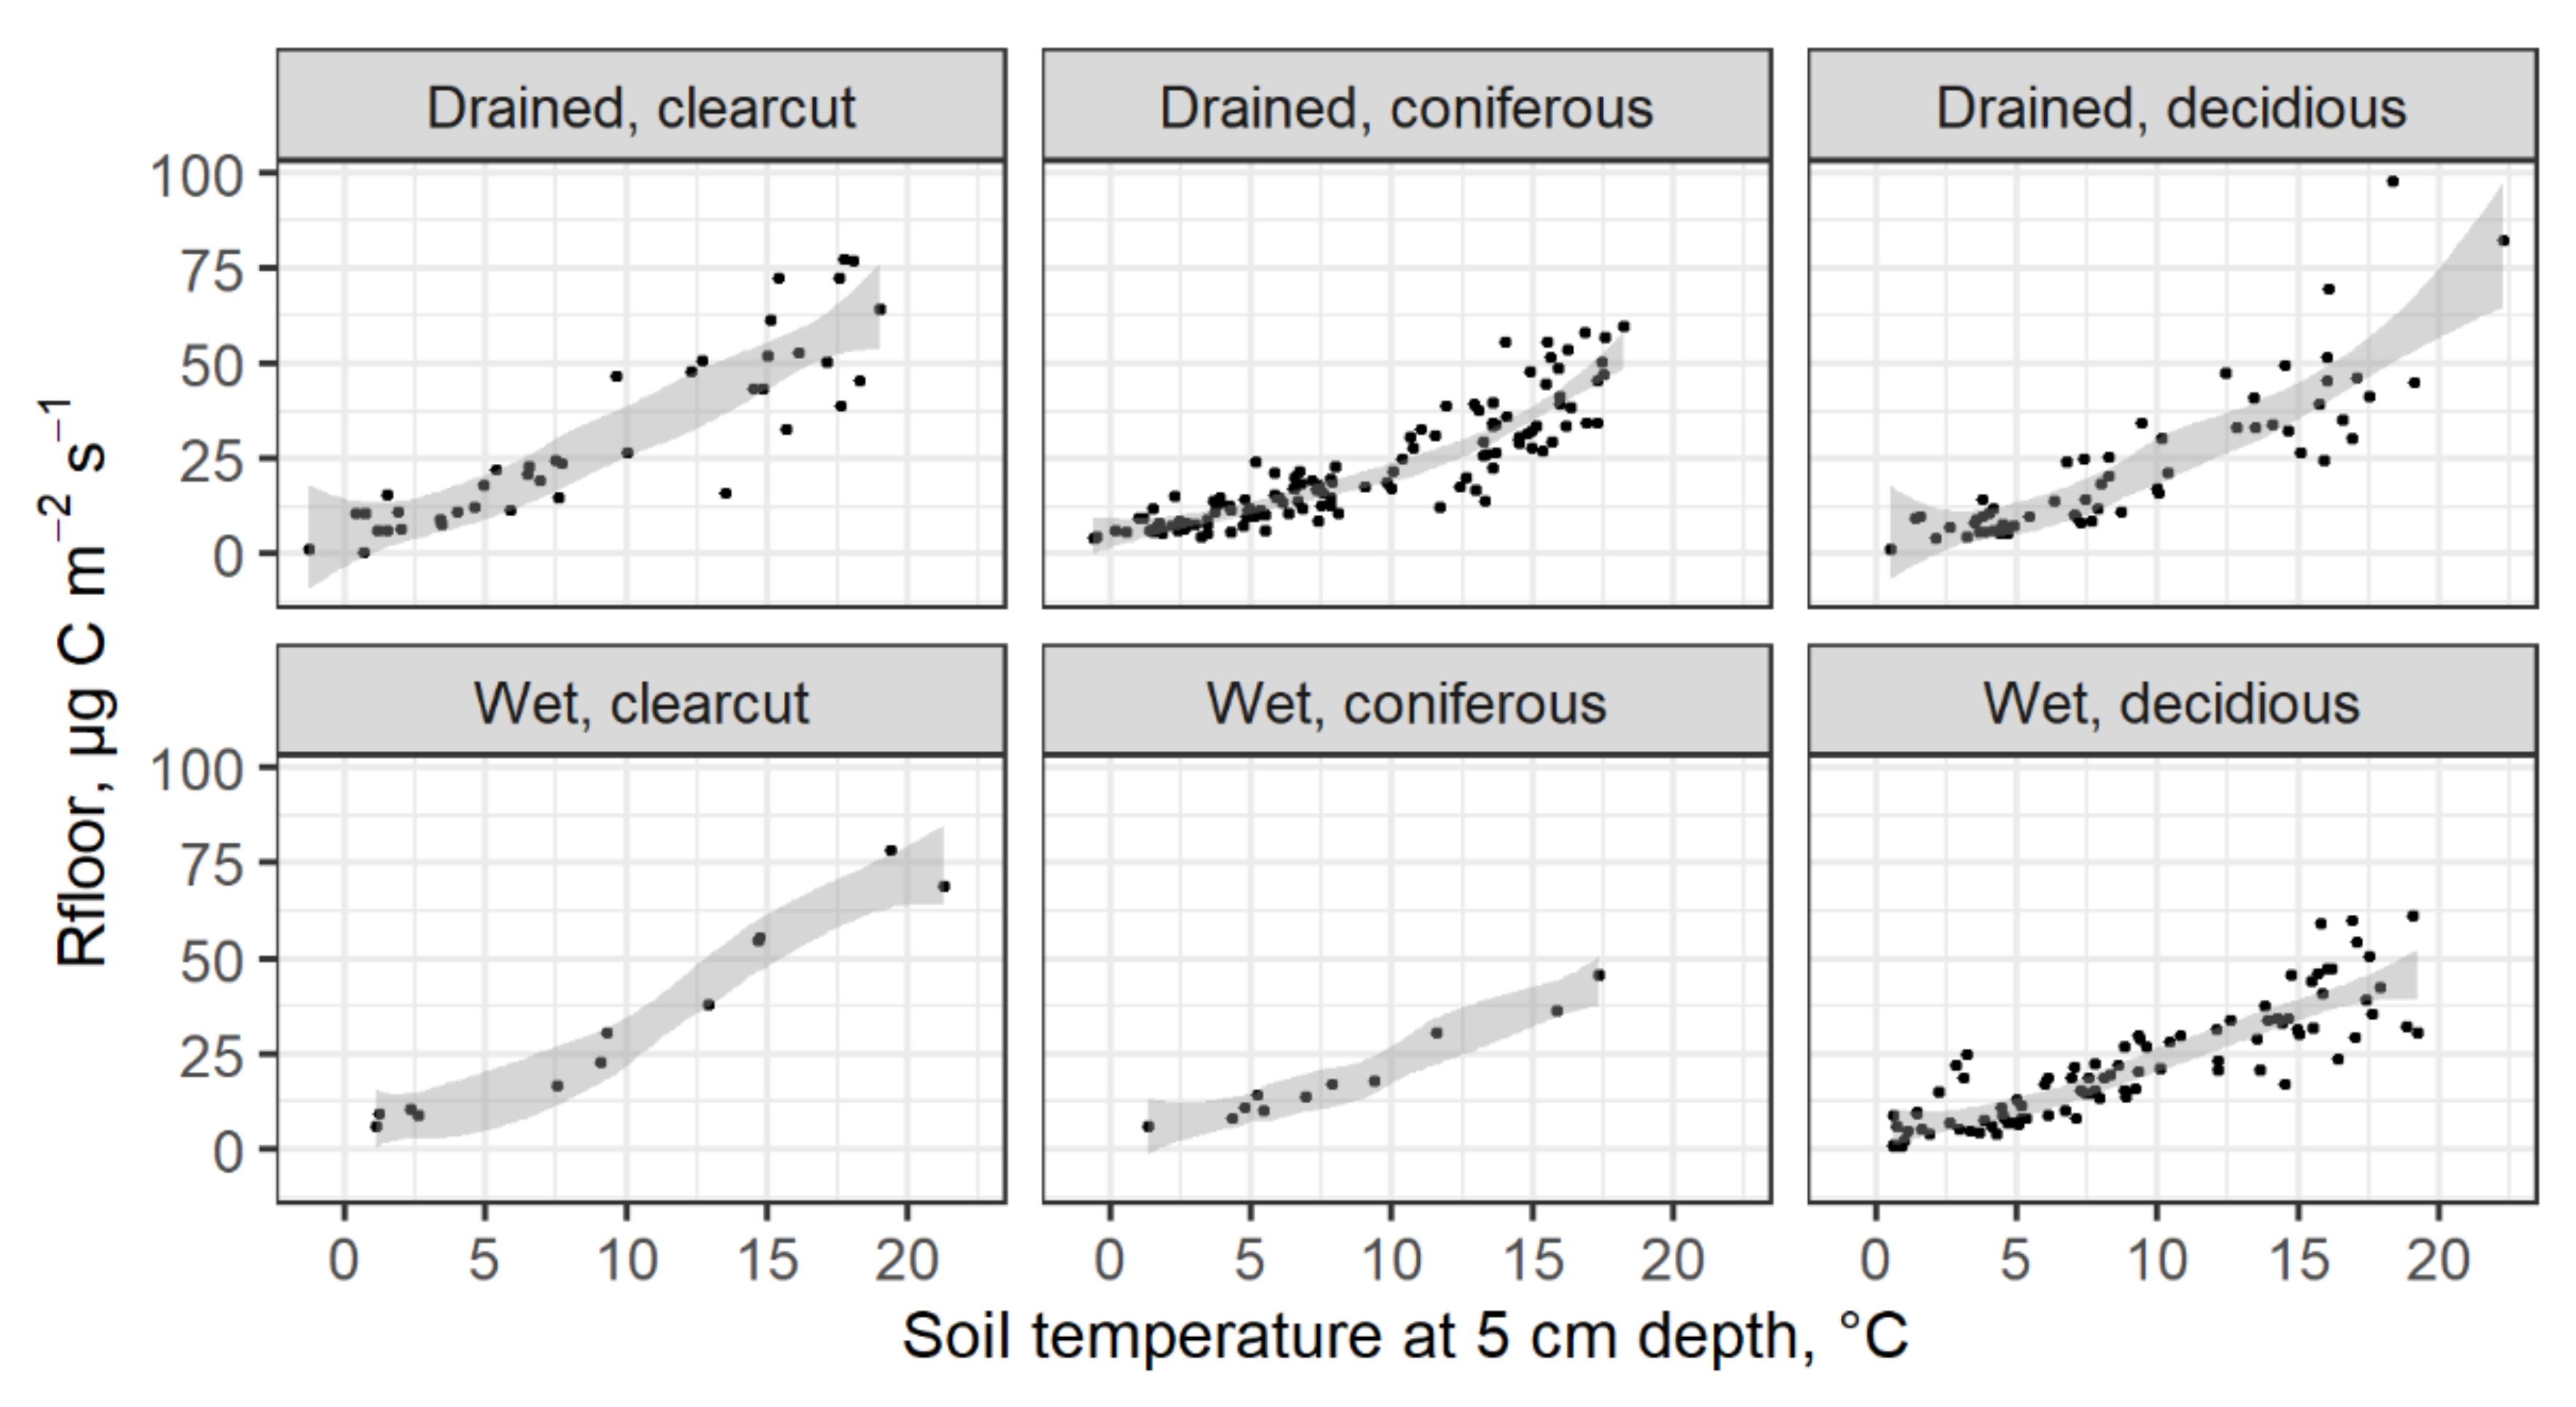
During the soil CO2 flux monitoring period, the measured Ts ranged from −1.3 to 22.3 °C, while the instantaneous Rfloor ranged from 0.6 to 97.8 µg C m−2 s−1 (Figure 3). The highest mean instantaneous emissions were found in clear-cuts. The difference between the measured mean Rfloor in the clear-cuts with drained (31.5 ± 7.0 µg C m−2 s−1) and undrained (33.4 ± 14.4 µg C m−2 s−1) soil is not significantly different. The measured mean Rfloor in the forest stands with different dominant tree species, and the soil moisture regimes were also not significantly different from each other and ranged from 18.5 ± 7.1 µg C m−2 s−1 in spruce stands with undrained soil to 25.9 ± 7.2 µg C m−2 s−1 in birch stands with drained soil. However, the difference between the measured mean Rfloor in the clear-cuts (31.9 ± 62 µg C m−2 s−1) and forest stands (21.7 ± 1.8 µ C m−2 s−1) is significantly different.
The relationship between the Ts and Rfloor can be expressed by exponential regression. The equation (Rfloor = a exp (b Ts) coefficients a and b are summarized in Table 4. According to the study results, the Rfloor tended to be more sensitive to Ts changes in deciduous forests and drained clear-cuts (Q10 from 3.9 to 4.18) as compared to the other study sites, namely, clear-cuts with undrained soils and coniferous forests (Q10 from 3.25 to 3.46).
The annual Rfloor was estimated by applying the prediction models developed by the study and hourly air temperature data within the study period in combination with the observed relationship between the temperature of the atmosphere and Ts (R2 = 0.87, p < 0.05):
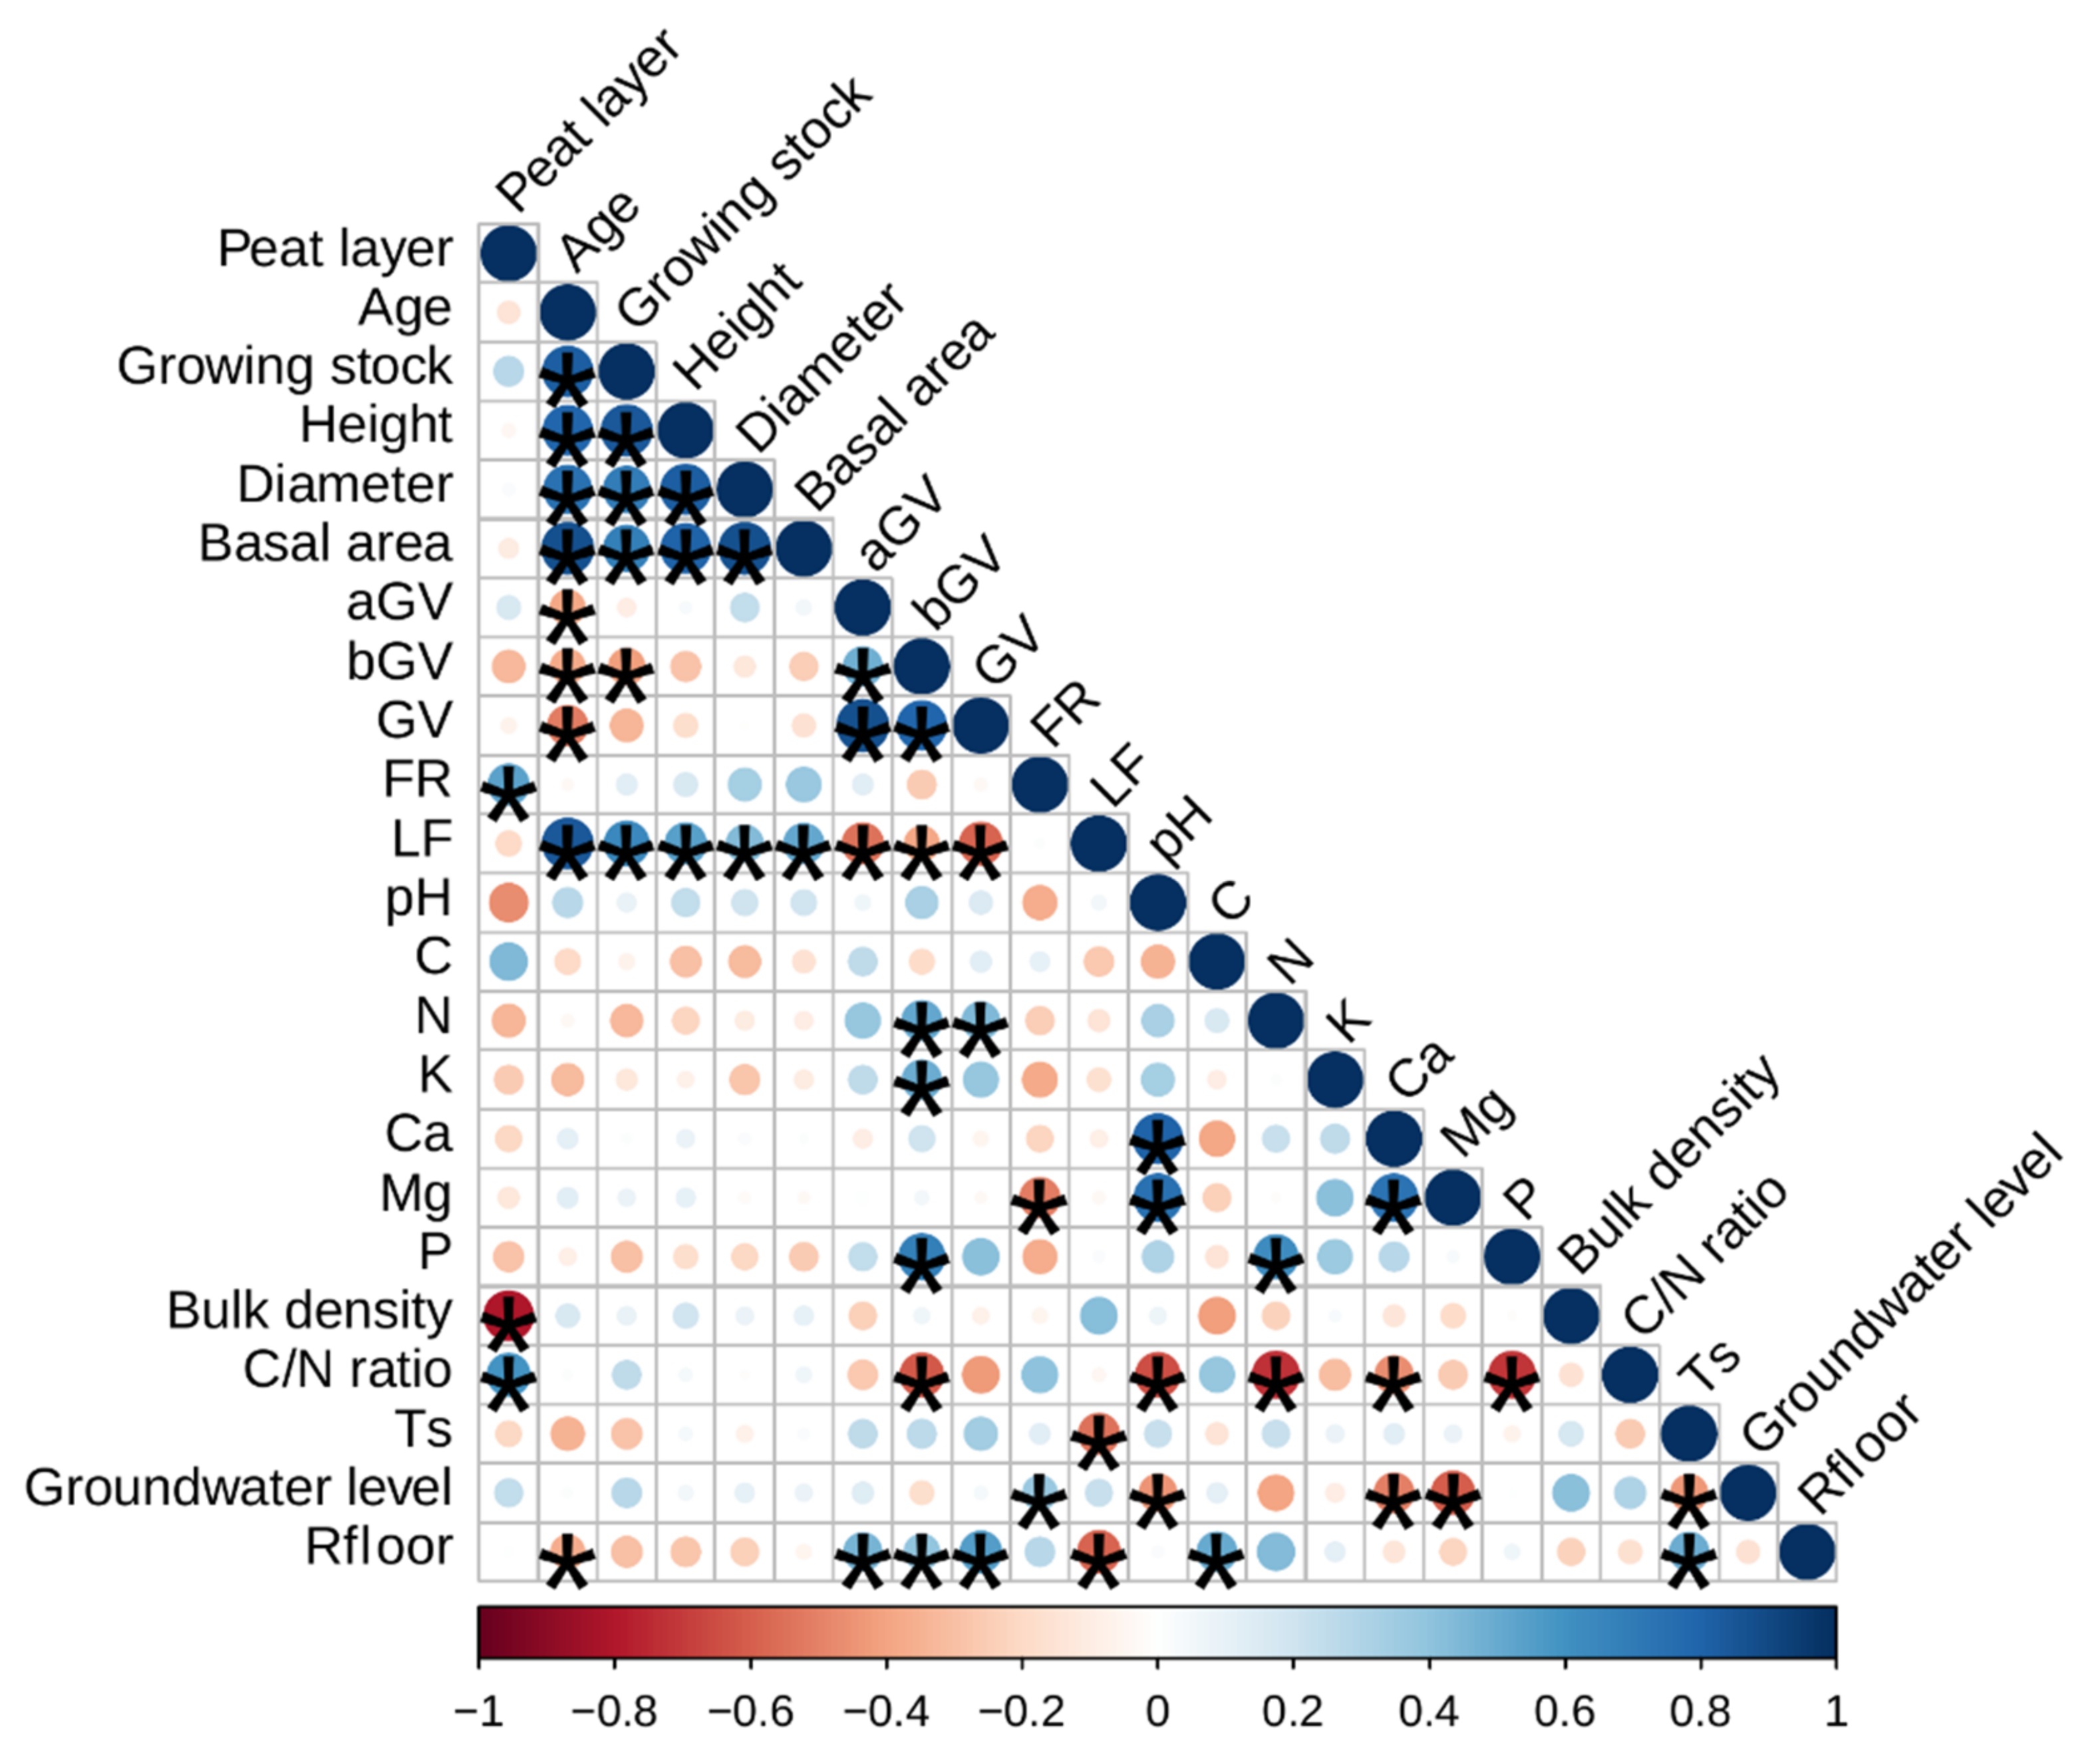
where Ts is the soil temperature at a 5 cm depth, °C, and tair is the air temperature, °C. The estimated annual Rfloor ranged from an average of 5.1 ± 0.2 t C ha−1 year−1 and 5.1 ± 2.6 t C ha−1 year−1 in alder stands with drained soil and birch stands with undrained soils, respectively, to 7.9 ± 3.3 t C ha−1 year−1 in clear-cut stands with undrained soil. The estimated annual mean Rfloor in the forest sites and clear-cuts was 6.2 ± 0.4 t C ha−1 year−1 and 7.7 ± 1.7 t C ha−1 year−1, respectively. The empirical data acquired show a correlation between the Rfloor and GV biomass (r was 0.4 to 0.55 for bGV and GV, respectively). It was also observed that the soil C content (r = 0.51) and LF biomass (r = −0.59) had a moderate correlation with Rfloor, while stand age had a weak (r = −0.36) but significant (p < 0.05) impact on Rfloor (Figure 4).
3.3. Soil C Input by Litter
In the study sites, the aGV (mean C content 47.1 ± 0.7%) and bGV (mean C content 49.7 ± 0.8%) at the end of vegetation season ranged from 6.1 to 8.2 t ha−1 (average 6.9 ± 1.0 t ha−1) in clear-cuts to 1.3 to 6.5 t ha−1 (average 3.5 ± 0.7 t ha−1) in forest stands. While there was no statistically significant relationship identified between the aGV and soil chemical parameter data, the bGV data had a relationship with the parameters indicating soil fertility. The bGV data had a moderate correlation with soil N (r = 0.51), K (r = 0.49), P (r = 0.69) content, and C/N ratio (r = −0.62). Although GV had a moderate correlation (r = 0.51) with stand age, due to the lack of study data available to elaborate models based on stand variables, soil CSC modeling was chosen to be performed by fixed ground vegetation biomass values stratified according to forest land status (forests stand or clear-cut), moisture regime (drained or undrained soil), and dominant tree species (coniferous or deciduous).
The same approach was applied regarding the FR litter data. The estimated FR production in the forest stands ranged from 0.1 to 1.8 t ha−1 (average 0.8 ± 0.2 t ha−1). Although moderate correlations between the estimated FR production and soil fertility characteristics data exist, these relationships were not found to be significant, except in the case of soil Mg content. The study data show that a lower annual average groundwater level tended to increase FR production (r = 0.38).
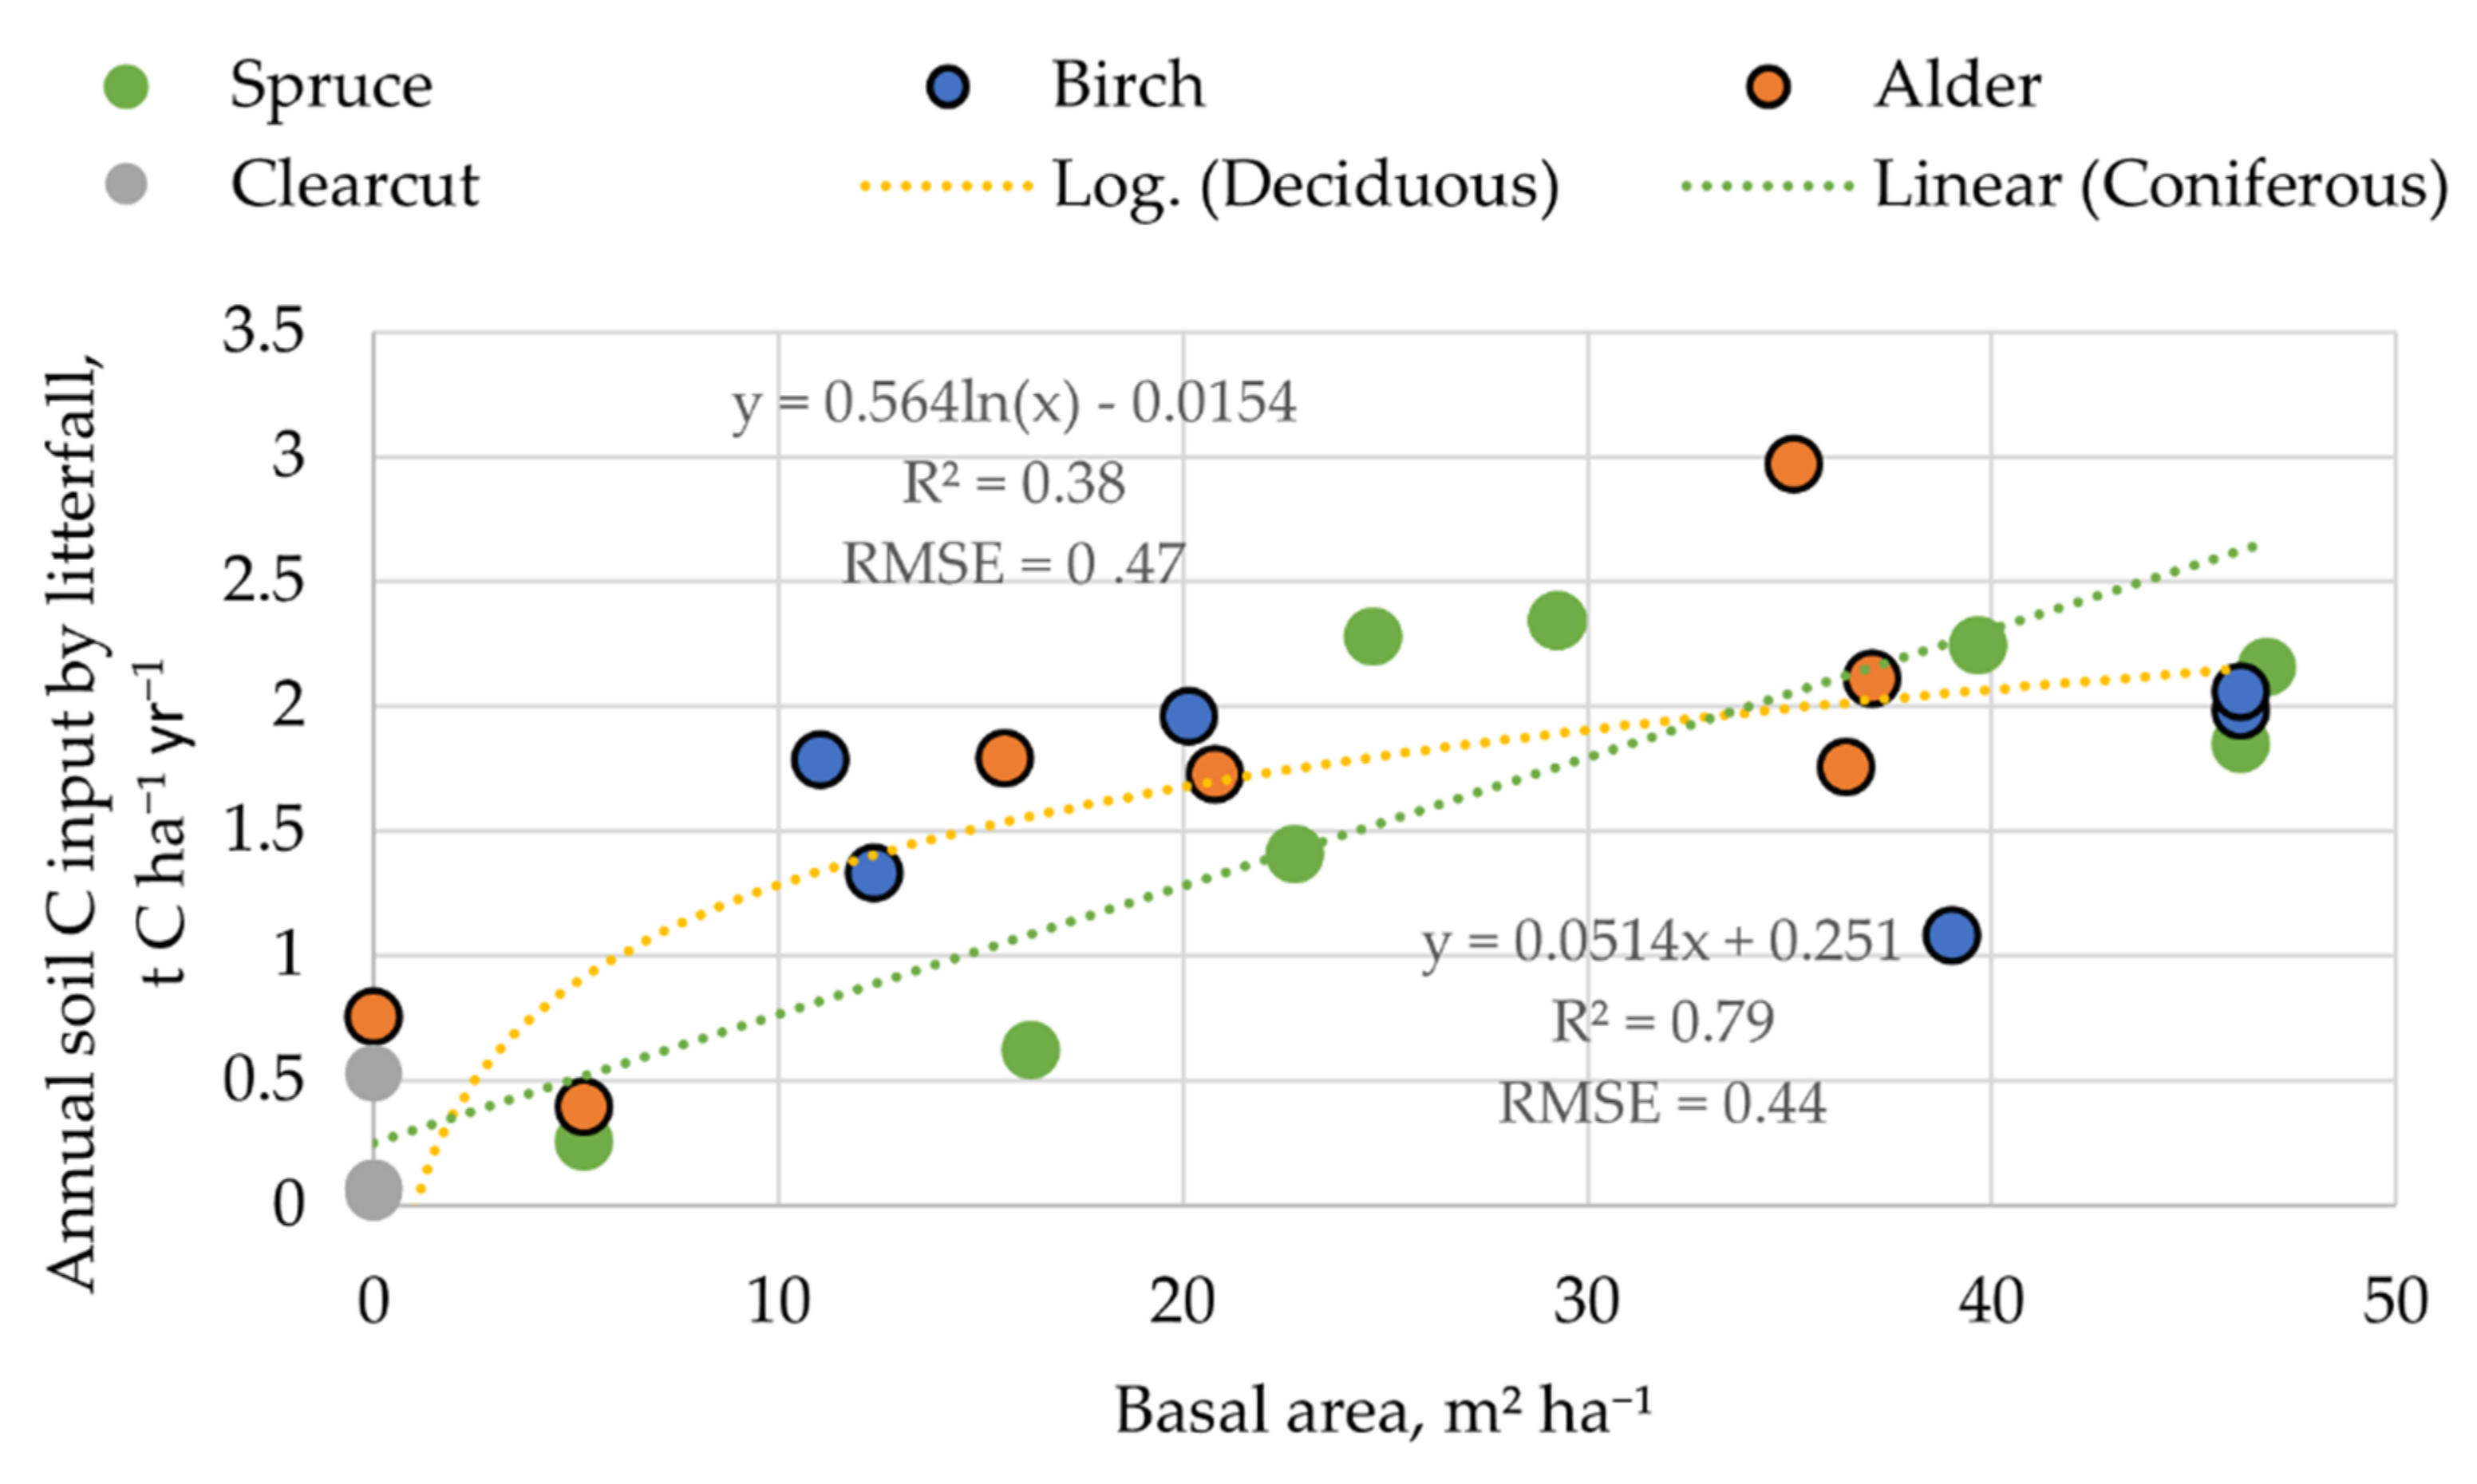
The estimated annual LF biomass ranged from 0.5 to 5.7 t ha−1 (average 3.3 ± 0.5 t ha−1) with a mean C content of 52.1 ± 0.2%. The annual foliar litter biomass data had a moderate (r from 0.44 to 0.65) correlation with average tree diameter, basal area, height, and growing stock (in order of increasing correlation) to a high correlation with stand age (r = 0.84). The basal area was chosen as a predictor for the explanation of the annual foliar litter biomass due to its better representation of the impact of deciduous or coniferous tree species. The annual soil C input by litter in the spruce stands had a linear relationship with the stand basal area; in the study sites, the estimated C input increased from 0.26 to 2.34 t C ha−1 year−1 in stands with a basal area of 8 m2 ha−1 and 45 m2 ha−1. The acquired data suggest that, in the case of deciduous forests, the LF stands had a steeper biomass increase until the basal area reached around 20 m2 ha−1. When the annual C input by litter reaches around 1.5 t C ha−1 year−1, further increases in the basal area have a more gradual impact on litter biomass increases (Figure 5).
3.4. Summary of Estimated Annual Soil CSC
According to the empirical data of the annual average Rfloor recalculated to Rhet and the soil C input estimated in the study, summarized in Table 5, the soil C loss by Rhet is compensated by the annual soil C input in forest stands with drained and undrained soils, while drained and undrained soil in clear-cuts is a net CO2 source.
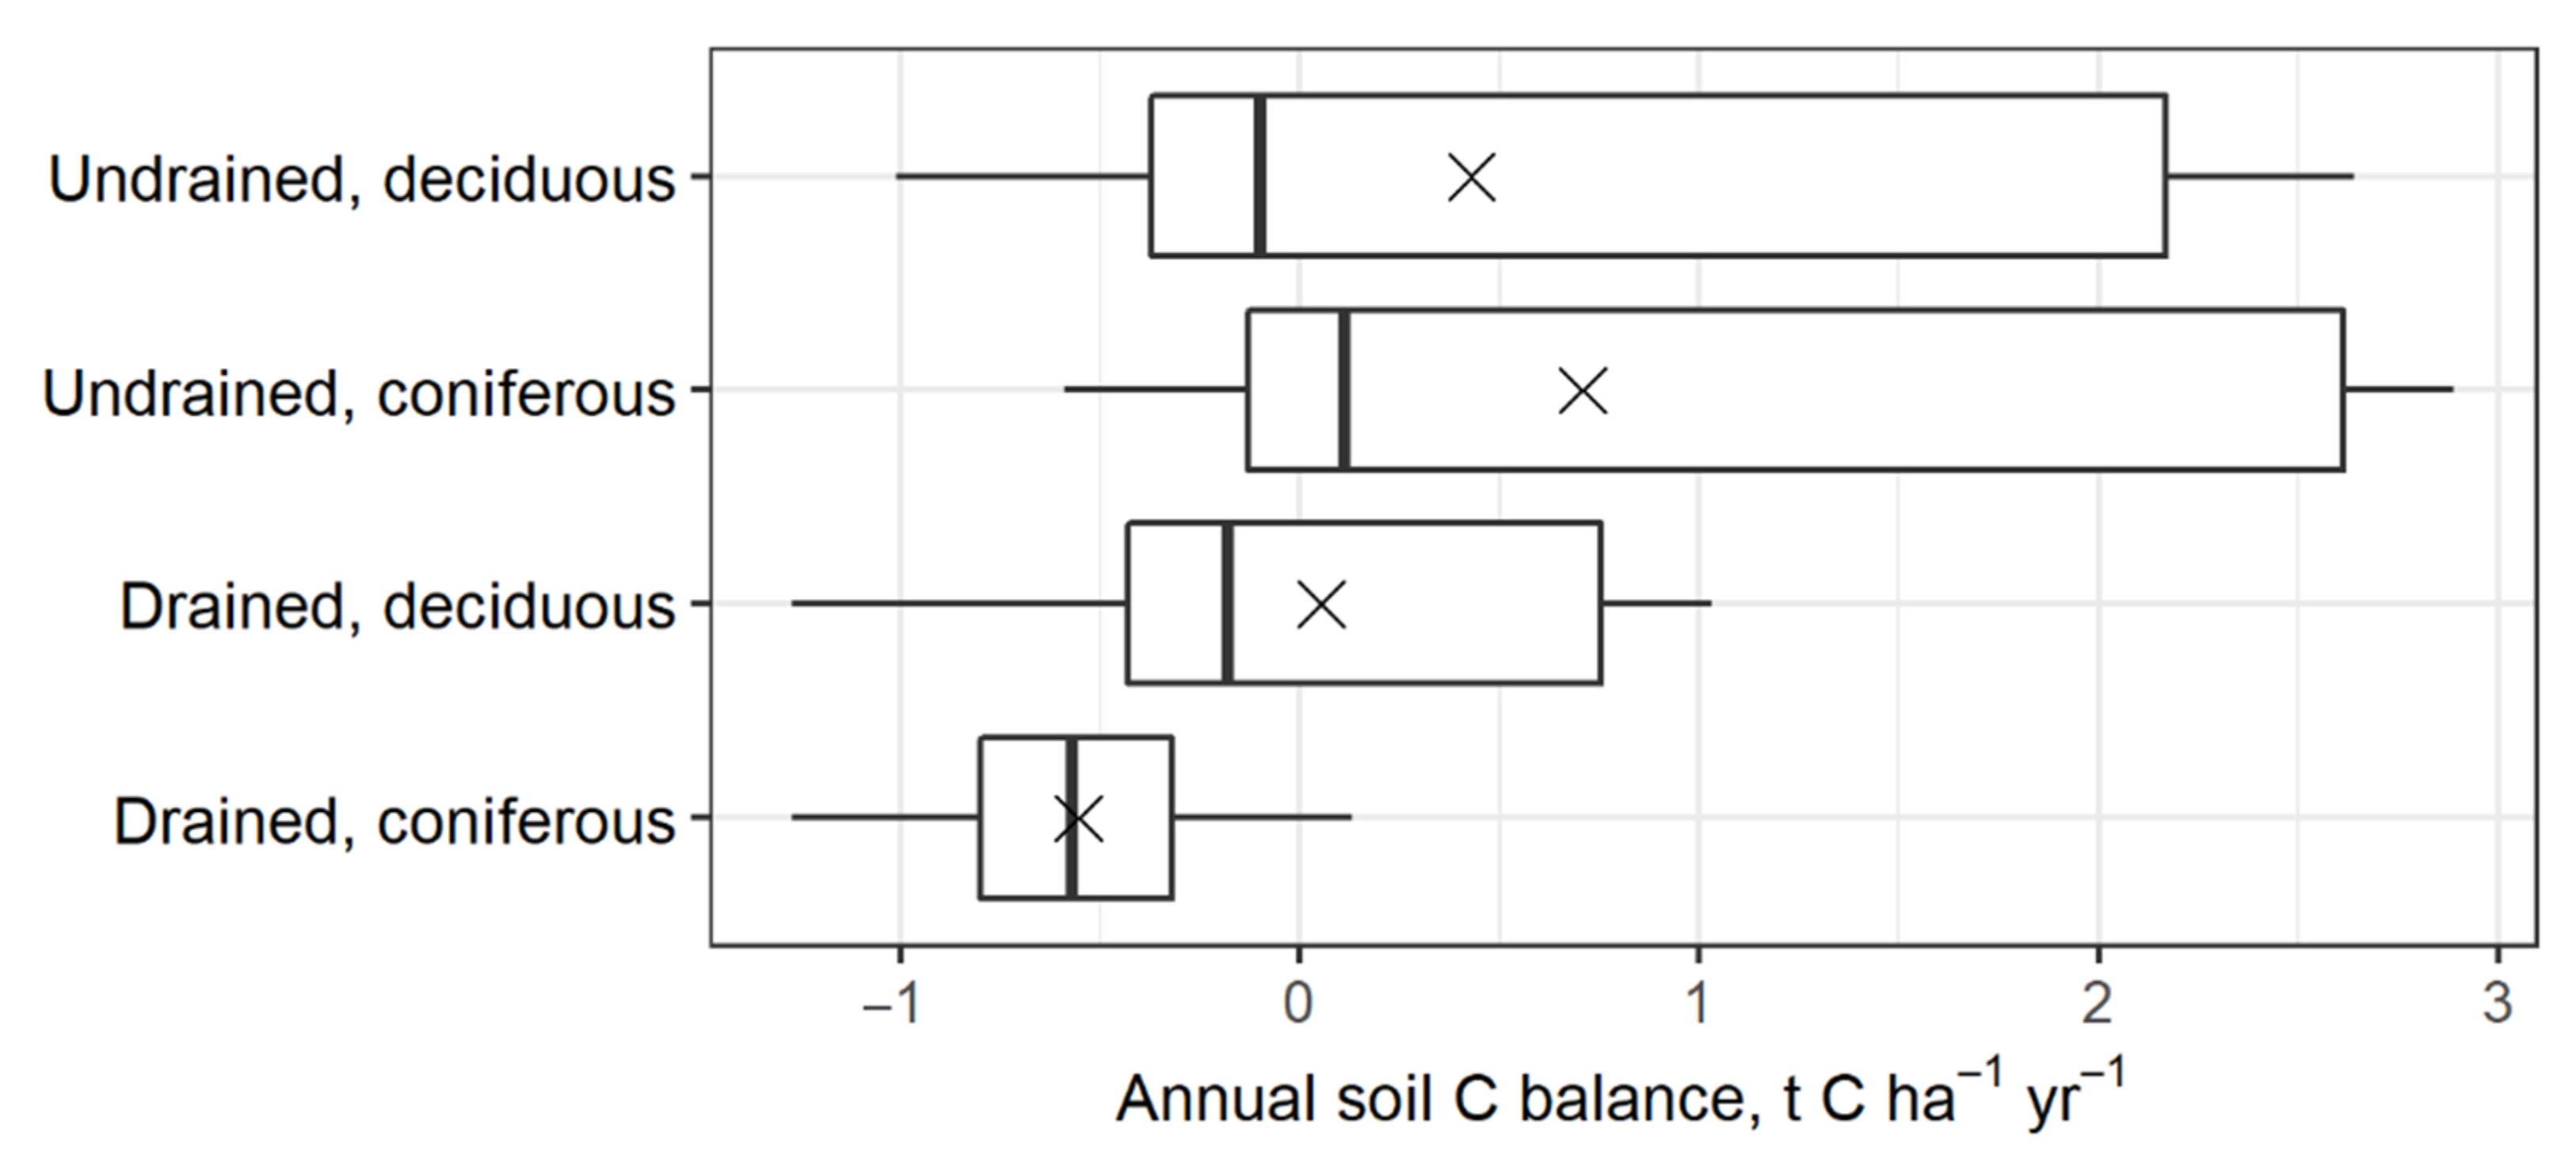
According to the modeling exercise explained in Section 2.4., within a 240-year forest management cycle, the annual soil CSC ranged from −1.0 to 2.6 t C ha−1 year−1 (mean 0.4 t C ha−1 year−1) in deciduous forests and from −0.6 to 2.9 t C ha−1 year−1 (mean 0.7 t C ha−1 year−1) in coniferous forests with undrained soil, whereas in forests with drained soil, the annual net C balance ranged from −1.3 to 1.0 t C ha−1 year−1 (mean 0.1 t C ha−1 year−1) in stands with deciduous-dominant species and from −1.3 to 0.1 t C ha−1 year−1 (mean −0.6 t C ha−1 year−1) in stands with coniferous-dominant species (Figure 6). These results indicate that long-term drainage reduces C uptake by nutrient-rich organic soil in managed forests. After drainage, the soil in deciduous forests may remain C-neutral, but in coniferous forests, the soil may become a CO2 source.
The soil CSC modeling results showed that aboveground litter, on average, contributed to the annual soil C input by 60 ± 4%, of which 40 ± 10% was from LF and 57 ± 9% from aboveground ground vegetation. The main component of the soil C input was GV, contributing 60 ± 7% of the total annual soil C input (Table 6).
4. Discussion
4.1. Method of Rhet Calculation
Previous studies in boreal forests mainly focused on the direct evaluation of Rhet [8]. In our study, the decision to estimate soil respiration by Rfloor measurements is a result of a methodological compromise allowing the acquisition of collected gas sample analysis results for soil CH4 and N2O flux estimates as well [39]. For this reason, in our study, the Rfloor measurements were recalculated to Rhet using an equation elaborated from the data of previous studies. While such an approach may introduce additional uncertainty in the results of Rhet estimates, it allowed us to maintain the simplicity of the soil CSC calculation. Although the use of direct Rhet measurement results would avoid such unknown potential errors, the method (trenching) required to acquire such Rhet data may introduce other errors in the flux estimates due to altered soil conditions [40,41,42]. The soil CSC calculation method based on the Rhet data was also favored by a study that compared different soil CSC estimation methods based on chamber measurements against reference estimates using eddy covariance measurements. In this study, it was concluded that an approach based on Rhet data provided results that agreed better with the reference results, as compared to methods that use Rfloor measurement data [25]. It was found that, although both soil CSC estimation methods are sensitive to biases introduced by the soil C input and output data used in the calculations, the approach based on Rhet data was more applicable due to the relatively simple calculation approach of subtracting Rhet measurement results from the soil C input data, while complicated modeling of ecosystem photosynthesis and respiration is needed to calculate soil CSC using Rfloor measurement data.
To recalculate the study results of the Rfloor for individual study sites to Rhet, a factor ranging from 0.52 to 0.66 (mean 0.6) was used. Therefore, the calculated Rhet may be overestimated, as the equation applied to determine the Rhet/Rfloor recalculation factor was elaborated by comparing the data of Rhet and Rfloor, excluding aboveground autotrophic respiration (Rs), from studies conducted in both boreal and temperate zones [25]. However, such an assumption may be speculative as, according to the data compiled by more recent metanalytical reviews, the Rhet/Rs determined by the trenching method in boreal coniferous forests ranges from 0.36 to 1.03 (mean: 0.73, with a standard deviation of 0.18). Therefore, the approach used to calculate the Rhet in the study may be considered conservative from the GHG inventory perspective as underestimation of soil C loss is not favorable in the elaboration of soil emission factors.
The results of Rhet calculated for individual study sites with forest cover ranging from 2.9 to 4.4 t C ha−1 year−1 fall within the range of results of the Rhet estimated by direct measurement in other studies in boreal forests. The Rhet of forestry-drained peatlands reported in the results of a Finnish study ranges from 1.46 to 6.70 t C ha−1 year−1. [16]. The Rhet estimated in a 30-year-old Scots pine plantation (former cropland) with organic soil situated in the middle of a boreal climatic zone was 4.80 t C ha−1 year−1 [43], while the quantified Rhet of 12 afforested organic soil cropland sites and six cutaway peatlands in Finland ranged from 2.07 to 5.39 t C ha−1 year−1 and from 2.76 to 4.79 t C ha−1 year−1, respectively [44]. The results of another study carried out in Finland showed an average Rhet of 2.38 t C ha−1 year−1 in a pine-dominated drained mire. It was estimated that the annual Rhet of forestry-drained peatlands in central Estonia and southern and northern Finland ranges from 2.48 to 5.15 t C ha−1 year−1 [13]. The consistency of the Rhet estimated in our study with previously reported values indicates that the use of the Rfloor recalculation method is applicable for studies conducted in the hemiboreal zone.
4.2. Soil Respiration
In our study, the difference between the mean measured instantaneous Rfloor in drained sites (7.35 ± 0.89 t C ha−1 year−1) and undrained (7.02 ± 0.96 t C ha−1 year−1) forest stand sites were found to be insignificant (p = 0.34). However, the differences between the measured mean instantaneous Rfloor in forest stands (6.84 ± 0.56 t C ha−1 year−1) and clear-cuts (10.08 ± 1.96 t C ha−1 year−1) were significant (p = 0.002). The tendency of similar soil respiration in drained and undrained sites, as well as increased emissions in areas with no forest cover, was also observed in a previous study. For instance, in afforested lowland raised peat bogs in Scotland, it was found that Rfloor was slightly higher in drained sites (4.53 t C ha−1 year−1) compared to undrained sites (3.35 t C ha−1 year−1), while in undrained areas with no forest cover, the estimated Rfloor was 6.95 t C ha−1 year−1 [45].
In our case, the insignificant difference between average soil respiration in drained and undrained study sites is mainly determined by the absence of correlation between the measurement data of the Rfloor and groundwater level. The average groundwater level in the drained study sites (mean 55 ± 2 cm) was on average 18 ± 2 cm deeper than in the undrained sites (mean 35 ± 3 cm); however, the groundwater level measurement results have weak, insignificant correlation (r = 0.3) with soil respiration data. We were not able to find empirical reasons for having a significantly higher soil respiration rate in clear-cut study sites compared to sites with forest cover. By evaluating the data of Ts and atmospheric temperature measurements, we observed that there was no higher Ts sensitivity to variation in atmospheric temperature. Linear regression models of characterizing the relationship between Ts and soil temperature in forest stands and clear-cuts were not statistically significant. Therefore, we concluded that Ts response to changes in atmospheric temperature was not different in both study site groups and increased warming of soil in clear-cuts was not the reason for elevated soil respiration. Most likely, the increased emissions are induced by soil disturbances of mechanized harvesting [46] and the decomposition of harvesting residues [47].
The annual Rfloor in clear-cuts with peaty gley soil, estimated by the previous study as ranging from 6.5 ± 1.6 to 7.1 ± 1.7 t C ha−1 year−1 [48], which is similar to our estimation of the annual Rfloor in drained and undrained clear-cuts, i.e., 7.6 ± 2.2 and 7.9 ± 1.2 t C ha−1 year−1, respectively. Additionally, the estimated Rfloor in the study sites with forest cover, which ranged from 4.4 to 8.0 t C ha−1 year−1, is similar to the range of the Rfloor estimated in other studies (2.73 ± 0.55 to 5.18 ± 1.09 t C ha−1 year−1) conducted in boreal forests [49,50]. Furthermore, the mean Rfloor was found to be significantly higher in drained coniferous forests with organic soil (from 2.45 to 5.18 t C ha−1 year−1) than in undrained mire forest sites (from 2.18 to 3.27 t C ha−1 year−1), although the drained sites were all moist [51]. This may be in line with the observations made in our study that the groundwater level may have no significant impact on Rfloor. Additionally, in a study aimed at creating soil respiration prediction models, it was concluded that by adding the water table depth into the models as an explanatory variable, the goodness of fit was not improved and the prediction power was not statistically significantly improved [52]. Even though, in some cases, the average water table depth can be significantly correlated with annual respiration values in peatlands [53], soil temperature alone is generally sufficient to explain the variation in soil respiration. The reasons why groundwater level can be used as a Rfloor predictor only in some areas can be further studied.
4.3. Soil C Input by Litter
The study results of the average annual soil C input by LF in drained and undrained forests with nutrient-rich organic soils ranging from 1.6 ± 0.3 to 2.2 ± 0.4 C ha−1 year−1, respectively, are within the uncertainty range of the average observed values in the coniferous and deciduous forests of Northern Europe, 1.7 ± 1.1 and 1.5 ± 0.7 t C ha−1 year−1, respectively [54]. While similar relationship tendencies with the basal area have been recognized, higher estimated values of the average soil C input by LF of coniferous (1.82 ± 0.02 t C ha−1 year−1) and silver birch stands (2.07 ± 0.03 t C ha−1 year−1) with drained organic soils were found in a recent Latvian study [55]. This points out that the average soil C input values used in the estimates of forest C balance or comparison of litterfall biomass across different studies can lead to considerable inaccuracies. In our study, as well as in a previous local study [55], it is recognized that basal area provides the highest prediction power of litterfall biomass compared to other commonly used forest stand characteristics. Therefore, the variation in the LF data acquired in the study can be explained with the basal area of the forest stands studied. A limited number of study sites restricted the ability to compare the relationship between the basal area and LF in the drained and undrained sites separately.
The mean tree fine-root production, ranging from 0.6 ± 0.6 t ha−1 year−1 in drained deciduous forests to 1.0 ± 0.2 t C ha−1 year−1 in undrained coniferous forests with nutrient-rich organic soil, as estimated in this study, is significantly lower than those mostly reported in previous studies. The mean fine-root production reported for Northern Europe was 2.84 ± 1.52 t ha−1 year−1 in coniferous forests and 1.99 ± 1.01 t ha−1 year−1 in deciduous forests [56]. Lower estimated fine-root production values may be explained by methodological underestimation or the phenomenon whereby the growth of trees in nutrient-rich soil requires less biomass of the fine roots to ensure a sufficient intake of water and nutrients. Higher fine-root productivity in stands with less fertile soils has been noticed in several studies [22,57,58,59]; however, the opposite relationship has also been found [60]. Such assumptions may also be contradicted by the annual fine-root production in forests with drained nutrient-rich soil, which ranged from 1.81 to 3.02 t ha−1 year−1, as reported in an Estonian study [12]. Most likely, the reason for underestimation arises from methodology, as the average uncertainty of acquired results also ranges from 30 to 161 % (mean 71 %) in study sites with different dominant tree species and soil moisture regimes. The study period of one year was not sufficient for fine root production estimates by the ingrowth method, as one vegetation season was not sufficient to mitigate the effects of disturbance introduced by the installation of ingrowth bags.
The annual soil C input by GV has not been studied extensively, and the available results are often not comparable due to different study methods and the different vegetation components included in the calculations. In Estonia, the estimated primary production of dwarf shrubs and grasses reached 0.4 t C ha−1 year−1 in spruce stands and ranged from 0.6 to 1.0 t C ha−1 year−1 in pine stands [22]. By using the biomass of herbs and grasses, the prediction models elaborated by a study conducted in Finland [33], taking into account the age distribution of Latvian forests, the average weighted annual soil C input by aGV and bGV ranged from 0.34 ± 0.01 to 1.29 ± 0.202 t C ha−1 year−1 in birch and pine stands with drained organic soil, respectively [55]. The higher annual soil C input by herbs and grasses, which ranged from 0.6 to 3.2 t C ha−1 year−1 in forest stands and from 2.9 to 4.0 t C ha−1 year−1 in clear-cuts estimated in our study, can be explained by the forest site types characterized by nutrient-rich soils included in this study and the positive correlation found between GV biomass and soil fertility characteristics.
4.4. Annual Net Soil CSC
According to general opinion, the drainage of organic soil increases CO2 emissions and reduces soil C stock; however, the results of previous studies on the effect of organic soil drainage on GHG emissions are ambiguous. The empirical data collected during this study shows that nutrient-rich organic soil in forest stands is a net CO2 sink, but the soil in clear-cuts is a net CO2 source. We estimated that during the study period, the average annual soil CSCs were 0.4 ± 0.4 t C ha−1 year−1 in undrained and 0.1 ± 0.4 t C ha−1 year−1 in drained forest sites, while in clear-cut estimated soil net C balance is −0.9 ± 0.7 and −0.4 ± t C ha−1 year−1 in drained and undrained sites, respectively. The observation of soil in forest stands acting as a C sink is in agreement with the conclusion reached in a previous local study on the CSC of drained moderately nutrient-rich forest soils [14] and can be explained by site productivity induced increased C input by litter that fully compensates soil C loss by respiration. The reason for soil in clear-cuts being a C source was increased C loss by respiration and reduced soil C input by litter. Although mean soil C input by ground biomass in clear-cuts (3.55 ± 0.37 t C ha−1 year−1) was considerably higher than in forest stands (1.65 ± 0.40 t C ha−1 year−1), that did not compensate for the increase in Rhet by average 0.8 t C ha−1 year−1 compared to forest sites and the absence of C input by litterfall (average 1.8 ± 0.5 t C ha−1 year−1) and the fine roots of trees (0.4 ± 0.2 t C ha−1 year−1).
In addition to calculating the annual soil CSCs as a sum of soil C balance components quantified in a monitoring year of the study, we modeled an inter-annual soil CSC within a 240-year forest management period by using variables of stand characteristics as predictors. As a result, by taking into account the impact of forest stand development (age and basal area) and the stages of forest land (forest stand and clear-cut), the average soil CSC with high variability was estimated. The range of estimated annual soil CSCs is mainly determined by two soil C balance components with high inter-annual variability determined by the stage of forest stand development—LF and ground GV. The most significant impact on variability is introduced by GV, which determines on average 63% of the total soil C input by litter, while LF impacts on average 24% of annual soil C input. Empirical data with the highest uncertainty is soil C input by FR, aGV, and bGV with confidence intervals of 71%, 41%, and 37%. The annual soil C input by GV ranges from an average of 1.68 ± 0.36 to 4.88 ± 1.40 t C ha−1 year in clear-cuts and forest stands with various dominant tree species signifying the importance of reducing the uncertainty of annual soil CSC estimations introduced by data on GV.
The results of the study are in line with the previous studies, which showed that the soil C stock does not change and can even increase after the drainage of organic soil in boreal forests [11,24,33,34]. It can be expected that soil respiration may be considerably higher in nutrient-rich site types compared to site types with less fertile soils [13], which may lead forests with fertile drained organic soils to be a source of CO2 emissions for the following reason. The Rfloor of forestry-drained peatlands estimated in Finland showed a clear diminishing trend in annual soil respiration from the most to the least fertile site types, and ranged from 3.8 to 12.10 t C ha−1 year−1 [16]. However, the results of this study indicate that both undrained and drained nutrient-rich organic soil in forest stands can still be a net C sink. The differences in the calculated annual soil CSC across various studies may be due to the different methods applied and the inclusion of different soil C input components in the calculations [52], as well as the uncertainty of these values, since the data available, especially for belowground litter, are highly uncertain, most often due to difficulties in acquiring such data [56]. For example, drained forest peatlands were identified as a CO2 source also in Sweden; however, the estimated annual soil C loss of −2.29 t C ha−1 year−1, calculated by subtracting Rhet from the soil C input [61], is considerably higher than that in our study, whereas in Finland, peatlands drained for forestry were found to be a net CO2 sink (removals from 0.2 to 0.252 t C ha−1 year−1) estimated by the soil C inventory method [62]. In our study, the inclusion of forest land status as a clear-cut estimation of annual soil CSC determined if nutrient-rich drained organic forest soil acts as a CO2 sink or source. The differences highlight the importance of harmonizing soil CSC estimation methods to improve the comparability of country-level GHG inventory results.
The results of soil CSC acquired in this study can be further improved by both more extensive studies and by conducting direct Rhet measurements or evaluating the proportion of Rhet/Rfloor under national conditions. Instead of using static annual soil C input value, approaches to model inter-annual litter biomass variations based on forest stand variables and climatic conditions should be elaborated for the estimation of soil C balance by offsetting the annual Rhet modeled using the annual data of air or soil temperature. The inter-annual variation in hourly or diurnal temperature data may have a significant impact on modeling soil respiration using previously elaborated equations characterizing the relationship between soil respiration and soil or atmosphere temperature. The choice of using temperature data of one year or time period characterizing climate, as well as the use of daily mean or hourly mean temperature data, may have a considerable impact on soil respiration modeling results, which should be considered in future studies.
5. Conclusions
The drained and undrained nutrient-rich organic soils in the forest stands monitored for one year in this study were a CO2 sink, while the soil in clear-cuts acted as a CO2 source. The soil in clear-cuts acting as a CO2 source was determined by increased soil respiration rates and the absence of soil C input by litterfall and the fine roots of trees. The significantly increased soil C input by ground vegetation in clear-cuts mitigated this effect; however, the significantly increased soil respiration rate and reduced soil C input by other sources were not fully compensated. If forest management cycles are considered, including forest land state as a clear-cut, drained nutrient-rich organic soil in managed forests is a CO2 source, while the soil C stock increases in undrained soil, according to the methodology applied in the CSC calculations.
Author Contributions
Conceptualization, A.L.; methodology, A.L.; data curation and analysis, A.B. (Aldis Butlers); writing—original draft preparation, A.B. (Aldis Butlers); writing—review and editing, S.K. and A.B. (Arta Bārdule); supervision, A.L. All authors have read and agreed to the published version of the manuscript.
Funding
This publication was co-financed by the European Regional Development Fund, Project No. 1.1.1.1/19/A/064: ‘Development of greenhouse gas emission factors and decision support tools for management of peatlands after peat extraction’.
Institutional Review Board Statement
Not applicable.
Informed Consent Statement
Not applicable.
Data Availability Statement
Not applicable.
Acknowledgments
Many thanks to the personnel of the LSFRI Silava Laboratory of Forest Environment for their help in field sampling and conducting the sample analyses and to the LIFE project OrgBalt (No. LIFE18 CCM/LV/001158) teams for their support in the fieldwork and data analysis. Work of A.B. (Aldis Butlers) was supported by the European Social Fund within the project (No. 8.2.2.0/20/I/001) “LLU Transition to a new funding model of doctoral studies”. Contribution of A.L. is covered by the ERDF project ‘Economic and environmental assessment of biomass production in buffer zones around drainage systems and territories surrounding the protective belts of natural water streams’ (No. 1.1.1.2/VIAA/3/19/437). Contribution of A.B. (Arta Bārdule) and S.K. was supported by the ERDF project ‘Development of greenhouse gas emission factors and decision support tools for management of peatlands after peat extraction’ (No. 1.1.1.1/19/A/064).
Conflicts of Interest
The authors declare no conflict of interest.
References
- Keith, H.; Lindenmayer, D.; MacKey, B.; Blair, D.; Carter, L.; McBurney, L.; Okada, S.; Konishi-Nagano, T. Managing Temperate Forests for Carbon Storage: Impacts of Logging versus Forest Protection on Carbon Stocks. Ecosphere 2014, 5, 1–34. [Google Scholar] [CrossRef] [Green Version]
- Krug, J.H.A. Accounting of GHG Emissions and Removals from Forest Management: A Long Road from Kyoto to Paris. Carbon Balance Manag. 2018, 13, 1–11. [Google Scholar] [CrossRef] [Green Version]
- Lundmark, T.; Bergh, J.; Nordin, A.; Fahlvik, N.; Poudel, B.C. Comparison of Carbon Balances between Continuous-Cover and Clear-Cut Forestry in Sweden. Ambio 2016, 45, 203–213. [Google Scholar] [CrossRef] [Green Version]
- Pohjanmies, T.; Triviño, M.; Le Tortorec, E.; Mazziotta, A.; Snäll, T.; Mönkkönen, M. Impacts of Forestry on Boreal Forests: An Ecosystem Services Perspective. Ambio 2017, 46, 743–755. [Google Scholar] [CrossRef]
- Luyssaert, S.; Inglima, I.; Jung, M.; Richardson, A.D.; Reichstein, M.; Papale, D.; Piao, S.L.; Schulze, E.D.; Wingate, L.; Matteucci, G.; et al. CO2 Balance of Boreal, Temperate, and Tropical Forests Derived from a Global Database. Glob. Chang. Biol. 2007, 13, 2509–2537. [Google Scholar] [CrossRef] [Green Version]
- Mayer, M.; Prescott, C.E.; Abaker, W.E.A.; Augusto, L.; Cécillon, L.; Ferreira, G.W.D.; James, J.; Jandl, R.; Katzensteiner, K.; Laclau, J.P.; et al. Influence of Forest Management Activities on Soil Organic Carbon Stocks: A Knowledge Synthesis. For. Ecol. Manag. 2020, 466, 118127. [Google Scholar] [CrossRef]
- Kekkonen, H.; Ojanen, H.; Haakana, M.; Latukka, A.; Regina, K. Mapping of Cultivated Organic Soils for Targeting Greenhouse Gas Mitigation. Carbon Manag. 2019, 10, 115–126. [Google Scholar] [CrossRef] [Green Version]
- Jauhiainen, J.; Alm, J.; Bjarnadottir, B.; Callesen, I.; Christiansen, J.R.; Clarke, N.; Dalsgaard, L.; He, H.; Jordan, S.; Kazanavičiūtė, V.; et al. Reviews and Syntheses: Greenhouse Gas Exchange Data from Drained Organic Forest Soils. A Review of Current Approaches and Recommendations for Future Research. Biogeosci. Discuss. 2019, 16, 4687–4703. [Google Scholar] [CrossRef] [Green Version]
- Paquel, K.; Bowyer, C.; Allen, B.; Nesbit, M.; Martineau, H.; Lesschen, J.P.; Arets, E. Analysis of LULUCF Actions in EU Member States as Reported under Art. 10 of the LULUCF Decision Final Study; Publications Office of the European Union: Brussels, Belgium, 2017. [Google Scholar]
- Lohila, A.; Minkkinen, K.; Aurela, M.; Tuovinen, J.P.; Penttilä, T.; Ojanen, P.; Laurila, T. Greenhouse Gas Flux Measurements in a Forestry-Drained Peatland Indicate a Large Carbon Sink. Biogeosciences 2011, 8, 3203–3218. [Google Scholar] [CrossRef] [Green Version]
- Meyer, A.; Tarvainen, L.; Nousratpour, A.; Björk, R.G.; Ernfors, M.; Grelle, A.; Kasimir Klemedtsson, Å.; Lindroth, A.; Räntfors, M.; Rütting, T.; et al. A Fertile Peatland Forest Does Not Constitute a Major Greenhouse Gas Sink. Biogeosciences 2013, 10, 7739–7758. [Google Scholar] [CrossRef]
- Uri, V.; Kukumägi, M.; Aosaar, J.; Varik, M.; Becker, H.; Morozov, G.; Karoles, K. Ecosystems Carbon Budgets of Differently Aged Downy Birch Stands Growing on Well-Drained Peatlands. For. Ecol. Manag. 2017, 399, 82–93. [Google Scholar] [CrossRef]
- Minkkinen, K.; Laine, J.; Shurpali, N.J.; Mäkiranta, P.; Alm, J.; Penttilä, T. Heterotrophic Soil Respiration in Forestry-Drained Peatlands. Boreal Environ. Res. 2007, 12, 115–126. [Google Scholar]
- Lupikis, A.; Lazdins, A. Soil Carbon Stock Changes in Transitional Mire Drained for Forestry in Latvia: A Case Study. Res. Rural Dev. 2017, 1, 55–61. [Google Scholar] [CrossRef]
- Bārdule, A.; Gerra-Inohosa, L.; Kļaviņš, I.; Kļaviņa, Z.; Bitenieks, K.; Butlers, A.; Lazdiņš, A.; Lībiete, Z. Variation in the Mercury Concentrations and Greenhouse Gas Emissions of Pristine and Managed Hemiboreal Peatlands. Land 2022, 11, 1414. [Google Scholar] [CrossRef]
- Ojanen, P.; Minkkinen, K.; Alm, J.; Penttilä, T. Soil-Atmosphere CO2, CH4 and N2O Fluxes in Boreal Forestry-Drained Peatlands. For. Ecol. Manag. 2010, 260, 411–421. [Google Scholar] [CrossRef]
- Skrebele, A.; Lupkina, L.; Cakars, I.; Siņics, L.; Lazdāne-Mihalko, J.; Puļķe, A.; Klavs, G.; Gračkova, L.; Lazdiņš, A.; Butlers, A.; et al. Latvia’s National Inventory Report—Submission under UNFCCC and the Kyoto Protocol; Ministry of Environmental Protection and Regional Development of the Republic of Latvia: Riga, Latvia, 2022.
- Bušs, K. Forest Ecology and Typology; Zinātne: Rīga, Latvija, 1981. [Google Scholar]
- Hutchinson, G.L.; Livingston, G.P. Use of Chamber Systems to Measure Trace Gas Fluxes. Agric. Ecosyst. Eff. Trace Gases Glob. Clim. Chang. 1993, 55, 63–78. [Google Scholar]
- Loftfield, N.; Flessa, H.; Augustin, J.; Beese, F. Automated Gas Chromatographic System for Rapid Analysis of the Atmospheric Trace Gases Methane, Carbon Dioxide, and Nitrous Oxide. J. Environ. Qual. 1997, 26, 560. [Google Scholar] [CrossRef]
- Cools, N.; De Vos, B. Sampling and Analysis of Soil, Manual Part X; ICP Forests: Hamburg, Germany, 2010; ISBN 9783865761620. [Google Scholar]
- Kriiska, K.; Frey, J.; Asi, E.; Kabral, N.; Uri, V.; Aosaar, J.; Varik, M.; Napa, Ü.; Apuhtin, V.; Timmusk, T.; et al. Variation in Annual Carbon Fluxes Affecting the SOC Pool in Hemiboreal Coniferous Forests in Estonia. For. Ecol. Manag. 2019, 433, 419–430. [Google Scholar] [CrossRef]
- Kukumägi, M.; Ostonen, I.; Uri, V.; Helmisaari, H.S.; Kanal, A.; Kull, O.; Lõhmus, K. Variation of Soil Respiration and Its Components in Hemiboreal Norway Spruce Stands of Different Ages. Plant Soil 2017, 414, 265–280. [Google Scholar] [CrossRef]
- Varik, M.; Kukumägi, M.; Aosaar, J.; Becker, H.; Ostonen, I.; Lõhmus, K.; Uri, V. Carbon Budgets in Fertile Silver Birch (Betula Pendula Roth) Chronosequence Stands. Ecol. Eng. 2015, 77, 284–296. [Google Scholar] [CrossRef]
- Bond-Lamberty, B.; Wang, C.; Gower, S.T. A Global Relationship between the Heterotrophic and Autotrophic Components of Soil Respiration? Glob. Chang. Biol. 2004, 10, 1756–1766. [Google Scholar] [CrossRef]
- Sampling and Analysis of Litterfall. Available online: https://storage.ning.com/topology/rest/1.0/file/get/9995559487?profile=original (accessed on 15 August 2022).
- Bhuiyan, R.; Minkkinen, K.; Helmisaari, H.S.; Ojanen, P.; Penttilä, T.; Laiho, R. Estimating Fine-Root Production by Tree Species and Understorey Functional Groups in Two Contrasting Peatland Forests. Plant Soil 2017, 412, 299–316. [Google Scholar] [CrossRef]
- Laiho, R.; Bhuiyan, R.; Straková, P.; Mäkiranta, P.; Badorek, T.; Penttilä, T. Modified Ingrowth Core Method plus Infrared Calibration Models for Estimating Fine Root Production in Peatlands. Plant Soil 2014, 385, 311–327. [Google Scholar] [CrossRef]
- Lupiķis, A.; Lazdiņš, A. Soil Carbon Balance on Drained and Afforested Transitional Bog in Forest Research Station Vesetnieki in Latvia. In EGU General Assembly Conference Abstracts; EGU: Munich, Germany, 2015; Volume 17. [Google Scholar]
- Bardulis, A.; Lupiķis, A.; Stola, J. Carbon Balance in Forest Mineral Soils in Latvia Modelled with Yasso07 Soil Carbon Model. Res. Rural Dev. 2017, 1, 28–34. [Google Scholar] [CrossRef]
- Lazdiņš, A.; Petaja, G.; Kārkliņa, I. Verification of applicability of forest growth model AGM in elaboration of forestry projections for national forest reference level. In Proceedings of the 9th International Scientific Conference Rural Development 2019, Kaunas, Lithuania, 26–28 September 2019; Raupelienė, A., Ed.; Vytautas Magnus University: Kaunas, Lithuania, 2019. [Google Scholar] [CrossRef]
- Lazdiņš, A.; Lupiķis, A.; Butlers, A.; Bārdule, A.; Kārkliņa, I. Elaboration of Forest Reference Level for Latvia Dor Period between 2021 and 2025; Ministry of Agriculture of Republic of Latvia: Riga, Latvia, 2018.
- Muukkonen, P.; Mäkipää, R. Empirical Biomass Models of Understorey Vegetation in Boreal Forests According to Stand and Site Attributes. Boreal Environ. Res. 2006, 11, 355–369. [Google Scholar]
- FAO. Knowledge Reference for National Forest Assessments; FAO: Rome, Italy, 2015; ISBN 9789253088324. [Google Scholar]
- Mälkönen, E. Annual Primary Production and Nutrient Cycle in Some Scots Pine Stands. Commun. Inst. For. Fenn. 1974, 84, 1–87. [Google Scholar]
- Havas, P.; Kubin, E. Structure, Growth and Organic Matter Content in the Vegetation Cover of an Old Spruce Forest in Northern Finland. In Annales Botanici Fennici; Finnish Botanical Publishing Board: Helsinki, Finland, 1983; pp. 115–149. [Google Scholar]
- Palviainen, M.; Finér, L.; Mannerkoski, H.; Piirainen, S.; Starr, M. Responses of Ground Vegetation Species to Clear-Cutting in a Boreal Forest: Aboveground Biomass and Nutrient Contents during the First 7 Years. Ecol. Res. 2005, 20, 652–660. [Google Scholar] [CrossRef]
- Eggleston, H.; Buendia, L.; Miwa, K.; Ngara, T.; Tanabe, K. 2006 IPCC Guidelines for National Greenhouse Gas Inventories, Prepared by the National Greenhouse Gas Inventories Programme; IGES: Kanagawa, Japan, 2006. [Google Scholar]
- Butlers, A.; Bārdule, A.; Spalva, G.; Muižniek, E. N2O and CH4 emissions from naturally wet and drained nutrient-rich organic forest soils. In Proceedings of the 10th International Scientific Conference Rural Development; Vytautas Magnus University, Kaunas, Lithuania, 21–23 September 2021. [Google Scholar]
- Subke, J.A.; Inglima, I.; Cotrufo, M.F. Trends and Methodological Impacts in Soil CO2 Efflux Partitioning: A Metaanalytical Review. Glob. Chang. Biol. 2006, 12, 921–943. [Google Scholar] [CrossRef]
- Kuzyakov, Y.; Friedel, J.K.; Stahr, K. Review of Mechanisms and Quantification of Priming Effects. Soil Biol. Biochem. 2000, 32, 1485–1498. [Google Scholar] [CrossRef]
- Ngao, J.; Longdoz, B.; Granier, A.; Epron, D. Estimation of Autotrophic and Heterotrophic Components of Soil Respiration by Trenching Is Sensitive to Corrections for Root Decomposition and Changes in Soil Water Content. Plant Soil 2007, 301, 99–110. [Google Scholar] [CrossRef]
- Lohila, A.; Laurila, T.; Aro, L.; Aurela, M.; Tuovinen, J.P.; Laine, J.; Kolari, P.; Minkkinen, K. Carbon Dioxide Exchange above a 30-Year-Old Scots Pine Plantation Established on Organic-Soil Cropland. Boreal Environ. Res. 2007, 12, 141–157. [Google Scholar]
- Mäkiranta, P.; Hytönen, J.; Aro, L.; Maljanen, M.; Pihlatie, M.; Potila, H.; Shurpali, N.J.; Laine, J.; Lohila, A.; Martikainen, P.J.; et al. Soil Greenhouse Gas Emissions from Afforested Organic Soil Croplands and Cutaway Peatlands. Boreal Environ. Res. 2007, 12, 159–175. [Google Scholar]
- Yamulki, S.; Anderson, R.; Peace, A.; Morison, J.I.L. Soil CO2 CH4 and N2O Fluxes from an Afforested Lowland Raised Peatbog in Scotland: Implications for Drainage and Restoration. Biogeosciences 2013, 10, 1051–1065. [Google Scholar] [CrossRef] [Green Version]
- James, J.; Harrison, R. The Effect of Harvest on Forest Soil Carbon: A Meta-Analysis. Forests 2016, 7, 308. [Google Scholar] [CrossRef]
- Jandl, R.; Lindner, M.; Vesterdal, L.; Bauwens, B.; Baritz, R.; Hagedorn, F.; Johnson, D.W.; Minkkinen, K.; Byrne, K.A. How Strongly Can Forest Management Influence Soil Carbon Sequestration? Geoderma 2007, 137, 253–268. [Google Scholar] [CrossRef]
- Ball, T.; Smith, K.A.; Moncrieff, J.B. Effect of Stand Age on Greenhouse Gas Fluxes from a Sitka Spruce [Picea Sitchensis (Bong.) Carr.] Chronosequence on a Peaty Gley Soil. Glob. Chang. Biol. 2007, 13, 2128–2142. [Google Scholar] [CrossRef]
- Klemedtsson, L.; Ernfors, M.; Björk, R.G.; Weslien, P.; Rütting, T.; Crill, P.; Sikström, U. Reduction of Greenhouse Gas Emissions by Wood Ash Application to a Picea Abies (L.) Karst. Forest on a Drained Organic Soil. Eur. J. Soil Sci. 2010, 61, 734–744. [Google Scholar] [CrossRef]
- Von Arnold, K.; Nilsson, M.; Hånell, B.; Weslien, P.; Klemedtsson, L. Fluxes of CO2, CH4 and N2O from Drained Organic Soils in Deciduous Forests. Soil Biol. Biochem. 2005, 37, 1059–1071. [Google Scholar] [CrossRef]
- Von Arnold, K.; Weslien, P.; Nilsson, M.; Svensson, B.H.; Klemedtsson, L. Fluxes of CO2, CH4 and N2O from Drained Coniferous Forests on Organic Soils. For. Ecol. Manag. 2005, 210, 239–254. [Google Scholar] [CrossRef]
- Ojanen, P.; Minkkinen, K.; Lohila, A.; Badorek, T.; Penttilä, T. Chamber Measured Soil Respiration: A Useful Tool for Estimating the Carbon Balance of Peatland Forest Soils? For. Ecol. Manag. 2012, 277, 132–140. [Google Scholar] [CrossRef]
- Silvola, J.; Alm, J.; Ahlholm, U.; Nykanen, H.; Martikainen, P.J. CO2 Fluxes from Peat in Boreal Mires under Varying Temperature and Moisture Conditions. J. Ecol. 1996, 84, 219–228. [Google Scholar] [CrossRef]
- Neumann, M.; Ukonmaanaho, L.; Johnson, J.; Benham, S.; Vesterdal, L.; Novotný, R.; Verstraeten, A.; Lundin, L.; Thimonier, A.; Michopoulos, P.; et al. Quantifying Carbon and Nutrient Input From Litterfall in European Forests Using Field Observations and Modeling. Glob. Biogeochem. Cycles 2018, 32, 784–798. [Google Scholar] [CrossRef]
- Bārdule, A.; Petaja, G.; Butlers, A.; Purviņa, D.; Lazdiņš, A. Estimation of Litter Input in Hemi-Boreal Forests with Drained Organic Soils for Improvement of GHG Inventories. Balt. For. 2021, 27, 2. [Google Scholar] [CrossRef]
- Neumann, M.; Godbold, D.L.; Hirano, Y.; Finér, L. Improving Models of Fine Root Carbon Stocks and Fluxes in European Forests. J. Ecol. 2020, 108, 496–514. [Google Scholar] [CrossRef] [Green Version]
- Lehtonen, A.; Palviainen, M.; Ojanen, P.; Kalliokoski, T.; Nöjd, P.; Kukkola, M.; Penttilä, T.; Mäkipää, R.; Leppälammi-Kujansuu, J.; Helmisaari, H.-S. Modelling Fine Root Biomass of Boreal Tree Stands Using Site and Stand Variables. For. Ecol. Manag. 2016, 359, 361–369. [Google Scholar] [CrossRef]
- Leppälammi-Kujansuu, J.; Aro, L.; Salemaa, M.; Hansson, K.; Kleja, D.B.; Helmisaari, H.-S. Fine Root Longevity and Carbon Input into Soil from Below- and Aboveground Litter in Climatically Contrasting Forests. For. Ecol. Manag. 2014, 326, 79–90. [Google Scholar] [CrossRef]
- Mäkelä, A.; Pulkkinen, M.; Mäkinen, H. Bridging Empirical and Carbon-Balance Based Forest Site Productivity—Significance of below-Ground Allocation. For. Ecol. Manag. 2016, 372, 64–77. [Google Scholar] [CrossRef]
- Helmisaari, H.-S.; Derome, J.; Nojd, P.; Kukkola, M. Fine Root Biomass in Relation to Site and Stand Characteristics in Norway Spruce and Scots Pine Stands. Tree Physiol. 2007, 27, 1493–1504. [Google Scholar] [CrossRef] [PubMed] [Green Version]
- Von Arnold, K.; Hånell, B.; Stendahl, J.; Klemedtsson, L. Greenhouse Gas Fluxes from Drained Organic Forestland in Sweden. Scand. J. For. Res. 2005, 20, 400–411. [Google Scholar] [CrossRef]
- Minkkinen, K.; Korhonen, R.; Savolainen, I.; Laine, J. Carbon Balance and Radiative Forcing of Finnish Peatlands 1900–2100—The Impact of Forestry Drainage. Glob. Chang. Biol. 2002, 8, 785–799. [Google Scholar] [CrossRef]
Figure 1.
Location of study sites and closest meteorological stations with the indicated radius of 30 km.
Figure 1.
Location of study sites and closest meteorological stations with the indicated radius of 30 km.

Figure 2.
Assumptions of stand basal area dynamics within a 240-year forest management cycle.

Figure 3.
Relationship between soil temperature and Rfloor. Confidence intervals are shown around the smooth lines.
Figure 3.
Relationship between soil temperature and Rfloor. Confidence intervals are shown around the smooth lines.

Figure 4.
Correlation analysis of the soil C stock balance components and affecting factors. Size and color of the bubbles indicate correlation strength; starred bubbles show significant (p ≤ 0.05) correlations.
Figure 4.
Correlation analysis of the soil C stock balance components and affecting factors. Size and color of the bubbles indicate correlation strength; starred bubbles show significant (p ≤ 0.05) correlations.

Figure 5.
Relationship between C stock in annual foliar litter and stand basal area.

Figure 6.
Inter-annual soil CSC variation within a 240-year forest management cycle. In the boxplots, the median is shown by the bold line; the mean is shown by the cross; the box corresponds to the lower and upper quartiles; whiskers show the minimal and maximal values (within 150% of the interquartile range from the median).


Table 1.
Dominant ground vegetation in the study sites.
| Forest Site Type | Ground Vegetation |
|---|---|
| Dryopterioso-caricosa | Thelypteris palustris Schott, Carex (L.), Iris pseudacorus (L.) Fuss, Scirpus (L.), Lysimachia vulgaris (L.), Cirsium oleraceum (L.) Scopoli, Filipendula ulmaria (L.) Maximowicz, Angelica sylvestris (L.) |
| Filipendulosa | Filipendula ulmaria (L.), Urtica dioica (L.), Geum rivale (L.), Paris quadrifolia (L.), Caltha palustris (L.), Solanum dulcamara (L.) |
| Oxalidosa turf. mel. | Cirsium oleraceum (L.) Scopoli, Hylocomium splendens (H.) Schimper, Rhytidiadelphus, Brachythecium, Vaccinium myrtillus (L.), Dryopteris filix-mas (L.) Schott |
Table 2.
Characteristics of forests sites.
| Parameter | Undrained Forest Sites | Drained Forest Sites | ||||||
|---|---|---|---|---|---|---|---|---|
| Spruce | Birch | Alder | Clearcut | Spruce | Birch | Alder | Clearcut | |
| Number of study sites | 1 | 3 | 5 | 1 | 12 | 3 | 2 | 4 |
| Age, years | 67 | 21–77 | 10–80 | 14–86 | 18–60 | 26–53 | ||
| Diameter, cm | 31 | 12–29 | 4–23 | 2–27 | 9–27 | 17–24 | ||
| Height, m | 28 | 12–28 | 4–29 | 2–24 | 9–22 | 17–26 | ||
| Basal area, m2 ha−1 | 61 | 17–71 | 8–57 | 8–72 | 19–60 | 32–56 | ||
| Growing stock, m3 ha−1 | 335 | 78–365 | 35–325 | 7–521 | 38–210 | 123–254 | ||
| Thickness of peat layer, cm | 68 | 31–52 | 30–99 | 47 | 37–99 | 25–75 | 60–70 | 63–99 |
The table shows the range of characteristics of forest sites.
Table 3.
Standard methods used in analyzing soil samples.
| Parameter | Unit | Method Principle | Standard Method |
|---|---|---|---|
| Bulk density | kg m−3 | Gravimetry | LVS ISO 11272:2017 |
| Total C | g kg−1 | Elementary analysis (dry combustion) | LVS ISO 10694:2006 |
| Total N | g kg−1 | Elementary analysis (dry combustion) | LVS ISO 13878:1998 |
| Carbonate (CaCO3) | g kg−1 | Volumetry | LVS EN ISO 10693:2014 |
| pH | unit | Potentiometry | LVS ISO 10390:2021 |
| HNO3 extractable potassium (K), calcium (Ca), magnesium (Mg) and phosphorus (P) | g kg−1 | ICP-OES | LVS EN ISO 11885:2009 |
Table 4.
Summary of the models for the prediction of soil Rfloor by soil temperature at a depth of 5 cm.
Table 4.
Summary of the models for the prediction of soil Rfloor by soil temperature at a depth of 5 cm.
| Moisture Regime | Forest Site Characteristics | Characteristics of Measured Data (Range) | Model Coefficients | Model Characteristics | |||
|---|---|---|---|---|---|---|---|
| Ts, °C | Rfloor, µg C m−2 s−1 | a | b | RMSE | Q10 | ||
| Drained | Clear-cut | −1.3…19.0 | 0.5…77.2 | 5.784 | 0.141 | 11.9 | 4.10 |
| Deciduous | 0.5…22.3 | 1.2…97.8 | 4.476 | 0.143 | 10.3 | 4.18 | |
| Coniferous | −0.6…18.2 | 4.2…59.7 | 6.235 | 0.118 | 6.2 | 3.25 | |
| Undrained | Clear-cut | 1.1…21.3 | 6.3…78.5 | 7.298 | 0.124 | 10.6 | 3.46 |
| Deciduous | 0.7…19.3 | 0.6…61.3 | 4.700 | 0.136 | 8.5 | 3.90 | |
| Coniferous | 1.4…17.4 | 6.2…45.9 | 5.798 | 0.124 | 3.0 | 3.46 | |
Table 5.
Summary of estimated soil respiration and soil C input (t C ha−1 year−1) in the study sites.
Table 5.
Summary of estimated soil respiration and soil C input (t C ha−1 year−1) in the study sites.
| Moisture Regime | Forest Site Characteristics | Rfloor | Rhet | aGV | bGV | FR | LF | Net Balance |
|---|---|---|---|---|---|---|---|---|
| Drained | Clear-cut | −7.6 ± 2.2 | −4.3 ± 0.90 | 2.2 ± 0.3 | 1 ± 0.2 | 0.2 ± 0.2 | −0.9 ± 0.7 | |
| Deciduous | −6.2 ± 1.2 | −3.7 ± 0.53 | 0.7 ± 0.3 | 1.3 ± 0.3 | 0.3 ± 0.3 | 1.6 ± 0.3 | 0.2 ± 0.4 | |
| Coniferous | −6.3 ± 0.5 | −3.7 ± 0.23 | 0.8 ± 0.2 | 0.8 ± 0.2 | 0.4 ± 0.1 | 1.7 ± 0.5 | 0.0 ± 0.3 | |
| Undrained | Clear-cut | −7.9 ± 1.2 | −4.4 ± 0.50 | 2.4 ± 0.3 | 1.4 ± 0.3 | 0.1 ± 0.4 | −0.4 ± 0.4 | |
| Deciduous | −6.1 ± 0.7 | −3.7 ± 0.32 | 0.7 ± 0.3 | 1.0 ± 0.4 | 0.3 ± 0.1 | 1.7 ± 0.6 | 0.0 ± 0.4 | |
| Coniferous | −5.1 ± 1.2 | −3.3 ± 0.50 | 0.5 ± 0.3 | 0.8 ± 0.3 | 0.5 ± 0.1 | 2.2 ± 0.4 | 0.8 ± 0.4 |
Table 6.
Summary of estimated forest management cycle’s annual average soil CSC (t C ha−1 year−1) for the study site measurements.
Table 6.
Summary of estimated forest management cycle’s annual average soil CSC (t C ha−1 year−1) for the study site measurements.
| Soil CSC Component | Drained | Undrained | ||
|---|---|---|---|---|
| Deciduous | Coniferous | Deciduous | Coniferous | |
| Rhet | −3.82 ± 0.45 | −3.85 ± 0.36 | −3.88 ± 0.7 | −3.54 ± 1.38 |
| LF | 1.14 ± 0.21 | 0.81 ± 0.24 | 1.12 ± 0.46 | 0.73 ± 0.22 |
| FR | 0.31 ± 0.25 | 0.44 ± 0.13 | 0.32 ± 0.29 | 0.53 ± 0.16 |
| aGV | 0.93 ± 0.61 | 1.1 ± 0.31 | 1.79 ± 0.61 | 1.59 ± 0.45 |
| Aboveground shrubs | 0.01 ± 0.01 | 0.01 ± 0.01 | 0.01 ± 0.01 | 0.01 ± 0.01 |
| Aboveground mosses | 0.02 ± 0.02 | 0.09 ± 0.04 | 0.02 ± 0.02 | 0.11 ± 0.04 |
| bGV | 1.27 ± 0.42 | 0.59 ± 0.17 | 1.13 ± 0.52 | 1.00 ± 0.28 |
| Belowground shrubs, mosses | 0.07 ± 0.07 | 0.25 ± 0.1 | 0.07 ± 0.07 | 0.28 ± 0.12 |
| Net balance | −0.08 ± 0.03 | −0.55 ± −0.12 | 0.43 ± 0.17 | 0.71 ± 0.25 |
Publisher’s Note: MDPI stays neutral with regard to jurisdictional claims in published maps and institutional affiliations. |
© 2022 by the authors. Licensee MDPI, Basel, Switzerland. This article is an open access article distributed under the terms and conditions of the Creative Commons Attribution (CC BY) license (https://creativecommons.org/licenses/by/4.0/).
Share and Cite
MDPI and ACS Style
Butlers, A.; Lazdiņš, A.; Kalēja, S.; Bārdule, A. Carbon Budget of Undrained and Drained Nutrient-Rich Organic Forest Soil. Forests 2022, 13, 1790. https://doi.org/10.3390/f13111790
AMA Style
Butlers A, Lazdiņš A, Kalēja S, Bārdule A. Carbon Budget of Undrained and Drained Nutrient-Rich Organic Forest Soil. Forests. 2022; 13(11):1790. https://doi.org/10.3390/f13111790
Chicago/Turabian StyleButlers, Aldis, Andis Lazdiņš, Santa Kalēja, and Arta Bārdule. 2022. "Carbon Budget of Undrained and Drained Nutrient-Rich Organic Forest Soil" Forests 13, no. 11: 1790. https://doi.org/10.3390/f13111790
Note that from the first issue of 2016, this journal uses article numbers instead of page numbers. See further details here.