Article

Carbon Dioxide, Methane and Nitrous Oxide Fluxes from Tree Stems in Silver Birch and Black Alder Stands with Drained and Naturally Wet Peat Soils

Latvian State Forest Research Institute ‘Silava’ (LSFRI Silava), Rigas Str. 111, LV-2169 Salaspils, Latvia
*
Author to whom correspondence should be addressed.
Forests 2023, 14(3), 521; https://doi.org/10.3390/f14030521
Submission received: 30 January 2023 / Revised: 2 March 2023 / Accepted: 3 March 2023 / Published: 7 March 2023
(This article belongs to the Section Forest Soil)

Abstract

:
The aim of this study was to evaluate the impact of groundwater level, soil temperature and general soil chemistry on greenhouse gas (GHG)—carbon dioxide (CO2), methane (CH4) and nitrous oxide (N2O)—fluxes from tree stems in deciduous stands with nutrient-rich naturally wet and drained peat soils. In total, nine sample plots were established in the central and north-eastern part of Latvia. The studied tree species were silver birch (Betula pendula Roth.) and black alder (Alnus glutinosa (L.) Gaertb.). Tree stands of different ages and tree dimensions were selected for the study. GHG fluxes were measured with a circular-type non-transparent chamber of fixed area and volume, which was connected to the “Gasmet DX4040” mobile spectrometer. Ambient and soil temperature at a depth of 10 cm were measured, soil parameters (pH and content of carbon (C), nitrogen (N), potassium (K), phosphorus (P)) down to 30 cm depth were analyzed, and groundwater levels and weather conditions (wind, cloudiness, precipitation) were determined. The study found that CO2 fluxes from tree stems show a distinct seasonal pattern and a strong positive correlation with soil temperature. Significant differences in CO2 fluxes were found between temperature ranges below and above 5 °C, indicating that this temperature represents a threshold value. CH4 emissions from the tree stems increased with increasing groundwater levels. The impact of groundwater level becomes insignificant if the depth of the groundwater exceeds 30 cm. No significant N2O fluxes from tree stems were detected for most of the study period, except for March, April and June in black alder stands. As with CH4, N2O emissions exhibit an increase as groundwater levels rise. The C and N contents in soil have a significant impact on N2O fluxes from tree stems. There is a tendency for the N2O flux to increase along with increasing C and N contents in soil.

1. Introduction

In the global context of terrestrial ecosystems, forests play a crucial role in the carbon (C) cycle, acting as a major C sink and storing about 90% of the total terrestrial C. Moreover, as significant regulators of the global climate, forests have the ability to influence and shape climate change dynamics [1,2]. Latvia’s forest area ranks fourth among European Union countries, comprising approximately 50% to 52% of its total land area [3,4]. According to the data of the National Forest Inventory of Latvia in 2018, forests with wet organic soil account for 10.3% and forests with drained organic soil account for 12.6% of the total forest area. Forests of both of these two types combined cover 739.87 kha [3]. In Latvia, organic soils are considered the largest source of greenhouse gas (GHG) emissions, emitting more than 6.1 million tons of carbon dioxide (CO2) yr−1 [5]. CO2 and methane (CH4) are the most abundant GHGs responsible for anthropogenic climate change. Nitrous oxide (N2O) is another important GHG that is about 300 times as potent as CO2 and depletes the ozone layer [6]. To gain a better understanding of C cycling in forests, other sinks and sources of GHGs as well as soils need to be studied in depth.
Until now, trees have been neglected and only recently has their potential for regulating GHG fluxes been recognized. Considering the number of trees worldwide, even small emissions from individual stems can upscale to large global fluxes [7]. Two pathways can be distinguished for GHG emissions from tree stems. First, GHGs may be produced by the physiological processes of a tree or the microorganisms inhabiting it [8,9,10]. Second, GHGs could be produced and accumulated in deep soil layers, and transported through the roots to the whole tree and further to the atmosphere [9,11,12]. The GHG fluxes from tree stems are determined by tree species and their characteristic growth rates, distribution area, dimensions, age, root system type and size and whether the tree is living or dead. Faster-growing trees emit more on average than slower-growing ones [1,12,13]. GHG emissions are also significantly affected by climatic and edaphic factors. The results of several studies show that greater amounts of GHG emissions through the surfaces of tree stems are released in flooded or overmoistened areas [14,15,16].
Tree respiration is a significant component of the C budget in forests at plant, stand and ecosystem levels and CO2 is produced as a byproduct. Tree stem respiration also plays a crucial role due to the assimilates consumed and the increase in wood as the stand develops [17]. Woody tissue respiration (mainly determined by stem respiration) accounts for about 50% of the total above-ground autotrophic respiration in temperate deciduous forests; however, respiration is not necessarily synonymous with CO2 efflux [18]. Some studies show that CO2 efflux is reduced by bark photosynthesis when CO2 re-fixation occurs [19,20].
It has been known since the 1970s that trees are capable of storing large amounts of CH4 in their stems, but the idea that trees are capable of emitting this GHG through the surface of their stems has only recently gained acceptance [21,22]. The anaerobic environment of a tree stem can promote the activity of methanogenic microorganisms involved in CH4 production [12]. In a study carried out in eutrophic peatlands, CH4 from tree stems accounted for up to 30% of net ecosystem CH4 emissions. The CH4 fluxes from stems were higher during the wet season when the water table was high and temperatures were lower [13].
Evidence suggests that in wetlands, mangroves and well-drained forests, tree stems most likely emit N2O produced in the soil by microbial nitrification and denitrification processes [23,24,25]. The N2O emissions tend to decrease sharply with increasing stem height, suggesting that tree stems rather than leaves are the main N2O emitters [21,24,26,27]. Black alder is known to grow in symbiosis with the N2-fixing actinomycetes Frankia sp. [28,29]. Due to this symbiosis, black alder forests are significant nitrogen (N)-fixing ecosystems. The decomposition of alder litter improves the C:N ratio in the soil, which alters soil microbial activity and affects the production of N2O [30]. Since this GHG is mainly produced during N mineralization in aerobic peat soils, rewetting can reduce the N2O emissions to levels close to those of undrained, natural peatlands [31]. As with CO2 and CH4, N2O can also be taken up by roots from deeper soil layers and, as it is further transported through the tree’s vascular tissues, released from the stem surface [12]. It is known that plant tissues can also produce N2O through nitrate uptake, which requires optimal light intensity, temperature, water and nutrient availability [32,33].
Emissions from tree stems have not been studied efficiently due to the complexity of the process and the factors affecting it. The aim of this study is to evaluate the effects of groundwater level and soil temperature, as well as general soil chemistry on GHG emissions from the surface of tree stems in deciduous stands with organic soil in Latvia. This study assessed the emissions of CO2, CH4 and N2O.

2. Materials and Methods
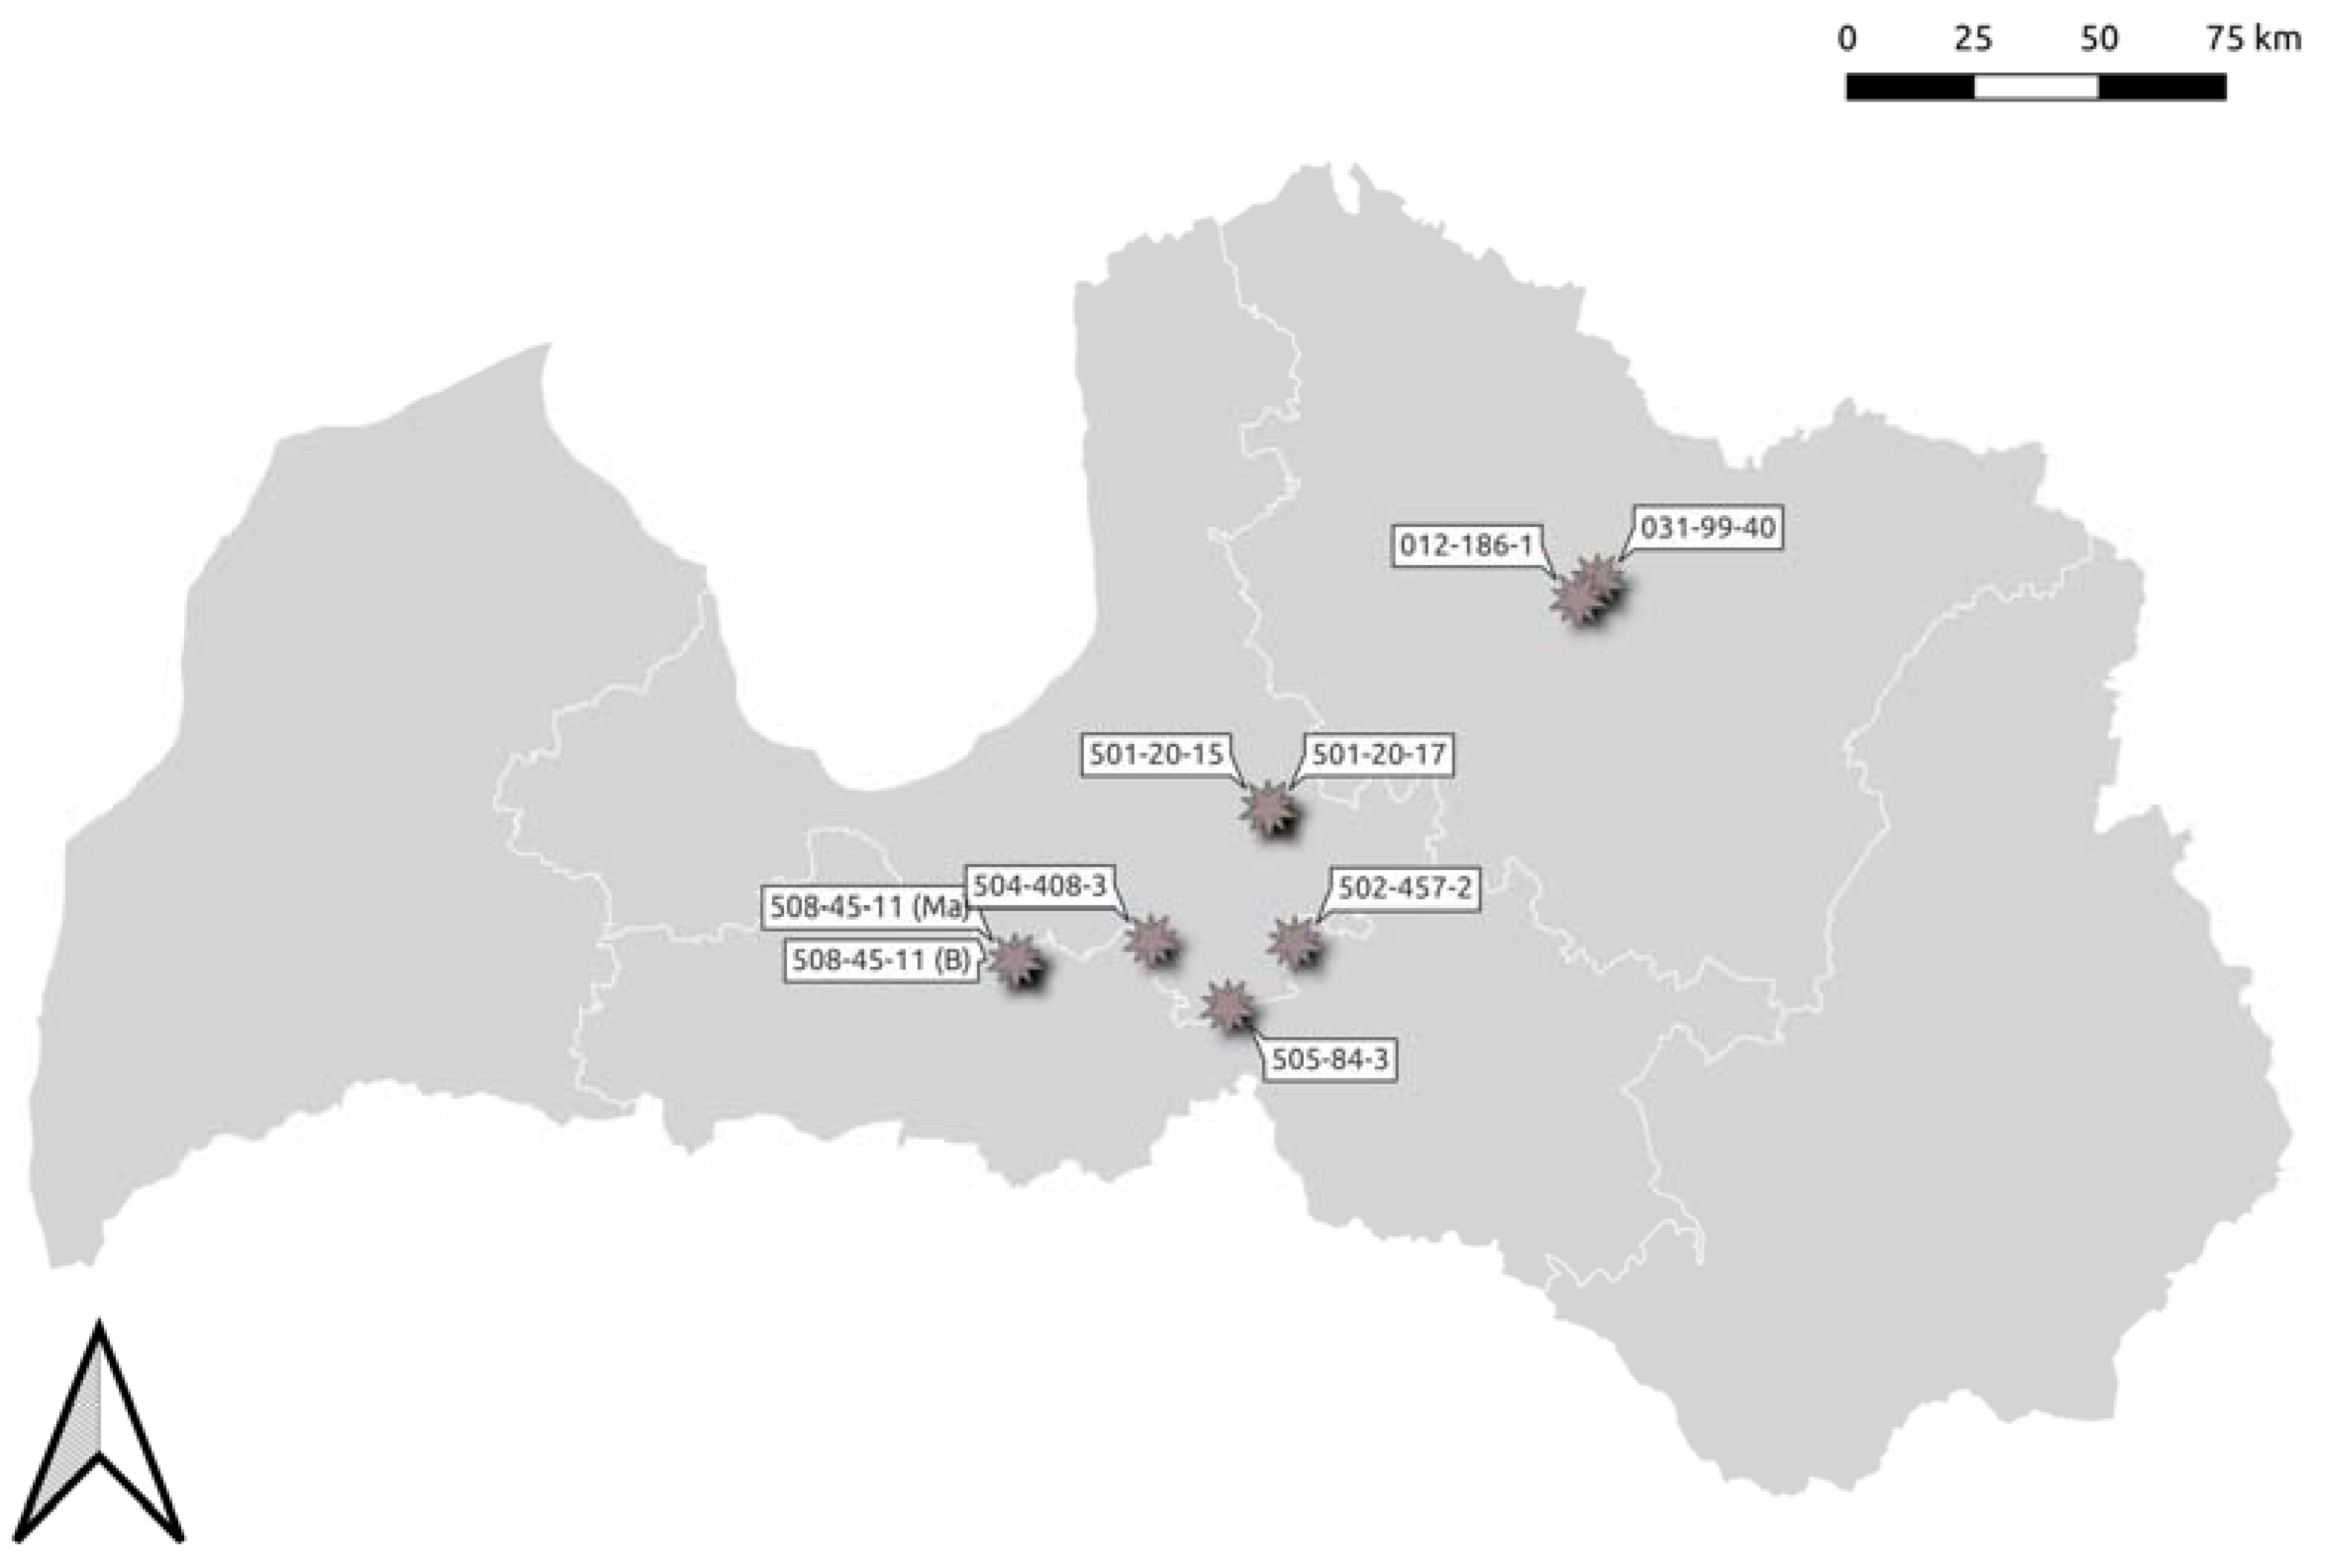
2.1. Study Sites

The study was conducted in the central and north-eastern part of Latvia, in eight deciduous forest stands with nutrient-rich organic (peat) soil—six silver birch (Betula pendula Roth.) stands with drained and wet peat soil and three black alder (Alnus glutinosa (L.) Gaertb.) stands with wet peat soil (Figure 1).
Each tree species was represented by at least one mature stand, one middle-aged stand and one young stand. In each sample plot three trees were selected, representing the largest, middle-sized and the smallest trees of the stand. Characteristics of the forest stands are shown in Table 1 and characteristics of individual trees are shown in Table 2.
The average annual air temperature in Latvia from 1991 to 2020 was +6.8 °C. In Latvia, in general, the warmest month of the year is July with an average temperature of +17.8 °C, while the coldest is February with an average temperature of −3.1 °C. The average amount of precipitation in Latvia is 678.6 mm. The wettest months are July (75.7 mm) and August (76.8 mm), while the driest is April (35.8 mm). The average relative air humidity is 81% [34]. In Latvia, the vegetation period begins mid to late April and lasts until October to November, depending on the part of Latvia (eastern or western) and the distance from the Baltic Sea [35]. At various points in winter, there was a snow cover on the ground in the study area, although it was not persistent.

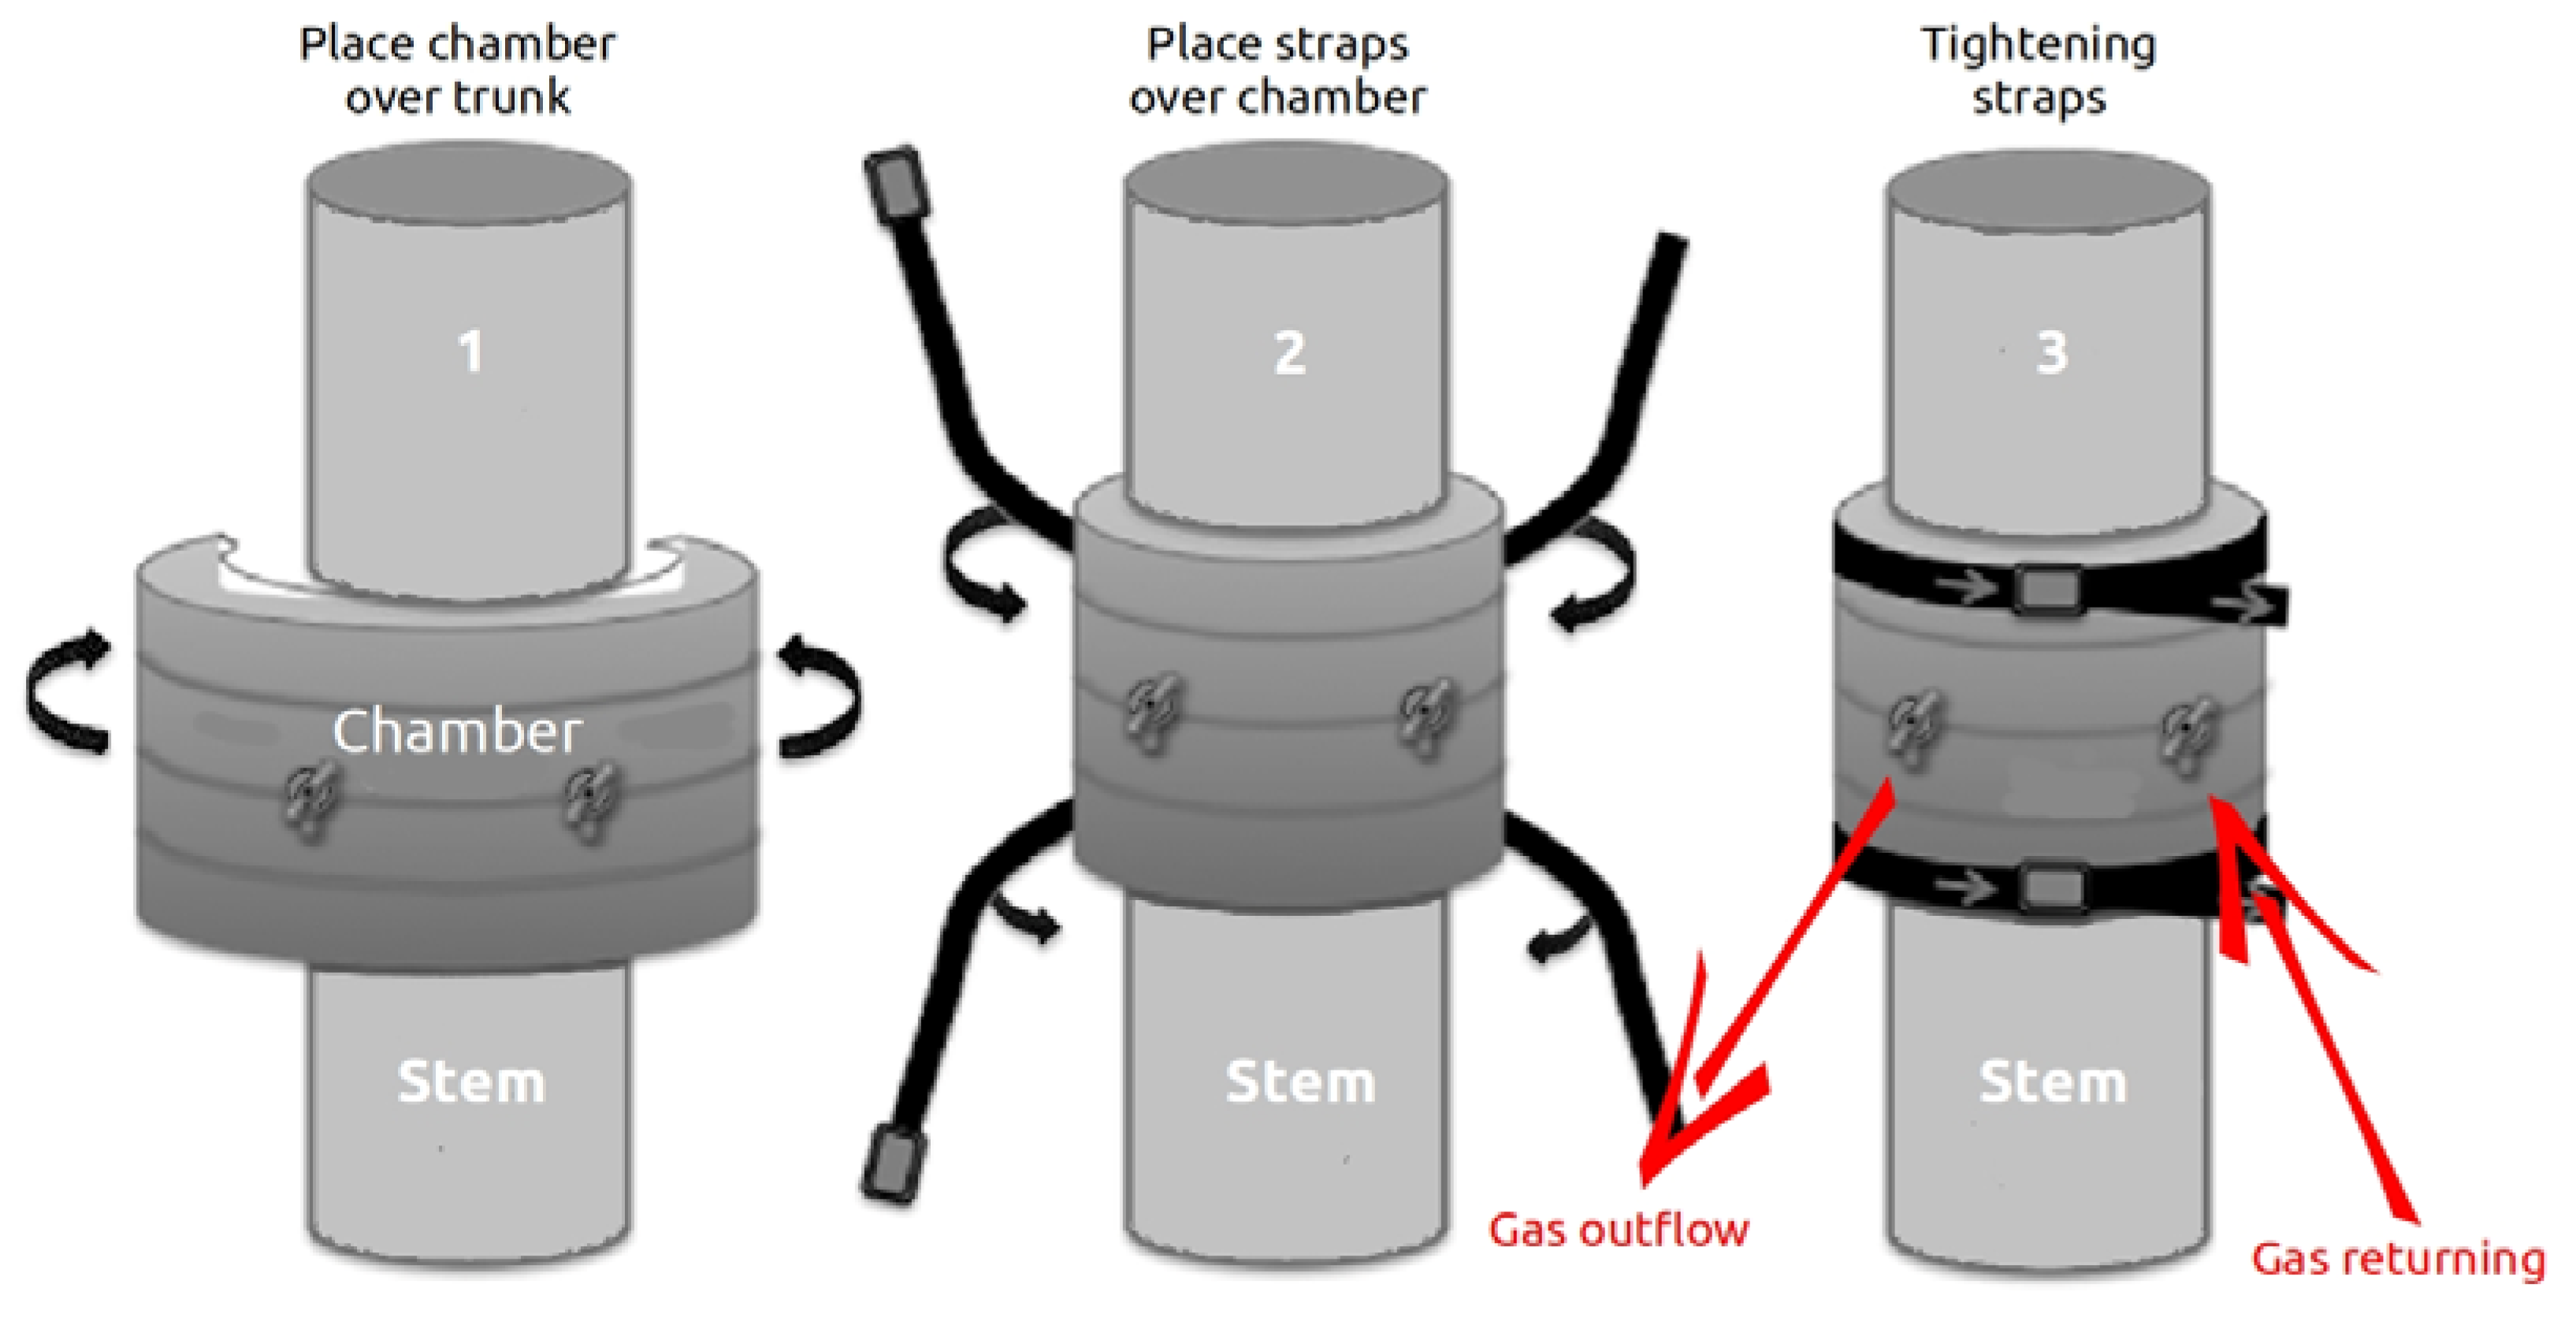
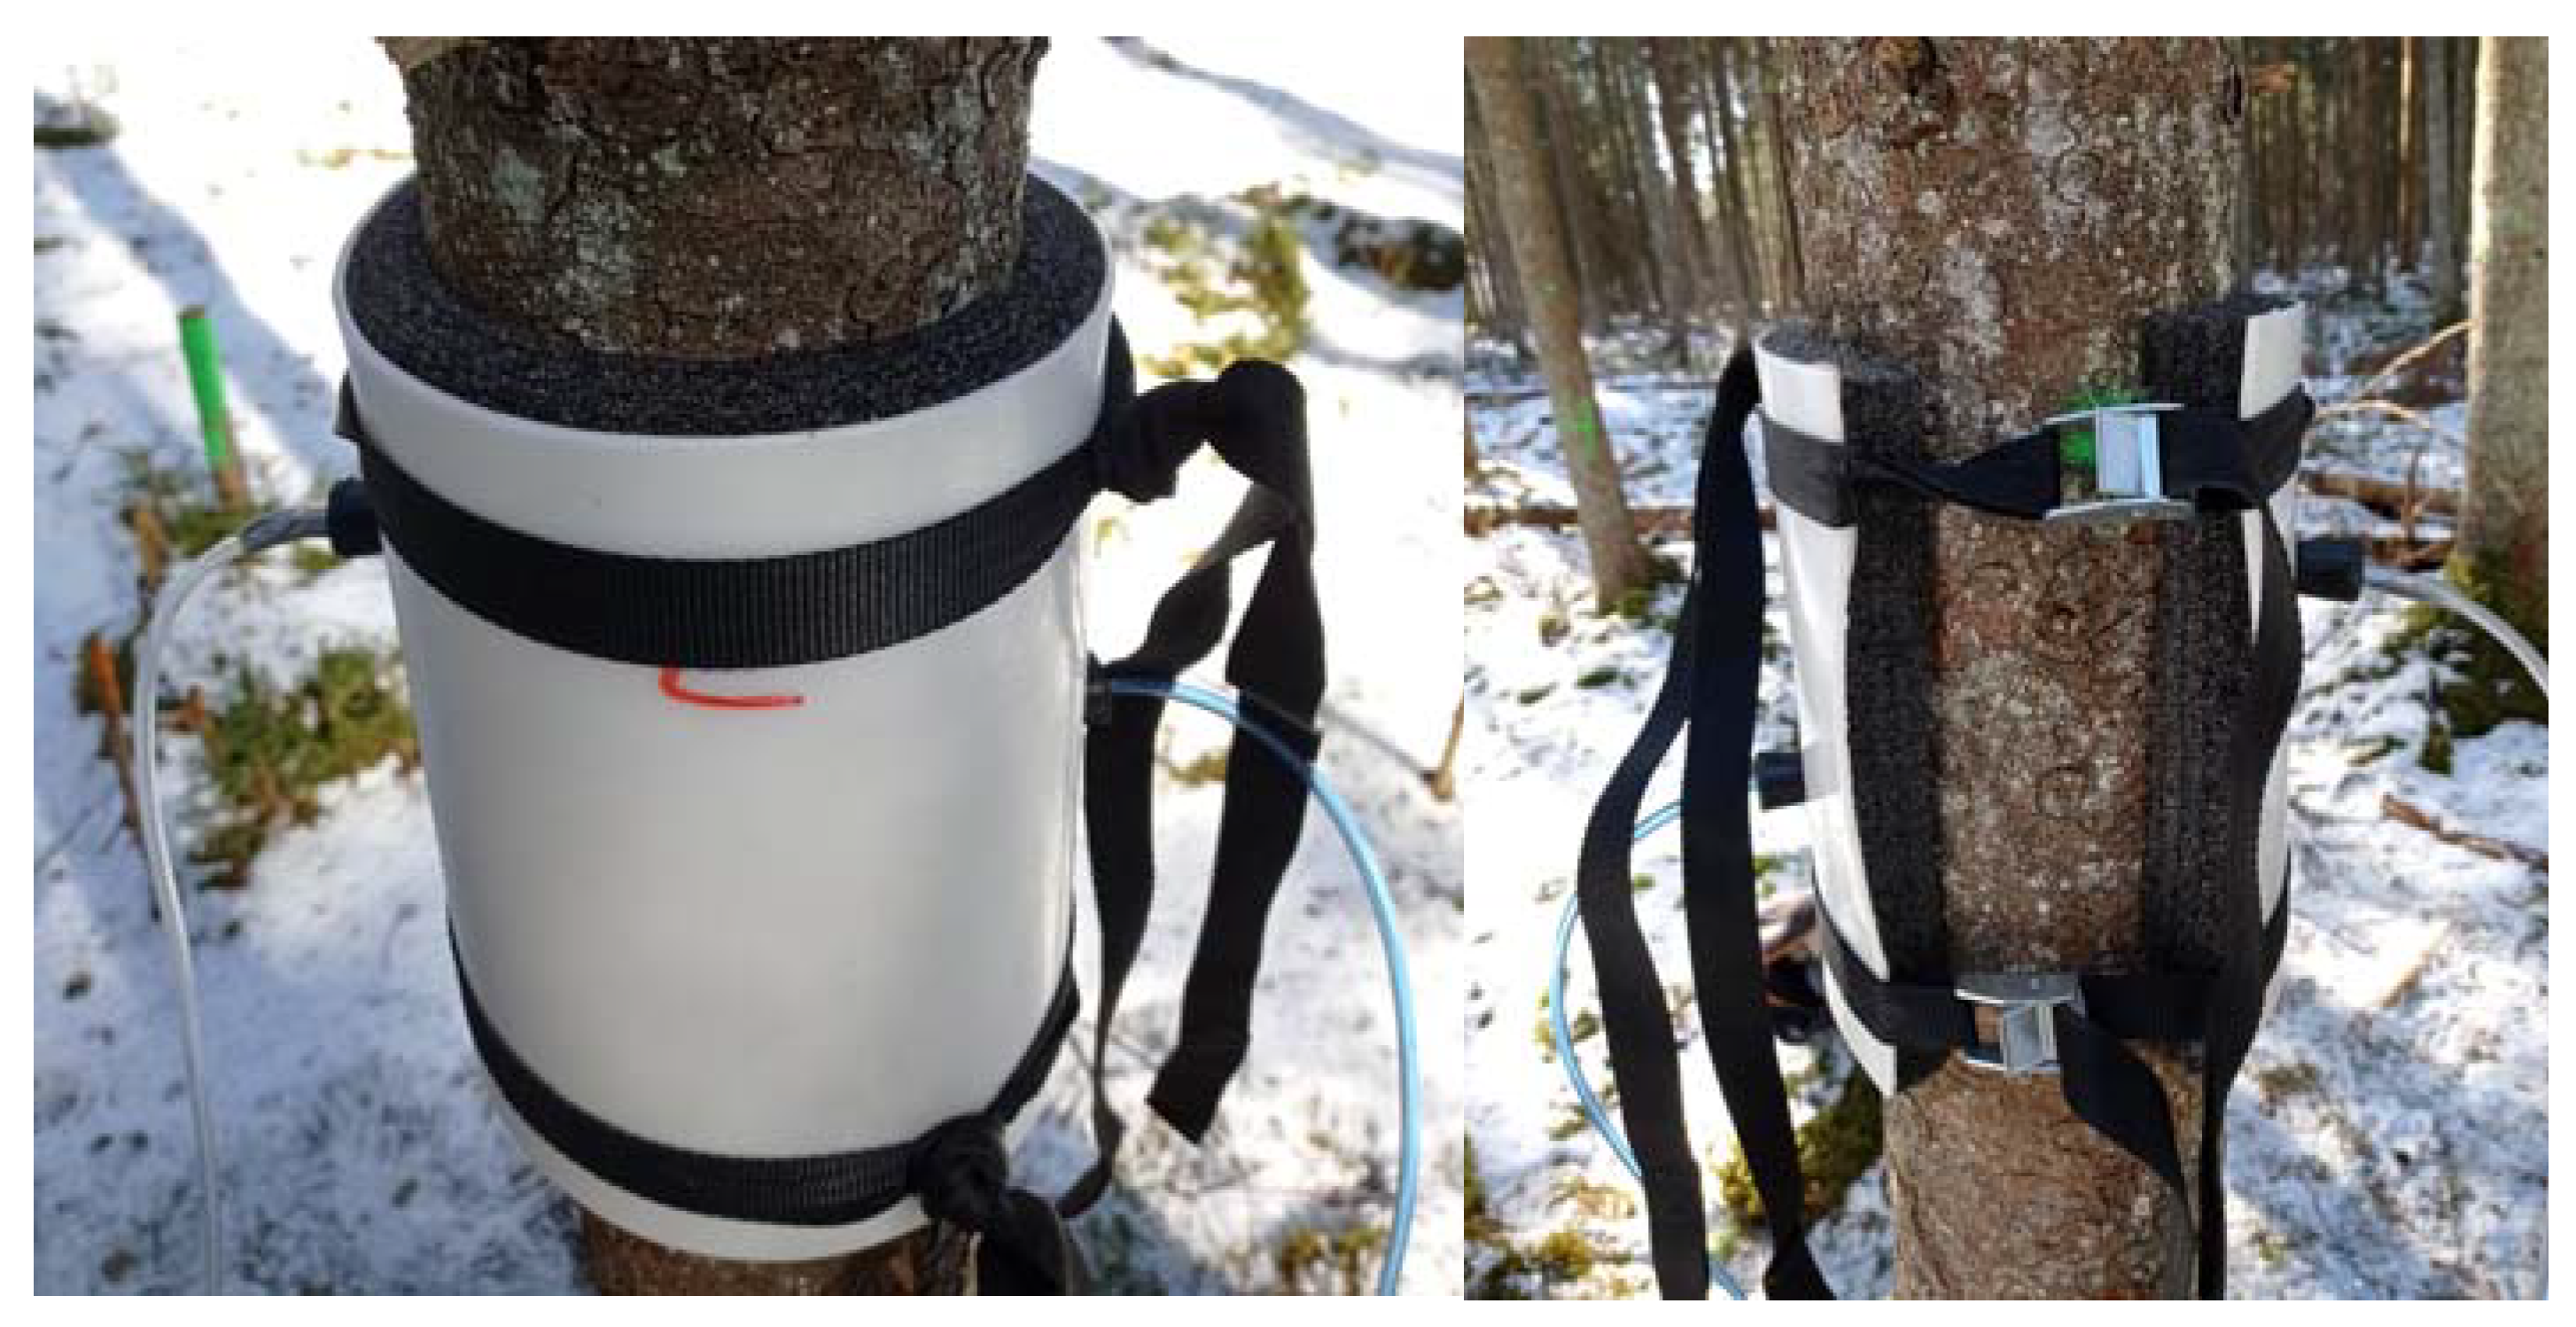
2.2. Closed Chamber Design and Gas Flux Exchange Measurements from Tree Stems

Measurements were carried out for 12 months (from November 2020 till October 2021). GHG flux measurements were performed using static closed non-transparent chambers of fixed area and volume and Gasmet DX4040 FTIR analyser. Depending on tree diameter, different chambers were used (Table 3). Before a measurement, the area of the stem bark where the chamber was to be attached was treated with silicone to ensure airtightness after the chamber was installed.
Before starting the measurements, the gas composition of the ambient air was determined. Upon installation of the chamber on the tree stem, a chronometer was started to facilitate and accurately record the time stamps at which the “Gasmet DX4040” measurement program must be turned off. When the chamber was installed, the first measurement was taken (at 0 min), followed by a 4 min pause. In the sixth minute, the device was turned on and three measurements were taken, each lasting two minutes. After the third measurement, the “Gasmet DX4040” was turned off again for 4 min, and turned on again at the 16th minute, when three more measurements were taken, each lasting 2 min. After the third measurement, the device was turned off again for 4 min and turned on at the 26th minute when the final three measurements were taken. Identical measurements were repeated on the two other trees in each sample plot. For each of the measurements with the “Gasmet DX4040”, information about humidity (H2O%) and the concentrations of carbon dioxide (CO2), methane (CH4) and nitrous oxide (N2O) in the camera at specific time intervals was recorded. A schematic representation of the gas measurement chamber and its installation is shown in Figure 2, and a photo of the chamber is shown in Figure 3.
Simultaneously to the gas flux measurements, soil and air temperature as well as the groundwater level were determined. The soil temperature was measured at a depth of 10 cm using a “Comet” thermometer by inserting its probe at the corresponding depth. The air temperature was measured with the same thermometer, but the probe was placed at approximately 1 m from the ground. The groundwater level was measured in a previously dug groundwater well using a ruler by measuring the internal part of the well up to the water surface and the external part up to the soil surface.
GHG fluxes (µg m−2 h−1) were calculated according to Equation (1). The quality of GHG flux measurements was checked by plotting concentration values over time to ensure that changes in concentrations had remained linear. The concentration of emitted CO2 in the chamber served as a control. During the measurements of one tree, if R2 of linear regression was equal to or greater than 0.95, data points were recognized as valid and used in further calculations. Otherwise, the data points were recognized as invalid and not used further. As linearity remained, we concluded there were no significant issues related to pressure or gas buildup.
G H G C = P * M * δ υ * V * f 1 A * T * t * R
where GHG-C—GHG flux;
  • P—air pressure in the chamber, assumed constant 101,300 Pa;
  • M—molar mass of measured gases (CO2—44.01 g·mol−1; CH4—16.04 g·mol−1; 44.01 N2O—44.01 g·mol−1);
  • δv—slope of regression representing gas concentration changes per hour;
  • V—chamber volume, m3 (Table 3);
  • f 1 —recalculation coefficient (0.27 for CO2, 0.75 for CH4 and 0.64 for N2O);
  • A—chamber surface area, m2;
  • T—soil temperature, K;
  • t—measurement time, hours;
  • R—universal gas constant (8.3143 m3·Pa·K−1·mol−1).
In order to calculate monthly emissions, the result is multiplied by 24 and the number of days in a specific month.

2.3. Soil Sampling and Analysis

For each sample plot, soil samples were collected from three subplots. Undisturbed soil samples of 100 cm3 were taken at depths of 0–10 cm, 10–20 cm, 20–30 cm. Sampling was performed using an auger and an undisturbed soil probe. Every sample was transferred into a plastic bag labelled with a sample ID. Soil samples were transported to the [36] -accredited laboratory at the LSFRI Silava and were prepared for analyses according to the [37] standard. Soil pH (CaCl2) was determined according to [38]. Total and organic carbon (TC and OC, g kg−1) and total nitrogen (TN, g kg−1) contents were determined using an elementary analysis method (Elementar El Cube, varioElcube 4.0.16) according to [39] and [40], respectively. Concentrated nitric acid (HNO3) extractable potassium (K, g kg−1) and phosphorus (P, g kg−1) were determined using inductively coupled plasma–optical emission spectrometry (ICP-OES) method (Thermo Fisher Scientific iCE3500, Waltham, MA, USA).

2.4. Statistical Analysis

The data of GHG flux measurements, temperature, groundwater level, soil chemical parameters were tested for normality using Shapiro–Wilk test, and equality of variances. For normally distributed data two-sample t-test was performed. For non-normally distributed data, Wilcoxon signed-rank test, Wilcoxon rank sum exact test and Mann–Whitney U test were performed. In order to assess the impact of temperature and groundwater level on CO2, CH4 and N2O fluxes, Spearman correlation analysis was carried out. Non-linear regression analysis (quadratic model) was performed to assess the impact of soil temperature on GHG fluxes. Linear regression analysis was performed to assess the impact of soil C and N contents on GHG fluxes. In case of CH4 sites with constantly high groundwater levels, these were excluded. Statistical significance for the performed tests was defined as p < 0.05. Data were analyzed using Rstudio (R version 4.2.0).

3. Results

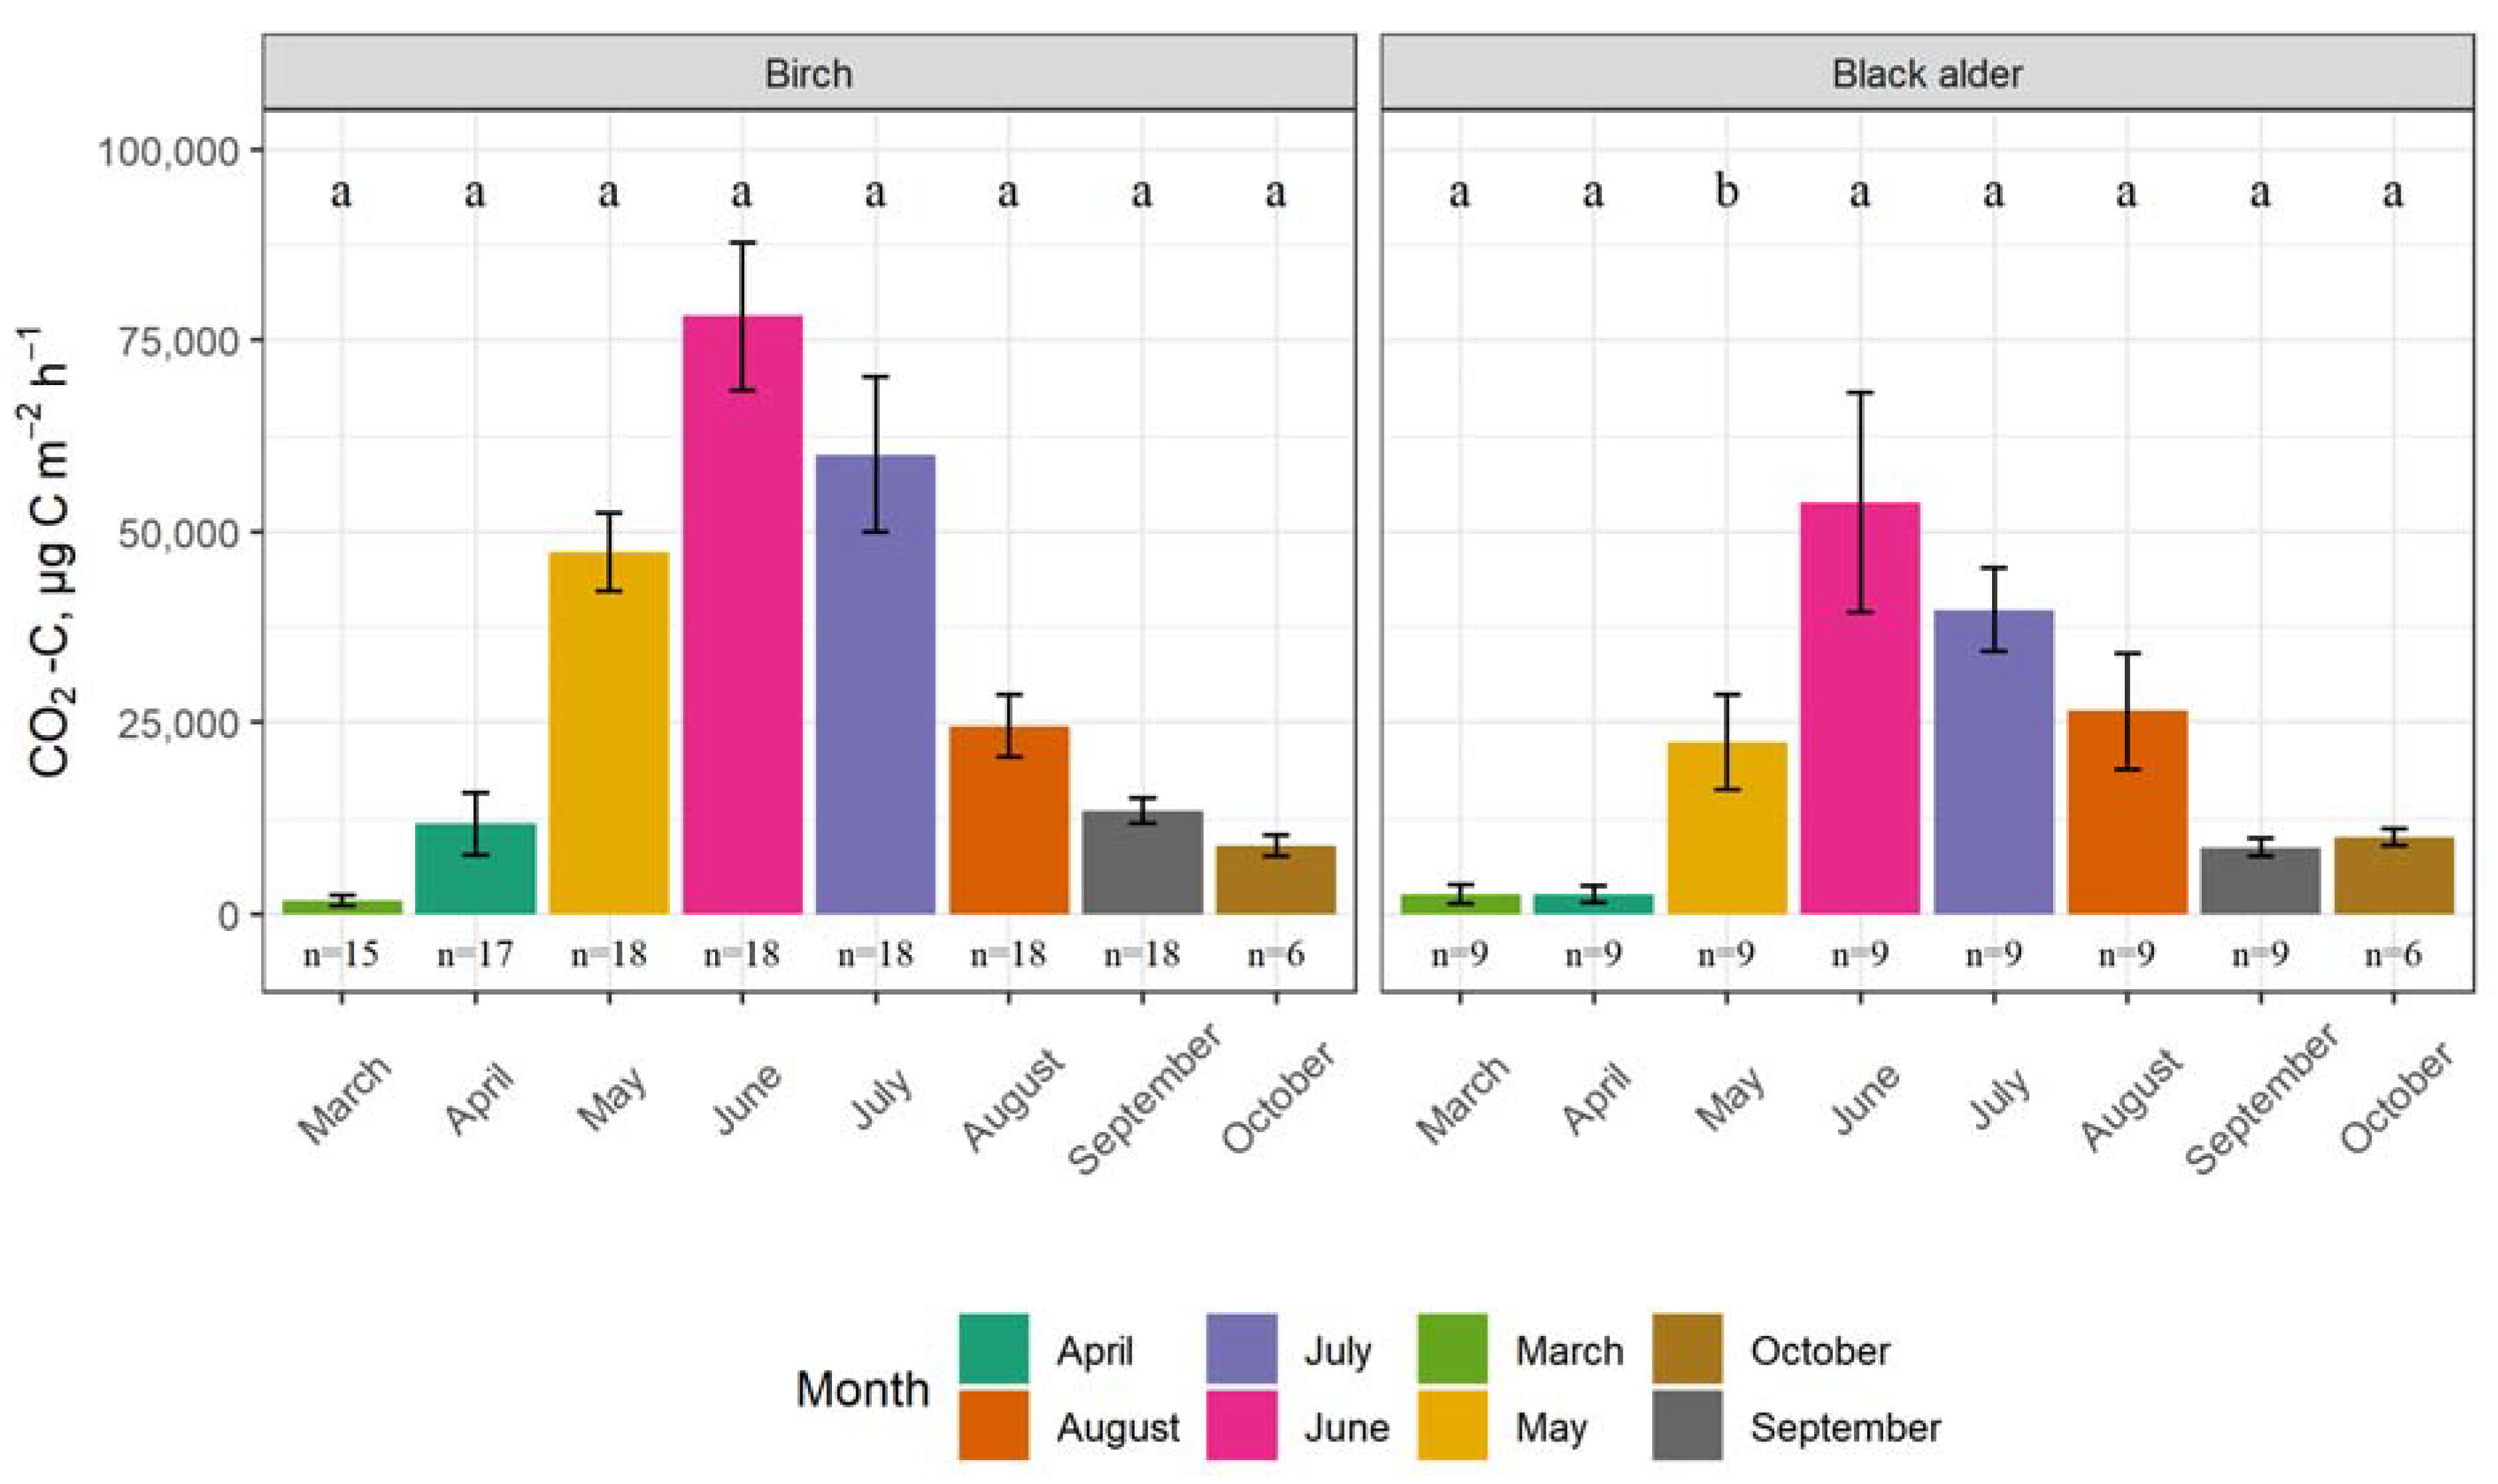
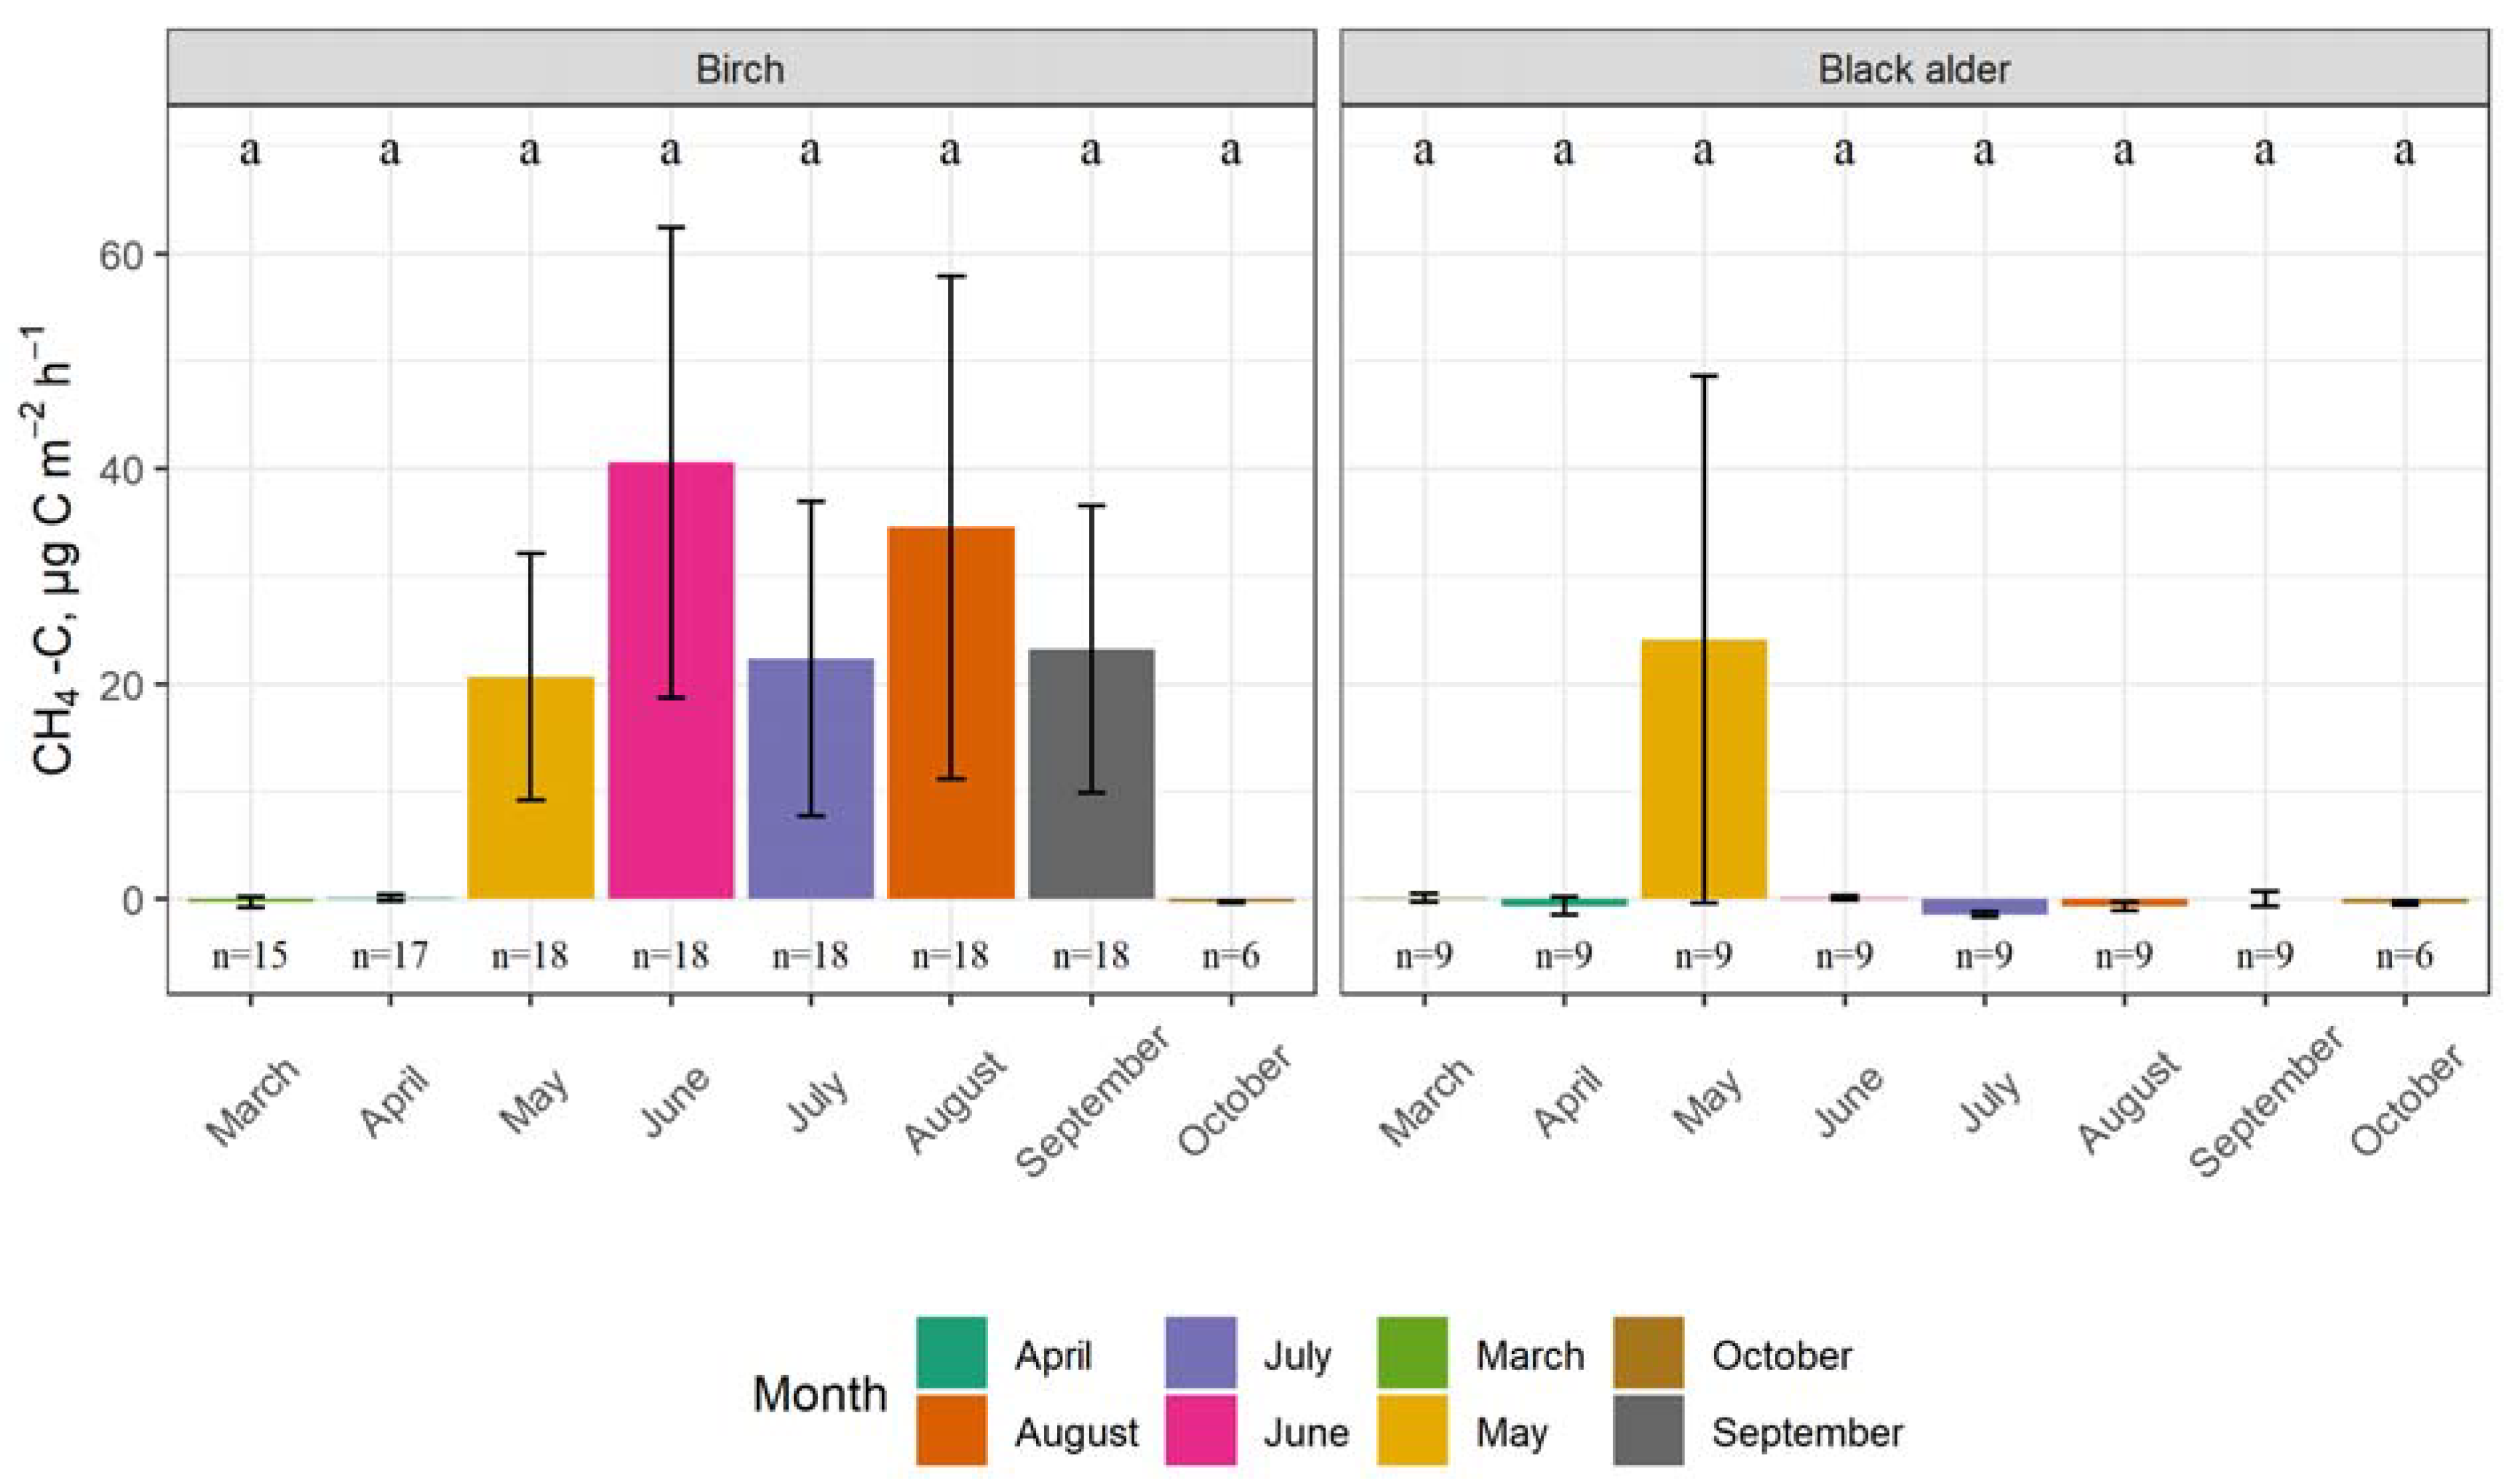
3.1. Seasonality of GHG Fluxes and the Impact of Tree Species

The CO2 emissions from tree stems varied seasonally for both silver birch and black alder stands. Birch stands on average emitted 21,588 ± 3624 µg CO2-C m−2 h−1 during spring months, 54,255 ± 5669 µg CO2-C m−2 h−1 during summer and 12,423 ± 1337 µg CO2-C m−2 h−1 during autumn, whereas black alder stands emitted 9241 ± 2751 µg CO2-C m−2 h−1 during spring months, 40,053 ± 5920 µg CO2-C m−2 h−1 during summer and 9247 ± 826 µg CO2-C m−2 h−1 during autumn. The highest CO2 emissions were detected in June, which coincides with the highest air and soil temperatures. In silver birch stands, 78,165 ± 3842 µg CO2-C m−2 h−1 were emitted during this month, and in black alder stands—53,871 ± 2086 µg CO2-C m−2 h−1. The lowest CO2 fluxes in all the study sites were measured in March. Data from the winter months were not included in the calculations, as the emissions were insignificant. The CO2 fluxes were higher in birch stands compared to black alder stands. On average, during the measurement cycle, birch stands emitted 30,782 ± 3197 µg CO2-C m−2 h−1, while black alder stands emitted 20,830 ± 3119 µg CO2-C m−2 h−1.The difference between both species during the whole measurement period is statistically significant (p = 0.01). Evaluating the differences between both of the tree species in spring, summer and autumn months separately, the difference in spring is statistically significant (p = 0.008). An insignificant, weak, negative correlation was found between CO2 fluxes and stand age (Spearman correlation coefficient ρ = −0.1338924, p > 0.05). Monthly GHG fluxes for each of the tree species are shown in Figure 4.
The seasonality was less pronounced for CH4 fluxes. Birch stands on average emitted 7.41 ± 4.29 µg CH4-C m−2 h−1 during spring months, 32.51 ± 11.54 µg CH4-C m−2 h−1 during summer and 17.36 ± 10.13 µg CH4-C m−2 h−1 during autumn. Black alder stands emitted 7.90 ± 8.16 µg CH4-C m−2 h−1 during spring months, whereas in summer and autumn months on average, slight removals were detected (−0.66 ± 0.20 µg CH4-C m−2 h−1 and −0.15 ± 0.43 µg CH4-C m−2 h−1 for summer and autumn, respectively). The CH4 fluxes in birch stands were the highest in June—40.60 ± 8.27 µg CH4-C m−2 h−1, while in black alder stands they were—in May—24.17 ± 9.25 µg CH4-C m−2 h−1. On average during the measurement period, birch stands emitted 17.63 ± 5.54 µg CH4-C m−2 h−1. As the groundwater level stabilized, CH4 fluxes were negligible. Differences between both of the species were statistically significant for all of the study period (p = 0.03) and for summer months (p = 0.0058) when evaluating the seasons separately, but no statistically significant differences (p > 0.05) between species were found when evaluating each month separately (Figure 5). An insignificant, moderate, positive correlation was found between CH4 fluxes and stand age (ρ = 0.32, p > 0.05).
Large data variation was observed for N2O fluxes. Considerable peaks of N2O emissions and removals were detected in June. No significant N2O fluxes from tree stems were detected for most of the study period, except for March (0.19 ± 0.77 µg N2O-N m−2 h−1), April (0.38 ± 0.24 µg N2O-N m−2 h−1) and June (1.44 ± 0.71 µg N2O-N m−2 h−1) in black alder stands. The difference between both species is statistically significant (p = 0.01). For birch stands, on average, no emissions and slight removals (−0.17 ± 0.06, −0.25 ± 0.10 and −0.85 ± 0.55 µg N2O-N m−2 h−1 for spring, summer and autumn, accordingly) were detected. Black alder stands emitted 0.20 ± 0.14 during spring months, 0.30 ± 2.33 µg N2O-N m−2 h−1 during summer and 0.0024 ± 0.0607 µg N2O-N m−2 h−1 during autumn. Differences between species in spring (p = 0.02) are statistically significant. An insignificant, moderate, positive correlation was found between N2O fluxes and stand age (ρ = 0.39, p > 0.05). Monthly N2O fluxes and removals from silver birch and black alder stems are shown in Figure 6.

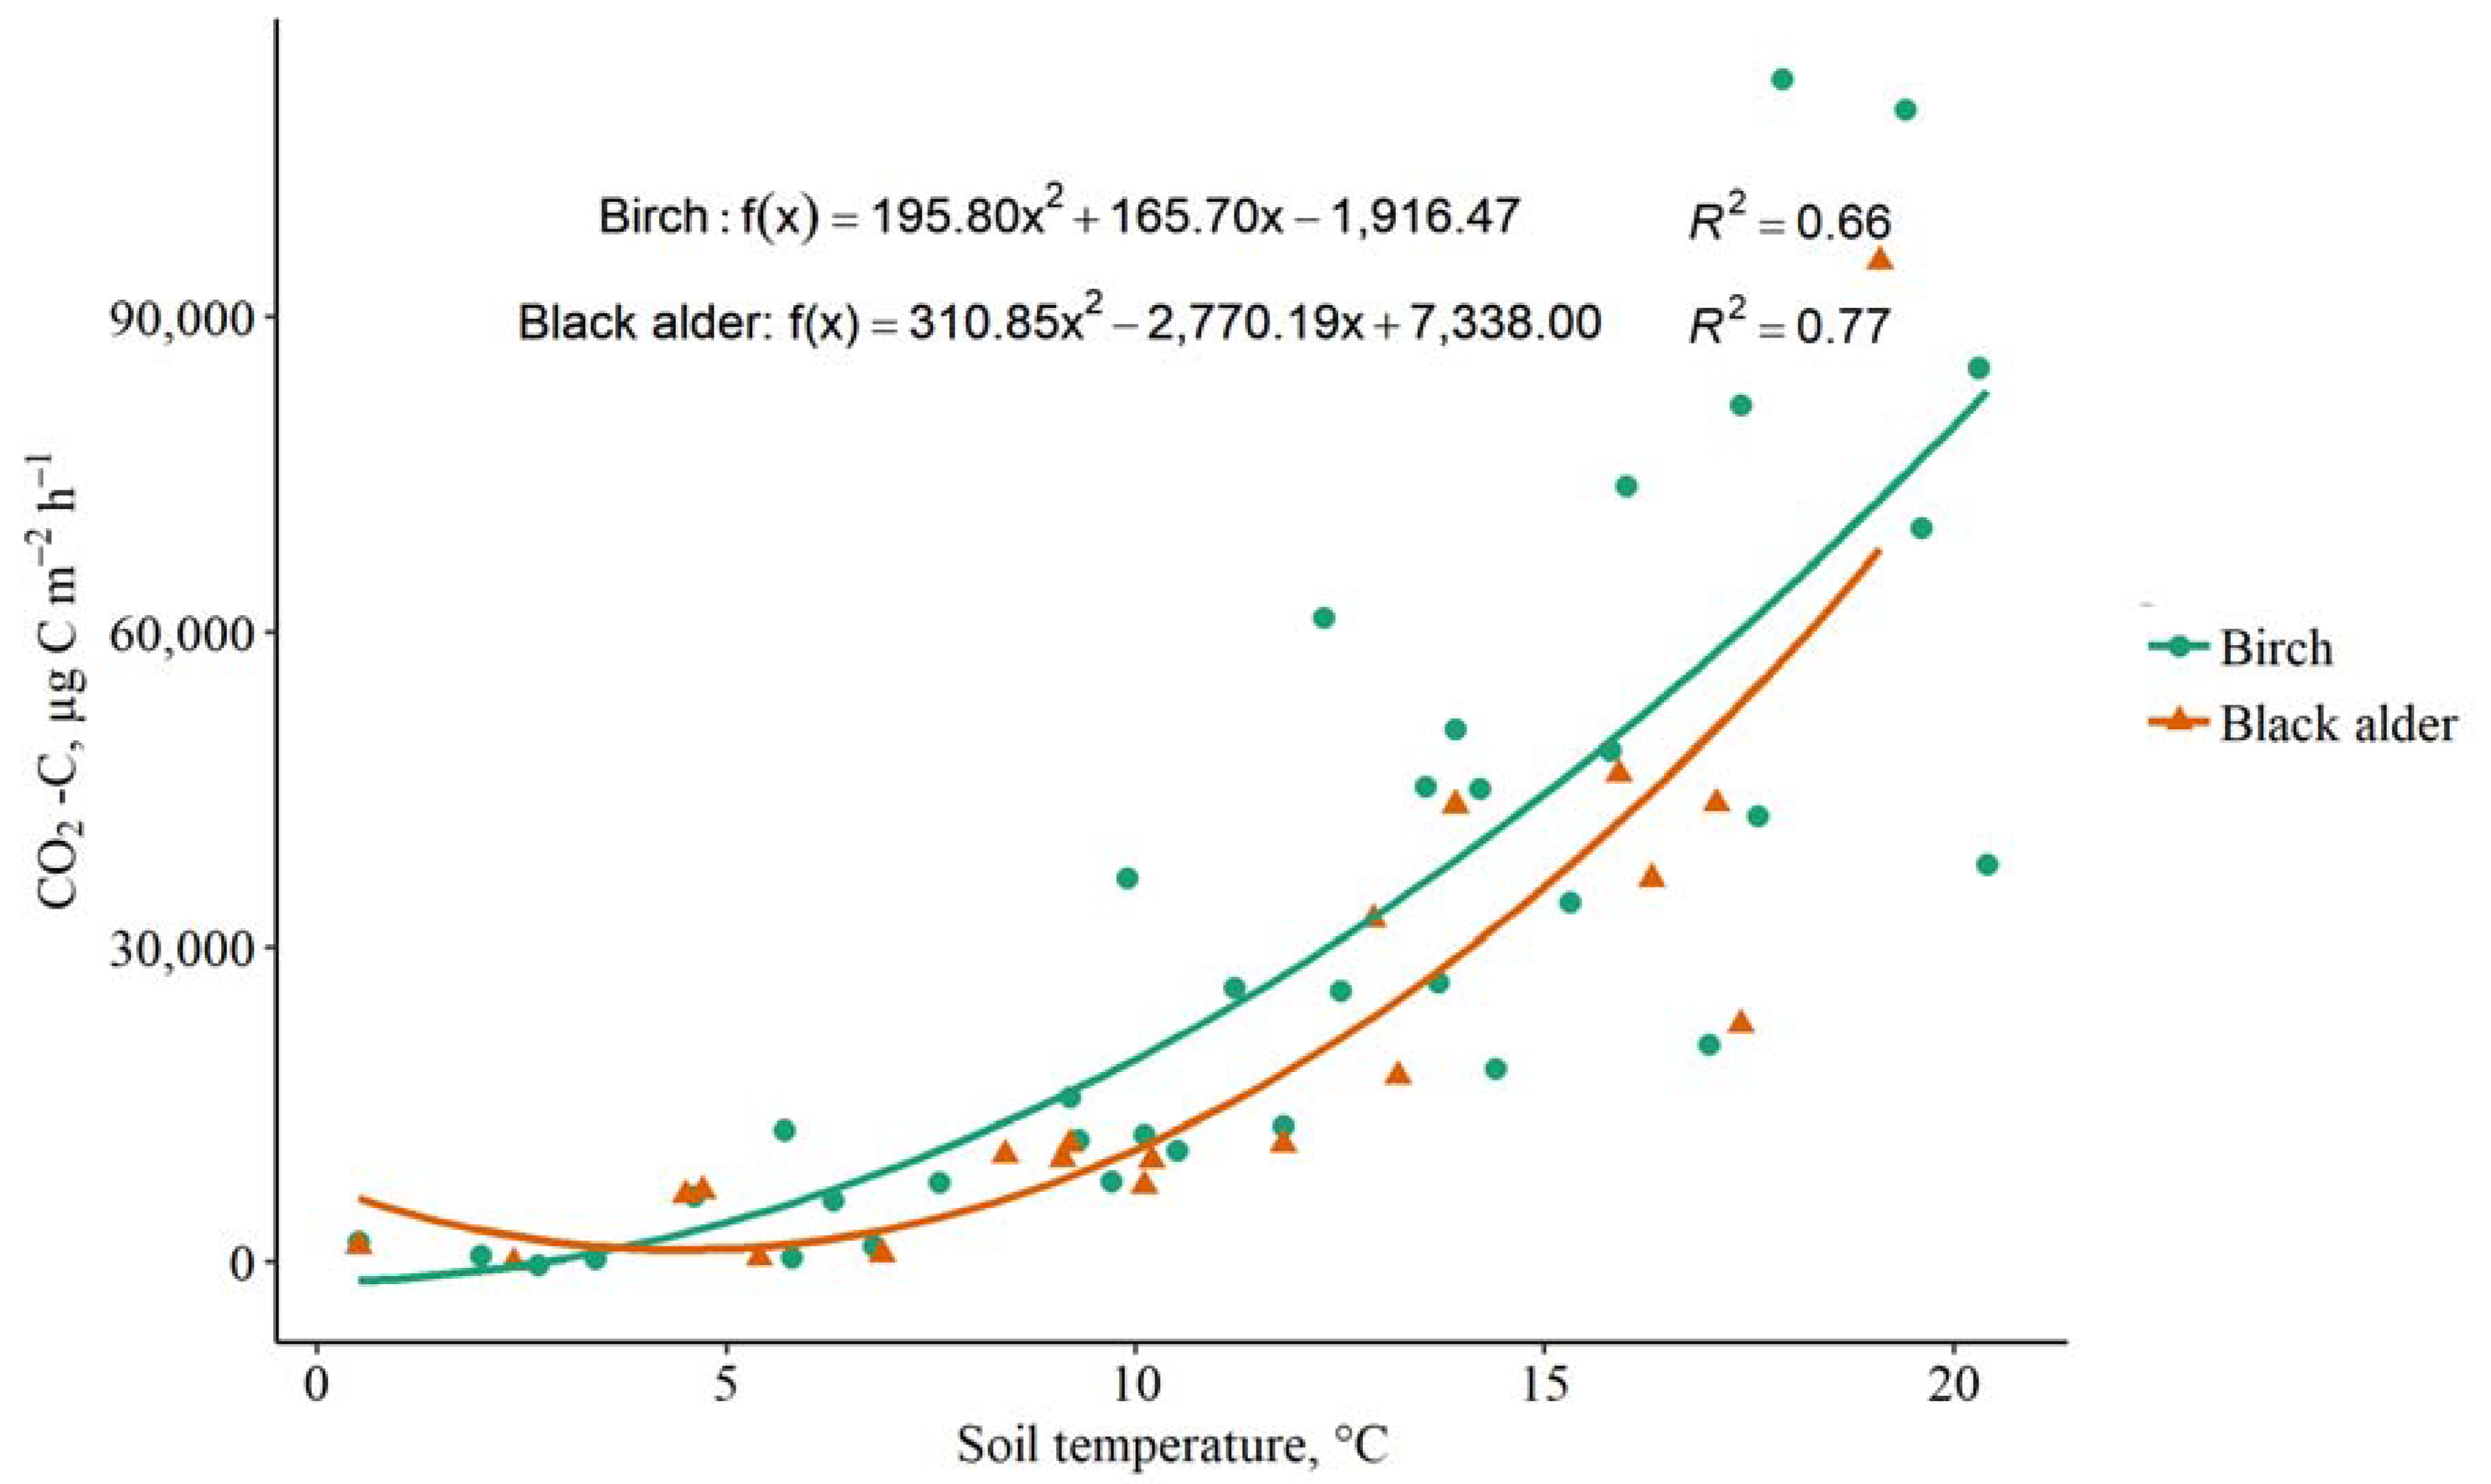
3.2. The Impact of Soil Temperature on CO2, CH4 and N2O Fluxes

Air and soil temperatures at a depth of 10 cm reached their maximum in June in both birch (25.8 °C and 20.6 °C, respectively) and black alder (24.2 °C and 17.9 °C, respectively) stands. The average air and soil temperatures in birch stands were 15.1 °C and 11.3 °C, respectively, and in black alder stands—14.3 °C and 10.7 °C, respectively.
The largest CO2 fluxes from tree stems are detected when the soil temperature rises above 10 °C, but some activity can be observed already when the soil has warmed up to 5 °C. As the soil cools to 0 °C, CO2 emissions decrease. Comparing emissions from both of the tree species, the largest CO2 fluxes were measured in birch stands, where 112.7 mg CO2-C m−2 h−1 was released at 17.7 °C, but in black alder stands emissions did not exceed 95.4 mg CO2-C m−2 h−1 at 19.1 °C (Figure 7). For both birch and black alder, a significant difference was found between the amount of CO2 released when the soil is cooler than 5 °C and when the soil is warmer than 5 °C (p < 0.01). As the interval of comparable temperatures increases to 10 °C, the p-value decreases. A significant, strong, positive correlation was found between the emitted CO2 and soil temperature in birch and black alder stands (Spearman correlation coefficient ρ = 0.89 and ρ = 0.91, p < 0.001, respectively).
Evaluating the impact of temperature on CH4 emissions, the coefficient of determination in silver birch stands was R2 = 0.10, but in black alder stands it was R2 = 0.06 Moreover, an insignificant, weak, negative correlation (ρ = −0.056, p = 0.761) was found between the released CH4 from the tree stem surface and the soil temperature up to 10 cm in birch stands, while an insignificant, weak, negative correlation was found in black alder stands (ρ = −0.18, p = 0.45).
Evaluating the impact of temperature on N2O emissions, the values of the determination coefficients are R2 = 0.02 in birch stands and R2 = 0.04 in black alder stands. An insignificant, weak, negative correlation (ρ = −0.22, p = 0.24) was found between soil temperature and N2O flux in birch stands. In black alder stands, an insignificant, moderate, negative correlation (ρ = −0.37, p = 0.12) was found between the N2O flux from the surface of tree stems and soil temperature.

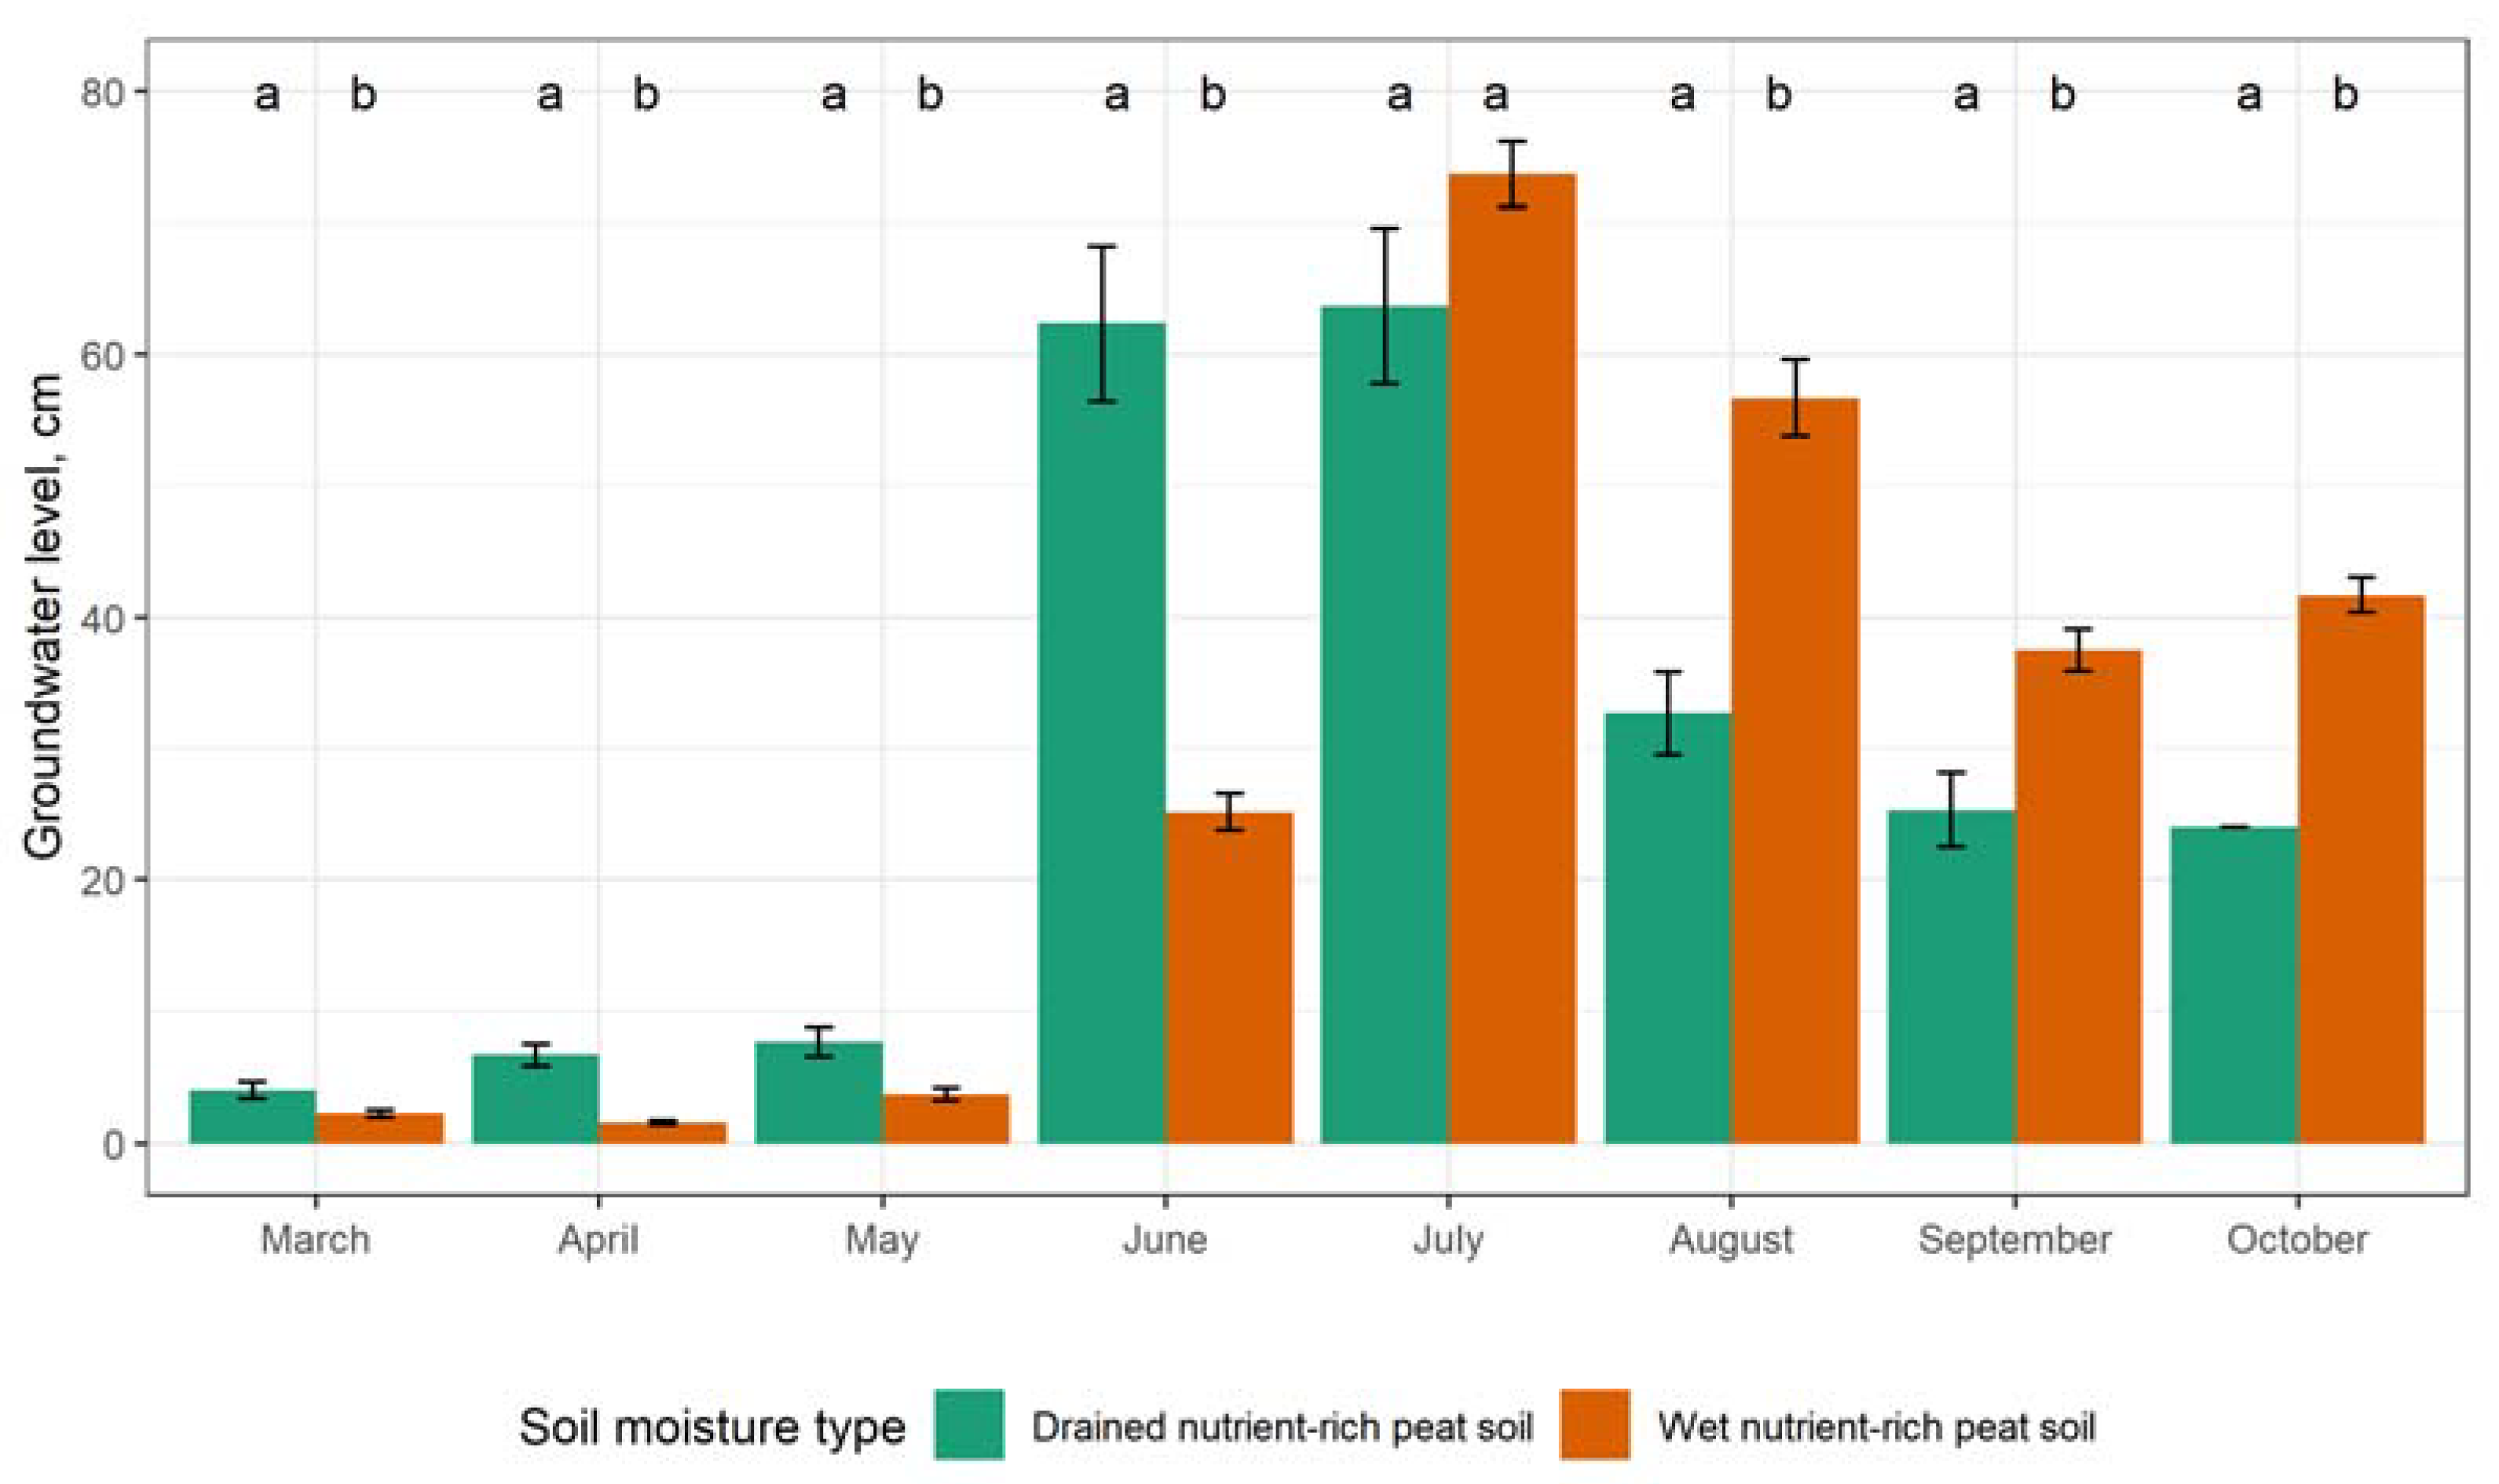
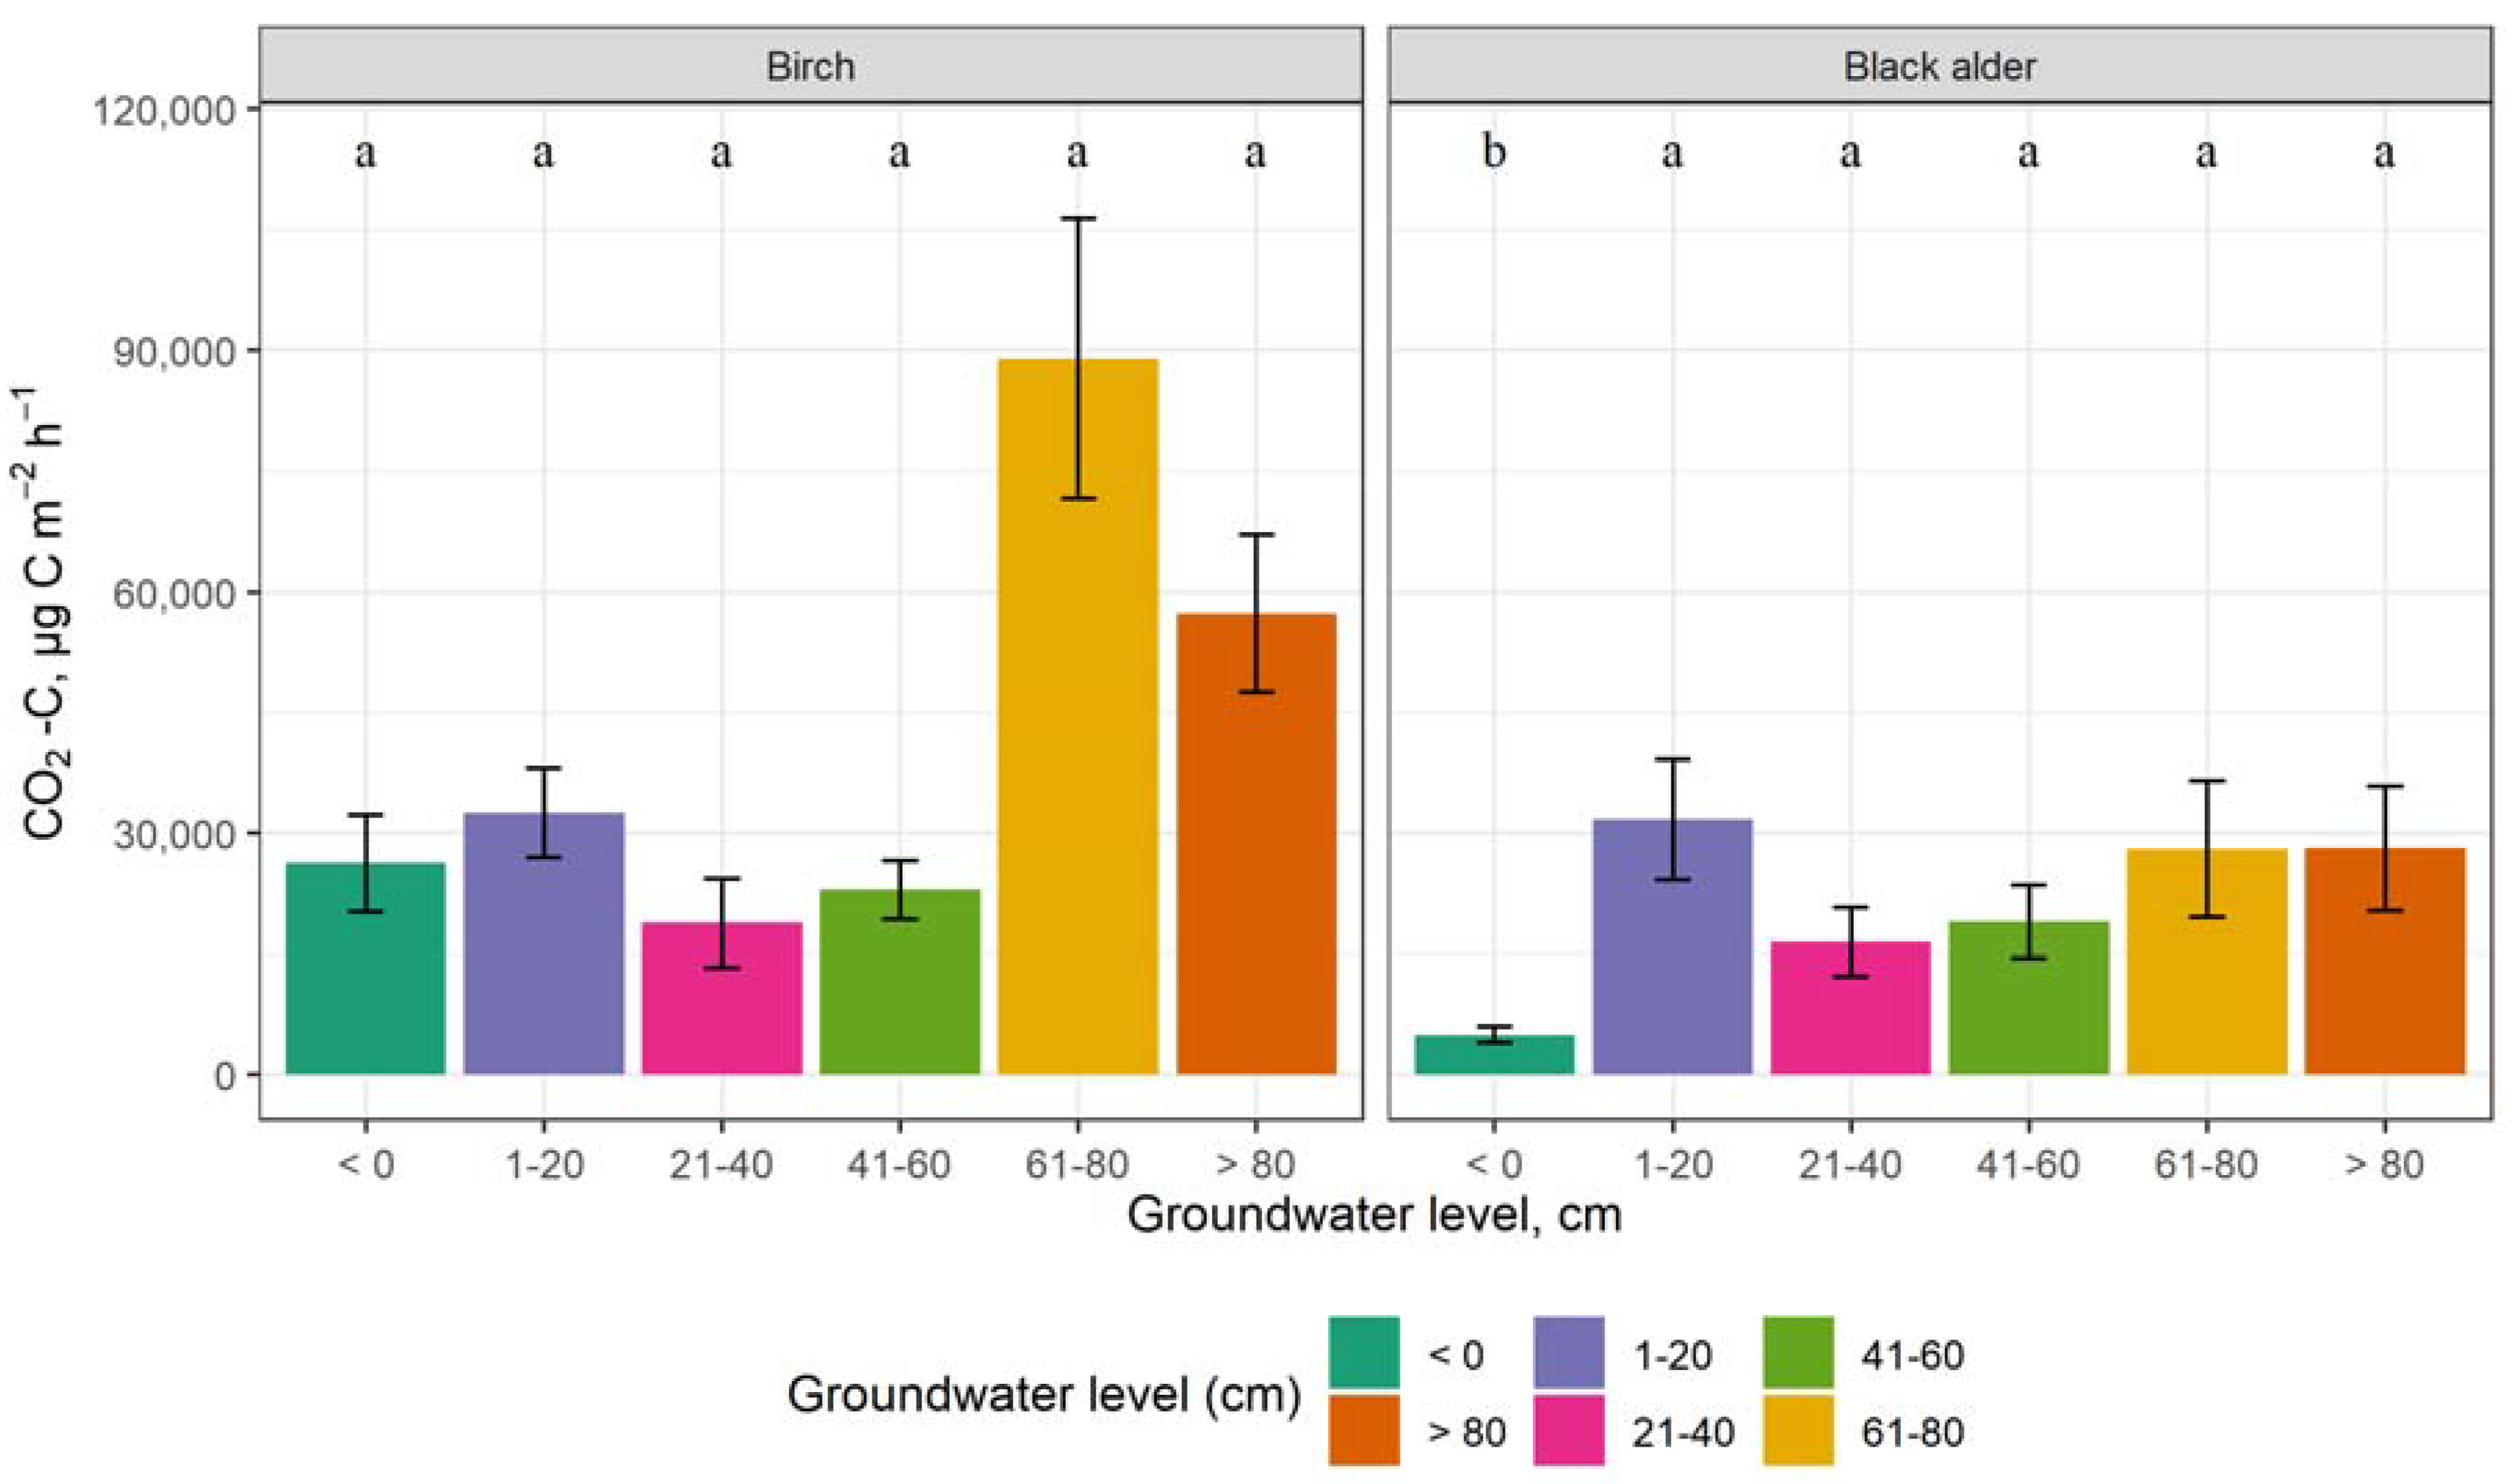
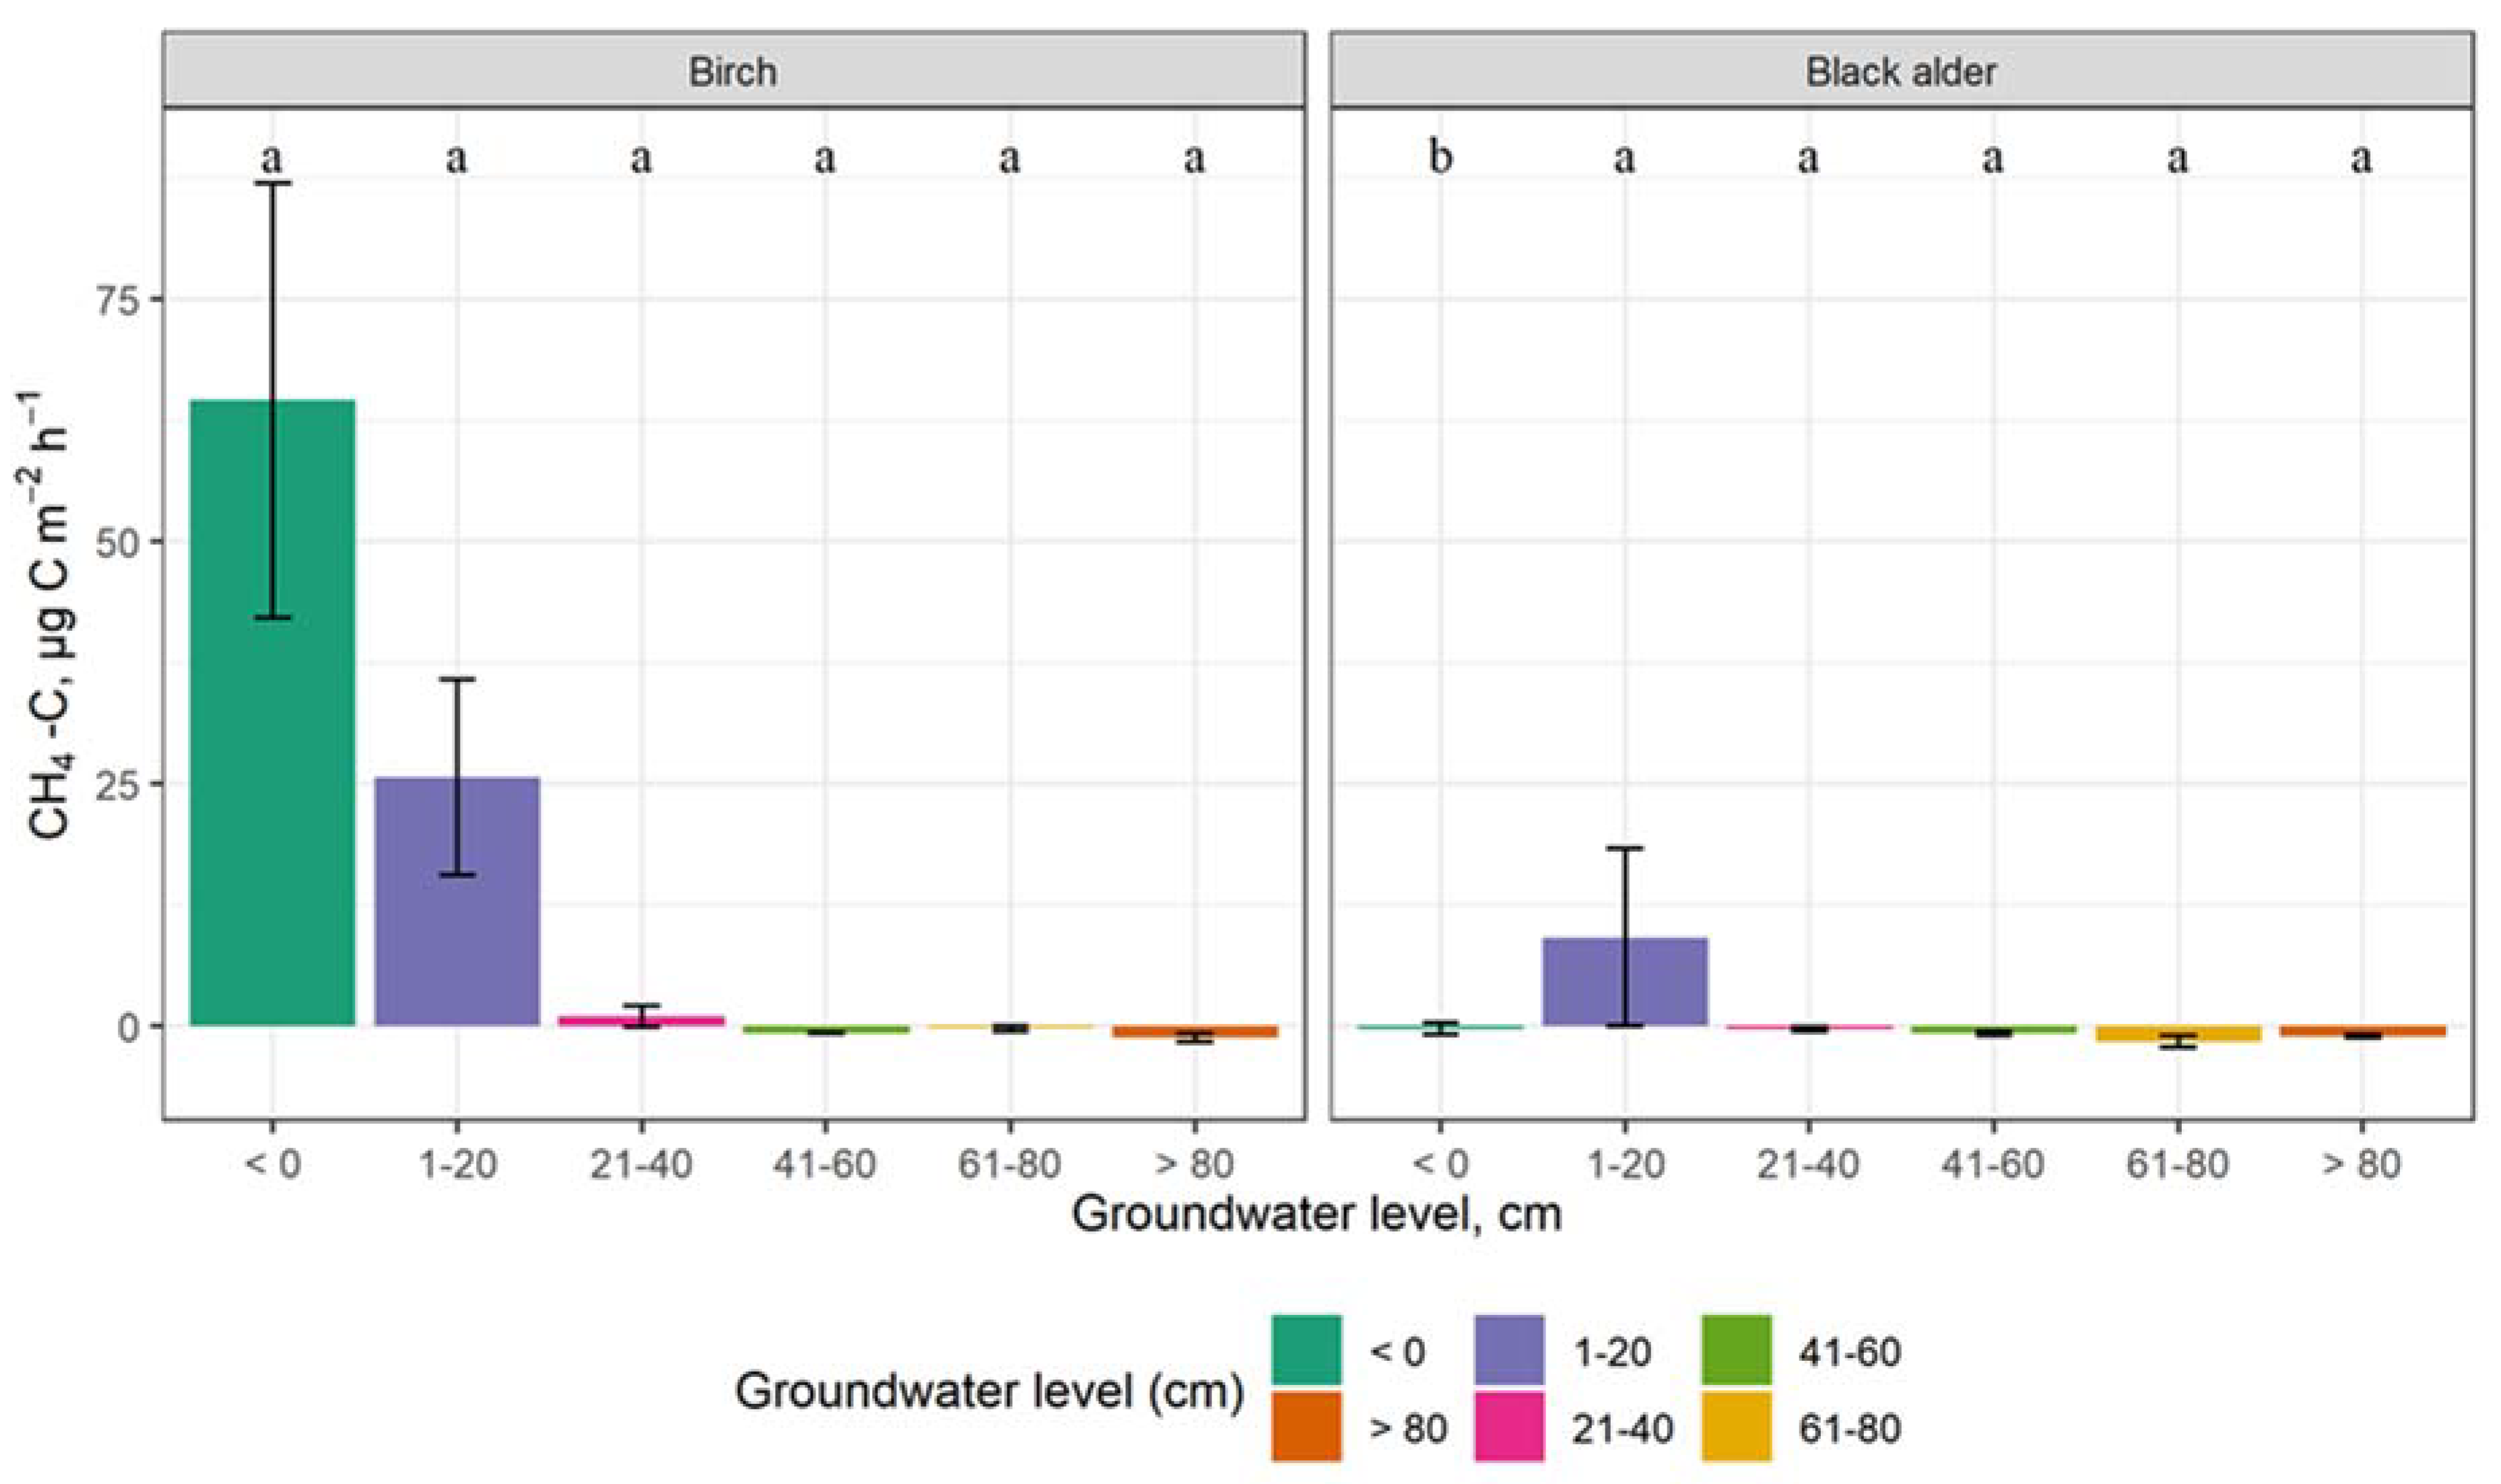
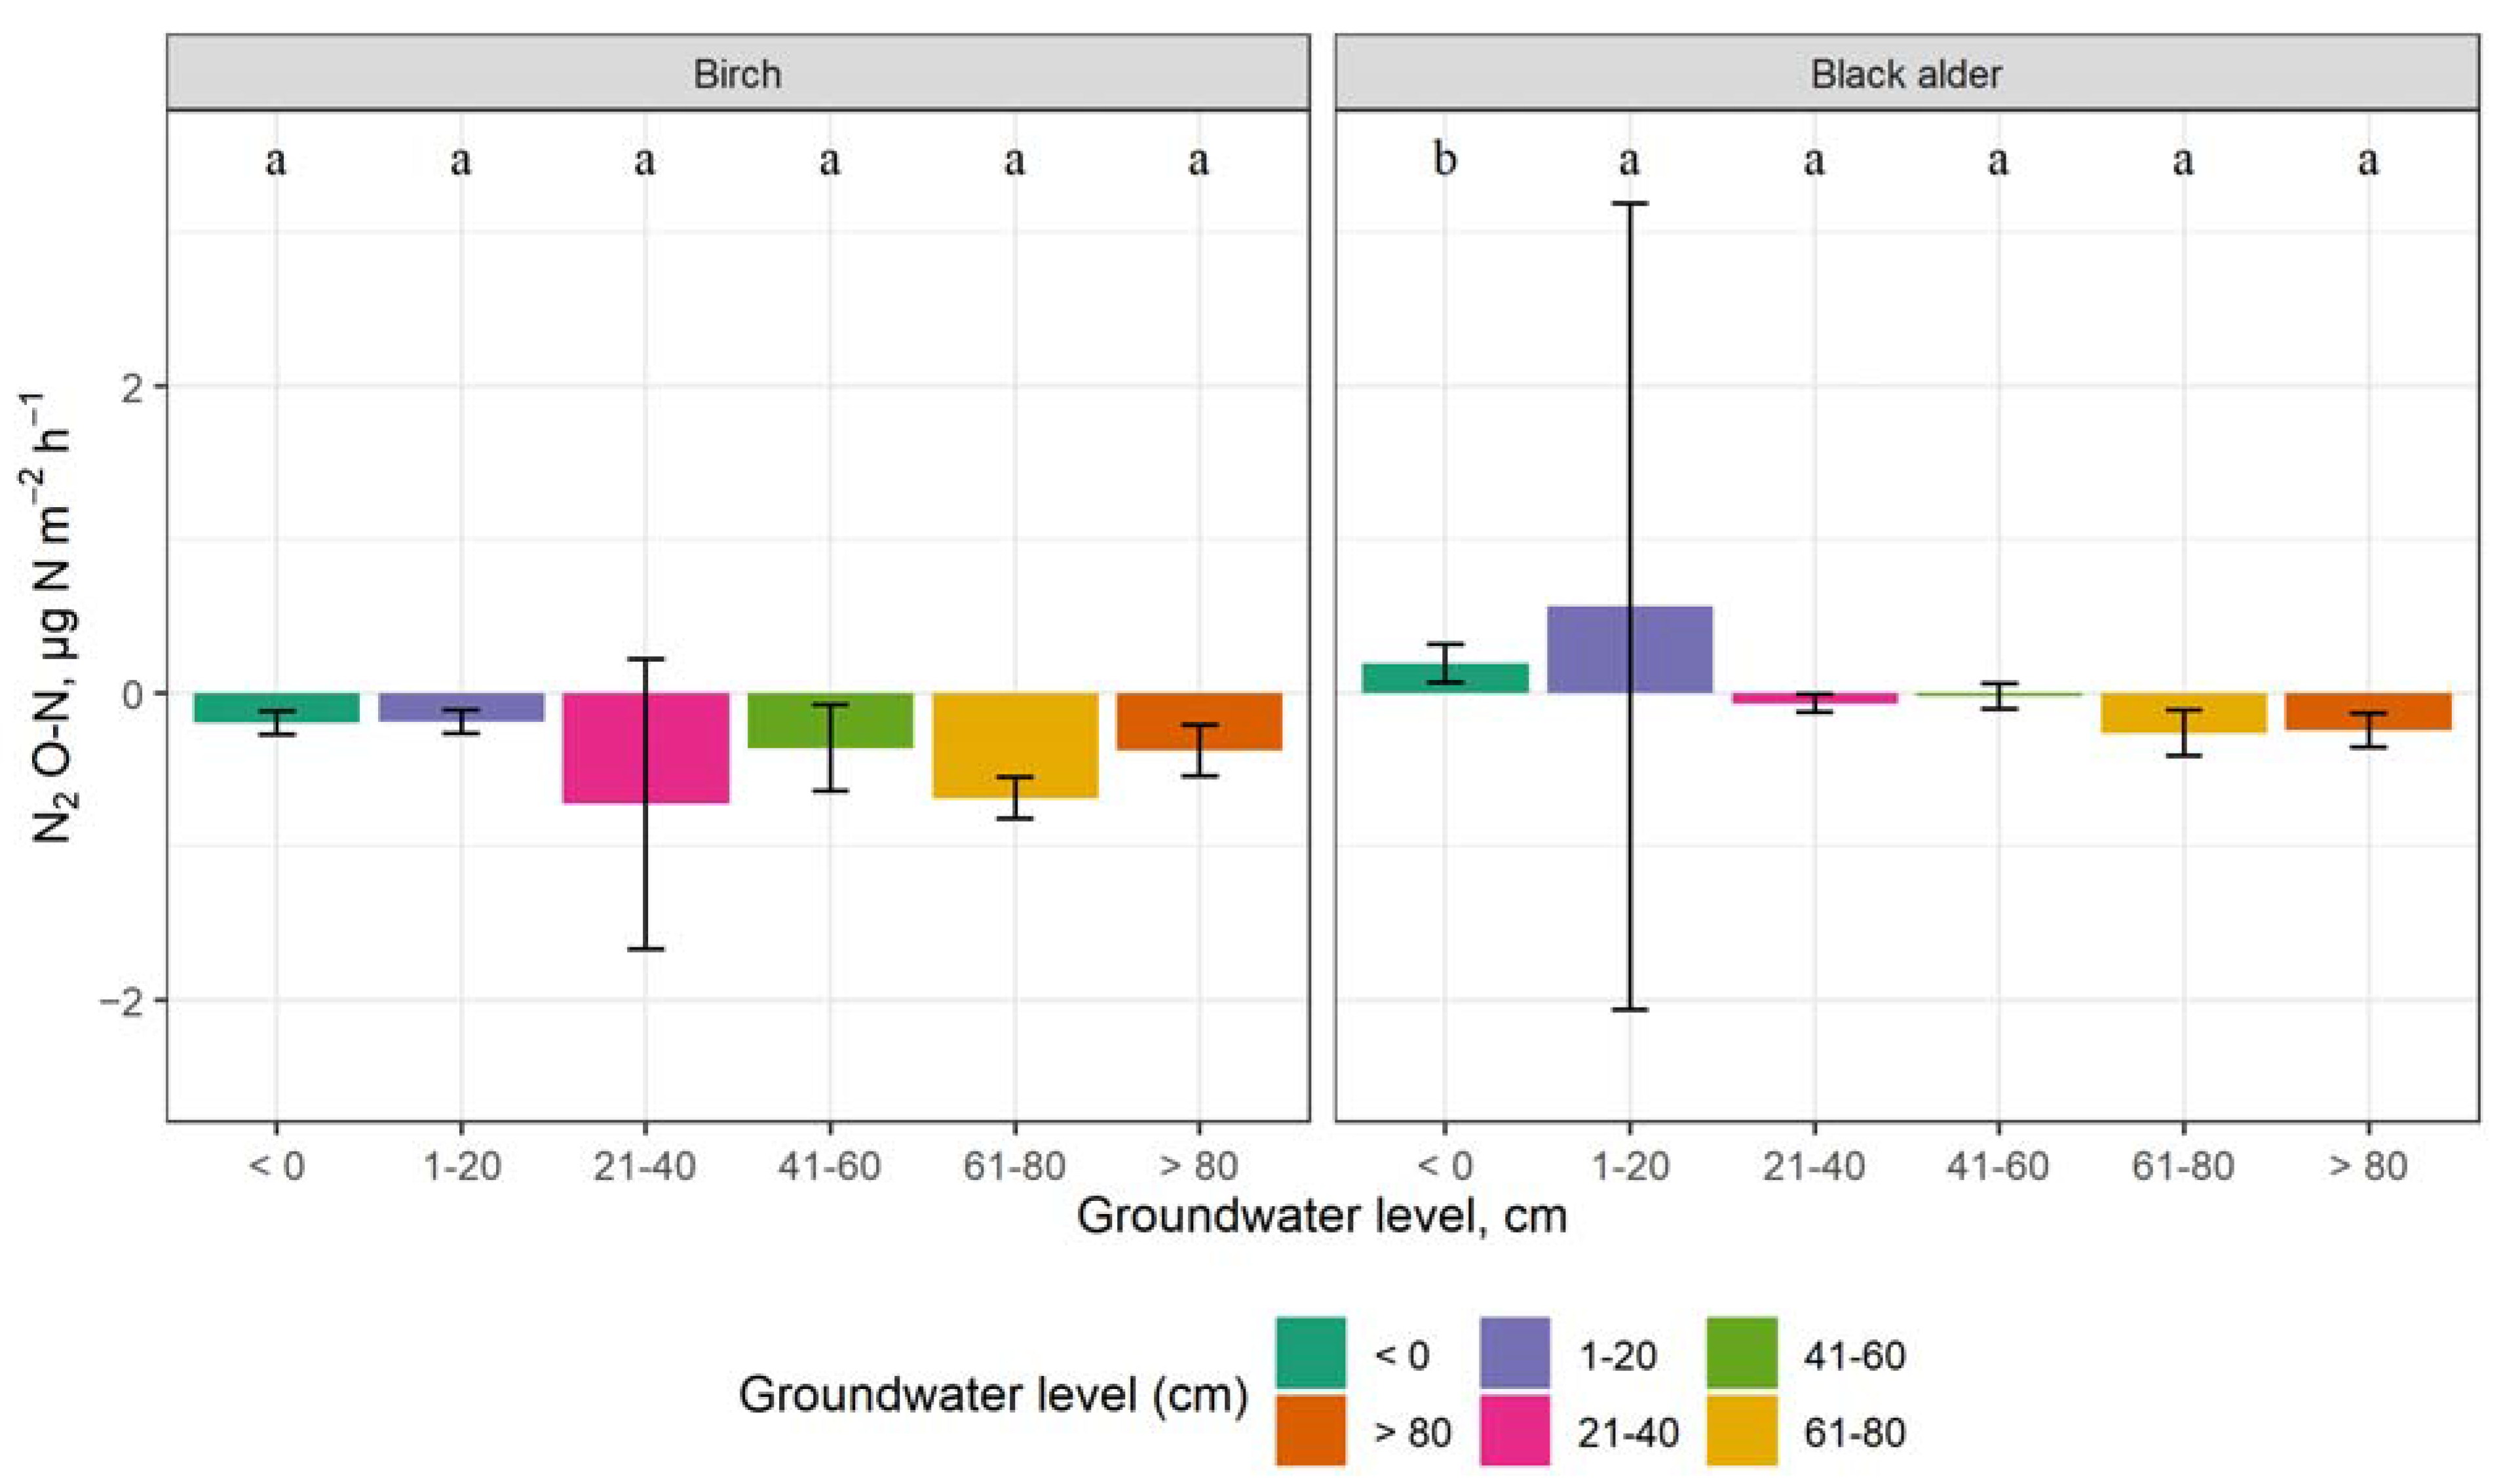
3.3. The Impact of Groundwater Level on GHG Emissions

In both forests with drained and naturally wet organic soils, the groundwater level is high during spring; it lowers as the summer approaches and rises again in autumn. The groundwater level was the highest from March till May when the average groundwater level in birch stands was 4.4 cm and in black alder stands—2.3 cm. The lowest groundwater level was detected in July; in birch stands it was 66.5 cm, but in black alder stands—78 cm (Figure 8). If we compare the emissions from tree stem surfaces in forest stands on drained and wet organic soils without considering tree species, emissions do not differ significantly—CO2 (p = 0.72), CH4 (p = 0.11) and N2O (p = 0. 32). If we compare the p-values, the ones for CO2 and N2O are considerably higher than CH4.
The highest CO2 emissions in birch stands (88,939.85 ± 17,458.35 CO2-C m−2 h−1) were detected when the groundwater level was 61–80 cm, whereas in black alder stands—when it was 1–20 cm (31,655.63 ± 7522.42 µg CO2-C m−2 h−1). There is no significant correlation between the groundwater level and the amount of CO2 released through the stems for both of the studied tree species. Weak, insignificant, positive correlations were found both in birch (ρ = 0.27) and black alder stands (ρ = 0.14). Average CO2 fluxes, depending on the groundwater level, are shown in Figure 9.
More CH4 is released during flooding and when the groundwater level is <0 and 1–10 cm (Figure 10). The CH4 fluxes are higher in silver birch stands. A significant, moderate negative correlation (ρ = −0.48, p < 0.001) was found between the CH4 flux from birch stems and the groundwater level. The influence of groundwater level up to 10 cm is very strong (ρ = 0.95), but, when the level is up to 20 cm, the impact decreases (ρ = 0.46), whereas up to 30 cm the impact of groundwater level is insignificant (ρ = 0.18). A significant moderate negative correlation (ρ = −0.38, p = 0.0013) was found also between the amount of CH4 released from black alder stems and the groundwater level. Moreover, for black alder, CH4 fluxes are higher during flooding and when the groundwater level is up to 10 cm (ρ = 0.47); up to 20 cm, the effect is moderately strong (ρ = 0.30), but up to 30 cm, the influence of groundwater is insignificant (ρ = 0.14).
Similar to CH4, the N2O flux also increases with groundwater levels. When the groundwater level remains at a depth of around 20 cm, higher N2O fluxes from tree stems in black alder stands is observed (ρ = 0.33), but when the groundwater level drops to 30 cm, the effect disappears (ρ = 0.07). In birch stands, a very strong effect on the N2O released from the surface of the stems is observed when the groundwater is up to 10 cm deep (ρ = 0.79), but when the groundwater level drops to 40 cm, the effect decreases but is still strong (Spearman ρ = 0.56). Comparing the amount of N2O released from the surface of black alder stems with the groundwater level, a significant, negative correlation (ρ = −0.28, p = 0.021) was found, while in birch stands the correlation was not significant (ρ = −0.13, p = 0.13). Which means that N2O emissions from the surfaces of tree stems will decrease as the groundwater level decreases. The N2O fluxes (emissions and removals) depending on the groundwater level are shown in Figure 11.

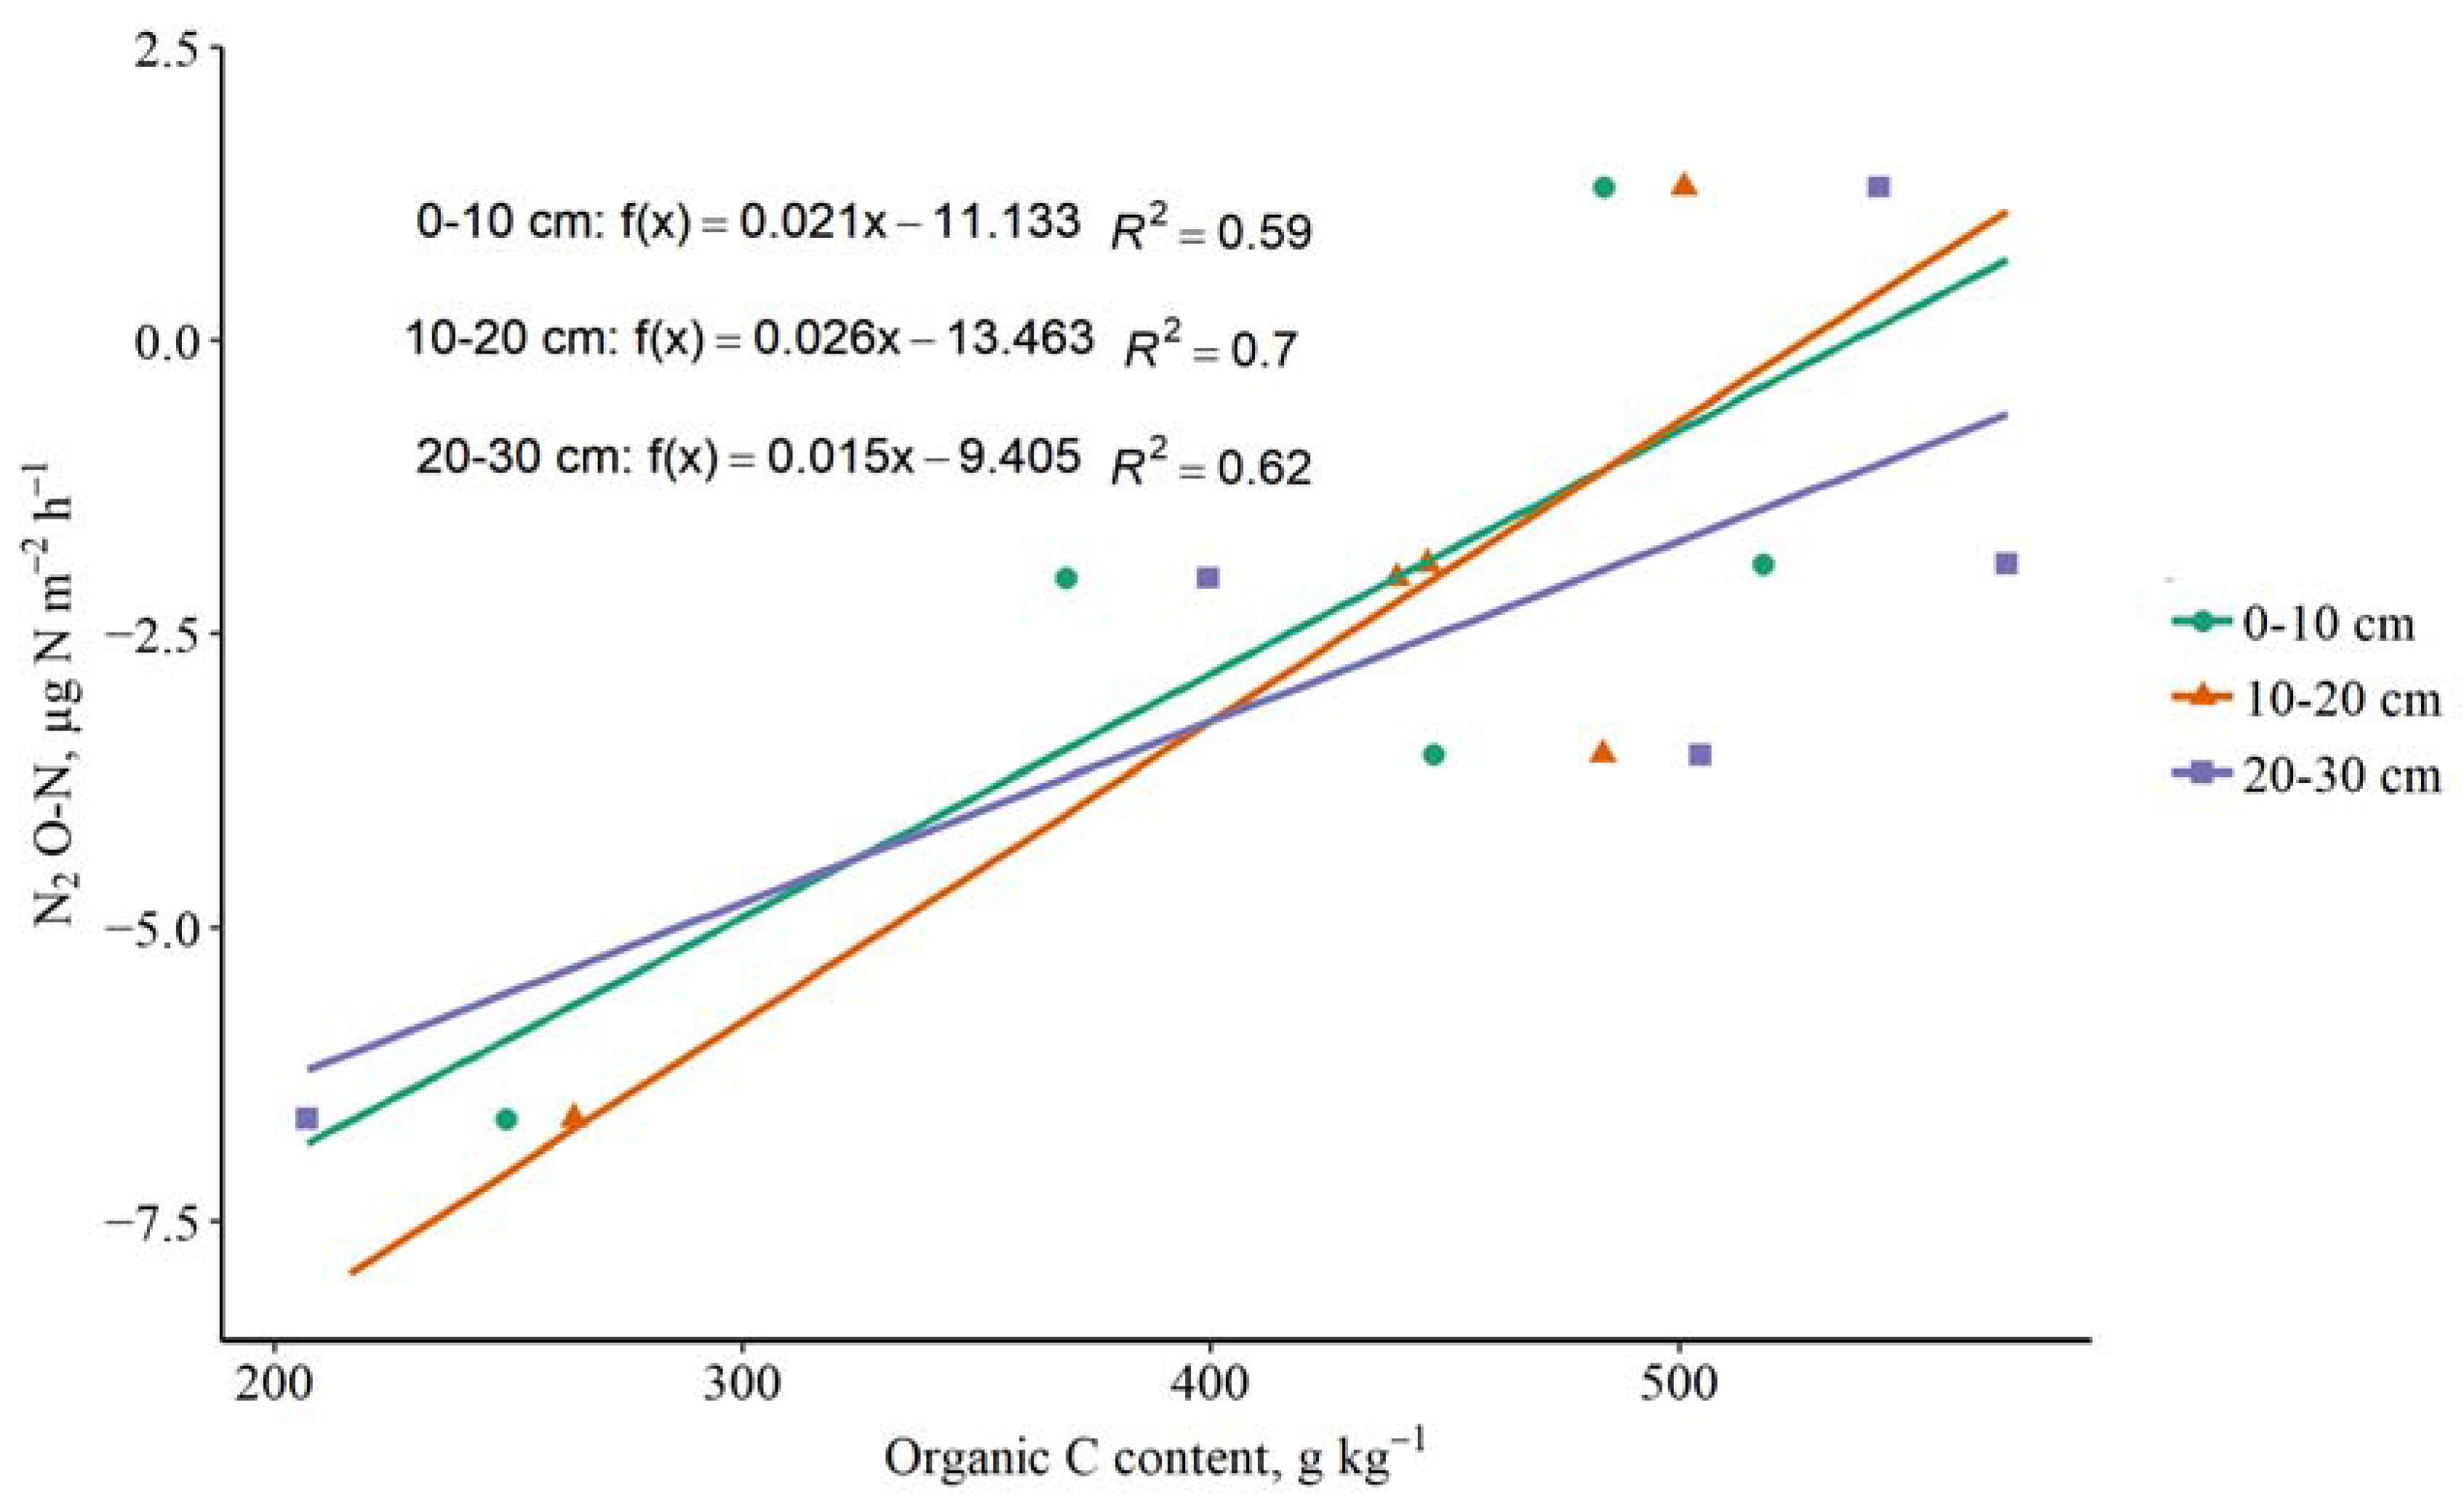
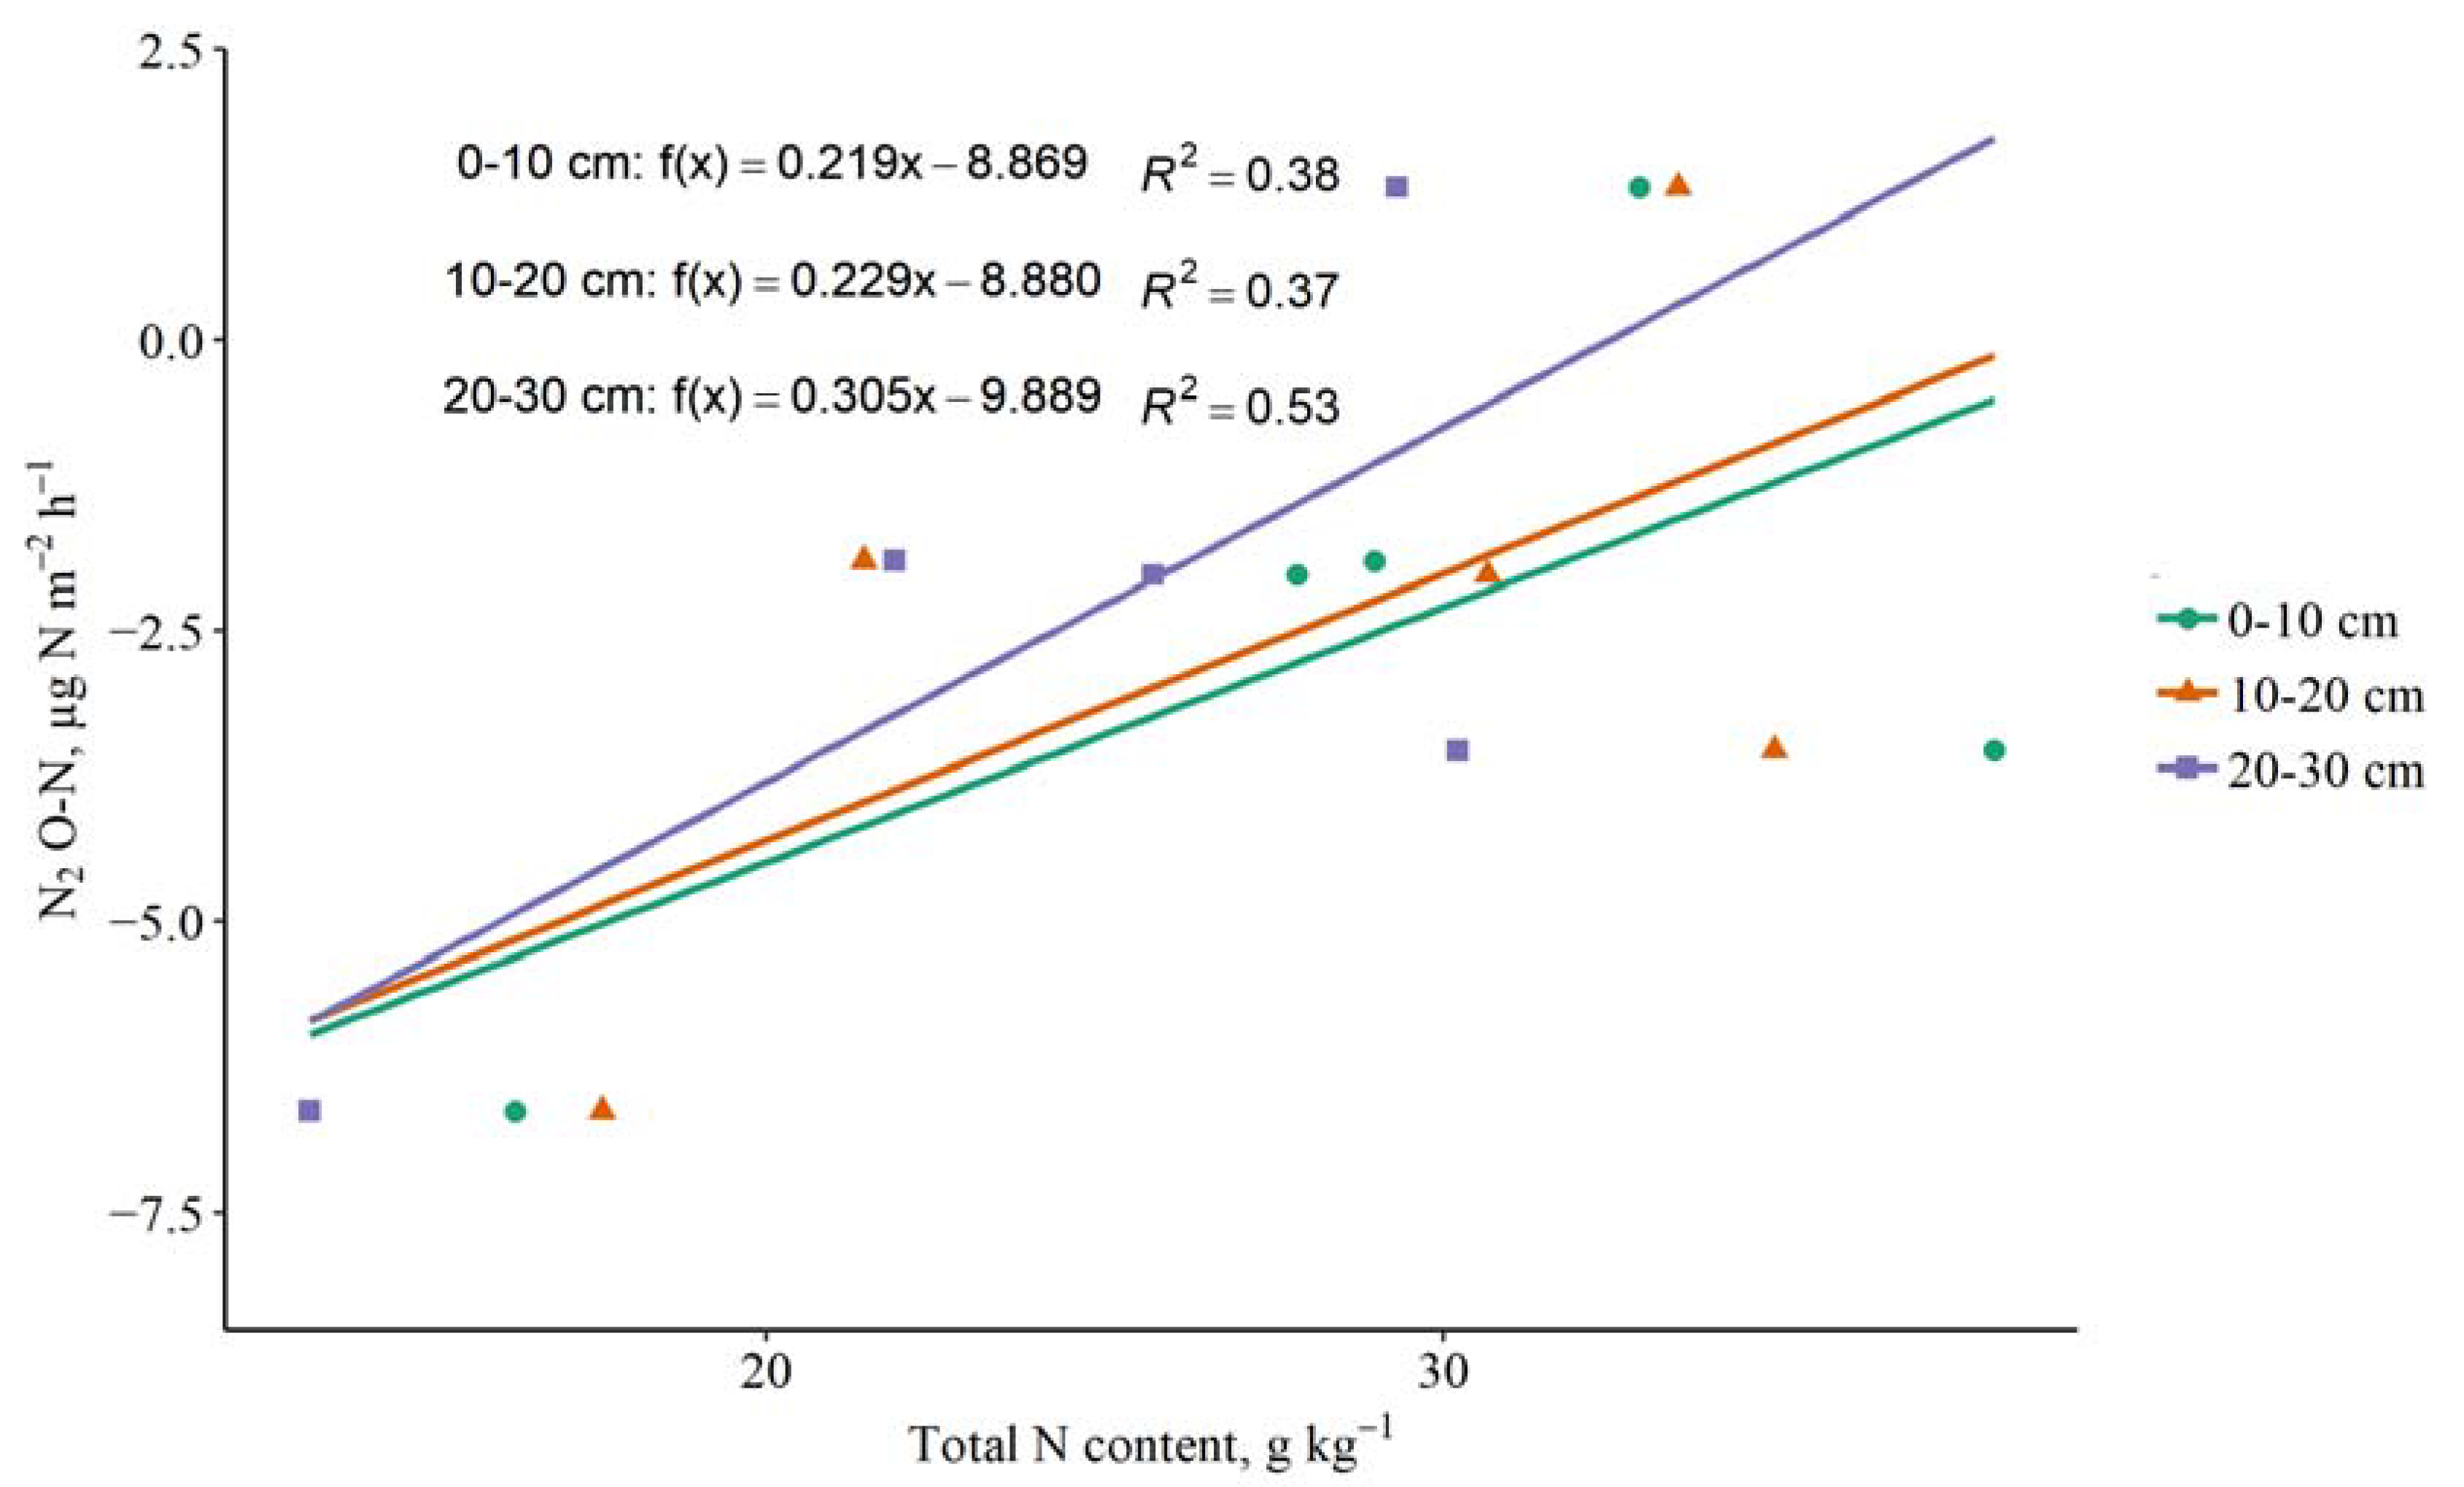
3.4. The Impact of Soil C and N Contents on GHG Emissions

No significant associations were identified between the amount of CH4 emissions from the surface of tree stems and C content in soil at different depths (R2 = 0.014 for 0–10 cm depth, R2 = 0.025 for 10–20 cm depth and R2 = 0.003 for 20–30 cm depth). There is a weak trend for the CH4 flux to increase along with the N content in the soil (R2 = 0.03 for 0–10 cm depth, R2 = 0.15 for 10–20 cm depth and R2 = 0.11 for 20–30 cm depth).
Moderately strong relationships were found between soil C content and the N2O flux from the surface of the tree stems at all the soil depths (R2 = 0.70 for 10–20 cm, R2 = 0.60 for 0–10 cm and R2 = 0.63 for 20–30 cm) (Figure 12). There is also a tendency for the N2O flux to increase along with increasing N content in soil. Moderately strong associations were also found between the N2O flux and N concentration in the soil, from which the strongest was at the depth of 20–30 cm (R2 = 0.53), compared with 10–20 cm (R2 = 0.37) and 0–10 cm (R2 = 0.38) (Figure 13).

4. Discussion

4.1. Seasonality of GHG Fluxes and the Impact of Tree Species

In our study, seasonality of CO2 fluxes was observed as well as positive correlations with soil and air temperature; however, for CH4 and N2O, seasonality was either less pronounced or there were only removals detected. A significant impact of stand age on GHG fluxes was not found in this study.
Results from a study carried out in a boreal forest in Finland show a distinct seasonal pattern for both CO2 and N2O fluxes from tree stems, and the level of emissions remains significant throughout the year. The emissions reach the maximum during the vegetation season, decrease in October, and remain low during the dormant period in winter [33]. Results from a study carried out in a deciduous upland temperate forest in the Mid Atlantic region of the USA show the seasonal pattern for CO2 and CH4 stem emissions, whereas no such pattern was observed for N2O, which is similar to our study [41]. Additionally, in a study carried out in Estonia in a riparian grey alder forest, a seasonal variability for CH4 and N2O fluxes was observed. The measured tree stems were net emitters of CH4 with flux rates of 4.63 ± 1.42 μg C m−2 h−1 during daytime and 2.96 ± 0.88 μg C m−2 h−1 during nighttime in summer 2017, which were substantially higher in the following spring in May 2018 (168.47 ± 33.59 μg C m−2 h−1, nighttime). Our estimates are higher than the fluxes measured in summer in the Estonian Grey alder forest, but lower than those of the following spring in this study. In the same study site in Estonia, tree stems were also net N2O emitters: in summer, 14.93 ± 4.90 μg N m−2 h−1 in the day and 11.17 ± 3.56 μg N m−2 h−1 at night; in spring, 3.30 ± 0.83 μg N m−2 h−1 in the daytime and 2.39 ± 0.56 μg N m−2 h−1 at nighttime; summer 2018, 0.11 ± 0.08 μg N m−2 h−1 in the daytime and −0.04 ± 0.22 μg N m−2 h−1 at nighttime [42]. In our study in silver birch stands, only removals were detected during the whole study period, and in black alder stands, 1.44 ± 0.71 µg N2O-N m−2 h−1 was measured in June, whereas in spring and summer, on average, only removals were detected. In a study carried out in Agali Drained Peatland Forest Research Station in Estonia, birch trees were a net annual source of both CH4 (0.38 ± 0.09 μg C m−2 h−1) and N2O (0.94 ± 0.32 μg N m−2 h−1). Birch stem CH4 emissions peaked significantly in November and June. Birch stem N2O emissions were negligible for most of the year, increasing slightly during March and the autumn months [43].
Pitz et al. measured CH4 fluxes from tree stems and soils in different habitats along a moisture gradient. The study was carried out in the USA, at Chesapeake Bay in Maryland. The mean CH4 emissions from tree stems were 68.8 ± 13.0, 567.9 ± 174.5 and 180.7 ± 55.2 µg CH4-C m−2 h−1 for upland, wetland and transitional habitats, respectively, whereas the mean CH4 emissions from soil for those habitats were 64.8 ± 6.2, 190.0 ± 123.0 and 7.4 ± 25.0 µg m−2 h−1, respectively. According to this study, fluxes from stems exceed those from soil in upland and wetland habitats, highlighting the importance of tree stems as significant GHG sources [9]. In a study carried out in Finland in a forested fen, where fluxes were measured from April to June, the median CH4 emissions from downy birch stems ranged from 0.11 to 100 µg m−2 h−1, depending on the tree height [44]. Our results fall within the previously reported estimates. During a study of peatlands in Finland, the measured CO2 fluxes from soil ranged from −0.01 to 2.14 g m−2 h−1, CH4 fluxes varied between −0.53 and 24.5 mg m−2 h−1, and N2O fluxes ranged from −0.07 to 0.45 mg m−2 h−1. These emissions and removals are higher than those of stems in our study [45]. In a study carried out in black alder stands growing in rewetted peatland in north-eastern Germany the highest stem CH4 flux was recorded in May—4.0 mg m−2 h−1, whereas the average stem emissions were 0.1 ± 0.3 mg m−2 h−1. The highest soil CH4 flux was 132.4 mg−1 m−2 h−1, but the average soil CH4 emissions were 4.8 ± 18.8 mg−1 m−2 h−1 [46]. In a study carried out in Latvia, the mean CO2 emissions from drainage ditches in peatland forests was 136.6 ± 28.7 mg CO2-C m−2 h−1, the mean CH4 emissions were 0.085 ± 0.034 mg CH4-C m−2 h−1 and the mean N2O emissions were 0.009 ± 0.003 mg N2O-N m−2 h−1 [47].
In a study carried out in the volcanic Réunion Island, it was found that mosses, lichens, algae and bacteria found on tree stems consume CH4 and make trees a major CH4 sink (8.3 ± 3.0 µg CH4-C m−2 h−1) [48]. The CH4 and N2O removals in our study could also be explained by the activity of microorganisms on tree bark. In the case of N2O, it is assumed that these organisms reduce N2O to N2 in the final denitrification process.
Species morphological and physiological differences could be the reason why birch stands emit more CO2 than black alder stands. Stem CO2 emissions are the main indicator of tree respiration [49]. In a study focusing on differences of CO2 fluxes between deciduous tree stems, it was found that CO2 efflux differences are related to differences in the concentration of non-structural carbohydrates and the proportion of living parenchyma in sapwood [50]. Species-specific differences could also explain why birch stands emit more CH4 than black alder stands when moisture conditions are similar. Studies have shown that black alder is more tolerant to elevated groundwater levels than birch [51,52]. Another study carried out in a temperate wetland forest showed that stem CH4 emissions varied significantly between black alder and downy birch (Betula pubescens Ehrh.). The seasonal variations for black alder were minimal, while substantial variations were observed for downy birch [14]. It is well known that there are species-specific differences in CH4 transport mechanisms in plants [53,54]. It is possible that black alder and birch use different CH4 transport mechanisms or a combination of convective transport and passive diffusion [14]. Pangala et al. suggested that stem CH4 transport in black alder trees is mainly driven by passive diffusion [55]. The significant differences in N2O emissions between the species could be explained by the fact that black alder grow in symbiosis with actinomycetes Frankia sp. that are capable of fixing N2 [28,29], whereas birch trees do not have such ability. It is known that black alder increases N availability in soil and mediate N2O from soil.

4.2. The Impact of Soil and Air Temperature

Temperature is usually mentioned as one of the main factors that have an impact on GHG fluxes. The seasonality of CO2 fluxes from both silver birch and black alder stems discussed in the previous section could be explained by the annual changes in soil and air temperature and the subsequent decrease/increase in tree physiological activity, as positive correlations between CO2 fluxes and soil and air temperature have been found [33,56,57]. Respiration and diffusion rates, sap flow and other physiological processes in trees are assumed to increase exponentially with an increase in air temperature [22,58,59]. In a study carried out in Finland, positive correlations were found between net GHG fluxes of stems and indicators of physiological activity—gross primary productivity (GPP), photosynthetically active radiation (PAR) and evapotranspiration [33].
The results of several previous studies on GHG fluxes from stems of deciduous trees have shown a significant and positive correlation between temperature and the amount of CO2 released into the atmosphere [18,59,60]. As air temperature increases, the amount of CO2 released in summer is significantly higher than in winter, spring or autumn [59]. In a study conducted in a riparian grey alder forest in Estonia, a moderate negative correlation was found between soil temperature and the CH4 flux from the surface of tree stems; however, no significant correlations were found at the ecosystem level [16]. Results regarding N2O emissions vary. In some studies, seasonal changes can be observed, driven by light intensity and temperature [25,33,61]. However, there are also studies in which such seasonal patterns of N2O fluxes were negligible [12].

4.3. The Impact of Groundwater Level

Groundwater level shows a seasonal pattern in both forests with drained and naturally wet organic soils. This pattern can be used to predict the potential timing at which GHG emissions from tree stems are elevated. The results show that the groundwater level is lower in stands with drained peat soil, indicating that the drainage system is functioning effectively. This ensures a shorter period of time during which tree roots are exposed to excessive moisture and reduces the time during which tree stems are a source of GHG emissions.
In our study, there was no relationship between the groundwater level and CO2 fluxes. The effect of groundwater level on CO2 emissions from tree stems is evident in stands with drained soil after thinning, where water availability was previously limited. As the number of trees decreases, competition for the necessary resources decreases, so physiological processes in the remaining trees improve, leading to an increase in the amount of CO2 released [62].
The main reason for the seasonal variation in CH4 emissions from tree stems is the groundwater level. Our results show that as the groundwater level decreases in both birch and black alder stands, the amount of CH4 emitted from tree stems decreases. In the birch stands, the highest amount of CH4 was emitted in June, which could be related to the high groundwater level in May, as emissions decrease in the following month when the water level drops. A similar tendency is observed in black alder stands, where the amount of CH4 released is the highest in May when the groundwater level is 10 cm. As the groundwater level stabilizes, few or no fluxes are detected.
In general, CH4 emissions have been studied in waterlogged or flooded areas, where soil is usually the source of GHGs. The results of a study carried out in a temperate, spring-fed, forested peatland in the United Kingdom show that more CH4 is emitted during the high water season (from April to July) [14]. In a study in mature riparian grey alder forest stands in Estonia, CH4 emissions from tree stems at 170 cm height before flooding did not differ significantly between the experimental site and the control site. When the experimental area was flooded, the amount of CH4 released from both soil and tree stems increased significantly, and this effect persisted even after the experiment. Similar observations were made for N2O emissions. In most cases there were no differences between N2O emissions from the control and treatment site before flooding, but as the groundwater level rose, the amount of N2O released increased [15]. In a study carried out later on the same study site in Estonia, 86% of all the CH4 emissions were found to be due to excess humidity. The results of this study showed a strong positive correlation between emissions from tree stems and soil water levels. The study concluded that the amount of CH4 emitted from tree stems differs significantly during dry and flooded periods [16]. Other studies carried out in wetland forests also show a positive relationship between tree stem GHG fluxes and water table depth [13,14,63,64,65]. These findings suggest that CH4 produced under anoxic conditions in groundwater enters plant tissues, where it is further transported and emitted to the atmosphere.
To limit CH4 emissions in forests with wet and drained nutrient-rich peat soils, the groundwater level should be at least 15–20 cm deep during the vegetation season. In drained forests, this can be achieved by maintaining and restoring drainage systems and restoring natural water flows damaged by logging. In forests with wet soil, the moisture regime can be improved by creating a network of deep furrows during reforestation, which drains excess water from the top layer of the soil and reduces the area of waterlogged depressions. Future studies should examine the effects of selective logging, wood ash application and other activities that promote evapotranspiration on groundwater levels and CH4 emissions to expand the range of emission reduction tools available to forest owners. An essential prerequisite for evaluating the potential to reduce CH4 emissions and the impact of implemented actions is to improve action data (models that predict groundwater level change), which is currently one of the problematic aspects of modeling emissions from soils and tree stems.
The increase in N2O emissions in March and April could be caused by the fluctuations in the groundwater level or sudden flooding in March, as N2O can form during rapid flooding. Increased N2O flux can also be observed after the water recedes [15].

4.4. The Impact of Soil C and N Contents

Soil C and N contents have also been mentioned in previous studies as one of the factors affecting GHG emissions from tree stems. The formation of N2O requires high soil N concentration and favorable conditions for oxidation-reduction reactions. In naturally wet peat soils, water has low oxygen (O2) content, reactions occur slowly and the amount of N2O released is low [66]. The results of a study carried out in peatlands in Finland show that drainage of peat soil rich in nutrients (including N) increases the O2 content in soil and thus the rate of mineralization of N, creating favorable conditions for nitrification and promoting the formation of N2O. NH3 not used by plants can be denitrified to NH4+ in the reduction process, which also leads to the release of N2O. The lower the C:N ratio was, the more the N2O increase was detected when the C:N ratio exceeded 30, whereas, N2O emissions increased exponentially with decreasing C:N ratio when the study site was dry—the groundwater level was lower than 30 cm. Additionally, N concentration in peat correlated positively with N2O emissions, but the correlation was not as pronounced as for the C:N ratio [31]. In a study carried out in Estonia, in a grey alder stand, the soil NO3 concentration was positively and NH4+ concentration was negatively related to N2O emissions from stems at different heights. A significant relationship was identified between the N2O fluxes from tree stems and nitrogen availability in soil [15]. In our study, higher C and N concentrations in soil were positively associated with N2O fluxes from silver birch and black alder stems.

5. Conclusions

This study confirms that stems of deciduous trees growing in areas with organic soils can be a significant source of CO2 and CH4 emissions. No significant N2O emissions were detected in this study. There are significant differences between GHG emissions from silver birch and black alder stems, which can be associated with species-specific physiological and morphological differences. CO2 emissions show a distinct seasonal pattern and a strong positive correlation with soil temperature. A soil temperature of 5 °C can be considered a threshold value that distinguishes between relatively high and low CO2 fluxes from tree stems. The main factor influencing CH4 emissions in both silver birch and black alder stands is the groundwater level, as a moderate negative correlation was found between the two variables. However, the impact of groundwater is significant only if it is 10 cm or higher. When the groundwater level is 30 cm or lower, the impact becomes insignificant. The C and N concentrations in soil are the main factors affecting N2O emissions from tree stems. The N2O flux has a tendency to increase as the C and N contents in soil increase.

Author Contributions

Conceptualization, A.L.; methodology, A.L. and G.S.; software, A.B.; validation, G.P. and R.A.; formal analysis, R.A. and G.P.; investigation, G.S., R.A., R.N.M. and D.P.; resources, G.S.; data curation, G.P.; writing—original draft preparation, R.A. and G.P.; writing—review and editing, G.P. and A.B.; visualization, G.P.; supervision, A.B.; project administration, A.L.; funding acquisition, A.L. All authors have read and agreed to the published version of the manuscript.

Funding

This research was funded by the Fundamental and applied research program “Evaluation of factors affecting greenhouse gas (GHG) emissions from surface of tree stems in deciduous forests with drained and wet soils”, grant number LZP-2021/1-0137.

Institutional Review Board Statement

Not applicable.

Informed Consent Statement

Not applicable.

Data Availability Statement

The supporting data can be provided by contacting corresponding author [email protected].

Acknowledgments

Many thanks to the personnel of the LSFRI Silava Laboratory of Forest Environment for their help in field sampling and conducting the sample analyses. The contribution of G.P., R.N.M. and A.B. is funded by the ERDF project “Evaluation of climate change mitigation options in drainage systems in croplands and grasslands”, No. 1.1.1.1/21/A/030, the contribution of G.S. and D.P. is funded by ERDF project “Evaluation of factors affecting greenhouse gas (GHG) emissions reduction potential in cropland and grassland with organic soils”, No. 1.1.1.1/21/A/031, and the contribution of A.L. is funded by the postdoctoral study “Economic and environmental assessment of biomass production in buffer zones around drainage systems and territories surrounding the protective belts of natural water streams”, No. 1.1.1.2/VIAA/3/19/437.

Conflicts of Interest

The authors declare no conflict of interest.

References

  1. Covey, K.R.; Megonigal, J.P. Methane production and emissions in trees and forests. New Phytol. 2019, 222, 35–51. [Google Scholar] [CrossRef]
  2. Pan, Y.; Birdsey, R.; Phillips, O.; Jackson, R. The Structure, distribution and biomass of the World’s forests. Annu. Rev. Ecol. Syst. 2013, 44, 593–622. [Google Scholar] [CrossRef] [Green Version]
  3. Latvijas Valsts Mežzinātnes Institūts “Silava”. Available online: www.silava.lv (accessed on 23 January 2023).
  4. Valsts Meža Dienests. Available online: www.vmd.gov.lv (accessed on 23 January 2023).
  5. Latvia’s National Inventory Report Submission under UNFCCC and the Kyoto Protocol Common Reporting Formats (CRF) 1990–2017. Available online: https://unfccc.int/documents/194812 (accessed on 23 January 2023).
  6. Saikawa, E.; Prinn, R.G.; Dlugokencky, E.; Ishijima, K.; Dutton, G.S.; Hall, B.D.; Langenfelds, R.; Tohjima, Y.; Machida, T.; Manizza, M.; et al. Global and regional emissions estimates for N2O. Atmos. Chem. Phys. 2014, 14, 4617–4641. [Google Scholar] [CrossRef] [Green Version]
  7. Crowther, T.W.; Glick, H.B.; Covey, K.R.; Bettigole, C.; Maynard, D.S.; Thomas, S.M.; Smith, J.R.; Hintler, G.; Duguid, M.C.; Amatulli, G.; et al. Mapping tree density at a global scale. Nature 2015, 525, 201–205. [Google Scholar] [CrossRef]
  8. Wang, Z.-P.; Han, S.-J.; Li, H.-L.; Deng, F.-D.; Zheng, Y.-H.; Liu, H.-F.; Han, X.-G. Methane production explained largely by water content in the heartwood of living trees in upland forests. J. Geophys. Res. Biogeosci. 2017, 122, 2479–2489. [Google Scholar] [CrossRef]
  9. Pitz, S.L.; Megonigal, J.P.; Chang, C.-H.; Szlavecz, K. Methane fluxes from tree stems and soils along a habitat gradient. Biogeochemistry 2018, 137, 307–320. [Google Scholar] [CrossRef]
  10. Yip, D.Z.; Veach, A.M.; Yang, Z.K.; Cregger, M.A.; Schadt, C.W. Methanogenic Archaea dominate mature heartwood habitats of Eastern Cottonwood (Populus deltoides). New Phytol. 2019, 222, 115–121. [Google Scholar] [CrossRef]
  11. Maier, M.; Machacova, K.; Lang, F.; Svobodova, K.; Urban, O. Combining soil and tree-stem flux measurements and soil gas profiles to understand CH4 pathways in Fagus sylvatica forests. J. Plant. Nutr. Soil Sci. 2018, 181, 31–35. [Google Scholar] [CrossRef] [Green Version]
  12. Ward, N.D.; Indivero, J.; Gunn, C.; Wang, W.; Bailey, V.; McDovell, N.G. Longitudinal Gradients in Tree Stem Greenhouse Gas Concentrations Across Six Pacific Northwest Coastal Forests. J. Geophys. Res. 2019, 124, 1401–1412. [Google Scholar] [CrossRef] [Green Version]
  13. Sjögersten, S.; Siegenthaler, A.; Lopez, O.R.; Aplin, P.; Turner, B.; Gauci, V. Methane emissions from tree stems in neotropical peatlands. New Phytol. 2020, 225, 769–781. [Google Scholar] [CrossRef] [Green Version]
  14. Pangala, S.R.; Hornibrook, E.R.C.; Gowing, D.J.; Gauci, V. The contribution of trees to ecosystem methane emissions in a temperate forested wetland. Glob. Chang. Biol. 2015, 21, 2642–2654. [Google Scholar] [CrossRef]
  15. Schindler, T.; Mander, Ü.; Machachova, K.; Espenberg, M.; Krasnov, D.; Escuer-Gatius, J.; Verb, G.; Pärn, J.; Sooasaar, K. Short-term flooding increases CH4 and N2O emissions from trees in a riparian forest soil-stem continuum. Sci. Rep. 2020, 10, 3204. [Google Scholar] [CrossRef] [Green Version]
  16. Mander, Ü.; Krasnova, A.; Schindler, T.; Megonigal, J.P.; Escuer-Gatius, J.; Espenberg, M.; Machaccova, K.; Maddison, M.; Pärn, J.; Ranniku, R.; et al. Long-term Dynamics of soil, tree stem and ecosystem methane fluxes in a riparian forest. Sci. Total Environ. 2022, 809, 151723. [Google Scholar] [CrossRef]
  17. Bužková, R.; Acosta, M.; Dařenová, E.; Pokorný, R.; Pavelka, M. Environmental factors influencing the relationship between stem CO2 efflux and sap flow. Trees 2015, 29, 333–343. [Google Scholar] [CrossRef]
  18. Teskey, R.O.; McGuire, M.A. Carbon dioxide transport in xylem causes errors in estimation of rates of respiration in stems and branches of trees. Plant Cell Environ. 2002, 25, 1571–1577. [Google Scholar] [CrossRef]
  19. Pfanz, H.; Aschan, G. The existence of bark and stem photosynthesis and its significance for the overall carbon gain: An eco-physiological and ecological approach. Prog. Bot. 2000, 62, 477–510. [Google Scholar]
  20. Pfanz, H.; Aschan, G.; Langenfeld-Heyser, R.; Wittmann, C.; Loose, M. Ecology and ecophysiology of tree stems: Corticular andwood photosynthesis. Naturwissenschaften 2002, 89, 147–162. [Google Scholar]
  21. Barba, J.; Bradford, M.A.; Brewer, P.E.; Bruhn, D.; Covey, K.; Van Haren, J.; Megonigal, J.P.; Mikkelsen, T.N.; Pangala, S.R.; Pihlatie, M.; et al. Methane emissions from tree stems: A new frontier in the global carbon cycle. New Phytol. 2019, 222, 18–28. [Google Scholar] [CrossRef]
  22. Vargas, R.; Barba, J. Greenhouse Gas Fluxes From Tree Stems. Trends Plant Sci. 2019, 24, 296–299. [Google Scholar] [CrossRef]
  23. Kreuzwieser, J.; Buchholz, J.; Rennenberg, H. Emission of Methane and Nitrous Oxide by Australian Mangrove Ecosystems. Plant Biol. 2023, 5, 423–431. [Google Scholar] [CrossRef]
  24. Rusch, H.; Rennenberg, H. Black alder (Alnus glutinosa (L.) Gaertn.) trees mediate methane and nitrous oxide emission from the soil to the atmosphere. Plant Soil 1998, 201, 1–7. [Google Scholar] [CrossRef]
  25. Welch, B.; Gauci, V.; Sayer, E.J. Tree stem bases are sources of CH4 and N2O in a tropical forest on upland soil during the dry to wet season transition. Glob. Change Biol. 2019, 25, 361–372. [Google Scholar] [CrossRef] [PubMed] [Green Version]
  26. Díaz-Pinés, E.; Heras, P.; Gasche, R.; Rubio, A.; Rennenberg, H.; Butterbach-Bahl, K.; Kiese, R. Nitrous oxide emissions from stems of ash (Fraxinus angustifolia Vahl) and European beech (Fagus sylvatica L.). Plant Soil 2016, 398, 35–45. [Google Scholar] [CrossRef]
  27. Wen, Y.; Corre, M.D.; Rachow, C.; Chen, L.; Veldkamp, E. Nitrous oxide emissions from stems of alder, beech and spruce in a temperate forest. Plant Soil 2017, 420, 423–434. [Google Scholar] [CrossRef]
  28. Oliveira, R.S.; Castro, P.M.L.; Dodd, J.C.; Vosátka, M. Synergistic effect of Glomus intraradices and Frankia spp. on the growth and stress recovery of Alnus glutinosa in an alkaline anthropogenic sediment. Chemosphere 2005, 60, 1462–1470. [Google Scholar] [CrossRef] [PubMed]
  29. Roy, M.; Rochet, J.; Manzi, S.; Jargeat, P.; Gryta, H.; Moreau, P.; Gardes, M. What determines Alnus-associated ectomycorrhizal community diversity and specificity? A comparison of host and habitat effects at a regional scale. New Phytol. 2013, 198, 1228–1238. [Google Scholar]
  30. Huth, V.; Hoffmann, M.; Bereswill, S.; Popova, Y.; Zak, D.; Augustin, J. The climate warming effect of a fen peat meadow with fluctuating water table is reduced by young alder trees. Mires Peat 2018, 21, 1–18. [Google Scholar]
  31. Minkkinen, K.; Ojanen, P.; Koskinen, M.; Penttilä, T. Nitrous oxide emissions of undrained, forestry-drained, and rewetted boreal peatlands. For. Ecol. Manag. 2020, 478, 118494. [Google Scholar] [CrossRef]
  32. Smart, D.R.; Bloom, A.J. Wheat leaves emit nitrous oxide during nitrate assimilation. Proc. Natl. Acad. Sci. USA 2021, 98, 7875–7878. [Google Scholar] [CrossRef] [Green Version]
  33. Machacova, K.; Vaino, E.; Urban, O.; Pihlatie, M. Seasonal dynamics of stem N2O exchange follow the physiological activity of boreal trees. Nat. Commun. 2019, 10, 4989. [Google Scholar] [CrossRef] [Green Version]
  34. Latvijas Vides, Ģeoloģijas un Meteoroloģijas Centrs. Available online: https://videscentrs.lvgmc.lv/ (accessed on 26 January 2023).
  35. Nacionālā Enciklopēdija. Available online: www.enciklopedija.lv (accessed on 26 January 2023).
  36. LVS EN ISO/IEC 17025:2018; General Requirements for the Competence of Testing and Calibration Laboratories. 3rd ed. ISO: Geneva, Switzerland, 2017; p. 30.
  37. LVS ISO 11464:2006; Soil Quality—Pretreatment of Samples for Physico-Chemical Analysis. 2nd ed. ISO: Geneva, Switzerland, 2006; p. 11.
  38. LVS ISO 10390:2021; Soil, Treated Biowaste and Sludge—Determination of pH. 3rd ed. ISO: Geneva, Switzerland, 2021; p. 8.
  39. LVS ISO 10694:2006 A/L; Soil Quality—Determination of Organic and Total Carbon after Dry Combustion (Elementary Analysis). ISO: Geneva, Switzerland, 2006.
  40. LVS ISO 13878:1998; Soil Quality—Determination of Total Nitrogen Content by Dry Combustion (“Elemental Analysis”). 1st ed. ISO: Geneva, Switzerland, 1998; p. 5.
  41. Barba, J.; Poyatos, R.; Vargas, R. Automated measurements of greenhouse gases fluxes from tree stems and soils: Magnitudes, patterns and drivers. Sci. Rep. 2019, 9, 4005. [Google Scholar] [CrossRef] [PubMed] [Green Version]
  42. Schindler, T.; Machacova, K.; Mander, Ü.; Escuer-Gatius, J.; Soosaar, K. Diurnal tree stem CH4 and N2O flux dynamics from a riparian alder forest. Forests 2021, 12, 863. [Google Scholar] [CrossRef]
  43. Ranniku, R.; Schindler, T.; Escuer-Gatius, J.; Mander, Ü.; Machacova, K.; Soosaar, K. Greenhouse Gas Dynamics in a Drained Peatland Forest: Annual CH4 and N2O Fluxes from Tree Stems and Soil. In Proceedings of the EGU General Assembly, Vienna, Austria, 23–27 May 2022. [Google Scholar]
  44. Vainio, E.; Haikarainen, I.P.; Machacova, K.; Putkinen, A.; Santalahti, M.; Koskinen, M.; Fritze, M.; Tuomivirta, T.; Pihlatie, M. Soil-tree-atmosphere CH4 flux dynamics of boreal birch and spruce trees during spring leaf-out. Plant Soil 2022, 478, 391–407. [Google Scholar] [CrossRef]
  45. Ojanen, P.; Minkkinen, K.; Alm, J.; Penttilä, T. Soil–atmosphere CO2, CH4 and N2O fluxes in boreal forestry-drained peatlands. For. Ecol. Manag. 2010, 260, 411–421. [Google Scholar] [CrossRef]
  46. Köhn, D.; Günther, A.; Schwabe, I.; Jurasinski, G. Short-lived peaks of stem methane emissions from mature black alder (Alnus glutinosa (L.) Gaertn.)—Irrelevant for ecosystem methane budgets? Plant-Environ. Interact. 2021, 2, 16–27. [Google Scholar] [CrossRef]
  47. Vanags-Duka, M.; Bārdule, A.; Butlers, A.; Upenieks, E.M.; Lazdiņš, A.; Purviņa, D.; Līcīte, I. GHG Emissions from Drainage Ditches in Peat Extraction Sites and Peatland Forests in Hemiboreal Latvia. Land 2022, 11, 2233. [Google Scholar] [CrossRef]
  48. Machacova, K.; Borak, L.; Agyei, T.; Schindler, T.; Soosaar, K.; Mander, Ü.; Ah-Peng, C. Trees as net sinks for methane (CH4) and nitrous oxide (N2O) in the lowland tropical rain forest on volcanic Réunion Island. New Phytol. 2021, 229, 1983–1994. [Google Scholar] [CrossRef]
  49. Hölttä, T.; Kolari, P. Interpretation of stem CO2 efflux measurements. Tree Physiol. 2009, 29, 1447–1456. [Google Scholar] [CrossRef] [Green Version]
  50. Rodríguez-Calcerrada, J.; López, R.; Salomón, R.; Gordaliza, G.G.; Valbuena-Carabaña, M.; Oleksyn, J.; Luis, G. Stem CO2 efflux in six co-occurring tree species: Underlying factors and ecological implications. Plant Cell Environ. 2015, 38, 1104–1115. [Google Scholar] [CrossRef]
  51. Obidziński, A. Black alder (Alnus glutinosa Gaertn.) as pioneer species in regeneration of fresh oak-linden-hornbeam forest (Tilio-Carpientum typicum Traczyk 1962) in Białowieża Forest (east Poland). Pol. J. Ecol. 2004, 52, 533–551. [Google Scholar]
  52. Sakalli, A. Simulation of potential distribution and migration of Alnus spp. under climate change. Appl. Ecol. Environ. Res. 2017, 15, 1039–1070. [Google Scholar] [CrossRef]
  53. Chanton, J.P.; Whiting, G.J.; Happell, J.D.; Gerard, G. Contrasting rates and diurnal patterns of methane emission from emergent aquatic macrophytes. Aquat. Bot. 1993, 46, 111–128. [Google Scholar] [CrossRef]
  54. Kim, J.; Verma, S.B.; Billesbach, D.P. Seasonal variation in methane emission from a temperate Phragmites-dominated marsh: Effect of growth stage and plant-mediated transport. Glob. Chang. Biol. 1999, 5, 433–440. [Google Scholar] [CrossRef]
  55. Pangala, S.R.; Gowing, D.J.; Hornibrook, E.R.C.; Gauci, V. Controls on methane emissions from Alnus glutinosa saplings. New Phytol. 2014, 201, 887–896. [Google Scholar] [CrossRef] [Green Version]
  56. Sevanto, S.; Suni, T.M.; Pumpanen, J.; Grönholm, T.; Kolari, P.; Nikinmaa, E.; Hari, P.; Vesala, T. Wintertime photosynthesis and water uptake in a boreal forest. Tree Physiol. 2006, 26, 749–757. [Google Scholar] [CrossRef] [Green Version]
  57. Kolari, P.; Kulmala, L.; Pumpanen, J.; Launiainen, S.; Ilvesniemi, H.; Hari, P.; Nikinmaa, E. CO2 exchange and component CO2 fluxes of a boreal Scots pine forest. Boreal Environ. Res. 2009, 14, 761–783. [Google Scholar]
  58. Acosta, M.; Pavelka, M.; Pokorony, R.; Janouš, D.; Marek, M.V. Seasonal variation in CO2 efflux of stems and branches of Norway spruce trees. Ann. Bot. 2008, 101, 469–477. [Google Scholar] [CrossRef] [Green Version]
  59. Tu, J.; Wei, X.; Fan, H.; Wu, J.; Hao, J.; Pei, Q. Disentangling critical drivers of stem CO2 efflux from Pinus elliottii trees in Subtropical China. Agric. For. Meteorol. 2017, 237–238, 296–302. [Google Scholar] [CrossRef]
  60. Guidolotti, G.; Rey, A.; D’Andrea, E.; Matteucci, G.; De Angelis, P. Effect of environmental variables and stand structure on ecosystem respiration components in a Mediterranean beech forest. Tree Physiol. 2013, 33, 960–972. [Google Scholar] [CrossRef] [Green Version]
  61. Liu, X.P.; Zhang, W.J.; Hu, C.S.; Tang, X.G. Soil greenhouse gas fluxes from different tree species on Taihang Mountain, North China. Biogeosciences 2014, 11, 1649–1666. [Google Scholar] [CrossRef] [Green Version]
  62. Zhao, K.; Fahey, T.J.; Wanh, X.; Warg, J.; He, F.; Fan, C.; Jia, Z.; Li, X. Effect of thinning intensity on the stem CO2 efflux of Larix principis-rupprechtii Mayr. For. Ecosyst. 2021, 8, 63. [Google Scholar] [CrossRef]
  63. Gauci, V.; Hornibrook, E.; Davis, J.; Dise, N. Woody stem methane emission in mature wetland alder trees. Atmos. Environ. 2010, 44, 2157–2160. [Google Scholar] [CrossRef] [Green Version]
  64. Terazawa, K.; Ishizuka, S.; Sakata, T.; Yamada, K.; Takahashi, M. Methane emissions from stems of Fraxinus mandshurica var. japonica trees in a floodplain forest. Soil. Biol. Biochem. 2007, 39, 2689–2692. [Google Scholar] [CrossRef]
  65. Torga, R.; Mander, Ü.; Soosaar, K.; Kupper, P.; Tullus, A.; Rosenvald, K.; Ostonen, I.; Kutti, S.; Jaagus, J.; Sober, J.; et al. Weather extremes and tree species shape soil greenhouse gas fluxes in an experimental fast-growing deciduous forest of air humidity manipulation. Ecol. Eng. 2017, 106, 369–377. [Google Scholar] [CrossRef]
  66. Leppelt, T.; Dechow, R.; Gebbert, S.; Freibauer, A.; Lohila, A.; Augustin, J.; Drösler, M.; Fiedler, S.; Glatzel, S.; Höper, H.; et al. Nitrous oxide emission hotspots from organic soils in Europe. Biogeosci. Discuss 2014, 11, 9135–9182. [Google Scholar]
Figure 1. Location of forest stands and sample plots. Forest stand identifiers are shown as numbers. Two sample plots are located in the same stand (Ma—black alder and B—silver birch).
Forests 14 00521 g001
Figure 2. A schematic representation of the gas measurement chamber and its installation on a tree stem.
Forests 14 00521 g002
Figure 3. Gas measurement chamber on a tree stem in the study area.
Forests 14 00521 g003
Figure 4. Average monthly CO2 fluxes from silver birch and black alder stems (mean value ± S.E.). Numbers below the bars (n) show number of measurements in each month. Different lowercase letters show statistically significant differences (p < 0.05, Wilcoxon rank sum exact test) between tree species within the same month.
Forests 14 00521 g004
Figure 5. Average monthly CH4 fluxes and removals from silver birch and black alder stems. Numbers below the bars (n) show number of measurements in each month. Different lowercase letters show statistically significant differences (p < 0.05, Wilcoxon rank sum exact test) between tree species within the same month (no statistically significant differences were found).
Forests 14 00521 g005
Figure 6. Average monthly N2O fluxes and removals from silver birch and black alder stems (mean value ± S.E.). Numbers below the bars (n) show number of measurements in each month. Negative values indicate N2O removals by tree stems. Different lowercase letters show statistically significant differences (p < 0.05, Wilcoxon rank sum exact test) between tree species within the same month.
Forests 14 00521 g006
Figure 7. Relationship between CO2 fluxes from birch and black alder stems and soil temperature.
Forests 14 00521 g007
Figure 8. Monthly groundwater level from March till October in forest stands with nutrient-rich drained and wet peat soil. Different lowercase letters show statistically significant differences (p < 0.05, two-sample t-test) between soil moisture type within the same month.
Forests 14 00521 g008
Figure 9. CO2 fluxes depending on the groundwater level in silver birch and black alder stands. Different lowercase letters show statistically significant differences (p < 0.05, two-sample t-test) between tree species within the same groundwater level group.
Forests 14 00521 g009
Figure 10. CH4 fluxes and removals depending on the groundwater level in silver birch and black alder stands. Different lowercase letters show statistically significant differences (p < 0.05, two-sample t-test) between tree species within the same groundwater level group.
Forests 14 00521 g010
Figure 11. N2O fluxes and removals depending on the groundwater level in silver birch and black alder stands. Different lowercase letters show statistically significant differences (p < 0.05, two-ample t-test) between tree species within the same groundwater level group.
Forests 14 00521 g011
Figure 12. N2O fluxes depending on organic C content in soil in silver birch and black alder stands without outliers.
Forests 14 00521 g012
Figure 13. N2O fluxes depending on total N content in soil at 0–10 cm, 10–20 cm and 20–30 cm depth in silver birch and black alder stands without outliers.
Forests 14 00521 g013
Table 1. Characteristics of the studied forest stands.
No. of Sample PlotTree SpeciesSoil Moisture ConditionLocation, WGS84Stand Age, YearsDiameter at Breast (1.3 m) Height, cmThe Average Tree Height, m
XY
1Silver birchDrained57.321826.0641201518
2Silver birchDrained56.687325.0482301217
3Silver birchDrained56.694224.5836592721
4Silver birchWet57.290625.9987601918
5Silver birchWet56.928924.9666702222
6Black alderWet56.659624.142123911
7Black alderWet56.928056.9280532224
8Black alderWet56.573756.5737722929
Table 2. Characteristics of individual trees of the studied forest stands.
Tree SpeciesDiameter of Trees at Breast (1.3 m) Height, cmTree Height, m
Tree 1Tree 2Tree 3Tree 1Tree 2Tree 3
Silver birch20.516.411.518.517.816.0
Silver birch20.314.712.721.418.219.4
Silver birch28.625.919.522.722.418.2
Silver birch14.510.69.212.612.212.0
Silver birch20.518.012.922.421.320.2
Silver birch29.921.014.025.423.620.8
Black alder11.311.18.711.411.49.7
Black alder24.319.314.223.721.319.8
Black alder36.923.921.230.227.126.7
Table 3. Parameters of gas flux chambers.
Chamber IDHeight, cmWidth, cmThickness, cmVolume, m3Surface Area, m2
120.125.02.20.00110.0503
220.542.02.30.00200.0861
320.056.52.50.00280.1130
419.073.02.80.00390.1387
Disclaimer/Publisher’s Note: The statements, opinions and data contained in all publications are solely those of the individual author(s) and contributor(s) and not of MDPI and/or the editor(s). MDPI and/or the editor(s) disclaim responsibility for any injury to people or property resulting from any ideas, methods, instructions or products referred to in the content.

