

Harvest Intensity Impacts Nutrient Status and Young Stand Development in Latvian Hemiboreal Forest

1
Latvian State Forest Research Institute ‘Silava’ (LSFRI Silava), Rigas Str. 111, LV-2169 Salaspils, Latvia
2
Faculty of Geography and Earth Sciences, University of Latvia, Jelgavas Str. 1, LV-1004 Riga, Latvia
*
Author to whom correspondence should be addressed.
Forests 2023, 14(4), 764; https://doi.org/10.3390/f14040764
Submission received: 13 March 2023
/
Revised: 1 April 2023
/
Accepted: 6 April 2023
/
Published: 7 April 2023
(This article belongs to the Special Issue Effects of Different Forestry Treatments on Forest Biodiversity and Regeneration)
Abstract
:This study aimed to compare the effects of whole-tree and stem-only harvesting in hemiboreal forests in Latvia. Chemistry of soil solution, precipitation, litter and needles, as well as tree parameters in regenerated stands were measured from 2012 to 2021 in oligotrophic and mesotrophic Scots pine sites with mineral soils and a eutrophic Norway spruce site with drained peat soil. Compared to the undisturbed control, the soil solution pH was significantly lower and N-NO3− and K+ concentrations were significantly higher after stem-only harvesting at the oligotrophic site, stem-only and whole-tree harvesting at the mesotrophic site and whole-tree harvesting at the eutrophic site. The height growth of the regenerated stands in all sites was similar for both harvesting methods six years after planting. More slender trees were observed after whole-tree harvesting than after stem-only harvesting at the eutrophic site. Whole-tree harvesting produced significant negative short-term effects on height growth in the oligotrophic site four to six years after harvest. The nutrient levels of needles differed with harvest intensity but did not indicate insufficient nutrient availability with any type of harvesting.
1. Introduction
The rapid pace of global change is putting increased pressure on natural resources around the world. While the COVID-19 pandemic interrupted the recent increase in global energy demand, stable growth of the renewable energy sector is projected for the future [1]. Biomass is the main source of renewable energy in Europe [2], with its share of production predicted to remain stable until at least 2030 [3]. Nearly 70% of Europe’s bioenergy is derived from woody biomass such as logging residues [4]. In Latvia specifically, renewable energy accounts for over 40% of the total energy consumption, and woody biomass constitutes more than 80% of renewables used for primary energy generation [5]. More complete utilisation of felled trees could contribute significantly to the energy sector. According to estimates by Camia et al. [6], primary woody biomass in the EU constitutes more than 35% of the total energy input, with 47% from stem wood and the remaining 53% from other tree parts (i.e., branches and treetops).
Harvesting of the entire above-ground tree biomass (hereafter referred to as whole-tree harvesting or WTH, as opposed to stem-only harvesting or SOH, where only tree stems are extracted and branches and treetops are left on site) presents opportunities as well as risks. Leaving fresh logging residues on site can attract pests, such as European spruce bark beetle (Ips typographus) [7], and increase fire risk [8,9]. Moreover, removing treetops and branches can reduce site preparation costs [10]. Some methods integrate logging residue removal and site preparation in one operation, thus reducing the use of heavy machinery [11]. However, whole-tree harvesting poses several concerns related to forest productivity, such as depletion of nutrient pools [12,13,14] and reduced nutrient availability [15], especially in poor soils. Compared to stem-only harvesting, whole-tree harvesting reduced the tree diameter of Sitka spruce [16] and reduced the mean annual increment of the young stand [17]. Sites with rich nutrient pools and no evidence of affected young stand growth at present may suffer long-term effects on site productivity if whole-tree harvesting is repeated [18]. However, several studies indicate that whole-tree harvesting enhances the growth of young trees [19,20,21], likely due to improved microclimate and seedling survival. The results may differ for conifers and broadleaves; for example, Roxby and Howard [22] detected no significant difference in the dimensions and biomass of hardwoods after whole-tree harvesting.
Whole-tree harvesting can also have further-reaching environmental impacts. Slash removal may acidify the organic horizon of already acidic soils [23]. Logging may increase concentrations of nutrients and loads to waterbodies [24], as well as increase mobilisation of metals due to altered hydrological pathways and soil disturbance [24,25]. Increased nutrient leaching after the removal of logging residues, however, has mainly been found on a local scale [26]. Slash increases the structural complexity of the ecosystem, and logging residue extraction may decrease habitat availability for deadwood-dependent and ground-living organisms [27,28]. While the data are conflicting and scale-dependent [26], several studies reported significant long-term changes in ground vegetation composition due to increased soil disturbance and nutrient removal associated with whole-tree harvesting [29,30,31].
Because the existing literature on the effects of whole-tree harvesting is site- and region-specific and scale-dependent, more localised data are necessary for optimising forestry activities. The aim of this study was to evaluate the impact of whole-tree and stem-only harvesting on nutrient cycling and young stand development in commercially valuable conifer forests in Latvia. To our knowledge, this study presents the longest series of observations of whole-tree and stem-only harvesting in the Baltic states, and one of the longest in Northern Europe.
2. Materials and Methods
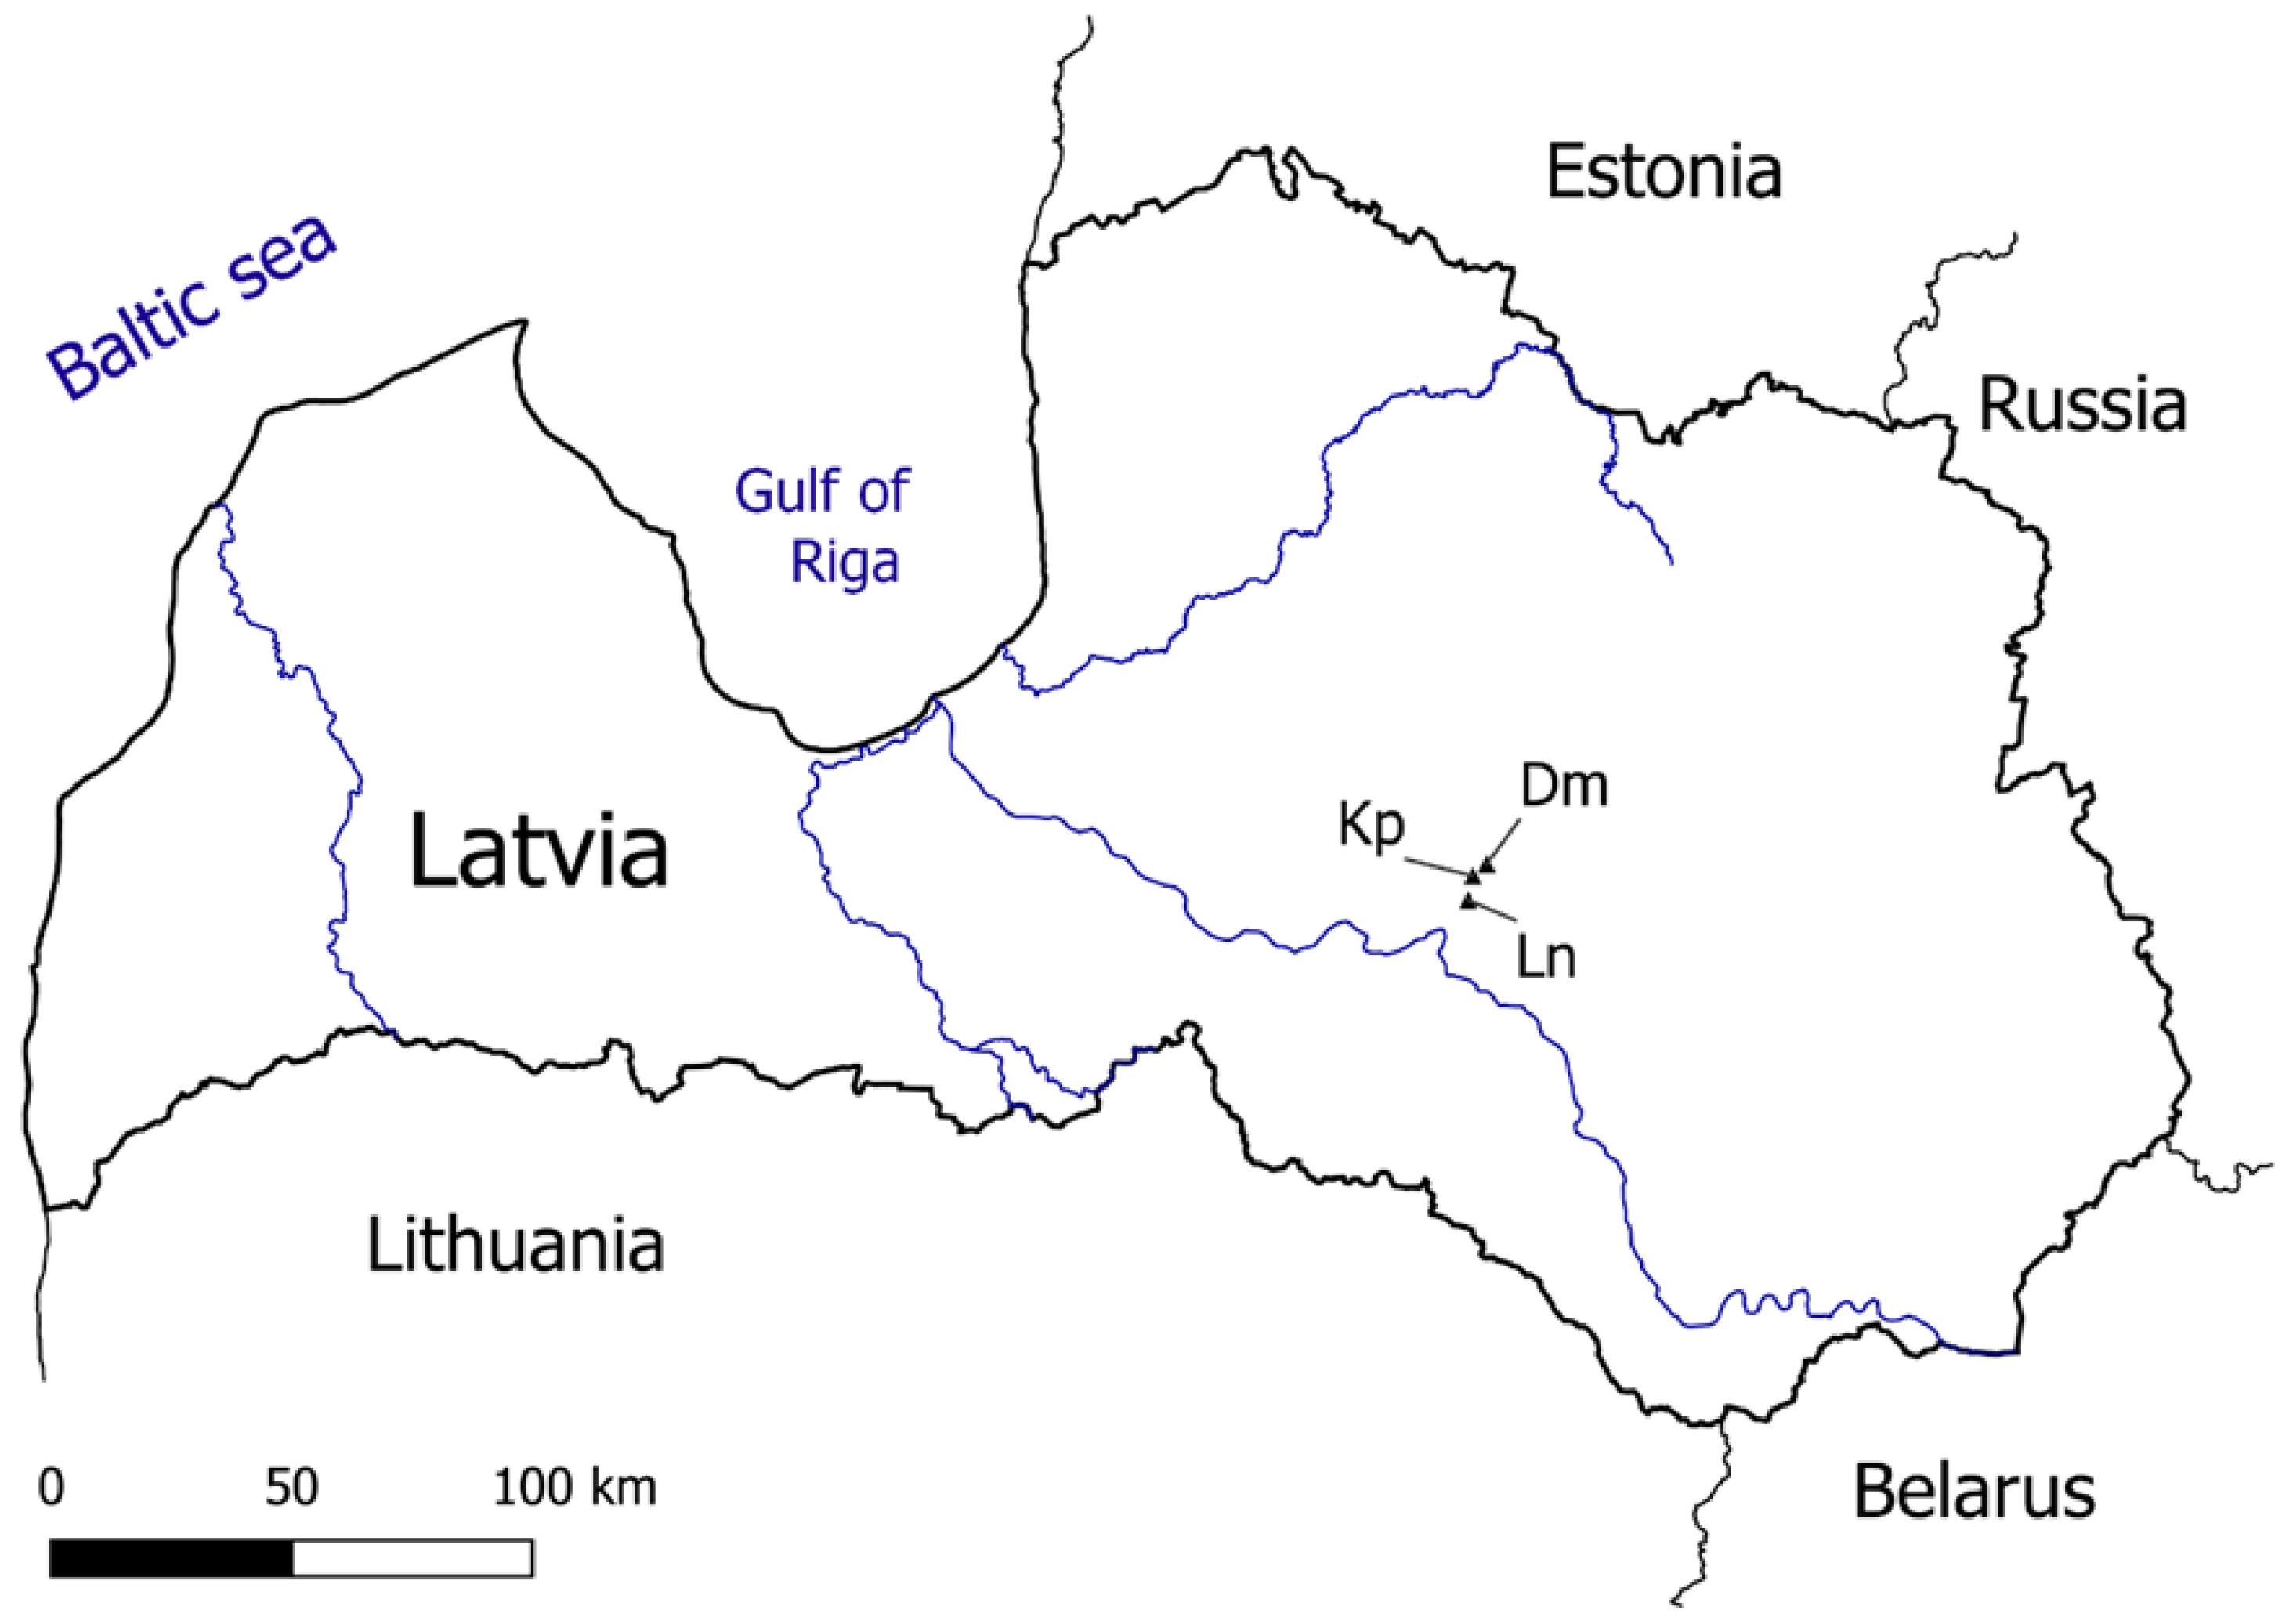
To compare the possible effects of whole-tree harvesting, stem-only harvesting and no management on nutrient cycling, as well as the development of next rotation young stands in conifer forests of Latvia (hemiboreal region), three study sites, Kp, Dm and Ln, were comprehensively observed from 2012 to 2021. The sites represent three typical forest site types with eutrophic, mesotrophic and oligotrophic conditions, respectively. The sites are located in the experimental forests of the Kalsnava forest district in the eastern part of Latvia (Figure 1).
The research area has a continental climate, with a vegetation season lasting from May until October. Mean precipitation was 754 mm annually (range of 474–1008 mm) during the study period (2012–2021) and 358 mm (range of 141–520 mm) during the vegetation season. Mean annual air temperature was 6.1 °C (range of 4.3–8.7 °C) in the study period and 14.2 °C (range of 12.9–15.6 °C) during the vegetation season.
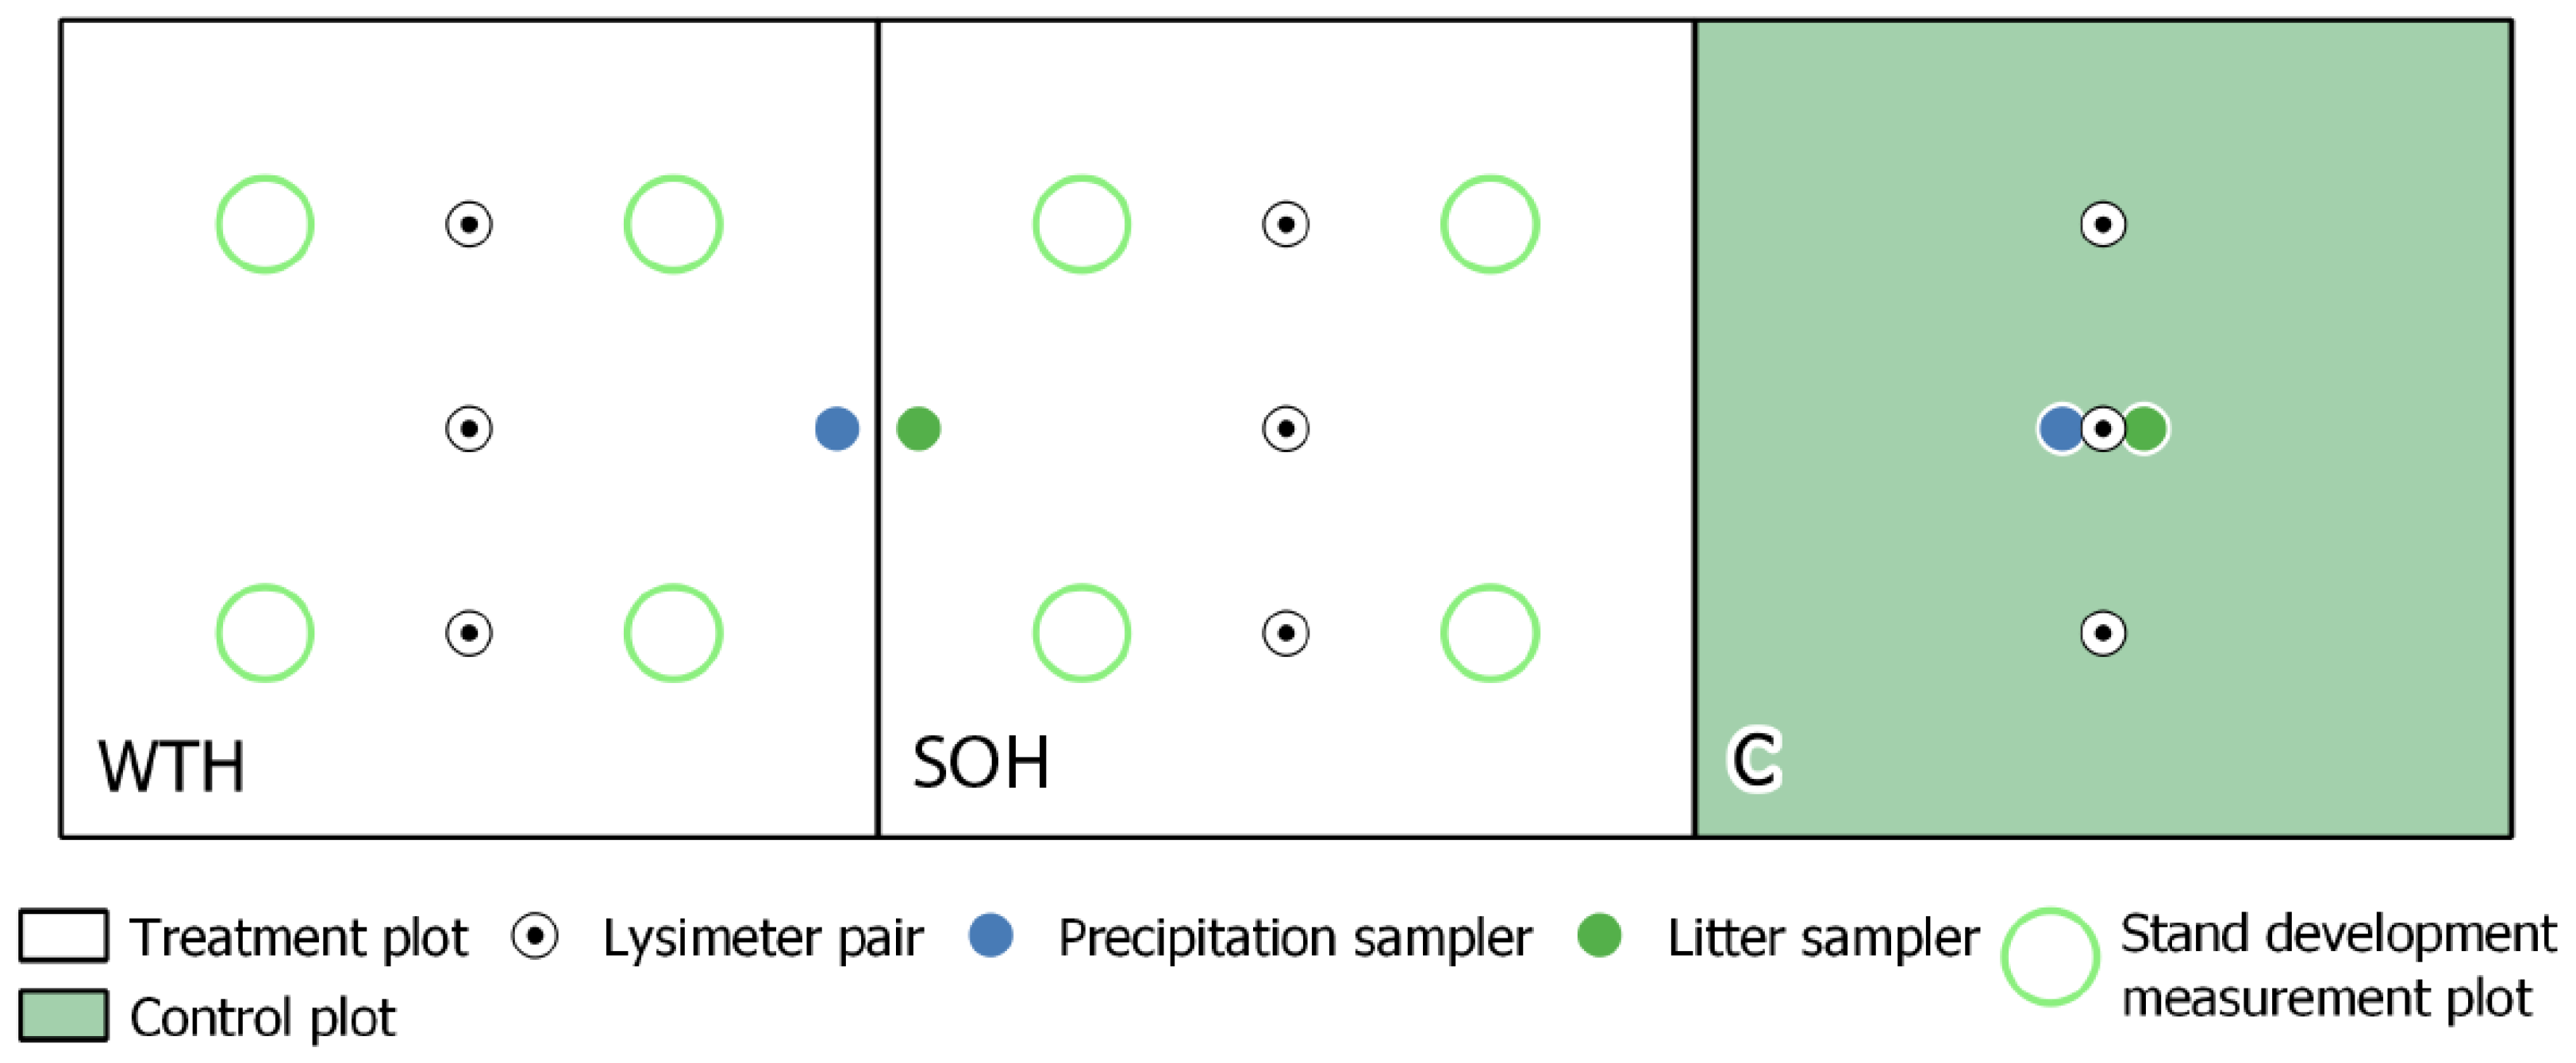
Each study site was divided into two treatment plots and a control plot (Figure 2). In the control plots, the forest stand was left intact without any disturbance. The treatment plots tested two harvest intensities—stem-only harvesting (SOH) and whole-tree harvesting (WTH). Only tree stems were harvested in the SOH plots, while all above-ground tree biomass was harvested in the WTH plots. Both employed treatments correspond to ground-based cut-to-length harvesting system (as, for example, in Nurminen et al. [32] and Lundbäck et al. [33]), with logging residues collected from WTH plots afterwards.
The sites were harvested with forestry machinery (a harvester and forwarder) in early spring 2013, when the soil was frozen, to avoid causing any significant damage. Slash was evenly scattered in SOH plots, while about 70% of branches and treetops were extracted from WTH plots based on the “business as usual” principle. Soil in the treatment plots was prepared with disc trenching in autumn 2014 for the Dm and Ln sites, while no soil preparation was performed for the Kp site. In spring 2015, the stand was regenerated with Scots pine container seedlings at the Dm and Ln sites and Norway spruce bareroot saplings at the Kp site (Table 1).
2.1. Environmental Sampling
Monthly sampling of precipitation, litter and soil solution during the vegetation season started in 2012. All sampling was carried out at least 5 m from the plot borders. The first year (2012) was considered a retrospection year, with observations made prior to any management activities. Precipitation samplers were installed in treatment plots (1 pcs in WTH and SOH) and control plots (2 pcs). In 2012, throughfall of mature stands was collected in all samplers. Open field precipitation samples were collected in samplers located in felled treatment plots beginning in 2013. Litter funnels were installed in the treatment (1 pcs in WTH and SOH) and control plots (3 pcs). Litter of mature stands was collected in all samplers in 2012.
In autumn 2011, three pairs (four pairs at the Dm site due to more complex topography) of suction tube lysimeters were installed along a central transect at each treatment plot to collect soil solution. Each pair consisted of lysimeters installed at 30 and 60 cm depths. The lysimeters consisted of a trace metal-free PVC body and a suction cup at the bottom made of porous 92% pure Al2O3 ceramic. To accumulate soil solution samples, air was pumped out of the lysimeters to a −0.7 bar vacuum each time previous samples were collected or at the beginning of each vegetation season—one month prior to the first sample collection. Outside the vegetation season, lysimeters were kept empty and closed with atmospheric pressure to avoid damage from freezing temperatures.
Needle samples of trees in regenerated stands were collected for two consecutive years (2018–2019). Sampling was conducted after the end of the vegetation season in winter, following guidelines by ICP Forests [34]. Two current-year branches were cut from every tree in two diagonal transects across each treatment plot, creating two replications. Branches were air-dried at room temperature, and needles were then separated from branches and homogenised prior to laboratory analysis.
2.2. Chemical Analysis of Environmental Samples
The soil solution and precipitation water samples were measured at the LVS EN ISO 17025:2018 accredited laboratory at the Latvian State Forest Research Institute Silava (LSFRI Silava) according to ISO standards (Table A1) for pH, nitrate-nitrogen (N-NO3−), ammonium-nitrogen (N-NH4+), total nitrogen (TN), phosphate-phosphorus (P-PO43−), potassium (K+), calcium (Ca2+) and magnesium (Mg2+) concentration. At the same laboratory, litter and needle samples were measured for nitrogen (N), phosphorus (P) and potassium (K) concentration (Table A1). In addition, micro- and macroelement (aluminium (Al), boron (B), calcium (Ca), chrome (Cr), copper (Cu), iron (Fe), potassium (K), magnesium (Mg), manganese (Mn), nitrogen (N), sodium (Na), nickel (Ni), potassium (P), sulphur (S), silicon (Si) and zinc (Zn)) concentrations in needle samples were determined at the laboratory of LSFRI Silava and the laboratory of Geography and Earth Sciences faculty at the University of Latvia.
2.3. Young Stand Development Assessment
Regenerated stand development was observed in four regularly distributed permanent measurement plots in each treatment plot at each site. Measurement plots were established at least 5 m from the plot borders. Trees were measured in circular plots with a radius of 5.64 m and area of 100 m2 early each spring from 2016 to 2021 (after the previous vegetation season). Distinction between planted and naturally ingrown trees was made, each tree in the measurement plot was categorised into a 10 cm height class, and planted trees were measured for exact height and root collar diameter.
2.4. Statistical Analysis
Statistical analysis was conducted in R [35], using a significance interval of 95% (α = 0.05) for all analyses. To compare the pH and nutrient concentrations between open field and throughfall precipitation, analysis of variance (ANOVA) was conducted within groups by sites and years. Supplementary analysis using ANOVA between open field and throughfall precipitation was conducted within groups by sites (all years of observations together) and without grouping (all sites and all years of observations together). Tukey’s honestly significant difference (HSD) test was used within groups by sites and years to compare mean nutrient concentrations in soil solution between the control, SOH and WTH treatments, while ANOVA was conducted within groups by sites, years and treatments to compare means between different sampling depths. Correlation matrices of the physio-chemical parameters of the soil solution were made using Pearson’s correlations method within groups by sites and treatments. No specific statistical tests were applied to litter data as the time series were descriptive. ANOVA was conducted within groups by sites and years to compare mean stand heights between SOH and WTH treatments. ANOVA was conducted within groups by sites to compare mean nutrient concentrations in needles between SOH and WTH treatments. All graphs were produced in R using the ggplot2 [36] and corrplot [37] packages.
3. Results
3.1. Precipitation
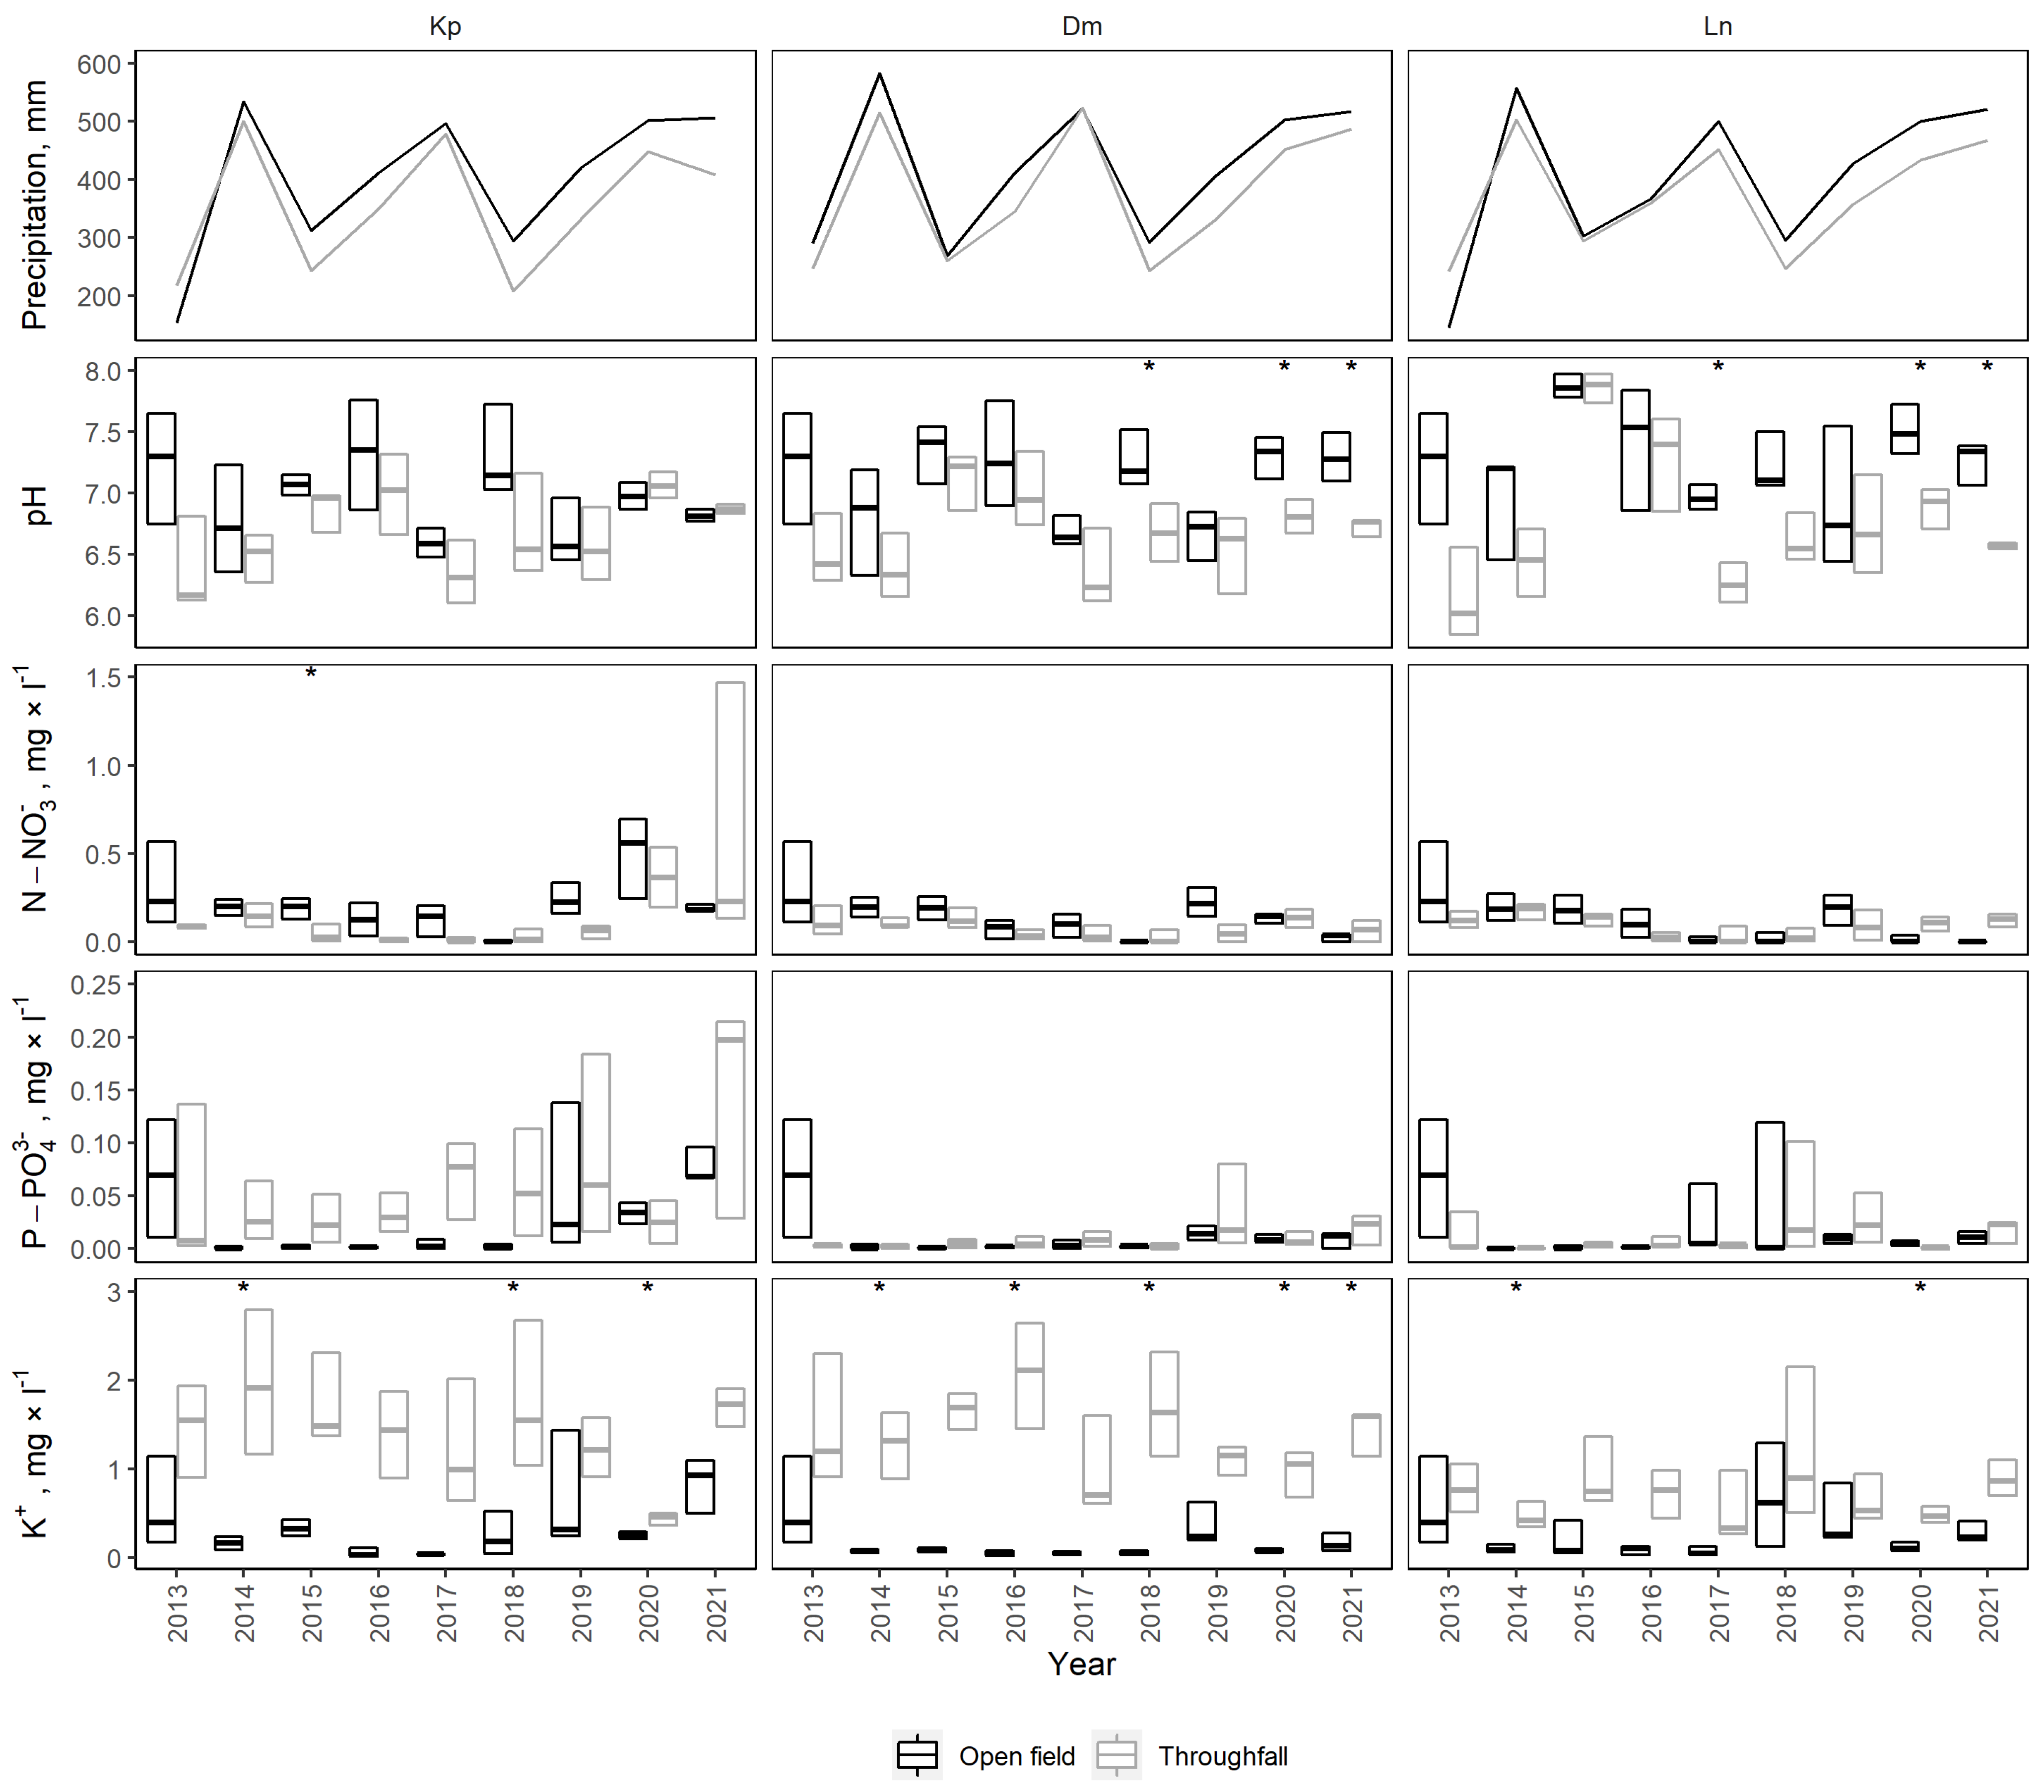
Across all study sites from 2012 to 2021, total precipitation during the vegetation season ranged from 145 mm (Ln 2013, open field) to 582 mm (Dm 2014, open field), with a mean of 393 ± 15 mm (Figure 3). Open field precipitation was 7.9% greater than throughfall precipitation on average (p > 0.05).
Across all study sites from 2012 to 2021, the mean pH of precipitation during the vegetation season was 7.1 ± 0.0 in the open field and 6.7 ± 0.1 in throughfall, and ranged from 6.3 ± 0.3 (Ln 2013, throughfall) to 7.7 ± 0.2 (Ln 2015, open field). Transition through the tree canopy in all study sites significantly decreased the pH of precipitation (p < 0.01). Similarly, significantly lower pH was observed in throughfall when compared to open field precipitation within each site (p < 0.02). The pH was lower for throughfall than for open field precipitation in 2018 and 2020–2021 at the Dm site (p = 0.01–0.04) and in 2017 and 2020–2021 at the Ln site (p < 0.05). No significant differences were observed between open field and throughfall precipitation during the vegetation seasons at the Kp site.
The mean N-NO3− concentration of precipitation was 0.26 ± 0.05 mg·L−1 in the open field and 0.18 ± 0.03 mg·L−1 in throughfall, and ranged from 0.02 ± 0.01 (Kp 2016, throughfall) to 1.25 ± 1.15 mg·L−1 (Kp 2016, open field). Transition through the tree canopy significantly lowered N-NO3− concentration in precipitation (p = 0.03), while no significant differences were observed within each site. During the vegetation seasons, no significant differences were observed within sites, except for the Kp site in 2015, when N-NO3− concentration was significantly lower in throughfall than open field precipitation (p = 0.02).
The mean P-PO43− concentration of precipitation was 0.05 ± 0.01 mg·L−1 in the open field and 0.06 ± 0.01 mg·L−1 in throughfall, and ranged up to 0.30 ± 0.27 mg·L−1 (Ln 2018, open field). No significant differences in P-PO43− concentrations were observed between throughfall and open field precipitation overall or within sites and vegetation seasons.
The mean K+ concentration of precipitation was 0.45 ± 0.06 mg·L−1 in the open field and 1.57 ± 0.14 mg·L−1 in throughfall, and ranged from 0.08 ± 0.02 (Dm 2020, open field) to 3.51 ± 2.23 mg·L−1 (Kp 2016, throughfall). Transition through the tree canopy significantly increased the K+ concentration of precipitation (p < 0.01). K+ concentrations were significantly higher in throughfall precipitation within each site (p < 0.01). During the vegetation season, K+ concentrations were significantly higher in throughfall than open field precipitation at the Dm site in 2014, 2016, 2018, 2020 and 2021 (p < 0.05), at the Kp site in 2014, 2018 and 2020 (p < 0.05), and at the Ln site in 2014 and 2020 (p < 0.01).
3.2. Soil Solution
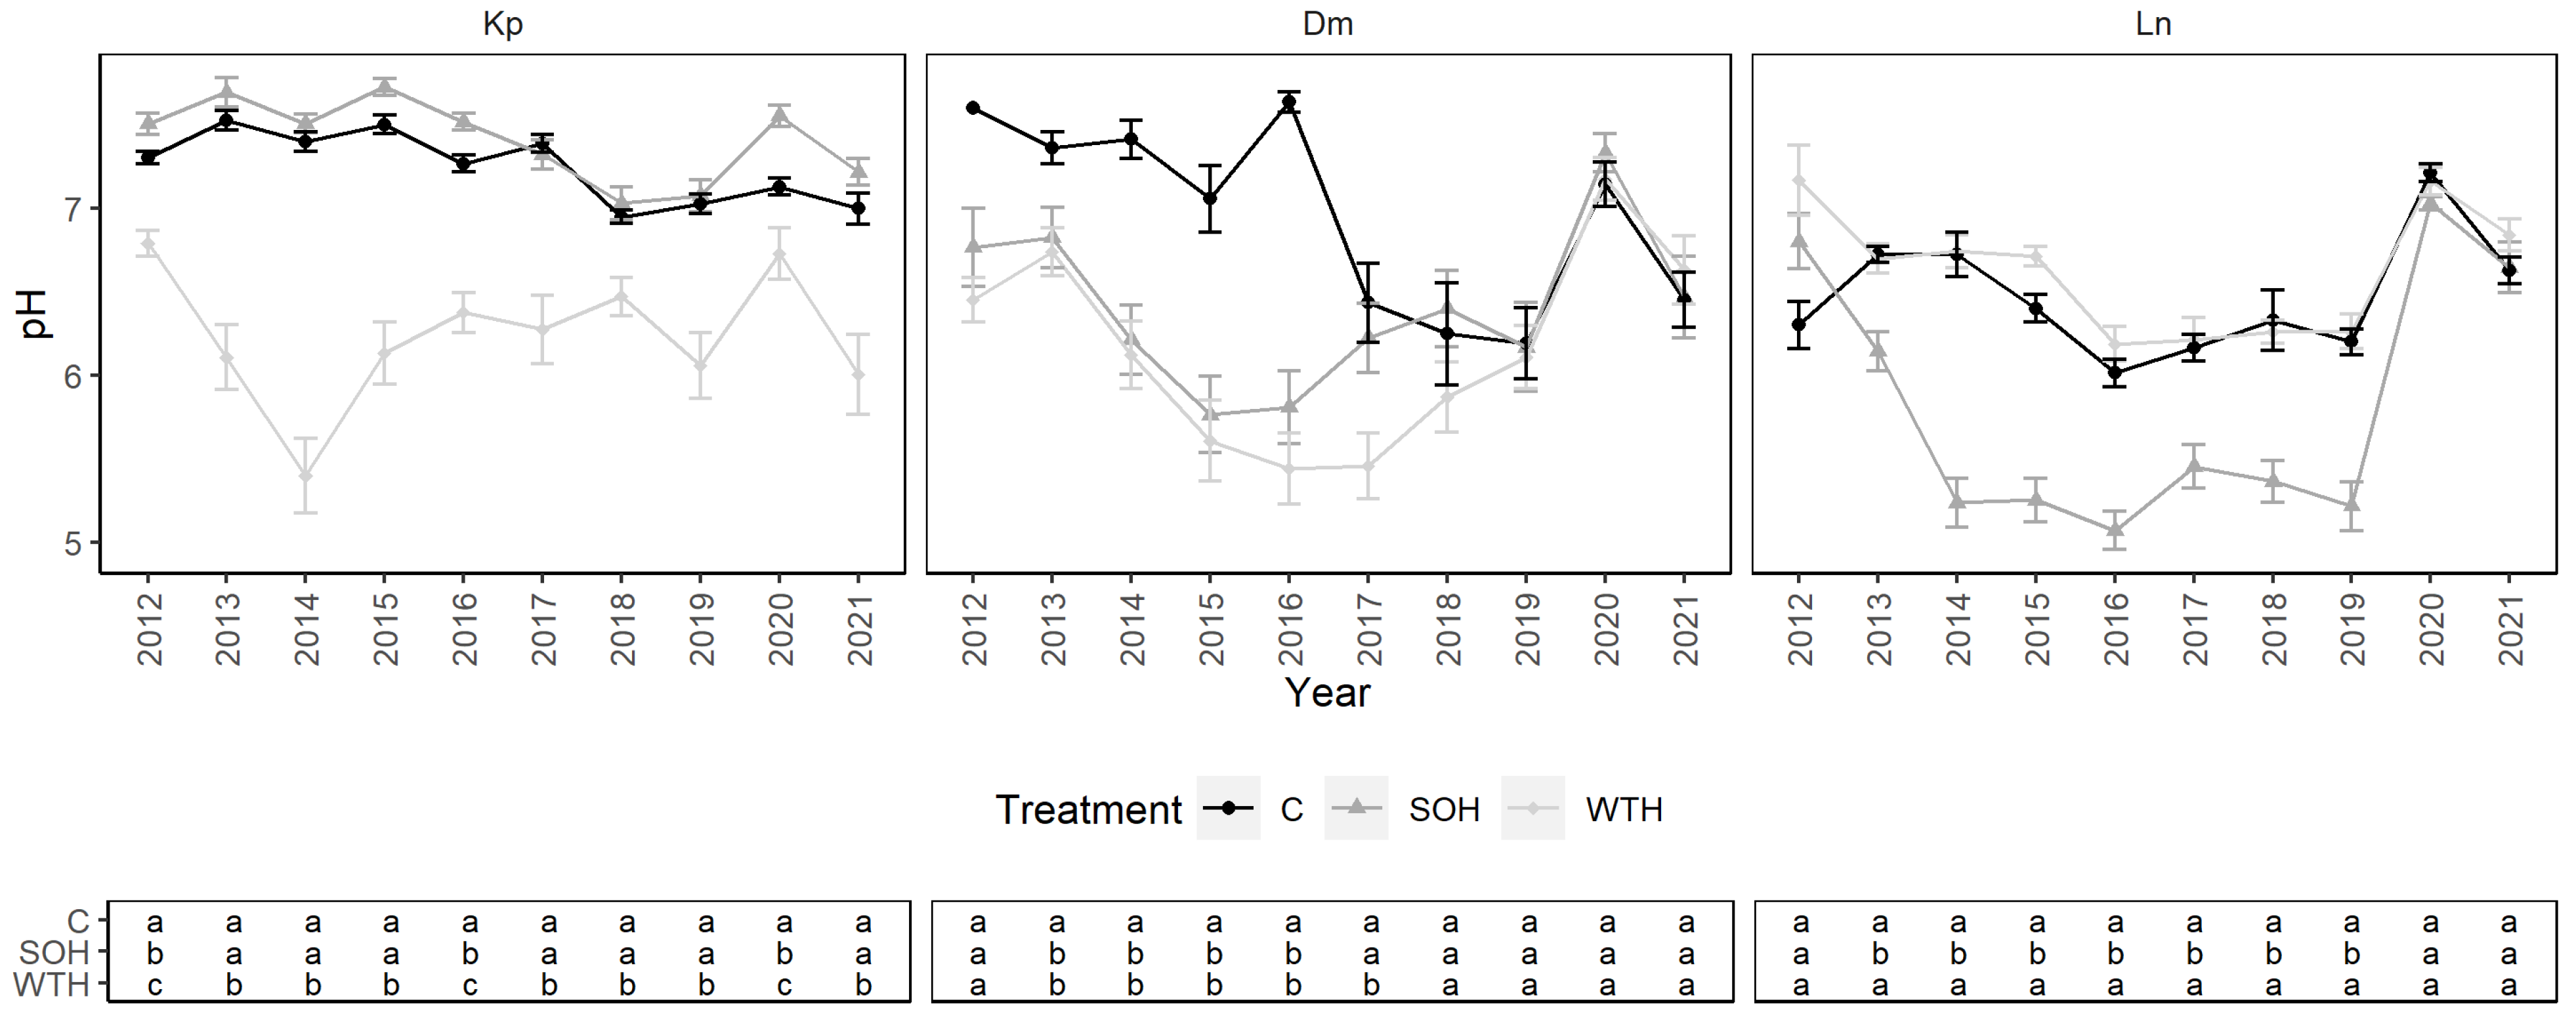
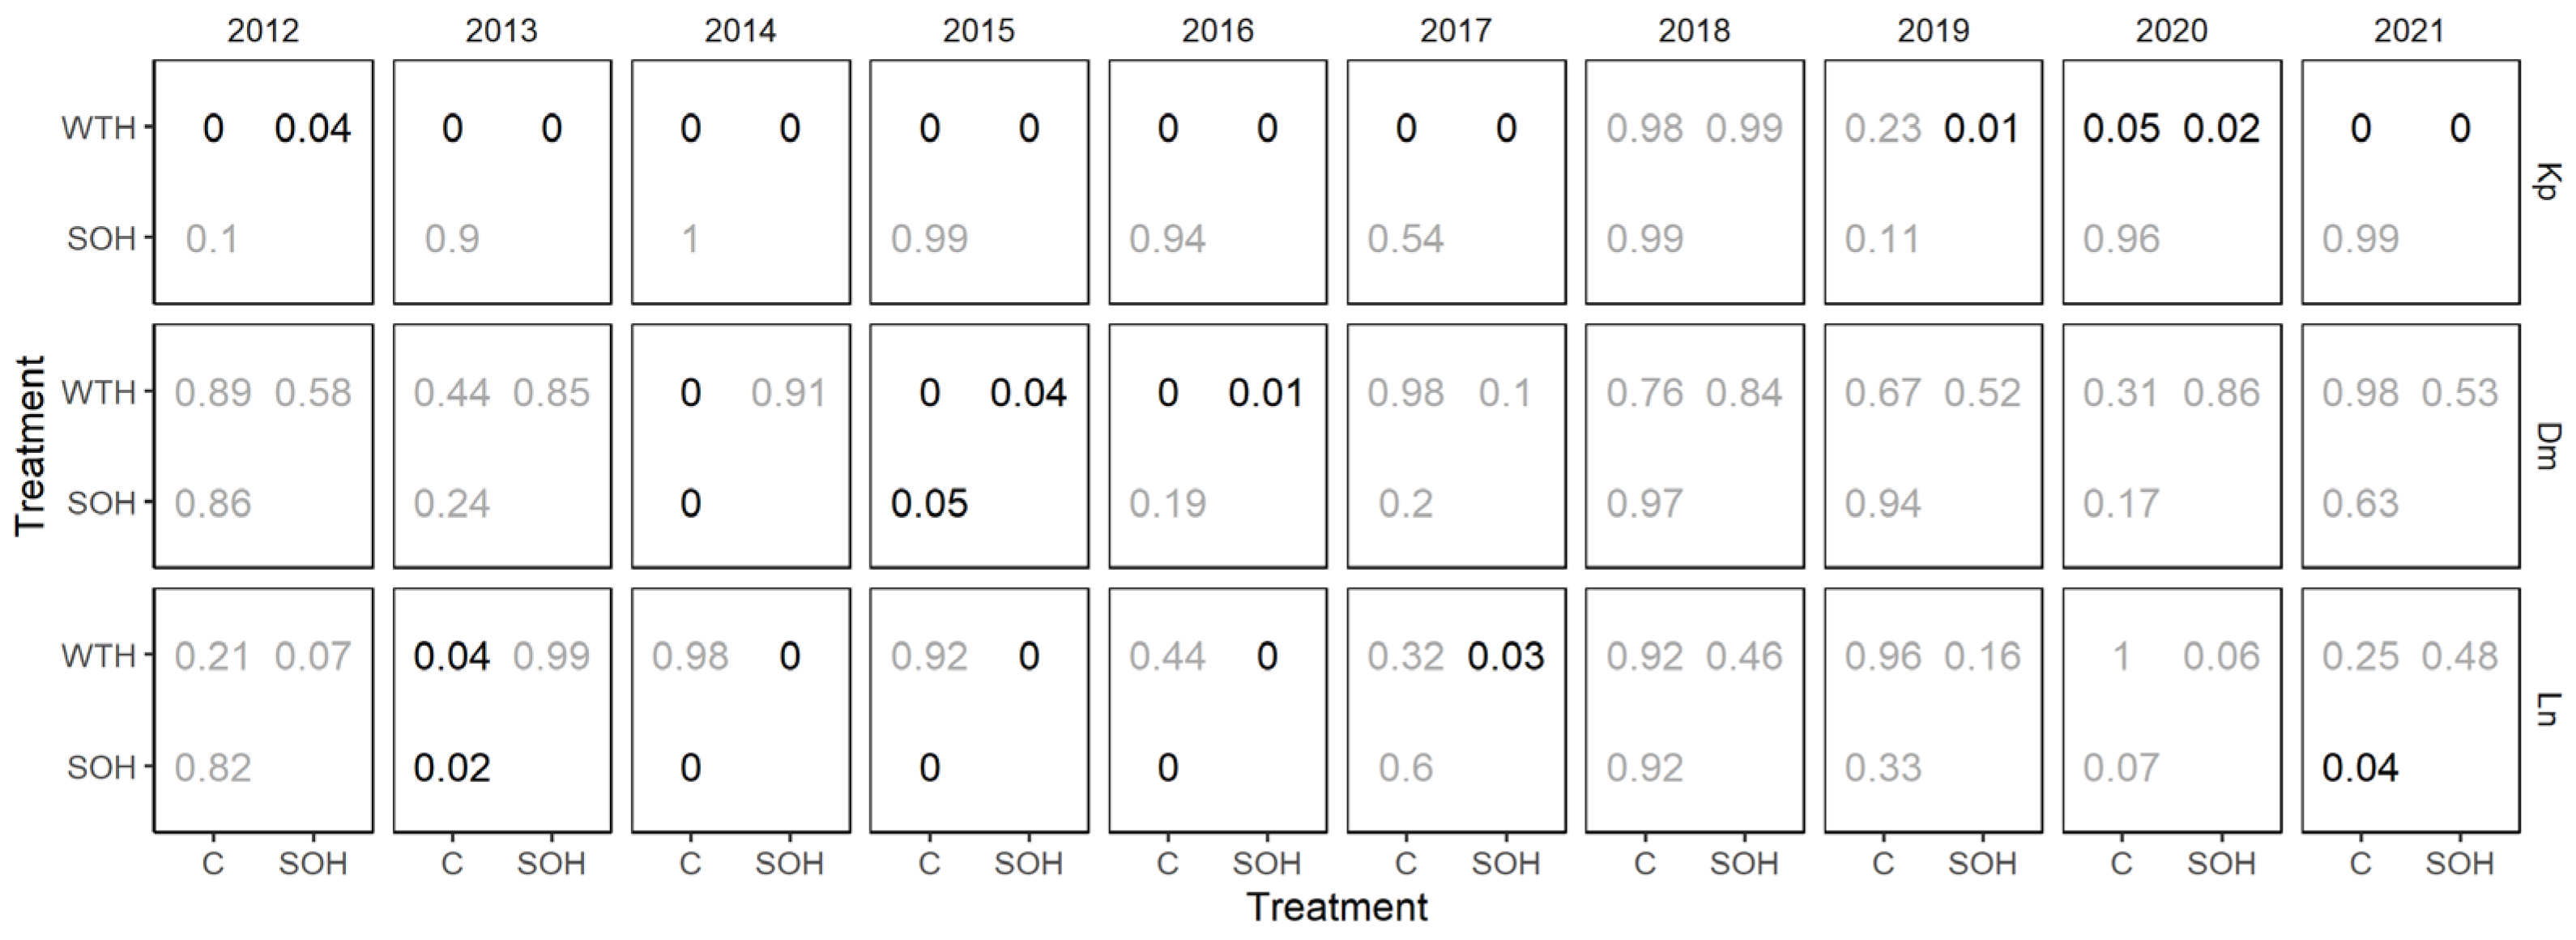
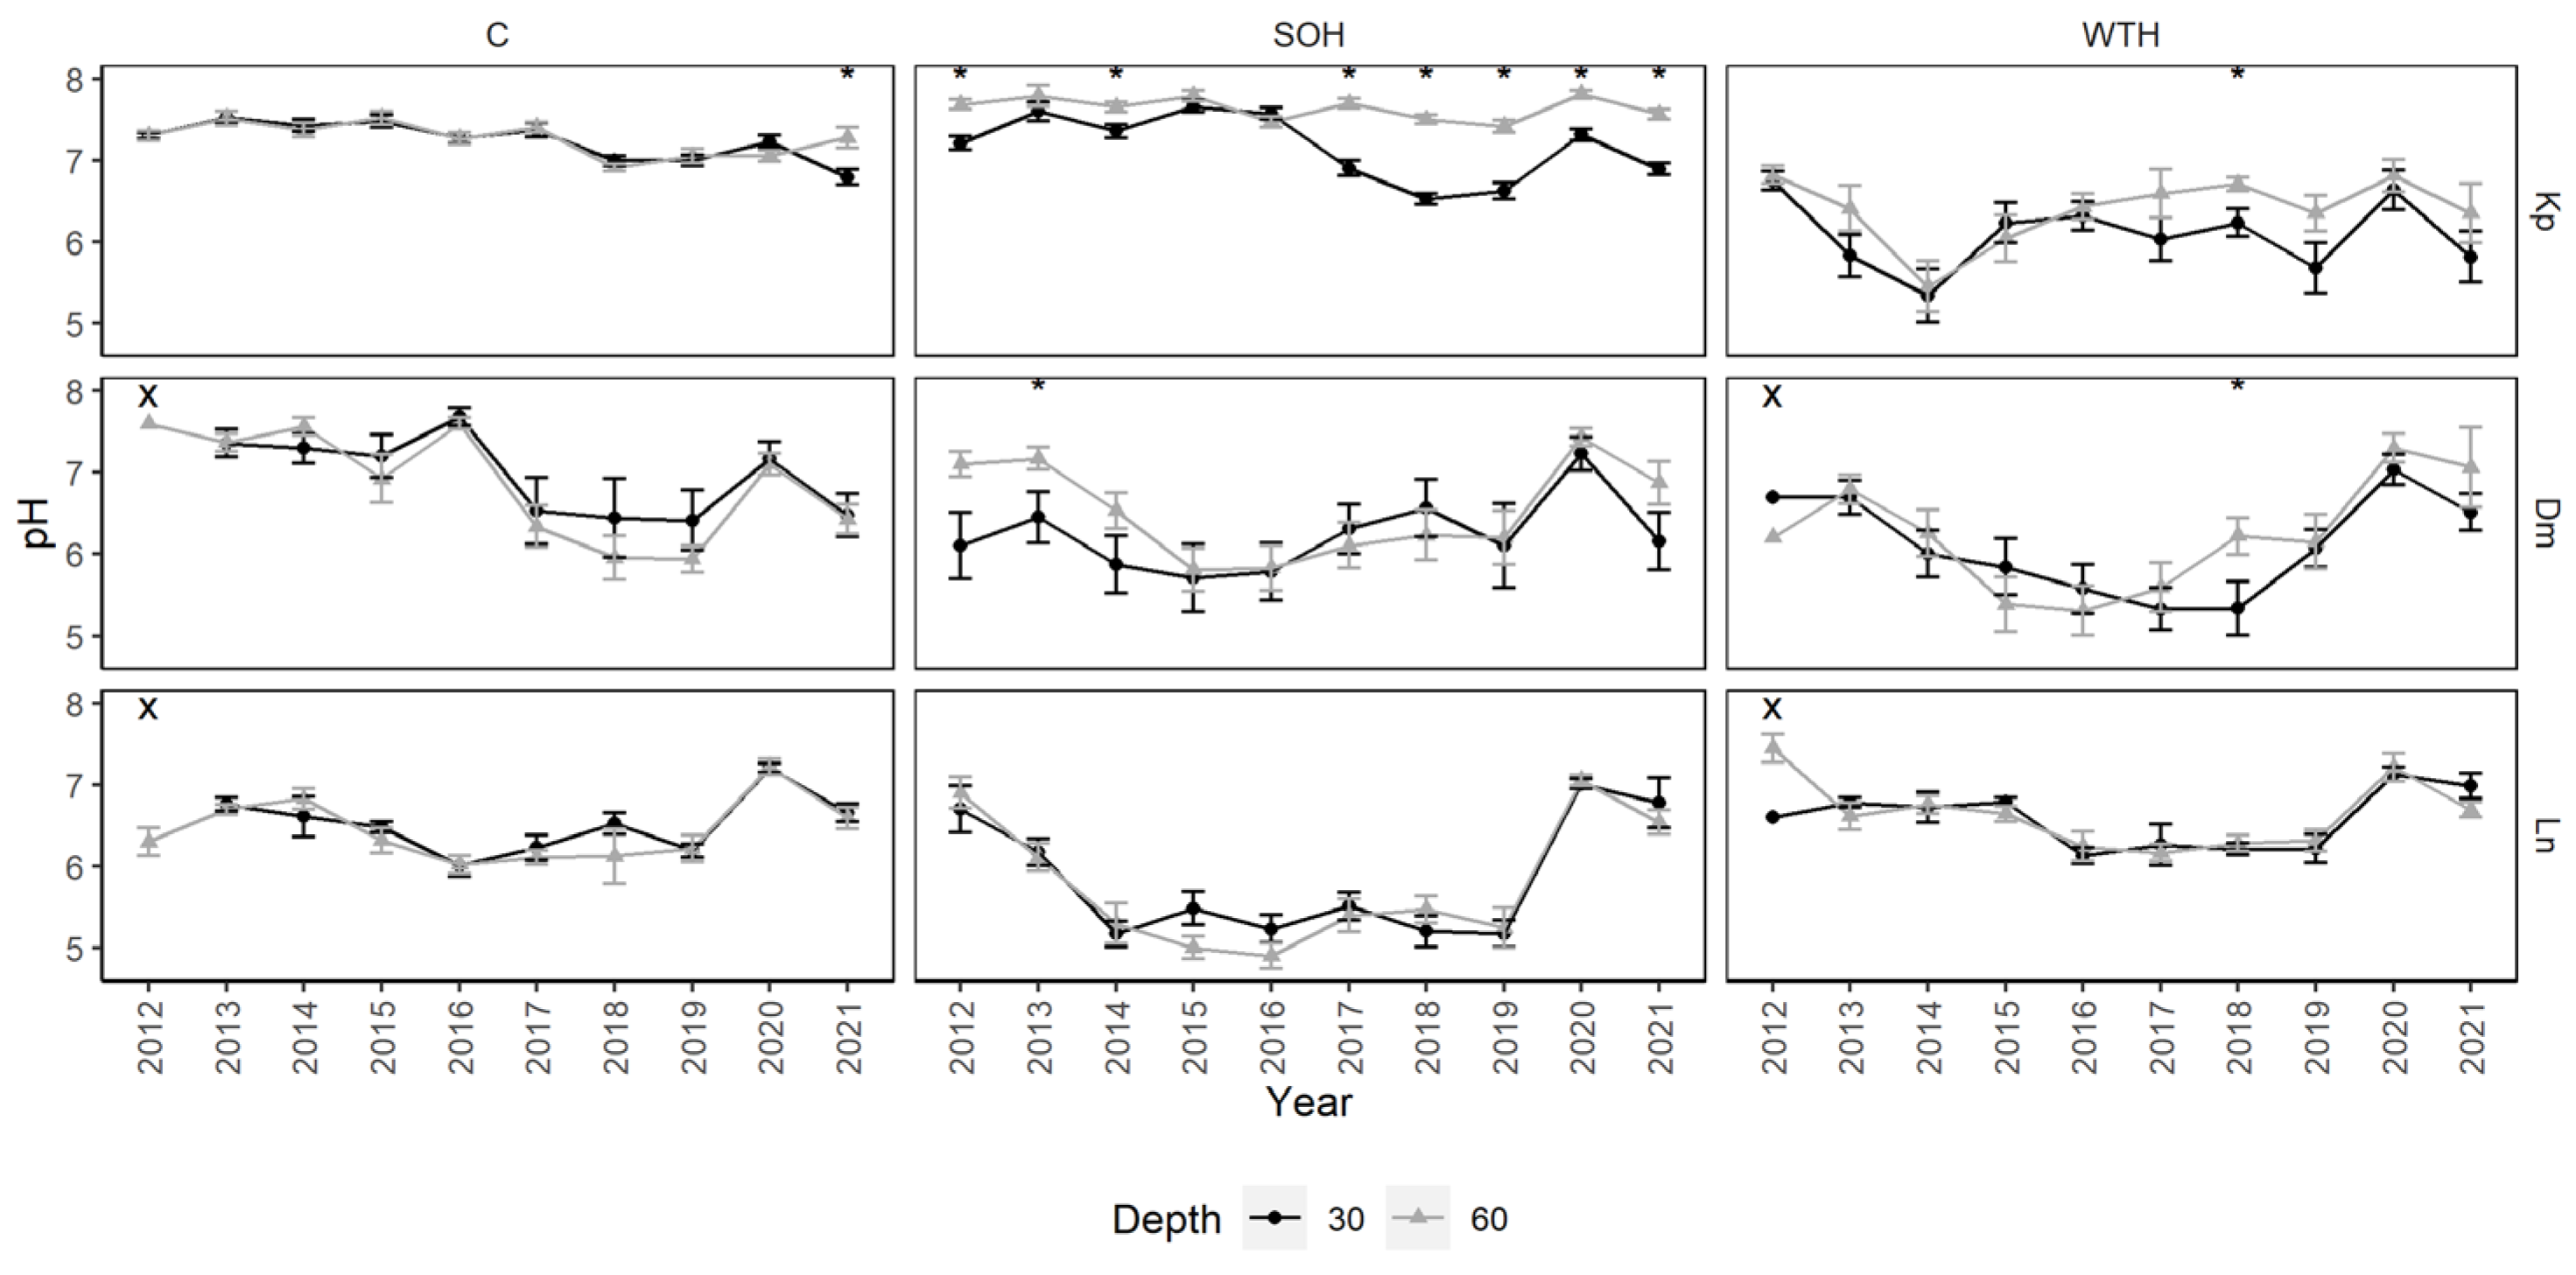
From 2012 to 2021, the mean soil solution pH of the Kp site was 7.0 ± 0.1: 7.2 ± 0.1 for the control, 7.4 ± 0.1 for CH and 6.3 ± 0.1 for WTH (Figure 4). The mean pH during the vegetation season was significantly lower for WTH than for CH or the control (p < 0.01) (Figure A1). The mean pH in the vegetation season for CH was similar to the control, except in 2012, 2016 and 2020 (p < 0.03). The mean pH of the soil solution from the Dm site was 6.5 ± 0.1: 7.0 ± 0.2 for the control, 6.4 ± 0.2 for CH and 6.2 ± 0.1 for WTH. The mean pH during the vegetation season was significantly lower for CH and WTH than for the control from 2013 to 2016 (p < 0.04). In 2017, the mean pH was significantly lower for WTH than for the control (p = 0.01) or CH (p = 0.03). Since 2018, the mean pH values in the control, CH and WTH were similar. The mean pH of the Ln site was 6.3 ± 0.1: 6.5 ± 0.1 for the control, 5.8 ± 0.2 for CH and 6.6 ± 0.1 for WTH. The mean pH during the vegetation season was significantly lower for CH than for WTH and the control from 2013 to 2019 (p < 0.01). No pronounced differences were observed between the 30 and 60 cm sampling depths in all plots at all sites, except for CH at the Kp site, where the mean pH during the vegetation season was often lower at the 30 cm than at the 60 cm sampling depth (Figure A5).
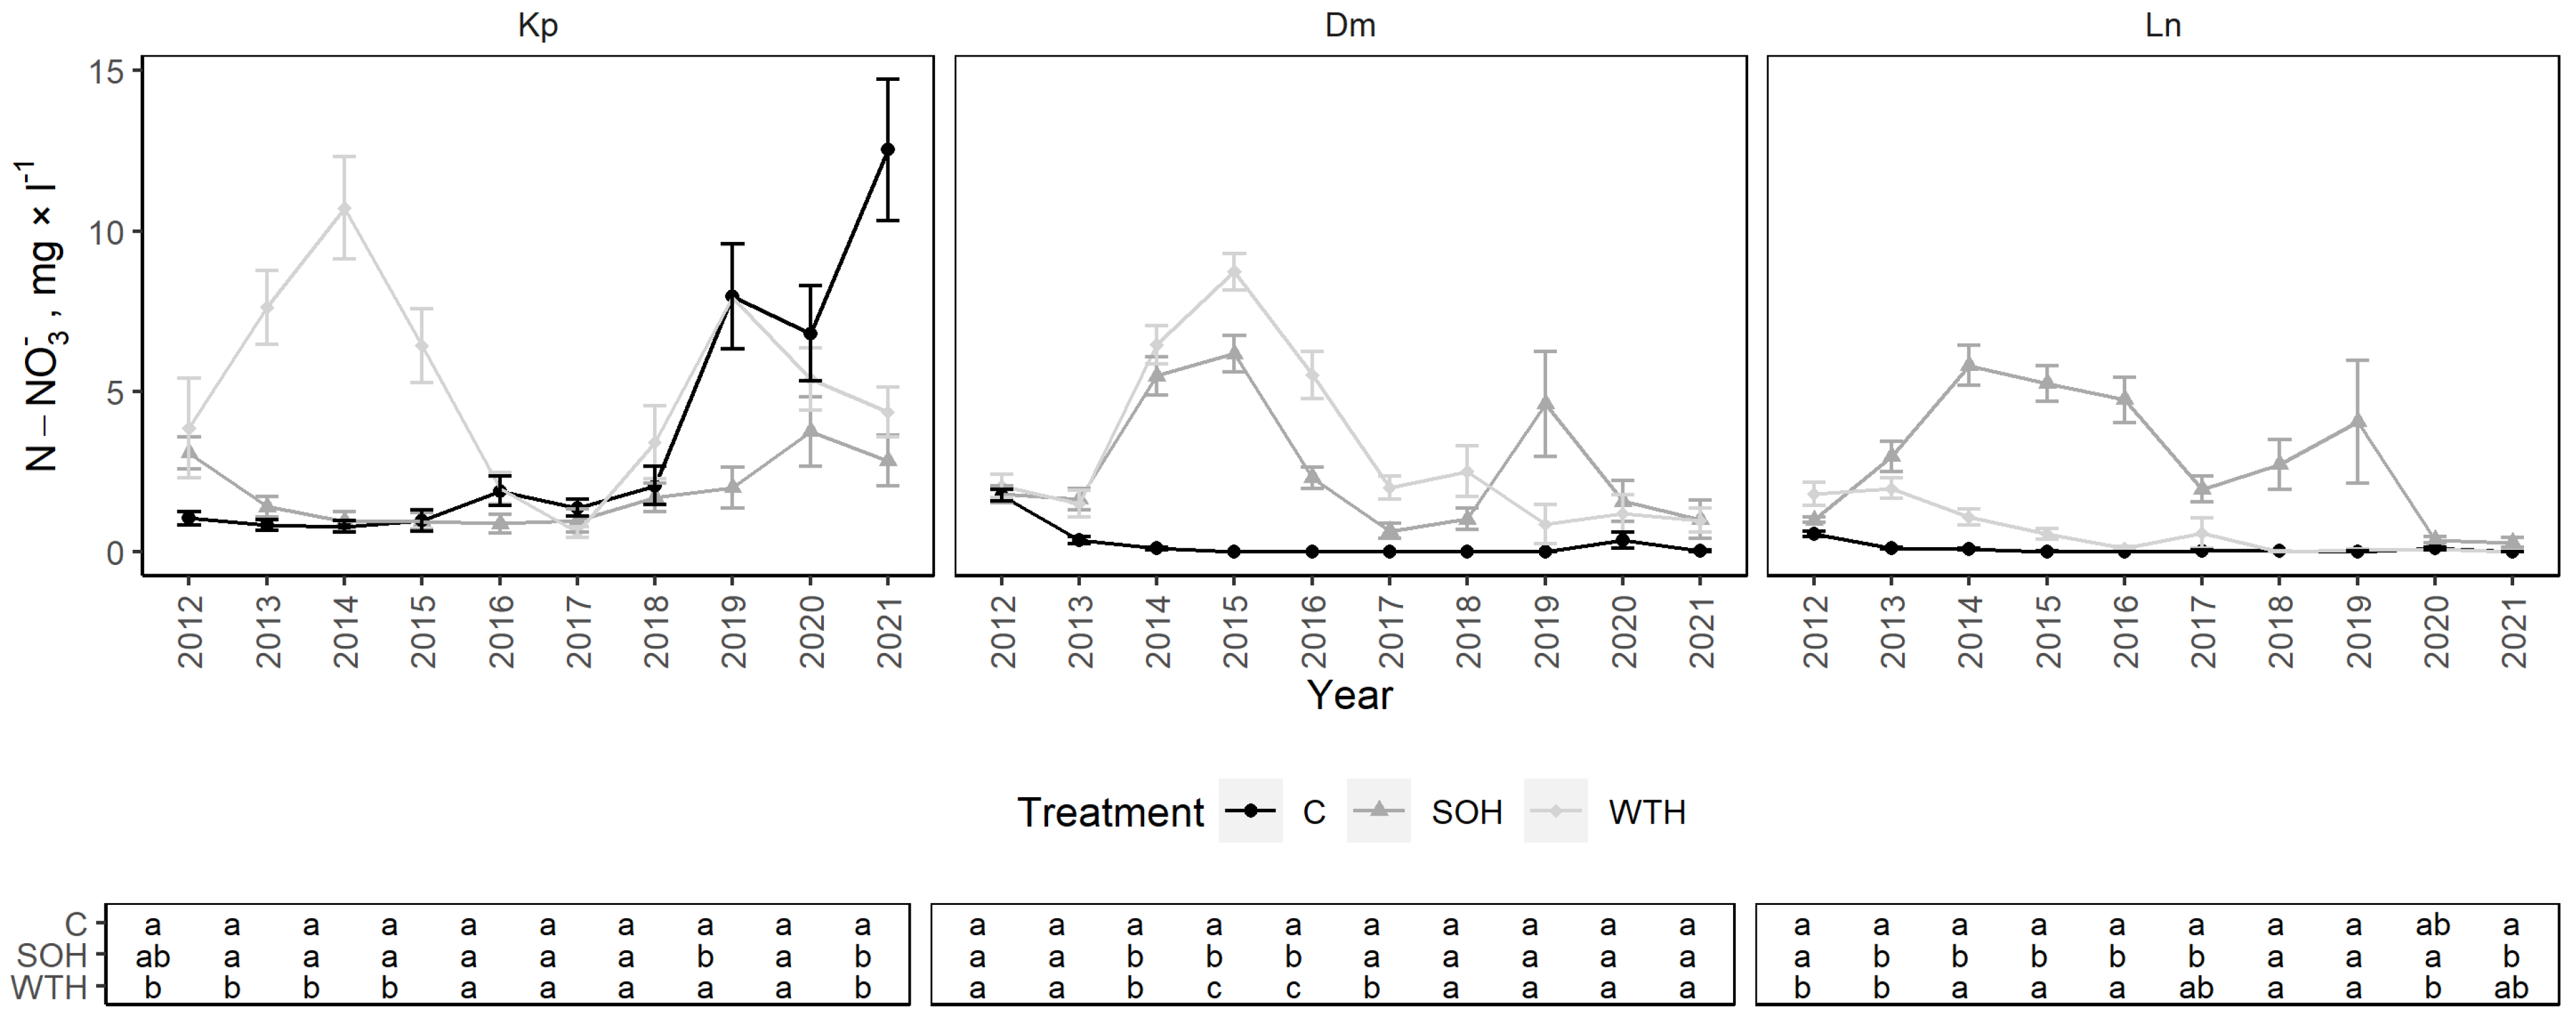
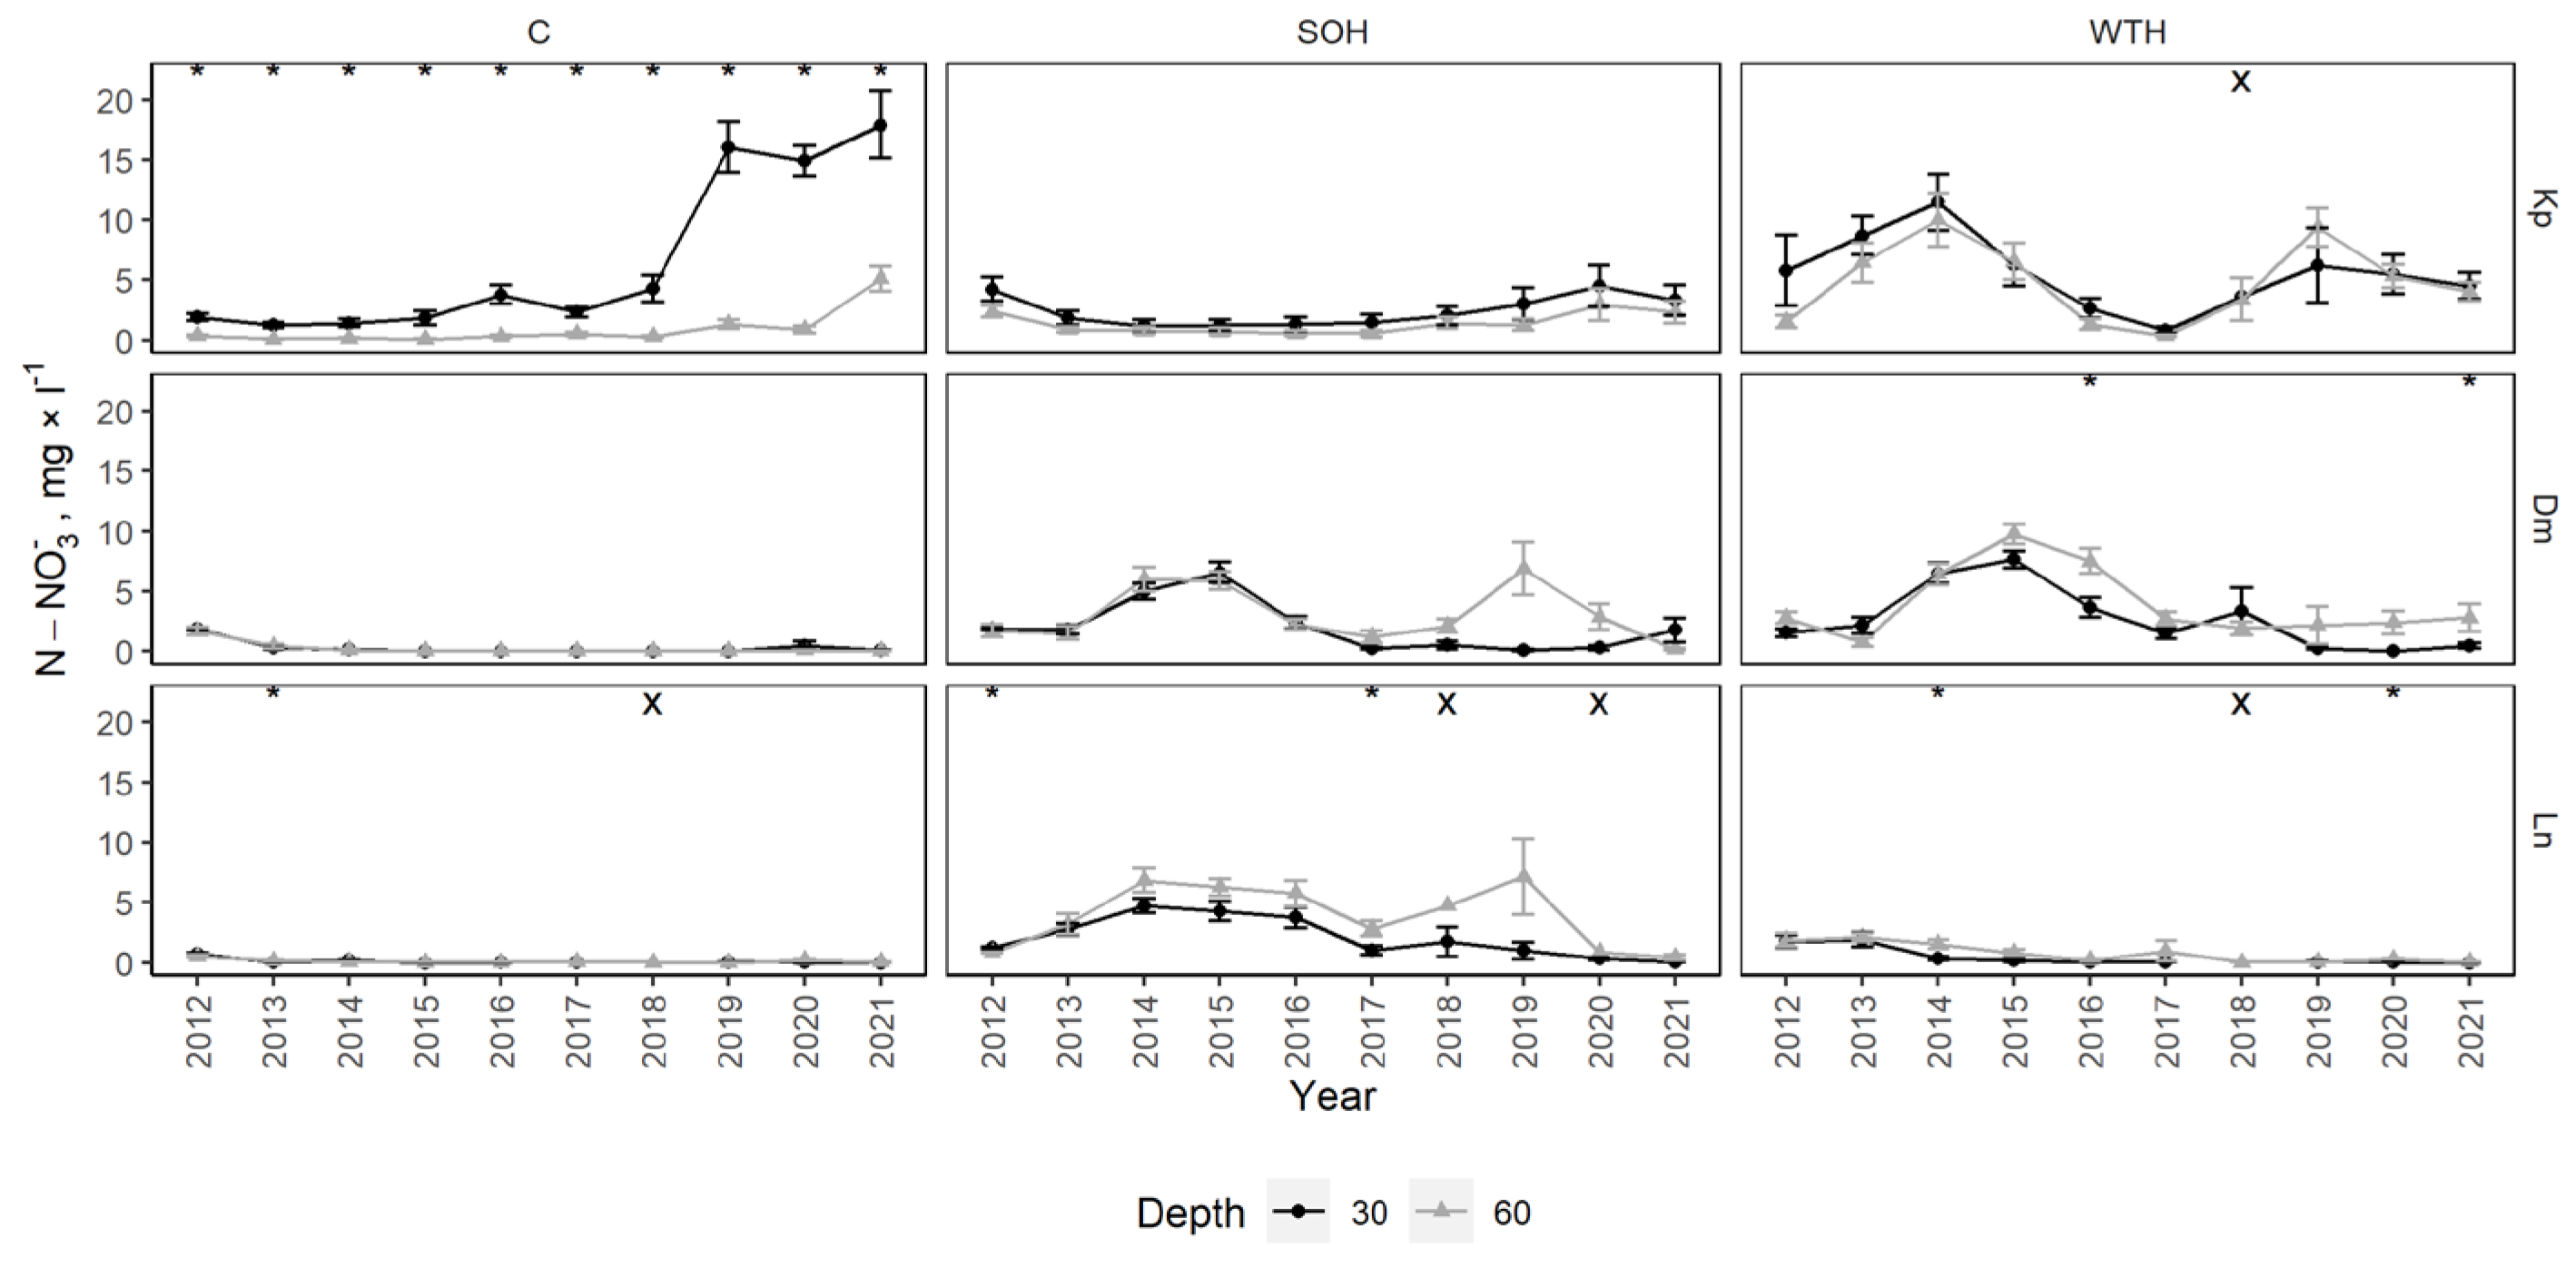
From 2012 to 2021, the mean N-NO3− concentration at the Kp site was 3.58 ± 0.58 mg·L−1: 3.64 ± 1.28 mg·L−1 for the control, 1.86 ± 0.33 mg·L−1 for CH and 5.24 ± 0.96 mg·L−1 for WTH (Figure 5). N-NO3− concentrations were slightly higher for WTH than for the control in 2012 (p = 0.04) (Figure A2). After harvest, N-NO3− concentrations peaked significantly for WTH from 2013 to 2015, while remaining relatively stable for the control and CH (p < 0.01). From 2016 to 2017, N-NO3− concentrations in all plots were similar to pre-felling levels. N-NO3− concentrations for the control increased significantly since 2019 due to the partial collapse of the stand resulting from bark beetle attack and wind throw. Significantly higher N-NO3− concentrations were observed for WTH in 2019 compared to CH (p = 0.03). For the control, N-NO3− concentrations from 2012 to 2018 were 0.57 mg·L−1 greater at the 30 cm than at the 60 cm sampling depth, on average (Figure A6). From 2019 to 2021, the difference between the sampling depths increased to 13.85 mg·L−1 due to the collapse of the stand. No considerable differences between sampling depths were observed for CH or WTH.
The mean N-NO3− concentration at the Dm site was 2.03 ± 0.42 mg·L−1: 0.27 ± 0.17 mg·L−1 for the control, 2.64 ± 0.64 mg·L−1 for CH and 3.19 ± 0.86 mg·L−1 for WTH. N-NO3− concentrations slightly decreased during the initial years of observations for the control and increased after harvesting for CH and WTH. Compared to the control, the N-NO3− concentration was significantly higher for CH from 2014 to 2016 (p < 0.01) and WTH from 2014 to 2017 (p < 0.01). The peak of N-NO3− concentrations was higher for WTH than for CH, which was statistically significant from 2015 to 2017 (p < 0.01). N-NO3− concentrations generally stabilised to the same level as the control after 2017. There were no significant differences in N-NO3− concentrations between the 30 and 60 cm sampling depths for the control, while the second statistically insignificant peak for CH was observed only at the 60 cm sampling depth. N-NO3− concentrations were 1.22 mg·L−1 greater at the 60 cm than at the 30 cm sampling depth for WTH, on average.
The mean N-NO3− concentration at the Ln site was 1.22 ± 0.32 mg·L−1: 0.11 ± 0.05 mg·L−1 for the control, 2.93 ± 0.64 mg·L−1 for CH and 0.64 ± 0.24 mg·L−1 for WTH. In 2012, the mean N-NO3− concentration was significantly higher for WTH than the control or CH (p < 0.01). In 2013, the mean N-NO3− concentration was still significantly higher for WTH than the control (p = 0.01), but later stabilised to the same level as the control. For CH, the N-NO3− concentrations significantly peaked from 2013 to 2017 when compared to the control (p < 0.02) and from 2014 to 2016 when compared to WTH (p < 0.01). From 2018 to 2019, another (statistically insignificant) peak of N-NO3− concentrations was observed for CH. N-NO3− concentrations for CH were higher at the 60 cm than at the 30 cm sampling depth by 2.51 mg·L−1 on average, during both peaks in 2013–2019.
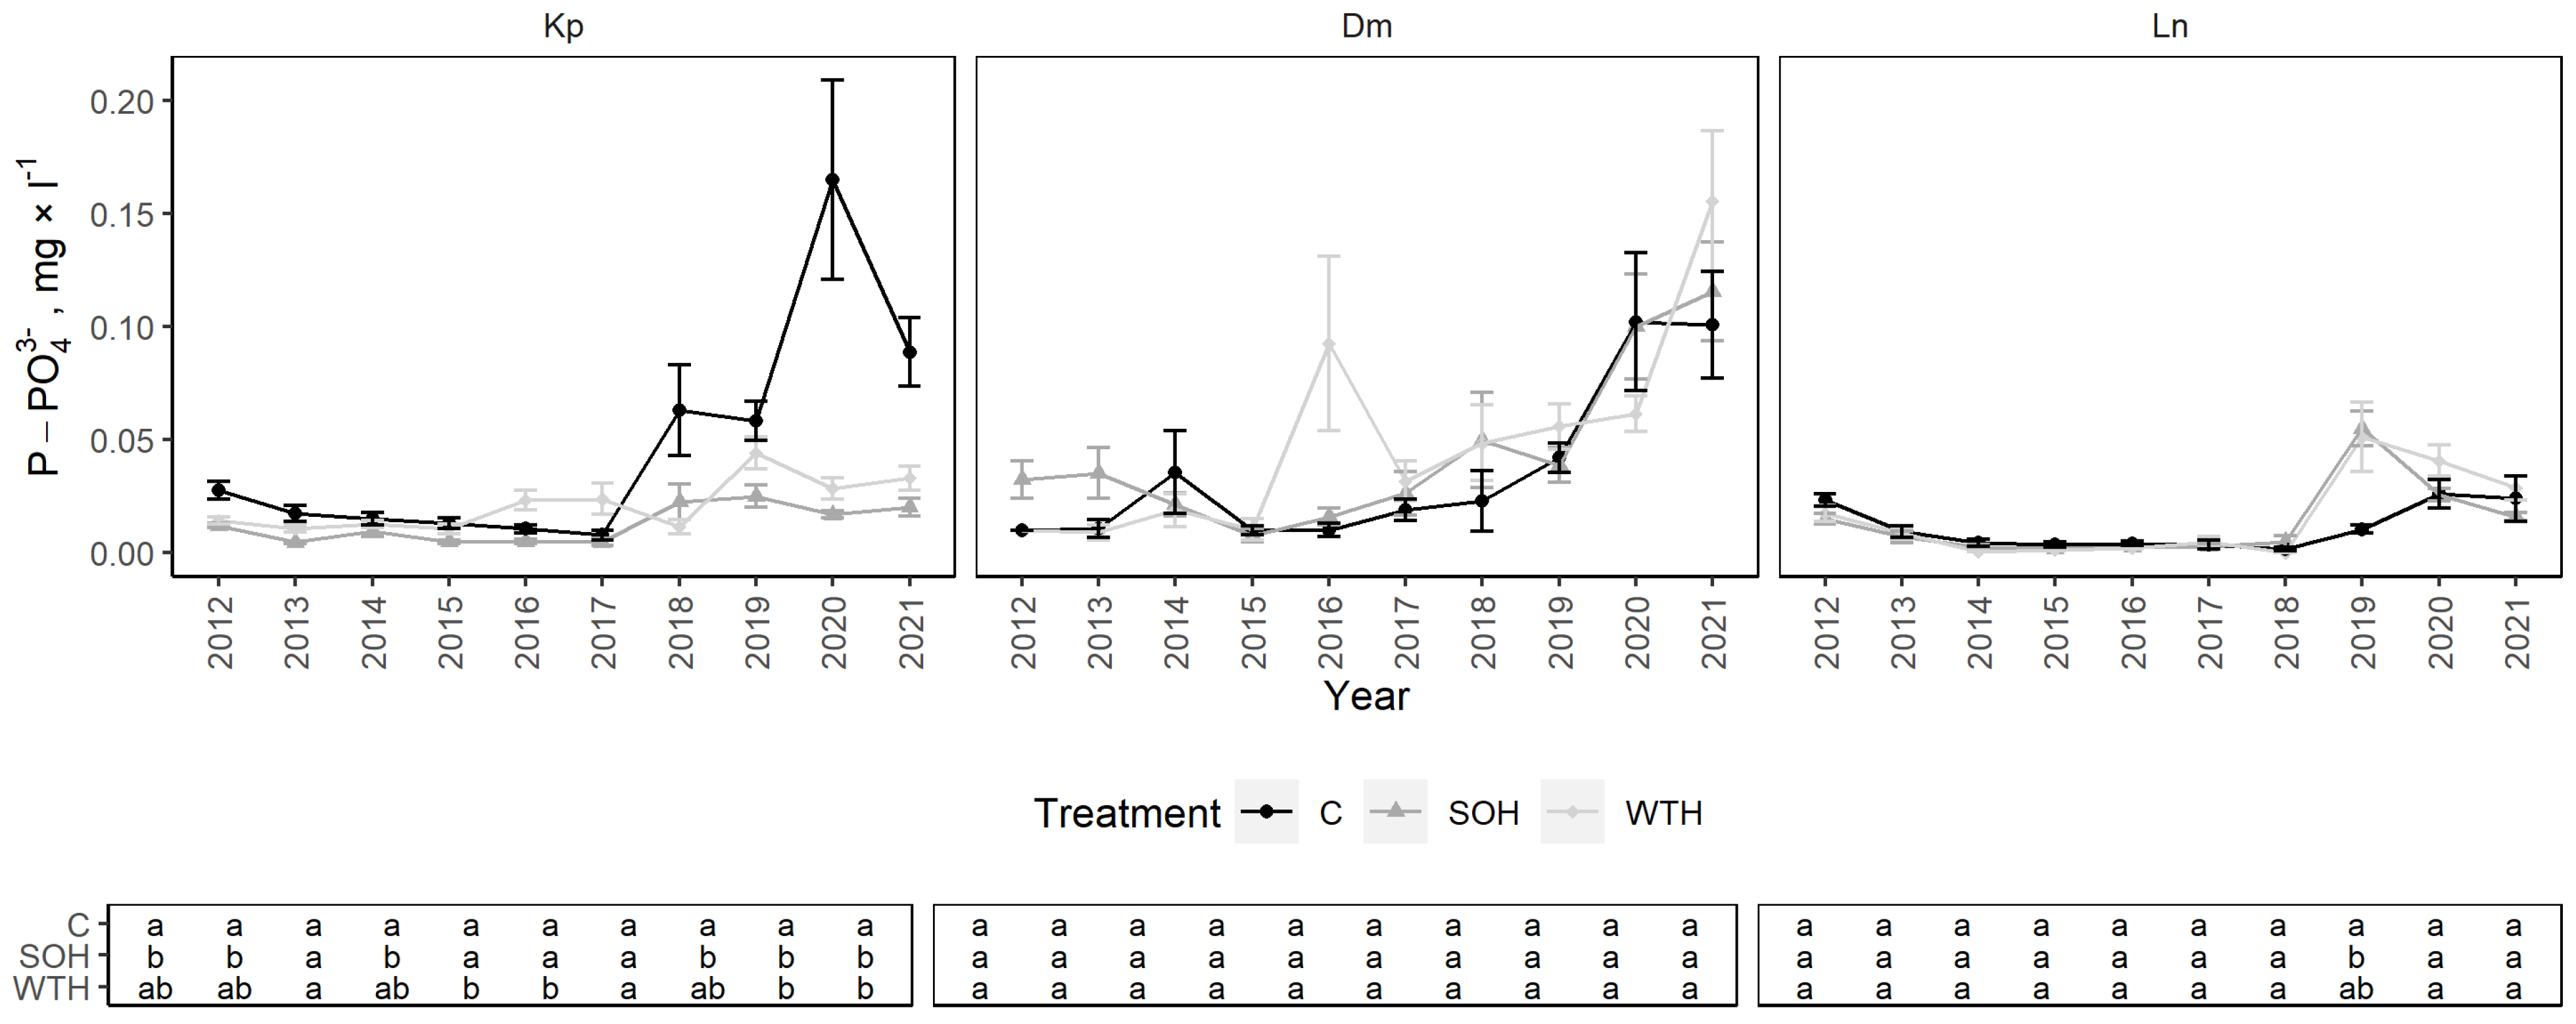
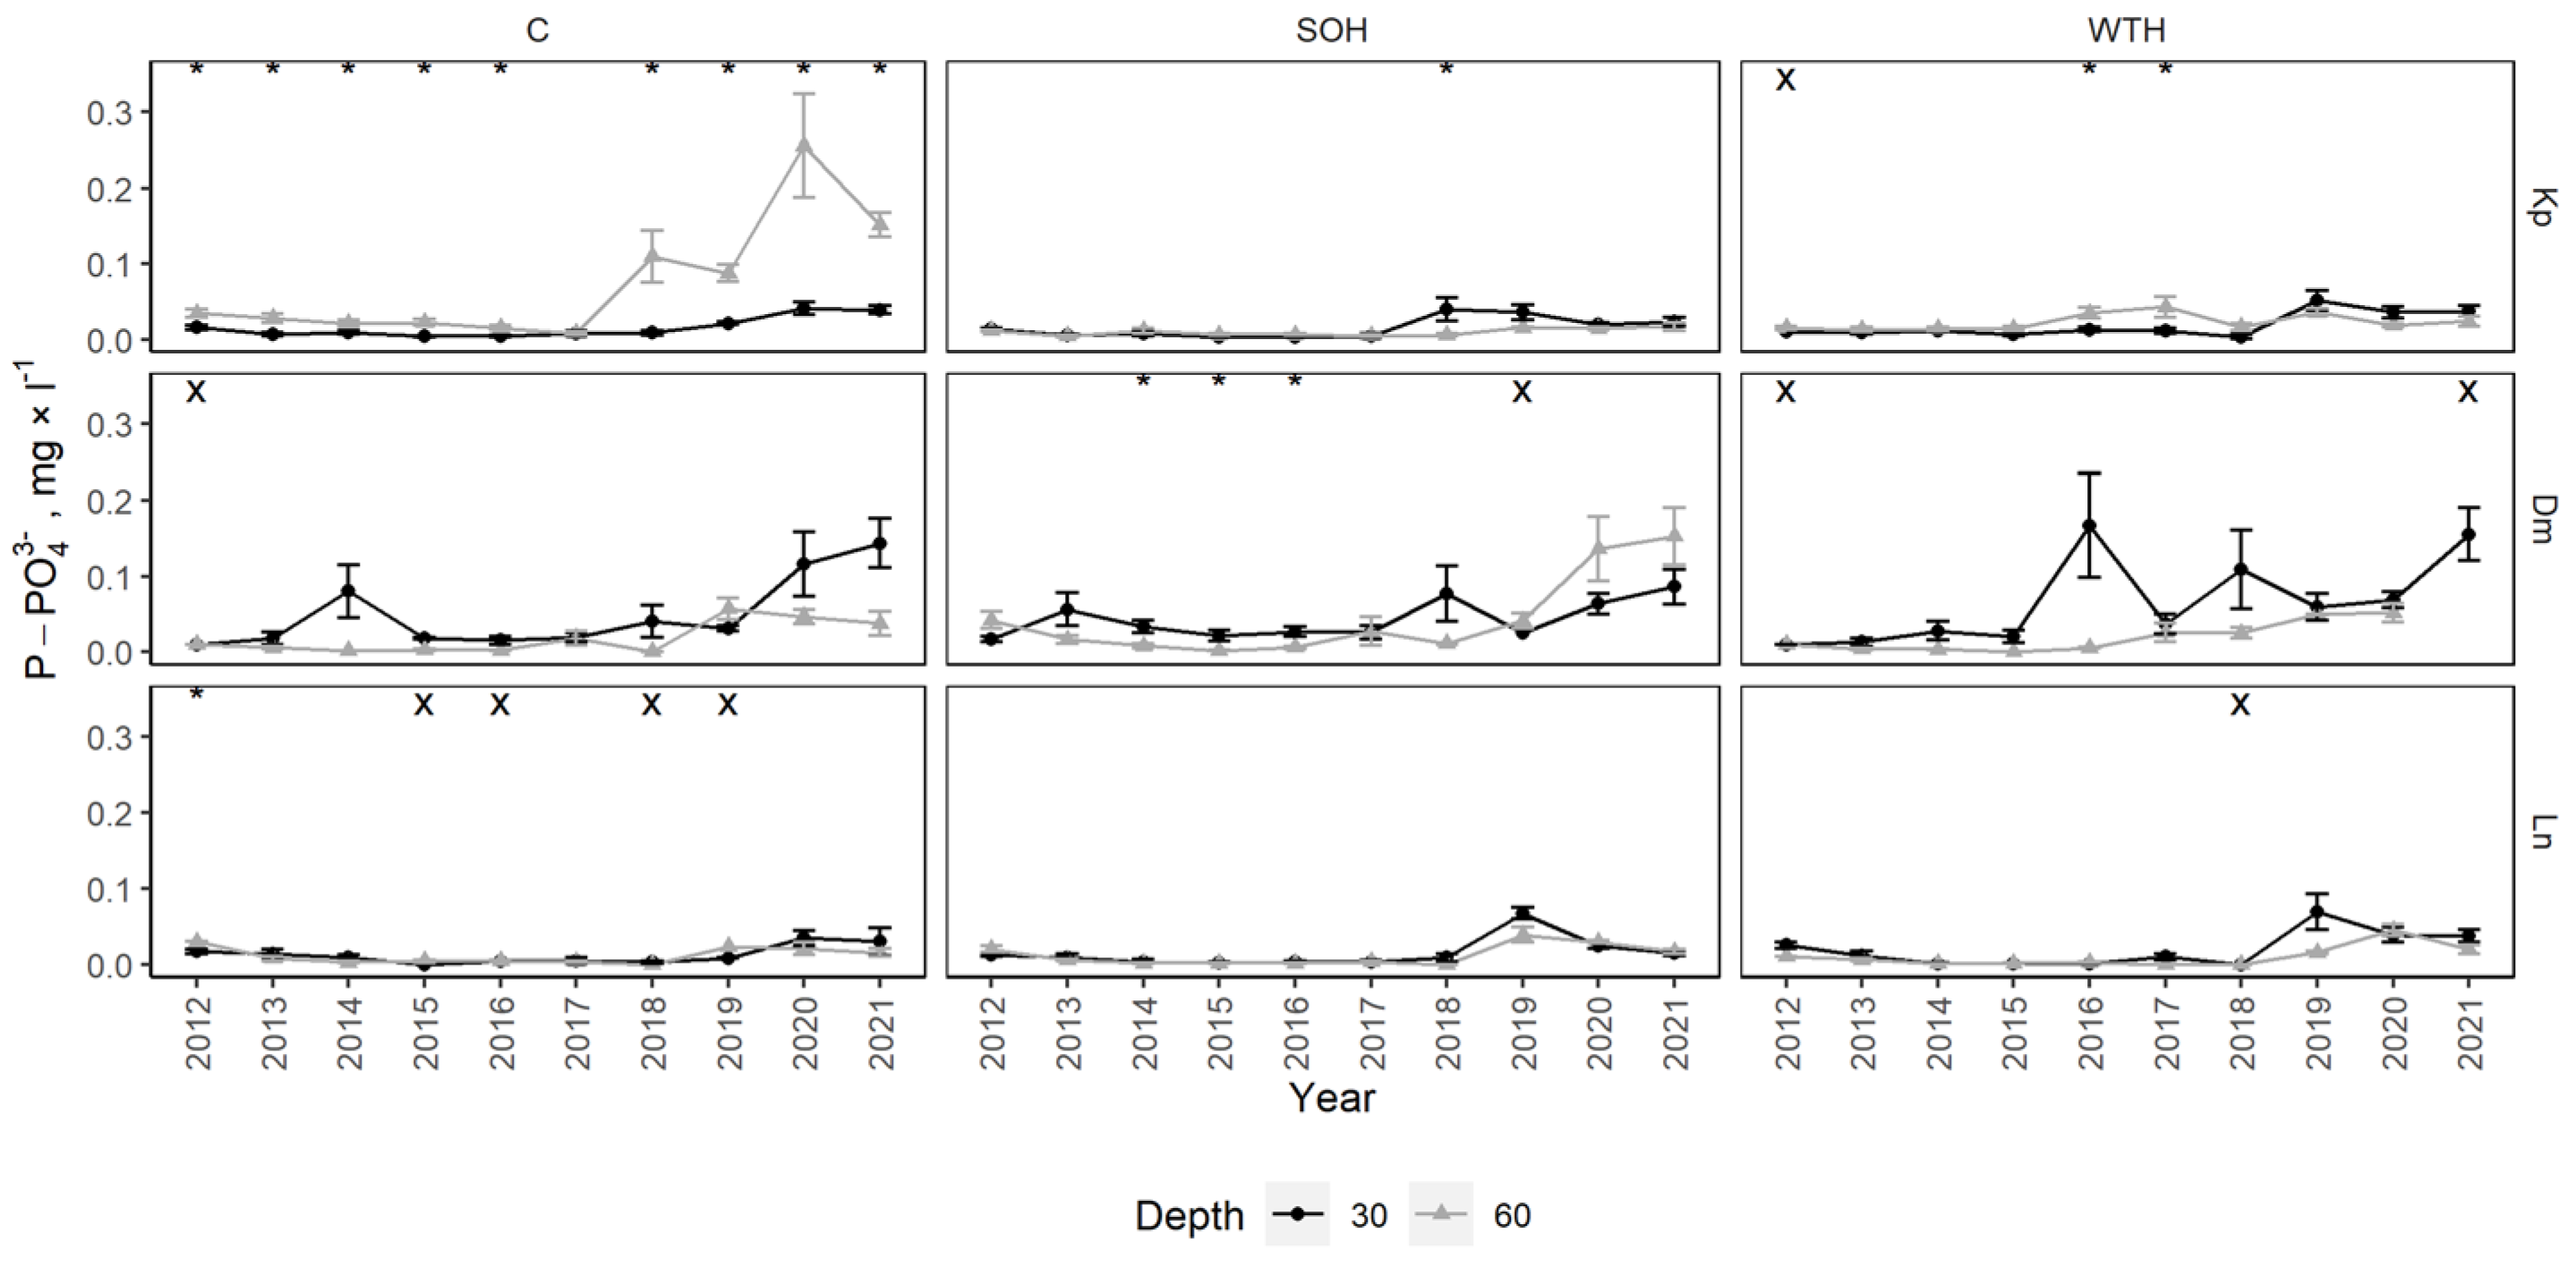
Generally, P-PO43− concentrations in all three sites were low and showed no clear effect of harvest intensity (Figure 6). From 2012 to 2021, the mean P-PO43− concentration at the Kp site was 0.03 ± 0.01 mg·L−1: 0.05 ± 0.02 mg·L−1 for the control, 0.01 ± 0.00 mg·L−1 for CH and 0.02 ± 0.00 mg·L−1 for WTH. In the latest years of observations (2018–2021), P-PO43− concentrations increased for the control with the partial collapse of the stand, reaching significantly higher concentrations than for CH from 2019 to 2021 (p < 0.01) and WTH from 2020 to 2021 (p < 0.01) (Figure A3). The effect was more pronounced at the 60 cm than at the 30 cm sampling depth (Figure A7). P-PO43− concentrations for the control were significantly higher at the 60 cm than at the 30 cm sampling depth, by 0.03 mg·L−1, on average, during all study years except 2017. P-PO43− concentrations were significantly lower for CH than for the control in 2012, 2013 and 2015 (p < 0.01). P-PO43− concentrations were significantly higher for WTH than CH or the control in 2016 and 2017 (p < 0.01). The mean P-PO43− concentrations at the Dm site tended to increase in the latest years (2020–2021) in all plots. The only statistically significant difference at the Ln site was observed in 2019, when the mean P-PO43− concentration increased slightly for CH compared to the control (p = 0.05).
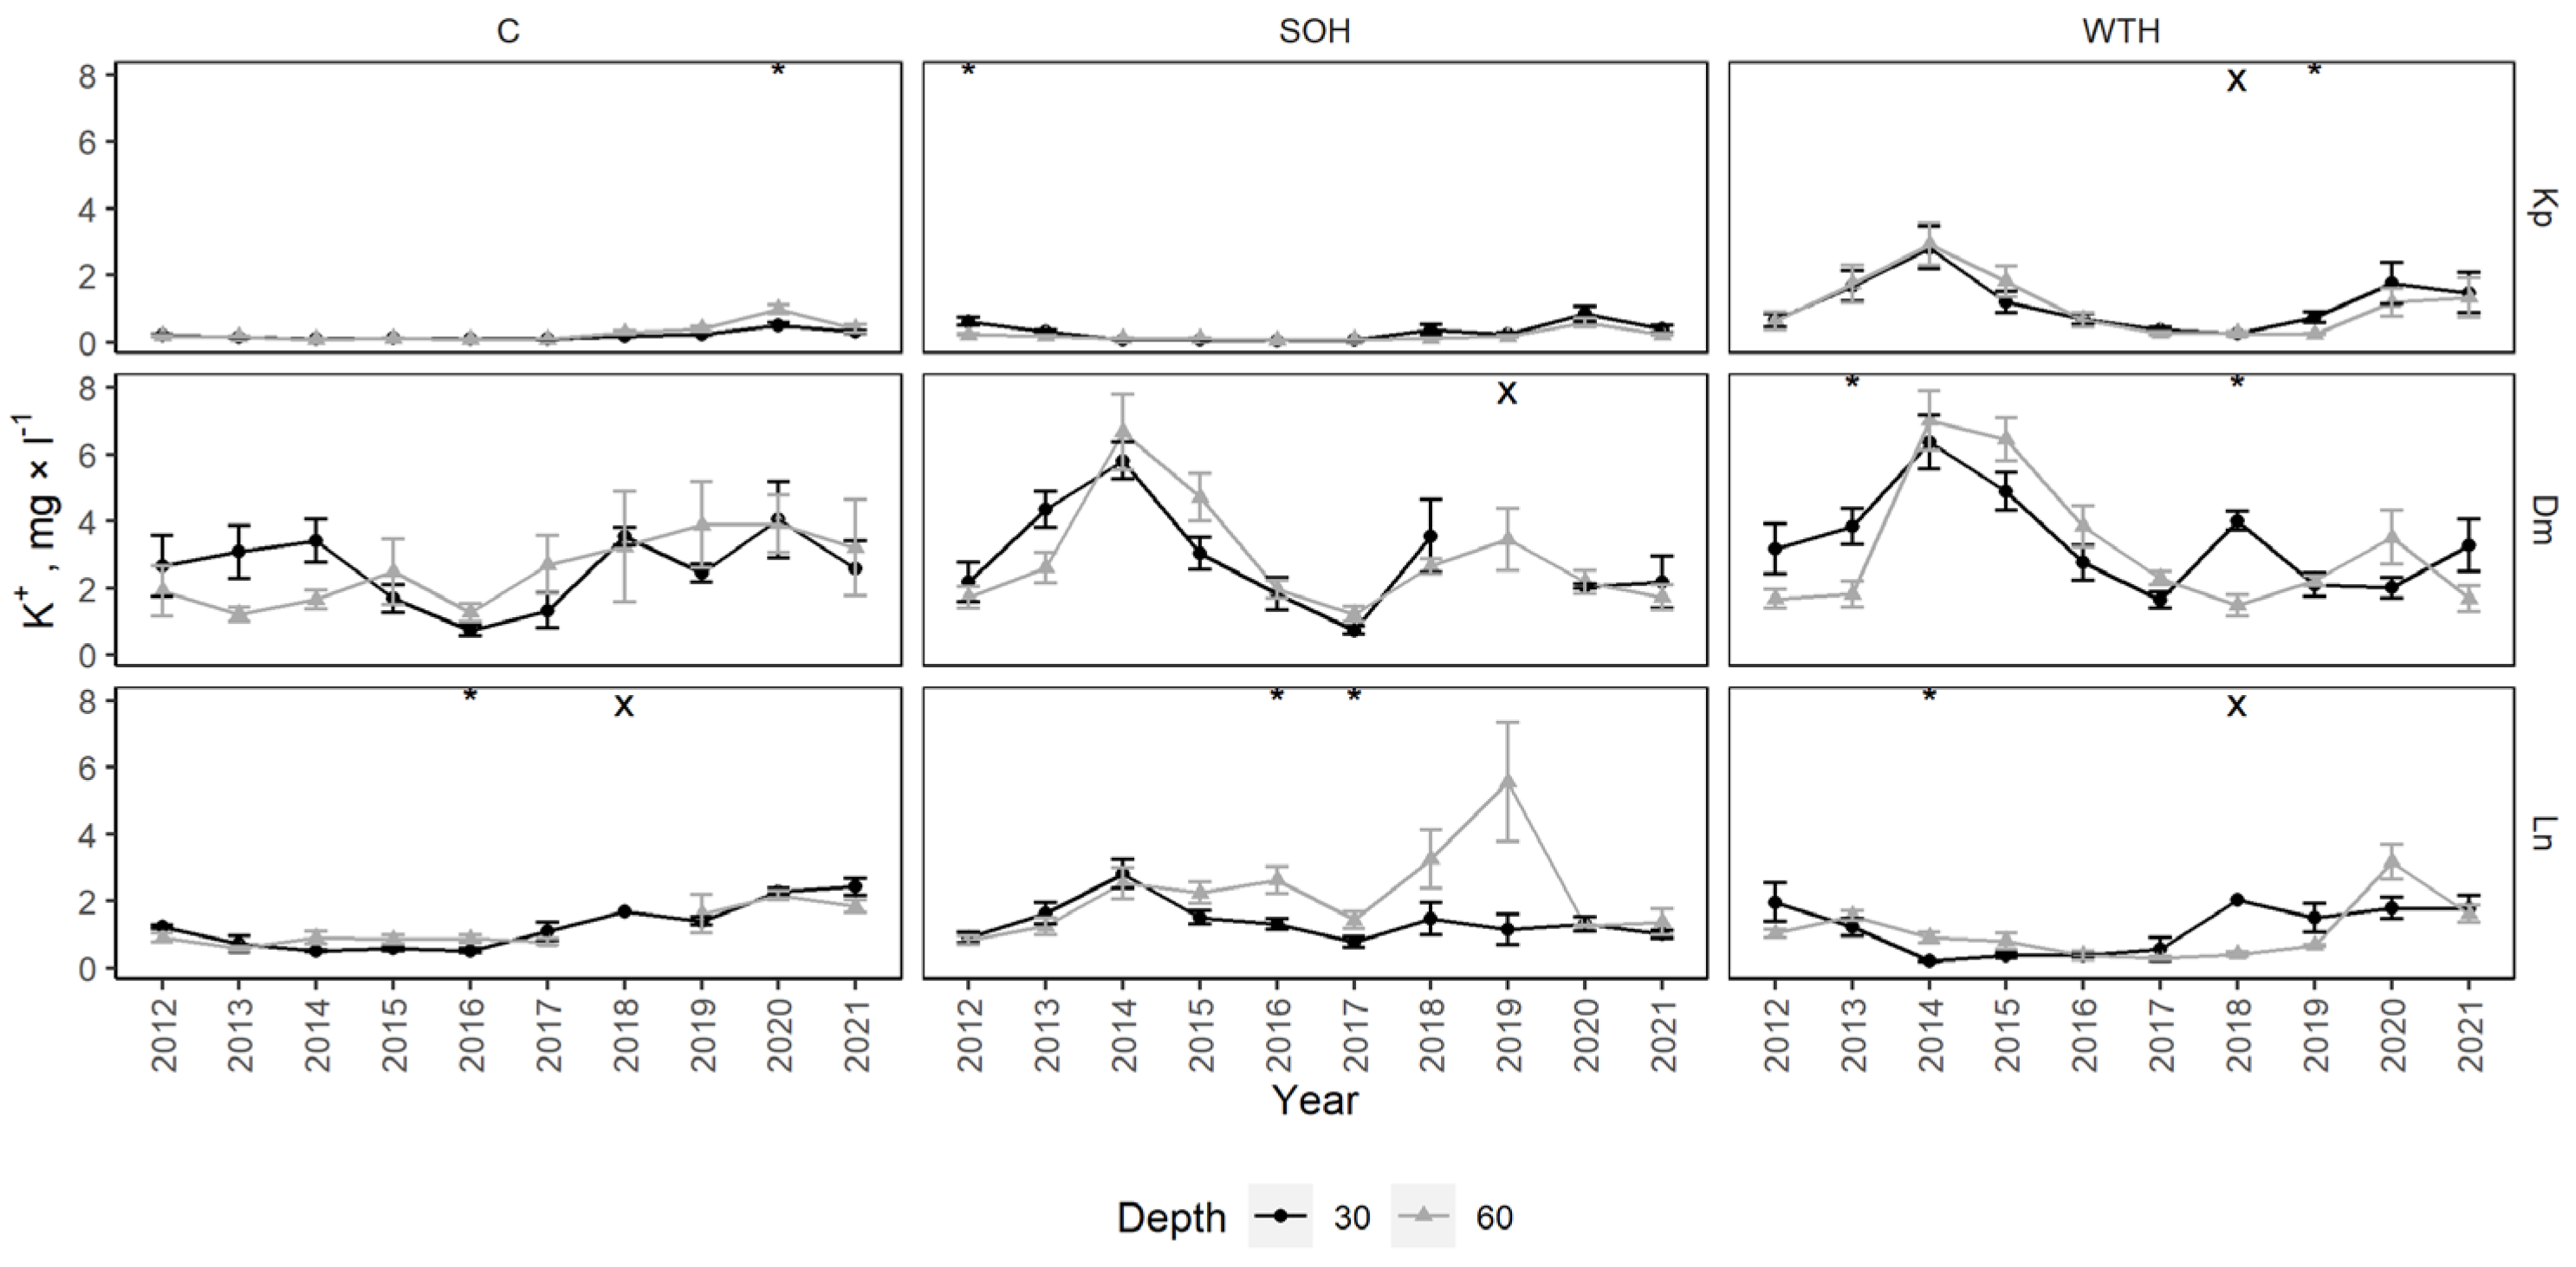
From 2012 to 2021, The mean K+ concentration at the Kp site was 0.54 ± 0.12 mg·L−1: 0.24 ± 0.07 mg·L−1 for the control, 0.24 ± 0.06 mg·L−1 for CH and 1.15 ± 0.26 mg·L−1 for WTH (Figure 7). Significantly higher mean K+ concentrations were observed for WTH from 2012 to 2017 compared to CH and the control (p < 0.04) (Figure A4). In 2012, the mean K+ concentration was significantly higher for WTH than for CH or the control, but less pronounced than during the peak. In 2018, K+ concentrations stabilised and were statistically similar in all plots. WTH had significantly higher mean K+ concentrations compared to CH from 2019 to 2021 (p < 0.02) and the control from 2020 to 2021 (p < 0.05).
The mean K+ concentration at the Dm site was 2.93 ± 0.25 mg·L−1: 2.51 ± 0.27 mg·L−1 for the control, 2.93 ± 0.48 mg·L−1 for CH and 3.36 ± 0.49 mg·L−1 for WTH. After harvest, K+ concentrations increased for both CH and WTH, with significant differences between CH and the control from 2014 to 2015 (p < 0.05) and WTH and the control from 2014 to 2016 (p < 0.01). The peak of K+ concentrations for WTH decreased more slowly than for CH, with significantly higher mean K+ concentrations for WTH than CH from 2015 to 2016 (p = 0.01–0.04).
The mean K+ concentration at the Ln site was 1.37 ± 0.13 mg·L−1: 1.22 ± 0.20 mg·L−1 for the control, 1.82 ± 0.25 mg·L−1 for CH and 1.09 ± 0.19 mg·L−1 for WTH. After harvest, the mean K+ concentrations were significantly higher for CH than for the control from 2013 to 2016 (p < 0.02) and WTH from 2014 to 2017 (p < 0.03). From 2015 to 2019, higher K+ concentrations were observed at the 60 cm than at the 30 cm sampling depth for CH (Figure A8). The K+ concentration was slightly higher for WTH than for the control in 2013 (p = 0.04). Another noticeable but statistically insignificant peak of mean K+ concentration was observed for CH from 2018 to 2019. Later, from 2020 to 2021, the K+ concentration for CH dropped even below that for the control, and the difference was statistically significant in 2021 (p = 0.04).
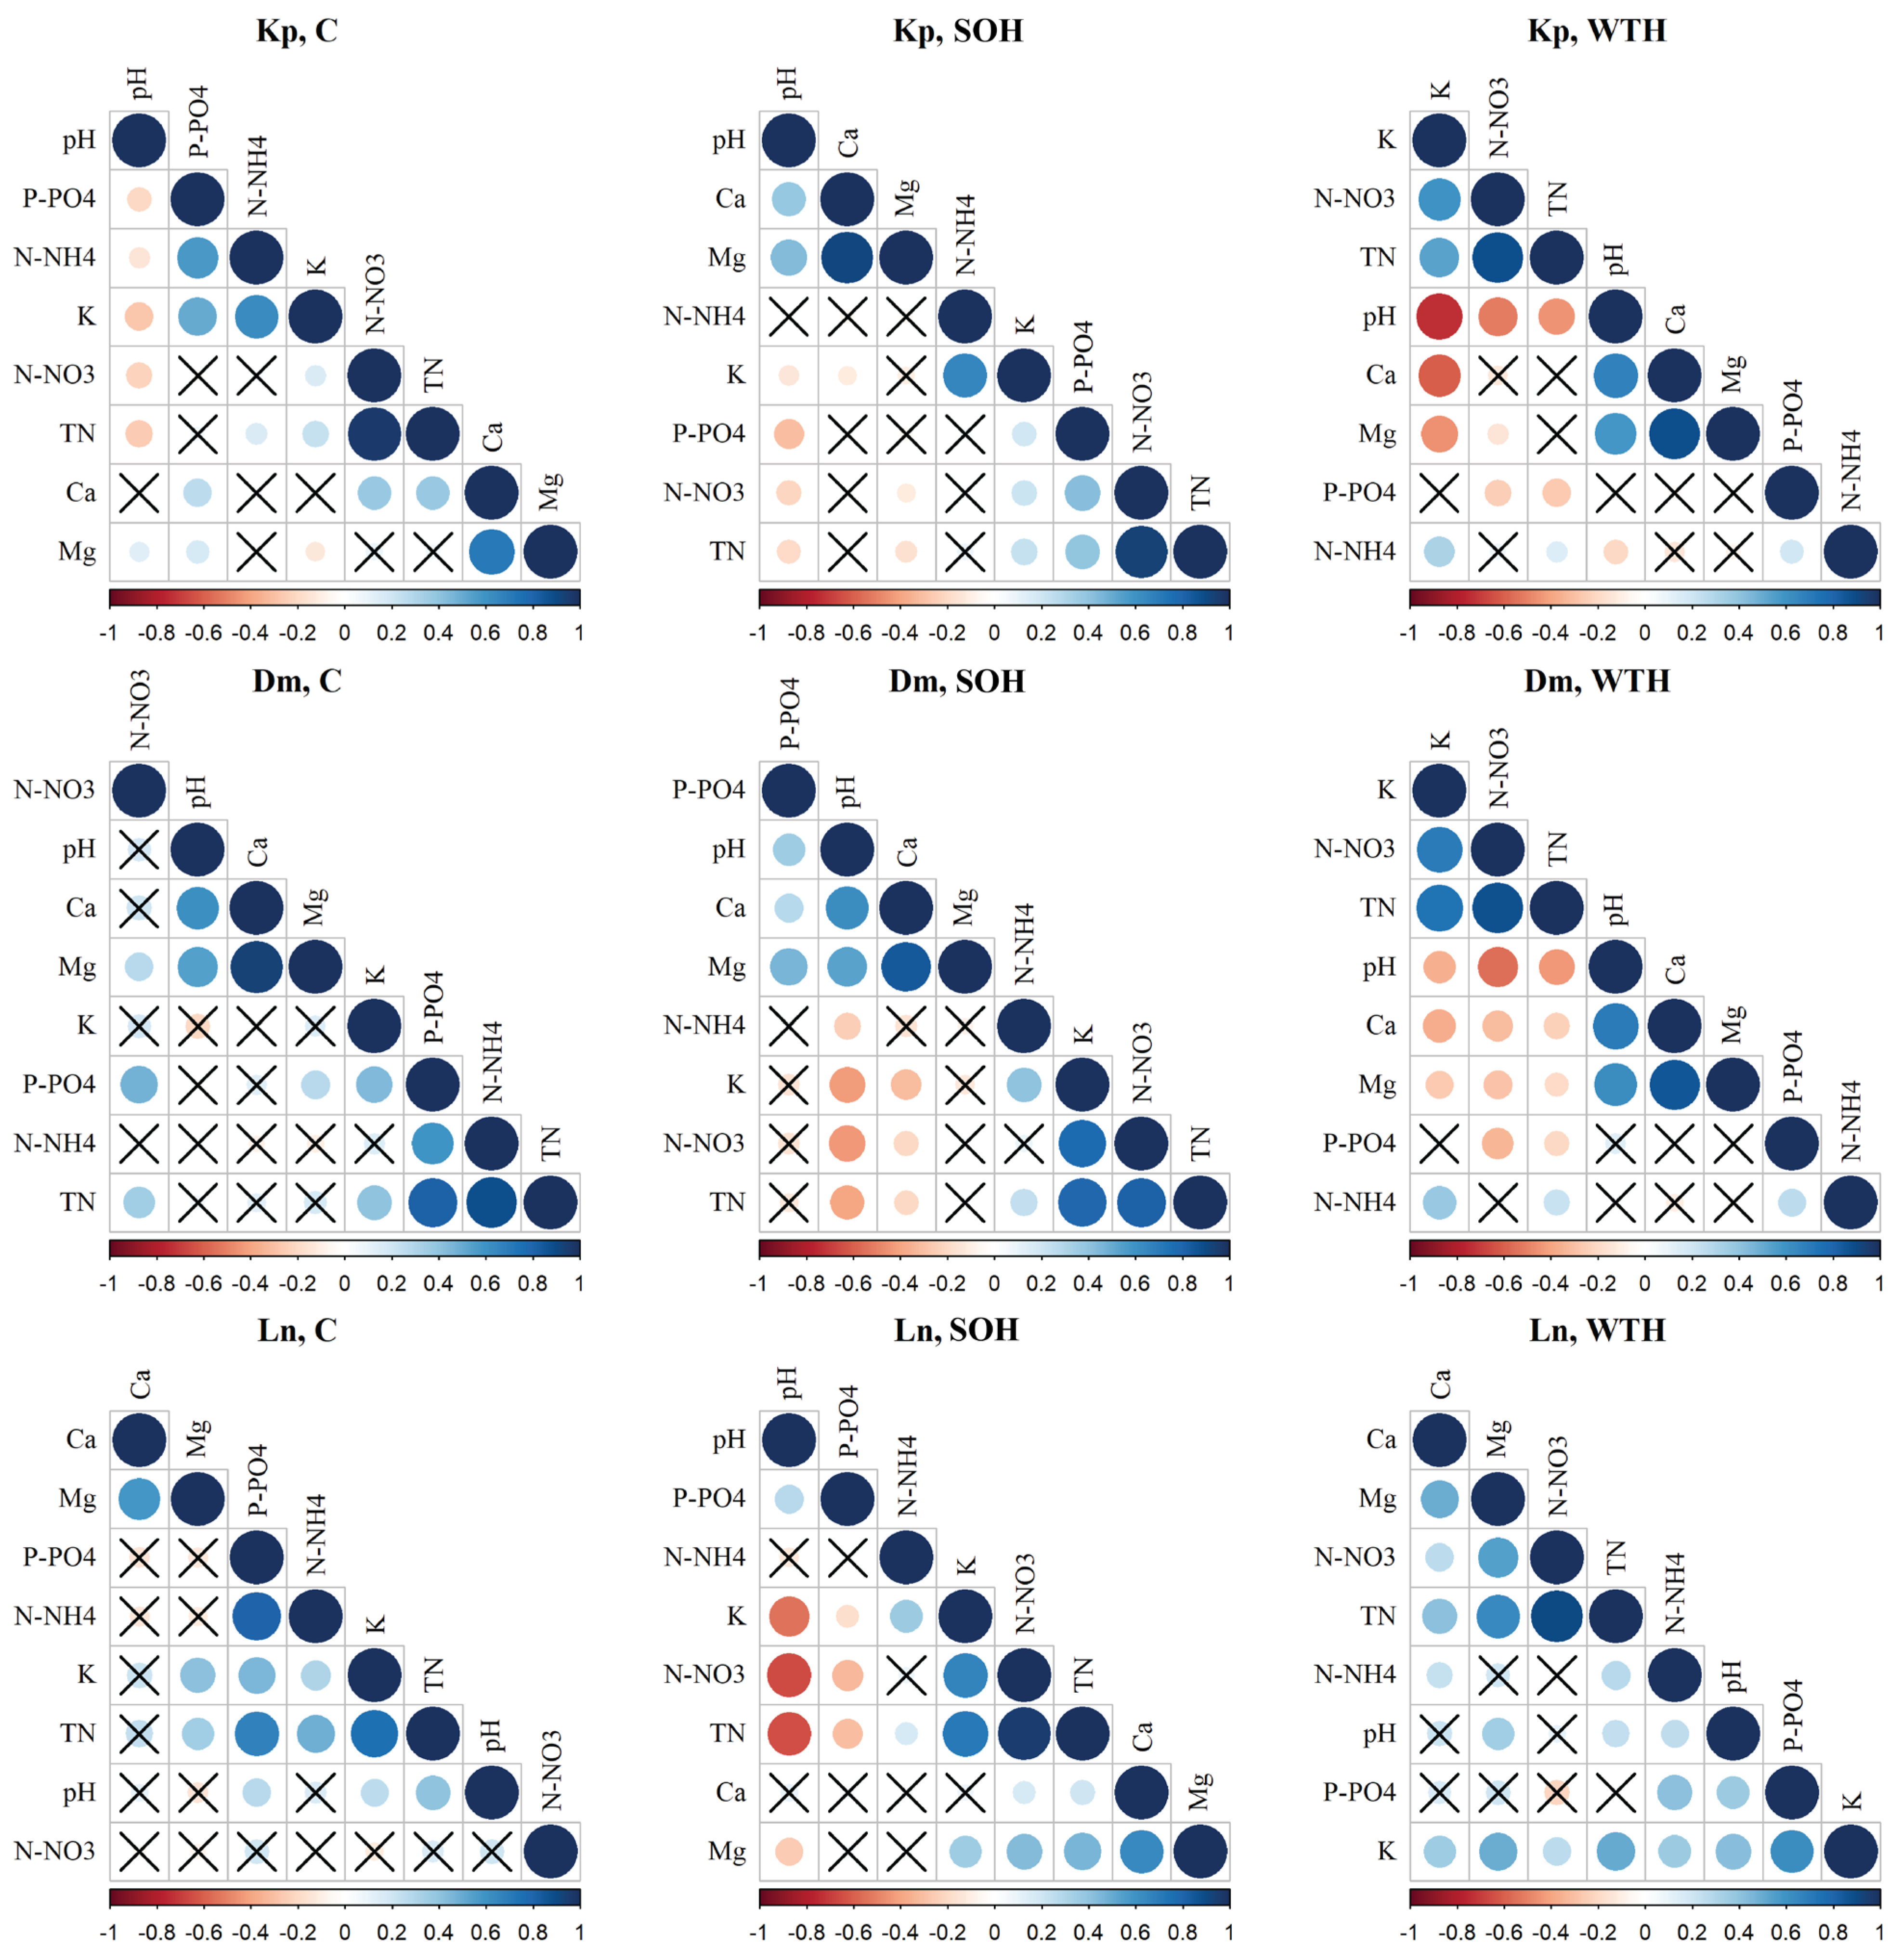
Cross-correlations were observed between general chemistry parameters of the soil solution (Figure A9). Generally, concentrations of inorganic forms of nitrogen (N-NO3− and N-NH4+) were positively correlated with TN. For the soil solutions of the Dm and Kp sites, pH was correlated positively with Mg and Ca concentrations and negatively with K concentration.
3.3. Litter
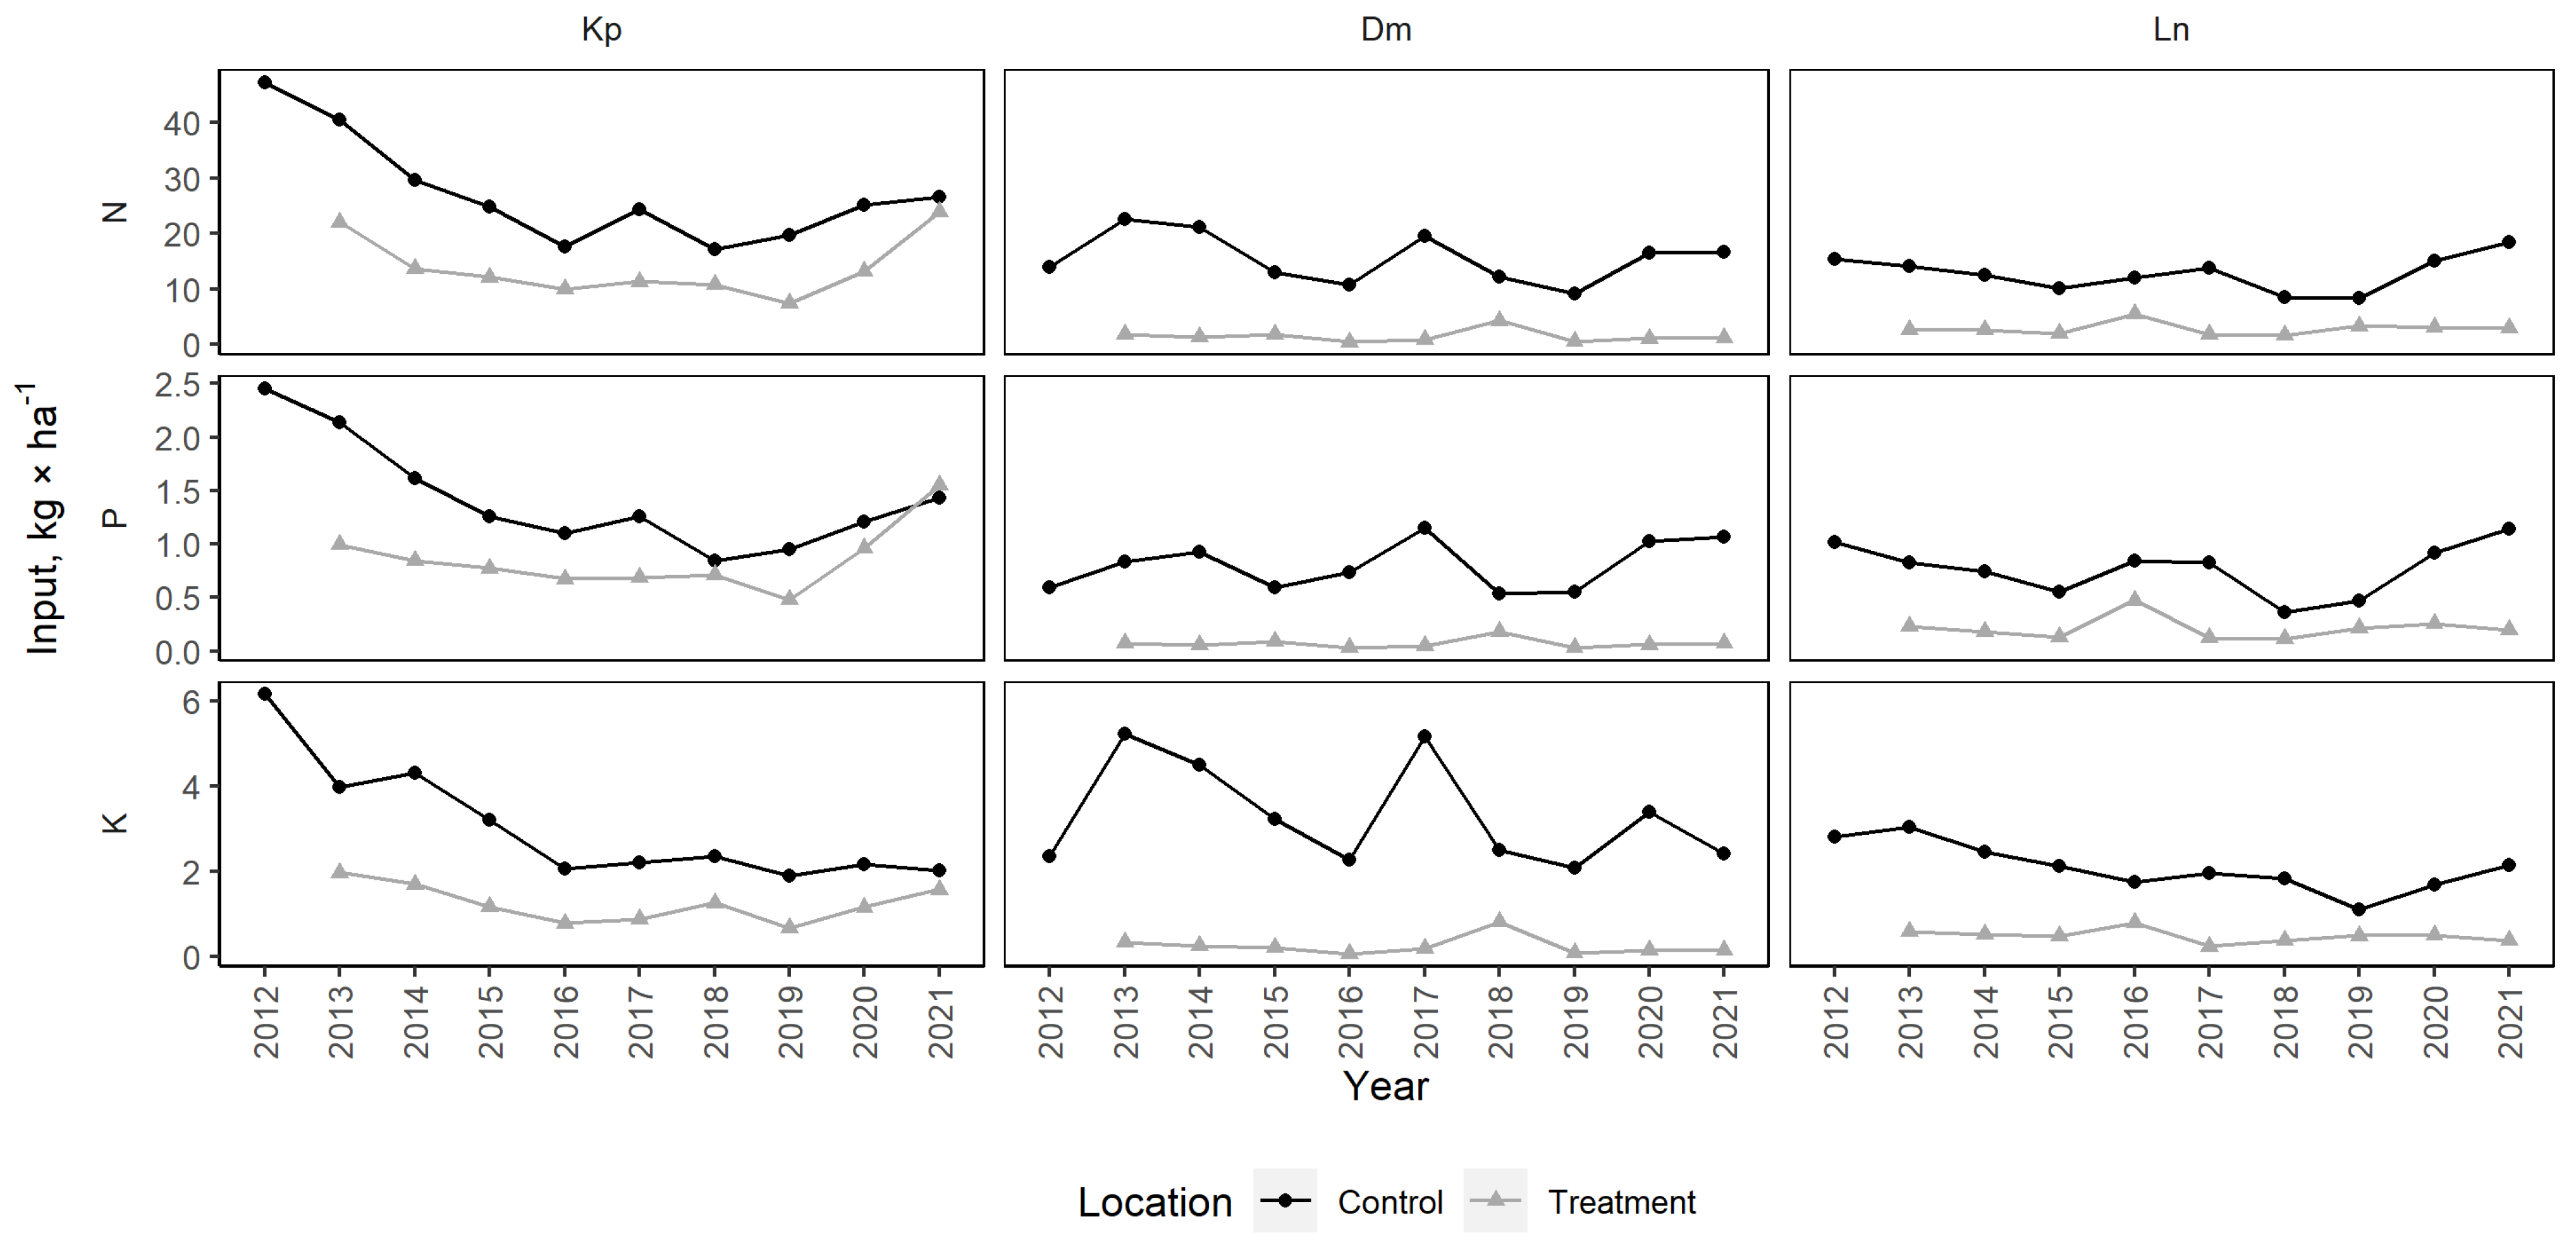
The mean N input with litter during the vegetation season was 18.55 ± 1.63 kg·ha−1 in control stands and 6.01 ± 1.25 kg·ha−1 in the harvested plots (Figure 8). The N input ranged from 8.26 (Ln 2019) to 47.30 (Kp 2012) kg·ha−1 in control stands and from 0.39 (Dm 2016) to 23.89 (Kp 2021) kg·ha−1 in the harvested plots. The mean P input was 1.00 ± 0.08 kg·ha−1 in control stands and 0.38 ± 0.08 kg·ha−1 in the harvested plots. The P input ranged from 0.36 (Ln 2018) to 2.46 (Kp 2012) kg·ha−1 in control stands and from 0.03 (Dm 2019) to 1.55 (Kp 2021) kg·ha−1 in the harvested plots. The mean K input was 2.82 ± 0.22 kg·ha−1 in control stands and 0.67 ± 0.10 kg·ha−1 in the harvested plots. The K input ranged from 1.10 (Ln 2019) to 6.17 (Kp 2012) kg·ha−1 in control stands and from 0.07 (Dm 2016) to 1.98 (Kp 2013) kg·ha−1 in the harvested plots.
3.4. Young Stand Development
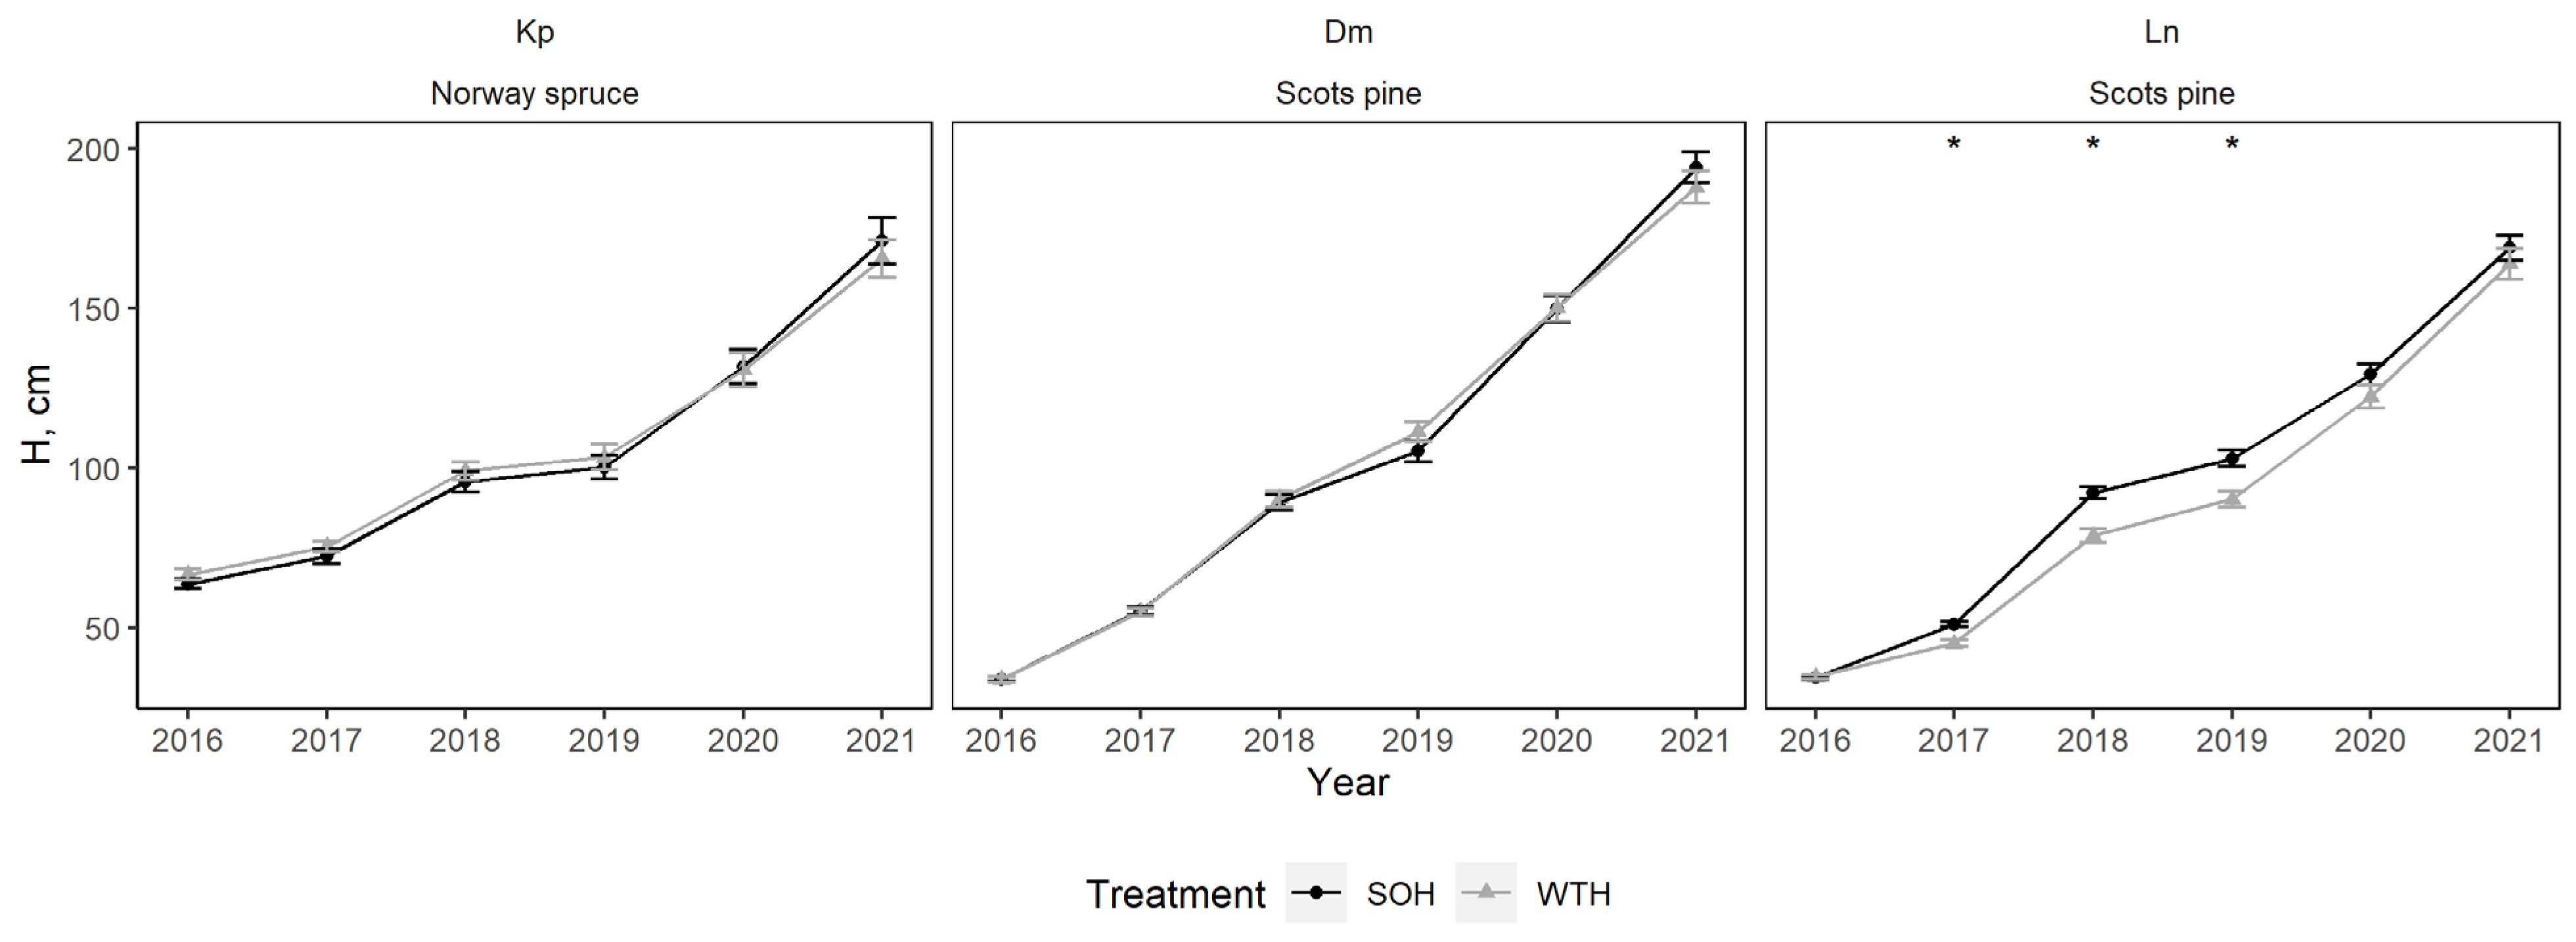
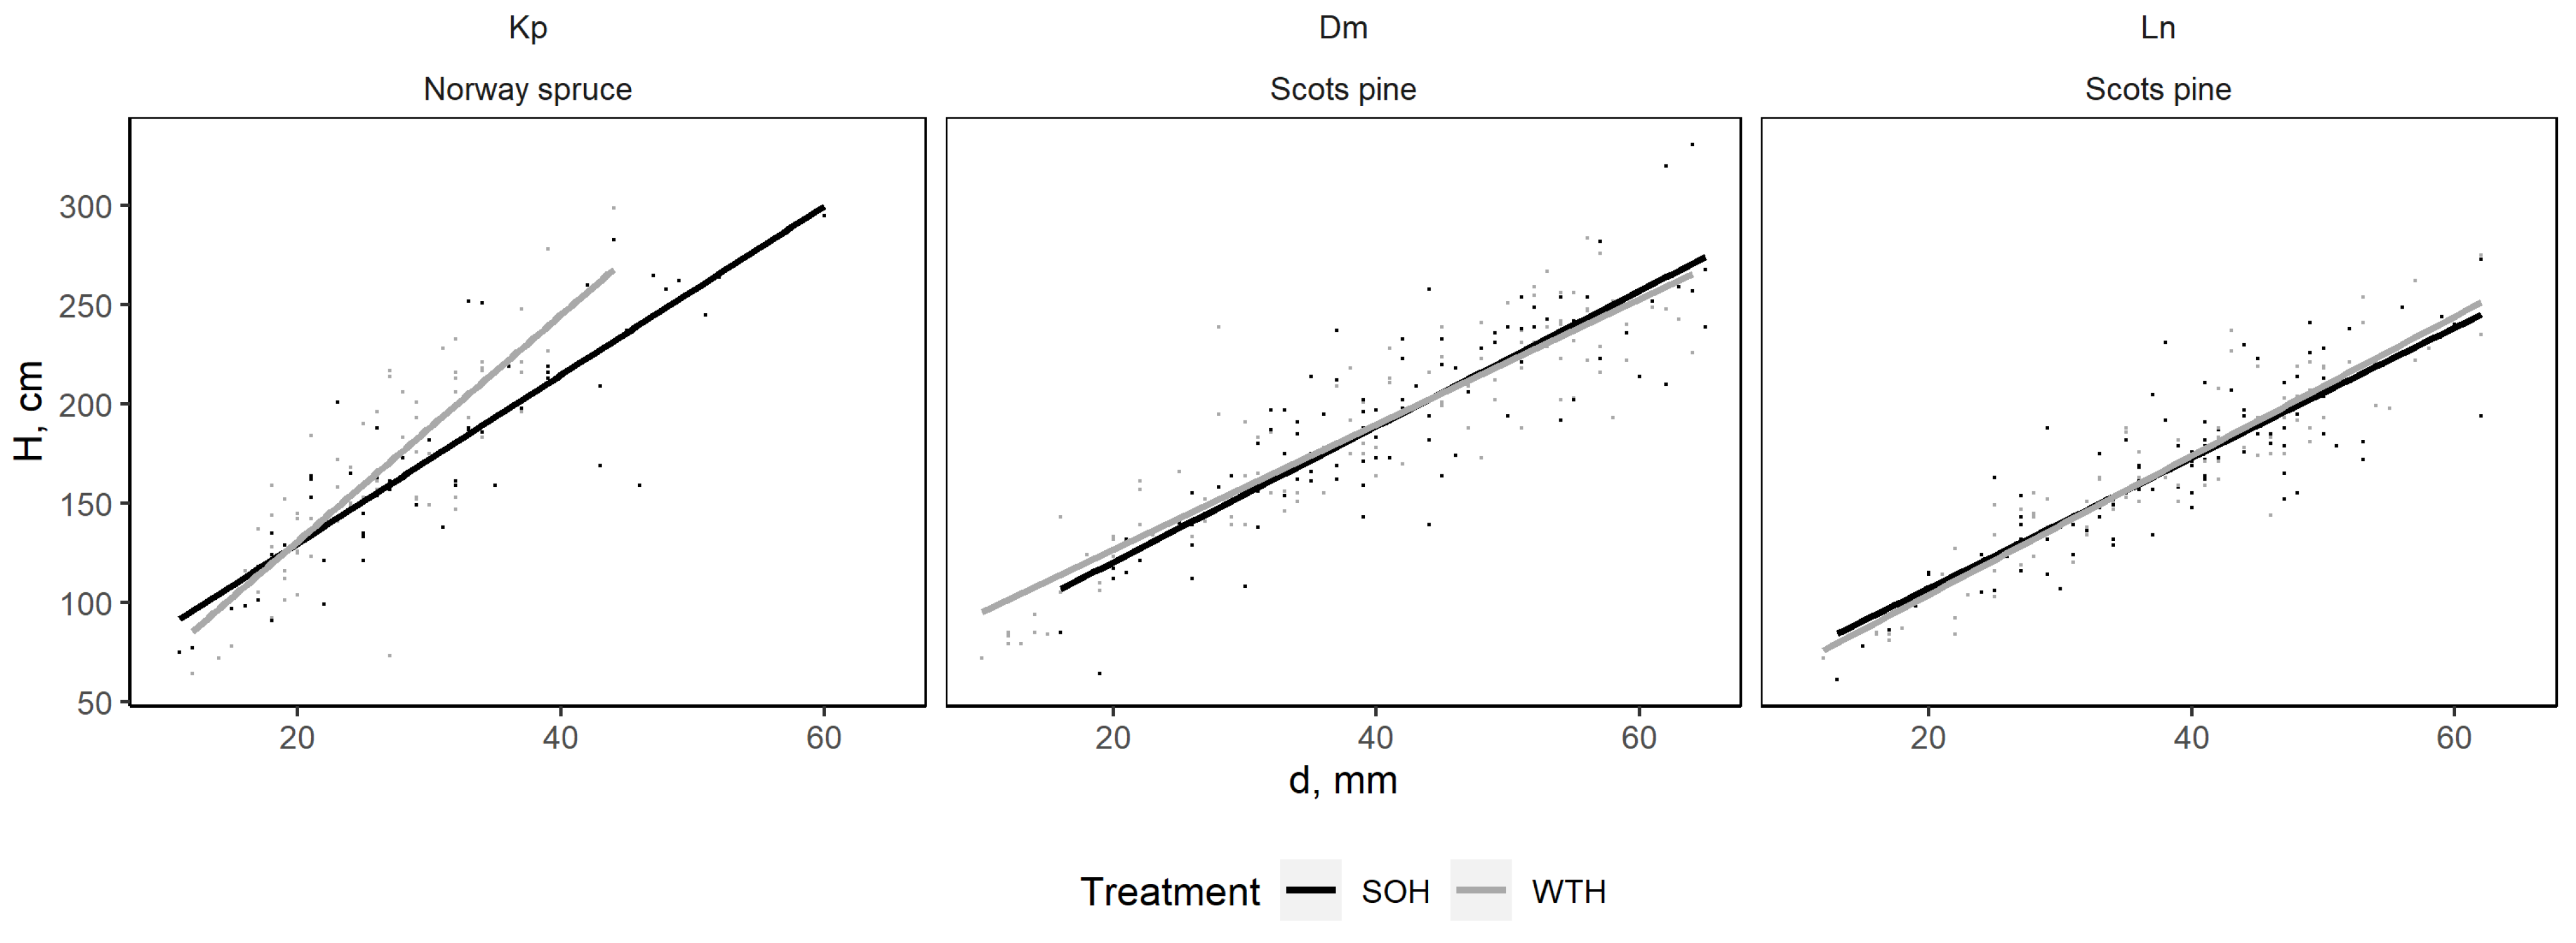
At the Dm and Kp sites, the mean tree height of regenerated stand in both CH and WTH were statistically similar during all years of observation (Figure 9). At the Ln site, the mean young stand height was significantly greater for CH than for WTH from 2017 to 2019 (p < 0.01), with the observed differences diminishing after 2020. The root collar diameter and height ratio at the Dm and Ln sites were similar between CH and WTH (Figure 10). At the Kp site, WTH resulted in smaller root collar diameters compared to CH.
3.5. Needle Nutrient Status in Regenerated Stands
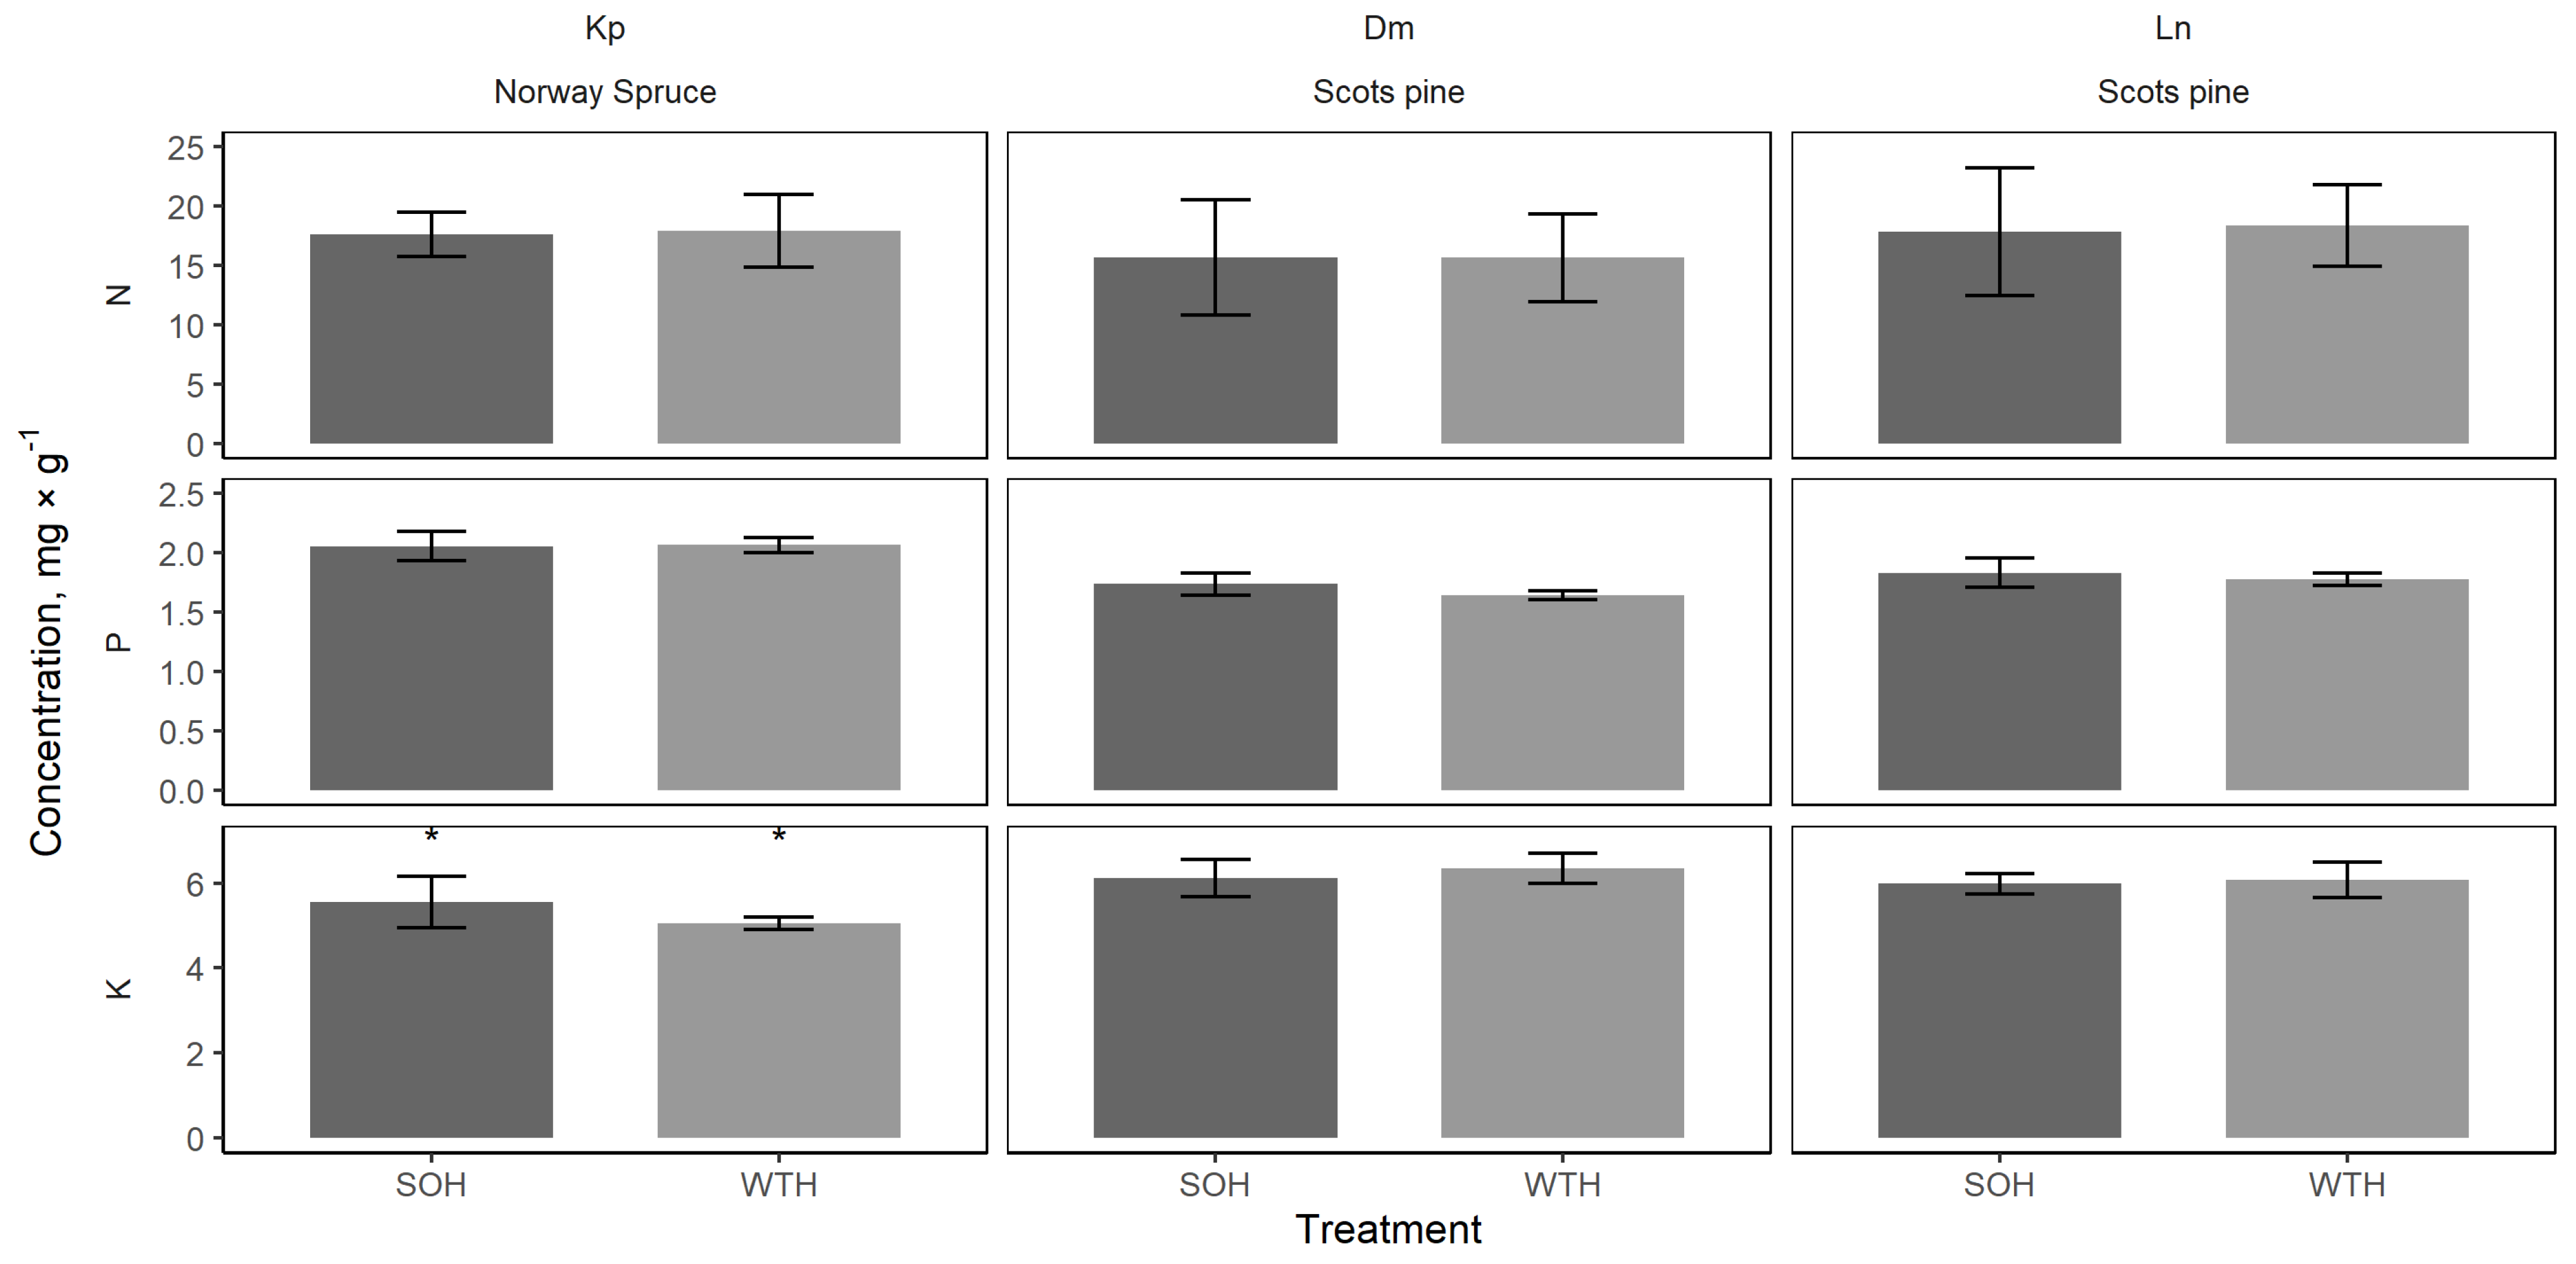
Four to five years after planting (2018–2019), the mean N concentrations in needles were similar for CH and WTH, in both the Scots pine sites (Ln and Dm) and the Norway spruce site (Kp) (Figure 11). The P concentrations in needles of both Scots pine sites were slightly lower with WTH than with CH (p > 0.05), while differences in the Norway spruce site were negligible. K concentrations in needles of both Scots pine sites (Ln and Dm) were slightly higher for WTH than CH (p > 0.05). At the Norway spruce site (Kp), P concentrations were significantly lower for WTH than for CH (p = 0.02).
All tested micro- and macroelement (Al, B, Ca, Cr, Cu, Fe, K, Mg, Mn, N, Na, Ni, P, S, Si and Zn) concentrations are presented in Table A2. In the Scots pine sites (Dm and Ln), Cu concentrations were significantly lower for WTH than CH (p = 0.02–0.04). At the Dm site, significantly higher Si (p < 0.01) concentrations and lower B (p = 0.01), Ni (p = 0.01) and Si (p < 0.01) concentrations were observed for WTH than CH. At the Ln site, significantly higher Zn (p = 0.03) concentrations and lower Mg (p = 0.04), Mn (p < 0.01) and Si (p = 0.03) concentrations were observed for WTH than CH. At the Norway spruce site (Kp), K concentrations were significantly lower for WTH than CH (p = 0.02).
4. Discussion
The effects of whole-tree harvesting on site productivity are largely site-specific, and generalised comprehension of the possible impacts is lacking [38]. The main concern is the removal of logging residues that contain high nutrient concentrations, which could result in serious consequences for site fertility in nutrient-poor sites lacking organic matter [12,39]. The sites observed in this study were examined previously. Libiete et al. [40] analysed macronutrient input by precipitation, general chemistry of soil solution, groundwater and surface water for two years after fellings. Macronutrient concentrations in soil solution of the sites were discussed again four and six years after fellings by Kļaviņš et al. [41] and Kļaviņš et al. [42], respectively. Young stand development three and six years after planting was studied by Kļaviņš et al. [43] and Kļaviņš and Kļaviņa [44], respectively.
4.1. Nutrient Status
The chemical composition of precipitation impacts a site regardless of harvest intensity, with the effect size dependent on site sensitivity. At our sites, the foliage captured some N-NO3− input from precipitation by significantly lowering the concentration reaching the ground. Moreover, foliage significantly lowered pH and significantly increased K+ concentration in precipitation reaching the ground. The observed assimilation of N-NO3− and leaching of K+ by the canopy, as well as the lower pH in throughfall precipitation, were expected as described in previous studies [45,46,47].
The soil solution is the medium linking the soil, hydrosphere and biosphere. Consequently, the most pronounced effects of harvest intensity were observed in the dynamics of nutrient concentrations and pH of the soil solution. At the eutrophic site, the soil solution pH was lower after whole-tree harvesting than stem-only harvesting or the control during the whole period of observations, with a distinct drop from the first to the third year after harvest. At the mesotrophic site, the soil solution pH decreased one year after both stem-only and whole-tree harvesting and stabilised to the level of the control four years after stem-only harvesting and five years after whole-tree harvesting. At the oligotrophic site, the soil solution pH decreased significantly immediately after stem-only harvesting and remained lower for seven years until stabilising at the level of whole-tree harvesting and the control. At the eutrophic site, peaks of N-NO3− concentrations were observed during the first–third and sixth–eighth years after whole-tree harvesting. At the mesotrophic site, N-NO3− concentrations peaked significantly during the second–fourth year after both stem-only and whole-tree harvesting. The increase was more explicit after whole-tree harvesting. At the oligotrophic site, an increase in N-NO3− concentrations was observed during the first–fourth years after stem-only harvesting. P-PO43− concentrations were generally low and showed no clear effect of harvest intensity. At the eutrophic site, K+ concentrations peaked for three years after whole-tree harvesting. At the mesotrophic site, K+ concentrations were elevated for four years after both stem-only and whole-tree harvesting. At the oligotrophic site, K+ concentrations peaked for four years after stem-only harvesting.
Logging residues left on site may be a significant source of nutrients, including N, for ground vegetation and regenerated stand [12]. In addition, logging residues limit risks of N losses from felling sites. Branches and needles acquire external N via biological N fixation. Coarser residues, such as branches, immobilise more N than needles or leaves [48]. The net release of N is only initiated after the period of immobilisation. Pine needles, as litter or logging residue, are a net sink of N and P for approximately three years, while spruce needles are a net sink of N for approximately two and a half years [49]. Coarser residues may be a net sink of N for up to eight years. P immobilisation in logging residues is modest compared to N and lasts for a shorter time [50]. In contrast, logging residues left on site can also be accountable for some N losses and leaching [51]. Acidification and increased N concentrations in the soil solution indicate the exceedance of N retention capacity of a site [52]. Basic cations (K, Ca and Mg) are weakly retained in logging residues [53]. Furthermore, elevated N concentrations may acidify the soil and promote leaching of the basic cations [54].
The differences between treatments may be explained by the trophic levels of the sites. At the oligotrophic site, stem-only harvesting decreased pH and elevated N-NO3− and K+ concentrations, as the logging residues on the forest floor served as extra biomass to be mineralised. Similar results were observed at comparable sites in a study from Finland [55]. At the mesotrophic site, both types of harvesting decreased pH and elevated N-NO3− and K+ concentrations, indicating that there may be a possible nutrient mineralisation rate or capacity regardless of nutrients sourced from soil or logging residues. At the eutrophic site, whole-tree harvesting decreased pH and elevated N-NO3− and K+ concentrations, where the lack of logging residues increased N uptake by vegetation (less competition), and high soil N levels may cause soil-sourced nutrient mineralisation and leaching. A study in North America [56] observed five times more intense leaching of N, originating mainly from soil, in high-productivity sites than in low-productivity sites after final fellings.
4.2. Young Stand Development
There were no significant differences in the height of planted trees between stem-only and whole-tree harvest nine years after fellings. At the oligotrophic site, Scots pine height was significantly lower five to seven years after whole-tree harvesting than stem-only harvesting, but later the observed differences became negligible. A study from Finland of comparable Scots pine sites [57] observed no significant effects of whole-tree harvesting on the height and diameters of the regenerated stand 22 years after planting when compared to stem-only harvesting. At the eutrophic site, Norway spruce trees had similar height after whole-tree and stem-only harvesting, but the root collar diameters were smaller after whole-tree harvesting. Slash left on site may limit revegetation and consumption of nutrients, resulting in reduced plant biomass [58,59]. When there were no logging residues following whole-tree harvesting, the rapid growth of ground vegetation most likely caused increased competition that affected the regenerating trees. A study by Littke et al. [60] on young Douglas fir stands suggests that competing vegetation is a significant factor influencing the growth and biomass of young trees.
The observed macronutrient concentrations in the needles of trees in regenerated stands generally fell into plausible ranges (5%–95% percentiles) of the ICP Forests manual on leaf and needle sampling and analysis [34]. There were no significant differences in needle macronutrient concentrations among treatments in Scots pine sites, except for Mg and S. Mg concentrations were significantly lower after whole-tree harvesting of the oligotrophic site, and S concentrations were significantly lower after whole-tree harvesting of the mesotrophic site compared to stem-only harvesting. Observed significant differences of micronutrient concentrations between treatment plots of Scots pine stands were generally not consistent across both sites, except for Cu, which was significantly lower after whole-tree harvesting. Littke et al. [61] report some detrimental effects of whole-tree harvesting on foliar nutrient concentrations (especially Ca and Mg); however, results are not consistent at all their experimental sites. In the study of comparable Scots pine stands from Finland [57], there were no significant differences in P, K, Ca, Mg, B, Cu, Mn and Zn concentrations in needles 22–24 years after planting between whole-tree harvesting and stem-only harvesting, but N concentrations were significantly higher after whole-tree harvesting of the less fertile site. At the eutrophic site, K concentrations were significantly lower in Norway spruce needles after whole-tree than stem-only harvesting. Logging residues from stem-only harvesting are likely a significant source of K [55] that is weakly retained [53]. Furthermore, the losses of K due to soil acidification by elevated N concentrations after whole-tree harvesting are likely reflected here [54]. Overall, no nutrient deficiencies were observed in any sites or treatments, with only Cu and B concentrations in needles at the eutrophic Norway spruce site below optimum levels [62,63,64,65,66], regardless of treatment.
5. Conclusions
The sustainability of site productivity should be considered when choosing the harvesting method, especially in oligotrophic sites where negative short-term effects on regenerated stand height growth were detected two to four years after planting (four to six years after harvest). During this period, nutrient input from logging residues after stem-only harvesting likely provided a significant advantage in nutrient-poor conditions. After a longer observation period, however, the growth differences of the regenerated trees between both treatments decrease and even out, thus pointing to negligible risks of productivity decline. At the mesotrophic site, the treatments did not produce distinct effects. Consequently, whole-tree harvesting may be conducted if economically justified. At the eutrophic site, logging residues left on site after stem-only harvesting most likely acquired excess nutrients that, to some extent, would be leached after whole-tree harvesting. In addition, more slender trees were present in the regenerated stand after whole-tree than stem-only harvesting. Alternatively, logging residues likely played an important role in restricting the rapid growth of ground vegetation and decreasing the competition on the regenerated stand after stem-only harvesting. However, advantages and risks specific to each site depending on trophic status should be carefully considered before selection of harvest intensity.
Author Contributions
Conceptualisation, Z.L. and I.K.; methodology, Z.L. and A.B.; software, I.K.; validation, I.K., A.B. and Z.K.; formal analysis, I.K. and A.B.; investigation, I.K. and Z.K.; resources, Z.L.; data curation, I.K.; writing—original draft preparation, I.K. and Z.K.; writing—review and editing, I.K., A.B., Z.L. and Z.K.; visualisation, I.K.; supervision, Z.L.; project administration, Z.L.; funding acquisition, Z.L. and I.K. All authors have read and agreed to the published version of the manuscript.
Funding
Sampling: chemical analyses, data analysis and manuscript preparation were funded by JSC “Latvia’s State Forests” within the frames of the research program “The impact of forest management on forest and related ecosystem services”, No 5-5.9.1_007n_101_21_76. The editing and publishing of the manuscript was funded by the project “Strengthening of the capacity of doctoral studies at the University of Latvia within the framework of the new doctoral model”, identification No. 8.2.2.0/20/I/006. This study is a part of the doctoral thesis of the main author of the paper.
Data Availability Statement
The datasets are available upon reasonable request by contacting the corresponding author.
Acknowledgments
The study was technically supported by the Forest Research Station.
Conflicts of Interest
The authors declare no conflict of interest. The funders had no role in the design of the study; in the collection, analyses, or interpretation of data; in the writing of the manuscript; or in the decision to publish the results.
Appendix A

Table A1.
Chemical analysis of environmental samples.
| Environmental Sample | Parameter | Unit | Method (ISO Standard) |
|---|---|---|---|
| Water | pH | pH unit | Potentiometry (LVS ISO 10523:2012) |
| nitrate-nitrogen (N-NO32−) | mg L−1 | Chemiluminescence detector after reduction of nitrate ions to nitrogen oxide | |
| ammonium-nitrogen (N-NH4+) | mg L−1 | Spectrophotometry (LVS ISO 7150-1:1984) | |
| total nitrogen (TN) | mg L−1 | Determination of bound nitrogen (TNb), following oxidation to nitrogen oxides (LVS EN 12260:2004) | |
| phosphate phosphorus (P-PO43−) | mg L−1 | Ammonium molybdate spectrometric method (LVS EN ISO 6878:2005) | |
| potassium (K), calcium (Ca), magnesium (Mg) | mg L−1 | Atomic absorption/emission flame spectrometry (LVS EN ISO 7980:2000, LVS ISO 9964-3:2000) | |
| Litter, needles | nitrogen (N) | mg g−1 | Dry combustion (elemental analysis) (ISO 13878:1998, LVS ISO 10694:2006) |
| phosphorus (P) | mg g−1 | Spectrometric method (ISO12914:2012, LVS 298:2002, LVS ISO 11466:1995, LVS EN 14672:2006) | |
| potassium (K) | mg g−1 | Atomic absorption/emission flame spectrometry | |
| Needles | aluminium (Al), boron (B), calcium (Ca), chrome (Cr), copper (Cu), iron (Fe), magnesium (Mg), manganese (Mn), sodium (Na), nickel (Ni), sulphur (S), silicon (Si), zinc (Zn) | mg kg−1 | Inductively coupled plasma–optical emission spectrometry (ICP-OES) |
Figure A1.
Results of Tukey’s HSD test of mean annual pH in soil solution between the control (C), stem-only harvesting (SOH) and whole-tree harvesting (WTH) plots of each site. Statistically significant differences (p < 0.05) are in black.
Figure A1.
Results of Tukey’s HSD test of mean annual pH in soil solution between the control (C), stem-only harvesting (SOH) and whole-tree harvesting (WTH) plots of each site. Statistically significant differences (p < 0.05) are in black.

Figure A2.
Results of Tukey’s HSD test of mean annual N-NO3− in soil solution between the control (C), stem-only harvesting (SOH) and whole-tree harvesting (WTH) plots of each site. Statistically significant differences (p < 0.05) are in black.
Figure A2.
Results of Tukey’s HSD test of mean annual N-NO3− in soil solution between the control (C), stem-only harvesting (SOH) and whole-tree harvesting (WTH) plots of each site. Statistically significant differences (p < 0.05) are in black.

Figure A3.
Results of Tukey’s HSD test of mean annual P-PO43− in soil solution between the control (C), stem-only harvesting (SOH) and whole-tree harvesting (WTH) plots of each site. Statistically significant differences (p < 0.05) are in black.
Figure A3.
Results of Tukey’s HSD test of mean annual P-PO43− in soil solution between the control (C), stem-only harvesting (SOH) and whole-tree harvesting (WTH) plots of each site. Statistically significant differences (p < 0.05) are in black.

Figure A4.
Results of Tukey’s HSD test of mean annual K+ in soil solution between the control (C), stem-only harvesting (SOH) and whole-tree harvesting (WTH) plots of each site. Statistically significant differences (p < 0.05) are in black.
Figure A4.
Results of Tukey’s HSD test of mean annual K+ in soil solution between the control (C), stem-only harvesting (SOH) and whole-tree harvesting (WTH) plots of each site. Statistically significant differences (p < 0.05) are in black.

Figure A5.
pH in soil solution in control (C), stem-only harvesting (SOH) and whole-tree harvesting (WTH) plots at 30 and 60 cm sampling depths at the study sites. Error bars represent standard error; stars indicate statistically significant differences (p < 0.05) between sampling depths; and “x” indicates years when data were not sufficient to carry out the statistical test.

Figure A6.
N-NO3− concentrations in control (C), stem-only harvesting (SOH) and whole-tree harvesting (WTH) plots at 30 and 60 cm sampling depths at the study sites. Error bars represent standard error; stars indicate statistically significant differences (p < 0.05) between sampling depths; and “x” indicates years when data were not sufficient to carry out the statistical test.

Figure A7.
P-PO43− concentrations in soil solution in control (C), stem-only harvesting (SOH) and whole-tree harvesting (WTH) plots at 30 and 60 cm sampling depths at the study sites. Error bars represent standard error; stars indicate statistically significant differences (p < 0.05) between sampling depths; and “x” indicates years when data were not sufficient to carry out the statistical test.

Figure A8.
K+ concentrations in soil solution in control (C), stem-only harvesting (SOH) and whole-tree harvesting (WTH) plots at 30 and 60 cm sampling depths at the study sites. Error bars represent standard error; stars indicate statistically significant differences (p < 0.05) between sampling depths; and “x” indicates years when data were not sufficient to carry out the statistical test.

Figure A9.
Pearson’s correlations between the soil water’s general physio-chemical parameters in the control (C), stem-only harvesting (SOH) and whole-tree harvesting (WTH) plots at the study sites. Positive correlations are displayed in blue and negative correlations in red. Colour intensity and circle size are proportional to the correlation coefficients. At the bottom of the correlogram, the legend colour shows the correlation coefficients and the corresponding colours. Correlations with p > 0.05 are considered insignificant (crosses are added).

Table A2.
Micro- and macroelement concentrations (average value ± standard error, mg·kg−1) in current-year needles of trees in regenerated stands in conventional harvesting (CH) and whole-tree harvesting (WTH) plots of study sites in 2018 and 2019. Statistically significant differences (p < 0.05) between treatment plots are in bold. Where data are available [62,63,64,65,66], “○” indicates that the element concentration is within the optimal range; “↓” indicates below optimal range and “↑” indicates above the optimal range.
| Element | Kp, Norway Spruce | Dm, Scots Pine | Ln, Scots Pine | ||||||
|---|---|---|---|---|---|---|---|---|---|
| SOH | WTH | p-Value | SOH | WTH | p-Value | SOH | WTH | p-Value | |
| Al | 24.58 ± 5.55 | 35.66 ± 5.86 | 0.18 | 354.77 ± 18.64 | 362.68 ± 9.29 | 0.71 | 340.40 ± 34.48 | 401.59 ± 24.17 | 0.16 |
| B | ↓9.04 ± 1.48 | ↓10.37 ± 0.67 | 0.42 | 5.81 ± 0.17 | 4.40 ± 0.43 | 0.01 | 6.58 ± 0.39 | 6.70 ± 0.21 | 0.79 |
| Ca | ○6645.89 ± 372.02 | ○6094.07 ± 287.05 | 0.25 | ↑3308.55 ± 166.68 | ↑3253.91 ± 127.30 | 0.80 | ↑3704.58 ± 88.33 | ↑3489.16 ± 241.11 | 0.41 |
| Cr | 0.47 ± 0.07 | 0.66 ± 0.14 | 0.23 | 0.59 ± 0.14 | 0.36 ± 0.06 | 0.15 | 0.44 ± 0.06 | 0.44 ± 0.10 | 0.95 |
| Cu | ↓2.96 ± 0.34 | ↓3.06 ± 0.34 | 0.83 | 4.79 ± 0.06 | 4.20 ± 0.23 | 0.02 | 4.37 ± 0.16 | 3.26 ± 0.47 | 0.04 |
| Fe | ○72.82 ± 8.58 | ○60.60 ± 6.83 | 0.28 | 60.36 ± 2.41 | 59.82 ± 2.36 | 0.87 | 62.33 ± 3.05 | 66.09 ± 3.13 | 0.40 |
| K | ○5552.88 ± 186.28 | ○5047.61 ± 64.60 | 0.02 | ↑6116.28 ± 136.99 | ↑6341.19 ± 110.72 | 0.22 | ○5985.84 ± 81.97 | ↑6073.14 ± 133.80 | 0.58 |
| Mg | ○1352.33 ± 92.61 | ○1424.30 ± 82.83 | 0.57 | ↑1283.93 ± 33.91 | ↑1268.73 ± 41.24 | 0.78 | ↑1322.46 ± 24.99 | ↑1226.91 ± 35.96 | 0.04 |
| Mn | ↑510.52 ± 63.30 | ↑530.50 ± 37.83 | 0.79 | 418.88 ± 31.20 | 377.79 ± 4.39 | 0.21 | 549.38 ± 16.24 | 422.90 ± 20.39 | 0.00 |
| N | ○17,576.08 ± 1068.20 | ○17,862.11 ± 1769.95 | 0.89 | ↑15,663.19 ± 2797.75 | ↑15,623.80 ± 2126.45 | 0.99 | ↑17,815.59 ± 3121.21 | ↑18341.14 ± 1990.16 | 0.89 |
| Na | 44.65 ± 8.91 | 39.61 ± 6.31 | 0.65 | 65.40 ± 6.01 | 67.18 ± 5.25 | 0.82 | 49.42 ± 8.68 | 66.27 ± 7.48 | 0.16 |
| Ni | 0.30 ± 0.06 | 0.44 ± 0.06 | 0.12 | 0.57 ± 0.07 | 0.36 ± 0.01 | 0.01 | 0.46 ± 0.04 | 0.49 ± 0.04 | 0.53 |
| P | ○2055.52 ± 38.80 | ○2065.64 ± 37.44 | 0.85 | ↑1738.03 ± 35.37 | ↑1644.51 ± 30.54 | 0.06 | ↑1833.30 ± 39.44 | ↑1777.74 ± 21.62 | 0.23 |
| S | ○1252.62 ± 46.29 | ○1271.85 ± 64.64 | 0.81 | 1281.33 ± 29.47 | 1173.17 ± 31.53 | 0.03 | 1272.06 ± 46.37 | 1269.50 ± 24.76 | 0.96 |
| Si | 315.28 ± 91.71 | 337.09 ± 16.13 | 0.82 | 123.00 ± 12.75 | 212.83 ± 11.03 | 0.00 | 364.39 ± 96.50 | 125.17 ± 9.61 | 0.03 |
| Zn | ○68.25 ± 3.94 | ○61.95 ± 0.78 | 0.13 | 68.25 ± 1.38 | 65.82 ± 1.15 | 0.19 | 59.67 ± 2.66 | 67.21 ± 1.77 | 0.03 |
References
- The Economist Intelligence Unit Limited Energy Outlook 2023. Available online: https://pages.eiu.com/rs/753-RIQ-438/images/energy-in-2023.pdf?mkt_tok=NzUzLVJJUS00MzgAAAGIPlWTeCK4RqY-enpLqf4ltmwE5a7OrsxTpRDGLCZ71FemC-nHhPDQu0ZbAhoKxUwEmJxVy--dtFZwHTsZB0SF1zVdm-Rr2CDDDz0aPymIYNQ9MQ (accessed on 7 March 2023).
- Enerdata Energy Crisis: Opportunity or Threat for EU’s Energy Transition? Available online: https://www.enerdata.net/publications/executive-briefing/energy-transition-impacting-energy-crisis.html (accessed on 7 March 2023).
- Enerdata Global Energy & CO2 Data. Available online: https://www.enerdata.net/research/energy-market-data-co2-emissions-database.html (accessed on 7 March 2023).
- Bioenergy Europe about Bioenergy. Available online: https://bioenergyeurope.org/about-bioenergy.html (accessed on 7 March 2023).
- Investment and Development Agency of Latvia Environment and Renewable Energy Industry. Available online: https://www.liaa.gov.lv/en/trade/industries/environment-and-renewable-energy (accessed on 7 March 2023).
- Camia, A.; Giuntoli, J.; Jonsson, R.; Robert, N.; Cazzaniga, N.E.; Jasinevičius, G.; Avitabile, V.; Grassi, G.; Barredo, J.I.; Mubareka, S. The Use of Woody Biomass for Energy Production in the EU; Publications Office of the European Union: Luxembourg, Luxembourg, 2021; ISBN 978-92-76-27867-2. [Google Scholar]
- Stříbrská, B.; Hradecký, J.; Čepl, J.; Tomášková, I.; Jakuš, R.; Modlinger, R.; Netherer, S.; Jirošová, A. Forest Margins Provide Favourable Microclimatic Niches to Swarming Bark Beetles, but Norway Spruce Trees Were Not Attacked by Ips Typographus Shortly after Edge Creation in a Field Experiment. For. Ecol. Manag. 2022, 506, 119950. [Google Scholar] [CrossRef]
- Evans, A.M.; Finkral, A.J. From Renewable Energy to Fire Risk Reduction: A Synthesis of Biomass Harvesting and Utilization Case Studies in US Forests. GCB Bioenergy 2009, 1, 211–219. [Google Scholar] [CrossRef]
- Alkan, H.; Korkmaz, M.; Eker, M. Stakeholders’ Perspectives on Utilization of Logging Residues for Bioenergy in Turkey. Croat. J. For. Eng. 2014, 35, 153–165. [Google Scholar]
- Gan, J.; Smith, C.T. Co-Benefits of Utilizing Logging Residues for Bioenergy Production: The Case for East Texas, USA. Biomass Bioenergy 2007, 31, 623–630. [Google Scholar] [CrossRef]
- Laitila, J.; Asikainen, A.; Hotari, S. Residue Recovery and Site Preparation in a Single Operation in Regeneration Areas. Biomass Bioenergy 2005, 28, 161–169. [Google Scholar] [CrossRef]
- Merino, A.; Balboa, M.A.; Rodríguez Soalleiro, R.; González, J.G.Á. Nutrient Exports under Different Harvesting Regimes in Fast-Growing Forest Plantations in Southern Europe. For. Ecol. Manag. 2005, 207, 325–339. [Google Scholar] [CrossRef]
- Tritton, L.M.; Martin, C.W.; Hornbeck, J.W.; Pierce, R.S. Biomass and Nutrient Removals from Commercial Thinning and Whole-Tree Clearcutting of Central Hardwoods. Environ. Manag. 1987, 11, 659–666. [Google Scholar] [CrossRef]
- Rothstein, D.E.; Gadoth-Goodman, D. Changes in Ecosystem Nutrient Pools through Stand Development Following Whole-Tree Harvesting of Jack Pine (Pinus Banksiana) on Sandy, Nutrient Poor Soils in Northern Lower Michigan. For. Ecol. Manag. 2023, 529, 120648. [Google Scholar] [CrossRef]
- Thiffault, E.; Hannam, K.D.; Paré, D.; Titus, B.D.; Hazlett, P.W.; Maynard, D.G.; Brais, S. Effects of Forest Biomass Harvesting on Soil Productivity in Boreal and Temperate Forests—A Review. Environ. Rev. 2011, 19, 278–309. [Google Scholar] [CrossRef]
- Walmsley, J.D.; Jones, D.L.; Reynolds, B.; Price, M.H.; Healey, J.R. Whole Tree Harvesting Can Reduce Second Rotation Forest Productivity. For. Ecol. Manag. 2009, 257, 1104–1111. [Google Scholar] [CrossRef]
- Nord-Larsen, T. Stand and Site Productivity Response Following Whole-Tree Harvesting in Early Thinnings of Norway Spruce (Picea Abies (L.) Karst.). Biomass Bioenergy 2002, 23, 1–12. [Google Scholar] [CrossRef]
- Kaarakka, L.; Tamminen, P.; Saarsalmi, A.; Kukkola, M.; Helmisaari, H.-S.; Burton, A.J. Effects of Repeated Whole-Tree Harvesting on Soil Properties and Tree Growth in a Norway Spruce (Picea Abies (L.) Karst.) Stand. For. Ecol. Manag. 2014, 313, 180–187. [Google Scholar] [CrossRef]
- Landhäusser, S.M. Impact of Slash Removal, Drag Scarification, and Mounding on Lodgepole Pine Cone Distribution and Seedling Regeneration after Cut-to-Length Harvesting on High Elevation Sites. For. Ecol. Manag. 2009, 258, 43–49. [Google Scholar] [CrossRef]
- Proe, M.F.; Griffiths, J.H.; McKay, H.M. Effect of Whole-Tree Harvesting on Microclimate during Establishment of Second Rotation Forestry. Agric. For. Meteorol. 2001, 110, 141–154. [Google Scholar] [CrossRef]
- Fleming, R.L.; Powers, R.F.; Foster, N.W.; Kranabetter, J.M.; Scott, D.A.; Ponder, F., Jr.; Berch, S.; Chapman, W.K.; Kabzems, R.D.; Ludovici, K.H.; et al. Effects of Organic Matter Removal, Soil Compaction, and Vegetation Control on 5-Year Seedling Performance: A Regional Comparison of Long-Term Soil Productivity Sites. Can. J. For. Res. 2006, 36, 529–550. [Google Scholar] [CrossRef] [Green Version]
- Roxby, G.E.; Howard, T.E. Whole-Tree Harvesting and Site Productivity: Twenty-Nine Northern Hardwood Sites in Central New Hampshire and Western Maine. For. Ecol. Manag. 2013, 293, 114–121. [Google Scholar] [CrossRef]
- Staaf, H.; Olsson, B.A. Acidity in Four Coniferous Forest Soils after Different Harvesting Regimes of Logging Slash. Scand. J. For. Res. 1991, 6, 19–29. [Google Scholar] [CrossRef]
- Kreutzweiser, D.P.; Hazlett, P.W.; Gunn, J.M. Logging Impacts on the Biogeochemistry of Boreal Forest Soils and Nutrient Export to Aquatic Systems: A Review. Environ. Rev. 2008, 16, 157–179. [Google Scholar] [CrossRef]
- Walmsley, J.D.; Godbold, D.L. Stump Harvesting for Bioenergy-A Review of the Environmental Impacts. Forestry 2010, 83, 17–38. [Google Scholar] [CrossRef] [Green Version]
- Ranius, T.; Hämäläinen, A.; Egnell, G.; Olsson, B.; Eklöf, K.; Stendahl, J.; Rudolphi, J.; Sténs, A.; Felton, A. The Effects of Logging Residue Extraction for Energy on Ecosystem Services and Biodiversity: A Synthesis. J. Environ. Manag. 2018, 209, 409–425. [Google Scholar] [CrossRef]
- Svensson, M.; Johansson, V.; Dahlberg, A.; Frisch, A.; Thor, G.; Ranius, T. The Relative Importance of Stand and Dead Wood Types for Wood-Dependent Lichens in Managed Boreal Forests. Fungal Ecol. 2016, 20, 166–174. [Google Scholar] [CrossRef]
- Hiron, M.; Jonsell, M.; Kubart, A.; Thor, G.; Schroeder, M.; Dahlberg, A.; Johansson, V.; Ranius, T. Consequences of Bioenergy Wood Extraction for Landscape-Level Availability of Habitat for Dead Wood-Dependent Organisms. J. Environ. Manag. 2017, 198, 33–42. [Google Scholar] [CrossRef] [PubMed]
- Bråkenhielm, S.; Liu, Q. Long-Term Effects of Clear-Felling on Vegetation Dynamics and Species Diversity in a Boreal Pine Forest. Biodivers. Conserv. 1998, 7, 207–220. [Google Scholar] [CrossRef]
- Olsson, B.A.; Staaf, H. Influence of Harvesting Intensity of Logging Residues on Ground Vegetation in Coniferous Forests. J. Appl. Ecol. 1995, 32, 640. [Google Scholar] [CrossRef]
- Fabião, A.; Martins, M.C.; Cerveira, C.; Santos, C.; Lousã, M.; Madeira, M.; Correia, A. Influence of Soil and Organic Residue Management on Biomass and Biodiversity of Understory Vegetation in a Eucalyptus Globulus Labill. Plantation. For. Ecol. Manag. 2002, 171, 87–100. [Google Scholar] [CrossRef] [Green Version]
- Nurminen, T.; Korpunen, H.; Uusitalo, J. Time Consumption Analysis of the Mechanized Cut-to-Length Harvesting System. Silva Fenn. 2006, 40, 335–363. [Google Scholar] [CrossRef] [Green Version]
- Lundbäck, M.; Häggström, C.; Nordfjell, T. Worldwide Trends in Methods for Harvesting and Extracting Industrial Roundwood. Int. J. For. Eng. 2021, 32, 202–215. [Google Scholar] [CrossRef]
- Rautio, P.; Fürst, A.; Stefan, K.; Raitio, H.; Bartels, U. Part XII: Sampling and Analysis of Needles and Leaves. In Manual on Methods and Criteria for Harmonized Sampling, Assessment, Monitoring and Analysis of the Effects of Air Pollution on Forests; International Co-operative Programme on Assessment and Monitoring of Air Pollution Effects on Forests (ICP Forests): Eberswalde, Germany, 2020; ISBN 978-3-86576-162-0. [Google Scholar]
- R Core Team, R. A Language and Environment for Statistical Computing. 2020. Available online: https://www.R-project.org/ (accessed on 7 March 2023).
- Wickham, H. Ggplot2: Elegant Graphics for Data Analysis. 2016. Available online: https://ggplot2.tidyverse.org (accessed on 7 March 2023).
- Wei, T.; Simko, V. R Package “Corrplot”: Visualization of a Correlation Matrix, Version 0.92. 2021. Available online: https://github.com/taiyun/corrplot (accessed on 7 March 2023).
- Wall, A. Risk Analysis of Effects of Whole-Tree Harvesting on Site Productivity. For. Ecol. Manag. 2012, 282, 175–184. [Google Scholar] [CrossRef]
- Carey, M.L. Whole Tree Harvesting in Sitka Spruce. Possibilities and Implications. Ir. For. 1980, 37, 48–63. [Google Scholar]
- Lībiete, Z.; Bārdule, A.; Mūrniece, S.; Lupiķis, A. Impact of Clearfelling on Dissolved Nitrogen Content in Soil-, Ground-, and Surface Waters: Initial Results from a Study in Latvia. Agron. Res. 2017, 15, 767–787. [Google Scholar]
- Kļaviņš, I.; Bārdule, A.; Lībiete, Z. Changes in Macronutrient Concentrations in Soil Solution Following Regeneration Felling in Pine and Spruce Stands: Whole-Tree Harvesting Versus Stem-Only Harvesting. In Proceedings of the International Scientific Conference “RURAL DEVELOPMENT 2017”, Kaunas, Lithuania, 15 February 2018. [Google Scholar]
- Kļaviņš, I.; Bārdule, A.; Lībiete, Z.; Lazdiņa, D.; Lazdiņš, A. Impact of Biomass Harvesting on Nitrogen Concentration in the Soil Solution in Hemiboreal Woody Ecosystems. Silva Fenn. 2019, 53, 10016. [Google Scholar] [CrossRef]
- Kļaviņš, I.; Kļaviņa, Z.; Lībiete, Z. Development of Young Stands after Different Intensity Regeneration Fellings. In Proceedings of the Research for Rural Development: Annual 25th International Scientific Conference, Jelgava, Latvia, 12 December 2019; pp. 18–23. [Google Scholar]
- Kļaviņš, I.; Kļaviņa, Z. Development of Young Stands after Whole Tree Harvesting and Whole Tree Harvesting Combined with Stump Biomass Extraction. RURAL Dev. 2022, 2021, 236–241. [Google Scholar] [CrossRef]
- Adriaenssens, S.; Hansen, K.; Staelens, J.; Wuyts, K.; De Schrijver, A.; Baeten, L.; Boeckx, P.; Samson, R.; Verheyen, K. Throughfall Deposition and Canopy Exchange Processes along a Vertical Gradient within the Canopy of Beech (Fagus Sylvatica L.) and Norway Spruce (Picea Abies (L.) Karst). Sci. Total Environ. 2012, 420, 168–182. [Google Scholar] [CrossRef]
- Houle, D.; Ouimet, R.; Paquin, R.; Laflamme, J.-G. Interactions of Atmospheric Deposition with a Mixed Hardwood and a Coniferous Forest Canopy at the Lake Clair Watershed (Duchesnay, Quebec). Can. J. For. Res. 1999, 29, 1944–1957. [Google Scholar] [CrossRef]
- Hansen, K. In-Canopy Throughfall Measurements of Ion Fluxes in Norway Spruce. Atmos. Environ. 1996, 30, 4065–4076. [Google Scholar] [CrossRef]
- Törmänen, T.; Smolander, A. Biological Nitrogen Fixation in Logging Residue Piles of Different Tree Species after Final Felling. J. Environ. Manag. 2022, 303, 113942. [Google Scholar] [CrossRef]
- Spohn, M.; Berg, B. Import and Release of Nutrients during the First Five Years of Plant Litter Decomposition. Soil Biol. Biochem. 2023, 176, 108878. [Google Scholar] [CrossRef]
- Hyvönen, R.; Olsson, B.A.; Lundkvist, H.; Staaf, H. Decomposition and Nutrient Release from Picea Abies (L.) Karst. and Pinus Sylvestris L. Logging Residues. For. Ecol. Manag. 2000, 126, 97–112. [Google Scholar] [CrossRef]
- Strahm, B.D.; Harrison, R.B.; Terry, T.A.; Flaming, B.L.; Licata, C.W.; Petersen, K.S. Soil Solution Nitrogen Concentrations and Leaching Rates as Influenced by Organic Matter Retention on a Highly Productive Douglas-Fir Site. For. Ecol. Manag. 2005, 218, 74–88. [Google Scholar] [CrossRef]
- Akselsson, C.; Kronnäs, V.; Stadlinger, N.; Zanchi, G.; Belyazid, S.; Karlsson, P.E.; Hellsten, S.; Karlsson, G.P. A Combined Measurement and Modelling Approach to Assess the Sustainability of Whole-Tree Harvesting—A Swedish Case Study. Sustainability 2021, 13, 2395. [Google Scholar] [CrossRef]
- Berg, B.; McClaugherty, C. Plant Litter: Decomposition, Humus Formation, Carbon Sequestration; Springer: Cham, Switzerland, 2020; ISBN 978-3-030-59630-9. [Google Scholar]
- De Vries, W.; de Jong, A.; Kros, J.; Spijker, J. The Use of Soil Nutrient Balances in Deriving Forest Biomass Harvesting Guidelines Specific to Region, Tree Species and Soil Type in the Netherlands. For. Ecol. Manag. 2021, 479, 118591. [Google Scholar] [CrossRef]
- Wall, A. Effect of Removal of Logging Residue on Nutrient Leaching and Nutrient Pools in the Soil after Clearcutting in a Norway Spruce Stand. For. Ecol. Manag. 2008, 256, 1372–1383. [Google Scholar] [CrossRef]
- Devine, W.D.; Footen, P.W.; Strahm, B.D.; Harrison, R.B.; Terry, T.A.; Harrington, T.B. Nitrogen Leaching Following Whole-Tree and Bole-Only Harvests on Two Contrasting Pacific Northwest Sites. For. Ecol. Manag. 2012, 267, 7–17. [Google Scholar] [CrossRef]
- Saarsalmi, A.; Tamminen, P.; Kukkola, M.; Hautajärvi, R. Whole-Tree Harvesting at Clear-Felling: Impact on Soil Chemistry, Needle Nutrient Concentrations and Growth of Scots Pine. Scand. J. For. Res. 2010, 25, 148–156. [Google Scholar] [CrossRef]
- Stevens, P.A.; Hornung, M. Effect of Harvest Intensity and Ground Flora Establishment on Inorganic-N Leaching from a Sitka Spruce Plantation in North Wales, UK. Biogeochemistry 1990, 10, 53–63. [Google Scholar] [CrossRef]
- Fahey, T.J.; Hill, M.O.; Stevens, P.A.; Hornung, M.; Rowland, P. Nutrient Accumulation in Vegetation Following Conventional and Whole-Tree Harvest of Sitka Spruce Plantations in North Wales. Forestry 1991, 64, 271–288. [Google Scholar] [CrossRef]
- Littke, K.M.; Holub, S.M.; Slesak, R.A.; Littke, W.R.; Turnblom, E.C. Five-Year Growth, Biomass, and Nitrogen Pools of Douglas-Fir Following Intensive Forest Management Treatments. For. Ecol. Manag. 2021, 494, 119276. [Google Scholar] [CrossRef]
- Littke, K.M.; Harrington, T.B.; Slesak, R.A.; Holub, S.M.; Hatten, J.A.; Gallo, A.C.; Littke, W.R.; Harrison, R.B.; Turnblom, E.C. Impacts of Organic Matter Removal and Vegetation Control on Nutrition and Growth of Douglas-Fir at Three Pacific Northwestern Long-Term Soil Productivity Sites. For. Ecol. Manag. 2020, 468, 118176. [Google Scholar] [CrossRef]
- Nollendorfs, V. Egļu Audžu Panīkuma Un Sabrukšanas Cēloņu Noskaidrošana, to Samazināšanas Iespējamie Pasākumi; LSFRI “Silava”: Salaspils, Latvia, 2008. [Google Scholar]
- Bergmann, W. (Ed.) Ernährungsstörungen bei Kulturpflanzen: Entstehung, Visuelle und Analytische Diagnose; 110 Tabellen; Zweite, Erweiterte und Neugestaltete Auflage; Georg Fischer AG: Stuttgart, Germany, 1988; ISBN 978-3-437-30562-7. [Google Scholar]
- Mellert, K.H.; Göttlein, A. Comparison of New Foliar Nutrient Thresholds Derived from van Den Burg’s Literature Compilation with Established Central European References. Eur. J. For. Res. 2012, 131, 1461–1472. [Google Scholar] [CrossRef]
- Bušs, M.; Kāposts, V.; Sacenieks, R. Meža mēslošana: Apskats. Latv. Repub. Zinātniski Teh. Inf. Propogandas Institūts 1974, 1, 53. [Google Scholar]
- Kāposts, V.; Sacenieks, R. Mežaudžu Barošanās Režīms Un to Mēslošana: Apskats. Latv. Zinātniski Teh. Inf. Teh. Ekon. Problēmu Zinātniskās Pētniecības Institūts 1981, 55, 55–56. [Google Scholar]
Figure 1.
Location of the study sites in conifer forests with mesotrophic (Dm), eutrophic (Kp) and oligotrophic (Ln) conditions in Latvia.
Figure 1.
Location of the study sites in conifer forests with mesotrophic (Dm), eutrophic (Kp) and oligotrophic (Ln) conditions in Latvia.

Figure 2.
Conceptual scheme of the study design, including whole-tree harvesting (WTH) and stem-only harvesting (SOH) treatments and a control (C; stand left intact).
Figure 2.
Conceptual scheme of the study design, including whole-tree harvesting (WTH) and stem-only harvesting (SOH) treatments and a control (C; stand left intact).

Figure 3.
Total precipitation and general chemistry during the vegetation season (May–October) collected in the open field (harvested area) and under the tree canopy (throughfall in control stand) at the study sites. Boxplots indicate 25%, median and 75% quartiles; stars indicate significant differences between open field and throughfall precipitation (p < 0.05).

Figure 4.
Soil solution pH in control (C), stem-only harvesting (SOH) and whole-tree harvesting (WTH) plots at the study sites. Error bars represent standard error; different letters (a, b, c) indicate statistically significant differences (p < 0.05) between treatments.
Figure 4.
Soil solution pH in control (C), stem-only harvesting (SOH) and whole-tree harvesting (WTH) plots at the study sites. Error bars represent standard error; different letters (a, b, c) indicate statistically significant differences (p < 0.05) between treatments.

Figure 5.
N-NO3− concentrations in soil solution in control (C), stem-only harvesting (SOH) and whole-tree harvesting (WTH) plots at the study sites. Error bars represent standard error; different letters (a, b, c) indicate statistically significant differences (p < 0.05) between treatments.
Figure 5.
N-NO3− concentrations in soil solution in control (C), stem-only harvesting (SOH) and whole-tree harvesting (WTH) plots at the study sites. Error bars represent standard error; different letters (a, b, c) indicate statistically significant differences (p < 0.05) between treatments.

Figure 6.
P-PO43− concentrations in soil solution in control (C), stem-only harvesting (SOH) and whole-tree harvesting (WTH) plots at the study sites. Error bars represent standard error; different letters (a, b, c) indicate statistically significant differences (p < 0.05) between treatments.
Figure 6.
P-PO43− concentrations in soil solution in control (C), stem-only harvesting (SOH) and whole-tree harvesting (WTH) plots at the study sites. Error bars represent standard error; different letters (a, b, c) indicate statistically significant differences (p < 0.05) between treatments.

Figure 7.
K+ concentrations in soil solution in control (C), stem-only harvesting (SOH) and whole-tree harvesting (WTH) plots at the study sites. Error bars represent standard error; different letters (a, b, c) indicate statistically significant differences (p < 0.05) between treatments.
Figure 7.
K+ concentrations in soil solution in control (C), stem-only harvesting (SOH) and whole-tree harvesting (WTH) plots at the study sites. Error bars represent standard error; different letters (a, b, c) indicate statistically significant differences (p < 0.05) between treatments.

Figure 8.
Nutrient (N, P and K) input with litter in control (mature stand) and treatment (felled) plots in study sites.
Figure 8.
Nutrient (N, P and K) input with litter in control (mature stand) and treatment (felled) plots in study sites.

Figure 9.
Mean regenerated stand height after stem-only harvesting (SOH) and whole-tree harvesting (WTH) at the study sites. Error bars represent standard error; stars indicate statistically significant differences (p < 0.05) between treatments.
Figure 9.
Mean regenerated stand height after stem-only harvesting (SOH) and whole-tree harvesting (WTH) at the study sites. Error bars represent standard error; stars indicate statistically significant differences (p < 0.05) between treatments.

Figure 10.
Correlation of tree height and root collar diameter after stem-only harvesting (SO) and whole-tree harvesting (WTH) in study sites.
Figure 10.
Correlation of tree height and root collar diameter after stem-only harvesting (SO) and whole-tree harvesting (WTH) in study sites.

Figure 11.
Nutrient (N, P, K) content in current-year needles of dominant tree species of regenerated stands in stem-only harvesting (SO) and whole-tree harvesting (WTH) plots at the study sites (sampled in 2018 and 2019). Error bars represent standard error; stars indicate statistically significant differences between treatments (p < 0.05).

Table 1.
Description of the study sites.
| Site | Coordinates (N;E) | Site Trophic Condition | Forest Site Type | Planted Tree Species | Standing Volume before Felling, m3 ha−1 | Year of Harvest | Year of Planting | Total Felling Area, ha | Planted Density, n·ha−1 | Soil Type | Soil Type (WRB *) |
|---|---|---|---|---|---|---|---|---|---|---|---|
| Kp | 56°42′54.53″; 25°51′33.39″ | eutrophic | Oxalidosa turf. mel. | Picea abies L. (Karst.) | 315.0 | 2013 | 2015 | 0.9 | ~2000 | mineral | Rheic Histosols (Eutric, Drainic) |
| Dm | 56°44′10.44″; 25°54′27.58″ | mesotrophic | Hylocomiosa | Pinus sylvestris L. | 541.3 | 2013 | 2015 | 1.7 | ~3000 | mineral | Folic Umbrisols (Albic, Hyperdystric, Arenic) |
| Ln | 56°40′10.71″; 25°50′29.76″ | oligotrophic | Myrtillosa | Pinus sylvestris L. | 270.9 | 2013 | 2015 | 0.8 | ~3000 | drained peat | Albic Arenosols (Dystric) |
* World Reference Base (WRB)—an international system for classification of soils
Disclaimer/Publisher’s Note: The statements, opinions and data contained in all publications are solely those of the individual author(s) and contributor(s) and not of MDPI and/or the editor(s). MDPI and/or the editor(s) disclaim responsibility for any injury to people or property resulting from any ideas, methods, instructions or products referred to in the content. |
© 2023 by the authors. Licensee MDPI, Basel, Switzerland. This article is an open access article distributed under the terms and conditions of the Creative Commons Attribution (CC BY) license (https://creativecommons.org/licenses/by/4.0/).
Share and Cite
MDPI and ACS Style
Klavins, I.; Bardule, A.; Klavina, Z.; Libiete, Z. Harvest Intensity Impacts Nutrient Status and Young Stand Development in Latvian Hemiboreal Forest. Forests 2023, 14, 764. https://doi.org/10.3390/f14040764
AMA Style
Klavins I, Bardule A, Klavina Z, Libiete Z. Harvest Intensity Impacts Nutrient Status and Young Stand Development in Latvian Hemiboreal Forest. Forests. 2023; 14(4):764. https://doi.org/10.3390/f14040764
Chicago/Turabian StyleKlavins, Ivars, Arta Bardule, Zane Klavina, and Zane Libiete. 2023. "Harvest Intensity Impacts Nutrient Status and Young Stand Development in Latvian Hemiboreal Forest" Forests 14, no. 4: 764. https://doi.org/10.3390/f14040764
Note that from the first issue of 2016, this journal uses article numbers instead of page numbers. See further details here.