Identification, Prioritization and Mapping of Ecosystem Services in the Panchase Mountain Ecological Region of Western Nepal


1
Ministry of Forests and Environment, Kathmandu, Nepal
2
Centre for International Forestry Research, Jalan CIFOR, Situ Gede, Sindang Barang, Bogor 16115, Indonesia
3
School of Ecosystem and Forest Science, University of Melbourne, Richmond, VIC 3121, Australia
*
Author to whom correspondence should be addressed.
Forests 2018, 9(9), 554; https://doi.org/10.3390/f9090554
Submission received: 6 August 2018
/
Revised: 30 August 2018
/
Accepted: 4 September 2018
/
Published: 10 September 2018
(This article belongs to the Section Forest Ecology and Management)
Abstract
:Ecosystem services (ES) are critical to human well-being, especially in developing countries. Improved understanding of the status of ES is required to help people improve their quality of life. The status of ES is largely unknown in many regions of Nepal. This study was carried out in one of Nepal’s biodiversity hotspots, the Panchase Mountain Ecological region (PMER), to identify, prioritize and map the major ES in the region. Primary data for the study were collected through key informant interviews, focus group discussions, a transect walk, and field observations. Similarly, secondary data were obtained from published and unpublished reports and satellite images of the study area. The data were analyzed both qualitatively and quantitatively. Thirty-seven ES were identified from the study landscape. Among them, nine were provisioning services, thirteen regulating services, nine cultural services, and six supporting services. Interestingly, the prioritization of ES among stakeholders differed on the basis of their background, particular features of their landscape, professional engagement, and individual interests. For instance, forest users prioritized provisioning services for their daily needs whereas forest managers prioritized regulating and cultural services for overall ecosystem management and aesthetic values. Mapping of the ES from the landscape for 1995 and 2015 identified that forest area and associated ES have likely increased, especially in the upland regions, while agricultural land and their associated ES have decreased. The study can be used as a reference by planners and policy makers in managing ES in the PMER to increase synergies and reduce trade-off among various services.
1. Introduction
Ecosystem services (ES)—the benefits that human populations derive from ecosystems are being increasingly recognized for their contribution to human well-being. The concept is applicable for both developed and developing nations. It is, however, more relevant in developing countries like Nepal where people are largely dependent on these services for their livelihoods [1,2,3,4].
There has been a lack of systematic studies on the status of ES in many regions due, in part, to lack of appropriate data, tools and policy [5]. The lack of systematic studies on ES suggests that there is a lack of knowledge at broader planning levels about the importance and use of ES at the landscape, community and house-hold level. This information is essential for informing proper planning and harnessing the effective contribution of the ES to human well-being.
Identifying which ES are provided from within a particular landscape is a prerequisite in ensuring conservation and sustainable management of various services from the landscape [6]. It is the entry point for the effective management of ES for both current and future generation. Identifying the important ES to a society can help decision-makers prioritize ES for the management of services and help implement polices into action [6,7,8]. Prioritization of the ES for the purpose of management is also equally important due to the limited resources available for the management of ES. This is complicated by varying preferences and importance for certain ES by different segments of society. Prioritizing ES should therefore be conducted through the lens of a socio-ecological system where both social and ecological systems are considered jointly [8]. Managing ecosystems for the delivery of prioritized ecosystem services may, however, alter the provision of other services [6,9] thereby requiring trade-offs on which ES are to be prioritized [6]. As a result, there needs to be increased focus on identifying synergies between multiple ES while decreasing trade-offs between users.
Mapping of ES is an important tool for decision-makers as they can communicate complex information on ecosystem services across different spatial and temporal scales [10]. Mapping of key areas supporting ES are therefore important from the perspective of decision-making [10,11,12,13,14]. Spatial mapping can aid in assessing potential synergies and trade-offs among ES thereby helping to prioritize areas and ecosystem services based on local requirements [13,15].
The assessment of ES in terms of identification, prioritization and mapping is a key component of the management of ES with multiple values and benefits [16]. First, it supports objective understandings of the role of ES on human welfare; second, it raises awareness about the importance of these ES to local communities, policy makers, and environmental I/NGOS; and third, help decision-makers with understanding the value of ES, proper land use planning, and stakeholder preferences for the management of ES [16]. Furthermore, the benefits of ecosystem services have been acknowledged in climate change adaptation [4,17] and mitigation [17], especially in reducing emissions from deforestation and forest degradation, conserving forests, managing forests in a sustainable way and enhancing carbon stock in forests (REDD+), biodiversity conservation and livelihood support [1]. However, the assessment of ES is complex and involves the assessment of sociocultural, economic and ecological values and benefits [16]. As a result, various tools and approaches have been developed to assess the ES in various spatial and temporal scales [16,18]. For example, sociocultural values can be assessed with participatory mapping, focus group discussions, household or expert surveys; whereas economic values can be assessed with stated-preference techniques, revealed-preference techniques and benefit transfer methods [16].
This study was carried out in a biodiversity-rich landscape of the Panchase Mountain Ecological Region in Western Nepal. The major aim of the study was to identify, prioritise and map the major ecosystem services in the PMER. It is expected that with adequate information on the status of ES for the region, the results of this study should facilitate more effective planning and decision-making regarding the management of multiple ecosystem services found in the landscape.
2. Materials and Methods
2.1. Study Area
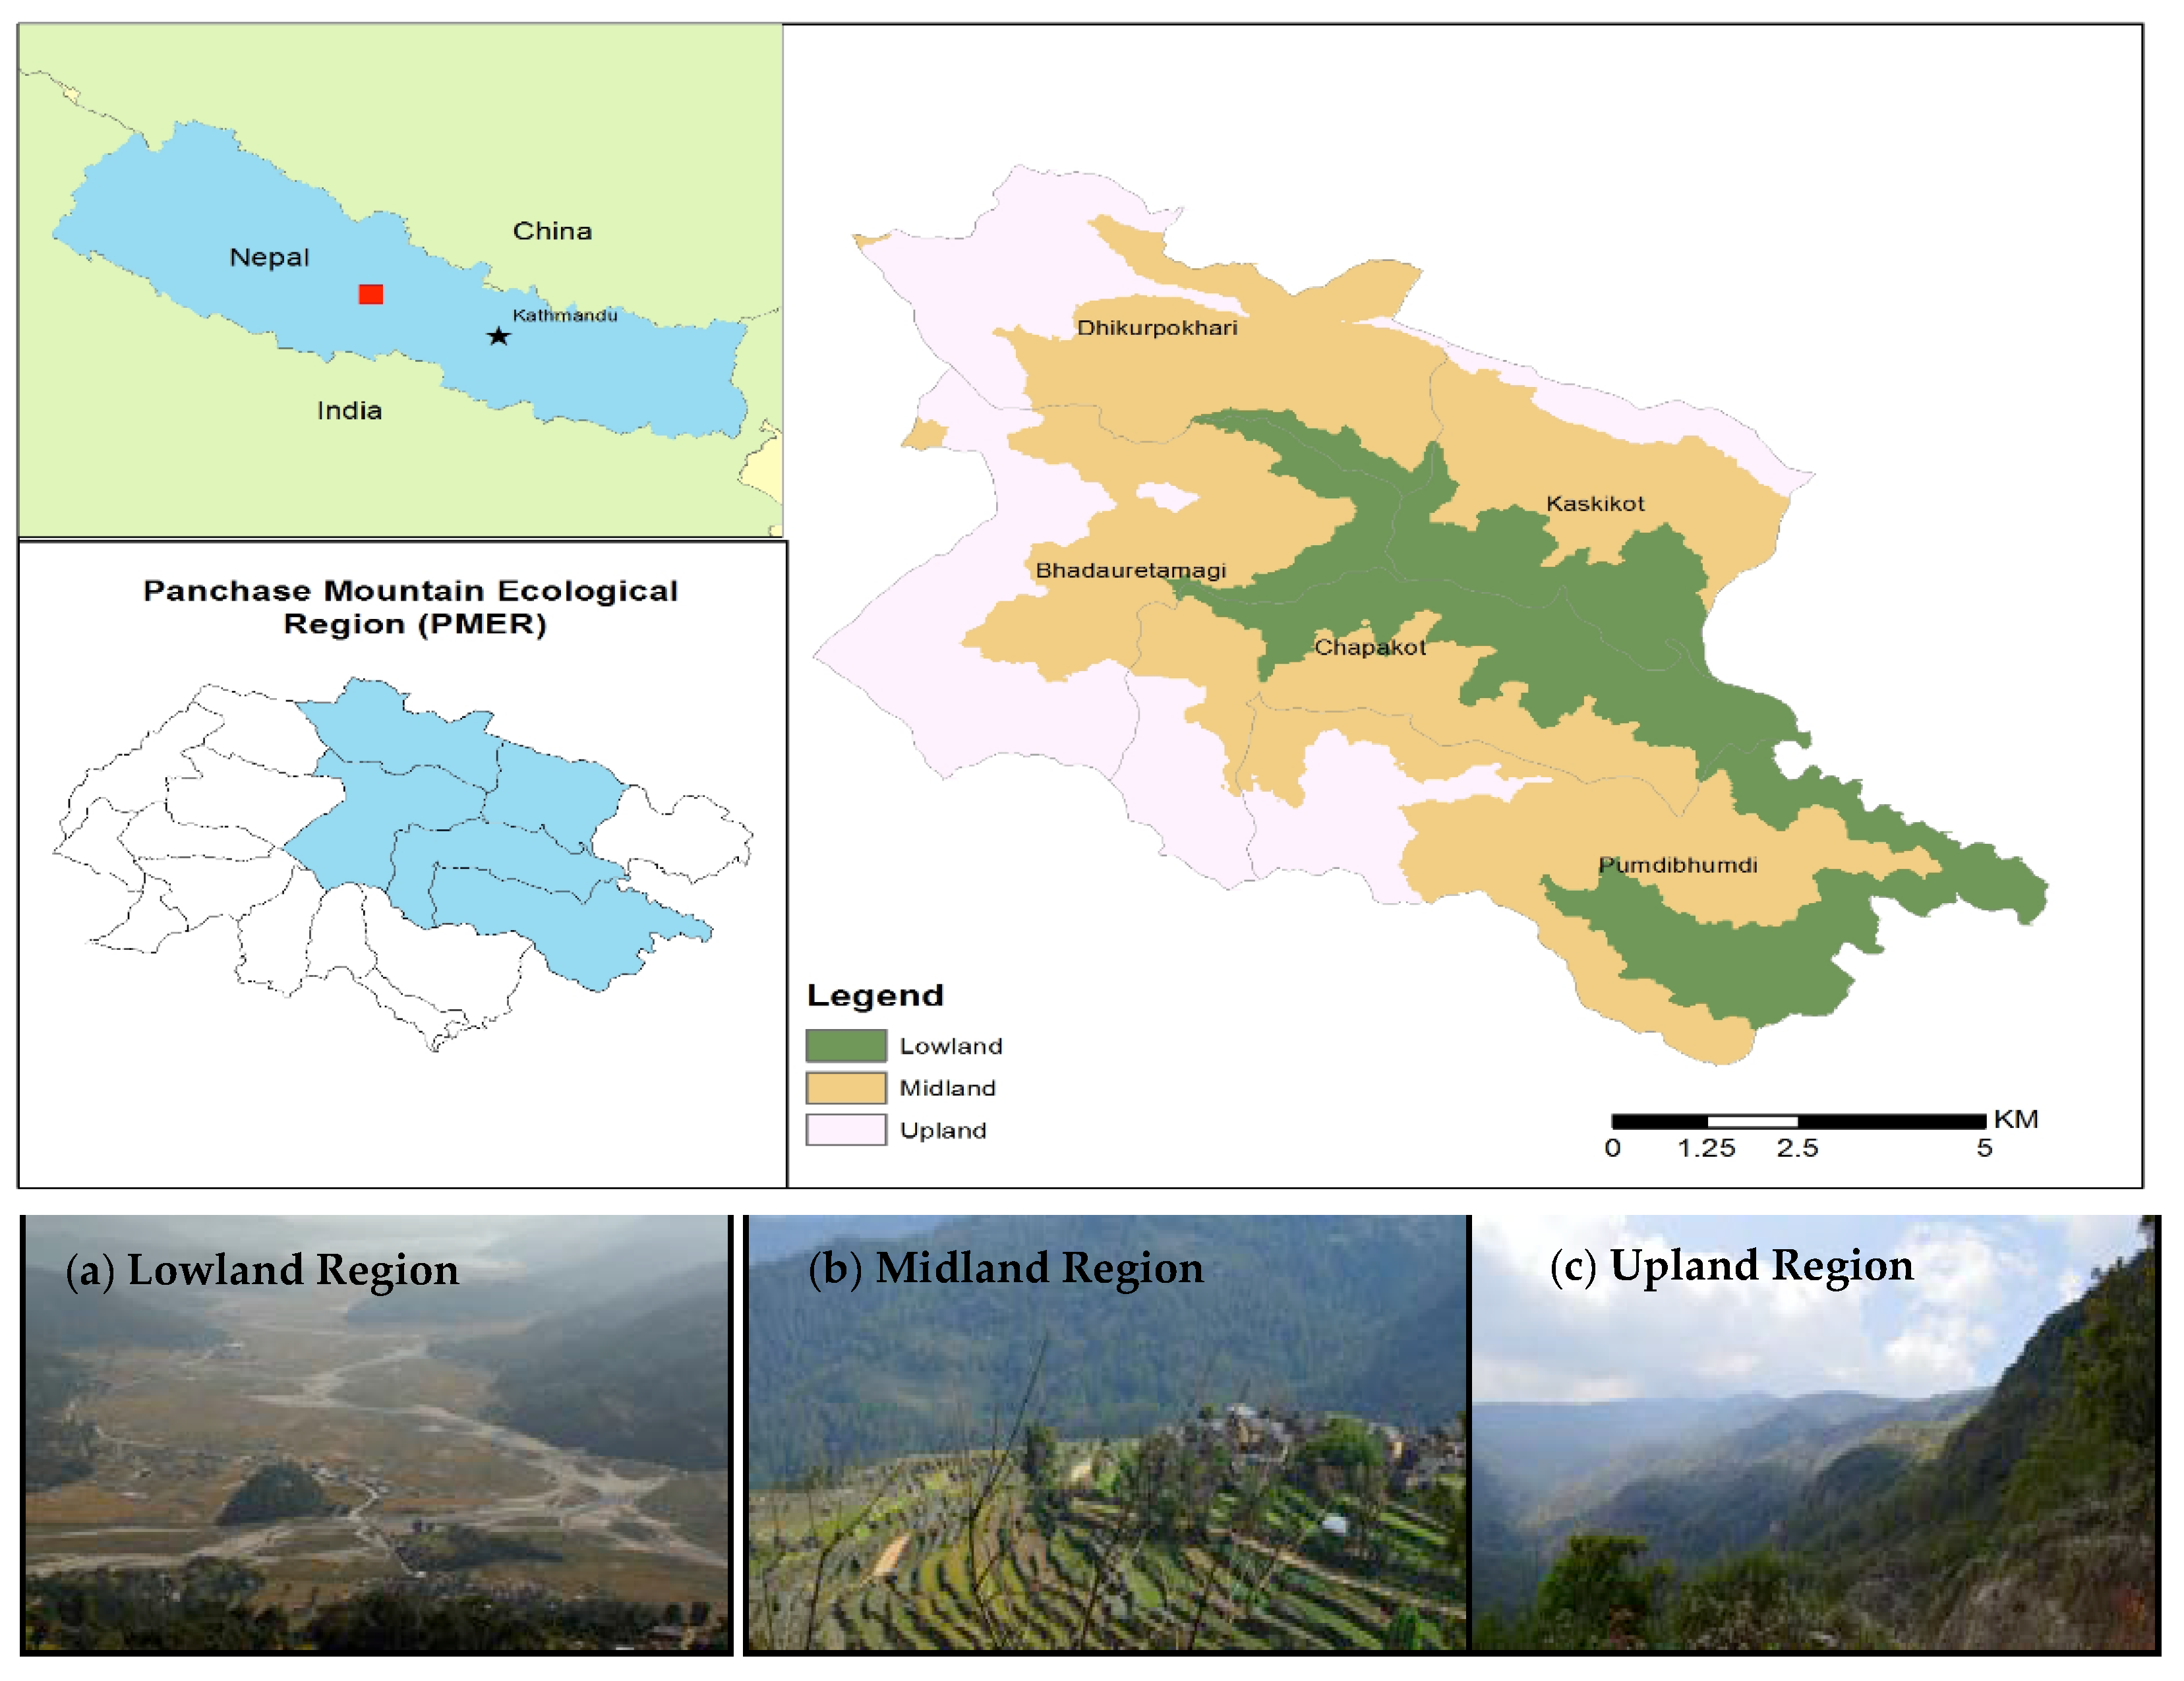
This study was carried out in the Harpankhola catchment of the Panchase Mountain Ecological Region (PMER). It covers an area of approximately 132 km2 and covers an altitudinal gradient from 815 to 2517 m a.s.l., (Figure 1). The study site was selected for multiple reasons: (1) it contains both upstream and downstream regions, (2) contains a range of ES upon which people from both regions are dependent for their livelihood, and, (3) the region has the potential of providing a variety of ES to the people. It is therefore regarded as a repository of biodiversity (agro and forest biodiversity), water resources and different cultural values [19].
The study area was divided into three regions, namely lowland, midland and upland regions (Figure 1). The lowland area represents valley bottoms around the Thulakhet, it is primarily a production landscape comprised of agricultural crops for food production such as rice (Oryza spp.), maize (Zea mays) and wheat (Triticum spp.). It also includes areas of forest along its periphery. It has an altitudinal range from 815 to 1300 m. a.s.l. The midland region, from 1400 to 1900 m a.s.l., is comprised of both forest and agricultural land. The forests are mainly managed by local users in the form of community forestry, and are regarded as a fringe/buffer area for the Panchase Protected Forest (PPF). The upland region is managed mainly for the conservation of biodiversity and ecosystem services, especially for medicinal and aromatic plants [20], as well as for the provision of water, cultural values, and aesthetic beauty. This region contains the core area of the PPF.
The study area is predominantly covered by forests (61%) followed by agriculture lands (34%), grasslands (3%) and wetlands (1.3%) [21]. The characteristic features of this area are representative of the typical mountain ecosystems of Nepal that connect lowland regions to the Himalayas [22]. The study area also contains the Harpan river which originates from the peak of the Panchase, and fulfills drinking and irrigation needs for both the upland and low land communities and also serves as the main feeder stream of Phewa lake, a major tourist attraction in the Pokhara valley.
2.2. Primary Data Collection
2.2.1. Field Methods
Major fieldwork and data collection were conducted from March to April 2015. As a first step, basic information on available ES from these landscapes, changes in the availability of services, and identification of different stakeholders involved in managing these services were collected through the Panchase Protected Forest Program (PPFP) and the then District forest office, Kaski. At the same time, different NGOs working in the field of forest and environment management were also consulted to obtain their ideas and experiences in regard to this study. Similarly, field visits from lowland to upland areas of the study landscape were completed to gain an overall picture of the study area and identify potential issues and respondents for the data collection. The preliminary consultations with different stakeholders and snap-shot spatial field observations helped identify sample groups and potential respondents for the interviews and focus group discussions and also to prepare interview questionnaires based on field reality.
2.2.2. Key Informant Interview
We used non-proportional quota (purposeful) sampling to interview different stakeholders actively engaged in managerial and decision-making roles involving ES. Forest managers, policy makers, forest users including people from indigenous and marginalized communities, and NGO representatives working in the region’s forests were the major respondents. Altogether 37 in-depth key informant interviews (KII) were conducted among forest users (n = 24), forest managers (n = 10), and a representative of an NGO working in the area (n = 3). Respondents of KIIs from forest users were mainly executive committee members of community forest user groups (CFUGs), ex-chairpersons and secretaries of the CFUGs who have many ideas on these issues, while key respondents from forest managers were District Forest Officers, Forest Officers, Forest Rangers, Managers and Chairpersons of PPF in the field, the Regional Director of forests, and the secretary of the Ministry of Forests and Environment. The interviews lasted from 1–1.5 h and were semi-structured in nature. The major reason behind this sampling method was to solicit and engage stakeholders with a wide spectrum of values to gain insight into the topic of discussion instead of having a large sample size for proportional quota sampling [23,24] while ensuring, as far as possible, complete insight on the topic of discussion. Once we completed 30–35 in-depth interviews, we realized new information began to diminish, which is compatible with the experience of Klain et al. [23].
2.2.3. Focus Group Discussion
To further our understanding of ES in the region we also employed interactive focus group discussions (FGD), one in each region, and one amongst forest managers and experts. FGD is a discussion among a predetermined group of people in an interactive environment, which is primarily focused on specific issues [24]. Generally, a trained facilitator moderates the discussion among 5 to 10 participants on a specific set of issues to gain a broad range of views on the research topic [24,25]. In each FGD, there were five participants, thus a total of 20 people participated in the discussions. Executive members of CFUGs, school teachers, members from women groups, a disaster risk reduction (DRR) group, farmer groups, indigenous ethnic groups and elderly people who have knowledge of the local situation were the major participants in each FGD in each region. Similarly, FGD with the managers and experts in the district headquarters involved Forest Officers, Rangers, Managers of PPF, and the chairperson of the PPF council. The facilitator moderated the discussion among the participants instead of asking questions repeatedly.
2.2.4. Transect Walk and Field Observation
A transect walk and field observations were carried out from Thulakhet in the lowland to the peak of the Panchase in order to verify the information collected through the interviews and FGD. Similarly, field observations identified how different ES were distributed throughout the study region. This was done through both direct observation and informal exchanges of information with local people during the transect walk.
2.3. Secondary Data Collection
Major sources of secondary data used in the study included: (i) published and unpublished reports of relevant governments and NGOs; (ii) a topo-map of the study area; and, (iii) the operational plan of PPFP and the adjoining community forest user groups. Key publications used as secondary data were gathered through different government departments and NGOs, including annual reports and publications of the PPFP, the District Forest Office Kaski, the District Soil Conservation Office Kaski, and Ecosystem-based Adaptation (EbA) project. In addition, different publications and journal articles related to the assessment of ES from nearby areas and other regions were consulted as secondary information. Landsat 5 satellite images, of the study area for the year 1995, and Landsat 8 satellite images for 2015 were also used to examine changes in land use patterns over the last 20 years and the potential implications for the availability of ES.
2.4. Data Analysis
2.4.1. Qualitative and Quantitative Data Analysis
We employed a mix of both qualitative and quantitative data for the study. Most of the data gathered from the interview and FGD were qualitative in nature. These qualitative data were analyzed with the help of Nvivo [26]. First, we integrated all the interviews into a database and then used Nvivo to manipulate, code and interpret data [26]. Second, an analysis of quantitative information was carried out with the use of Microsoft Excel and Minitab.
2.4.2. Mapping of Land Use and ES
We used participatory GIS [27,28] for the mapping of both land use-land cover changes and, the mapping of identified major ES was carried out with the use of Landsat images derived from the United States Geological Survey (USGS) data portal and land use information gathered from the field. As a part of participatory GIS approach, base maps were produced from Landsat satellite imagery for the study area, which was checked for geo-location accuracy. The landcover map prepared was used as part of the FGD to inform discussions on the status of various ES in the study area [5].
For the mapping of ES, the Landsat 5 image was used for land use mapping of 1995 whereas Landsat 8 image was used for 2015. Land use maps for both years were carried out using supervised classification with the help of ER Mapper 2011 software. Five major land use patterns including forest land, agricultural land, gravel and sand, water bodies, and settlement area were identified through the mapping. The area covered by each land use category was calculated using the geometric calculation algorithm in ArcGIS 10.
Mapping of prioritized ES was carried out with information gathered through field visits, interviews and satellite images and other maps (such as a protected area map) for the area. These were used to assign a value of high, medium and low (or no) on the map for each ES. For this, we first divided the classified land use classes into various elevation zones to prioritize the ecosystem services as altitude has a prominent effect on the biodiversity, forest types, recreational activities and productivity in the study area. For elevation related analysis, we used the Advanced Spaceborne Thermal Emission and Reflection Radiometer (ASTER) digital elevation model (DEM) acquired freely from the USGS data portal. Secondly, we linked these priority maps to the local protected area maps to incorporate some of the ecosystem services provided by protected areas such as biodiversity, carbon and water. Then finally, we produced a map of each of the prioritized ES in the region showing high, medium and low distribution of each of the prioritized services in the regions. Prioritized maps of overall ES for the years 1995 and 2015 were developed to compare changes in ES in the region over the last 20 years.
3. Results
3.1. Identification of ES
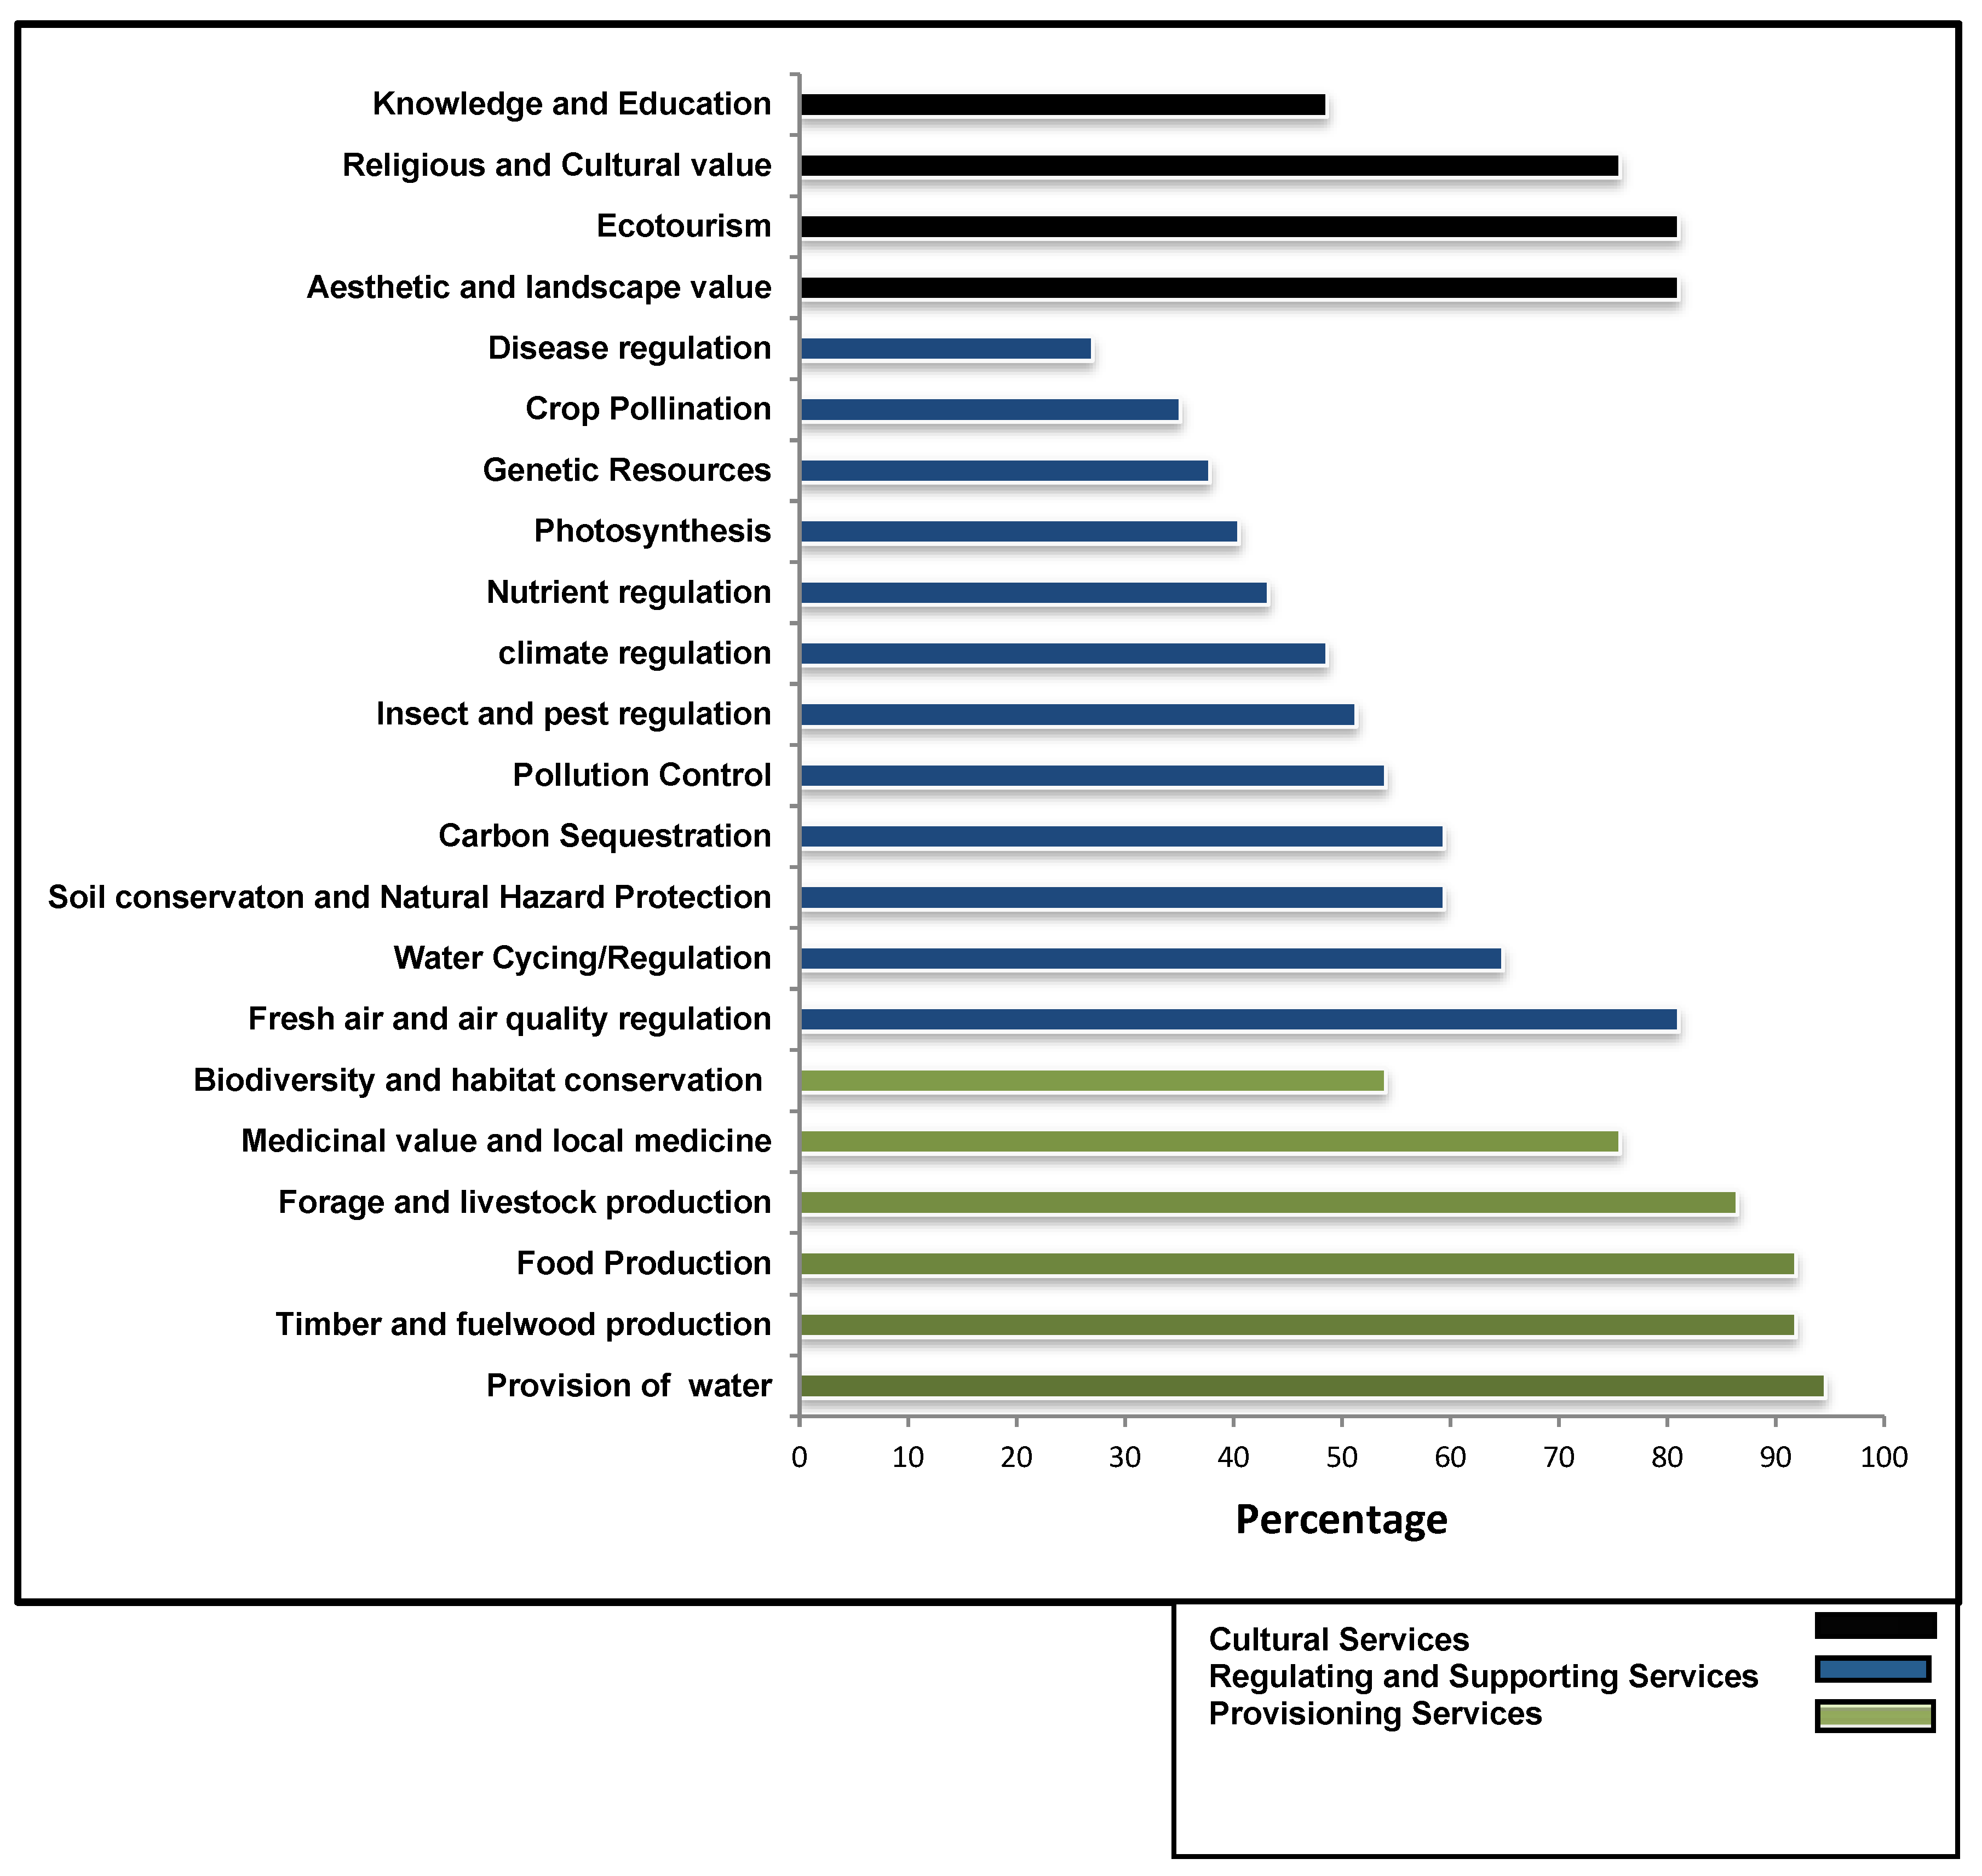
A suite of ES occurs in the PMER which is used to support livelihoods. Altogether, thirty-seven ES (Table 1) were identified throughout the region and these were classified based on MEA [29] into four categories. Out of the thirty-seven ES, nine are provisioning services, thirteen regulating services, eight cultural services, and seven supporting services (Table 1).
Though there were higher numbers of regulating services identified, most of the respondents identified and acknowledged that the provisioning services such as provision of water, food, different forest products (timber, fuel wood, forage) to be more important than regulating and supporting services such as climate regulation, soil conservation, nutrient regulation, and disease control. However, >80% of the respondents recognized the value of fresh air and air quality regulation. Likewise, about 80% of the respondents also identified that the PMER has aesthetic and landscape value, value for ecotourism, and religious and cultural significance (Figure 2).
3.2. Prioritizations of ES
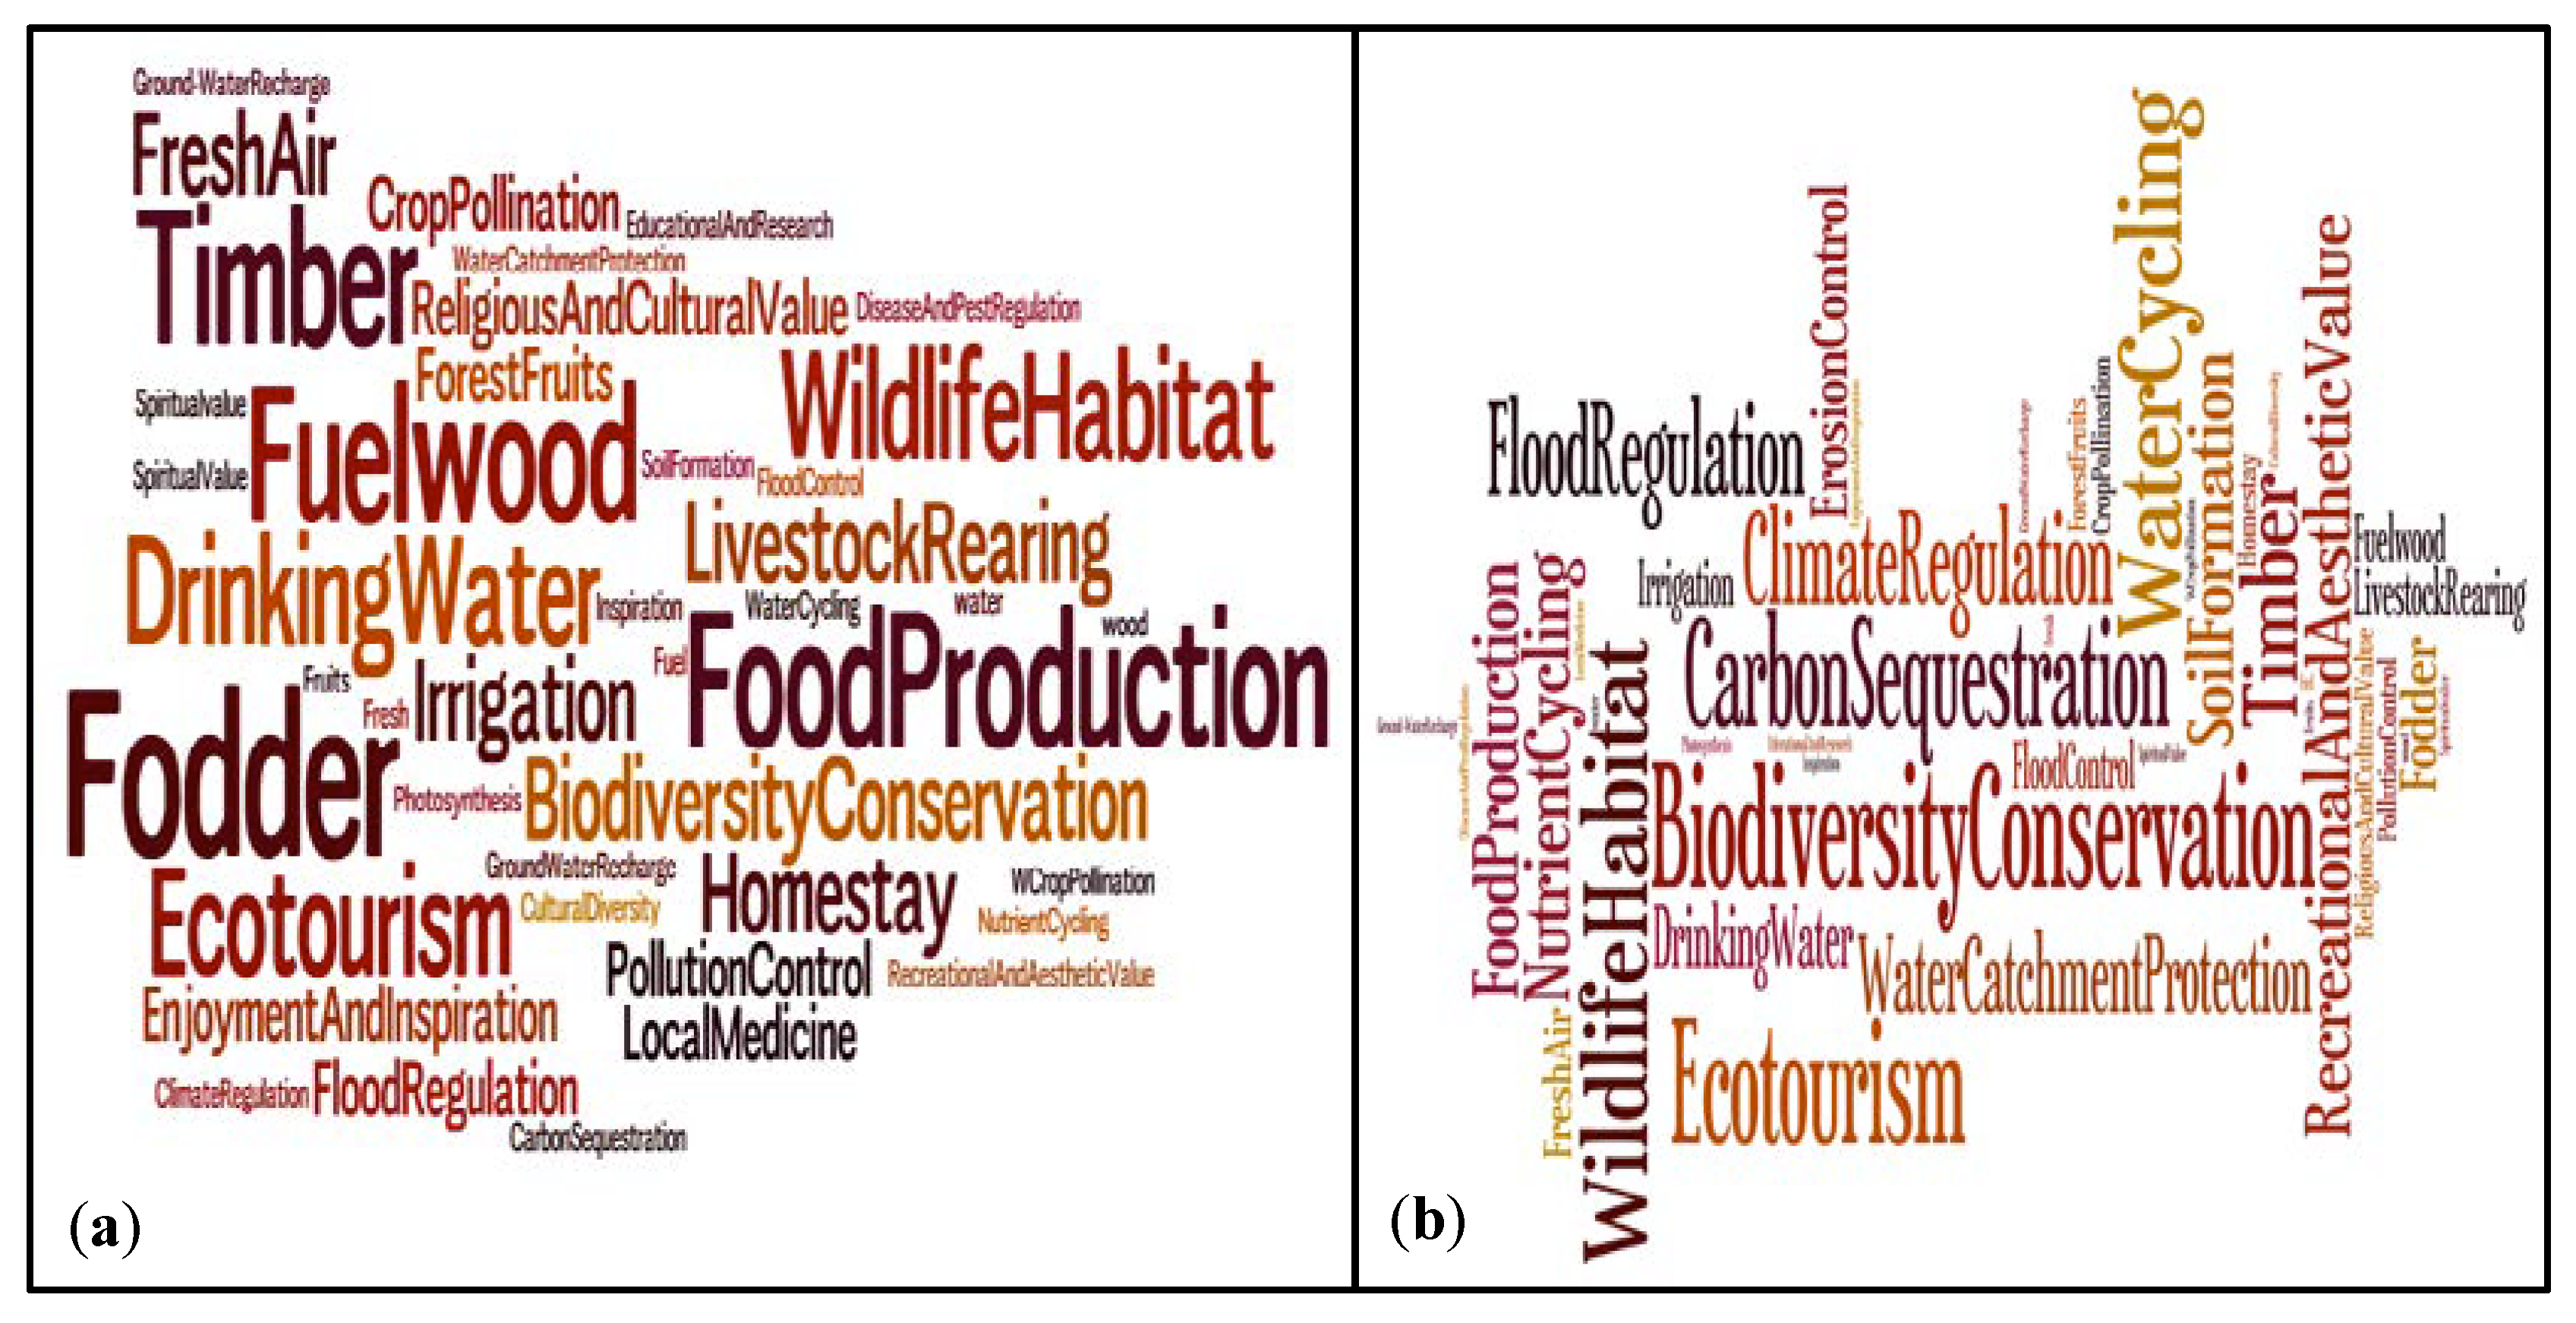
Prioritization of ES among stakeholders differed on the basis of their background, particular features of their landscape, professional engagement, and individual interests. Respondents from different locations but with the similar backgrounds had different priorities in terms of ES. For example, forest users prioritized provisioning ES such as provision of food, water, timber, fuel wood, and fodder, whereas forest managers prioritized regulating and cultural services such as biodiversity conservation, flood regulation, carbon sequestration and climate regulation, ecotourism and wildlife habitats (Figure 3).
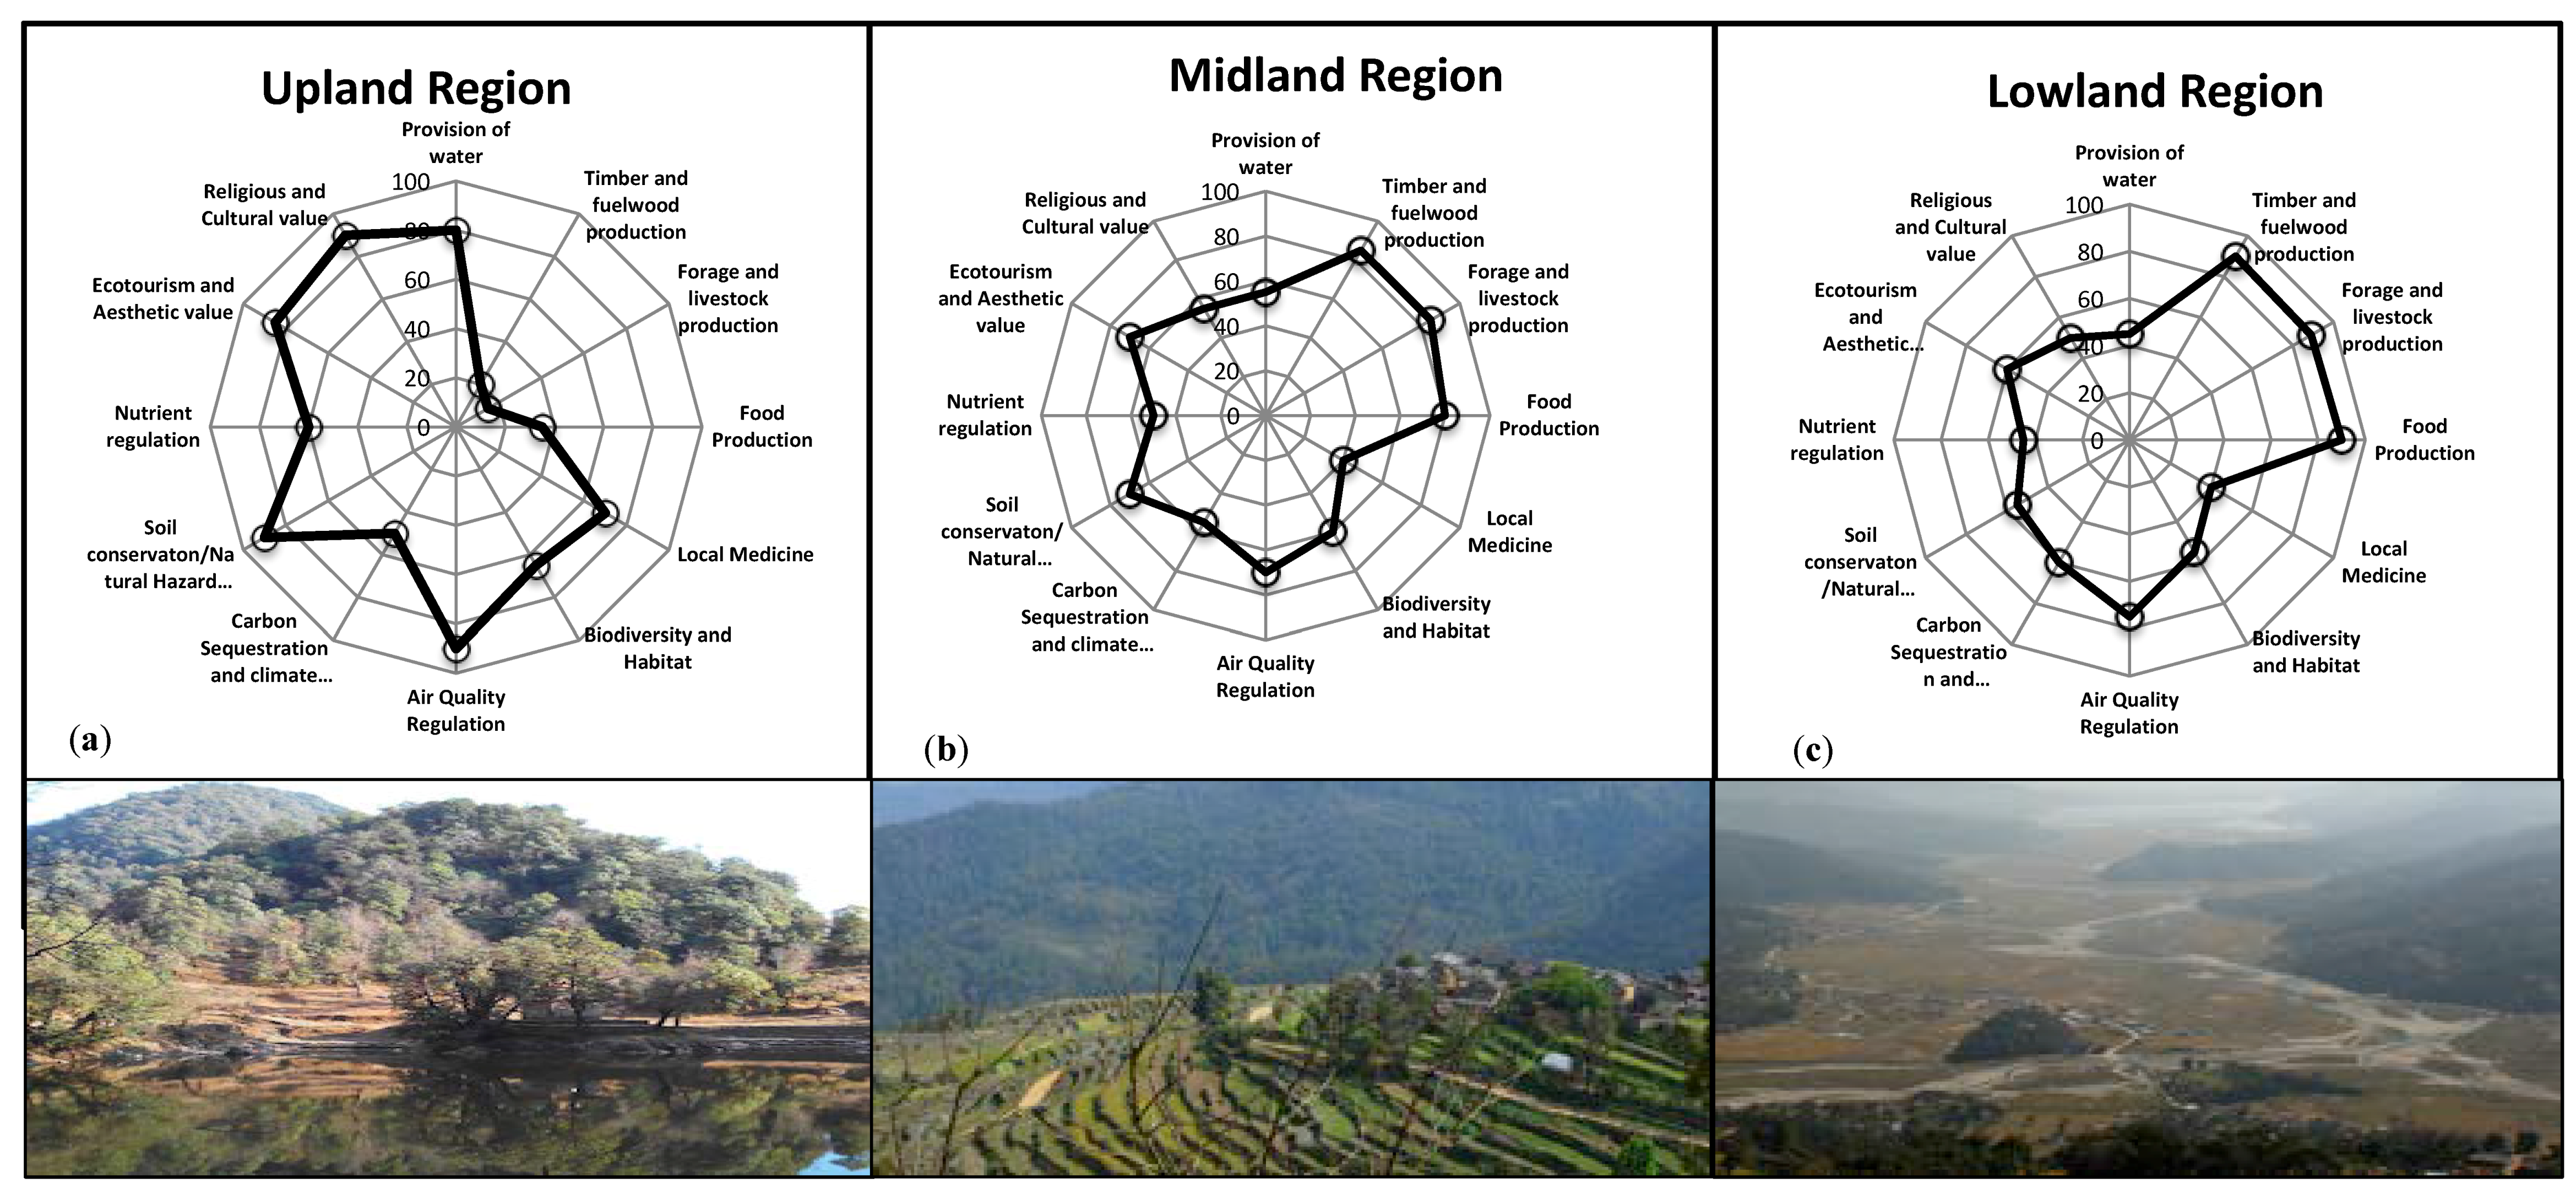
Among forest users, respondents from different regions have different priorities (Figure 4); for example, respondents in the upland region, which contains the core protected forest area, with cultural and biodiversity significance, and infertile agriculture land, valued their ecosystems for soil conservation, aesthetic beauty and ecotourism, religious and cultural significance, along with biodiversity, ecotourism and medicinal value. On the other hand, forest users from the midland region, which contains a mix of both production landscape and forest products, valued provisioning services for production of food, fodder, fuel wood and timber, while putting some priority on other services such as biodiversity, air quality regulation, soil conservation, ecotourism. Similarly, in the plains of the production landscape in the lowland area, most respondents put a higher priority on production of food and forest products. Therefore, priority of ES was based upon the requirements of the stakeholders and the environmental context of their region.
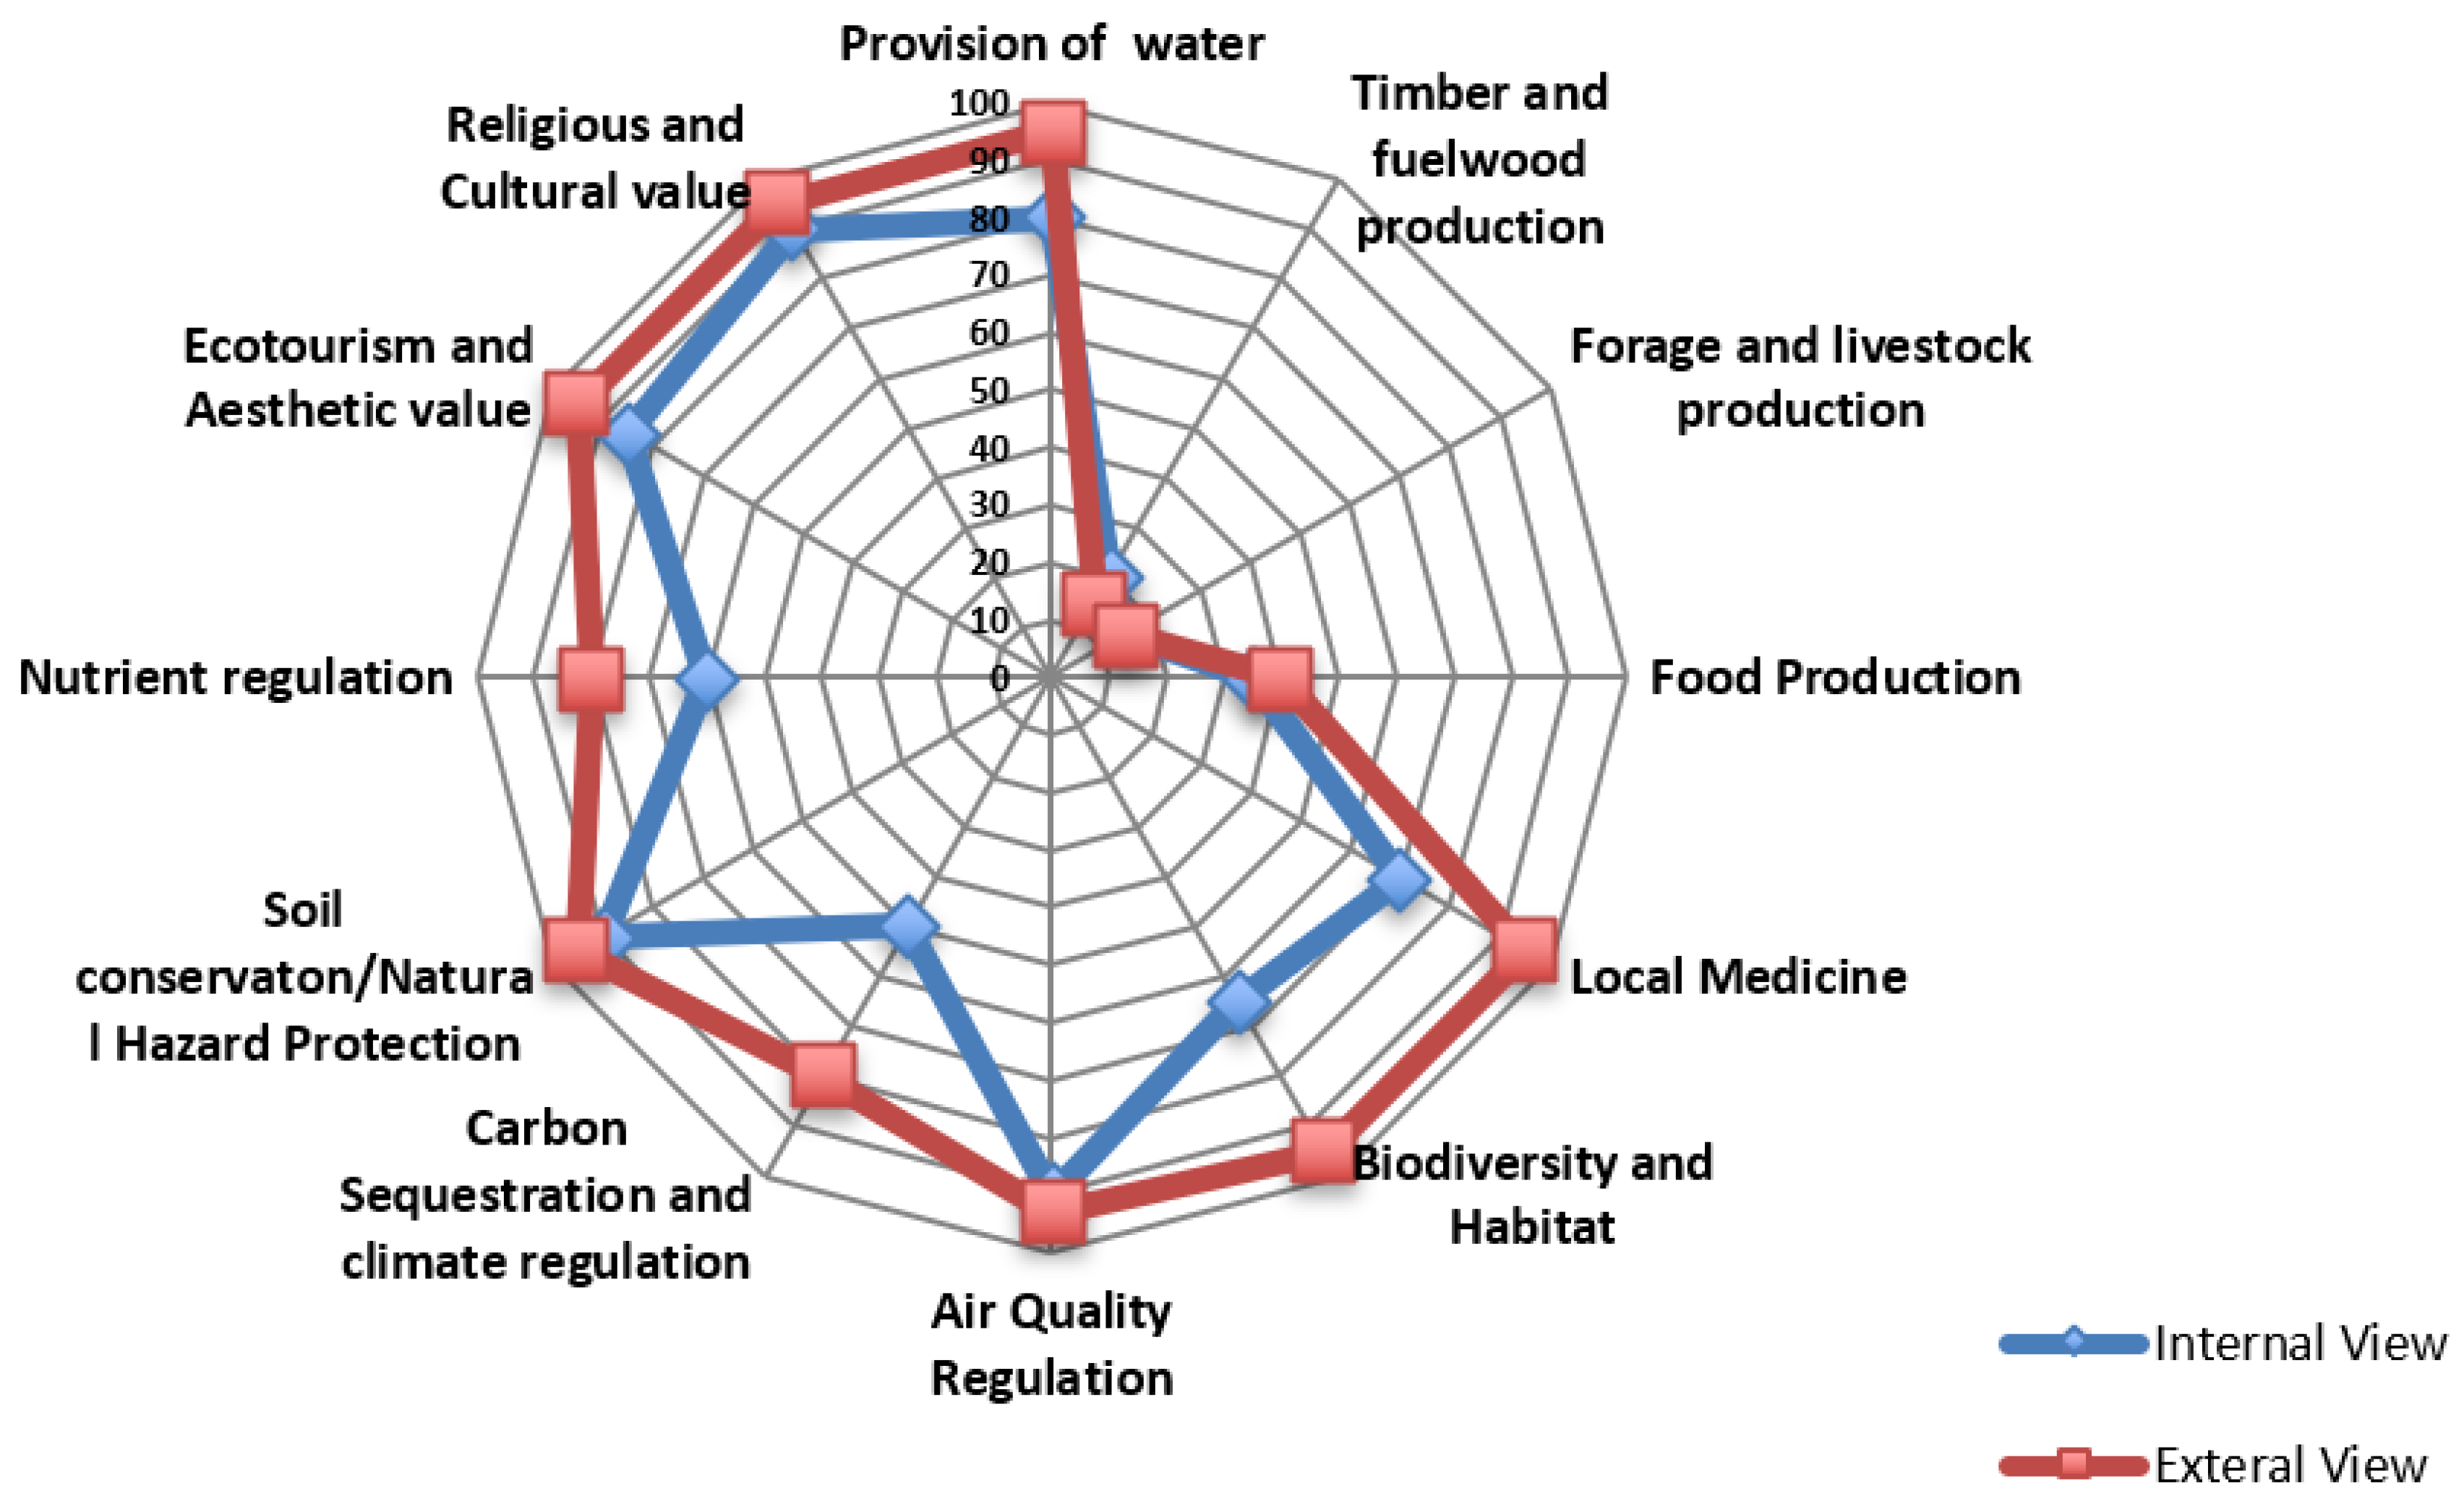
As the upland region’s ecosystem is considered particularly important for its role in biodiversity conservation, culture, and recreation services, we were interested in the responses of respondents from the middle and lowland regions regarding how they value the upland region’s protected forest. Figure 5 shows that respondents from the upland region valued its provision of water sources, ecotourism, biodiversity, medicinal value, climate and nutrient regulations, but that external respondents, especially from the lower region, put even higher value on these ES (Figure 5). However, both external and internal respondents valued the middle and lower regions similarly.
3.3. Mapping of Changes in Land Use and ES
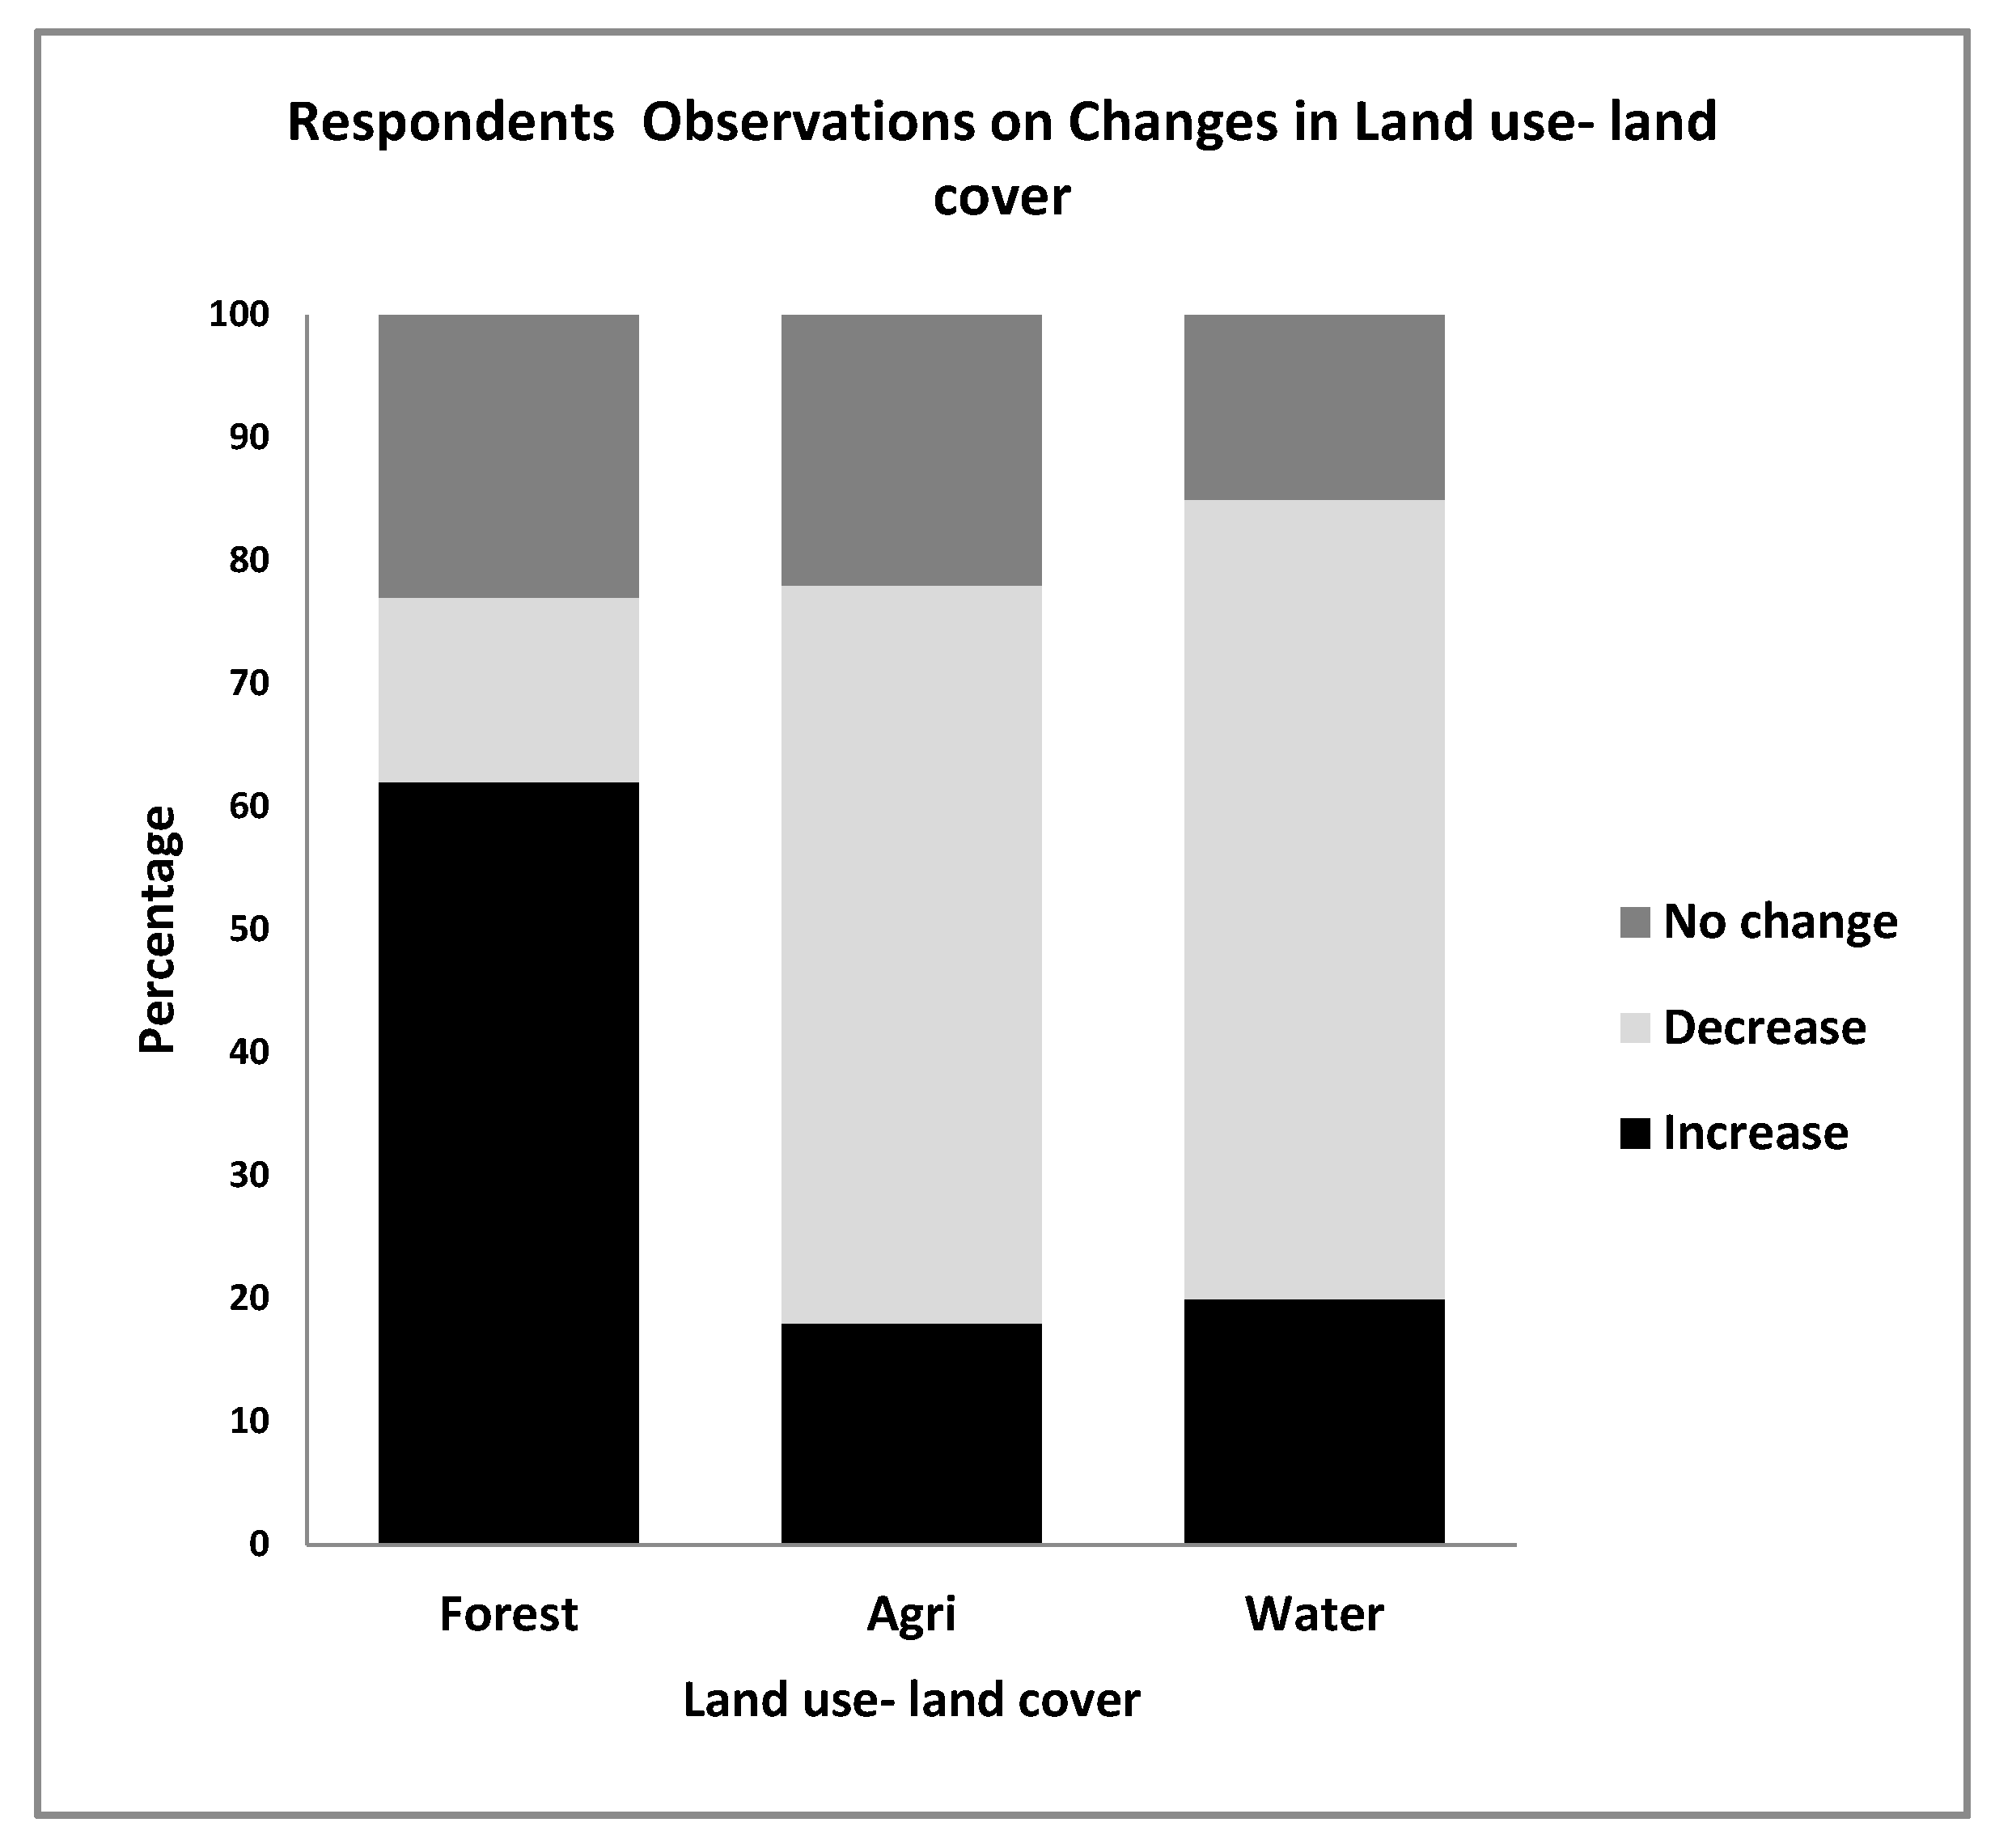
Mapping of land use patterns and ES over the last 20 years suggests that changes in both land use and land cover have occurred. More than 60% of the respondents identified that forest area had increased during this period, whilst agriculture and water resources had decreased (Figure 6).
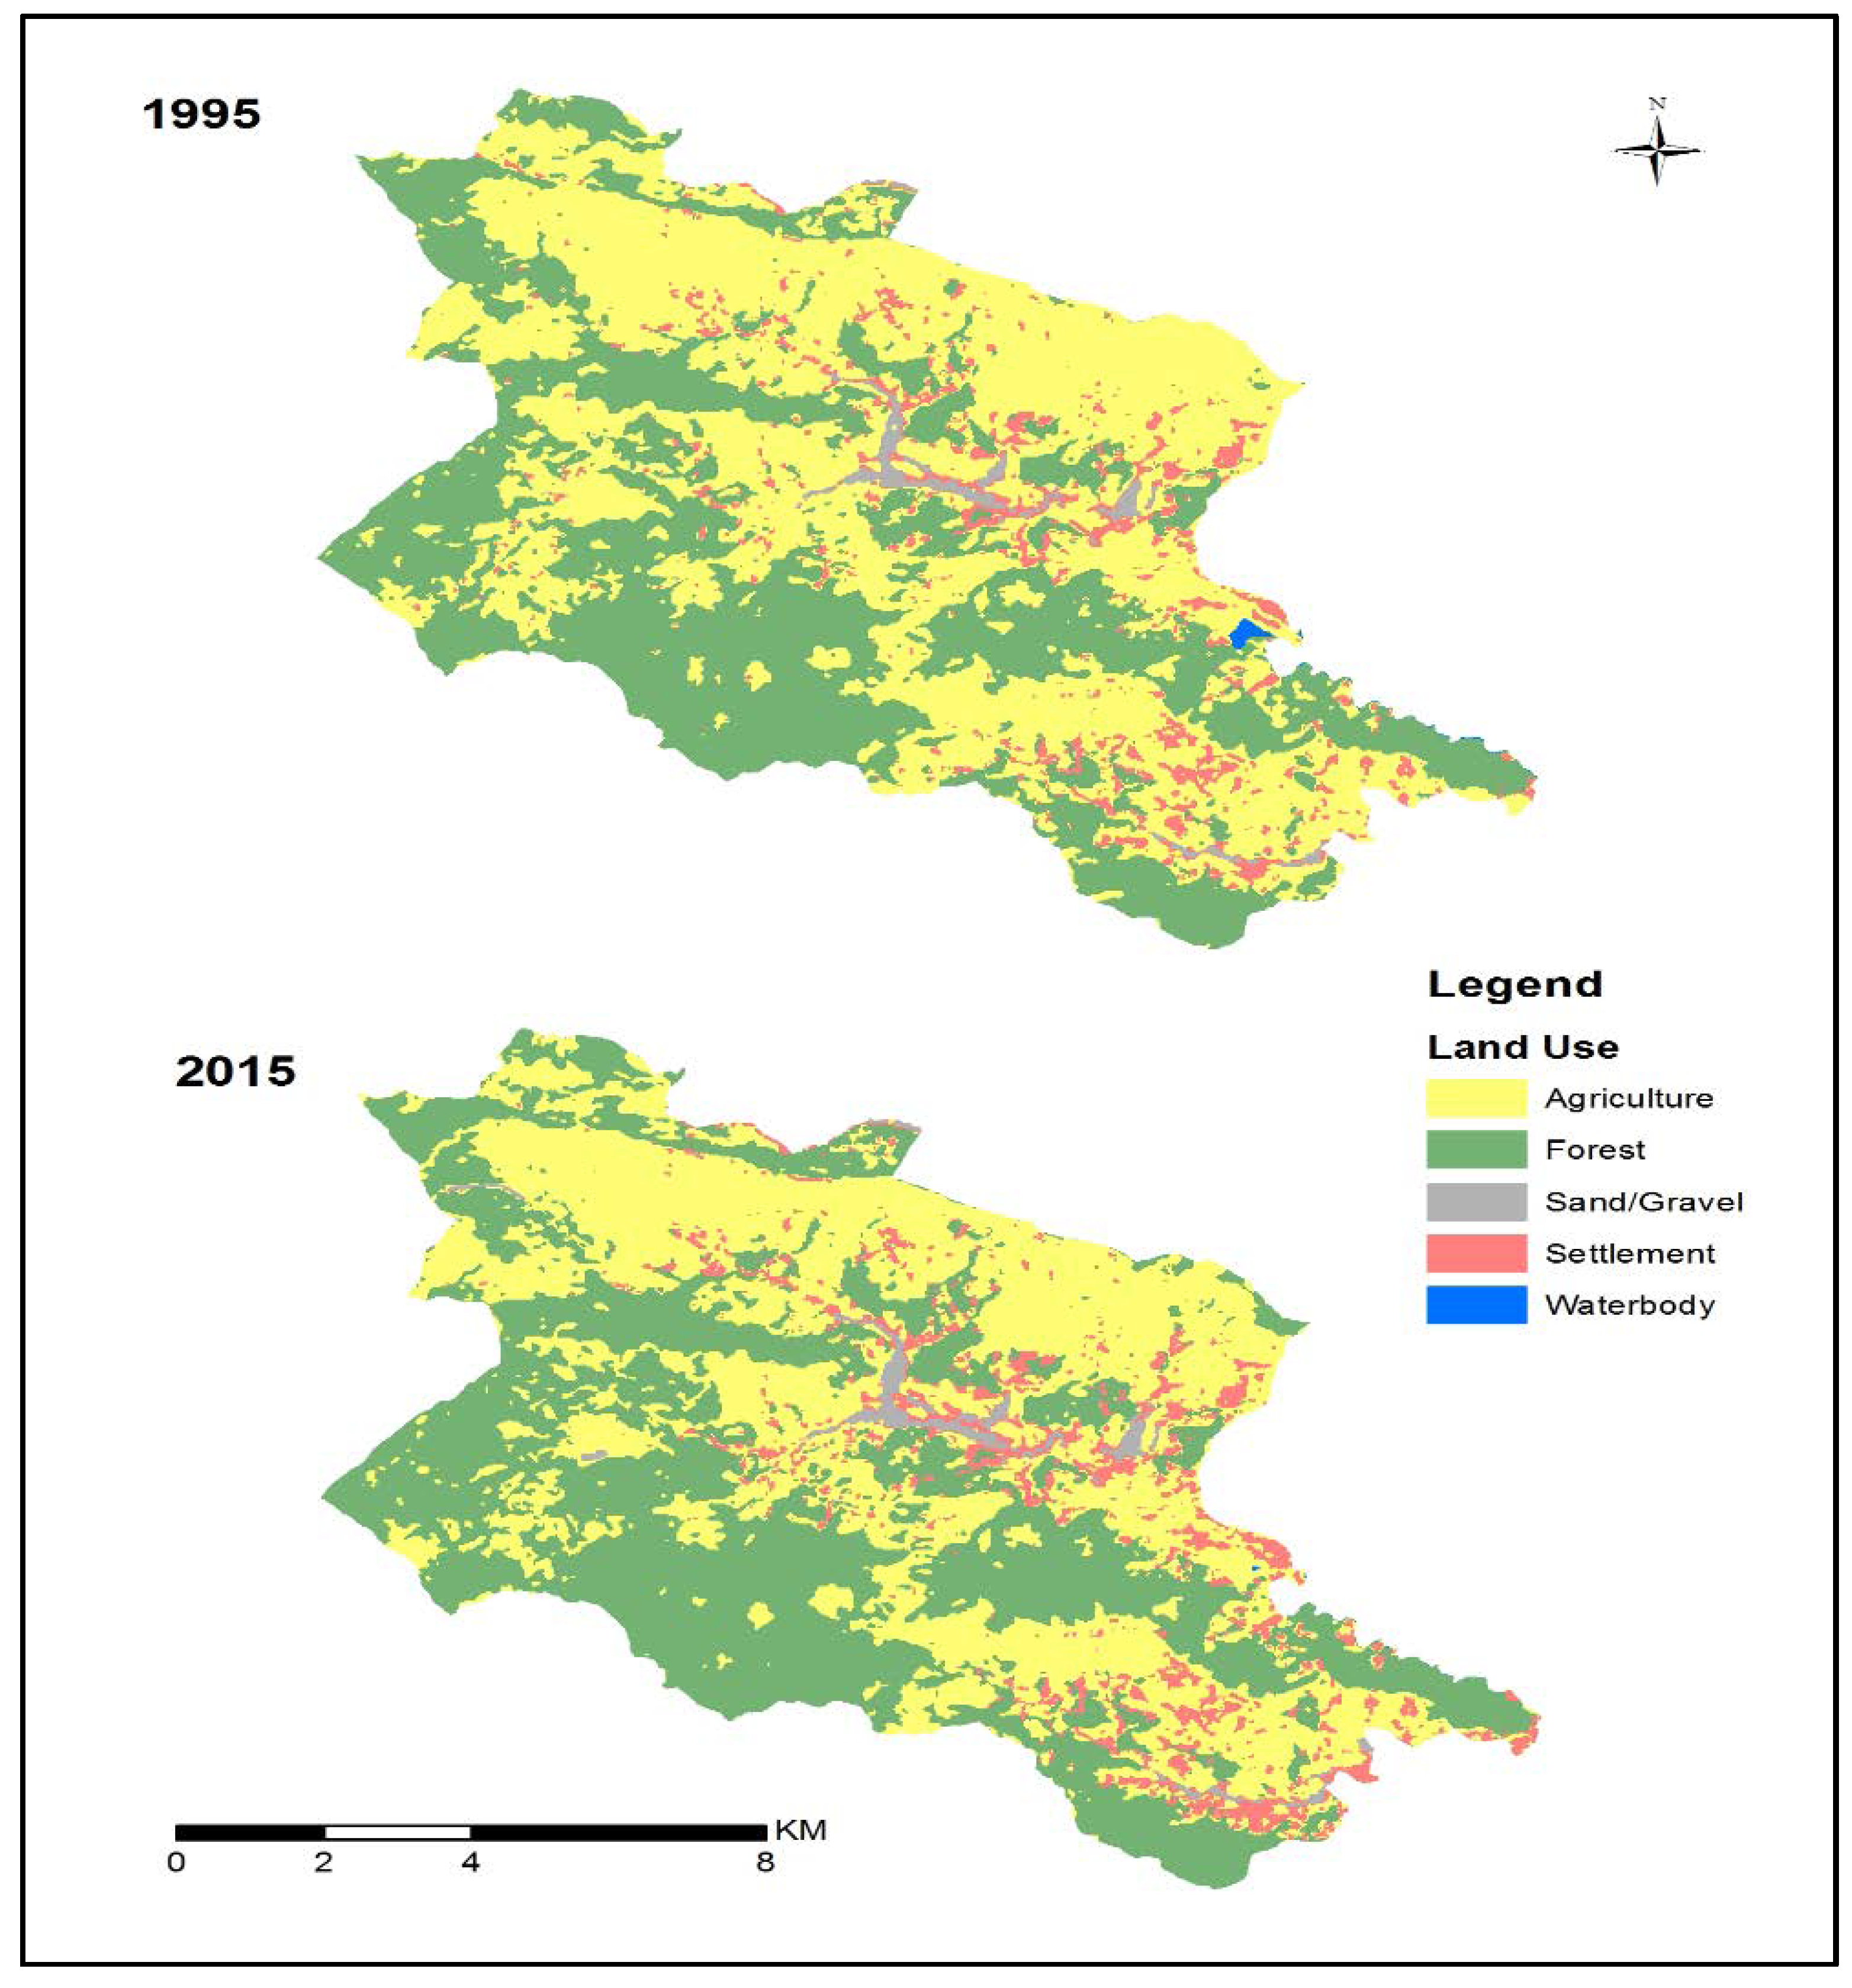
Land use maps of the region for 1995 and 2015 support respondents’ observations (Figure 7), and showed that forest area has increased, especially in the upland regions, while agricultural land has decreased during the same period. Similarly, settlement in the upland regions decreased slightly but increased in the lowland, leading to an increase in the overall area under settlement.
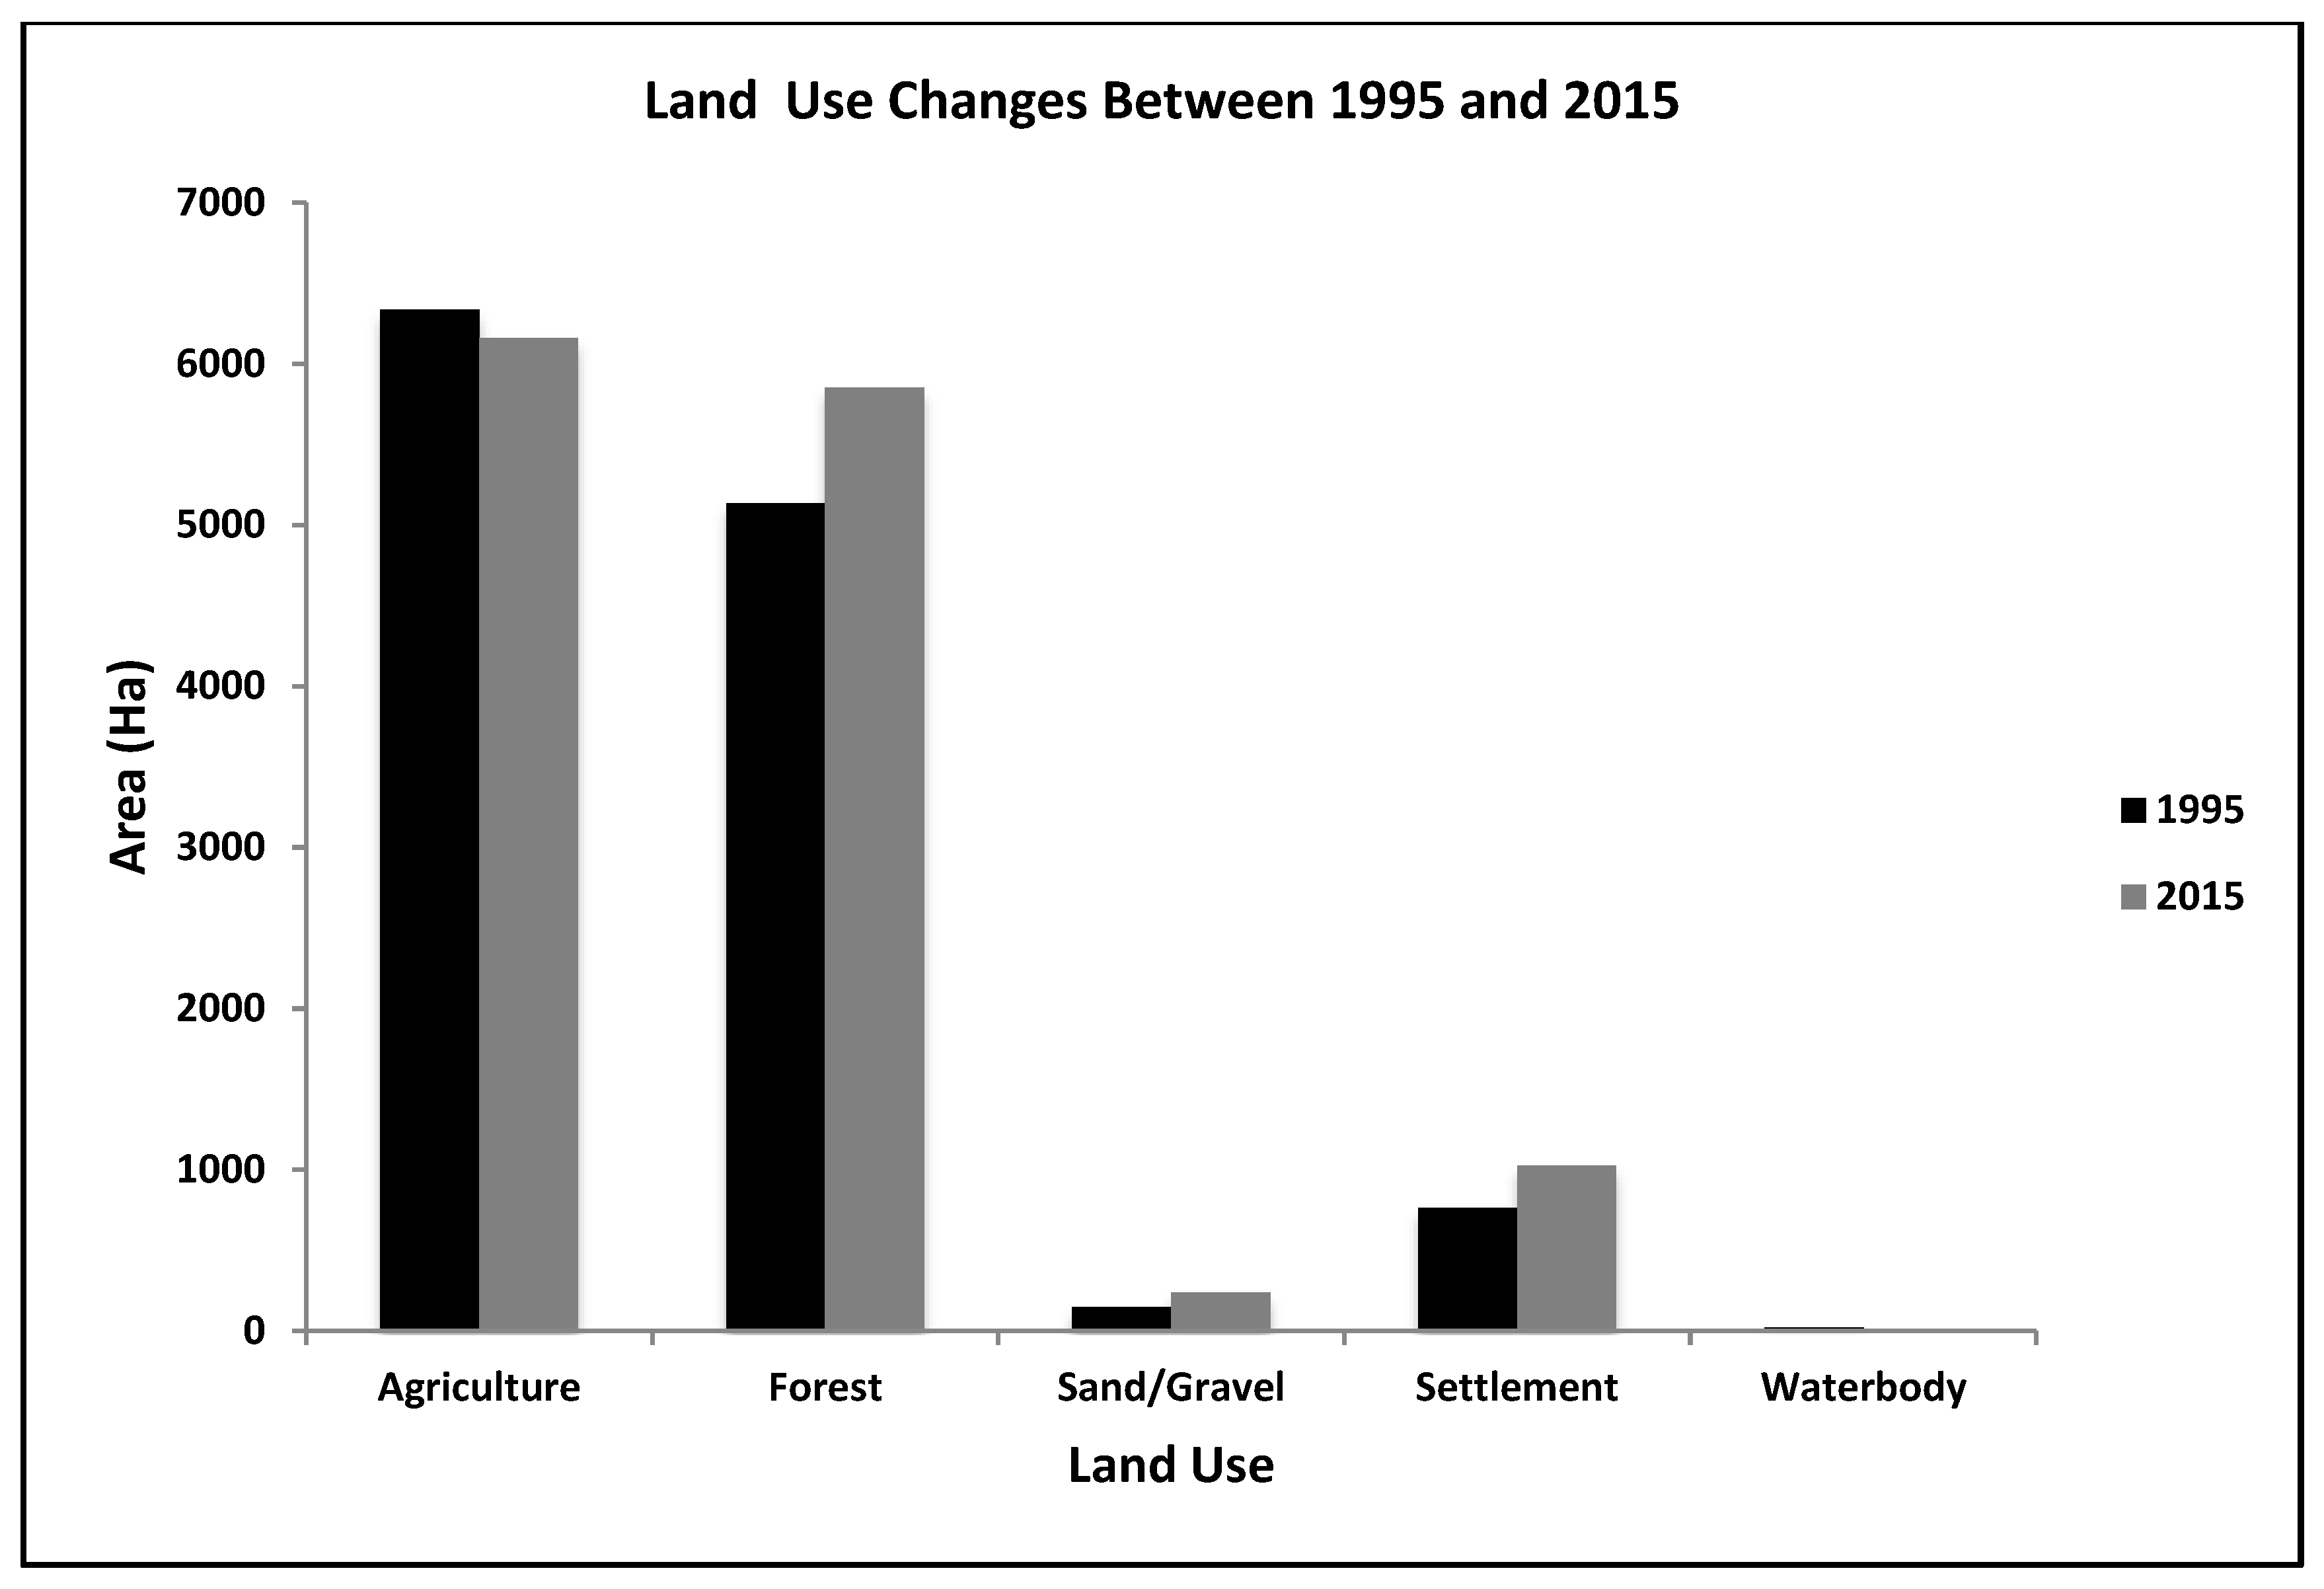
Changes in land use pattern data (Figure 8) indicate that the agriculture area decreased by a small amount and changes in sand and/or gravel and water body appear to be negligible.
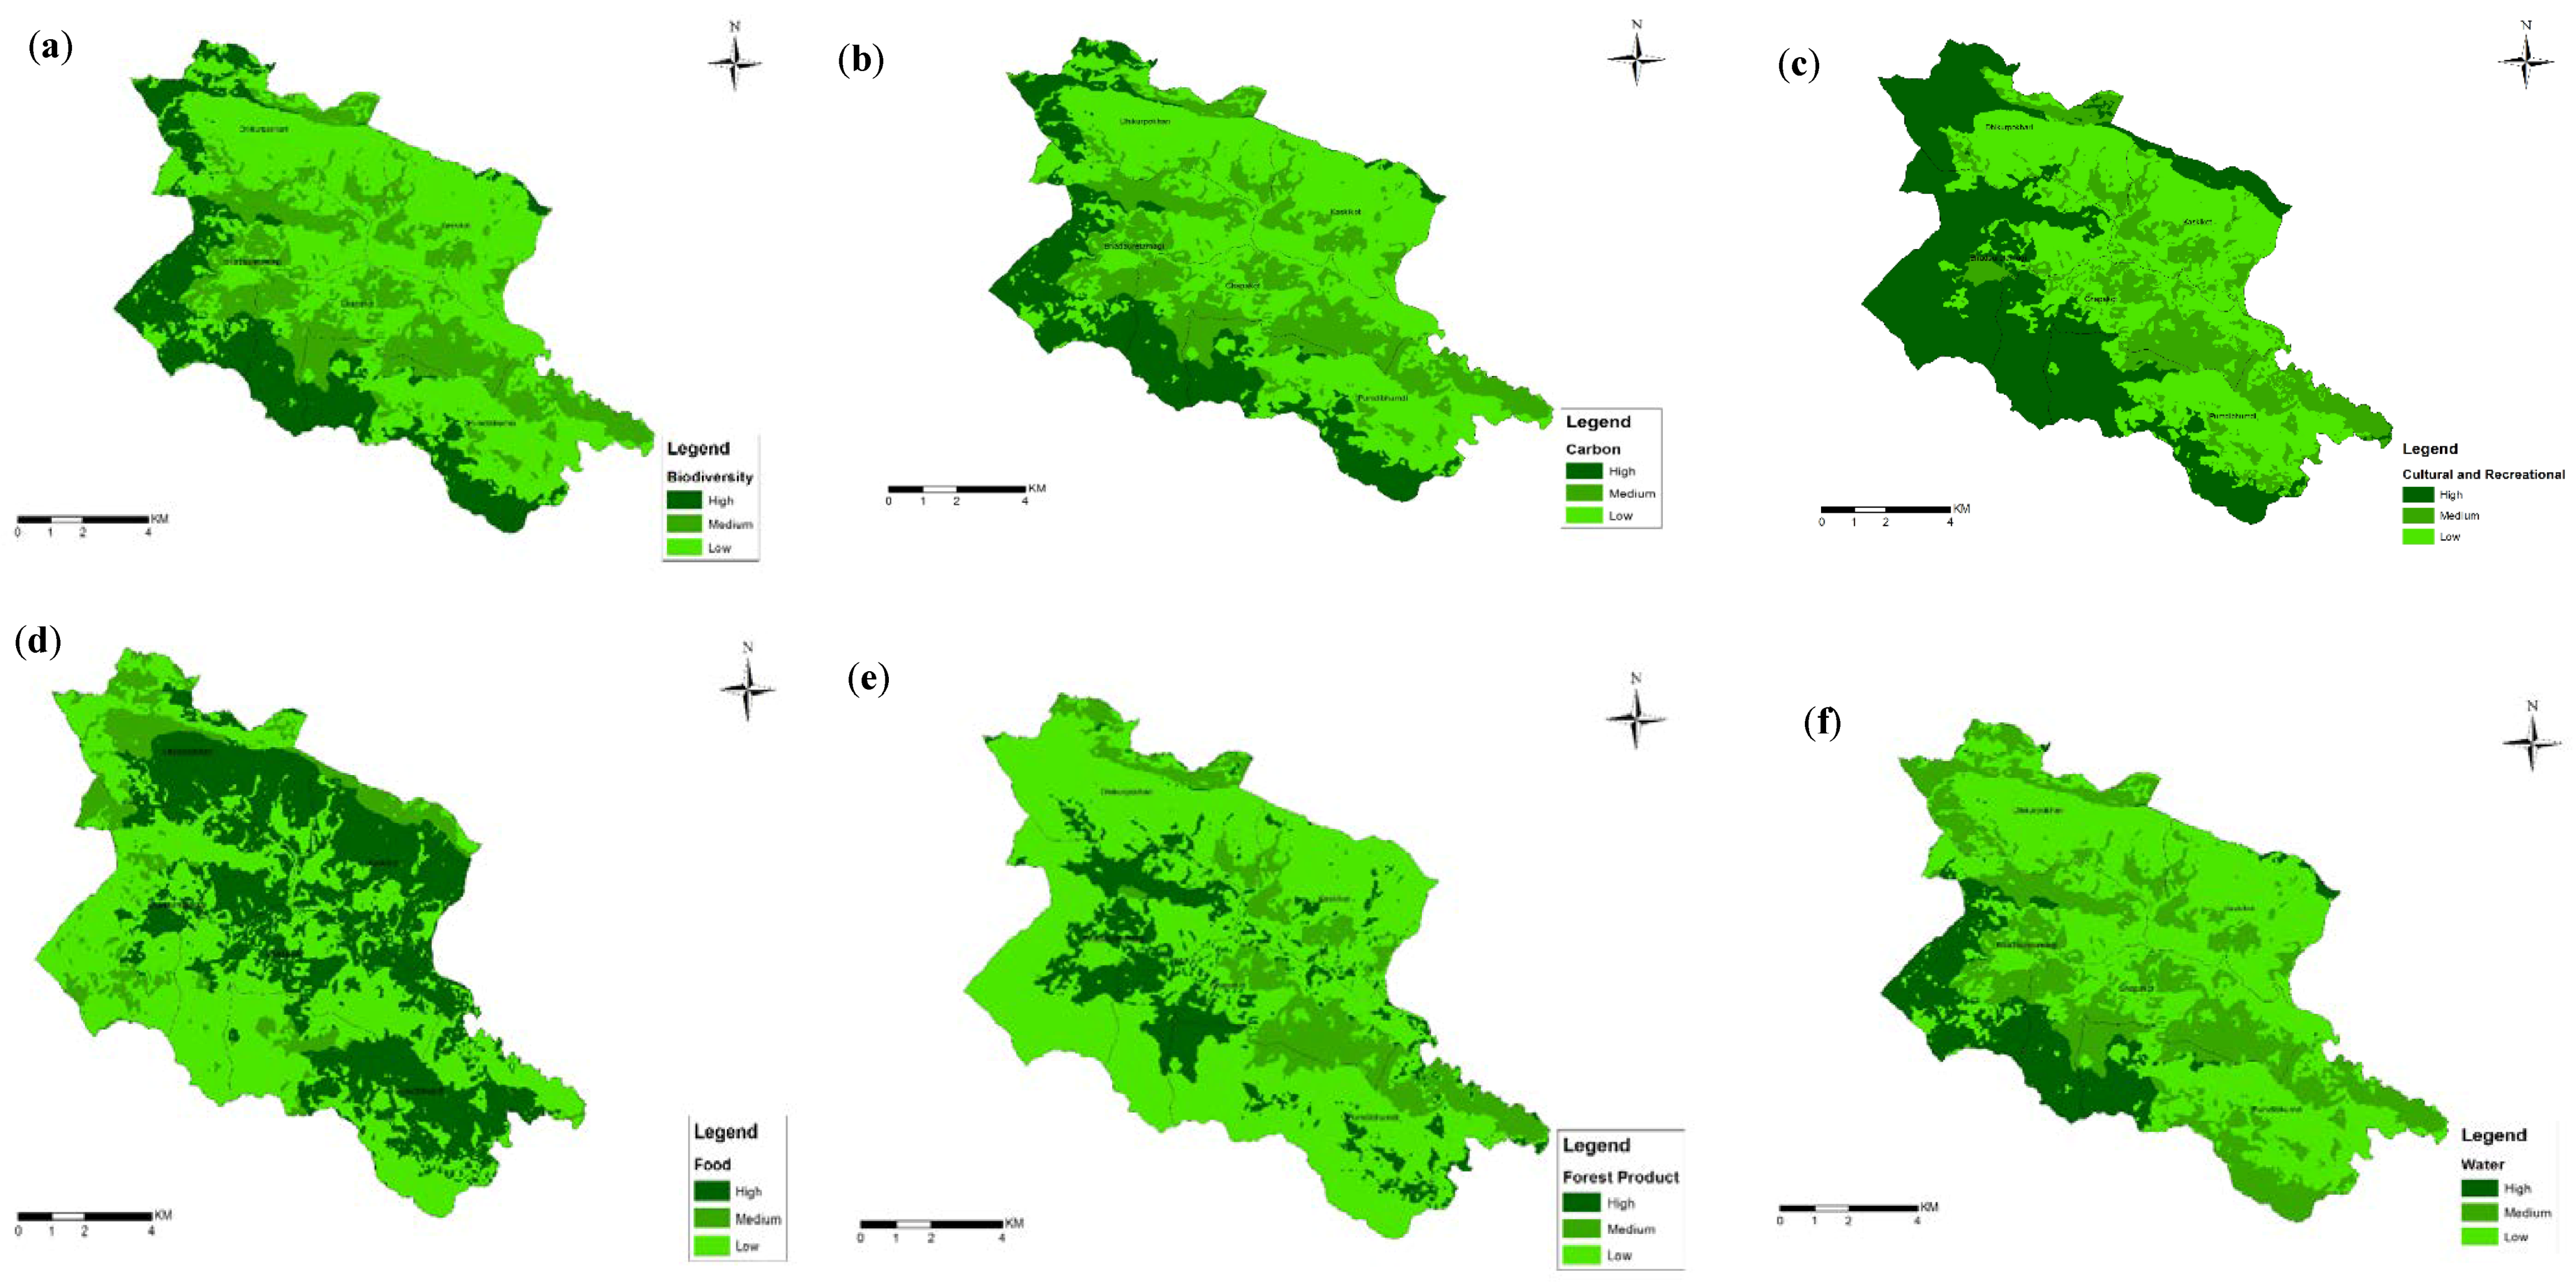
Changes in land use during the last 20 years likely reflect changes in ES. Mapping of major ES show that the protected forest in the upland region has high biodiversity, carbon sequestration and water resource services, respectively (Figure 9a,b,f), whereas the production landscape of the middle and lower regions has significantly higher services for production of food (Figure 9d) and forest products (Figure 9e).
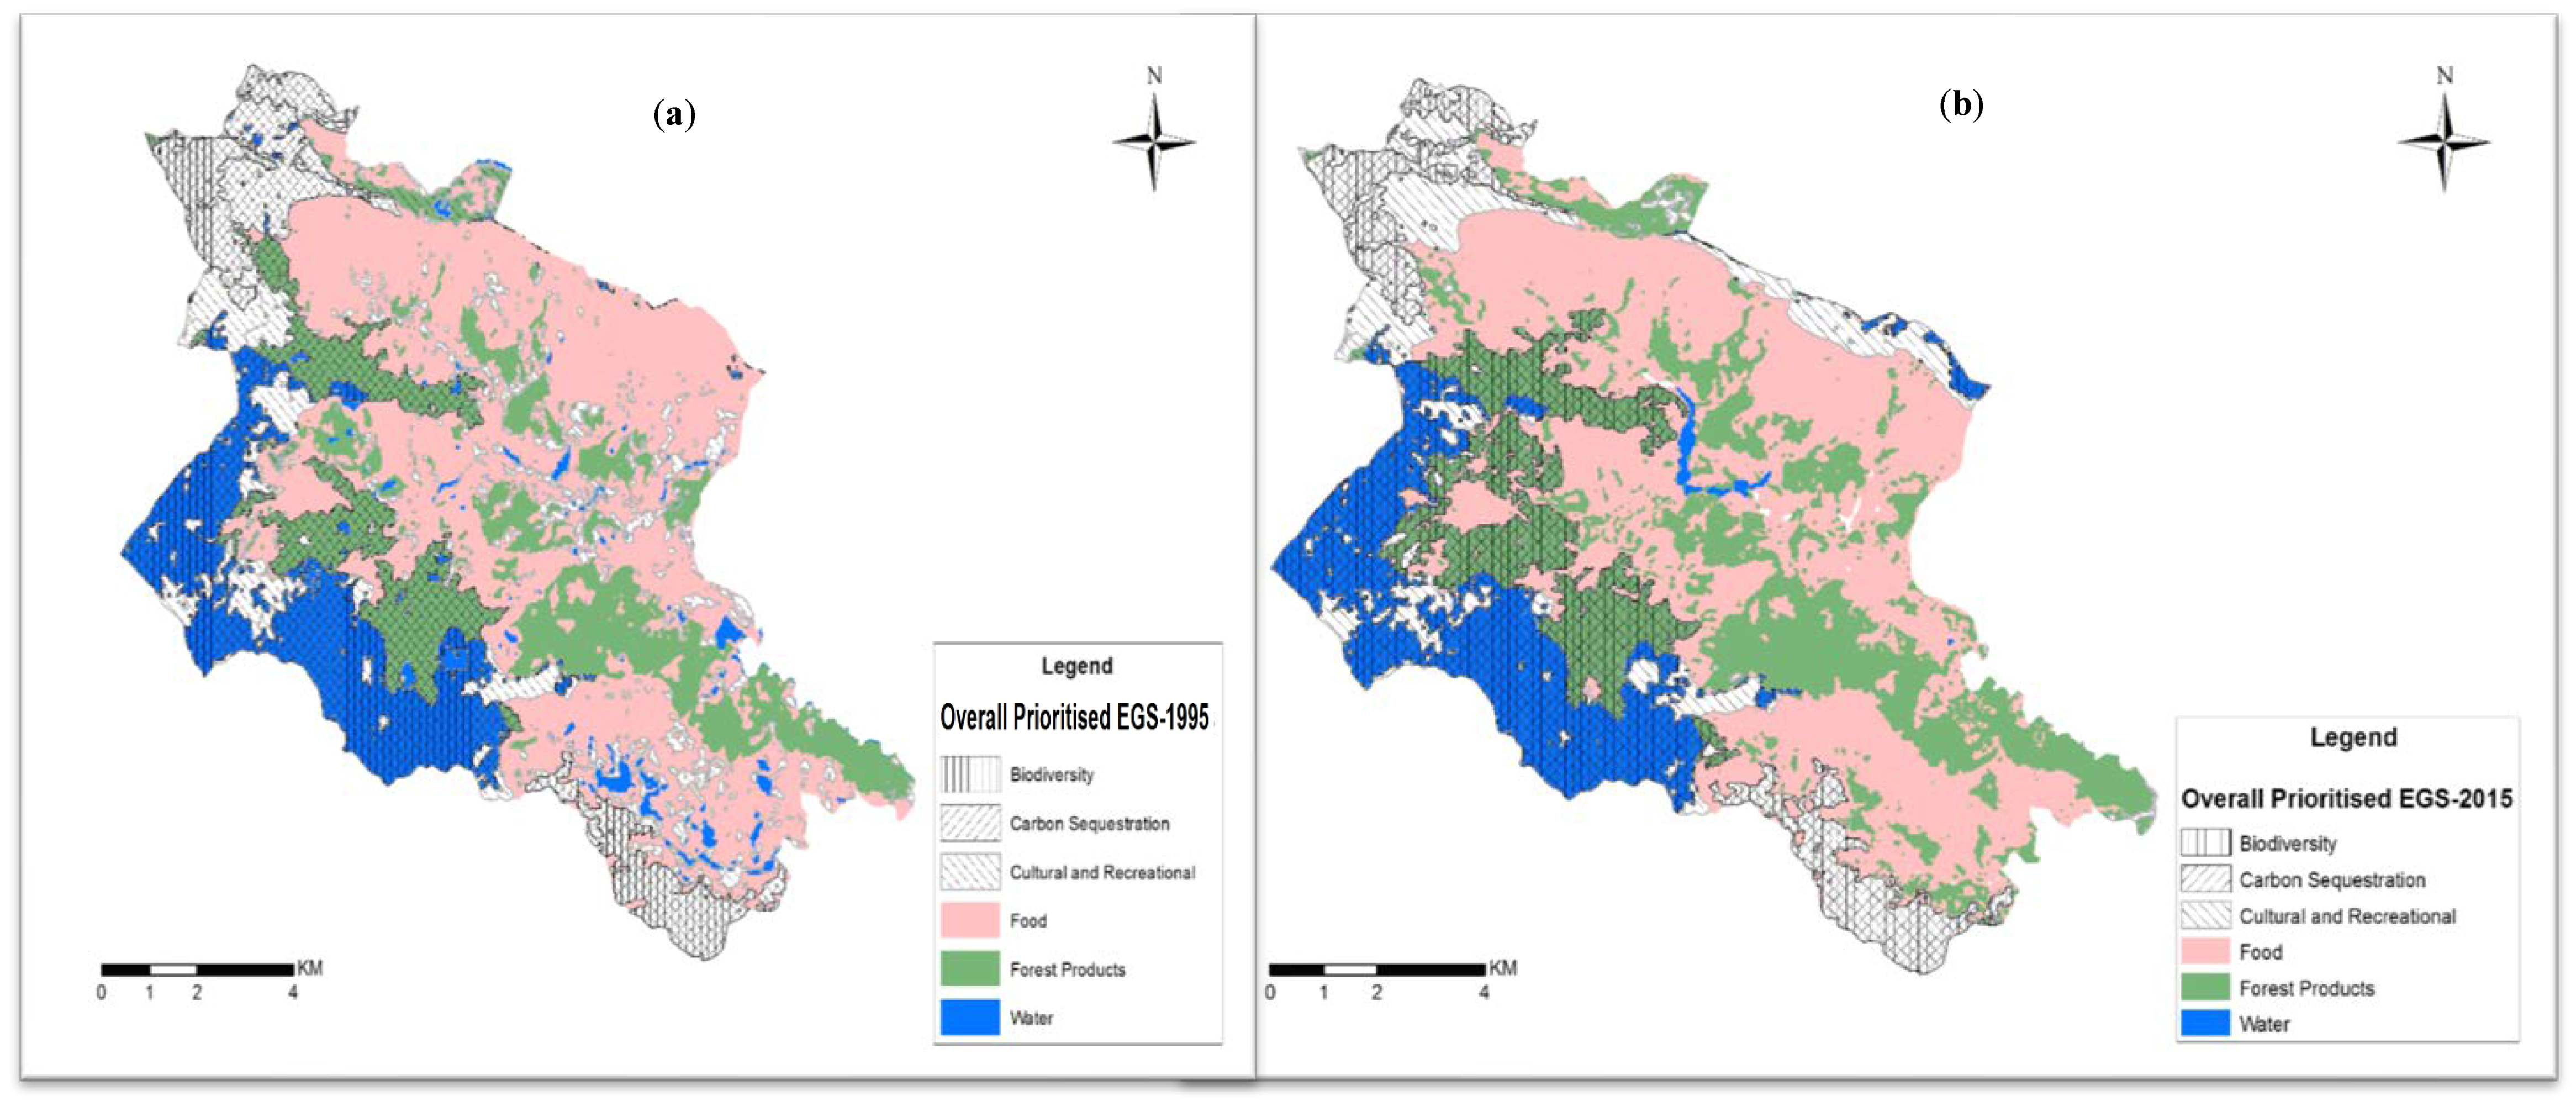
Figure 10 shows the mapping of overall changes in ES for 1995 and 2015. As for the changes in land use pattern, the changes in services from these land uses have been reflected in the overall changes in the ES map during the last 20 years (Figure 10). For example, the forest area has increased whereas agricultural land and water bodies have slightly decreased during this period.
4. Discussion
4.1. Identification of ES
We expected a range of ES from the study area to support local livelihoods and maintain ecosystem processes in the region because of the distinct altitudinal and climatic variation from the lowland to the upland region [19]. Consistent with these expectations, we identified thirty-seven ES ranging from provisioning services, through regulating to cultural and supporting services. These results are comparable with other findings [5,12,33,34]. For instance, Paudyal et al. [5] identified nineteen ES from the Dolakha district of the high mountain region of Nepal, Burkhard et al. [12] identified twenty-two ES in the Leipzig-Halle case study area in Germany, Vihervaara et al. [34] identified twenty seven ES from the Finnish Forest Lapland in Finland, Koto et al. [33] identified seventeen ES from the Karavasta lagoon of coastal habitat in Albania, and Baral et al. [35] identified twelve ES for the sub-catchment G8, Lower Glenelg basin Australia. Our ES are comparatively higher in number, which might be due to the mosaic of farmland, production forest and conservation areas within the landscape. Interestingly, these services not only benefit the local people, but are also of importance to other regions. For instance, provisioning services such as food, timber, firewood, forage, local medicine are used by local people, whereas the benefits from regulation of climate, air, water and protection from natural hazards go well beyond the local level and people in the downstream region and beyond also benefit, which is in congruent with the finding of Paudyal et al. [5].
Our results suggest that these provisioning, regulating and cultural services contribute to human well-being in the region through material benefits, health and security and social relation components of the society. For example, food from farmland and forest, water from the nearby forest sources, firewood for domestic energy and fodder for their livestock are the most used ES as a material benefit for livelihoods and human well-being at the local level. This might be the reason why more than 90% of the respondents identified provisioning services such as food, water, fuel wood, and fodder as contributing directly to their livelihoods. Van Oort et al. [3] also found similar results from the Koshi Hill of Nepal. Similarly, cultural services especially ecotourism as a result of well-managed landscapes, reference [36] is also increasingly recognized as an alternative source of livelihood in the region. Similarly, it would also benefit both local people and foreign tourists, broadening the scope and benefit of cultural services from a local to global level [37]. Cultural values of the region have also contributed to maintaining social cohesion. On the other hand, regulating services recognized by respondents were also found to contribute to human well-being as ES from forest and agro-ecosystem provides health benefits such as fresh air, water, and also providing nutrients to agriculture land, while protecting farm and settlement from natural hazards such as landslides, and floods [38,39].
We identified all the ES and their potential contributions to human well-being similarly to the components of the MEA framework primarily based on the perceptions of the respondents through interviews and FGD. We did not quantify ES, and as a result, the availability of ES is still unclear. Moreover, we do not know how much of these services are required to support local livelihoods and the maintenance of ecosystems. We also found some of the ES were related to each other, such as religious services, cultural services and spiritual services, making it difficult to identify each of them as a single service or a combination. Further research is required to assess the ES in a quantitative manner and look into the relationship between how much of each of these services is required to contribute to human well-being and quality of life even among different well-being and ethnic groups in the region. Nonetheless, our results provide a broad overview of the major ES, their distribution and contribution to the various components of human well-being and livelihood support with the use of readily available data from Landsat images and the opinions of local people and experts, as recommended by Baral [35] and Baral et al. [30] especially in data-poor regions such as Nepal. The overall identification of the ES can help prioritize ES for the better management of important services from the region.
4.2. Prioritization of ES
Prioritization of major ES is crucial for efficient resource management given the availability of limited manpower and resources to manage the ES in a particular location. Therefore, priorities of available ES depend upon the particular interests of stakeholders, features of the ecosystem in question, and the management regime [40]. Our results show that prioritization of ES from PMER differs among different stakeholders, and even among the same stakeholders; priorities differ among geographic locations within the study area. Differences in priority among forest managers and forest users are in agreement with the finding from Paudyal et al. [5], who found that forest managers were more interested in regulating services such as biodiversity conservation and water catchment protection, whereas forest users are more interested in provisioning services associated with food, water and forest products. This might be due to livelihood context, forest users, for example, are more dependent on provisioning ES for their livelihoods, whereas forest managers are assigned to manage the overall ecosystem. Therefore, they might believe if the overall ecosystem were managed well, it would also ensure provisioning services for the local communities, along with regulating and cultural services, and ultimately serve human well-being in a sustainable manner.
It is interesting to note that field-based forest managers put more emphasis on the role of ES to support the livelihoods of local communities through provisioning services, than senior officials engaged in policy and decision-making. Similarly, the NGO representative put more emphasis on supporting livelihoods of local communities through provisioning services, while taking due consideration of the important role that regulating and cultural services play. As forest managers and NGOs work closely with local communities they put higher priority on the role of ES for local livelihoods and well-being, with due consideration for the management of ecosystems to ensure regulating and other services.
Prioritization of ES among local communities, especially local forest users, was reflective of the geographic context and predominant land use regime of each region. For instance, respondents from lower and midland regions, containing production landscapes, prioritize ES from a food production. It is interesting to note that respondents from other regions, especially the lowlands, value the ES of the upland region in terms of provision of water, ecotourism, landscape and aesthetic values, biodiversity and wildlife habitat, and protection from natural hazards more than the respondents of the upland region. This could be because they have fewer of such resources in their region or they might be fearful that if these resources are depleted their livelihoods would be negatively affected, as most of them are reliant on water sources from the upland region. Along with differences in priorities between different stakeholders and even among the same stakeholders in different geographic locations, our study also found that within the same community, there are differences in preferences of ES among different sections of society. This was also found by Paudyal et al. [5]. Differences in priorities existed between the marginalized groups (e.g., blacksmiths, who depend on forest for coal) and elite members of forest users, rich and poor, high caste and lower caste, male and female, indigenous and non-indigenous, and farmers and entrepreneurs. For example, females were found to be more interested in forage, fodder, firewood, and food, as they are supposed to manage these goods on a daily basis within their family, but male members were found more interested in timber and cash crops, from which they can earn money. Similarly, farmers, poor and marginalized communities prioritize provisioning services for the material benefits of food, water and forest products, whereas elite groups and people with entrepreneurial backgrounds especially put higher priority on landscape and aesthetic values, regulating services and promoting ecotourism.
The differences in the prioritization of ES by different stakeholders within and among regions might create tradeoffs and synergies in managing these services. For Example, Pandey et al. [41] reported a possible reduction in species richness with increasing the carbon stock. Even within a carbon stock, an average soil organic carbon and biomass carbon was found to be greater in mixed species with dense canopy forests than sparse ones in Nepal [42,43] and in Australia [44]. Managing forest ES therefore could contribute in carbon benefits while securing biodiversity conservation. This requires an incentive mechanism for maintaining species richness together with carbon stock [41] while providing social safeguards with increased participation of indigenous people, women and the poor in REDD+ process especially in community-based forest management [45]. However, our study did not look into the linkage of ES assessment with REDD+ and tradeoffs and synergies among ES. Therefore, further research is needed to gain insight into these issues.
The results of this study suggest that there is general support for obtaining synergy in managing ES in the PMER from a landscape zoning context. A landscape approach should reduce negative tradeoffs amongst ES at finer scales. For this, the upland region, with its high potential for biodiversity, water sources, aesthetic and cultural values should be the focus of conservation-oriented management. This will help communities in the upland region, but also the people in downstream regions and beyond from these services. For example, Panchase peak is the source of water for both upstream and downstream regions and also serves as a main feeder of Phewa lake in Pokhara, a famous tourist destination. Similarly, the midland region of the production landscape should be managed for the production of food, fruits, livestock and forest products, providing material benefits for human well-being in the region including downstream communities. This section of the landscape also represents the typical agroforestry practices with an inextricable linkage between farming, livestock, forests and human beings [46]. On the other hand, the agricultural land down in the valley bottom should be managed for the production of food and vegetables and the forest land surrounding the farmland should be managed as a community managed forest to fulfill the requirements of the forest products at the same time. This region then can contribute to and even fulfill the food requirements of both upland and lowland regions as well. Interestingly, people in the upland regions possess irrigated farmland, known as “khetland”, used especially for the production of rice. If we manage the ES from three regions in a holistic manner, trade-offs of prioritized ES among forest managers and forest users can occur across space rather than within space.
Though several studies identified the potential danger of prioritizing landscapes for managing a single ecosystem commodity on diminishing other services and undermining overall ecosystem resilience [29,31,47,48,49,50,51,52], our findings and suggestions could address these concerns by managing different ES priorities in different zones within the landscapes. To facilitate zoning, the mapping of ES can help managers and policy makers to spatially identify which areas of high prioritized ES should be maintained [53,54] and enable better policy and implementation in the field. This will further help decision makers assess the trade-offs and synergies among multiple ES and prioritize areas that meet multiple conservation goals [10,55,56,57,58].
4.3. Mapping of ES
Mapping temporal and spatial changes in land use and associated ES is a powerful tool for supporting decision-making for ecosystem management and landscape planning [11,12]. Our results support the finding of Baral et al. [11] that land use—land cover changes influence the provision of ecosystem services. We found that during the last 20 years, land use patterns, especially agriculture and forest land, have undergone change. In contrast to the global trend of increasing agricultural land at the expense of forest land [59], our results show that forest area increased, which is in agreement with the findings from assessments by Niraula et al. [60] and Paudyal et al. [5] in Dolakha, Nepal. However, the trend of changes in land use pattern is also site specific. For example, though the forest area seems to have increased as a whole, especially in the upland region, the forest area in the lower belt has remained quite stable even though in some locations agricultural land has increased.
Use of participatory GIS was useful for mapping of the major ES for the PMER landscape. As the participatory approaches incorporate most of the stakeholders including experts and local users [61,62,63], reflecting the heterogeneity of human desires, preferences and values [64] regarding ES, the mapping process and the decision based on the findings also create broad ownership concerning managing the ES [10,65]. Similarly, the participatory approach was comparatively easy and relatively fast [10] as it used readily and freely available Landsat Images, and the opinions from experts and local users. For this reason, it is appropriate in data-poor regions [5,30,66], which is reflective of our study site.
The counter argument to our approach is it contains a high level of subjectivity in assessment and mapping, and lacks quantitative estimates of ES [10]. For instance, prioritization has also used subjective judgment of the respondents on which they assigned each of the major ES in their land use pattern with a value of high, medium and low (or no) value based on the availability of services. Furthermore, mapping of land use patterns and prioritized ES in the region was based on the satellite image interpretation. The relationship between land cover maps and ES remains untested in the region which likely leads to increased uncertainty in estimates [10]. Similarly, appropriate selection of stakeholders is also another major challenge, because it is equally time and cost intensive and the findings are difficult to upscale and generalize as they are site-specific in most cases [64]. Nonetheless, these maps provide an overview of the landscape and associated ES, and can help decision makers manage ES and contribute to human well-being in the region.
Overall, the assessment of ES through identification, prioritization, and mapping can help policy makers, forest managers and forest users improve the management of ES in the landscape. This could, for example, inform policy makers about the status of existing ES and priority of these services among different stakeholders including local communities. Further, it can help in the preparation of comprehensive policies that aim to accommodate the management of the ES while considering the needs and priorities of different stakeholders simultaneously. This will benefit managers who implement policies in the field, ensuring that active engagement of local users in managing ES. Similarly, international and national NGOs, including local environmental organizations, can support the national government and local communities in preparing and implementing relevant policies and programs in the field.
5. Conclusions
Our study was able to identify, prioritize, and map key ES in the Panchase Mountain Ecological Regions (PMER). The study reveals that the PMER is rich in ES with 37 ES. Though rich in ES, availability and prioritization of these services were found to be different from one region to another and among the stakeholders as well. However, almost all agreed on the importance of the prioritization of the available ES from the perspective of proper landscape planning and management of critical ES while enabling the utilization of abundant services. The variation in prioritization of ES makes the proper planning and management of them more complex. However, participatory mapping in a landscape context of ES shows that ES management could foster synergies between ES and potentially avoid trade-offs between community groups with different interests. Therefore, the identification, prioritization and mapping of the available ES in any particular region are important in order to have effective management of ES and optimum benefit of the management efforts at the local and national levels.
Author Contributions
S.A. wrote the paper with significant contribution by H.B. and C.R.N. S.A. identified the research question and designed the study with guidance from H.B. and C.R.N.
Funding
This research was supported by the Australia Award of the Department of Foreign Affairs and Trade (DFAT) Australia, and the University of Melbourne, Australia. The study was conducted with ethics approval from the Faculty of Science, Human Ethics Advisory Group, the University of Melbourne (Ethics ID: 1543765).
Acknowledgments
The authors would like to acknowledge the anonymous reviewers whose comments on the earlier draft helped us improve the manuscript. We would also like to thank Milan Dhungana for his support in mapping.
Conflicts of Interest
The authors declare no conflict of interest.
References
- Bhatta, L.D.; Van Oort, B.E.H.; Stork, N.E.; Baral, H. Ecosystem services and livelihoods in a changing climate: Understanding local adaptations in the Upper Koshi, Nepal. Int. J. Biodivers. Sci. Ecosyst. Serv. Manag. 2015, 11, 145–155. [Google Scholar] [CrossRef] [Green Version]
- Birch, J.C.; Thapa, I.; Balmford, A.; Bradbury, R.B.; Brown, C.; Butchart, S.H.; Gurung, H.; Hughes, F.M.; Mulligan, M.; Pandeya, B. What benefits do community forests provide, and to whom? A rapid assessment of ecosystem services from a Himalayan forest, Nepal. Ecosyst. Serv. 2014, 8, 118–127. [Google Scholar] [CrossRef] [Green Version]
- Van Oort, B.; Bhatta, L.D.; Baral, H.; Rai, R.K.; Dhakal, M.; Rucevska, I.; Adhikari, R. Assessing community values to support mapping of ecosystem services in the Koshi river basin, Nepal. Ecosyst. Serv. 2015, 13, 70–80. [Google Scholar] [CrossRef]
- Adhikari, S.; Baral, H.; Nitschke, C. Adaptation to Climate Change in Panchase Mountain Ecological Regions of Nepal. Environments 2018, 5, 42. [Google Scholar] [CrossRef]
- Paudyal, K.; Baral, H.; Burkhard, B.; Bhandari, S.P.; Keenan, R.J. Participatory assessment and mapping of ecosystem services in a data-poor region: Case study of community-managed forests in central Nepal. Ecosyst. Serv. 2015, 13, 81–92. [Google Scholar] [CrossRef]
- Pan, Y.; Marshall, S.; Maltby, L. Prioritising ecosystem services in Chinese rural and urban communities. Ecosyst. Serv. 2016, 21, 1–5. [Google Scholar] [CrossRef]
- Albert, C.; Galler, C.; Hermes, J.; Neuendorf, F.; Von Haaren, C.; Lovett, A. Applying ecosystem services indicators in landscape planning and management: The ES-in-Planning framework. Ecol. Indic. 2016, 61, 100–113. [Google Scholar] [CrossRef]
- Inostroza, L.; König, H.J.; Pickard, B.; Zhen, L. Putting ecosystem services into practice: Trade-off assessment tools, indicators and decision support systems. Ecosyst. Serv. 2017, 26, 303–305. [Google Scholar] [CrossRef]
- Spash, C.L. Bulldozing biodiversity: The economics of offsets and trading-in Nature. Biol. Conserv. 2015, 192, 541–551. [Google Scholar] [CrossRef]
- Martínez-Harms, M.J.; Balvanera, P. Methods for mapping ecosystem service supply: A review. Int. J. Biodivers. Sci. Ecosyst. Serv. Manag. 2012, 8, 17–25. [Google Scholar] [CrossRef]
- Baral, H.; Keenan, R.J.; Stork, N.E.; Kasel, S. Measuring and managing ecosystem goods and services in changing landscapes: A south-east Australian perspective. J. Environ. Plan. Manag. 2014, 57, 961–983. [Google Scholar] [CrossRef]
- Burkhard, B.; Kroll, F.; Nedkov, S.; Müller, F. Mapping ecosystem service supply, demand and budgets. Ecol. Indic. 2012, 21, 17–29. [Google Scholar] [CrossRef]
- Galicia, L.; Zarco-Arista, A.E. Multiple ecosystem services, possible trade-offs and synergies in a temperate forest ecosystem in Mexico: a review. Int. J. Biodivers. Sci. Ecosyst. Serv. Manag. 2014, 10, 275–288. [Google Scholar] [CrossRef]
- Maes, J.; Egoh, B.; Willemen, L.; Liquete, C.; Vihervaara, P.; Schägner, J.P.; Grizzetti, B.; Drakou, E.G.; La Notte, A.; Zulian, G.; et al. Mapping ecosystem services for policy support and decision making in the European Union. Ecosyst. Serv. 2012, 1, 31–39. [Google Scholar] [CrossRef]
- Peh, K.S.H.; Thapa, I.; Basnyat, M.; Balmford, A.; Bhattarai, G.P.; Bradbury, R.B.; Brown, C.; Butchart, S.H.; Dhakal, M.; Gurung, H.; et al. Synergies between biodiversity conservation and ecosystem service provision: Lessons on integrated ecosystem service valuation from a Himalayan protected area, Nepal. Ecosyst. Serv. 2016, 22, 359–369. [Google Scholar] [CrossRef] [Green Version]
- Baral, H.; Jaung, W.; Bhatta, L.D.; Phuntsho, S.; Sharma, S.; Paudyal, K.; Zarandian, A.; Sears, R.; Sharma, R.; Dorji, T.; et al. Approaches and Tools for Assessing Mountain Forest Ecosystem Services; Centre for International Forestry Research: Bogor, Indonesia, 2018. [Google Scholar]
- Pandey, S.S.; Cockfield, G.; Maraseni, T.N. Assessing the roles of community forestry in climate change mitigation and adaptation: A case study from Nepal. For. Ecol. Manag. 2016, 360, 400–407. [Google Scholar] [CrossRef]
- Neugarten, R.A.; Langhammer, P.F.; Osipova, E.; Bagstad, K.J.; Bhagabati, N.; Butchart, S.H.; Dudley, N.; Elliott, V.; Gerber, L.R.; Arrellano, C.G.; et al. Tools for Measuring, Modelling, and Valuing Ecosystem Services: Guidance for Key Biodiversity Areas, Natural World Heritage Sites, and Protected Areas; IUCN: Gland, Switzerland, 2018. [Google Scholar]
- Shah, R.; Adhikari, A.; Khanal, R. Scoping of Piloting Ecosystem Based Adaptation in Panchase A Report; IUCN Nepal: Lalitpur, Nepal, 2012. [Google Scholar]
- Bhattarai, K.R.; Måren, I.E.; Chaudhary, R.P. Medicinal plants and plant based knowledge in the Panchase region, Middle Hills of Nepal in the Himalayas. Banko Janakari 2011, 21, 31–39. [Google Scholar]
- Baral, S.; Adhikari, A.; Khanal, R.; Basnyat, B. Building Resilience of Forest Ecosystem in the Panchase Area; IUCN: Lalitpur, Nepal, 2014. [Google Scholar]
- WWF Nepal. Chitwan Annapurna Landscape (CHAL): A Rapid Assessment; World Wildlife Fund Nepal: Kathmandu, Nepal, 2013. [Google Scholar]
- Klain, S.C.; Satterfield, T.A.; Chan, K.M. What matters and why? Ecosystem services and their bundled qualities. Ecol. Econ. 2014, 107, 310–320. [Google Scholar] [CrossRef]
- Hennink, M.M. Focus Group Discussions; Oxford University Press: Oxford, UK, 2013. [Google Scholar]
- Monique, H.; Hutter, I.; Bailey, A. Qualitative Research Methods; SAGE Publications: Thousand Oaks, CA, USA, 2010. [Google Scholar]
- Azeem, M.; Salfi, N.A.; Dogar, A. Usage of NVivo software for qualitative data analysis. Acad. Res. Int. 2012, 2, 262–266. [Google Scholar]
- Dunn, C.E. Participatory GIS—A people’s GIS? Prog. Hum. Geogr. 2007, 31, 616–637. [Google Scholar] [CrossRef]
- Elwood, S. Critical issues in participatory GIS: Deconstructions, reconstructions, and new research directions. Trans. GIS 2006, 10, 693–708. [Google Scholar] [CrossRef]
- MEA. Ecosystems and Human Well-Bein; Island Press: Washington, DC, USA, 2005. [Google Scholar]
- Baral, H.; Keenan, R.J.; Fox, J.C.; Stork, N.E.; Kasel, S. Spatial assessment of ecosystem goods and services in complex production landscapes: A case study from south-eastern Australia. Ecol. Complex. 2013, 13, 35–45. [Google Scholar] [CrossRef]
- Bennett, E.M.; Peterson, G.D.; Gordon, L.J. Understanding relationships among multiple ecosystem services. Ecol. Lett. 2009, 12, 1394–1404. [Google Scholar] [CrossRef] [PubMed] [Green Version]
- Dobbs, C.; Kendal, D.; Nitschke, C.R. Multiple ecosystem services and disservices of the urban forest establishing their connections with landscape structure and sociodemographics. Ecol. Indic. 2014, 43, 44–55. [Google Scholar] [CrossRef]
- Koto, R.; Bani, A.; Haxhialushi, R.; Dautaj, A. The Identification of Ecosystem Goods and Services Provided by Karavasta Lagoon. Albanian J. Agric. Sci. 2015, 14, 162–168. [Google Scholar]
- Vihervaara, P.; Kumpula, T.; Tanskanen, A.; Burkhard, B. Ecosystem services—A tool for sustainable management of human–environment systems. Case study Finnish Forest Lapland. Ecol. Complex. 2010, 7, 410–420. [Google Scholar] [CrossRef]
- Baral, H. Ecosystem Goods and Services in Production Landscapes in South-Eastern Australia. Ph.D. Thesis, The University of Melbourne, Melbourne, Australia, October 2013. [Google Scholar]
- Fleming, B.; Fleming, J.P. A watershed conservation success story in Nepal: Land use changes over 30 years. Waterlines 2009, 28, 29–46. [Google Scholar] [CrossRef]
- Nepal, S.K. Mountain ecotourism and sustainable development: Ecology, economics, and ethics. Mt. Res. Dev. 2002, 22, 104–109. [Google Scholar] [CrossRef]
- Jose, S. Agroforestry for ecosystem services and environmental benefits: an overview. Agrofor. Syst. 2009, 76, 1–10. [Google Scholar] [CrossRef]
- Swinton, S.M.; Lupi, F.; Robertson, G.P.; Hamilton, S.K. Ecosystem services and agriculture: Cultivating agricultural ecosystems for diverse benefits. Ecol. Econ. 2007, 64, 245–252. [Google Scholar] [CrossRef]
- Casalegno, S.; Bennie, J.J.; Inger, R.; Gaston, K.J. Regional Scale Prioritisation for Key Ecosystem Services, Renewable Energy Production and Urban Development. PLoS ONE 2014. [Google Scholar] [CrossRef] [PubMed]
- Pandey, S.S.; Cockfield, G.; Maraseni, T.N. Dynamics of carbon and biodiversity under REDD+ regime: A case from Nepal. Environ. Sci. Policy 2014, 38, 272–281. [Google Scholar] [CrossRef]
- Pandey, S.S.; Maraseni, T.N.; Cockfield, G. Carbon stock dynamics in different vegetation dominated community forests under REDD+: A case from Nepal. For. Ecol. Manag. 2014, 327, 40–47. [Google Scholar] [CrossRef] [Green Version]
- Maraseni, T.N.; Pandey, S.S. Can vegetation types work as an indicator of soil organic carbon? An insight from native vegetations in Nepal. Ecol. Indic. 2014, 46, 315–322. [Google Scholar] [CrossRef]
- Maraseni, T.N.; Mitchell, C. An assessment of carbon sequestration potential of riparian zone of Condamine Catchment, Queensland, Australia. Land Use Policy 2016, 54, 139–146. [Google Scholar] [CrossRef]
- Maraseni, T.N.; Neupane, P.R.; Lopez-Casero, F.; Cadman, T. An assessment of the impacts of the REDD+ pilot project on community forests user groups (CFUGs) and their community forests in Nepal. J. Environ. Manag. 2014, 136, 37–46. [Google Scholar] [CrossRef] [PubMed]
- Jaquet, S.; Schwilch, G.; Hartung-Hofmann, F.; Adhikari, A.; Sudmeier-Rieux, K.; Shrestha, G.; Liniger, H.P.; Kohler, T. Does outmigration lead to land degradation? Labour shortage and land management in a western Nepal watershed. Appl. Geogr. 2015, 62, 157–170. [Google Scholar] [CrossRef]
- Bryan, B.A.; Crossman, N.D. Systematic regional planning for multiple objective natural resource management. J. Environ. Manag. 2008, 88, 1175–1189. [Google Scholar] [CrossRef] [PubMed]
- Butler, J.R.; Wong, G.Y.; Metcalfe, D.J.; Honzák, M.; Pert, P.L.; Rao, N.; van Grieken, M.E.; Lawson, T.; Bruce, C.; Kroon, F.J. An analysis of trade-offs between multiple ecosystem services and stakeholders linked to land use and water quality management in the Great Barrier Reef, Australia. Agric. Ecosyst. Environ. 2013, 180, 176–191. [Google Scholar] [CrossRef]
- Raudsepp-Hearne, C.; Peterson, G.D.; Bennett, E. Ecosystem service bundles for analyzing tradeoffs in diverse landscapes. Proc. Natl. Acad. Sci. USA 2010, 107, 5242–5247. [Google Scholar] [CrossRef] [PubMed] [Green Version]
- Rodríguez, J.P.; Beard, T.D.; Bennett, E.M.; Cumming, G.S.; Cork, S.J.; Agard, J.; Dobson, A.P.; Peterson, G.D. Trade-offs across space, time, and ecosystem services. Ecol. Soc. 2006, 11, 28. [Google Scholar] [CrossRef]
- Sanon, S.; Hein, T.; Douven, W.; Winkler, P. Quantifying ecosystem service trade-offs: The case of an urban floodplain in Vienna, Austria. J. Environ. Manag. 2012, 111, 159–172. [Google Scholar] [CrossRef] [PubMed]
- Stoate, C.; Báldi, A.; Beja, P.; Boatman, N.; Herzon, I.; Van Doorn, A.; De Snoo, G.; Rakosy, L.; Ramwell, C. Ecological impacts of early 21st century agricultural change in Europe—A review. J. Environ. Manag. 2009, 91, 22–46. [Google Scholar] [CrossRef] [PubMed]
- Balvanera, P.; Daily, G.C.; Ehrlich, P.R.; Ricketts, T.H.; Bailey, S.-A.; Kark, S.; Kremen, C.; Pereira, H. Conserving Biodiversity and Ecosystem Services. Science 2001, 291, 2047. [Google Scholar] [CrossRef] [PubMed]
- Turner, W.R.; Brandon, K.; Brooks, T.M.; Costanza, R.; Da Fonseca, G.A.; Portela, R. Global conservation of biodiversity and ecosystem services. BioScience 2007, 57, 868–873. [Google Scholar] [CrossRef]
- Daily, G.C.; Matson, P.A. Ecosystem services: From theory to implementation. Proc. Natl. Acad. Sci. USA 2008, 105, 9455–9456. [Google Scholar] [CrossRef] [PubMed]
- Naidoo, R.; Balmford, A.; Costanza, R.; Fisher, B.; Green, R.E.; Lehner, B.; Malcolm, T.; Ricketts, T.H. Global mapping of ecosystem services and conservation priorities. Proc. Natl. Acad. Sci. USA 2008, 105, 9495–9500. [Google Scholar] [CrossRef] [PubMed] [Green Version]
- Nelson, E.; Mendoza, G.; Regetz, J.; Polasky, S.; Tallis, H.; Cameron, D.; Chan, K.M.; Daily, G.C.; Goldstein, J.; Kareiva, P.M. Modeling multiple ecosystem services, biodiversity conservation, commodity production, and tradeoffs at landscape scales. Front. Ecol. Environ. 2009, 7, 4–11. [Google Scholar] [CrossRef] [Green Version]
- Tallis, H.; Kareiva, P.; Marvier, M.; Chang, A. An ecosystem services framework to support both practical conservation and economic development. Proc. Natl. Acad. Sci. USA 2008, 105, 9457–9464. [Google Scholar] [CrossRef] [PubMed] [Green Version]
- Zak, M.R.; Cabido, M.; Cáceres, D.; Díaz, S. What drives accelerated land cover change in central Argentina? Synergistic consequences of climatic, socioeconomic, and technological factors. Environ. Manag. 2008, 42, 181–189. [Google Scholar] [CrossRef] [PubMed]
- Niraula, R.R.; Gilani, H.; Pokharel, B.K.; Qamer, F.M. Measuring impacts of community forestry program through repeat photography and satellite remote sensing in the Dolakha district of Nepal. J. Environ. Manag. 2013, 126, 20–29. [Google Scholar] [CrossRef] [PubMed]
- Casado-Arzuaga, I.; Madariaga, I.; Onaindia, M. Perception, demand and user contribution to ecosystem services in the Bilbao Metropolitan Greenbelt. J. Environ. Manag. 2013, 129, 33–43. [Google Scholar] [CrossRef] [PubMed]
- Palomo, I.; Martín-López, B.; Potschin, M.; Haines-Young, R.; Montes, C. National Parks, buffer zones and surrounding lands: Mapping ecosystem service flows. Ecosyst. Serv. 2013, 4, 104–116. [Google Scholar] [CrossRef]
- Plieninger, T.; Dijks, S.; Oteros-Rozas, E.; Bieling, C. Assessing, mapping, and quantifying cultural ecosystem services at community level. Land Use Policy 2013, 33, 118–129. [Google Scholar] [CrossRef] [Green Version]
- Wolff, S.; Schulp, C.; Verburg, P. Mapping ecosystem services demand: A review of current research and future perspectives. Ecol. Indic. 2015, 55, 159–171. [Google Scholar] [CrossRef]
- Orenstein, D.E.; Groner, E. In the eye of the stakeholder: Changes in perceptions of ecosystem services across an international border. Ecosyst. Serv. 2014, 8, 185–196. [Google Scholar] [CrossRef]
- Ericksen, P.; de Leeuw, J.; Said, M.; Silvestri, S.; Zaibet, L. Mapping ecosystem services in the Ewaso Ng’iro catchment. Int. J. Biodivers. Sci. Ecosyst. Serv. Manag. 2012, 8, 122–134. [Google Scholar] [CrossRef]
Figure 1.
Map of study area in the Panchase Mountain Ecological Region, with lowland (a) midland (b), and upland (c) regions, based on altitudinal variation.
Figure 1.
Map of study area in the Panchase Mountain Ecological Region, with lowland (a) midland (b), and upland (c) regions, based on altitudinal variation.

Figure 2.
Overall percentage of respondents on the major ES in the PMER.

Figure 3.
Prioritization of ES by Forest Users—Figure (a); and Forest Managers—Figure (b) in the PMER, Nepal. The word size indicates the priority of respective ES—the larger the font size, the higher the priority by the respondents.
Figure 3.
Prioritization of ES by Forest Users—Figure (a); and Forest Managers—Figure (b) in the PMER, Nepal. The word size indicates the priority of respective ES—the larger the font size, the higher the priority by the respondents.

Figure 4.
Prioritization of major ecosystem services (ES) by forest users in the upland (a), Midland (b), and lowland (c) region of PMER, Nepal.
Figure 4.
Prioritization of major ecosystem services (ES) by forest users in the upland (a), Midland (b), and lowland (c) region of PMER, Nepal.

Figure 5.
Prioritization of ecosystem goods and services from the upland core Panchase region by the respondents from both upland regions and other regions.
Figure 5.
Prioritization of ecosystem goods and services from the upland core Panchase region by the respondents from both upland regions and other regions.

Figure 6.
Respondents’ observations on local land use change during the last 20 years from 1995 to 2015.
Figure 6.
Respondents’ observations on local land use change during the last 20 years from 1995 to 2015.

Figure 7.
Land use map of the study area in 1995 and in 2015.

Figure 8.
Land use changes between 1995 and 2015.

Figure 9.
Mapping of distribution and availability of prioritized ecosystem goods and services in the study landscape: (a) Biodiversity, (b) carbon, (c) Cultural and recreational value, (d) Food Production; (e) Forest Products; and (f) Provision of water.
Figure 9.
Mapping of distribution and availability of prioritized ecosystem goods and services in the study landscape: (a) Biodiversity, (b) carbon, (c) Cultural and recreational value, (d) Food Production; (e) Forest Products; and (f) Provision of water.

Figure 10.
Mapping of prioritized ecosystem goods and services in 1995 (a), and 2015 (b) in the study landscape.
Figure 10.
Mapping of prioritized ecosystem goods and services in 1995 (a), and 2015 (b) in the study landscape.


Table 1.
Major ecosystem goods and services (ES) in Panchase Mountain Ecological Region (PMER), Western Nepal based on (Baral et al., 2014 [30]; Bennett et al., 2009 [31]; Dobbs et al., 2014 [32]; Paudyal et al., 2015 [5]). In which, Beneficiary; Private = individual household, Public = public benefit throughout the community and beyond; Scale, O = onsite users—living with in the forest surroundings, L = local users—living quite nearby the forest within 5 km, R = regional users—living between 5–300 km, N = national users, G = Global users beyond national boundaries; on scale, ‘+’ = increasing, ‘0’ = no change, ‘-’ = decreasing, and ? = unknown; key measurement units, “no” = number, ML = mega liters, tons = metric tons (1000 kg), ha = Hectare, Bhari = local unit equivalent of around 30 kg, per ha = per hectare, kg = Kilogram, ft3 = Cubic feet.
| SN | Ecosystem Services | Features | Beneficiary | Scale | Local Trend | Reason for Changes | Units of Measurement |
|---|---|---|---|---|---|---|---|
| (A) Provisioning Services (Ecosystem goods) | |||||||
| 1 | Forest products | Provision of forest products especially timber, firewood, fodder from the forests | Private | O-L | + | Forest management activities Agriculture land converted into shrub and forest land | Timber—ft3 Firewood and fodder—kg and Bhari in local unit. |
| 2 | Food production from farmland | Food grains from farmlandsVegetables and fruits | Private | O | - | -Farmland abandonment -Effect of natural hazards-floods, droughts, -Shifting profession from farm-based to other sectors | ha; tons per ha |
| 3 | Forest foods and fruits | Fruits and vegetable from forest such as wild fruits (lapsi, Kaphal berries), mushrooms, Honey | Private | O-L | - | -Decrease in the number and quality of fruit trees/products -Forest food producing understory area is invaded by bushy and unwanted species. | Area = ha, products in tons per ha, and Number of fruit trees and species |
| 4 | Provision of water | Drinking and irrigation water | Public and private | O-R | - | -Largely unknown, though increase in forest area, provision of water is decreasing. | Area in ha, Number of traditional water sources |
| 5 | Local medicine | Different plant species with medicinal and aromatic values-trees, shrubs and herbs species | Public and Private | L-R | - | -Decrease in number and production of medicinal plants -Potentially due to changes in species composition | Number of medicinal plants per ha Kg or tons per ha |
| 6 | Energy | Fire wood as a major source of energy, also supported by biogas. | Private | O-L | 0 | -Easy access to firewood -Number of biogas plants in the village is also increasing | Number and area covered by firewood species, Number of households using biogas plants |
| 7 | Ornamental resources | Presence of varieties of ornamental and flowering species in the forest | Public and private | O-R | ? | -Largely unknown, but some of the respondents identified decreasing numbers of such plant species | Number of species and trees with ornamental values in the landscape, Area covered in ha. |
| 8 | Genetic resources | Different varieties and genes of tree, shrubs and herbs species. | Public and private | L-G | ? | -No systematic studies regarding the genetic diversity among different plant species | Number and varieties of species |
| 9 | Support to local agriculture and livestock | Support to farming practices through leaf/litters/organic manure, protection from wind and erosion, and fodder and forage for livestock. | Private | O-L | 0 and/or + | -Sufficient supply of fodder and litter in the upland. -more or less similar or a decrease in these services in the lowland | Number of household and livestock, and area of farmland supported by forest |
| (B) Regulating Services | |||||||
| 1 | Climate regulation | Amelioration of local climatic condition and improve microclimate | Public and Private | L-R | ? | -There is no detailed study on these regards, but respondents state that forests in the surrounding landscape have been helping to improve local climate | Area improved by forests |
| 2 | Flood regulation | Control and regulation of floods | Public and Private | O-R | + | -Generally improved flood control scenario especially in upland regions, but the lowland is still affected by floods | Number of prevented floods, and Reclaimed flood affected area by forest |
| 3 | Water source protection & purification | Availability of pure water in the streams and water ponds | Public and private | O-R | + | Overall, water sources have been protected by forests. In contrast, availability of water has decreased in the pond and streams | Cubic meter per hectare Number and area of water sources protected by forests |
| 4 | Water regulation | Role of vegetation in the forest in regulating hydrological flows | Public and private | O-R | ? | No proper research so far, but most of the respondents believe in a positive role of forest on water regulation | Cubic meter per hectare |
| 5 | Erosion and landslide regulation | Vegetation on the farm and forest area, supporting on erosion control and prevent from landslide | Public and private | O-R | + | Due to forest and vegetation, landslides and erosion have decreased especially in the upland area as trees and vegetation act as a buffer against these kind of hazards | Number of landslide per year, Area affected by landslide and erosion in hectare. |
| 6 | Pest regulation | Local ecosystem and services could reduce the harmful insect and animal in the landscape | Public and Private | O-L | ? | -Not much systematic study conducted so far -Some of the respondents view local ecosystems and services as a means of regulating harmful insects and pests. | Number of cases of reduced pest infestation in the locality |
| 7 | Disease regulation | Fresh air, and water supplied from nearby forest and streams reduce the cases of disease. | Public and Private | O-L | ? and/or + | -Not many systematic studies. -Numbers of water borne diseases are reduced. | Number of diseases and effects among local inhabitants |
| 8 | Pollution control | Forest and surrounding ecosystem help reduce land, water and noise pollution | Public and Private | O-R | + | Decreased case of land, and water-based hazards | Number and area of the effect in hectare |
| 9 | Fresh air and air quality regulation | Trees/forests absorbs dust particles and carbon dioxide from the atmosphere, provide fresh air and oxygen | Public and Private | O-G | + | -Due to increase in forest area, increase in fresh air and thereby increased air quality. -No scientific study in this regard | Total leaf area (TLA) per ha, and amount of pollutant in the air. |
| 10 | Crop pollination | Some wild species such as birds and bees play crucial roles in crop pollination of both forest and farm species | Public and Private | O-R | ? and/or + | -There is no systematic study, but respondents agree with the positive role of birds and bee species in crop pollination | Number per ha, Tons per ha |
| 11 | Carbon sequestration | Forest capture atmospheric carbon through trees, shrubs and herbs. | Public and Private | O-G | + | With the increase in forest and vegetation cover, carbon sequestration also increases | Tons per ha or Mg per ha per year Both on an annual basis |
| 13 | Nutrient regulation | Forest provides various nutrients through decayed leaf litters and other organic matters | Public and Private | O-L | + | Increased nutrient regulation through decaying (and other process) of leaf litter and regulating of nutrients status of the forest itself and nearby farmland | - |
| (C) Cultural Services | |||||||
| 1 | Religious value (temples, festivals) | Panchase region has different religious sites such as temples and stupas. | Public and Private | O-L | + | With the publicity of religious values of the sites and temples, large number of people are visiting the places | Number of religious sites, Number of visitors |
| 2 | Cultural and spiritual value | Presence of culturally significant indigenous Gurung culture, and their associated traditions and values | Public and Private | O-R | + | -Growing awareness of local and indigenous cultural values | Number of cultural sites, Number of visitors |
| 3 | Recreational value and lifestyle | Overall, the landscape provides and functions as a recreational site | Public and Private | O-R | + | -The site is increasingly becoming a recreational site | Number of visitors, and area covered by recreational landscape. |
| 4 | Aesthetic value and inspiration | Mosaic landscape have aesthetic and inspirational value through breathtaking views and an inspiring environment | Public and Private | O-G | + | -Increased aesthetic beauty and inspiring environment | Area covered as an aesthetic and inspiring environment. |
| 5 | Ecotourism | Aesthetic forest is also a source of ecotourism as means of recreation and ecotourism | Public and Private | O-G | + | -Increased number of tourists -Promotion of ecotourism activities such as homestay business | -Number of tourist visiting the places -The number of people engaged in ecotourism business |
| 6 | Sense of place | Increased sense of place among local communities due to their identity and attachment with the place and also the characteristic feature of the study landscape as a whole | Public and Private | O-L | + | -Due to the growing awareness and interest among local inhabitants, an increased sense of place was found among them both for their identity and the special features of the place | Number of people acknowledging their identity, value and the place of their origin. |
| 7 | Knowledge and education | Due to the diverse array of socio-ecological features, it is becoming an educational hub and natural laboratory. | Public and Private | O-G | + | -Increased research and study in the region | Number of studies |
| 8 | Social relation | Diverse groups and society in a small landscape provides an operational relationship and link between these groups, culture and communities. | Public and Private | O-L | + | -As a result of growing traditions of managing different ecosystems together through local institution and governance -Cooperation and supporting behavior in different social activities | Social value, culture, norms Institutional values. |
| (D) Supporting Services | |||||||
| 1 | Nutrient cycling | Nutrient cycling in the ecosystem is influenced by the use of additional inputs such as fertilizers, livestock waste and so on. | Public and Private | O-L | ? | ||
| 2 | Soil formation and conservation | Prevent erosion and help conserve and further support for soil formation | Public and Private | O-L | + | Due to increased forest cover especially in the upland area, decreased soil erosion and thereby enhanced soil formation process. | Net annual saving of soil per hectare, i.e., tons per hectare per year |
| 3 | Wildlife habitat | Forest provides habitat support for large numbers of plants and animals | Public and Private | O-R | + | Increased forest cover has provided more habitats for different plan and animal species. | Presence of plant and animals in the forest. |
| 4 | Photosynthesis | Trees use the sun’s energy for photosynthesis, provide us with the oxygen to breathe and also store carbon below and above ground in the forest. | Public and Private | O-G | ? and/or + | As forest area is increasing, there might be increased oxygen through photosynthesis and storage of carbon in the forest. | |
| 5 | Water cycling | Water cycling may be affected by different human and natural factors such as structural changes to rivers | Public and Private | O-R | ? | The role of forest ecosystem, water cycling and availability of water resources needs further study in the region. | |
| 6 | Primary production | Net primary productivity is affected by different seasonal and inter-annual climatic variability | Public and Private | O-L | ? | Either increase or decrease in NPP in the face of different socio-ecological factors would also be an interesting area to investigate. | |
| 7 | Biodiversity conservation | Number of flora and fauna species in the farm and forest ecosystem | Public and Private | O-G | - | -Number of traditional species are decreasing, and invasive alien species are invading the farm and forest land | Area covered in ha. |
© 2018 by the authors. Licensee MDPI, Basel, Switzerland. This article is an open access article distributed under the terms and conditions of the Creative Commons Attribution (CC BY) license (http://creativecommons.org/licenses/by/4.0/).
Share and Cite
MDPI and ACS Style
Adhikari, S.; Baral, H.; Nitschke, C.R. Identification, Prioritization and Mapping of Ecosystem Services in the Panchase Mountain Ecological Region of Western Nepal. Forests 2018, 9, 554. https://doi.org/10.3390/f9090554
AMA Style
Adhikari S, Baral H, Nitschke CR. Identification, Prioritization and Mapping of Ecosystem Services in the Panchase Mountain Ecological Region of Western Nepal. Forests. 2018; 9(9):554. https://doi.org/10.3390/f9090554
Chicago/Turabian StyleAdhikari, Shankar, Himlal Baral, and Craig R. Nitschke. 2018. "Identification, Prioritization and Mapping of Ecosystem Services in the Panchase Mountain Ecological Region of Western Nepal" Forests 9, no. 9: 554. https://doi.org/10.3390/f9090554
Note that from the first issue of 2016, this journal uses article numbers instead of page numbers. See further details here.