Beer Aroma and Quality Traits Assessment Using Artificial Intelligence


Digital Agriculture, Food and Wine Sciences Group, School of Agriculture and Food, Faculty of Veterinary and Agricultural Sciences, University of Melbourne, Parkville, VIC 3010, Australia
*
Author to whom correspondence should be addressed.
Fermentation 2020, 6(2), 56; https://doi.org/10.3390/fermentation6020056
Submission received: 30 April 2020
/
Revised: 23 May 2020
/
Accepted: 27 May 2020
/
Published: 28 May 2020
(This article belongs to the Special Issue Industrial Fermentation)
Abstract
:Increasing beer quality demands from consumers have put pressure on brewers to target specific steps within the beer-making process to modify beer styles and quality traits. However, this demands more robust methodologies to assess the final aroma profiles and physicochemical characteristics of beers. This research shows the construction of artificial intelligence (AI) models based on aroma profiles, chemometrics, and chemical fingerprinting using near-infrared spectroscopy (NIR) obtained from 20 commercial beers used as targets. Results showed that machine learning models obtained using NIR from beers as inputs were accurate and robust in the prediction of six important aromas for beer (Model 1; R = 0.91; b = 0.87) and chemometrics (Model 2; R = 0.93; b = 0.90). Additionally, two more accurate models were obtained from robotics (RoboBEER) to obtain the same aroma profiles (Model 3; R = 0.99; b = 1.00) and chemometrics (Model 4; R = 0.98; b = 1.00). Low-cost robotics and sensors coupled with computer vision and machine learning modeling could help brewers in the decision-making process to target specific consumer preferences and to secure higher consumer demands.
1. Introduction
Due to the high popularity of beer worldwide—78% of total volume sales among the alcoholic beverages—and consumers demanding premium beers with higher quality (e.g., foam, aromas, flavors, tastes), there is an increased need for more reliable, accurate, cost-effective, and less time-consuming methods to assess quality traits of beers at the end of the production line [1,2,3,4,5]. Traditional methods to analyze physicochemical parameters for beverages involve costly equipment and require specialized personnel. Furthermore, instrumentation must be installed in designated laboratory areas such as the gas chromatographs with mass-spectroscopy (GC-MS) that require a ventilated laboratory space with gas detectors and special gas cylinders to function. These conventional techniques also require the use of consumables and tend to be time-consuming [1,6,7]; therefore, results are not readily available to brewers, which hinders the ability to modify formulations or processes to improve beer quality traits rapidly.
Artificial intelligence (AI), which refers to the automation of machines that have the ability to behave like humans in the sense of thinking, problem-solving, decision-making, and self-learning, is composed of different branches such as computer vision (CV), robotics, sensors, and machine learning (ML) [1,8]. These techniques have been recently applied in the food and beverage industries to develop more efficient methods for the assessment of the products in terms of quality and consumer acceptability. Specifically for beer, CV has been used to assess color from images [9,10], bubble size and haze [11], and foam-related parameters [12,13,14]. The use of robotics has also been reported to uniform the pouring of beverages such as sparkling wine, carbonated water, and beer [14,15,16]. ML modeling has been integrated with other technologies such as sensors, robotics, and CV to classify the samples into different categories and/or to predict different parameters. Some examples of this are the prediction of aromas and off-aromas using electronic noses (e-noses) as inputs [7,17], prediction of acetic acid using the fermentation data obtained from the process [18], the use of a robotic pourer (RoboBEER; The University of Melbourne, Parkville, Vic, Australia) and CV techniques to assess foam, color and bubble parameters to predict the sensory profile of beers [19], consumers acceptability [20], and proteins [21]. Classification models have also been developed with the use of e-noses to categorize beers according to their defects [17] and style [22,23,24], and the use of color- and foam-related parameters obtained using the RoboBEER to classify the samples according to the type of fermentation [14].
Implementing machine learning and AI modeling strategies in the food and beverage industry will reduce subjectivity on the analysis of quality traits and introduce consumer preference in manufacturing. These technologies will increase the acceptability and success of new products in the market. Around 95% of new food and beverage products fail in the market without proper sensory studies [25]. As previously mentioned, earlier studies have shown highly accurate ML models developed using RoboBEER parameters to predict sensory attributes [19,20] and proteins [21]. Therefore, this study aimed to develop new methods to assess the aroma profile and chemical parameters of beer using an AI approach by integrating robotics, sensors, CV, and ML techniques, which will help the industry to increase the acceptability of their products. A comparison between predictive ML models using near-infrared (NIR) spectroscopy as inputs and those developed with color, foam, and bubble parameters measured with RoboBEER is presented. Data used as targets/outputs of the models were obtained using traditional methods to train the models and achieve high accuracy and performance. The methodology proposed could be easily implemented in craft, medium, and large beer processes due to its accuracy, affordability, and minimal requirements of the system and skills from users.
2. Materials and Methods
2.1. Samples Description
A total of 20 commercial beer samples from different styles and types of fermentation (Table 1) were used for the physicochemical analysis to evaluate some of their quality traits. To avoid bias, three bottles of each sample were used for all analyses (N = 60).
2.2. Physical Measurements—RoboBEER
All samples (N = 60) were analyzed using an automatic robotic pourer (RoboBEER; The University of Melbourne, Parkville, Vic, Australia). As detailed by Gonzalez Viejo et al. [14], this robot is able to pour the beer bottles automatically while being recorded by a smartphone for 5 min. Furthermore, RoboBEER has three sensors that measure temperature, alcohol gas (OH), and carbon dioxide (CO2) in real-time during the pouring. The recorded videos are then processed using computer vision algorithms developed in Matlab® R2020a (Mathworks, Inc., Natick, MA, USA) to obtain parameters such as (i) lifetime of foam (LTF), (ii) total lifetime of foam (TLTF), (iii) maximum volume of foam (MaxVol), (iv) foam drainage (FDrain), color in (v, vi, vii) CIELab and (viii, ix, x) RGB scales, and bubble size distribution in the foam as (xi) small (SmBubb), (xii) medium (MedBubb), and (xiii) large (LgBubb).
2.3. Chemical Measurements
2.3.1. Aromas—Gas-Chromatography Mass-Spectroscopy
As described by Gonzalez Viejo et al. [7,26], a total of 5 mL of each of the triplicates of the beers were placed in 20 mL vials and analyzed using a gas-chromatograph with a mass-selective detector 5977B (GC-MSD; Agilent Technologies, Inc., Santa Clara, CA, USA), which is integrated with an autosampler system PAL3 (CTC Analytics AG, Zwingen, Switzerland). The method used was based on headspace with solid-phase microextraction (SPME) divinylbenzene–carboxen–polydimethylsiloxane (DVB–CAR–PDMS) grey fiber. The carrier gas was helium, and an HP-5MS column was used. Furthermore, two blanks were included at the start and end to ensure no carryover effects. The National Institute of Standards and Technology library (NIST; National Institute of Standards and Technology, Gaithersburg, MD, USA) was used to identify the volatile aromatic compounds, and only those with >80% certainty were used.
2.3.2. Near-Infrared Spectroscopy
A microPHAZIR™ RX Analyzer (Thermo Fisher Scientific, Waltham, MA, USA) was used to measure the near-infrared absorbance values within the 1596–2396 nm range every 7–9 nm. The samples were impregnated in a Whatman® filter paper (Whatman plc. Maidstone, UK), qualitative grade three, and 7.0 cm diameter. This was used to measure the beers by placing the white background on top to avoid signal noise caused by environmental interference. The values of a dry filter paper were subtracted from those containing the beer samples to remove the cellulose peaks. All samples were measured at room temperature (20–23 °C).
2.3.3. Other Chemical Measurements
A 50 mL sample of each beer was used to measure the total dissolved solids (TDS) and electrical conductivity (Econd) using a Yuelong YL-TDS2-A digital tester (Zhengzhou Yuelong Electronic Technology Co., Ltd., Zhengzhou City, Henan Province, China). The same samples were used to obtain the pH with a pH-meter (QM-1670, DigiTech, Sandy, UT, USA), and salt concentration using a digital salt-meter (PAL-SALT Mohr, Atago Co., Ltd., Saitama, Japan). Total soluble solids were measured using an optical refractometer Alla France REFBX010 (Alla France Sarl, Chemillé-Melay, France), with a range of measurement 0–32 Brix. On the other hand, a 60 mL sample was obtained to assess the alcohol concentration using an Alcolyzer Wine M alcohol meter (Anton Paar GmbH, Graz, Austria) with <0.1% vv−1 accuracy.
2.4. Statistical Analysis and Machine Learning Modeling
An ANOVA was conducted to assess if there were significant differences among the samples using Fishers least significant differences (LSD) as a post hoc test (α = 0.05). The latter was performed using the SAS® 9.4 software (SAS Institute Inc., Cary, NC, USA). Furthermore, all data were evaluated using a multivariate data analysis based on principal components analysis (PCA) with Matlab® R2020a (Mathworks, Inc., Natick, MA, USA).
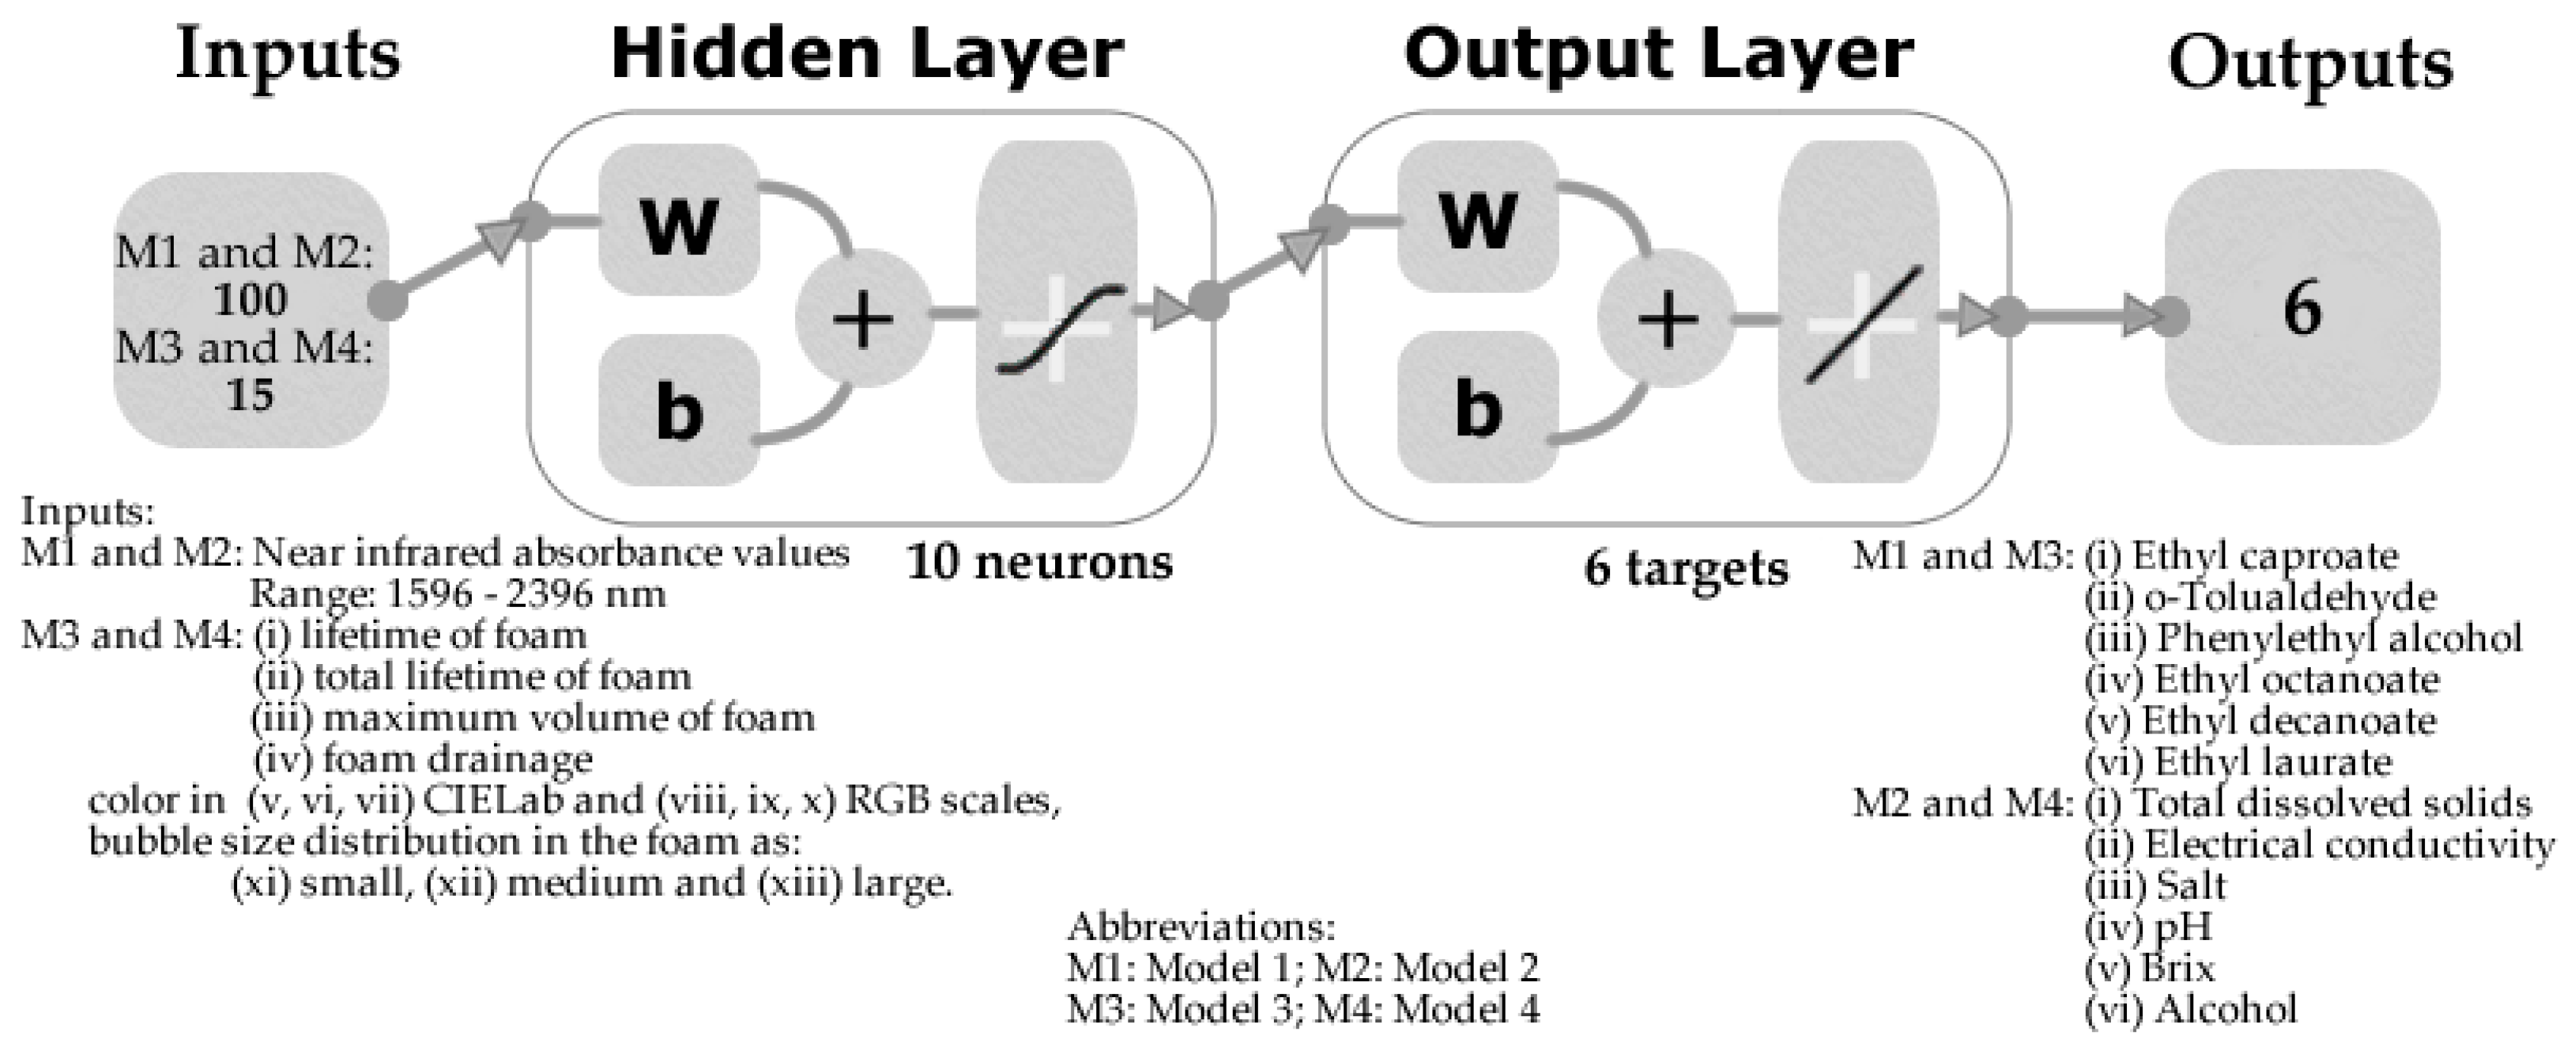
The absorbance values obtained with the NIR device were used as inputs to develop two artificial neural network (ANN) models to predict the peak area of six volatile aromatic compounds (Model 1; Figure 1) and six chemical parameters (Model 2; Figure 1). These were constructed using a code written in Matlab® R2020a to evaluate 17 different training algorithms to find the most accurate models and with the highest performance. On the other hand, the 15 parameters obtained from the RoboBEER measurements were used as inputs to develop two more models to predict the peak area of six volatile aromatic compounds (Model 3; Figure 1) and six chemical parameters (Model 4; Figure 1). All models were developed using a random data division, with 70% of the samples used for training with the Bayesian regularization algorithm and 30% for testing using a default derivative function and performance based on means squared error. Ten neurons were selected as the best for all four models to obtain the highest accuracy with no overfitting.
3. Results
Figure 2a shows the normalized mean values of the RoboBEER parameters (color, foam, and bubbles) for each sample. There were significant differences (p < 0.05) between samples in all parameters. It can be observed that the spontaneous fermentation samples such as OG and LW were the highest in MaxVol with 61.9 and 57 mL, respectively (Table S1). On the contrary, the bottom fermentation beers XX and C were the lowest in MaxVol, with 7 and 8.3 mL, respectively. The spontaneous fermentation beers LK and LG were the highest in small bubbles in the foam (4809 and 4084, respectively), while the bottom fermentation samples XX and C had the lowest SmBubb (603 and 617, respectively).
Figure 2b shows the normalized mean values of the peak areas of the volatile aromatic compounds. There were significant differences among samples in all aromas. It can be observed that o-Tolualdehyde, which provides cherry-like aromas, was only found in three samples (CS, LK, and RT), and these had significant differences among them (Table S2). Samples OG and L had the highest peaks in ethyl caproate, which is associated with aromas such as green apple and green bananas. On the other hand, ethyl decanoate (apple/grapes) and ethyl laurate (waxy/floral) were the most abundant in CS, and least abundant in BC.
Figure 2c shows the normalized mean values of the chemical measurements. Similar to the other parameters, there were significant differences among the samples for all variables. It can be noted that the spontaneous fermentation beers LF and LC were the highest in TDS (1226 and 1207 ppm, respectively), Econd (2608 and 2568 µs cm−1, respectively), and salt (0.10% both samples), with the bottom fermentation sample XX as the lowest in the three parameters (TDS = 469 ppm, Econd = 997 µs cm−1, and salt = 0.02%; Table S3). The lowest pH value was found for LC (2.85), while BC had the highest (4.69). On the other hand, the sample LF had the highest Brix value (10.83 Brix) and the lowest alcohol content (2.53%).
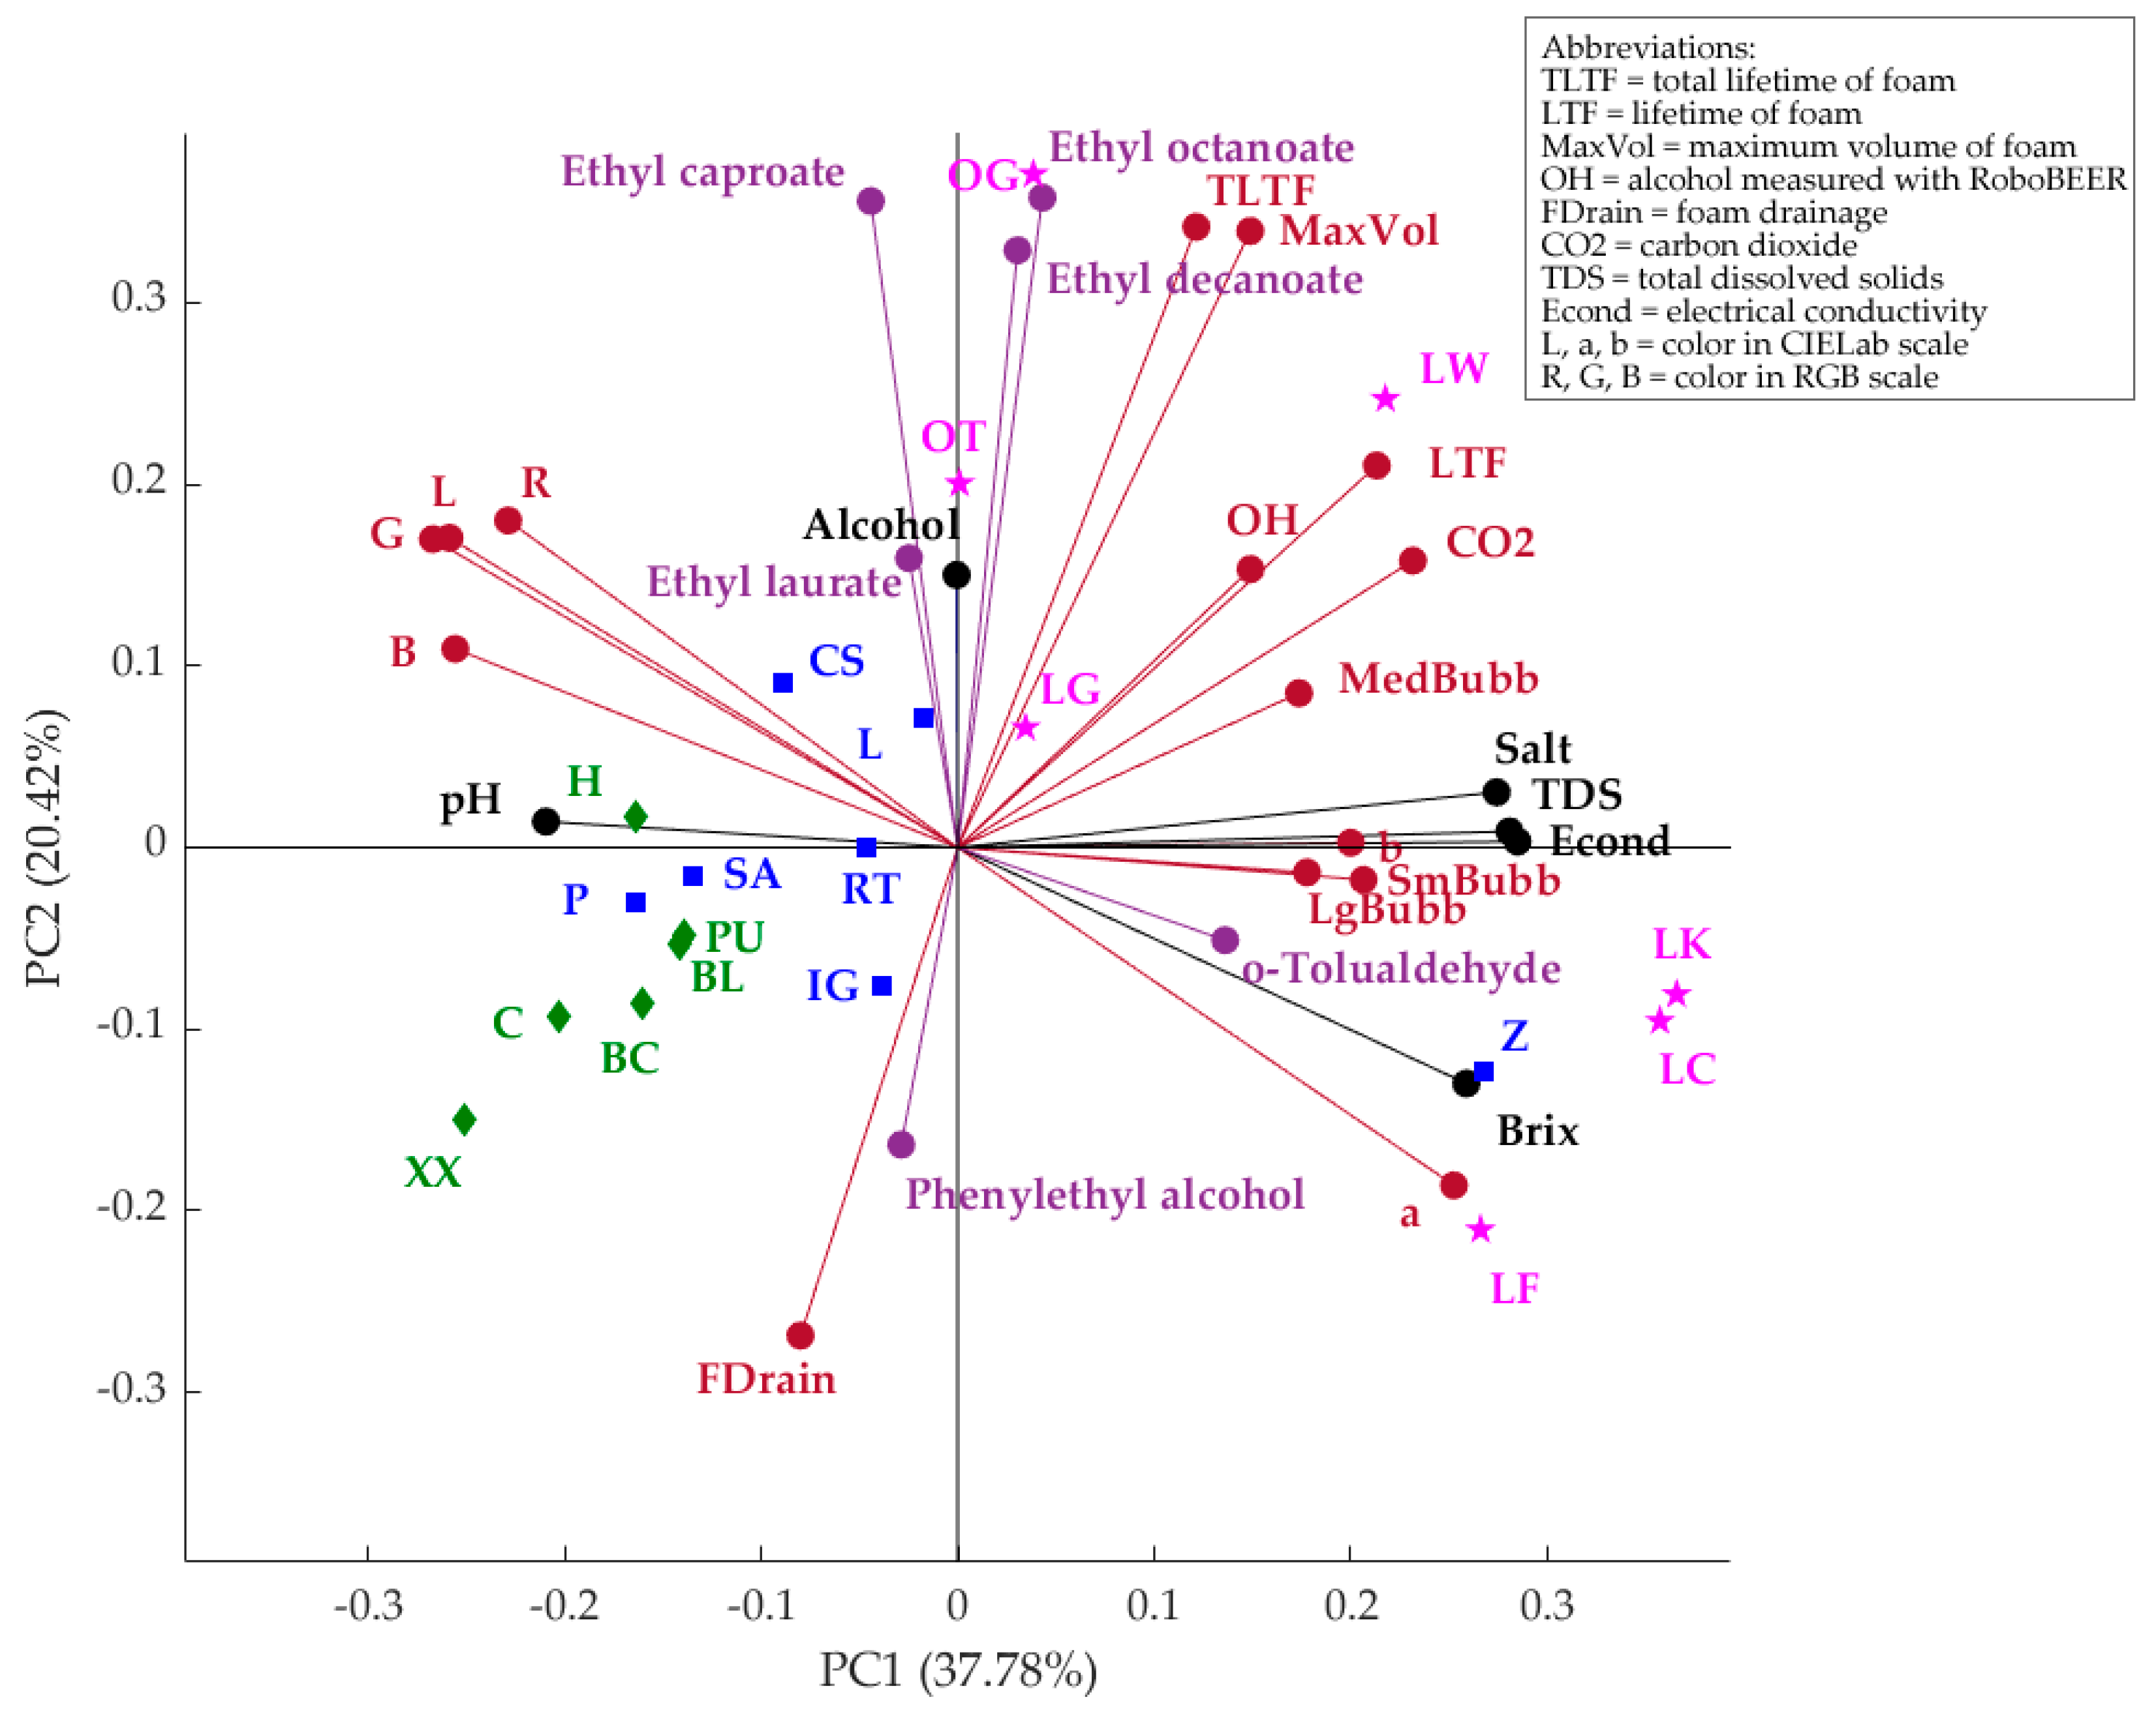
Figure 3 shows the PCA with all data from the RoboBEER, volatile aromatic compounds, and chemical measurements. The PCA accounted for 58.2% of the total data variability with principal component one (PC1), representing 37.78%, and with PC2 at 20.42%. According to the factor loadings (FL), PC1 was mainly described by TDS (FL = 0.28), Econd (FL = 0.28), and Salt (FL = 0.27) on the positive side, and by G (FL = −0.27), Brix (FL = −0.26), and L (FL = −0.26) on the negative side of the axis. In contrast, PC2 was mainly represented by ethyl octanoate (FL = 0.36), ethyl caproate (FL = 0.36), and TLTF (FL = 0.34) on the positive side, and by FDrain (FL = −0.27) and “a” (FL = −0.19) on the negative side of the axis. Aromatic compounds such as ethyl octanoate, ethyl decanoate, and ethyl caproate had a positive relationship with the foam-related parameters TLTF and MaxVol, while phenylethyl alcohol had a positive relationship with FDrain and a negative relationship with TLTF and MaxVol. Brix was positively related to o-Tolualdehyde and “a”. The spontaneous fermentation samples (pink stars) were associated with the foam-related parameters, while the top (blue squares) and bottom (green diamonds) fermentation beers were more associated with pH, RGB color scale, and FDrain. The top-fermenting sample Z was separated from all other beers from the same fermentation and was associated with Brix and “a”.
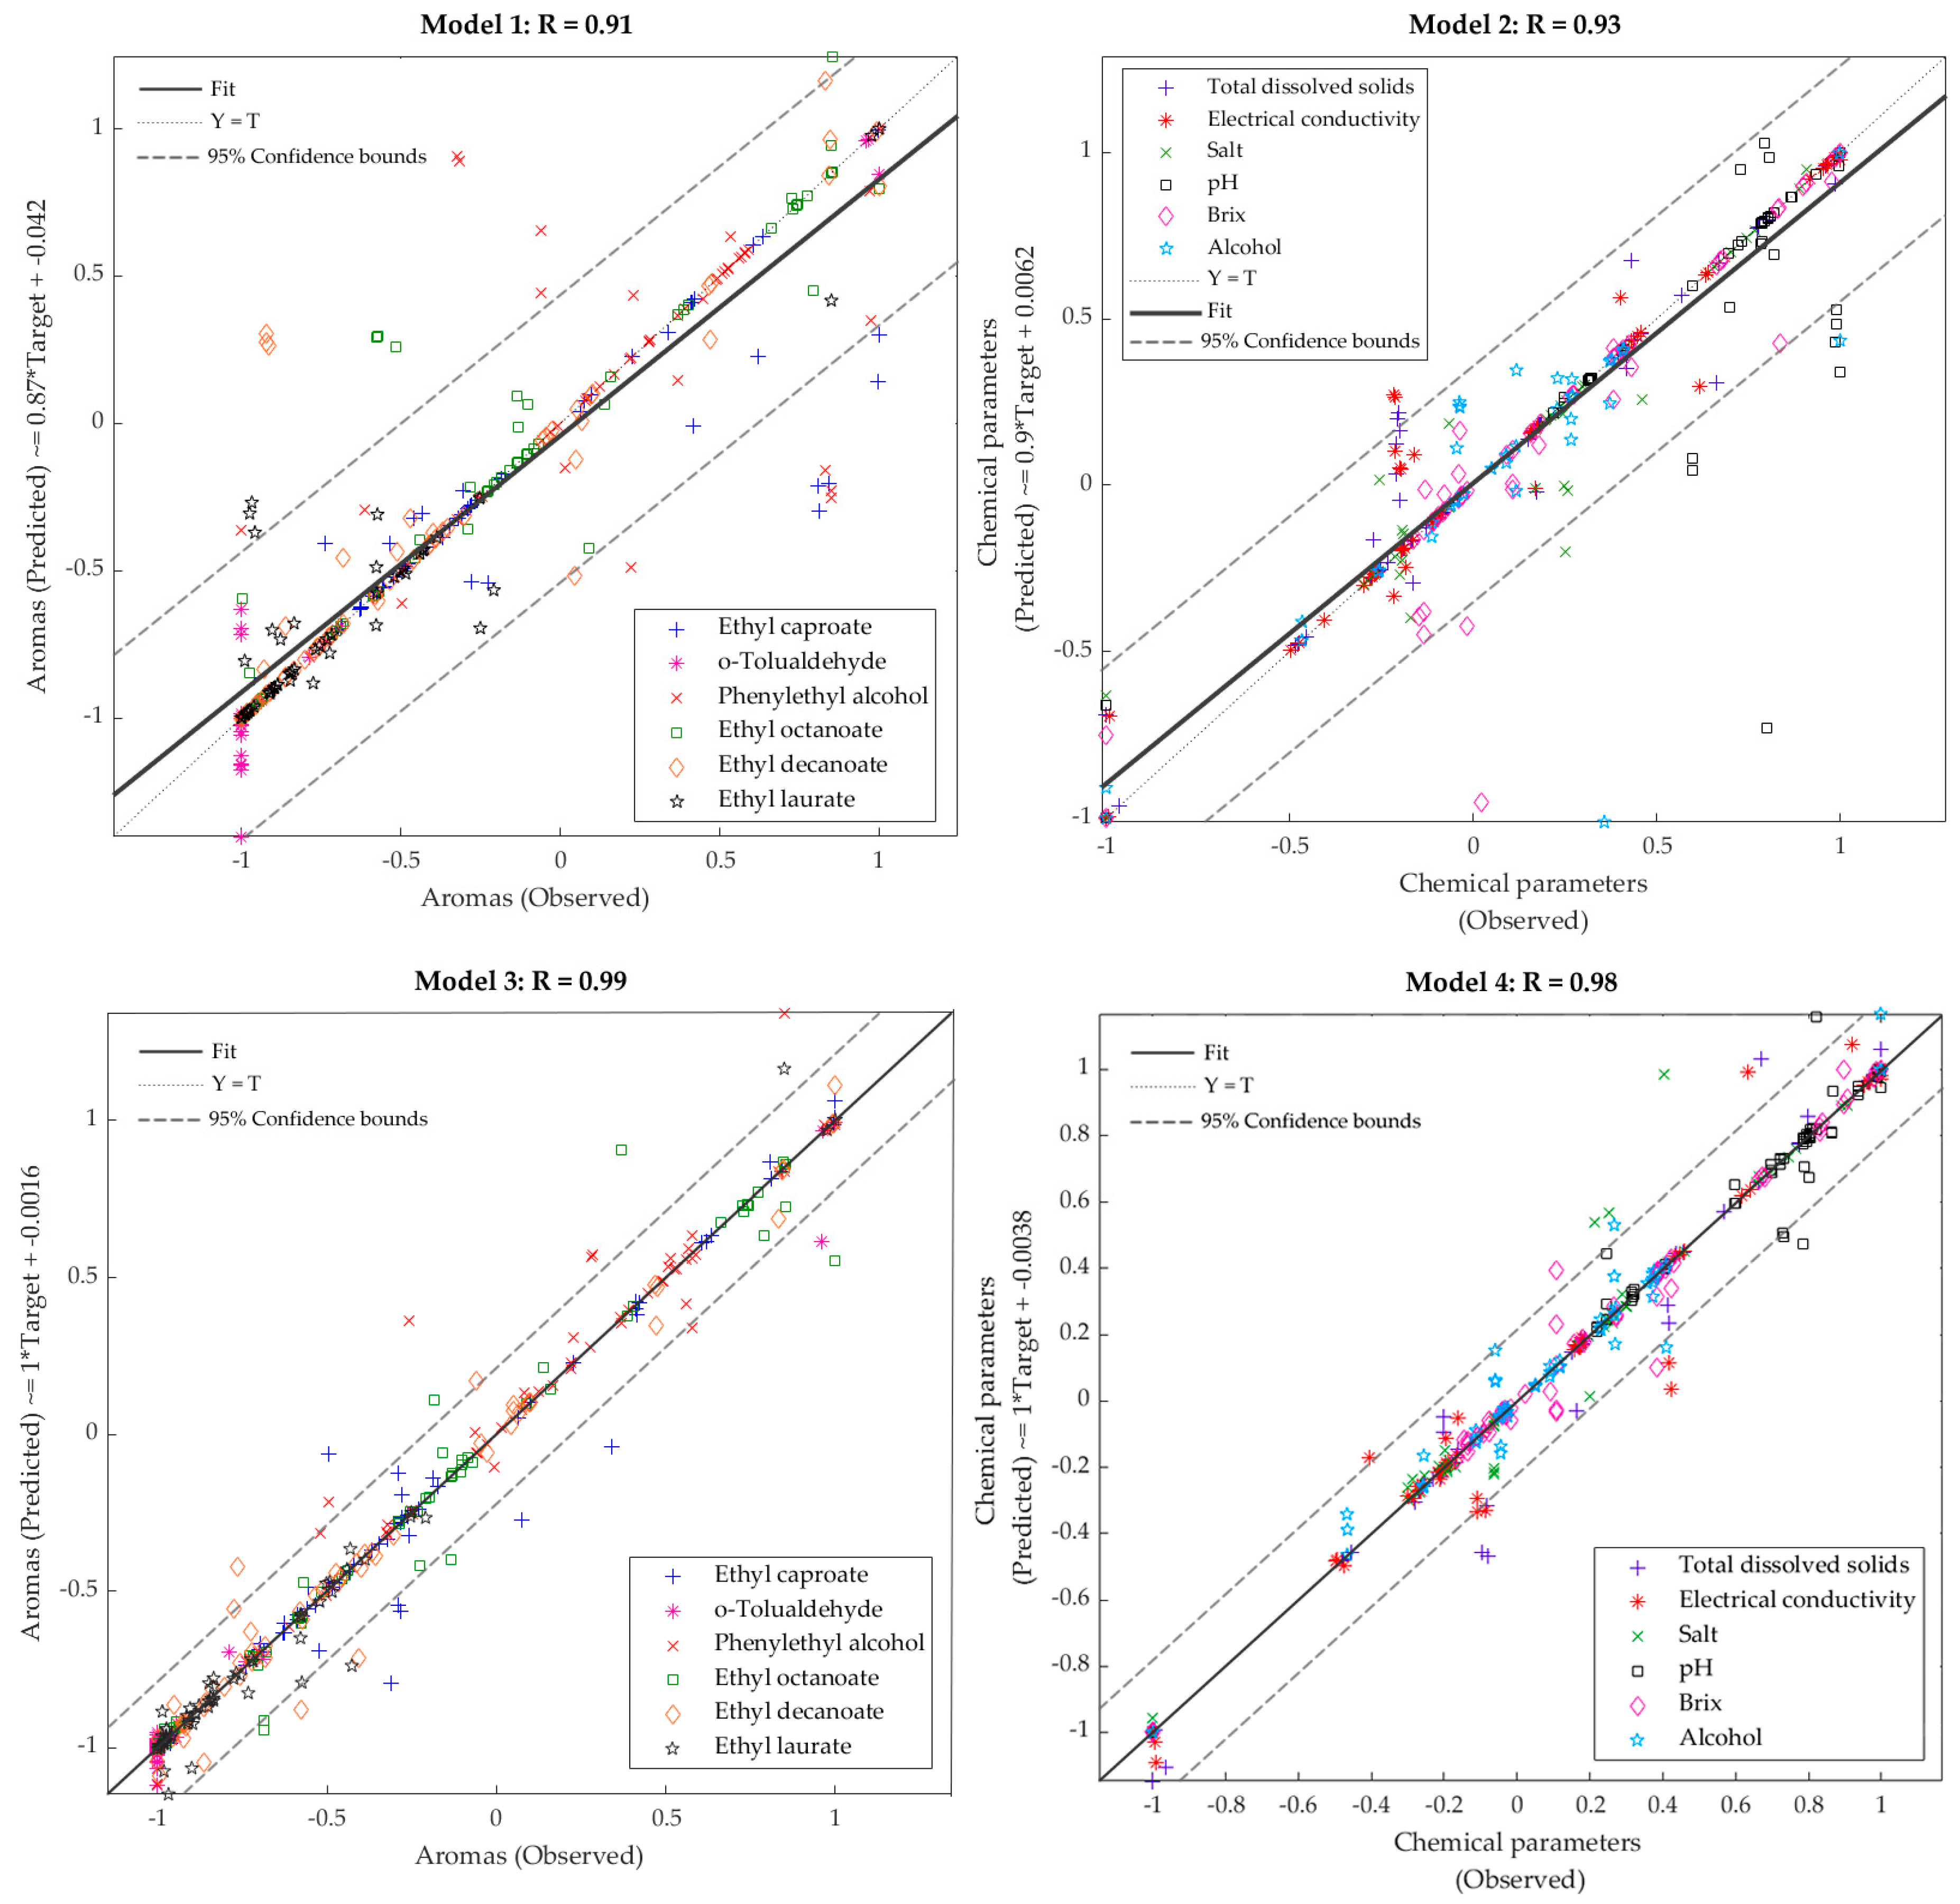
Table 2 shows the statistical results of the four ML models; it can be observed that Model 1 to predict aromas using NIR as inputs had a high overall correlation coefficient (R = 0.91). However, the accuracy of the testing stage was moderate (R = 0.73; Slope = 1.00) and much lower than the training stage (R = 1.00). Model 2 constructed using NIR as inputs to predict the chemical data also had high overall accuracy (R = 0.93), but it has similar results to Model 1 for the testing stage (R = 0.75), which is much lower than the training stage (R = 1.00). This is a sign of possible overfitting of the models. On the other hand, Model 3 developed using the RoboBEER parameters as inputs to predict the aromatic compounds had a very high overall accuracy (R = 0.99), with the R-value of the testing stage (R = 0.96) not far from that of the training (R = 0.99). Furthermore, the slope values of the three stages were 1.00, and the training performance (MSE < 0.01) was lower than the testing (MSE = 0.04), which are signs of no overfitting. Model 4 to predict chemical data using the RoboBEER variables as inputs also had a very high overall accuracy (R = 0.98), with the R-value of the testing stage (R = 0.95) close to the training (R = 0.99). Similar to Model 3, this had slope values of 1.00 for the three stages and high performance, with the training stage (MSE < 0.01) being lower than the testing (MSE = 0.04).
Figure 4 shows the overall regression of the four models. Model 1 and Model 3 had 5% of outliers (18 out of 360) based on the 95% confidence bounds. However, in the graph, it can be observed that phenylethyl alcohol (red ×) had the highest number of outliers in Model 1, while ethyl caproate (blue +) had the highest number outliers in Model 3. On the other hand, Model 2 and Model 4 had 4.7% of outliers (17 out of 360) according to the 95% confidence bounds. In Model 2, pH (black ▫) presented most of the outliers, while in Model 4, Econd (red *) represented the highest number of outliers. In both Model 1 and Model 2, the outliers seem to have a higher error than those in Model 3 and Model 4.
4. Discussion
As expected, the spontaneous fermentation beers such as OG, LW, OT, and LK were the highest in MaxVol, TLTF, and CO2, while the top and bottom fermentation samples (CS, XX, and C) were the lowest. This is due to the prolonged fermentation (≥2 years) that the spontaneous types have, which allows the production of higher CO2 [27] along with the use of cork, which aids in better sealability. On the contrary, bottom and top fermentation are carried out in five days to a few weeks and use regular thinner bottles with a bottle cap, which leads to the leaking of gas [14,28]. Some of the most abundant aromatic volatile compounds found in the samples used in this study were those related to aromas such as fruity (apple, banana, pineapple, grapes), floral (rose, honey), and waxy. Similar to the findings in the present study, other authors have identified compounds such as ethyl caproate, ethyl octanoate, phenylethyl alcohol, and ethyl decanoate in beer samples from the three types of fermentation [29,30].
Even though TDS, Econd, and salt concentration are not usually measured in beer, these are an indicator of the minerals content, especially from water, as this is the main ingredient in beer, and its hardness (minerals) level is crucial to determine the final product’s sensory attributes. For example, hard water with a high concentration of iron used for brewing has been associated with off-flavors and discoloration in beer [31]. In this study, it was found that most spontaneous fermentation beers were higher in these three components compared with top and bottom. This may be since lambic beers are produced in controlled environments and similar regions of Belgium, which makes it more likely to have a similar water composition. According to Jablonská et al. [32], soft water low in magnesium is usually used to brew lighter beers, while water with higher mineral content is used for dark beers. This coincides with the present study in which Z (dark beer) was the highest in TDS, Econd, and salt within the top and bottom fermentation categories.
According to the PCA, aromatic compounds such as esters (ethyl caproate, ethyl decanoate, ethyl laurate, and ethyl octanoate) had a positive relationship with the foaming parameters; this may be because the bubbles in the foam contain most aromatic volatiles, compared with the liquid phase, and when they start bursting gradually, these are released and perceived [33,34]. The relationship between Brix, o-tolualdehyde (cherry aroma), and “a” coincides with Abeytilakarathna et al. [35], who reported a correlation between Brix and red colors in red fruits, and Gonzalez Viejo et al. [19], who found a similar relationship in beer samples.
Even though it has been reported that ethyl ester overtones can be found between 1700 and 2300 nm [36] and alcohols may be found at around 2000 nm [37], the ML model using NIR inputs was not as accurate to predict aromas, as phenylethyl alcohol, ethyl caproate, and ethyl decanoate presented most of the outliers in the overall model (Model 1). In contrast, although Model 3 had the same number of outliers, these were fitted better in the regression line, this may be due to the relationships found in the PCA between the foam- and bubble-related parameters and the aromas, and to the form of measurement, as RoboBEER is based on a visual and volatiles (sensors) assessment, which is closer to the GC-MS principle, while NIR is based on their spectrum. Even though other studies have reported highly accurate ML models to predict pH using the 1600–2400 nm NIR range [28] due to the overtone of pOH (inverse to pH) in 1908 nm [37], in the models developed with beers, it was the parameter that presented the most outliers in Model 2. In contrast, in Model 4, pH had high accuracy, and this is due to its influence in foam formation and stability as, when proteins are closer to their isoelectric pH, they are able to form more viscous films and therefore increase foam stability [28,38,39]. Econd was the parameter with the most outliers in Model 4; however, as it is directly related to TDS, this may be easily corrected.
The higher accuracies and performance of the Models 3 and 4 are in accordance with other studies [20,40,41,42,43,44], which have found that the use of specific parameters that are directly related to the targets have provided better results with more robust models than the use of raw NIR values. Hence, in Models 3 and 4, color, foam, and bubble parameters were used as these are directly influenced/related by/to all the variables used as targets, as shown in the PCA (Figure 3).
Models 3 and 4 may be used as accurate, reliable, rapid, and cost-effective tools to predict a total of 12 parameters from aromas and other chemical data, which may ease the quality control and assurance within the production line. Furthermore, it may be used as part of the product development to screen the samples and select those with the highest quality traits without the need to take all samples to laboratory analyses, which tend to be time-consuming and more expensive due to the equipment and consumables required.
5. Conclusions
Relationships between the color- and foam-related parameters of beers and their volatile aromatic compounds, as well as other physicochemical measurements such as pH, salt, Brix, and total dissolved solids, among others, were found. Based on these findings, the models with an AI approach were developed for the rapid and accurate assessment of commercial beers. The models that were based on low-cost robotics and sensors were more accurate than those produced based on NIR spectroscopy. These results are very encouraging since robotics and sensors used in this study are significantly less expensive compared with the NIR instrumentation used (10% of NIR retail price), which can be readily implemented in the breweries as a portable device rather than sending samples to specialized laboratories. Although these models may still be improved by feeding them with data of more samples/brands, these may already be implemented at the end of the brewing process and as a rapid assessment of small trials to fine-tune specific requirements in terms of aroma profiles and chemometrics that are better adjusted to consumer preferences or beer styles. Limitations of this study are based on further model construction for other specific aromas and chemometrics, which require objective measurements using GC-MS or NIR spectrometry. However, this required information can be obtained through the collaboration with research institutions or obtained from commercial laboratories. Further studies may focus on the attachment of an electronic nose to the RoboBEER for the assessment of off-flavors and off-aromas for the early detection of faults in the product within the different stages of production to obtain a near real-time assessment of beers in terms of aroma profiles, common fault detection, and liking of consumers.
Supplementary Materials
The following are available online at https://www.mdpi.com/2311-5637/6/2/56/s1, Table S1. Mean values of the RoboBEER foam and color parameters with letters of significance (a–k) according to the ANOVA and Fishers least significant difference post hoc test (α = 0.05). Abbreviations of the samples are found in Table 1; Table S2. Mean values of the peak area of the aromatic volatile compounds with letters of significance (a–l) according to the ANOVA and Fishers least significant difference post hoc test (α = 0.05). Abbreviations of the samples are found in Table 1; Table S3. Mean values of the chemical data with letters of significance (a–q) according to the ANOVA and Fishers least significant difference post hoc test (α = 0.05). Abbreviations of the samples are found in Table 1.
Author Contributions
Conceptualization, C.G.V. and S.F.; Data curation, C.G.V. and S.F.; Formal analysis, C.G.V.; Investigation, C.G.V. and S.F.; Methodology, C.G.V.; Project administration, S.F.; Resources, S.F.; Software, C.G.V. and S.F.; Supervision, S.F.; Validation, C.G.V. and S.F.; Visualization, C.G.V. and S.F.; Writing—original draft, C.G.V. and S.F. All authors have read and agreed to the published version of the manuscript.
Funding
This research received no external funding.
Conflicts of Interest
The authors declare no conflict of interest.
References
- Gonzalez Viejo, C.; Torrico, D.; Dunshea, F.; Fuentes, S. Emerging Technologies Based on Artificial Intelligence to Assess the Quality and Consumer Preference of Beverages. Beverages 2019, 5, 62. [Google Scholar] [CrossRef] [Green Version]
- Euromonitor-International. Beer in Australia; Euromonitor International: London, UK, 2015; p. 15. [Google Scholar]
- Euromonitor-International. Statistics—Alcoholic Drinks; Euromonitor-International: London, UK, 2018. [Google Scholar]
- Carbone, A.; Quici, L. Craft beer mon amour: An exploration of Italian craft consumers. Br. Food J. 2020. [Google Scholar] [CrossRef]
- Aquilani, B.; Laureti, T.; Poponi, S.; Secondi, L. Beer choice and consumption determinants when craft beers are tasted: An exploratory study of consumer preferences. Food Qual. Prefer. 2015, 41, 214–224. [Google Scholar] [CrossRef]
- Wang, L.; Sun, D.W.; Pu, H.; Cheng, J.H. Quality analysis, classification, and authentication of liquid foods by near-infrared spectroscopy: A review of recent research developments. Crit. Rev. Food Sci. Nutr. 2017, 57, 1524–1538. [Google Scholar] [CrossRef]
- Gonzalez Viejo, C.; Fuentes, S.; Godbole, A.; Widdicombe, B.; Unnithan, R.R. Development of a low-cost e-nose to assess aroma profiles: An artificial intelligence application to assess beer quality. Sens. Actuators B Chem. 2020, 308, 127688. [Google Scholar] [CrossRef]
- Dell Technologies. The Difference Between AI, Machine Learning, and Robotics. Available online: https://www.delltechnologies.com/en-us/perspectives/the-difference-between-ai-machine-learning-and-robotics/ (accessed on 15 April 2020).
- Silva, T.; Godinho, M.D.S.; Oliveira, A.E.D. Identification of pale lager beers via image analysis. Lat. Am. Appl. Res. 2011, 41, 141–145. [Google Scholar]
- Fengxia, S.; Yuwen, C.; Zhanming, Z.; Yifeng, Y. Determination of beer color using image analysis. J. Am. Soc. Brew. Chem. 2004, 62, 163–167. [Google Scholar] [CrossRef]
- Hepworth, N.; Varley, J.; Hind, A. Characterizing gas bubble dispersions in beer. Food Bioprod. Process. 2001, 79, 13–20. [Google Scholar] [CrossRef]
- Yasui, K.; Yokoi, S.; Shigyo, T.; Tamaki, T.; Shinotsuka, K. A customer-oriented approach to the development of a visual and statistical foam analysis. J. Am. Soc. Brew. Chem. 1998, 56, 152–158. [Google Scholar] [CrossRef]
- Cimini, A.; Pallottino, F.; Menesatti, P.; Moresi, M. A low-cost image analysis system to upgrade the rudin beer foam head retention meter. Food Bioprocess Technol. 2016, 9, 1587–1597. [Google Scholar] [CrossRef]
- Gonzalez Viejo, C.; Fuentes, S.; Li, G.; Collmann, R.; Condé, B.; Torrico, D. Development of a robotic pourer constructed with ubiquitous materials, open hardware and sensors to assess beer foam quality using computer vision and pattern recognition algorithms: RoboBEER. Food Res. Int. 2016, 89, 504–513. [Google Scholar] [CrossRef]
- Condé, B.C.; Fuentes, S.; Caron, M.; Xiao, D.; Collmann, R.; Howell, K.S. Development of a robotic and computer vision method to assess foam quality in sparkling wines. Food Control 2017, 71, 383–392. [Google Scholar] [CrossRef]
- Gonzalez Viejo, C.; Torrico, D.; Dunshea, F.; Fuentes, S. The Effect of Sonication on Bubble Size and Sensory Perception of Carbonated Water to Improve Quality and Consumer Acceptability. Beverages 2019, 5, 58. [Google Scholar] [CrossRef] [Green Version]
- Santos, J.P.; Lozano, J. Real time detection of beer defects with a hand held electronic nose. In Proceedings of the 2015 10th Spanish Conference on Electron Devices (CDE), Madrid, Spain, 11–13 February 2015; pp. 1–4. [Google Scholar]
- Zhang, Y.; Jia, S.; Zhang, W. Predicting acetic acid content in the final beer using neural networks and support vector machine. J. Inst. Brew. 2012, 118, 361–367. [Google Scholar] [CrossRef]
- Gonzalez Viejo, C.; Fuentes, S.; Torrico, D.; Howell, K.; Dunshea, F. Assessment of Beer Quality Based on a Robotic Pourer, Computer Vision, and Machine Learning Algorithms Using Commercial Beers. J. Food Sci. 2018, 83, 1381–1388. [Google Scholar] [CrossRef]
- Gonzalez Viejo, C.; Torrico, D.; Dunshea, F.; Fuentes, S. Development of Artificial Neural Network Models to Assess Beer Acceptability Based on Sensory Properties Using a Robotic Pourer: A Comparative Model Approach to Achieve an Artificial Intelligence System. Beverages 2019, 5, 33. [Google Scholar] [CrossRef] [Green Version]
- Gonzalez Viejo, C.; Caboche, C.H.; Kerr, E.D.; Pegg, C.L.; Schulz, B.L.; Howell, K.; Fuentes, S. Development of a rapid method to assess beer foamability and quality based on relative protein content using RoboBEER and machine learning modeling. Beverages 2020, 6, 28. [Google Scholar] [CrossRef]
- Men, H.; Shi, Y.; Jiao, Y.; Gong, F.; Liu, J. Electronic nose sensors data feature mining: A synergetic strategy for the classification of beer. Anal. Methods 2018, 10, 2016–2025. [Google Scholar] [CrossRef]
- Nimsuk, N. Improvement of accuracy in beer classification using transient features for electronic nose technology. J. Food Meas. Charact. 2019, 13, 656–662. [Google Scholar] [CrossRef]
- Santos, J.P.; Lozano, J.; Aleixandre, M. Electronic noses applications in beer technology. Brew. Technol. 2017, 177. [Google Scholar] [CrossRef] [Green Version]
- Buss, D. Food Companies Get Smart About Artificial Intelligence. Food Technol. 2018, 72, 26–41. [Google Scholar]
- Gonzalez Viejo, C.; Fuentes, S.; Torrico, D.; Godbole, A.; Dunshea, F. Chemical characterization of aromas in beer and their effect on consumers liking. Food Chem. 2019, 293, 479–485. [Google Scholar] [CrossRef]
- Papadopoulou-Bouraoui, A.; Vrabcheva, T.; Valzacchi, S.; Stroka, J.; Anklam, E. Screening survey of deoxynivalenol in beer from the European market by an enzyme-linked immunosorbent assay. Food Addit. Contam. 2004, 21, 607–617. [Google Scholar] [CrossRef] [PubMed]
- Gonzalez Viejo, C.; Fuentes, S.; Torrico, D.; Howell, K.; Dunshea, F.R. Assessment of beer quality based on foamability and chemical composition using computer vision algorithms, near infrared spectroscopy and machine learning algorithms. J. Sci. Food Agric. 2018, 98, 618–627. [Google Scholar] [CrossRef] [PubMed]
- Pires, E.J.; Teixeira, J.A.; Brányik, T.; Vicente, A.A. Yeast: The soul of beer’s aroma—A review of flavour-active esters and higher alcohols produced by the brewing yeast. Appl. Microbiol. Biotechnol. 2014, 98, 1937–1949. [Google Scholar] [CrossRef] [Green Version]
- Hiralal, L.; Olaniran, A.O.; Pillay, B. Aroma-active ester profile of ale beer produced under different fermentation and nutritional conditions. J. Biosci. Bioeng. 2014, 117, 57–64. [Google Scholar] [CrossRef]
- Delcour, J.A.; Hoseney, R.C. Principles of Cereal Science and Technology; AACC International: St. Paul, MN, USA, 2010. [Google Scholar]
- Jablonská, J.; Pôbiš, T.; Timčák, G.M. Beer tourism in Slovakia. In Proceedings of the Geotour and Irse 2013: Strategies of Building Geotourist and Geoheritage Attractions, Wrocław, Poland, 25–27 September 2013; pp. 67–74. [Google Scholar]
- Gonzalez Viejo, C.; Fuentes, S.; Howell, K.; Torrico, D.; Dunshea, F. Integration of non-invasive biometrics with sensory analysis techniques to assess acceptability of beer by consumers. Physiol. Behav. 2019, 200, 139–147. [Google Scholar] [CrossRef]
- Liger-Belair, G.; Cilindre, C.; Gougeon, R.D.; Lucio, M.; Gebefügi, I.; Jeandet, P.; Schmitt-Kopplin, P. Unraveling different chemical fingerprints between a champagne wine and its aerosols. Proc. Natl. Acad. Sci. USA 2009, 106, 16545–16549. [Google Scholar] [CrossRef] [Green Version]
- Abeytilakarathna, P.; Fonseka, R.; Eswara, J.; Wijethunga, K. Relationship between total solid content and red, green and blue colour intensity of strawberry (Fragaria x ananassa Duch.) fruits. J. Agric. Sci. 2013, 8, 82. [Google Scholar] [CrossRef] [Green Version]
- Cayuela, J.A. Rapid NIR determination of alkyl esters in virgin olive oil. Grasas Y Aceites 2017, 68, 195. [Google Scholar] [CrossRef] [Green Version]
- Burns, D.A.; Ciurczak, E.W. Handbook of Near-Infrared Analysis; CRC press: Boca Raton, FL, USA, 2007. [Google Scholar]
- Bamforth, C.; Russell, I.; Stewart, G. Beer: A Quality Perspective; Elsevier Science: San Diego, CA, USA, 2011. [Google Scholar]
- Badui, S. Química de los Alimentos; Pearson Education: Naucalpan de Juarez, Estado de Mexico, México, 2006. [Google Scholar]
- Fuentes, S.; Tongson, E.; Torrico, D.D.; Gonzalez Viejo, C. Modeling Pinot Noir Aroma Profiles Based on Weather and Water Management Information Using Machine Learning Algorithms: A Vertical Vintage Analysis Using Artificial Intelligence. Foods 2020, 9, 33. [Google Scholar] [CrossRef] [PubMed] [Green Version]
- Gonzalez Viejo, C.; Fuentes, S.; Howell, K.; Torrico, D.; Dunshea, F. Robotics and computer vision techniques combined with non-invasive consumer biometrics to assess quality traits from beer foamability using machine learning: A potential for artificial intelligence applications. Food Control 2018. [Google Scholar] [CrossRef]
- Romero, M.; Luo, Y.; Su, B.; Fuentes, S. Vineyard water status estimation using multispectral imagery from an UAV platform and machine learning algorithms for irrigation scheduling management. Comput. Electron. Agric. 2018, 147, 109–117. [Google Scholar] [CrossRef]
- Gunaratne, T.M.; Gonzalez Viejo, C.; Gunaratne, N.M.; Torrico, D.D.; Dunshea, F.R.; Fuentes, S. Chocolate Quality Assessment Based on Chemical Fingerprinting Using Near Infra-red and Machine Learning Modeling. Foods 2019, 8, 426. [Google Scholar] [CrossRef] [Green Version]
- Fuentes, S.; Chacon, G.; Torrico, D.D.; Zarate, A.; Gonzalez Viejo, C. Spatial Variability of Aroma Profiles of Cocoa Trees Obtained through Computer Vision and Machine Learning Modelling: A Cover Photography and High Spatial Remote Sensing Application. Sensors 2019, 19, 3054. [Google Scholar] [CrossRef] [Green Version]
Figure 1.
Diagram showing the feedforward model with two layers using a tan-sigmoid function in the hidden layer and a linear transfer function in the output layer. Abbreviations: W: weights and b = bias.
Figure 1.
Diagram showing the feedforward model with two layers using a tan-sigmoid function in the hidden layer and a linear transfer function in the output layer. Abbreviations: W: weights and b = bias.

Figure 2.
Graphs depicting the normalized mean values of (a) color, foam, and bubble parameters measured with the RoboBEER, (b) aromas measured as the peak area of volatile compounds, and (c) chemical measurements. Bars represent the standard error, and abbreviations of the samples can be found in Table 1.

Figure 3.
Principal components analysis showing all color, foam, and bubble parameters measured with RoboBEER (red), volatile aromatic compounds (purple), and chemical measurements (black). Samples from top fermentation are shown in blue squares, bottom fermentation in green diamonds, and spontaneous fermentation in pink stars. Abbreviations: PC = principal component; sample labels can be found in Table 1.

Figure 4.
Regression models showing the data points of each parameter identified with different markers and colors. Abbreviations: R = correlation coefficient, T = targets.
Figure 4.
Regression models showing the data points of each parameter identified with different markers and colors. Abbreviations: R = correlation coefficient, T = targets.


Table 1.
Beer sample styles used for the study and their description.
| Beer Style | Country | Fermentation | Label | Seal | Net Content |
|---|---|---|---|---|---|
| Abbey Ale | Belgium | Top | L | Bottle cap | 330 mL |
| Porter | Poland | Top | Z | Bottle cap | 330 mL |
| Kolsch | Australia | Top | P | Bottle cap | 330 mL |
| Red Ale | USA | Top | RT | Bottle cap | 355 mL |
| Steam Ale | Australia | Top | SA | Bottle cap | 330 mL |
| Aged Ale | Scotland | Top | IG | Bottle cap | 330 mL |
| Sparkling Ale | Australia | Top | CS | Bottle cap | 375 mL |
| Pale Lager | Mexico | Bottom | C | Bottle cap | 355 mL |
| Pale Lager | Mexico | Bottom | XX | Bottle cap | 355 mL |
| Vienna Lager | USA | Bottom | BL | Bottle cap | 355 mL |
| Pale Lager | Netherlands | Bottom | H | Bottle cap | 330 mL |
| Pale Lager | Czech Republic | Bottom | BC | Bottle cap | 330 mL |
| German Pilsner | Czech Republic | Bottom | PU | Bottle cap | 330 mL |
| Lambic Cassis | Belgium | Spontaneous | LC | Cork + Bottle cap | 375 mL |
| Lambic Framboise | Belgium | Spontaneous | LF | Cork + Bottle cap | 375 mL |
| Lambic Gueuze | Belgium | Spontaneous | LG | Cork + Bottle cap | 375 mL |
| Lambic Kriek | Belgium | Spontaneous | LK | Cork + Bottle cap | 375 mL |
| Lambic Gueuze | Belgium | Spontaneous | OG | Cork | 375 mL |
| Lambic Gueuze | Belgium | Spontaneous | OT | Cork | 375 mL |
| Wild Saison | Australia | Spontaneous | LW | Bottle cap | 375 mL |
Table 2.
Statistical results of each stage of the four machine learning models showing the correlation coefficient (R) and performance based on means squared error (MSE).
Table 2.
Statistical results of each stage of the four machine learning models showing the correlation coefficient (R) and performance based on means squared error (MSE).
| Stage | Samples | Observations (Samples × Targets) | R | Performance (MSE) | Slope |
|---|---|---|---|---|---|
| Model 1 (Inputs: Near-infrared; Targets: Aromas) | |||||
| Training | 42 | 252 | 1.00 | <0.01 | 1.00 |
| Testing | 18 | 108 | 0.73 | 0.22 | 0.64 |
| Overall | 60 | 360 | 0.91 | - | 0.87 |
| Model 2 (Inputs: Near-infrared; Targets: Chemical data) | |||||
| Training | 42 | 252 | 1.00 | <0.01 | 1.00 |
| Testing | 18 | 108 | 0.75 | 0.11 | 0.67 |
| Overall | 60 | 360 | 0.93 | - | 0.90 |
| Model 3 (Inputs: RoboBEER; Targets: Aromas) | |||||
| Training | 42 | 252 | 0.99 | <0.01 | 1.00 |
| Testing | 18 | 108 | 0.96 | 0.04 | 1.00 |
| Overall | 60 | 360 | 0.99 | - | 1.00 |
| Model 4 (Inputs: RoboBEER; Targets: Chemical data) | |||||
| Training | 42 | 252 | 0.99 | <0.01 | 1.00 |
| Testing | 18 | 108 | 0.95 | 0.03 | 1.00 |
| Overall | 60 | 360 | 0.98 | - | 1.00 |
© 2020 by the authors. Licensee MDPI, Basel, Switzerland. This article is an open access article distributed under the terms and conditions of the Creative Commons Attribution (CC BY) license (http://creativecommons.org/licenses/by/4.0/).
Share and Cite
MDPI and ACS Style
Gonzalez Viejo, C.; Fuentes, S. Beer Aroma and Quality Traits Assessment Using Artificial Intelligence. Fermentation 2020, 6, 56. https://doi.org/10.3390/fermentation6020056
AMA Style
Gonzalez Viejo C, Fuentes S. Beer Aroma and Quality Traits Assessment Using Artificial Intelligence. Fermentation. 2020; 6(2):56. https://doi.org/10.3390/fermentation6020056
Chicago/Turabian StyleGonzalez Viejo, Claudia, and Sigfredo Fuentes. 2020. "Beer Aroma and Quality Traits Assessment Using Artificial Intelligence" Fermentation 6, no. 2: 56. https://doi.org/10.3390/fermentation6020056
Note that from the first issue of 2016, this journal uses article numbers instead of page numbers. See further details here.