A Digital Approach to Model Quality and Sensory Traits of Beers Fermented under Sonication Based on Chemical Fingerprinting


Digital Agriculture, Food and Wine Sciences Group, School of Agriculture and Food, Faculty of Veterinary and Agricultural Sciences, University of Melbourne, Melbourne, VIC 3010, Australia
*
Author to whom correspondence should be addressed.
Fermentation 2020, 6(3), 73; https://doi.org/10.3390/fermentation6030073
Submission received: 19 June 2020
/
Revised: 6 July 2020
/
Accepted: 20 July 2020
/
Published: 21 July 2020
Abstract
:The development of digital tools based on artificial intelligence can produce affordable and accurate methodologies to assess quality traits and sensory analysis of beers. These new and emerging technologies can also assess new products in a near real-time fashion through virtual simulations before the brewing process. This research was based on the development of specific digital tools (four models) to assess quality traits and sensory profiles of beers produced using sonication and traditional brewing techniques. Results showed that models developed using supervised machine learning (ML) regression algorithms based on near-infrared spectroscopy (NIR) were highly accurate in the estimation of physicochemical parameters (Model 1; R = 0.94; b = 0.91). Outputs from Model 1 were then used as inputs to obtain estimations of the intensity of sensory descriptors (Model 2; R = 0.99; b = 0.98), liking of sensory attributes (Model 3; R = 0.97; b = 0.99), and the classification of fermentation treatments using supervised classification ML algorithms (Model 4; 96% accuracy). These new digital tools can aid craft brewing companies for product development at lower costs and maintain specific quality traits and sensory profiles, creating original styles of beers to get positioned in the market.
1. Introduction
The craft beer industry is growing around the world, which has been driven by the increased requirements of higher quality of beers by consumers [1,2,3]. However, there is minimal reliance on scientific tests, such as physicochemical or sensory analysis of beers produces, making the process dependent on the brewer’s experience and trial and error, especially in craft breweries. Some of the larger brewing companies rely more on the familiarity of products and styles, which are maintained with sensory and physicochemical analyses commonly made in-house and using traditional methods, which are time-consuming and expensive [4,5,6,7].
Some important quality traits of beers related to the visual attributes, such as foamability and bubble size, have been shown in previous research to be one of the first unconscious assessments from consumers [3,8,9,10,11,12], which are also important parameters to aid in the release of flavor, aromas, and the avoidance of oxidation of beer that can produce off-flavors [3,13,14,15]. These specific traits can be achieved through the selection of materials for the brewing process and the fermentation type chosen to achieve a specific style [14,16]. However, it has been recently demonstrated that foamability, foam stability, bubble size, and beer organoleptic perception by consumers can be modified in beers through a sonication process (audible frequencies) applied either in the fermentation or carbonation part of the brewing process [17]. Similar effects have been observed in the application of sonication of carbonated water [18].
The objective effects of different brewing techniques on the final beers are difficult to assess since they require either sending samples to specialized laboratories, having those laboratories or small versions of them, with specialized or trained personnel in-house, outsourcing sensory analysis services, or again having a small and uncontrolled version of sensory analysis in-house. These practices require considerable investments of time and money that, in many situations, can only be afforded by medium to large brewing companies [6,7,19].
Artificial intelligence, robotics, and machine learning (ML) have been applied recently in the brewing industry to obtain digital tools that can be affordable, cost-effective, and requiring do-it-yourself (DIY) instrumentation with highly accurate results. One of these advances for the physicochemical assessment of beers is using the RoboBEER pourer (The University of Melbourne, Parkville, VIC, Australia), which is coupled with computer vision and non-invasive sensors to assess the gas release of beers (electronic nose) [6,16]. Outputs from this robot have been modeled using machine learning to assess the sensory properties of beers [4], consumers’ acceptability [9], proteins [19], aromas [6], and the type of fermentation (top, bottom, or spontaneous [16]).
Near-infrared (NIR) spectroscopy offers a chemical fingerprinting of beers that can be modeled to obtain other important parameters, such as consumer appreciation in terms of quality, liking, and purchase intent, that can be applied without the requirement of a sensory panel. Some authors have used NIR to assess the quality parameters of beer based on real extract, alcohol concentration, and prediction of acetic acid using artificial neural networks (ANNs; [20]). Grassi et al. [21] used Fourier-transformation NIR in the fermentation stage to predict Brix, biomass, and pH using ML based on locally weighted regression (LWR). Furthermore, Gonzalez Viejo et al. [22] used NIR coupled with ANN to predict Brix, alcohol content, maximum volume of foam, and pH. On the other hand, Giovenzana et al. [23] used visible/NIR spectroscopy to predict soluble solids and pH as quality parameters of beer during the fermentation stage.
This paper describes the development of digital tools based on artificial intelligence to obtain physicochemical characteristics, sensory appreciation (intensities) from a trained panel, liking/acceptability, and classification of beer samples according to sonication treatments (control, sonication during fermentation, and sonication during carbonation) based on NIR spectroscopy. The models obtained from this work can be easily applied from craft to medium and larger brewing companies for beer testing, product development, simulations of quality appreciation, and specific traits of beers before the brewing process.
2. Materials and Methods
2.1. Sample Preparation
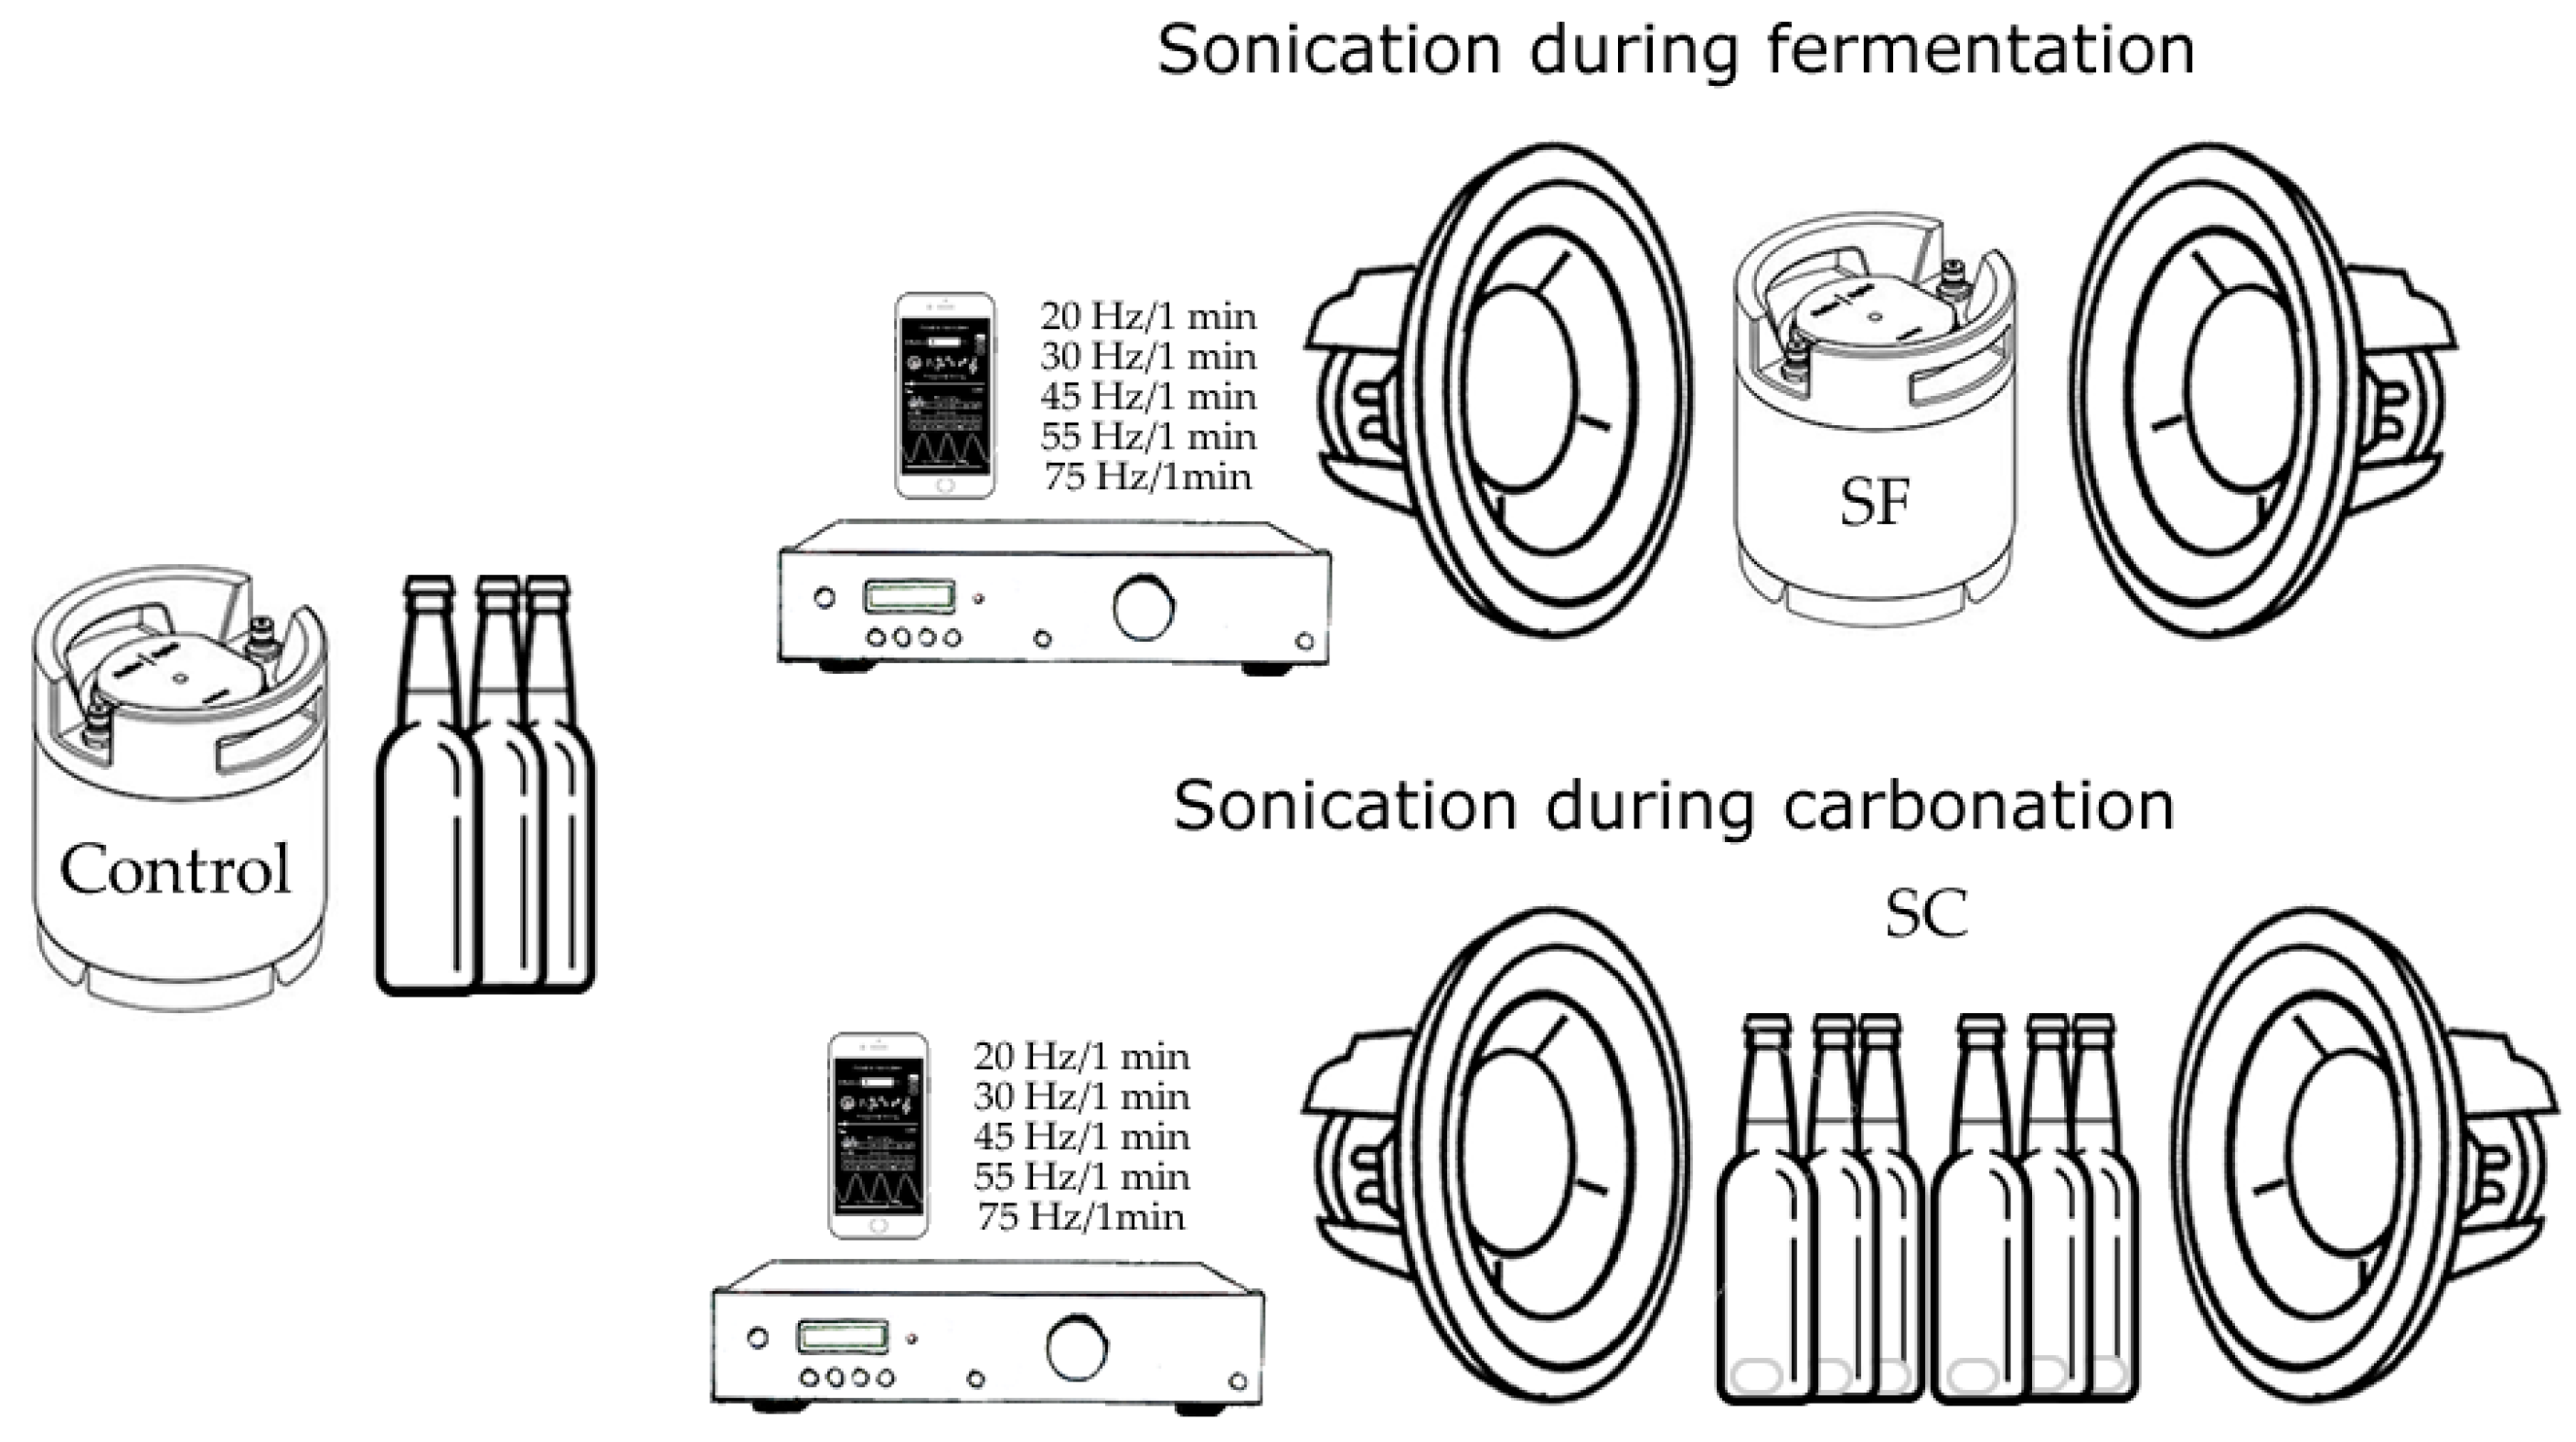
Triplicates of two bottles obtained from three batches of three different treatments (N = 54) of English-style India Pale Ale beers (IPA, Berlin IPA, BrewBaker, Berlin, Germany) were used for the study. All samples were prepared using the PicoBrew S machine (PicoBrew, Seattle, WA, USA). The treatments applied were the (i) control, (ii) sonication applied during the fermentation, and (iii) sonication applied during the natural in-bottle carbonation (Table 1). The sonication treatments consisted of the application of audible sounds at five different frequencies (20, 30, 45, 55, and 75 Hz at −4 dB) for 5 min (1 min for each frequency) using two sub-woofers Response CW2199 (Jaycar Electronics, Sydney, NSW, USA), a DigiTech AA0479 amplifier (DigiTech, Sandy, UT, USA), and an Audio Function Generator application (Thomas Gruber) for iPhone (Apple Inc., Cupertino, CA, USA; Figure 1), as described by Gonzalez Viejo et al. [17,18]. dB uses a logarithmic scale in the master volume; therefore, a negative value as the one used for this study (−4 dB) means that there are some soundwaves physically present, but they may not be audible.
2.2. Physicochemical Measurements
2.2.1. Physical Measurements—RoboBEER
Each bottle/replicate from each batch and treatment was analyzed for physical parameters related to foam and bubbles, as well as alcohol gas release and carbon dioxide (CO2) release using the RoboBEER robotic pourer (The University of Melbourne, Parkville, VIC, Australia) [16]. A 5-min video of the beer pouring was recorded and analyzed using computer vision algorithms developed in Matlab® R2020a (Mathworks, Inc., Natick, MA, USA), as described by Gonzalez Viejo et al. [16]. The parameters and abbreviations obtained from this analysis are shown in Table 2.
2.2.2. Near-Infrared Spectroscopy
Near-infrared (NIR) absorbance values within the 1596–2396 nm range were measured using a microPHAZIR™ RX Analyzer (Thermo Fisher Scientific, Waltham, MA, USA). As described by Gonzalez Viejo et al. [22], Whatman® filter paper (quality grade 3; diameter: 7 cm; Whatman plc. Maidstone, UK) was soaked in the beer samples (N = 54) at room temperature (20–23 °C) and measured with the device with the white background on top to avoid the interference of any signal noise from the environment. Additionally, the means of triplicate readings of the dry filter paper were subtracted from the soaked filters to remove the cellulose overtones and to obtain only the beer-related reflectance results. To enhance peaks and for plotting purposes, the Savitzky–Golay first derivative was obtained as a signal transformation method using The Unscrambler X ver. 10.3 (CAMO Software, Oslo, Norway).
2.2.3. Chemical Measurements
A pH meter (QM-1670, DigiTech, Sandy, UT, USA) was used to measure 50 mL of each replicate of each treatment at ambient temperature (~23 °C). The pH meter was previously calibrated with a buffer solution at pH 7.0. Furthermore, 60-mL samples were used to measure alcohol in the liquid using an alcohol meter Alcolyzer Wine M (accuracy: <0.1% vv−1; Anton Paar GmbH, Graz, Austria) in the wine extension mode. On the other hand, 150-mL samples were used to measure viscosity with a Brookfield viscometer DV-II+ (AMETEK Brookfield, Middleborough, MA, USA) and an RV02 spindle (50 rpm for 20 s; [17]).
2.3. Sensory Evaluation
2.3.1. Descriptive Sensory Session
A sensory session with 10 trained participants from The University of Melbourne (UoM; Ethics ID: 1545786.2) was conducted. All participants were regular beer consumers and trained according to the quantitative descriptive analysis (QDA®) method. The session was conducted in the sensory laboratory in a focus group-type room located in the Faculty of Veterinary and Agricultural Sciences of the UoM. Participants evaluated the triplicates (three batches) of each treatment, and these were served in 1-oz clear plastic cups at 4 °C. Samples were labeled with 3-digit random codes, and panelists were provided with water and water crackers to cleanse the palate. The assessment of visual attributes consisted of watching 20-s videos of the pouring of the samples using the RoboBEER to ensure all participants evaluated the samples under the same conditions. The BioSensory Application (App; The University of Melbourne, Parkville, VIC, Australia; [24]) was used to display the videos and questionnaire, which consisted of evaluating the intensity of sensory attributes in a 15-cm non-structured scale (Table 3; [17]).
2.3.2. Consumer sensory session
A sensory session was conducted with 30 regular beer consumers recruited via email from the staff and students from the UoM (ethics ID: 1545786.2). This session was carried out in individual booths with uniform white light-emitting diode (LED) lights at room temperature (~23 °C). Like the descriptive sensory test, the BioSensory app was used to display the questionnaire (Table 4) and videos of the beer pouring for the visual assessment. Samples were labeled with three-digit random codes and served in 1-oz clear plastic cups at 4 °C; participants were provided with water crackers and water to cleanse their palate between samples.
2.4. Statistical Analysis and Machine Learning Modeling
Two correlation matrices were developed using Matlab® R2020a to show significant (p < 0.05) correlations between (i) the physicochemical parameters and the intensity of sensory attributes from the descriptive test, and (ii) the physicochemical parameters and the liking of sensory attributes from the consumer test.
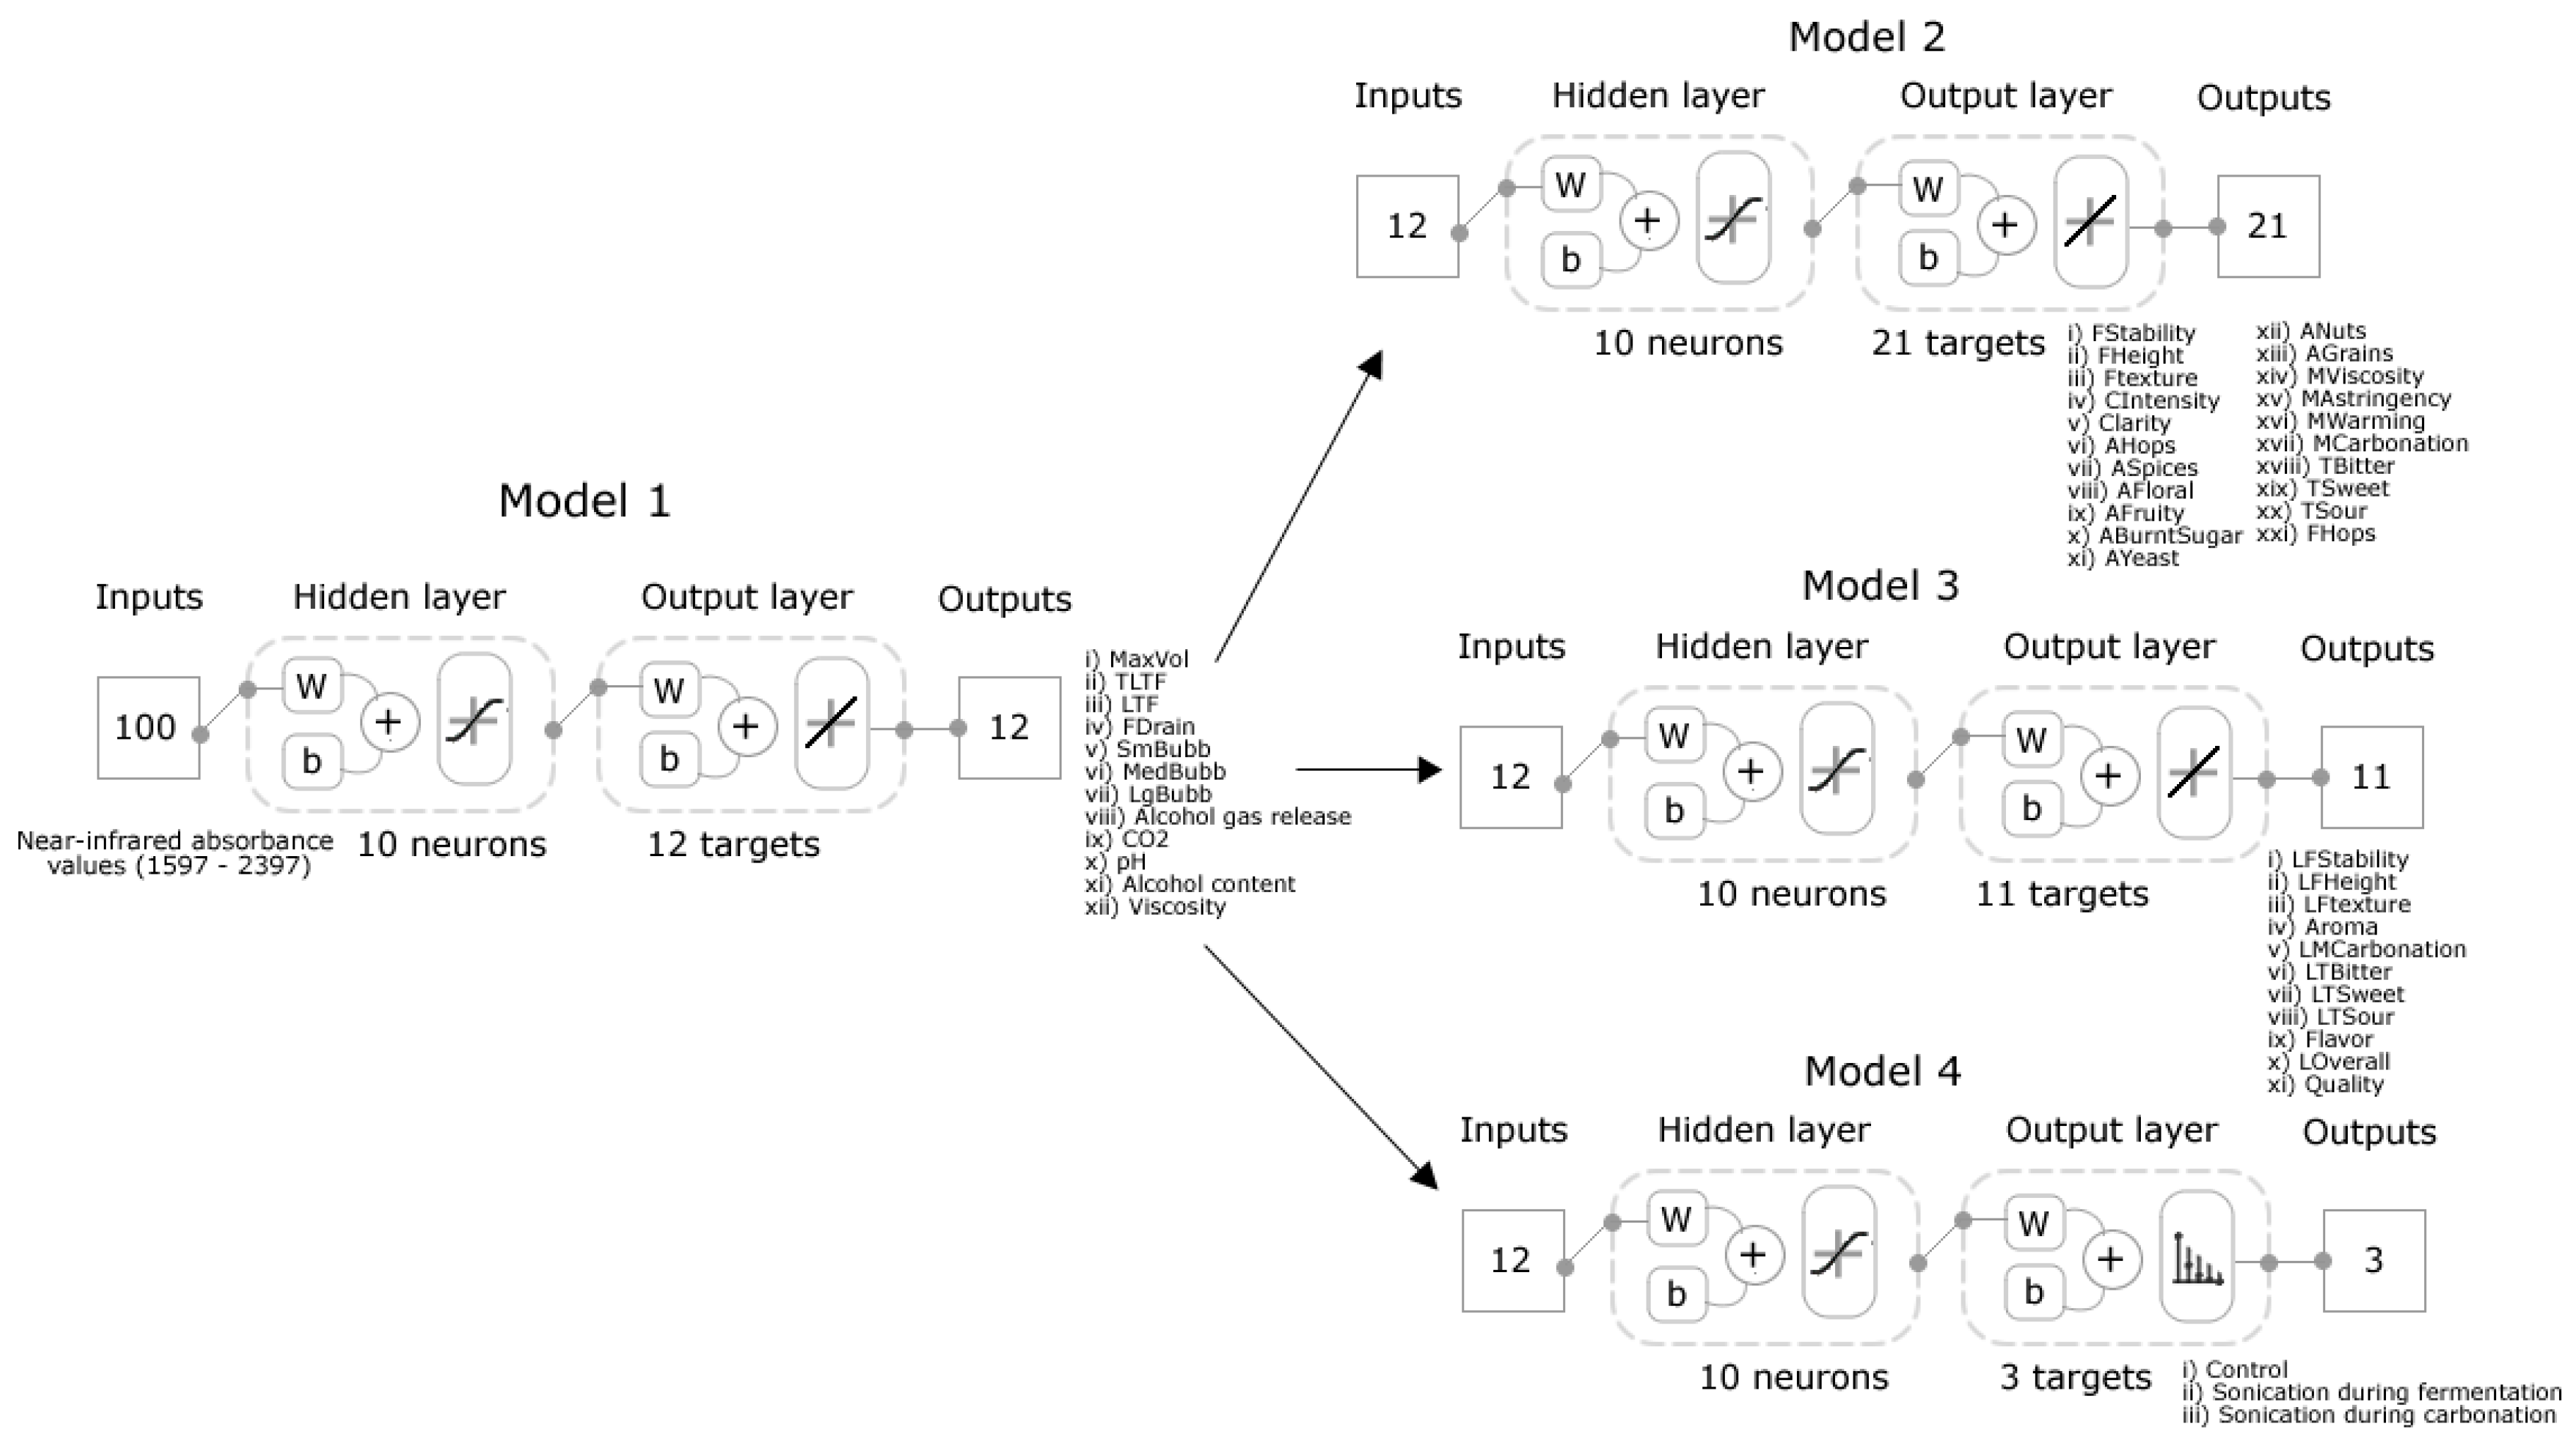
Three ML regression models were developed using ANNs with a customized code written in Matlab® R2020a. This code was able to test 17 different supervised training algorithms to find the best model based on performance and the highest accuracy based on the correlation coefficient (R). Model 1 was developed using the NIR absorbance values (1596–2396 nm) as inputs to predict 12 physicochemical parameters (Table 2, plus pH, alcohol content, and viscosity). Model 2 and Model 3 were constructed using the outputs from Model 1 (physicochemical parameters) as inputs to predict the intensity of 21 sensory descriptors (Model 2; Table 3) and the liking of 11 sensory attributes (Model 3; Table 4). The three models (Figure 2) were developed using the Levenberg Marquardt training algorithm with random data division (training: 70% samples; validation: 15% samples; testing: 15% samples). Performance was assessed using the means squared error (MSE) algorithm. Outliers from the overall models were evaluated based on the 95% confidence bounds.
Model 4 was based on pattern recognition and developed using a code written in Matlab® R2020a, which was able to test 17 different supervised training algorithms to find the best model performance (data not shown). The Levenberg Marquardt training algorithm resulted the highest performance and accuracy. This model was constructed using the outputs from Model 1 (physicochemical parameters) as inputs to classify the samples into the treatments (control, SF, and SC; Figure 2). A random data division was used with 70% of the samples for training, 15% for validation, and 15% for testing. Performance was assessed using the means squared error (MSE) algorithm.
3. Results
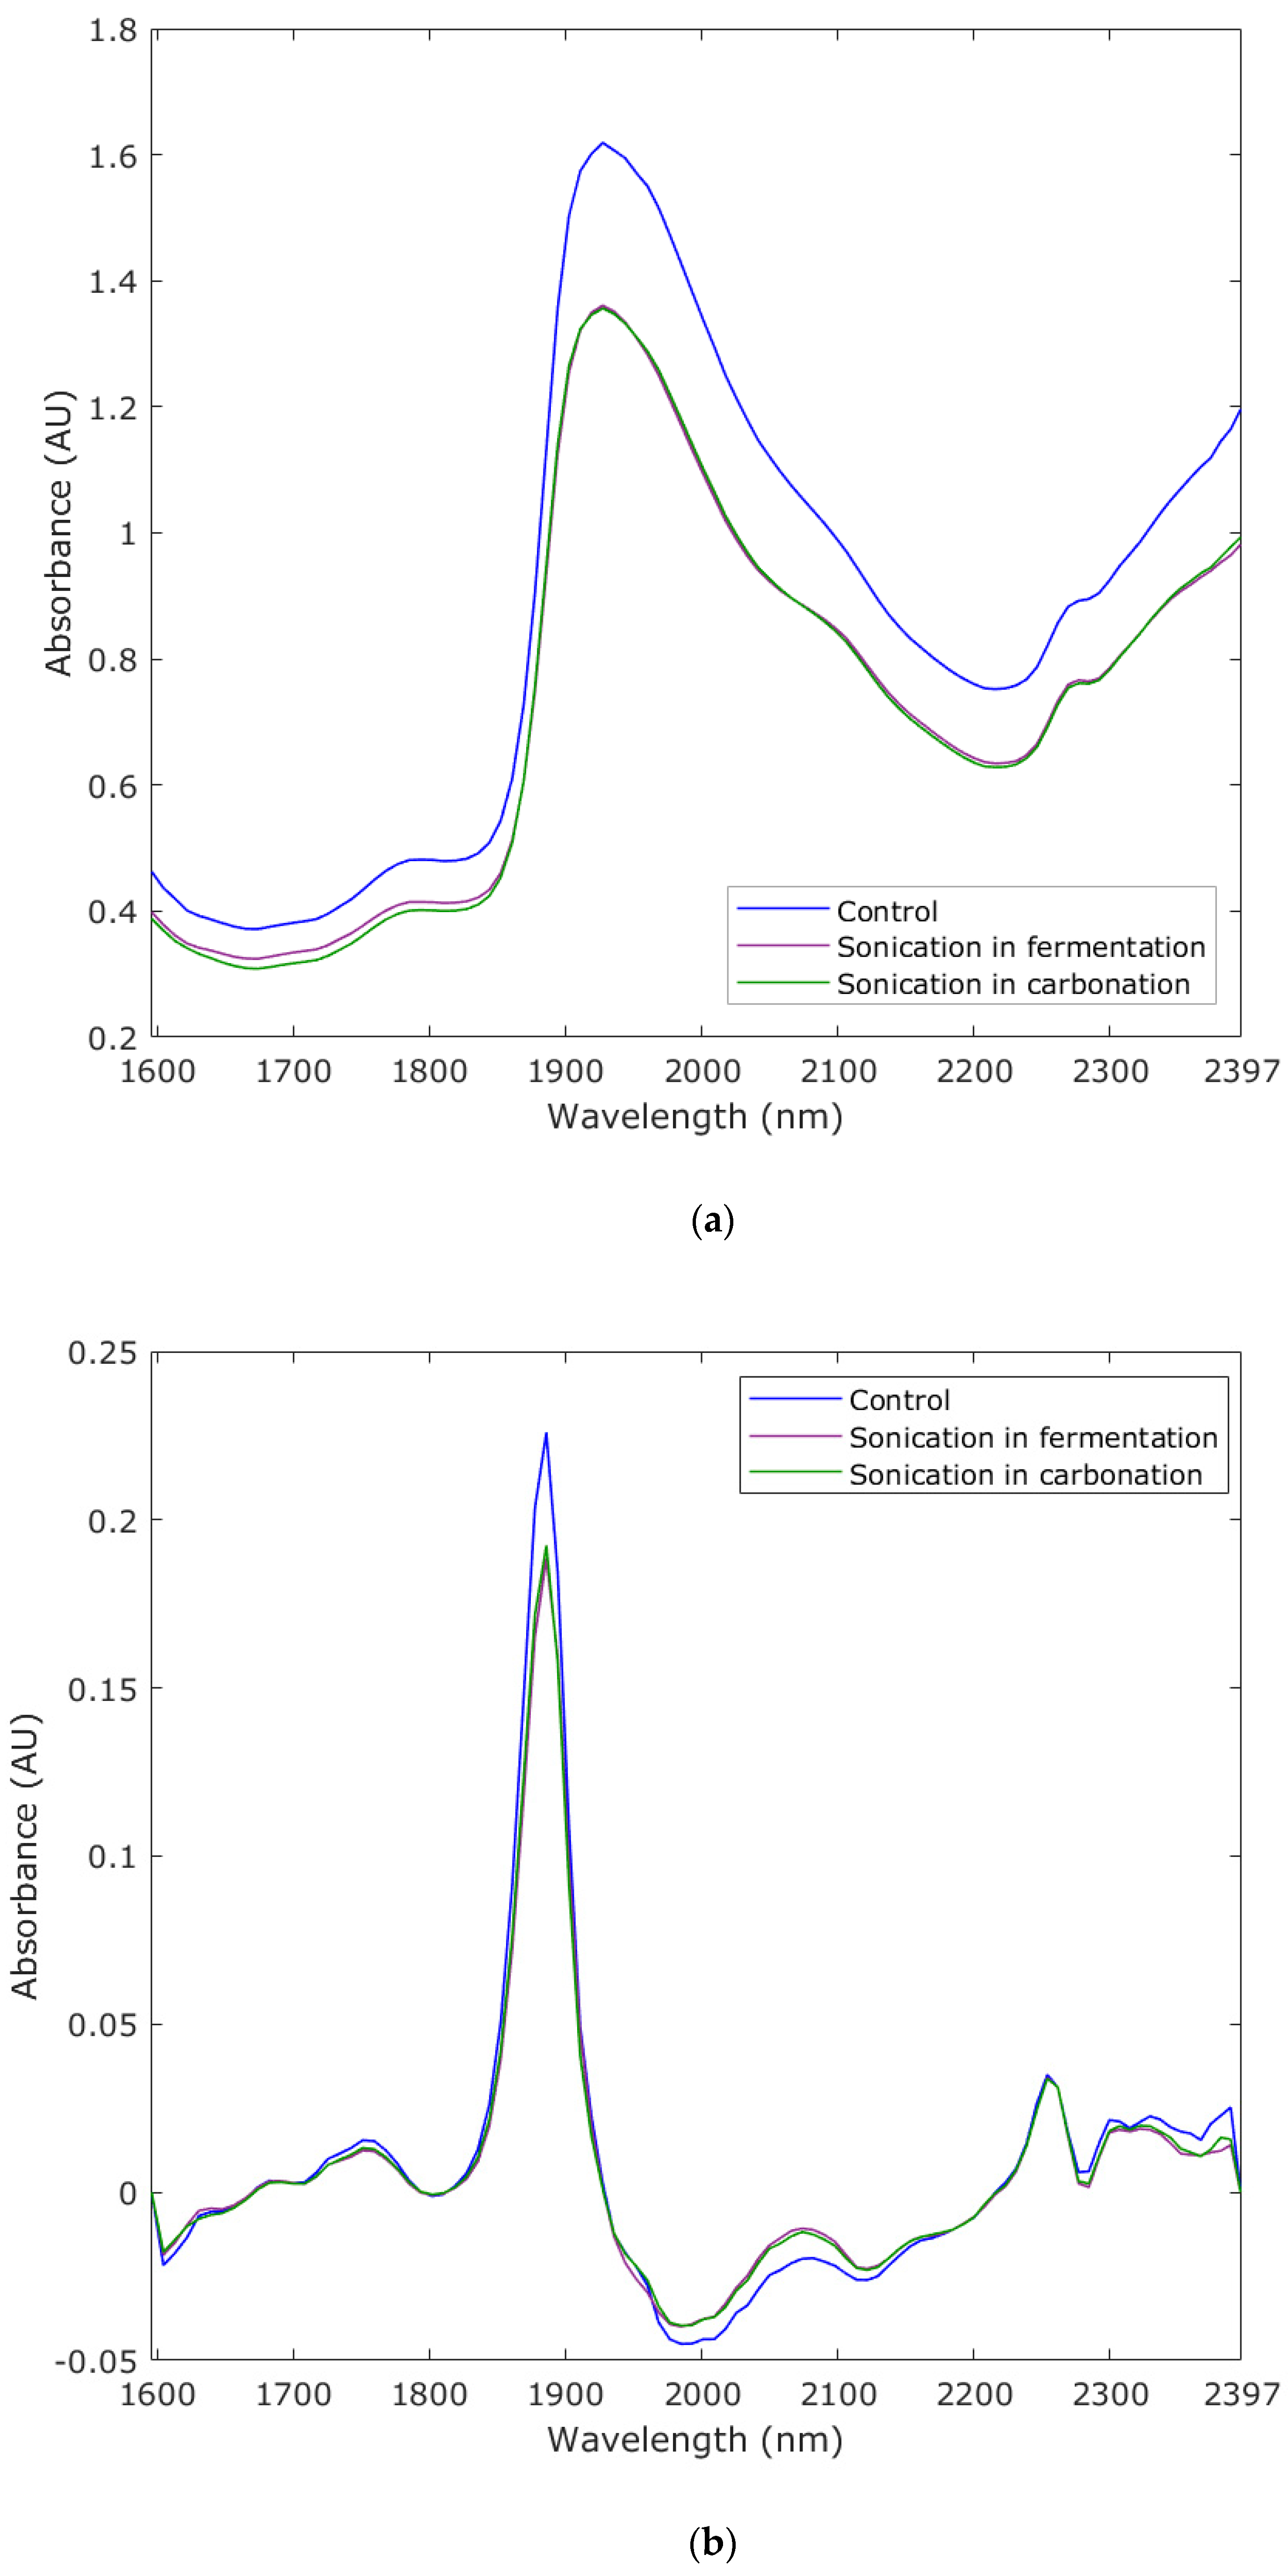
Figure 3a shows the NIR curves with the raw absorbance values; it can be observed that the major peak was 1927 nm, but there are other overtones present at 2270 nm and > 2300 nm. Figure 3b shows the curves using the first derivative of the NIR absorbance values, and enhanced peaks at 1759 nm, 1886 nm, 2074 nm, and >2250 nm can be observed.
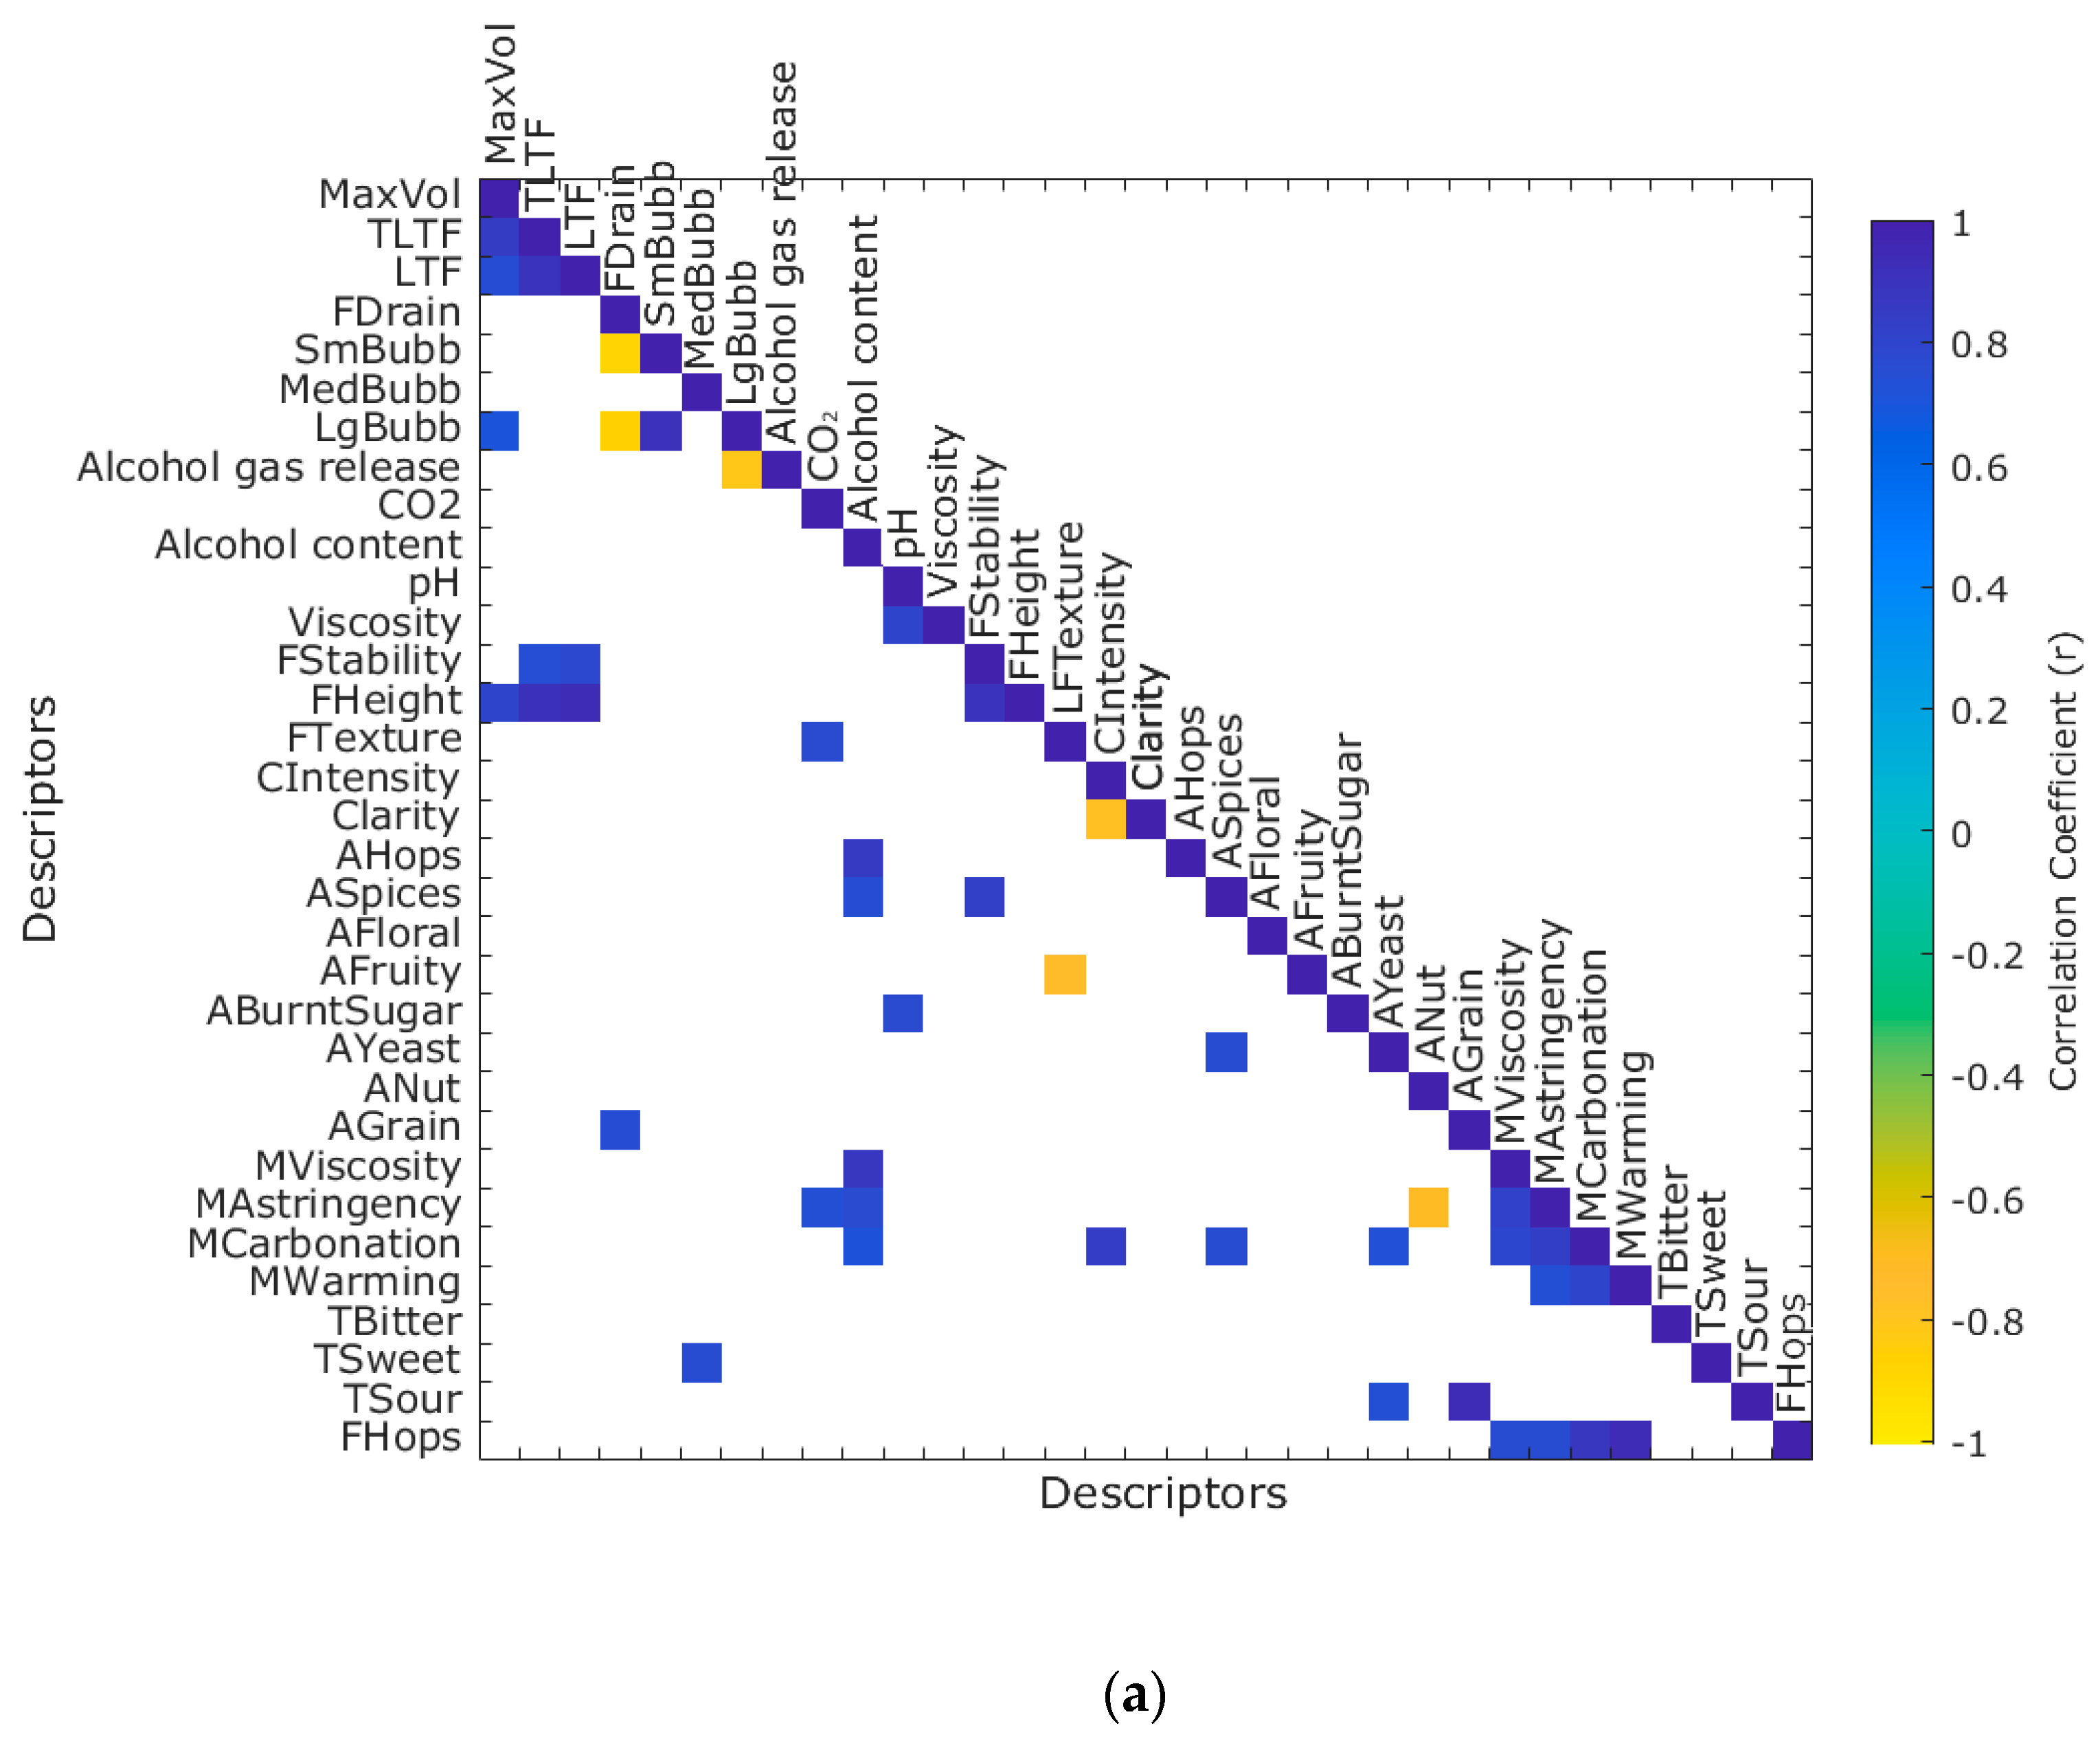
Figure 4a shows the significant correlations between the physicochemical parameters and the intensity of sensory descriptors assessed with the trained panel. It was found that MaxVol was positively correlated with FHeight (r = 0.80), TLTF, and LTF had a positive correlation with FStability (r = 0.74 and r = 0.77, respectively) and FHeight (r = 0.91 and r = 0.94, respectively). Furthermore, FDrain was positively correlated with AGrain (r = 0.75), while LgBubb had a negative correlation with alcohol gas release (r = −0.82). On the other hand, CO2 had a positive correlation with FTexture (r = 0.77) and MAstringency (r = 0.73). There was a positive correlation between alcohol content and MCarbonation (r = 0.72), MAstringency (r = 0.77), MViscosity (r = 0.87), ASpices (r = 0.75), and AHops (r = 0.86).
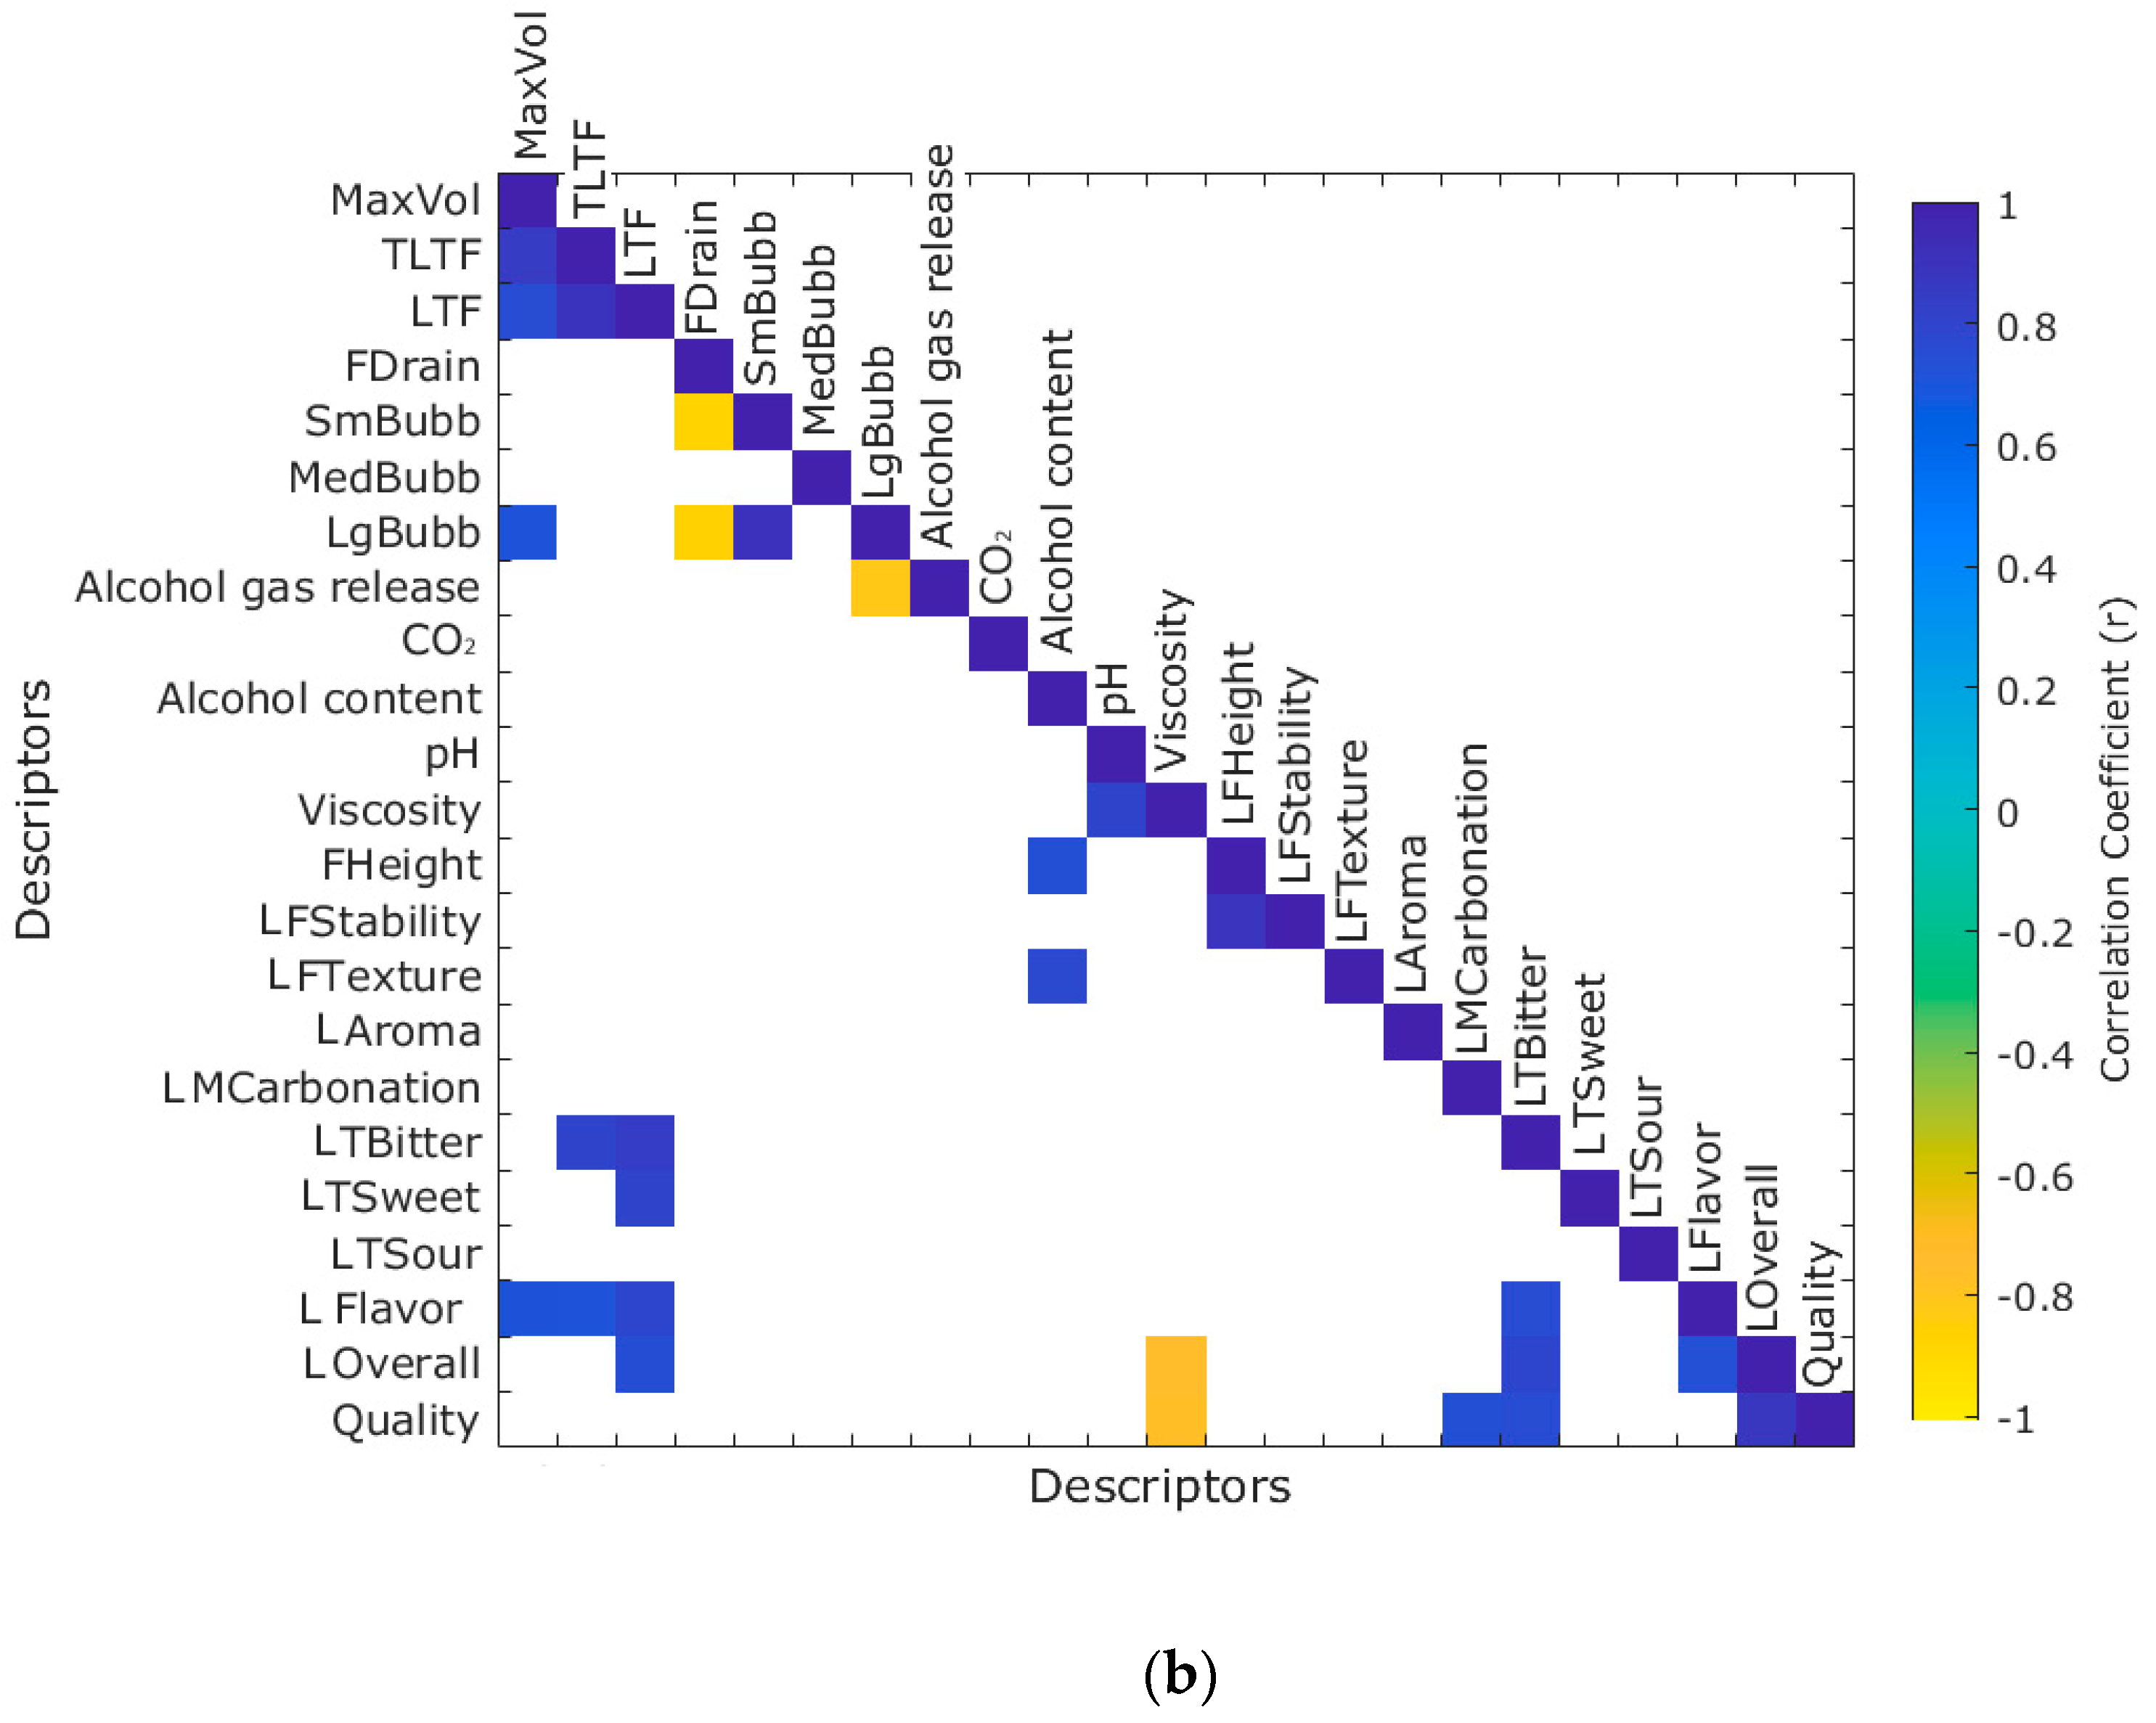
Figure 4b shows the significant correlations between the physicochemical parameters and the liking of sensory attributes from the consumer test. It can be observed that MaxVol, TLTF, and LTF had a positive correlation with flavor (r = 0.72, r = 0.71, and r = 0.79, respectively); additionally, TLTF and LTF had a positive correlation with LTBitter (r = 0.80, and r = 0.84, respectively). Likewise, LTF was positively correlated with LTSweet (r = 0.80) and overall liking (r = 0.74). Alcohol content had a positive correlation with LFTexture (r = 0.77), while viscosity was negatively correlated with overall liking (r = −0.76) and quality (r = −0.77).
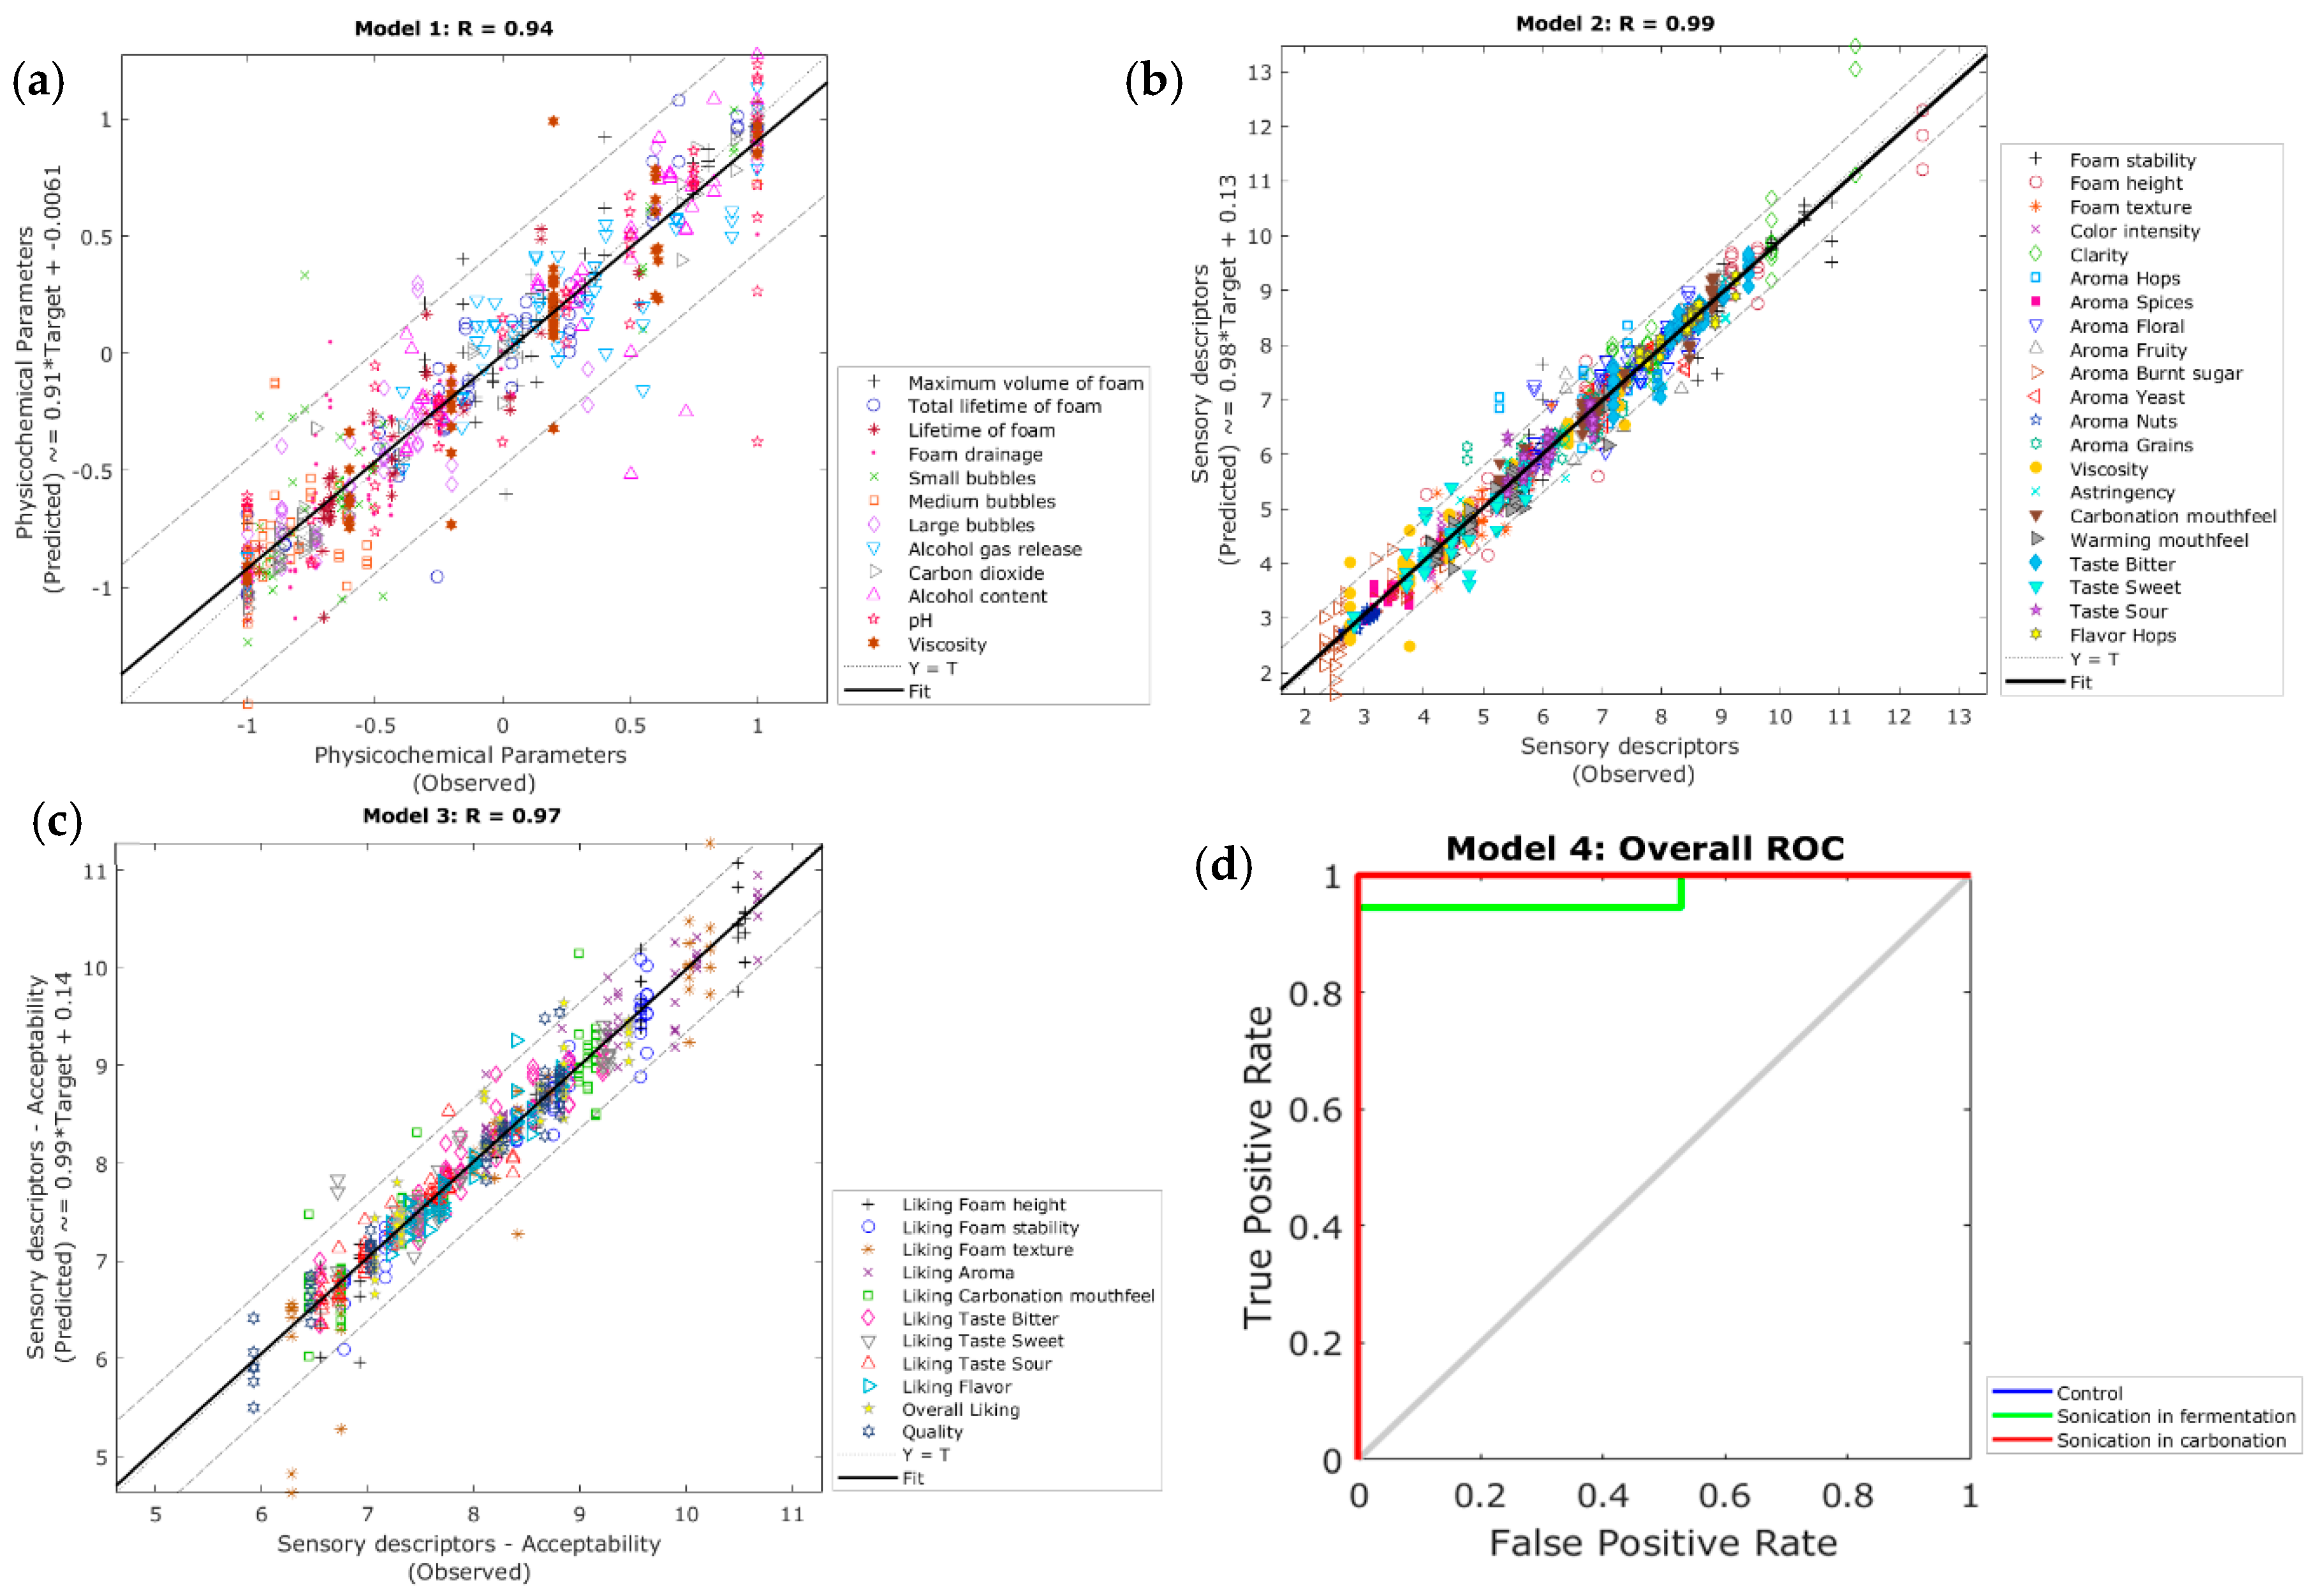
Table 5 shows the statistical data from the four ANN models constructed. It can be observed that Model 1 had a high overall accuracy (R = 0.94) to predict the 12 physicochemical parameters (Figure 5a). Furthermore, this model had 4.9% (32 out of 648) of outliers based on the 95% confidence bounds. On the other hand, Model 2 had a very high overall correlation coefficient (R = 0.99) to predict the intensity of 21 sensory descriptors (Figure 5b), with 5.0% (57 out of 1134) of outliers calculated from the 95% confidence bounds. Similarly, Model 3 was highly accurate (R = 0.97) at predicting the liking of 11 sensory attributes (Figure 5c) and had 5.1% (30 out of 594) of outliers based on the 95% confidence bounds. The three models had a slope (b) close to the unity (b ~ 1). They did not present signs of under- or overfitting as the training performance was lower than the other stages, and the validation and testing performance were the same. All models presented similar results after several retraining attempts.
Model 4 presented a high overall accuracy (96%) to classify samples into the treatments (control, SF, and SC). Figure 5d shows the overall receiver operating characteristics (ROC) curve, which depicts the true positive (sensitivity) and false-positive (specificity) rates for each treatment. This model did not present signs of overfitting as the training performance was lower than the validation and testing, and the latter were close to each other. These models also presented similar results after several retraining attempts.
4. Discussion
The NIR curve developed with raw absorbance values (Figure 3a) is consistent with that reported by McClure and Stanfield for beers [25]. According to Wilson et al. [26], the peak at 1927 nm corresponds to an overtone of protein-bound water, while other authors have identified water at 1932 [25] and 1940 nm [27], which are also within the range of the major peak observed in the curve for the three beer treatments. Ethanol, which is one of the main components in beer, has been identified at 2270 nm [22,25], which was observed in both the raw and first derivative curves. Overtones found at 1740–1760 nm correspond to thiol (S-H; [28]); this is an aromatic compound present in small concentrations in hops and, therefore, in beer [29]. Starch has been identified at 1886 nm; this may be present in beer due to possible residues from the malt that may not have been fully converted into sugars [14]. Overtones at 2074 nm correspond to amines [30], which are present in beer, especially as biogenic amines [14]. On the other hand, peaks > 2250 nm correspond to overtones of proteins and carbohydrates [27], which are of high importance for beer quality, as these are responsible for foam formation and stability [4,14,16,17,22].
The correlations found between MaxVol and FHeight and between TLTF, LFT, and FStability indicate that the panelists were well-trained and are in accordance with the relationships found by Gonzalez Viejo et al. [16] using commercial beer samples and a QDA® trained panel. The negative correlation between LgBubb and alcohol gas release may be due to the breakage of large bubbles, which aids in the release of the gas that conforms them. On the other hand, CO2 is the main factor responsible for bubble formation due to its high solubility in H2O [3,13]; this effect agrees with the positive correlation found between CO2 and FTexture, which refers to the bubble size within the foam. The positive correlation between the foaming parameters and Flavor liking, LTBitter, LTSweet, and overall liking is in accordance with the findings from Gonzalez Viejo et al. [9] in which it was found that the visual parameters have a great influence on consumers’ acceptability when tasting beers.
The sonication treatments applied in both the fermentation and the carbonation stages were shown to improve the beers’ foam and bubble-related parameters without affecting the flavor and aromas, as mentioned by Gonzalez Viejo et al. [17]. The regression ML models presented in this paper may be used in the brewing industry for the rapid assessment of beer in either craft or large companies. This is due to the use of the physicochemical parameters as inputs to predict the sensory attributes from the descriptive and acceptability tests. These physicochemical parameters may be obtained either from Model 1 when the company has an NIR spectrometer or by evaluating each parameter using the techniques mentioned in the materials and methods. Model 4 may be used by breweries that would implement sonication as part of the production process to improve the foam and bubble quality of the beer samples and to identify which samples/batches had been treated and at which stage of the process (carbonation or fermentation).
5. Conclusions
The NIR readings are a chemical fingerprint of beer samples, which gives specific signal data related to several compounds that are present on beers in the form of overtones. These data were used as inputs to model specific and important physicochemical characteristics of beers (Model 1). The advantages of using the predicted physicochemical outputs from Model 1 to construct the subsequent models presented in this work are (i) it helps to better understand the effects of specific physicochemical parameters involved and respective levels, avoiding the “black box” effect that NIR readings will present if they are used as inputs for subsequent models; (ii) physicochemical parameters can be measured using laboratory techniques and low-cost RoboBEER without requiring NIR instruments that can be cost-prohibitive for the particular NIR range used in this research; (iii) specific physicochemical parameters can be changed in a “simulation mode” to obtain real-time results from subsequent models related to changes in the sensory liking and type of fermentation treatment used; and (iv) Model 4 serves as a control process to recognize specific fermentations and sonication treatments of beer as a validation process in breweries.
Author Contributions
Conceptualization, C.G.V., and S.F.; Data curation, C.G.V., and S.F.; Formal analysis, C.G.V., and S.F.; Investigation, C.G.V., and S.F.; Methodology, C.G.V., and S.F.; Project administration, C.G.V., and S.F.; Software, C.G.V., and S.F.; Validation, C.G.V., and S.F.; Visualization, C.G.V., and S.F.; Writing—original draft, C.G.V., and S.F.; Writing—review and editing, C.G.V. and S.F.
Funding
This research received no external funding.
Conflicts of Interest
The authors declare no conflict of interest.
References
- Euromonitor-International. Beer in Australia; Euromonitor International: London, UK, 2016. [Google Scholar]
- Euromonitor-International. Statistics—Alcoholic Drinks; Euromonitor-International: London, UK, 2018. [Google Scholar]
- Gonzalez Viejo, C.; Torrico, D.D.; Dunshea, F.R.; Fuentes, S. Bubbles, Foam Formation, Stability and Consumer Perception of Carbonated Drinks: A Review of Current, New and Emerging Technologies for Rapid Assessment and Control. Foods 2019, 8, 596. [Google Scholar] [CrossRef] [PubMed] [Green Version]
- Gonzalez Viejo, C.; Fuentes, S.; Torrico, D.; Howell, K.; Dunshea, F. Assessment of Beer Quality Based on a Robotic Pourer, Computer Vision, and Machine Learning Algorithms Using Commercial Beers. J. Food Sci. 2018, 83, 1381–1388. [Google Scholar] [CrossRef]
- Gonzalez Viejo, C.; Torrico, D.; Dunshea, F.; Fuentes, S. Emerging Technologies Based on Artificial Intelligence to Assess the Quality and Consumer Preference of Beverages. Beverages 2019, 5, 62. [Google Scholar] [CrossRef] [Green Version]
- Gonzalez Viejo, C.; Fuentes, S.; Godbole, A.; Widdicombe, B.; Unnithan, R.R. Development of a low-cost e-nose to assess aroma profiles: An artificial intelligence application to assess beer quality. Sens. Actuators B Chem. 2020, 308, 127688. [Google Scholar] [CrossRef]
- Lees, M.; Rogers, P.; Campbell, D.; Pecar, M.; Sudarmana, D. Intelligent Systems for the Brewery based on Real-Time Measurement of Biological Parameters. In Proceedings of the 9th Australian Barley Technical Symposium, Melbourne, Austrilia, 12–16 September 1999; pp. 2–8. [Google Scholar]
- Gonzalez Viejo, C.; Fuentes, S.; Howell, K.; Torrico, D.; Dunshea, F. Robotics and computer vision techniques combined with non-invasive consumer biometrics to assess quality traits from beer foamability using machine learning: A potential for artificial intelligence applications. Food Control 2018. [Google Scholar] [CrossRef]
- Gonzalez Viejo, C.; Torrico, D.; Dunshea, F.; Fuentes, S. Development of Artificial Neural Network Models to Assess Beer Acceptability Based on Sensory Properties Using a Robotic Pourer: A Comparative Model Approach to Achieve an Artificial Intelligence System. Beverages 2019, 5, 33. [Google Scholar] [CrossRef] [Green Version]
- Bamforth, C. Perceptions of beer foam. J. Inst. Brew. 2000, 106, 229–238. [Google Scholar] [CrossRef]
- Donadini, G.; Fumi, M.D.; de Faveri, M.D. How Foam Appearance Influences the Italian Consumer’s Beer Perception and Preference. J. Inst. Brew. 2011, 117, 523–533. [Google Scholar] [CrossRef]
- Dale, C.; West, C.; Eade, J.; Rito-Palomares, M.; Lyddiatt, A. Studies on the physical and compositional changes in collapsing beer foam. Chem. Eng. J. 1999, 72, 83–89. [Google Scholar] [CrossRef]
- Campbell, G.M.; Mougeot, E. Creation and characterisation of aerated food products. Trends Food Sci. Technol. 1999, 10, 283–296. [Google Scholar] [CrossRef]
- Bamforth, C.; Russell, I.; Stewart, G. Beer: A Quality Perspective; Academic press: Cambridge, MA, USA, 2011. [Google Scholar]
- Pozo-Bayón, M.Á.; Santos, M.; Martín-Álvarez, P.J.; Reineccius, G. Influence of carbonation on aroma release from liquid systems using an artificial throat and a proton transfer reaction–mass spectrometric technique (PTR–MS). Flavour Fragr. J. 2009, 24, 226–233. [Google Scholar] [CrossRef]
- Gonzalez Viejo, C.; Fuentes, S.; Li, G.; Collmann, R.; Condé, B.; Torrico, D. Development of a robotic pourer constructed with ubiquitous materials, open hardware and sensors to assess beer foam quality using computer vision and pattern recognition algorithms: RoboBEER. Food Res. Int. 2016, 89, 504–513. [Google Scholar] [CrossRef]
- Gonzalez Viejo, C.; Fuentes, S.; Torrico, D.; Lee, M.; Hu, Y.; Chakraborty, S.; Dunshea, F. The Effect of Soundwaves on Foamability Properties and Sensory of Beers with a Machine Learning Modeling Approach. Beverages 2018, 4, 53. [Google Scholar] [CrossRef] [Green Version]
- Gonzalez Viejo, C.; Torrico, D.; Dunshea, F.; Fuentes, S. The Effect of Sonication on Bubble Size and Sensory Perception of Carbonated Water to Improve Quality and Consumer Acceptability. Beverages 2019, 5, 58. [Google Scholar] [CrossRef] [Green Version]
- Gonzalez Viejo, C.; Caboche, C.H.; Kerr, E.D.; Pegg, C.L.; Schulz, B.L.; Howell, K.; Fuentes, S. Development of a rapid method to assess beer foamability and quality based on relative protein content using RoboBEER and machine learning modeling. Beverages 2020, 6, 28. [Google Scholar] [CrossRef]
- Zhang, Y.; Jia, S.; Zhang, W. Predicting acetic acid content in the final beer using neural networks and support vector machine. J. Inst. Brew. 2012, 118, 361–367. [Google Scholar] [CrossRef]
- Grassi, S.; Amigo, J.M.; Lyndgaard, C.B.; Foschino, R.; Casiraghi, E. Beer fermentation: Monitoring of process parameters by FT-NIR and multivariate data analysis. Food Chem. 2014, 155, 279–286. [Google Scholar] [CrossRef]
- Gonzalez Viejo, C.; Fuentes, S.; Torrico, D.; Howell, K.; Dunshea, F. Assessment of beer quality based on foamability and chemical composition using computer vision algorithms, near infrared spectroscopy and machine learning algorithms. J. Sci. Food Agric. 2018, 98, 618–627. [Google Scholar] [CrossRef]
- Giovenzana, V.; Beghi, R.; Guidetti, R. Rapid evaluation of craft beer quality during fermentation process by vis/NIR spectroscopy. J. Food Eng. 2014, 142, 80–86. [Google Scholar] [CrossRef]
- Fuentes, S.; Gonzalez Viejo, C.; Torrico, D.; Dunshea, F. Development of a biosensory computer application to assess physiological and emotional responses from sensory panelists. Sensors 2018, 18, 2958. [Google Scholar] [CrossRef] [Green Version]
- McClure, W.F.; Stanfield, D.L. Near-Infrared Spectroscopy of Biomaterials. Handb. Vib. Spectrosc. 2002. [Google Scholar] [CrossRef]
- Wilson, B.C.; Tuchin, V.V.; Tanev, S. Advances in Biophotonics; IOS Press: Amsterdam, The Netherlands, 2005; Volume 369. [Google Scholar]
- Burns, D.A.; Ciurczak, E.W. Handbook of Near-Infrared Analysis; CRC press: Boca Raton, FL, USA, 2007. [Google Scholar]
- Araka, P.P.; Okparanma, R.N.; Ayotamuno, J.M.; Nawar, S.; Mouazen, A.M. Variability of visible and near-infrared (vis-NIR) diffuse spectral reflectance of cement-based solidified/stabilized pre-treated oil-based drill cuttings. J. Civ. Eng. Constr. Technol. 2019, 10, 60–70. [Google Scholar]
- Biendl, M.; Engelhard, B.; Forster, A.; Gahr, A.; Lutz, A.; Mitter, W.; Schmidt, R.; Schönberger, C. Hops: Their Cultivation, Composition and Usage; Fachverlag Hans Carl: Nuremberg, Germany, 2015. [Google Scholar]
- Wang, S. Infrared Spectroscopy for Food Quality Analysis and Control.; Academic press: Cambridge, MA, USA, 2010. [Google Scholar]
Figure 1.
Diagram depicting the treatments developed for the study, where the control was developed with the regular brewing methods, the treatment with sonication during fermentation (SF) consisted of the application of audible sounds to the brewing keg, and the sonication during carbonation (SC) consisted of the application of audible sounds during the in-bottle natural carbonation stage.

Figure 2.
Diagram showing the artificial neural network (ANN) two-layer feedforward models. Models 1–3 consist of ANN regression with the tan-sigmoid function in the hidden layer and linear transfer function in the output layer. Model 4 consists of ANN pattern recognition with the tan-sigmoid function in the hidden layer and Softmax transfer function in the output layer. Abbreviations: W: weights, and b = bias, inputs, outputs/targets abbreviations are found in Table 2, Table 3 and Table 4.

Figure 3.
Near-infrared curves showing (a) the raw and (b) the transformed curves using the first derivative of the absorbance values within the 1597–2397 nm range.
Figure 3.
Near-infrared curves showing (a) the raw and (b) the transformed curves using the first derivative of the absorbance values within the 1597–2397 nm range.

Figure 4.
Matrices showing the correlations between the physicochemical parameters and (a) the intensity of sensory descriptors assessed with the trained panel and (b) the liking of sensory attributes from the consumers test.
Figure 4.
Matrices showing the correlations between the physicochemical parameters and (a) the intensity of sensory descriptors assessed with the trained panel and (b) the liking of sensory attributes from the consumers test.


Figure 5.
Overall regression of (a) Model 1 to predict the physicochemical parameters using near-infrared absorbance values as inputs, (b) Model 2 to predict the intensity of sensory descriptors using the physicochemical parameters as inputs, and (c) Model 3 to predict the liking of sensory attributes using the physicochemical parameters as inputs; while (d) shows the receiver operating characteristics (ROC) curve from Model 4 to classify samples into the three treatments (control, sonication in fermentation, and sonication in carbonation).


Table 1.
Beer sample treatments used for the study and their labels.
| Treatment | Label | Net Content |
|---|---|---|
| Control | C | 330 mL |
| Sonication in fermentation | SF | 330 mL |
| Sonication in carbonation | SC | 330 mL |
Table 2.
Parameters analyzed using the robotic pourer RoboBEER.
| Parameter | Label |
|---|---|
| Maximum volume of foam | MaxVol |
| Lifetime of foam | LTF |
| Total lifetime of foam | TLTF |
| Foam drainage | FDrain |
| Small bubbles in the foam | SmBubb |
| Medium bubbles in the foam | MedBubb |
| Large bubbles in the foam | LgBubb |
| Alcohol gas release | Alcohol gas release |
| Carbon dioxide | CO2 |
Table 3.
Sensory attributes evaluated in the descriptive test and respective abbreviations used.
| Parameter | Label |
|---|---|
| Foam stability | FStability |
| Foam height | FHeight |
| Foam texture (bubble size in the foam) | FTexture |
| Color Intensity | CIntensity |
| Clarity | Clarity |
| Aroma Hops | AHops |
| Aroma Spices | ASpices |
| Aroma Floral | AFloral |
| Aroma Fruity | AFruity |
| Aroma Burnt Sugar | ABurntSugar |
| Aroma Yeast | AYeast |
| Aroma Nuts | ANuts |
| Aroma Grains | AGrains |
| Mouthfeel-Viscosity | MViscosity |
| Mouthfeel-Astringency | MAstringency |
| Mouthfeel-Warming | MWarming |
| Mouthfeel-Carbonation | MCarbonation |
| Taste Bitter | TBitter |
| Taste Sweet | TSweet |
| Taste Sour | TSour |
| Flavor Hops | FHops |
Table 4.
Sensory attributes evaluated in the descriptive test.
| Parameter | Label |
|---|---|
| Foam stability | LFStability |
| Foam height | LFHeight |
| Foam texture | LFTexture |
| Aroma | Aroma |
| Carbonation | LMCarbonation |
| Taste Bitter | LTBitter |
| Taste Sweet | LTSweet |
| Taste Sour | LTSour |
| Flavor | Flavor |
| Overall liking | LOverall |
| Perceived Quality | Quality |
Table 5.
Results from the artificial neural network regression (Models 1–3) and classification (Model 4) models. Performance was calculated based on the mean squared error (MSE).
Table 5.
Results from the artificial neural network regression (Models 1–3) and classification (Model 4) models. Performance was calculated based on the mean squared error (MSE).
| Model | Stage | Observations (Samples × Targets) | Correlation Coefficient (R) | Slope | Performance (MSE) |
| Model 1 | Training | 454 | 0.98 | 0.95 | 0.01 |
| Validation | 97 | 0.88 | 0.82 | 0.10 | |
| Testing | 97 | 0.83 | 0.84 | 0.10 | |
| Overall | 648 | 0.94 | 0.91 | - | |
| Model 2 | Training | 794 | 0.99 | 0.99 | 0.04 |
| Validation | 170 | 0.96 | 0.94 | 0.30 | |
| Testing | 170 | 0.97 | 0.97 | 0.30 | |
| Overall | 1134 | 0.99 | 0.98 | - | |
| Model 3 | Training | 416 | 0.99 | 0.97 | 0.02 |
| Validation | 89 | 0.94 | 0.99 | 0.20 | |
| Testing | 89 | 0.92 | 1.10 | 0.20 | |
| Overall | 594 | 0.97 | 0.99 | - | |
| Model | Stage | Samples | Accuracy | Error | Performance (MSE) |
| Model 4 | Training | 38 | 100% | 0.0% | <0.01 |
| Validation | 8 | 90.9% | 9.1% | 0.05 | |
| Testing | 8 | 90.9% | 9.1% | 0.02 | |
| Overall | 54 | 96.3% | 3.7% | - |
© 2020 by the authors. Licensee MDPI, Basel, Switzerland. This article is an open access article distributed under the terms and conditions of the Creative Commons Attribution (CC BY) license (http://creativecommons.org/licenses/by/4.0/).
Share and Cite
MDPI and ACS Style
Gonzalez Viejo, C.; Fuentes, S. A Digital Approach to Model Quality and Sensory Traits of Beers Fermented under Sonication Based on Chemical Fingerprinting. Fermentation 2020, 6, 73. https://doi.org/10.3390/fermentation6030073
AMA Style
Gonzalez Viejo C, Fuentes S. A Digital Approach to Model Quality and Sensory Traits of Beers Fermented under Sonication Based on Chemical Fingerprinting. Fermentation. 2020; 6(3):73. https://doi.org/10.3390/fermentation6030073
Chicago/Turabian StyleGonzalez Viejo, Claudia, and Sigfredo Fuentes. 2020. "A Digital Approach to Model Quality and Sensory Traits of Beers Fermented under Sonication Based on Chemical Fingerprinting" Fermentation 6, no. 3: 73. https://doi.org/10.3390/fermentation6030073
Note that from the first issue of 2016, this journal uses article numbers instead of page numbers. See further details here.