Loss and Recovery of Carbon in Repeatedly Burned Degraded Peatlands of Kalimantan, Indonesia
by
 , and
, and
Liubov Volkova
1,* ,
,
Wahyu Catur Adinugroho
2,
Haruni Krisnawati
2,
Rinaldi Imanuddin
2 and
Christopher John Weston
1 1
School of Ecosystem and Forest Sciences, Faculty of Science, The University of Melbourne, Creswick, VIC 3363, Australia
2
Forest Research and Development Center, Forestry and Environment Research, Development and Innovation Agency (FORDIA), Bogor 16610, Indonesia
*
Author to whom correspondence should be addressed.
Fire 2021, 4(4), 64; https://doi.org/10.3390/fire4040064
Submission received: 30 July 2021
/
Revised: 3 September 2021
/
Accepted: 24 September 2021
/
Published: 28 September 2021
Abstract
:Although accurate estimates of biomass loss during peat fires, and recovery over time, are critical in understanding net peat ecosystem carbon balance, empirical data to inform carbon models are scarce. During the 2019 dry season, fires burned through 133,631 ha of degraded peatlands of Central Kalimantan. This study reports carbon loss from surface fuels and the top peat layer of 18.5 Mg C ha−1 (3.5 from surface fuels and 15.0 from root/peat layer), releasing an average of 2.5 Gg (range 1.8–3.1 Gg) carbon in these fires. Peat surface change measurements over one month, as the fires continued to smolder, indicated that about 20 cm of the surface was lost to combustion of peat and fern rhizomes, roots and recently incorporated organic residues that we sampled as the top peat layer. Time series analysis of live green vegetation (NDVI trend), combined with field observations of vegetation recovery two years after the fires, indicated that vegetation recovery equivalent to fire-released carbon is likely to occur around 3 years after fires.
Keywords:
emissions; emission factor; shrub; ferns; NDVI; litter; peat bulk density; carbon content; peat depth1. Introduction
Tropical peatlands are areas of high carbon density that sequester an estimated 82–92 Pg C, with Indonesian peatlands sequestering about 10% of the global total [1]. Repeated and extensive fires, following drainage and selective logging, have contributed to peat forest loss in Indonesia over recent decades [2]. Over the last two decades, about 12% of peatlands in Sumatra and Kalimantan have been burned more than once, with about 23% of this area burned more than twice [3]. Carbon loss and emissions from repeatedly burned peatlands have been estimated for peat, but not so well for aboveground components [4]. In degraded peat swamp forests, recent studies indicate that about 50% of aboveground carbon remains after several consecutive fires—as coarse woody debris, standing dead trees and pyrogenic carbon [5,6]. While there are studies that describe the recovery of carbon after fire for northern hemisphere peat ecosystems [7,8], there are few recovery studies for Indonesian peatlands, including peat swamp forests.
During the dry season, in the period of July–September 2019, peat fires were accidentally ignited in a degraded peatland area near Tumbang Nusa camp in Central Kalimantan, Indonesia. We used this opportunity to empirically measure aboveground carbon loss and peat combustion from these areas which were previously peat swamp forests and burned in more than four fires over the last twenty years. Two years after the fires, we revisited the sites to observe the recovery of carbon. Here, we report losses and recovery of carbon from these degraded peatlands of Central Kalimantan.
2. Materials and Methods
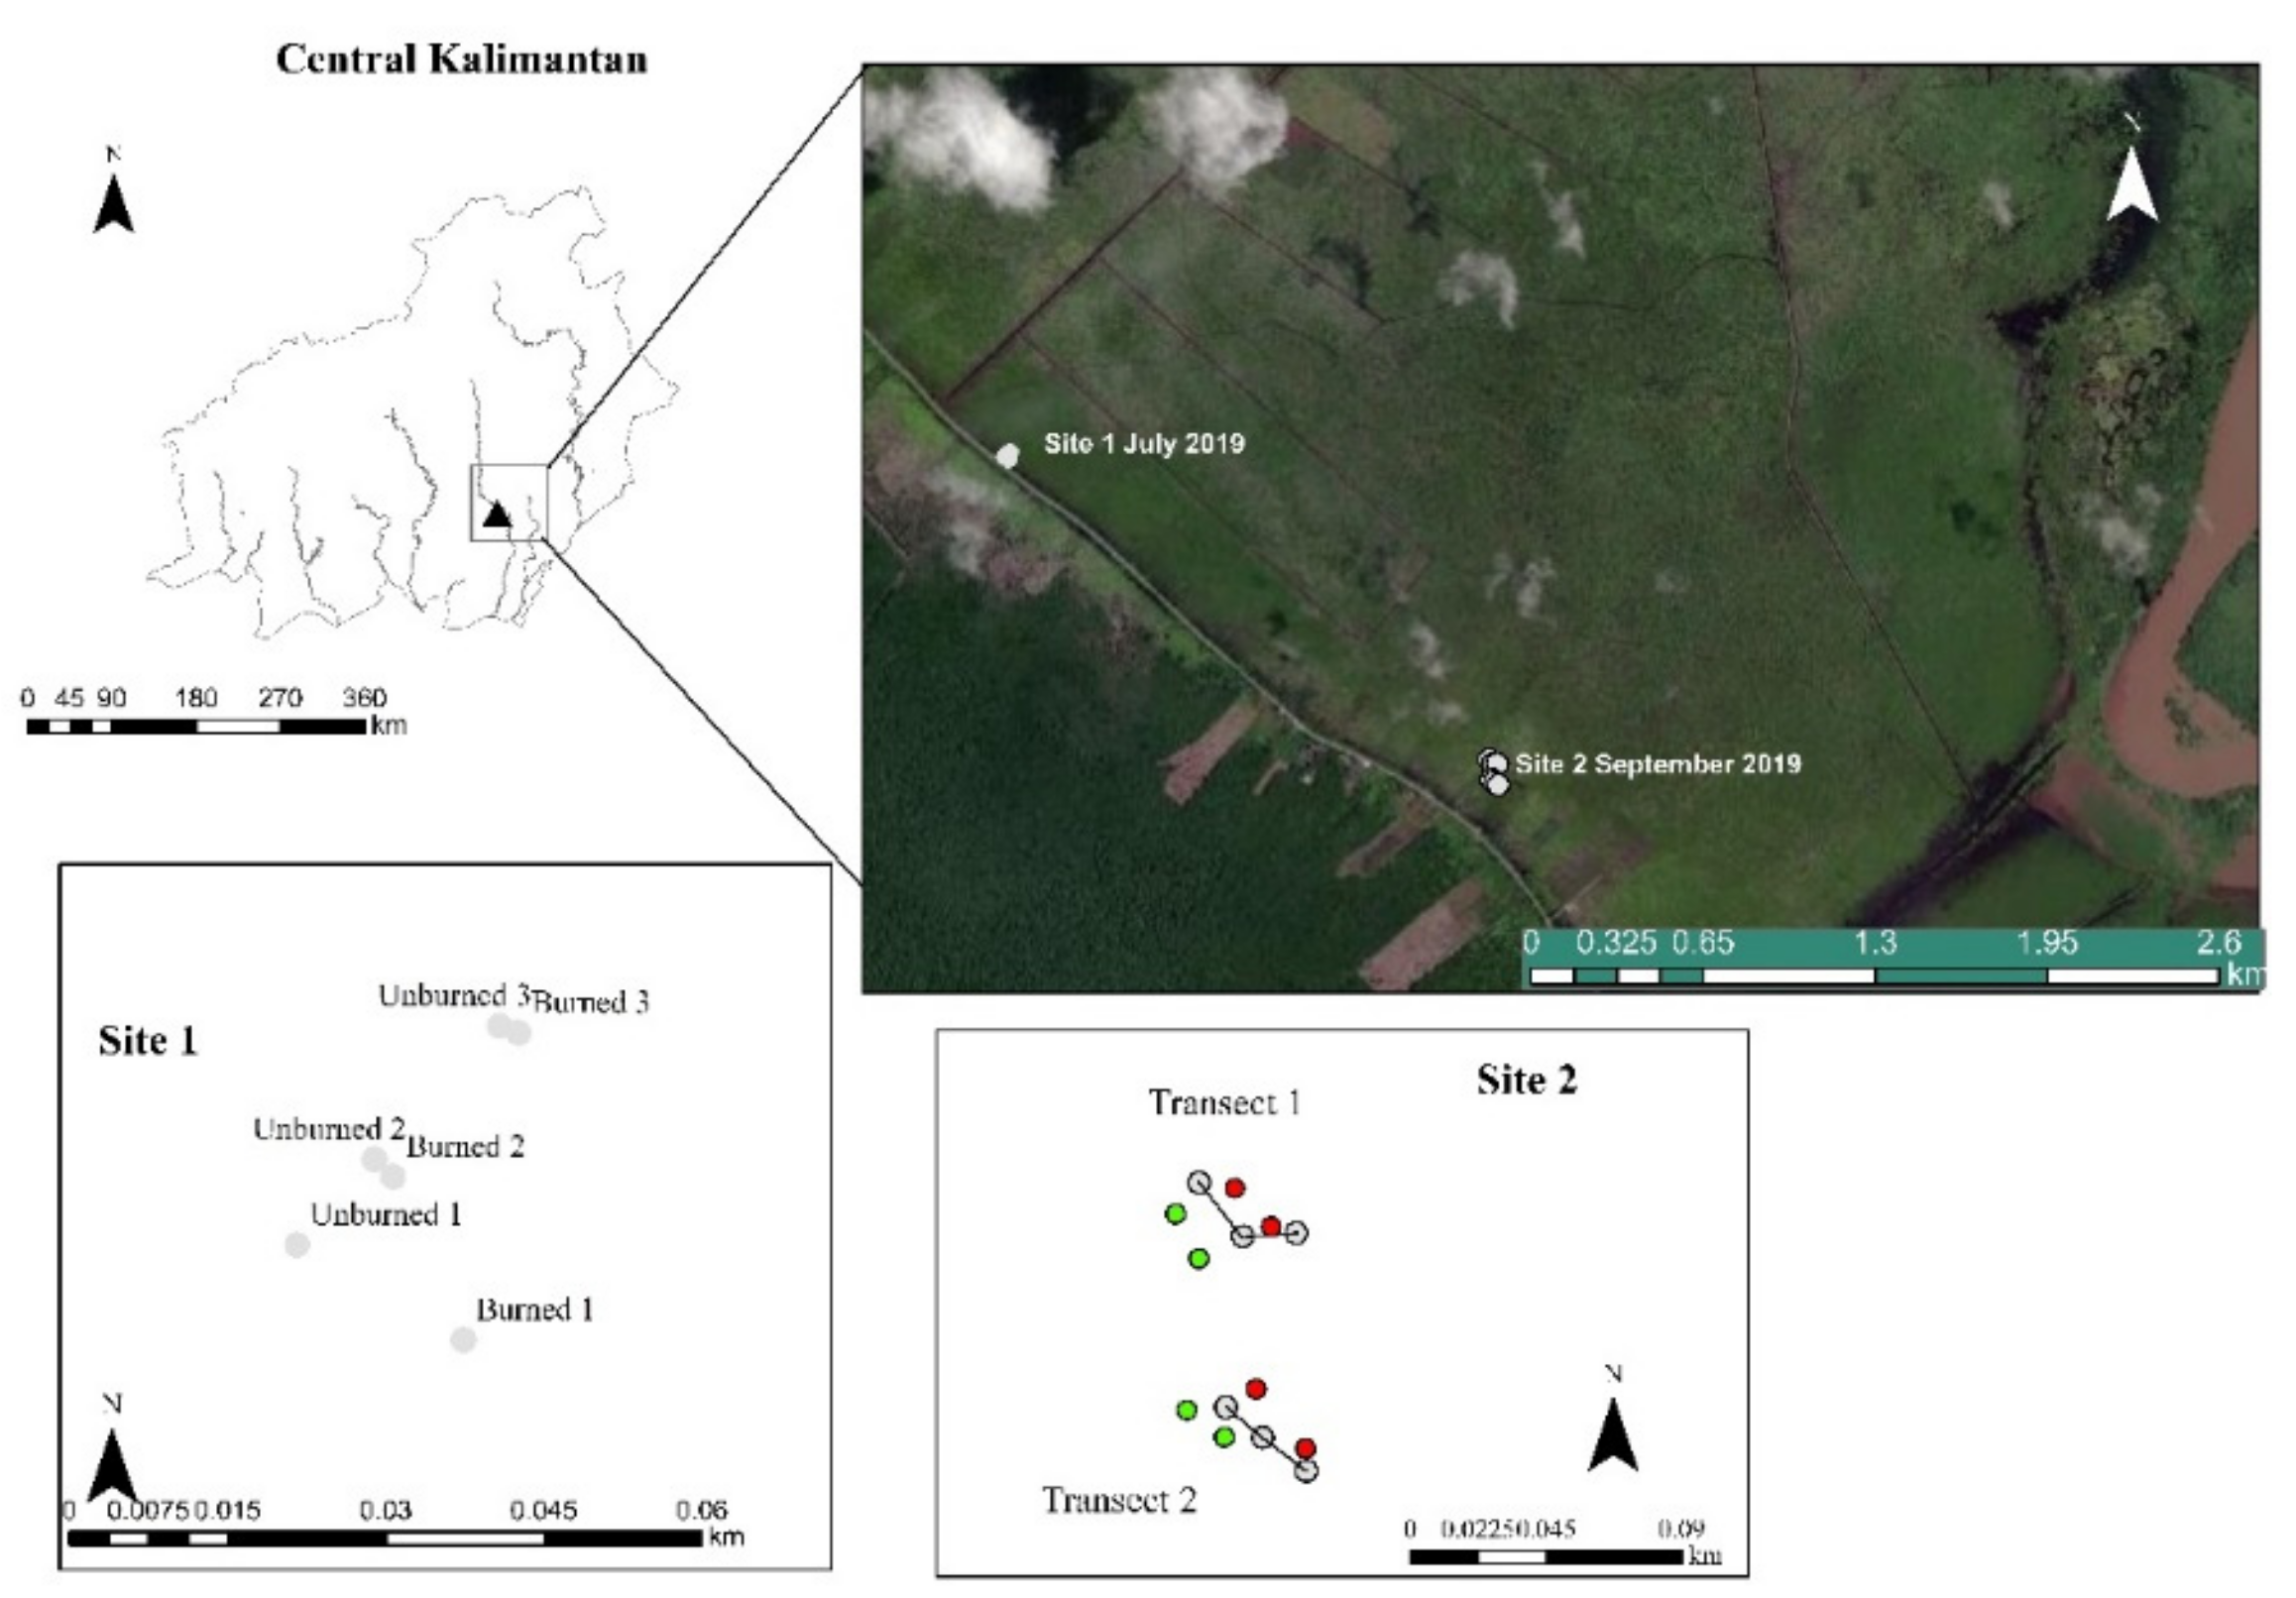
The study was developed in degraded peatland where a fire burned from July to October 2019. Site 1 was sampled in July 2019 after the fire was extinguished in the immediate area, with samples taken in unburned and adjacent burned areas. Site 2 was sampled in September 2019 at the active front of the fire, so that the fire burned into areas where peat depth rods were placed prior to the fire advancing. At each site, an equal number of plots was established in unburned and in burned areas (Table 1); these plots were sampled at three points, resulting in 9 samples per treatment in Site 1 and 12 samples per treatment in Site 2 (Table 1, Figure 1 and Figure 2A). Study sites were heavily degraded peatlands dominated by the fern Stenochlaena palustris. Aboveground samples comprised mostly ferns, grasses and litter, while belowground samples were made up of peat, fern rhizomes and roots (Figure 2B).
The loss of peat, fern rhizomes and roots in fires was measured at Site 2 during the September 2019 field campaign. Two transects (Figure 1, Site 2), each 30–40 m long, were set up in unburned areas of vegetation just prior to the advance of the fire into that area. For each transect, thirty 1.5 m long metal rods (Figure 2F) were pushed about 70–80 cm into the peat approximately 1–1.5 m apart, numbered (1–30) and the distance from the top of the rods to the surface recorded at the time of installation. The combustion of the surface was measured over 26 days from the 4th to the 30 September until fires were self-extinguished. The depth and rate of peat surface loss was calculated from the increase in the distance from the top of the rod to the peat surface from prior to the fire (the time of installation) to after the fire, with measurements taken periodically throughout the 26 days until the fire went out.
Surface fuels were destructively sampled from 0.1 m2 frames and were separated into a shrub sample (ferns and grasses) and litter (the rest of the organic matter). The peat sample included organic residues, rhizomes and root material to an 11 cm depth, collected using a metal cylinder of 464 cm3 after shrub and litter had been removed (Figure 2B–E).
All samples (litter, shrubs, peat) were transferred to the facilities of FORDA in Bogor, air dried and weighed for mass of dry matter and calculation of aboveground biomass on a per hectare basis. Sub-samples of litter, shrub and peat were analyzed for C content at the Centre for Agricultural Land Resource Research and Development using a loss on ignition method (LoI). Carbon content, C%, was estimated as organic matter divided by the conversion factor of 1.922 [9]. Peat depth to the mineral soil was measured using an Edelman soil auger fitted with a half cylinder peat sampler (Eijkelkamp peat sampler; https://en.eijkelkamp.com accessed on 23 September 2021). One auger hole was placed in burned and unburned areas of each transect, near each other (Figure 1 and Figure 2A).
In July 2021, sites were revisited, and the recovery of the biomass was observed and photographed (Figure 2C,G). The recovery process was also assessed from a sequence of change in the Normalized Difference Vegetation Index (NDVI) based on the ratio of the red and NIR band, created from Sentinel-2 MSI: MultiSpectral Instrument, Level-1C image, processed using Google Earth Engine.
A map of the area burned in peat fires was created using data from the Ministry of Environment and Forestry (MoEF) land cover map, Indonesian National Carbon Accounting System (INCAS) burned area maps and peat land areas provided by the Ministry of Agriculture (MoA), Indonesia. The map was developed from hotspot images combined with visual delineation and validation based on information from fire suppression activities.
A linear mixed effect model (GenStat 16.4, VSN International Ltd., Hemel Hempstead, UK) was used to investigate the impact of fire on above- and belowground C% and total biomass loss.
As our study used the direct measurements of biomass loss during fires, the emission factor (Mg C ha−1) was estimated as the difference in carbon mass from before fire to after fire for aboveground components (shrubs and litter) and belowground components (peat, rhizomes and roots).
3. Results and Discussion
3.1. Area Burned
3.2. Impact of Fires on Carbon Content (C%) of Surface Fuels and Peat
Fires modified the C% of litter and peat but not shrubs. Litter C% in burned sites was reduced by almost 6% compared to the unburned sites, while C% of shrubs remained comparable between burned and unburned locations. The top layer of peat lost about 5% of carbon compared to unburned sites (Table 2). However, both the burned and unburned sites in these degraded peatlands had lower C% than relatively undisturbed peat forest, e.g., 51% for the top layer in the Sebangau National Park, [6], 54% reported by [10] or 56% averaged for the whole of South East Asia by [1]. The impact of recurrent fires on C% (also called Corg) has been greatly understudied [5]. Yet, this parameter directly affects peat fire emission estimates as defined by methods developed by the Intergovernmental Panel on Climate Change (IPCC) [11] (see Equation (1) below).
3.3. Mass Loss from Aboveground Shrubs and Litter and from Belowground Rhizomes, Roots and Peat
Peat bulk density was comparable between the treatments and sites, with an average of 0.150 ± 0.005 g cm−3 (Table 3, p = 0.067). These values were consistent with our previous estimates for the degraded peatlands [6].
Almost 90% of shrub mass was combusted in fires yet the litter mass was comparable between burned and unburned locations (Table 4). No changes in litter loads (or even slightly greater in burned than unburned sites) suggest that carbon was added from the shrub layer (a redistribution of carbon) which was partly combusted or converted to other forms of carbon, such as char and ash, which were difficult to separate (Figure 2E). Overall, fire had a significant impact on shrub + litter mass, which was reduced from 8.09 ± 0.62 to 4.62 ± 0.68 Mg C ha−1, losing 3.5 Mg C ha−1 (Table 4). The significantly lower carbon content of peat at burned sites (Table 2) resulted in loss from the peat surface of 15.02 Mg C ha−1, with overall loss from surface and peat mass of 18.50 ± 4.88 Mg C ha−1 (Table 4).
3.4. Combustion of Peat Surface during Fires
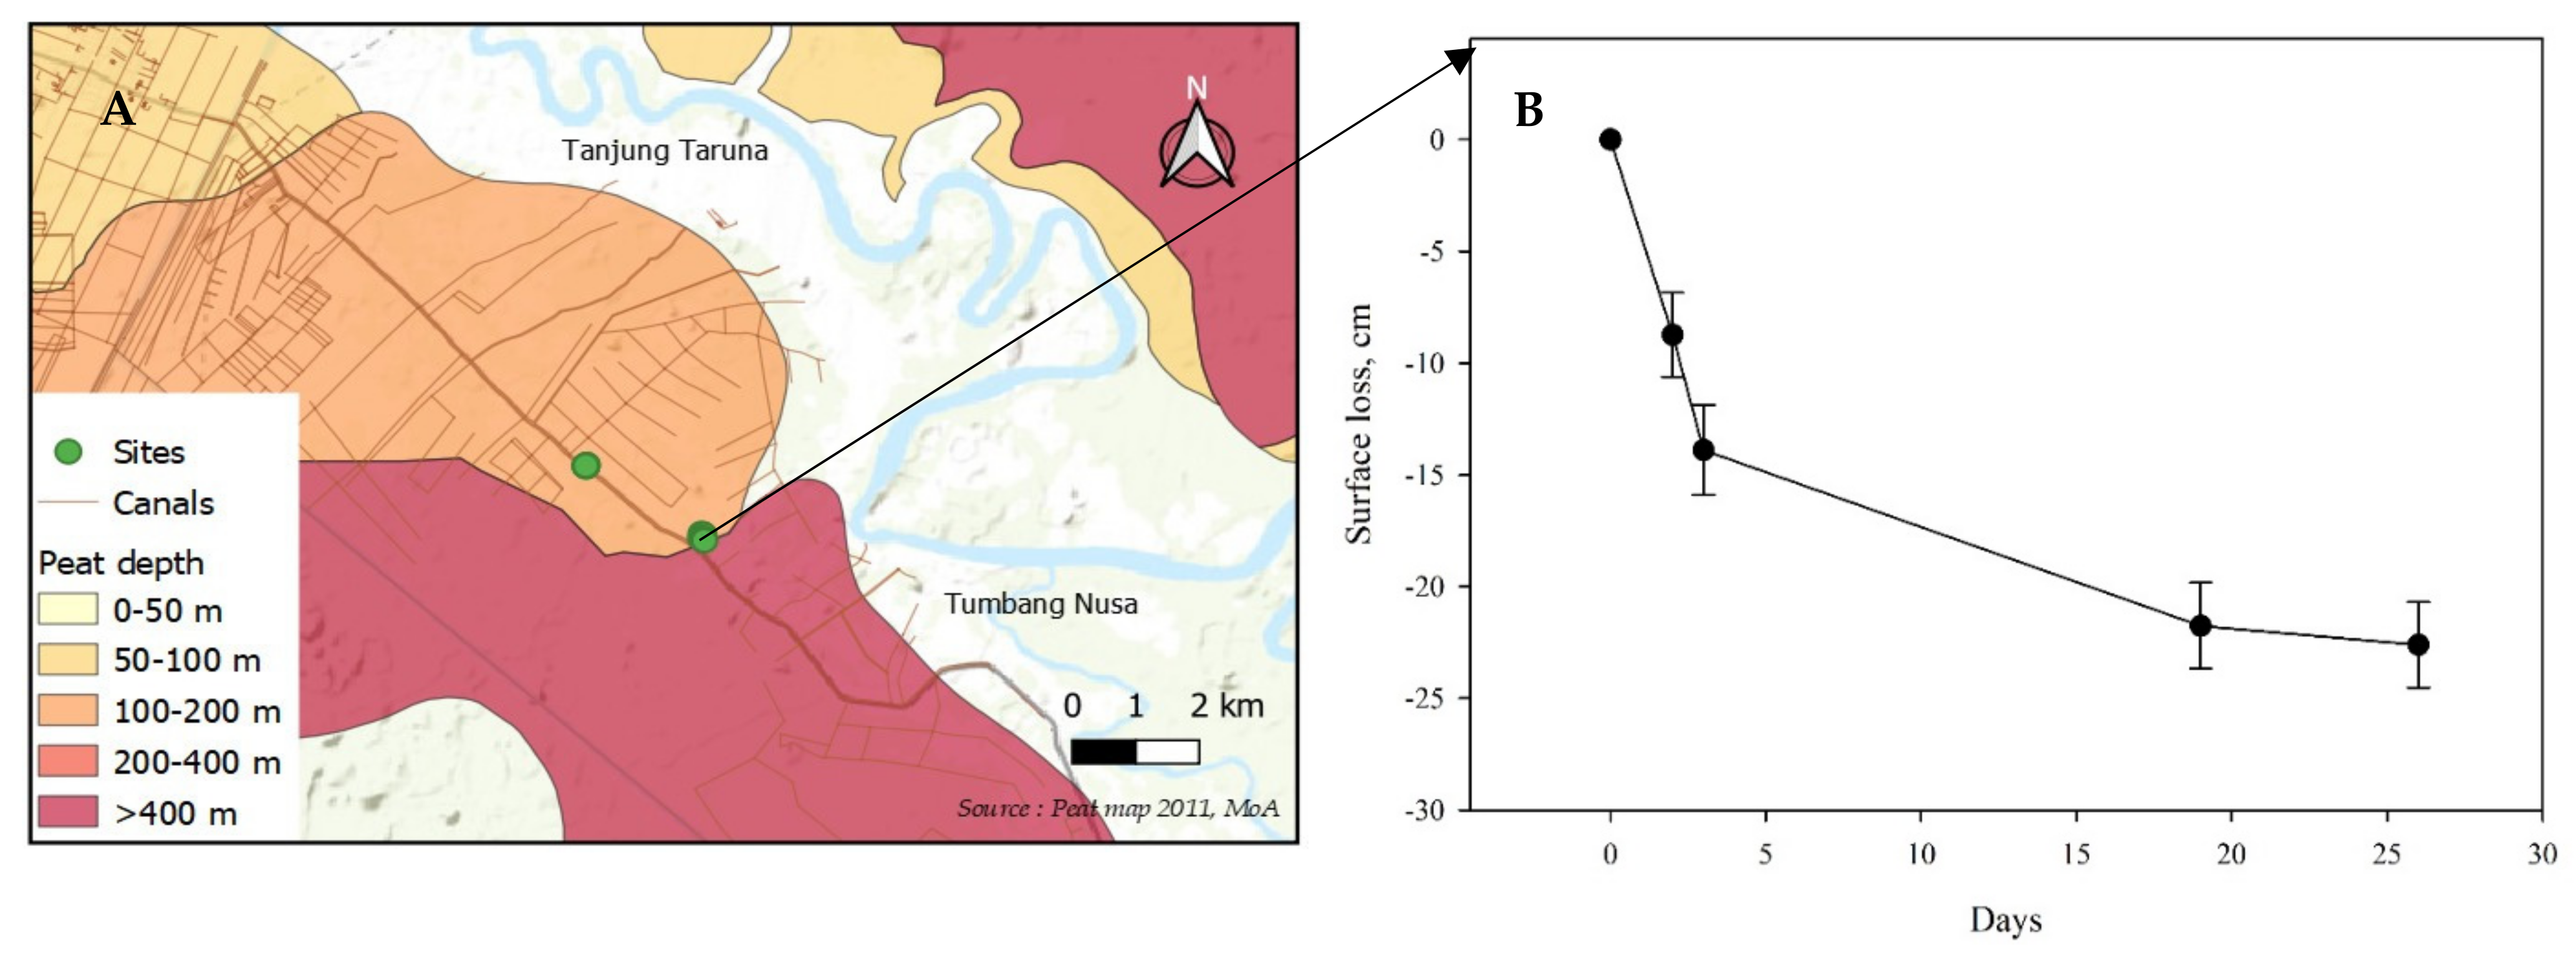
The depth of peat to the mineral soil was comparable between unburned (2.44 ± 0.20 m) and burned (2.28 ± 0.11 m) sites and comparable with the peat depth maps derived from the MoA (Figure 4A).
Over almost a month of smoldering peat fires from 4–29 September, a total of 21–24 cm of surface was lost (Figure 4B). The greatest reduction in the surface depth occurred in the first week, with a loss of up to 15 cm. About 3 cm was lost in the second week and less than 1 cm in the last days of measurements prior to the fire going out. Our measurements were comparable to the average peat layer loss of 15.8 ± 0.5 cm reported by [12]. Yet, burned peat layer depth was much smaller than recorded for a large forest fire in Central Kalimantan in 1997 (40 cm) [13]. Our observations during sampling of the peat surface indicate that it is not necessarily all peat mass that is consumed in fires but rather a combination of roots, fern rhizomes, peat and recently added litter that contributes to the decrease in peat depth (as can be seen in Figure 2D).
3.5. Emission Factors and Emission from Recurrently Burned Degraded Peatlands
The overall loss of carbon from the surface and top peat layer was 18.5 Mg C ha−1 (3.5 from the surface and 15.0 from top peat), an emission factor greater than 13 Mg C ha−1 suggested by [4]. However, if only the loss from peat is considered, then our estimates of 15.02 ± 4.76 would be comparable to [4]. We should emphasize that for the estimates of carbon loss, the authors used a lower peat bulk density value of 0.115 g cm−3 but greater carbon content of 55.3% compared to our field measurements of 0.150 g cm−3 and 45.6%. Consistent with the findings from other studies [14,15], degraded peatlands have compact peat with bulk densities much greater than 0.115 g cm−3 which is more representative of undisturbed peatlands [10]. Our previous analyses have shown that C% of 39–43% is a more realistic value for the degraded peatlands [6]—well below the almost universally used 56% reported by Page, Rieley and Banks [1]—irrespective of peat degradation status.
In our study, we recorded a much greater combustion of the peat surface than the relative burned area depth of 2 cm for four or more consecutive fires reported by [4] This suggests that the authors did not consider the contribution of organic matter and roots to the burned area depth in their estimates. Our field observations (Figure 2B,D) indicate that the shrubs, litter and roots in degraded peatlands are the main fuels consumed in fires that determine the depth of peat loss.
Assuming the total loss of 18.5 ± 4.88 Mg C ha−1, we estimate the peat fires of 2019 that burned though about 133 631 ha of degraded peatlands dominated by ferns and other small shrubs of Central Kalimantan released between 1.8 and 3.1 Gg C. Using the IPCC method [11] (Equation (1)) and our field data would produce an estimate of carbon loss in the range 67.5–77.1 Mg C ha−1:
where average depth burned (DB) is 21–24 cm, average peat bulk density (BD) is 0.150 g cm−3, peat carbon content (C) is 0.4558 and peat combustion factor (CF) is 0.47 from [6]. Multiplying this carbon loss by the peat area burned would produce carbon emissions from the study area of between 9 and 10 Gg C. This IPCC method overestimates emissions from degraded peatlands, where the shrub, litter and root components are the main contributors to emissions.
Similarly, using the IPCC method (Equation (1)), our field data for BD, C% and the relative peat depth burned of 2 cm from [4] would produce carbon loss of 6.42 Mg C ha−1, or half of what we observed in the field, due to the authors [4] not accounting for aboveground and root biomass contributions to the emissions.
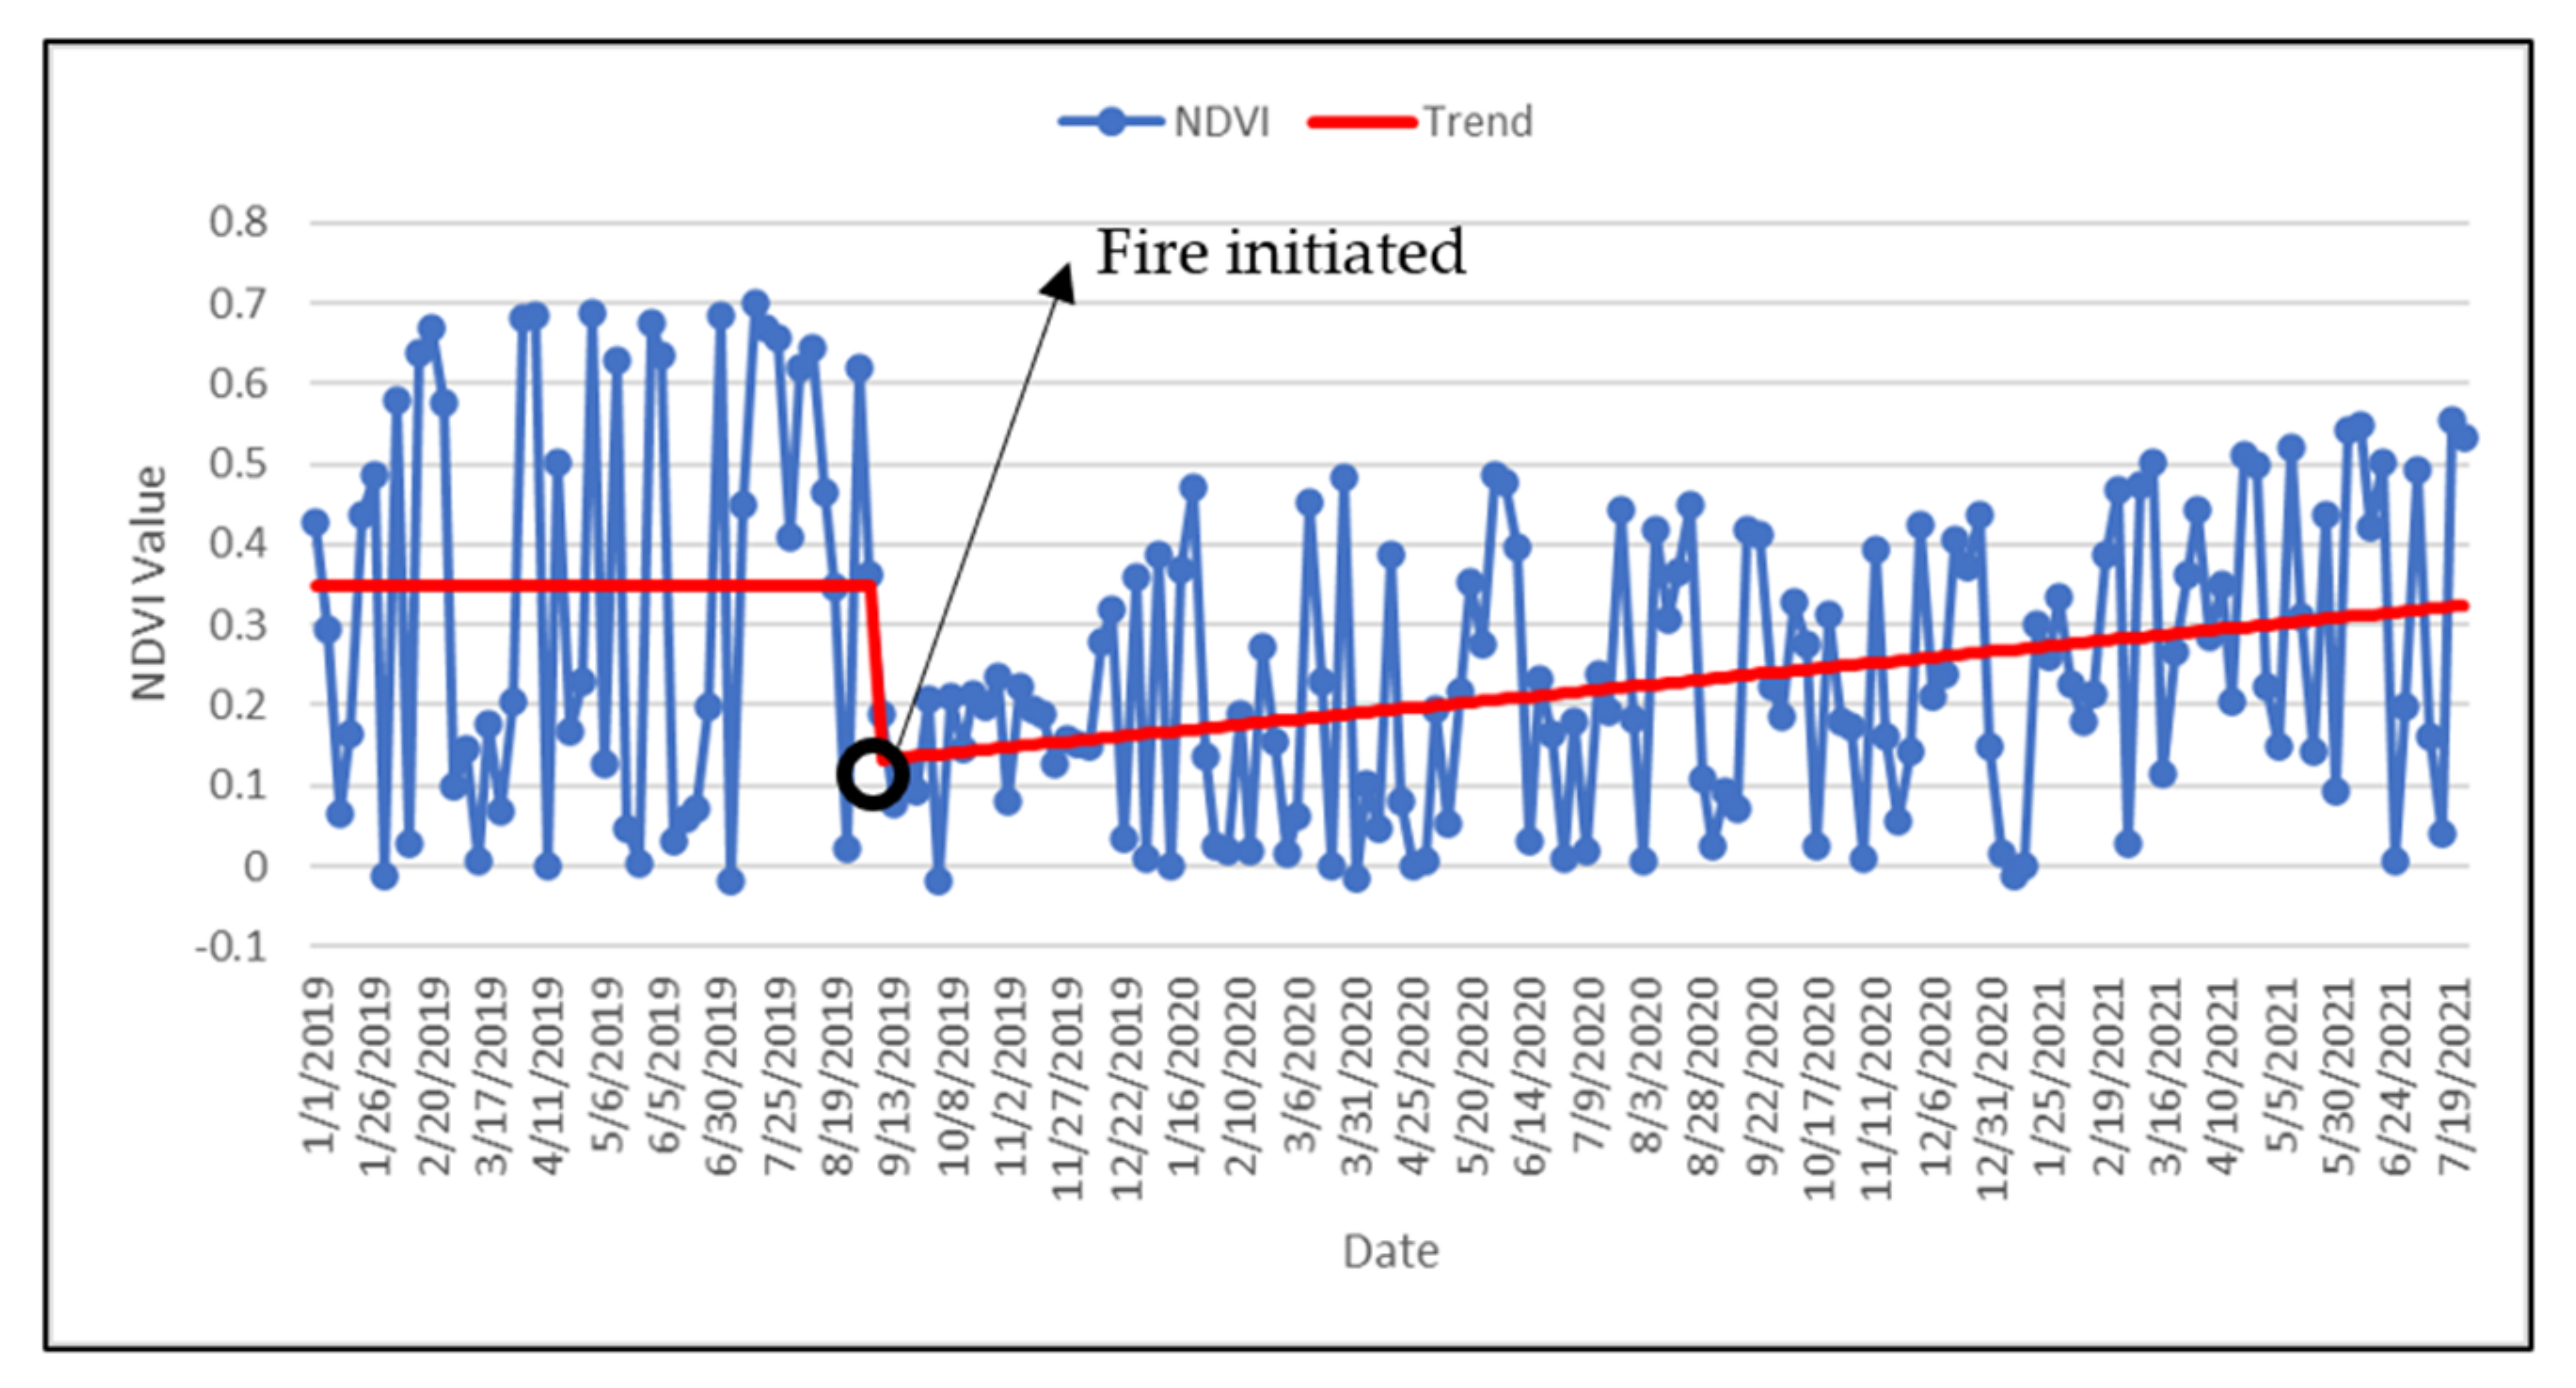
Although the recovery of vegetation was visually apparent two years after fires (Figure 2C,G), we do not have biomass estimates for the vegetation in 2021. As a surrogate for biomass measures after fire, we used the trend in the NDVI to estimate equivalence in the vegetation condition from the period prior to fire to two years after fire. The monthly NDVI trend indicated that about 3 years are required for the aboveground carbon to fully recover to pre-fire conditions (Figure 5). An increase in the index value indicates an increase in the greenness value which describes an increase in growth or density of land cover vegetation. Theoretically, the NDVI value interval for shrubs is narrower than the NDVI value interval for forest stands, so it is very possible that shrub recovery can occur in a relatively short time. As the net primary productivity of tropical fern shrublands is about 11 Mg C ha−1 yr−1 [16], the NDVI estimated vegetation recovery in this study is likely highly conservative.
This study provides one of just a few rare empirical estimates of biomass and peat loss as measured during fires. Our results suggest that following peat fire in degraded peatlands, vegetation carbon recovers within 3 years.
Author Contributions
Conceptualization, L.V., H.K., C.J.W.; methodology, L.V., W.C.A., H.K., C.J.W.; sample preparation and analysis, W.C.A.; NDVI analysis, W.C.A.; fire map development W.C.A., R.I.; writing—original draft preparation, L.V.; writing—review and editing, W.C.A., H.K., R.I., C.J.W.; project administration, L.V. and H.K.; funding acquisition, L.V., H.K., C.J.W. All authors have read and agreed to the published version of the manuscript.
Funding
This work was funded by the Asia-Pacific Network for Sustainable Forest Management and Rehabilitation (APFNet) through the project “Improving capacities towards reducing greenhouse gas emissions from peat swamp forest fires in Indonesia”, grant number ID:2018P5-IND and the Australian Centre for International Agricultural Research and the Department of Industry, Science, Energy and Resources (International Climate Change and Energy Innovation Division), grant number SLAM/2020/140.
Data Availability Statement
The data presented in this study are available from the corresponding authors upon reasonable request.
Acknowledgments
The authors acknowledge the help of Banjarbaru and Tumbang Nusa personnel during field sampling: Wawan Halwany, Purwanto B. Santosa, Supriyadi, Arif Susianto, Ariel, Yusnan. L. Volkova and C.J. Weston acknowledge the foreign research permits from the Ministry of Research, Technology and Higher Education, Republic of Indonesia.
Conflicts of Interest
The authors declare no conflict of interest. The funders had no role in the design of the study; in the collection, analyses, or interpretation of data; in the writing of the manuscript, or in the decision to publish the results.
References
- Page, S.E.; Rieley, J.O.; Banks, C.J. Global and regional importance of the tropical peatland carbon pool. Glob. Chang. Biol. 2011, 17, 798–818. [Google Scholar] [CrossRef] [Green Version]
- Page, S.; Hoscilo, A.; Langner, A.; Tansey, K.; Siegert, F.; Limin, S.; Rieley, J.O. Tropical peatland fires in southeast asia. In Tropical Fire Ecology. Climate Change, Land Use, and Ecosystem Dynamics; Cochrane, M.A., Ed.; Springer and Praxis Publishing: Chichester, UK, 2009; pp. 263–287. [Google Scholar]
- Vetrita, Y.; Cochrane, M.A. Fire frequency and related land-use and land-cover changes in indonesia’s peatlands. Remote Sens. 2020, 12, 5. [Google Scholar] [CrossRef] [Green Version]
- Konecny, K.; Ballhorn, U.; Navratil, P.; Jubanski, J.; Page, S.E.; Tansey, K.; Hooijer, A.; Vernimmen, R.; Siegert, F. Variable carbon losses from recurrent fires in drained tropical peatlands. Glob. Chang. Biol. 2016, 22, 1469–1480. [Google Scholar] [CrossRef] [PubMed] [Green Version]
- Volkova, L.; Krisnawati, H.; Adinugroho, W.C.; Imanuddin, R.; Qirom, M.A.; Santosa, P.B.; Halwany, W.; Weston, C.J. Identifying and addressing knowledge gaps for improving greenhouse gas emissions estimates from tropical peat forest fires. Sci. Total Environ. 2021, 763, 142933. [Google Scholar] [CrossRef] [PubMed]
- Krisnawati, H.; Adinugroho, W.C.; Imanuddin, R.; Weston, C.J.; Volkova, L. Carbon balance of tropical peat forests at different fire history and implications for carbon emissions. Sci. Total Environ. 2021, 779, 146365. [Google Scholar] [CrossRef] [PubMed]
- Page, S.E.; Siegert, F.; Rieley, J.O.; Boehm, H.D.V.; Jaya, A.; Limin, S. The amount of carbon released from peat and forest fires in indonesia during 1997. Nature 2002, 420, 61–65. [Google Scholar] [CrossRef] [PubMed]
- Turetsky, M.R.; Benscoter, B.; Page, S.; Rein, G.; van der Werf, G.R.; Watts, A. Global vulnerability of peatlands to fire and carbon loss. Nat. Geosci. 2015, 8, 11–14. [Google Scholar] [CrossRef]
- Gaveau, D.L.A.; Salim, M.A.; Hergoualc’h, K.; Locatelli, B.; Sloan, S.; Wooster, M.; Marlier, M.E.; Molidena, E.; Yaen, H.; DeFries, R.; et al. Major atmospheric emissions from peat fires in southeast asia during non-drought years: Evidence from the 2013 sumatran fires. Sci. Rep. 2014, 4, 1–7. [Google Scholar] [CrossRef] [PubMed] [Green Version]
- Morison, M.; van Beest, C.; Macrae, M.; Nwaishi, F.; Petrone, R. Deeper burning in a boreal fen peatland 1-year post-wildfire accelerates recovery trajectory of carbon dioxide uptake. Ecohydrology 2021, 14, e2277. [Google Scholar] [CrossRef]
- Kettridge, N.; Thompson, D.K.; Waddington, J.M. Impact of wildfire on the thermal behavior of northern peatlands: Observations and model simulations. J. Geophys. Res. Biogeosciences 2012, 117. [Google Scholar] [CrossRef] [Green Version]
- Huijnen, V.; Wooster, M.J.; Kaiser, J.W.; Gaveau, D.L.A.; Flemming, J.; Parrington, M.; Inness, A.; Murdiyarso, D.; Main, B.; van Weele, M. Fire carbon emissions over maritime southeast asia in 2015 largest since 1997. Sci. Rep. 2016, 6, 1–8. [Google Scholar] [CrossRef] [PubMed] [Green Version]
- UN. CO2 Emissions from Peatlands Degradation. Available online: http://www.Grida.No/resources/12529 (accessed on 11 October 2020).
- Maswar. Kajian Cadangan Karbon Paga Lahan Gambut Tropika Yang Didrainase Untuk Tanaman Tahunan. Ph.D. Thesis, Sekolah Pascasarjana Institut Pertanian Bogor, Tangerang, Indonesia, 2011. [Google Scholar]
- Warren, M.W.; Kauffman, J.B.; Murdiyarso, D.; Anshari, G.; Hergoualc’h, K.; Kurnianto, S.; Purbopuspito, J.; Gusmayanti, E.; Afifudin, M.; Rahajoe, J.; et al. A cost-efficient method to assess carbon stocks in tropical peat soil. Biogeosciences 2012, 9, 4477–4485. [Google Scholar] [CrossRef] [Green Version]
- IPCC. 2013 Supplement to the 2006 IPCC Guidelines for National Greenhouse Gas Inventories: Wetlands; IPCC: Geneva, Switzerland, 2014. [Google Scholar]
Figure 1.
Map of the study area with sampling design. Site 1, showing the location of plots in burned and unburned areas. Site 2, showing the location of 2 transects for measuring the depth of peat burned and location of burned (red) and unburned (green) plots.
Figure 1.
Map of the study area with sampling design. Site 1, showing the location of plots in burned and unburned areas. Site 2, showing the location of 2 transects for measuring the depth of peat burned and location of burned (red) and unburned (green) plots.

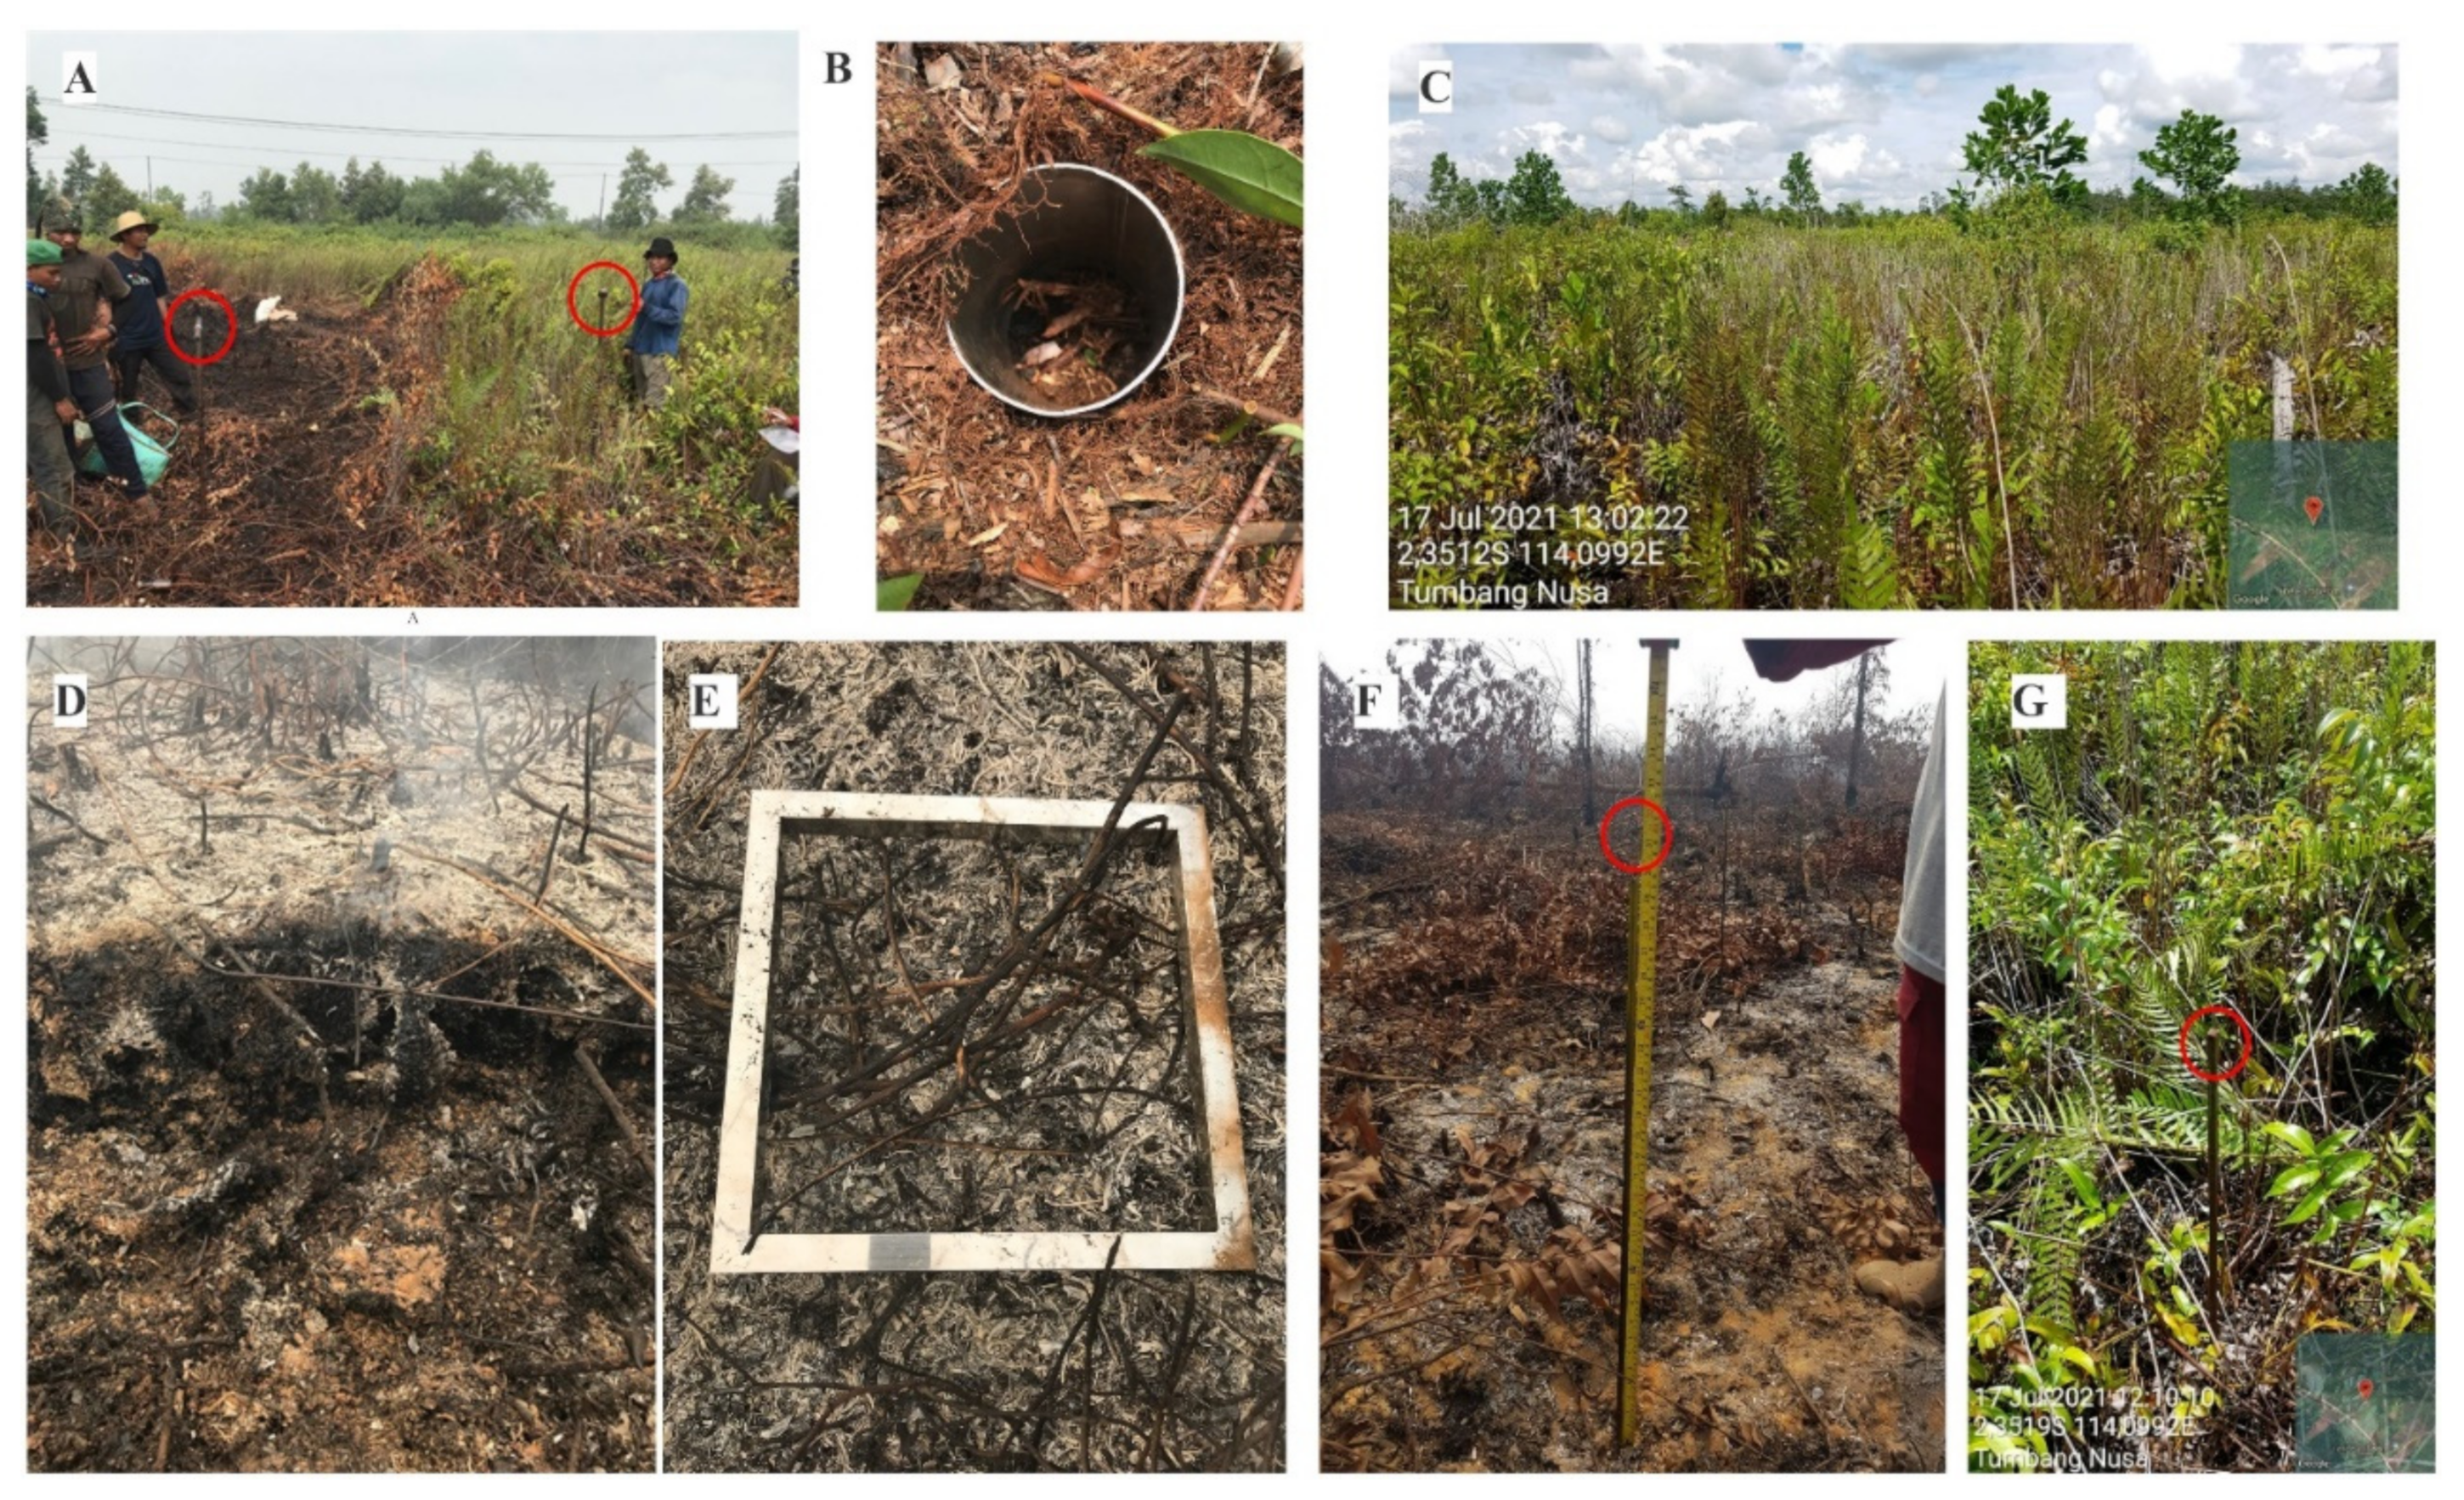
Figure 2.
Photos of study sites: (A) Site 1 during July 2019 measurements, showing burned and unburned locations, red circles indicate position of peat auger samples taken from burned and unburned sites; (B) sampling of roots, rhizomes and peat using a metal ring; (C) Site 1 in July 2021 showing recovery of vegetation; (D) Site 2 in September 2019 showing exposed roots, one day after peat fire burned the area; (E) sampling of shrubs and litter at burned sites, where the red circle indicates the metal rod; (F) Site 2, measurements of surface combustion using a metal rod indicated by the red circle; and (G) Site 2 in July 2021 showing recovery of vegetation and litter.

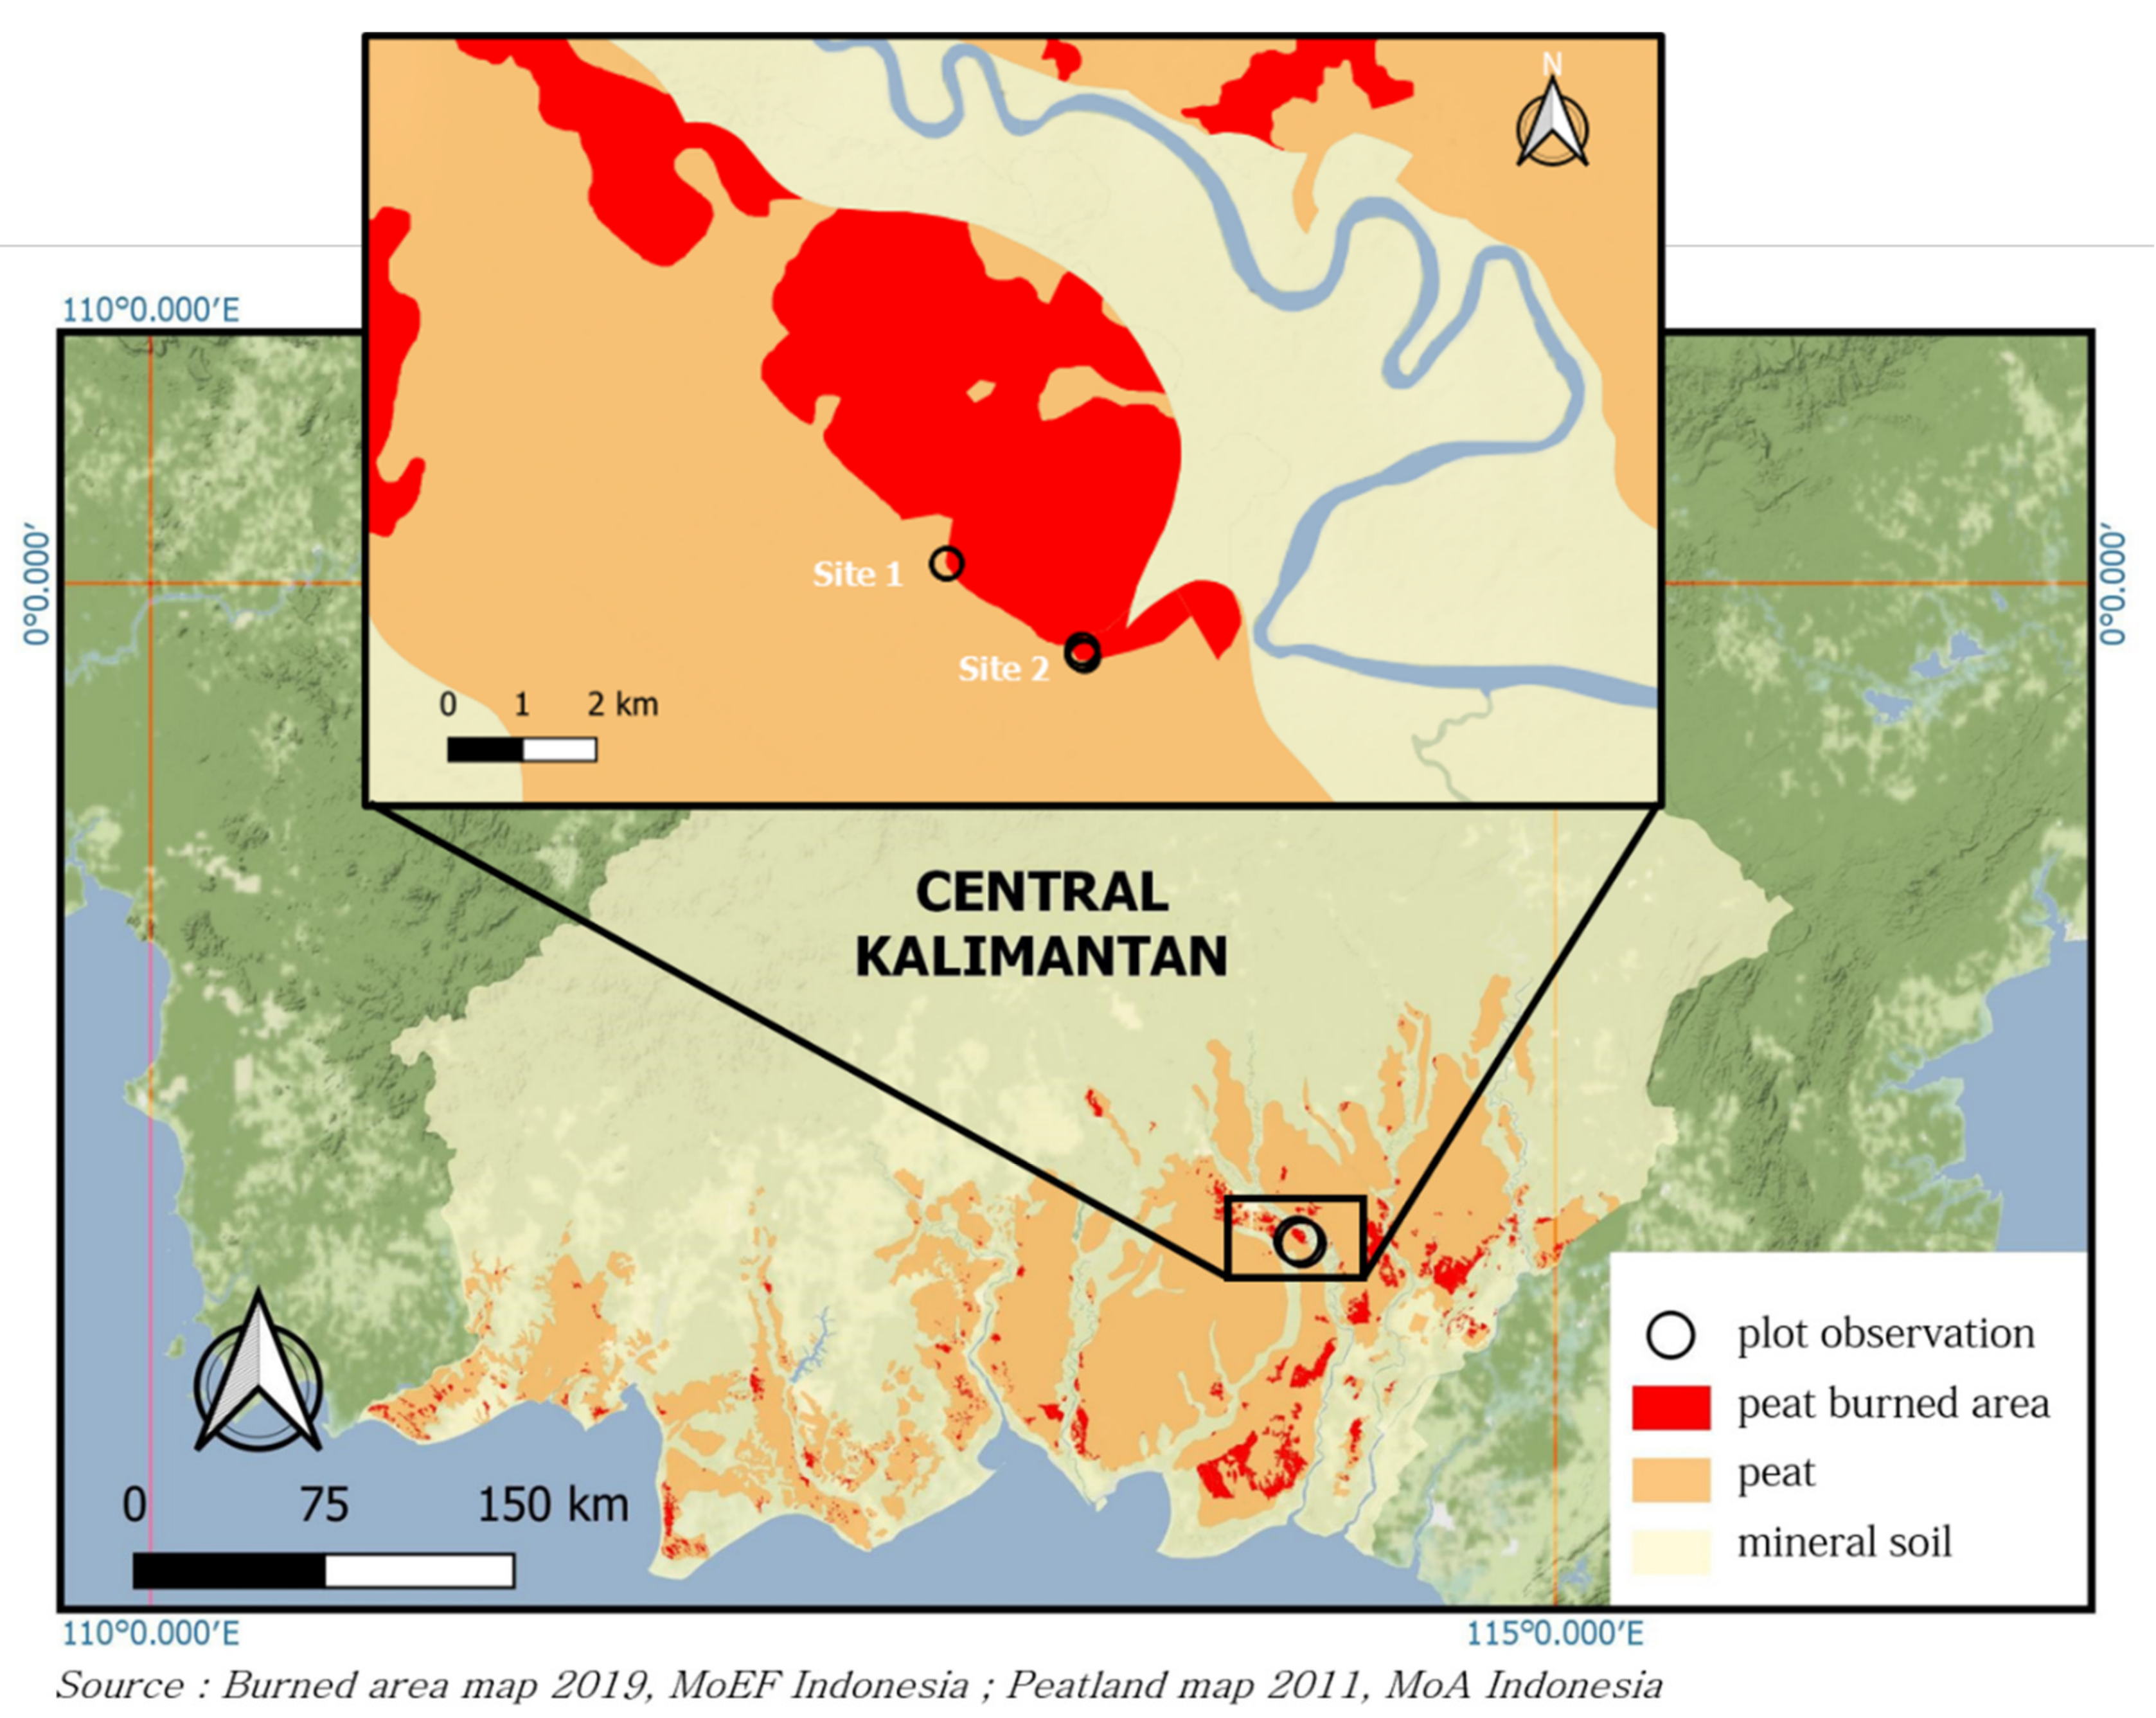
Figure 3.
A map of the area burned in peat fires in 2019 in Central Kalimantan.

Figure 4.
(A) Map of the peat depth at the study sites, (B) loss of the peat surface during peat fires in September 2019 at Site 2 as measured from two transects, Central Kalimantan. Error bars are the standard error (s.e.) of the mean. As can be seen in Figure 2D, it was not possible to separate the loss of peat from the overall surface loss.

Figure 5.
Monthly Normalized Difference Vegetation Index (NDVI) from January 2019 to July 2021 at Site 2, Central Kalimantan.
Figure 5.
Monthly Normalized Difference Vegetation Index (NDVI) from January 2019 to July 2021 at Site 2, Central Kalimantan.


Table 1.
Sampling design at Site 1 and 2 in burned and unburned treatments in degraded peatlands.
| Component | Site 1 | Site 2 |
|---|---|---|
| Date of measurements | 15 July 2019 | 5 September 2019 |
| Number of burned plots | 3 | 4 |
| Number of unburned plots | 3 | 4 |
| Number of samples, burned plots | 9 | 12 |
| Number of samples, unburned plots | 9 | 12 |
| Vegetation type | Degraded peatland | Degraded peatland |
| Fire history | 2003, 2006, 2009 | 2001, 2004, 2006, 2009 |
Table 2.
Carbon content (C%) of measured above- and belowground components in burned and unburned degraded peatland treatments according to site.
Table 2.
Carbon content (C%) of measured above- and belowground components in burned and unburned degraded peatland treatments according to site.
| Treatment | Component | Site 1 | Site 2 | Average |
|---|---|---|---|---|
| Burned | Litter | 39.3 ± 0.46 | 50.40 ± 1.31 | 45.2 ± 1.49 |
| Shrub | Not present | 47.35 ± 0.42 | 47.4 ± 0.43 | |
| Peat, 0–10 cm | 45.03 ± 0.23 | 38.14 ± 2.35 | 41.1 ± 1.53 | |
| Unburned | Litter | 49.76 ± 0.42 | 52.06 ± 0.71 | 51.1 ± 0.52 |
| Shrub | 46.88 ± 0.41 | 47.37 ± 0.31 | 47.2 ± 0.25 | |
| Peat, 0–10 cm | 51.41 ± 1.10 | 41.21 ± 2.51 | 45.6 ± 1.86 |
Values are the means, n = 9 for Site 1 and n = 12 for Site 2, ± is the standard error (s.e.) of the mean.
Table 3.
Peat bulk density (g cm−3) in burned and unburned treatments in degraded peatlands of Central Kalimantan.
Table 3.
Peat bulk density (g cm−3) in burned and unburned treatments in degraded peatlands of Central Kalimantan.
| Component | Burned | Unburned |
|---|---|---|
| Site 1 | 0.131 ± 0.008 (9) | 0.149 ± 0.007 (9) |
| Site 2 | 0.149 ± 0.007 (12) | 0.165 ± 0.011 (12) |
Values are the means (with the number of samples given in brackets), ± is the standard error (s.e.) of the mean.
Table 4.
Mass of above- and belowground carbon and carbon loss (Mg C ha−1) across two sites in degraded peatlands of Central Kalimantan.
Table 4.
Mass of above- and belowground carbon and carbon loss (Mg C ha−1) across two sites in degraded peatlands of Central Kalimantan.
| Component | Burned | Unburned | Loss | p Value |
|---|---|---|---|---|
| Shrub | 0.63 ± 0.27 | 4.57 ± 0.47 | 4.04 ± 0.56 | <0.001 |
| Litter | 3.99 ± 0.62 | 3.43 ± 0.41 | −0.56 ± 0.79 | n/s |
| Peat (0–11 cm) | 63.4 ± 3.21 | 78.4 ± 3.88 | 15.02 ± 4.76 | 0.004 |
| Total | 18.50 ± 4.88 |
Values are the means, n = 20, ± is the s.e. of the mean.
Publisher’s Note: MDPI stays neutral with regard to jurisdictional claims in published maps and institutional affiliations. |
© 2021 by the authors. Licensee MDPI, Basel, Switzerland. This article is an open access article distributed under the terms and conditions of the Creative Commons Attribution (CC BY) license (https://creativecommons.org/licenses/by/4.0/).
Share and Cite
MDPI and ACS Style
Volkova, L.; Adinugroho, W.C.; Krisnawati, H.; Imanuddin, R.; Weston, C.J. Loss and Recovery of Carbon in Repeatedly Burned Degraded Peatlands of Kalimantan, Indonesia. Fire 2021, 4, 64. https://doi.org/10.3390/fire4040064
AMA Style
Volkova L, Adinugroho WC, Krisnawati H, Imanuddin R, Weston CJ. Loss and Recovery of Carbon in Repeatedly Burned Degraded Peatlands of Kalimantan, Indonesia. Fire. 2021; 4(4):64. https://doi.org/10.3390/fire4040064
Chicago/Turabian StyleVolkova, Liubov, Wahyu Catur Adinugroho, Haruni Krisnawati, Rinaldi Imanuddin, and Christopher John Weston. 2021. "Loss and Recovery of Carbon in Repeatedly Burned Degraded Peatlands of Kalimantan, Indonesia" Fire 4, no. 4: 64. https://doi.org/10.3390/fire4040064