
Optimization of Ultrasound-Assisted Extraction via Sonotrode of Phenolic Compounds from Orange By-Products

 ,
,  ,
,  , and
, and
Abstract
:1. Introduction
2. Materials and Methods
2.1. Chemicals and Samples
2.2. Experimental Design
2.3. Extraction of Phenolic Compounds from Orange By-Products by Sonotrode Ultrasonic Extraction
2.4. Conventional Extraction of Phenolic Compounds from Orange By-Products
2.5. Determination of Total Phenolic Compounds by Folin–Ciocalteu Assay
2.6. Determination of Phenolic Compounds from Orange By-Products by HPLC-ESI-TOF-MS
2.7. Antioxidant Assays DPPH and ABTS
3. Results and Discussion
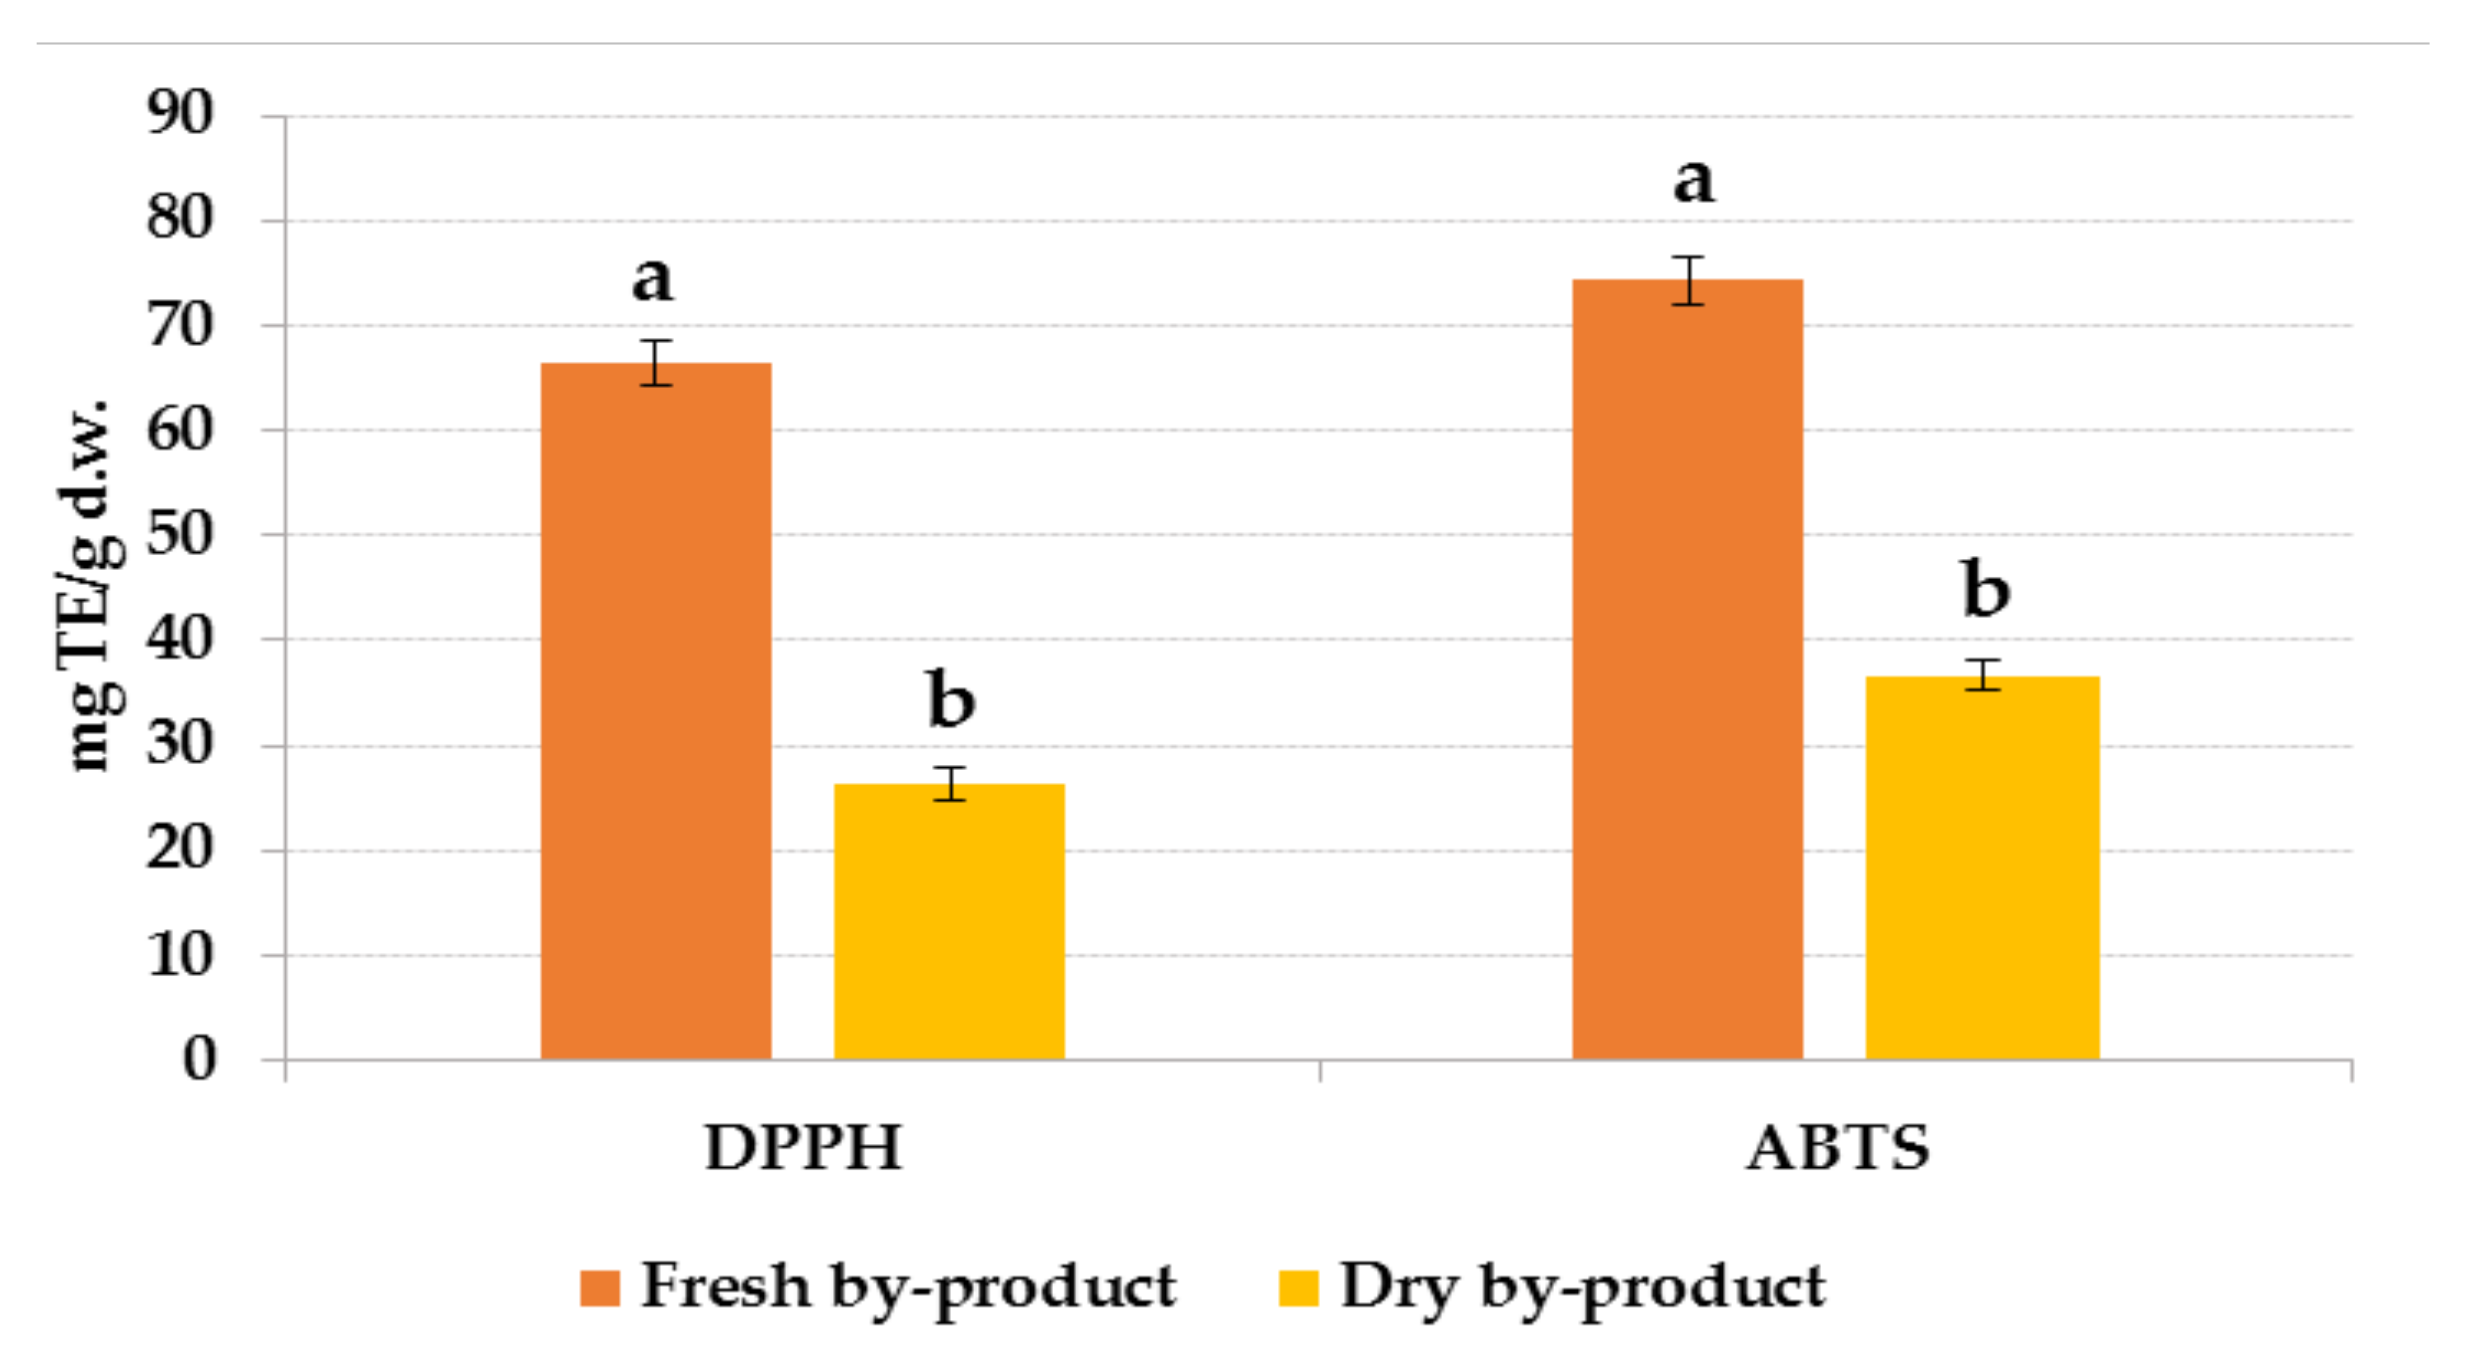
3.1. Determination of Total Phenolic Compounds and Antioxidant Capacity in Orange By-Products
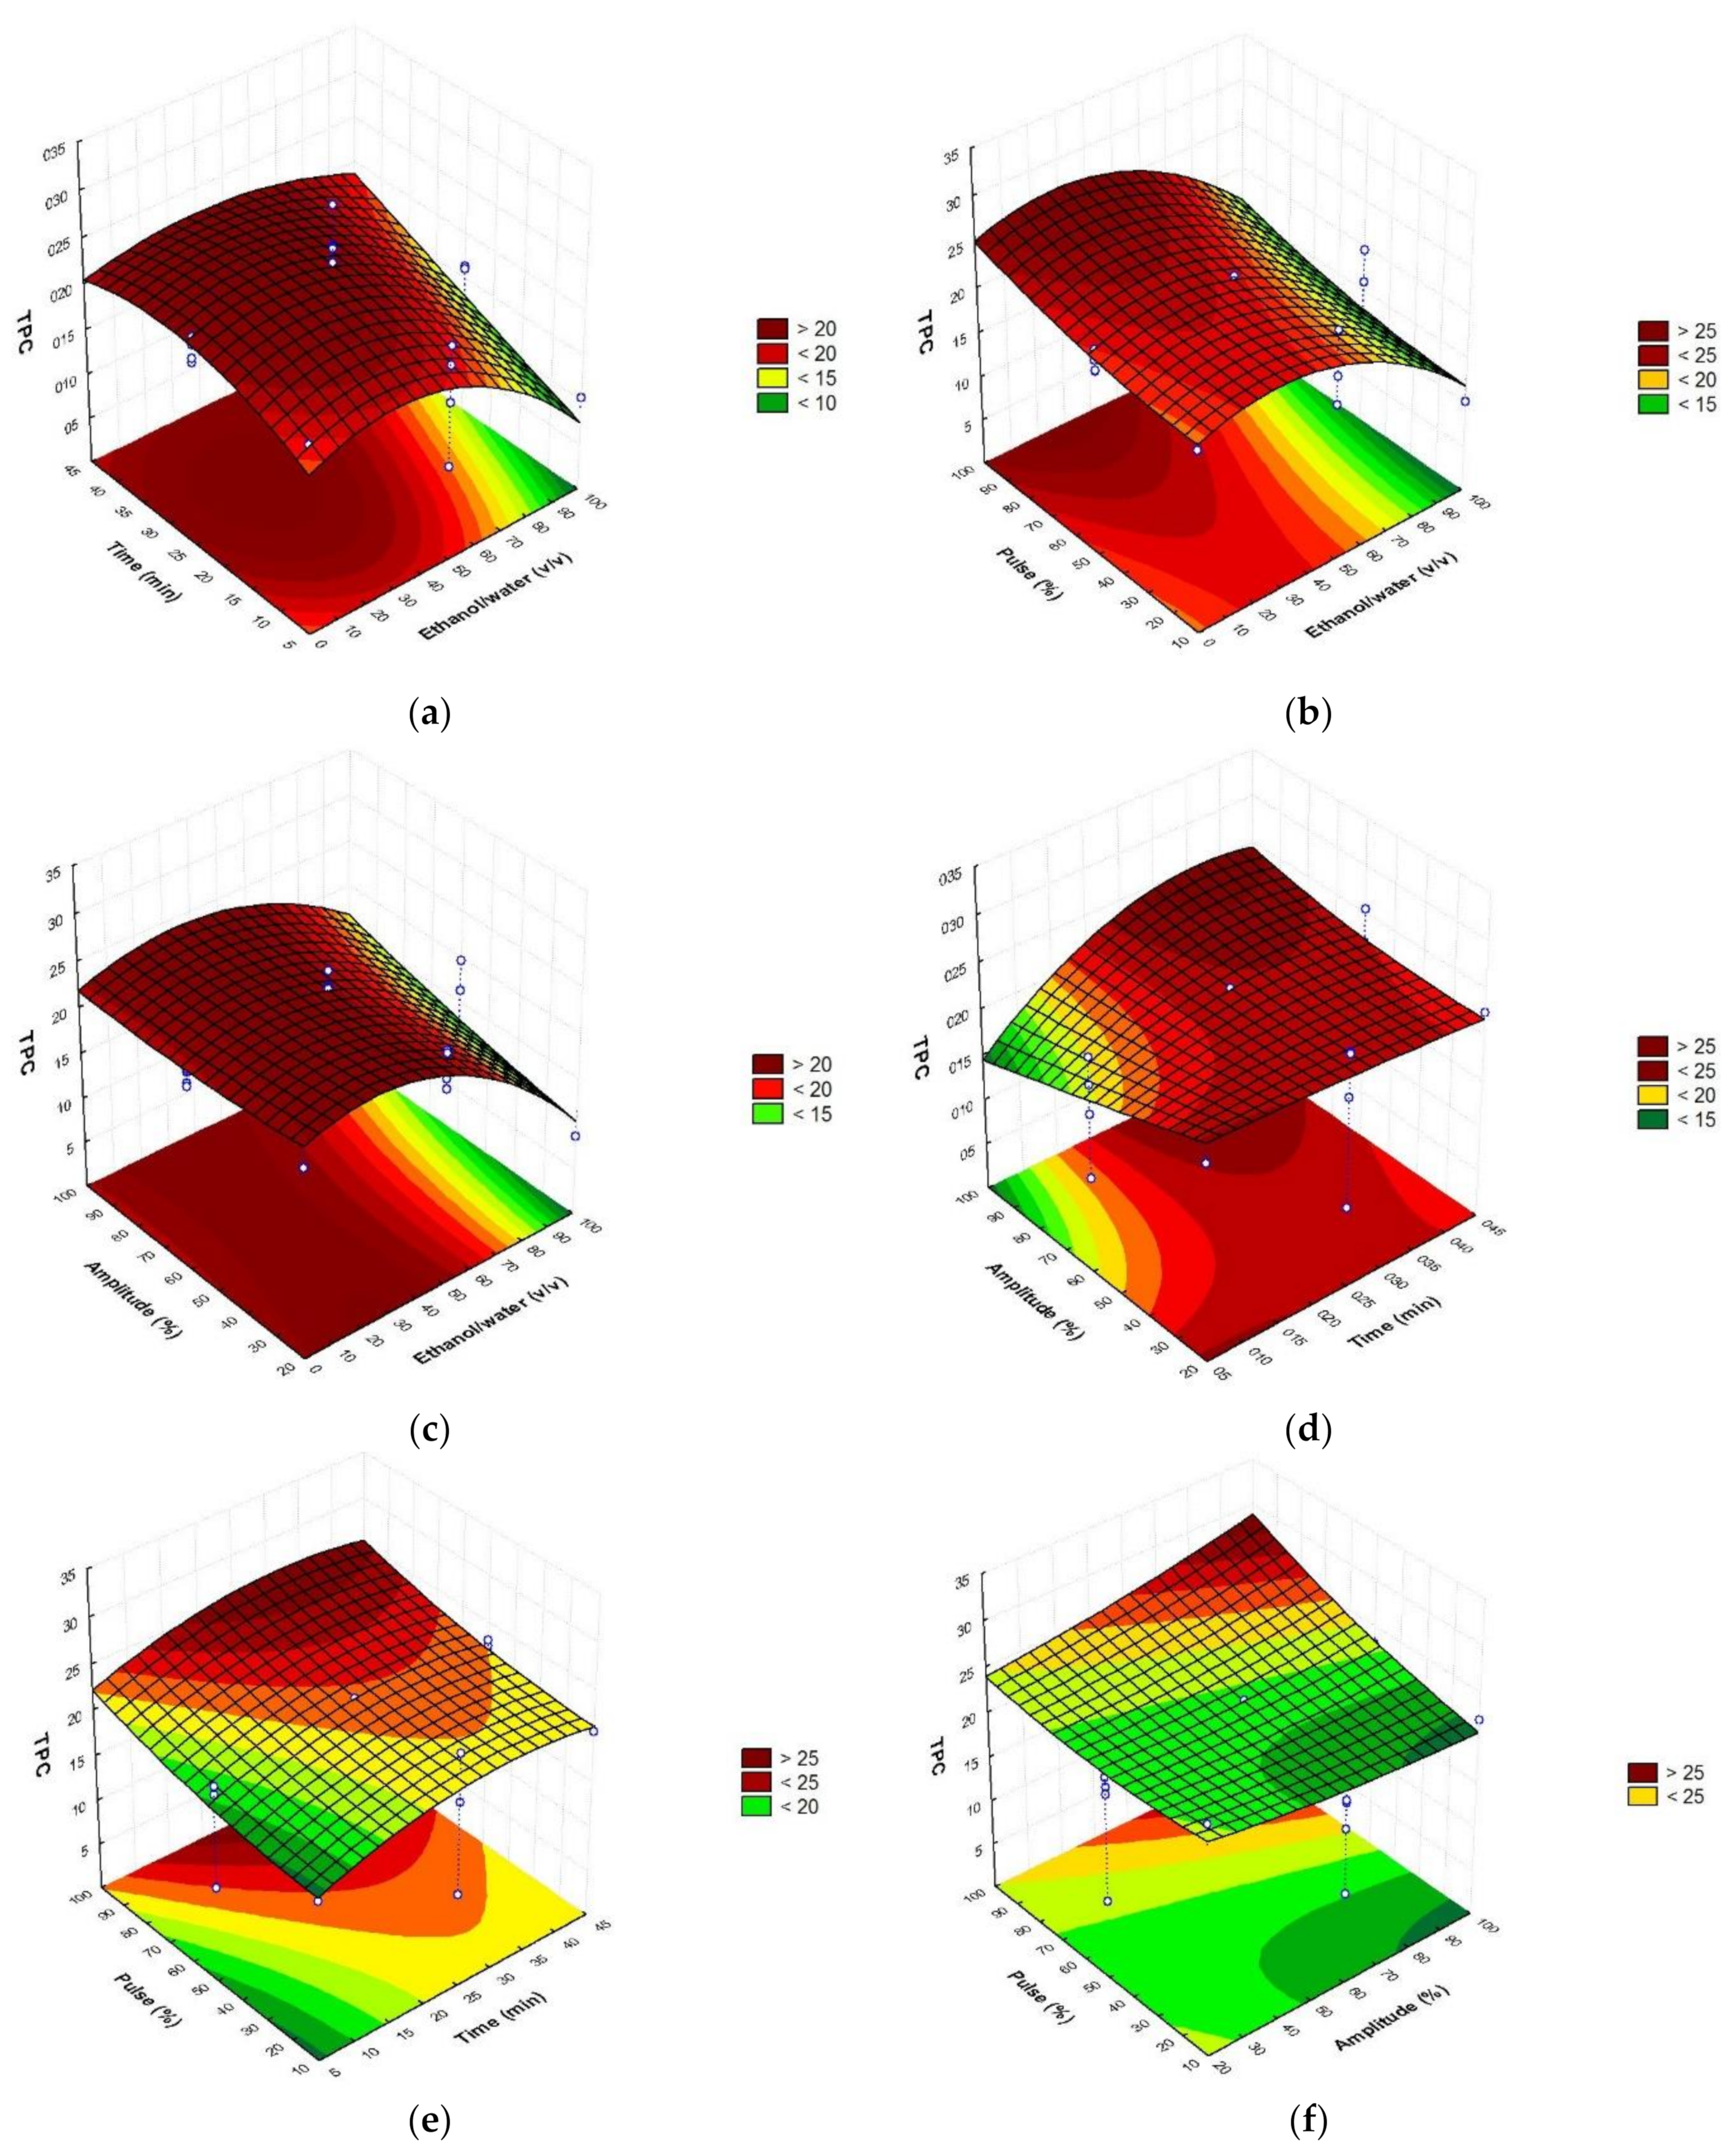
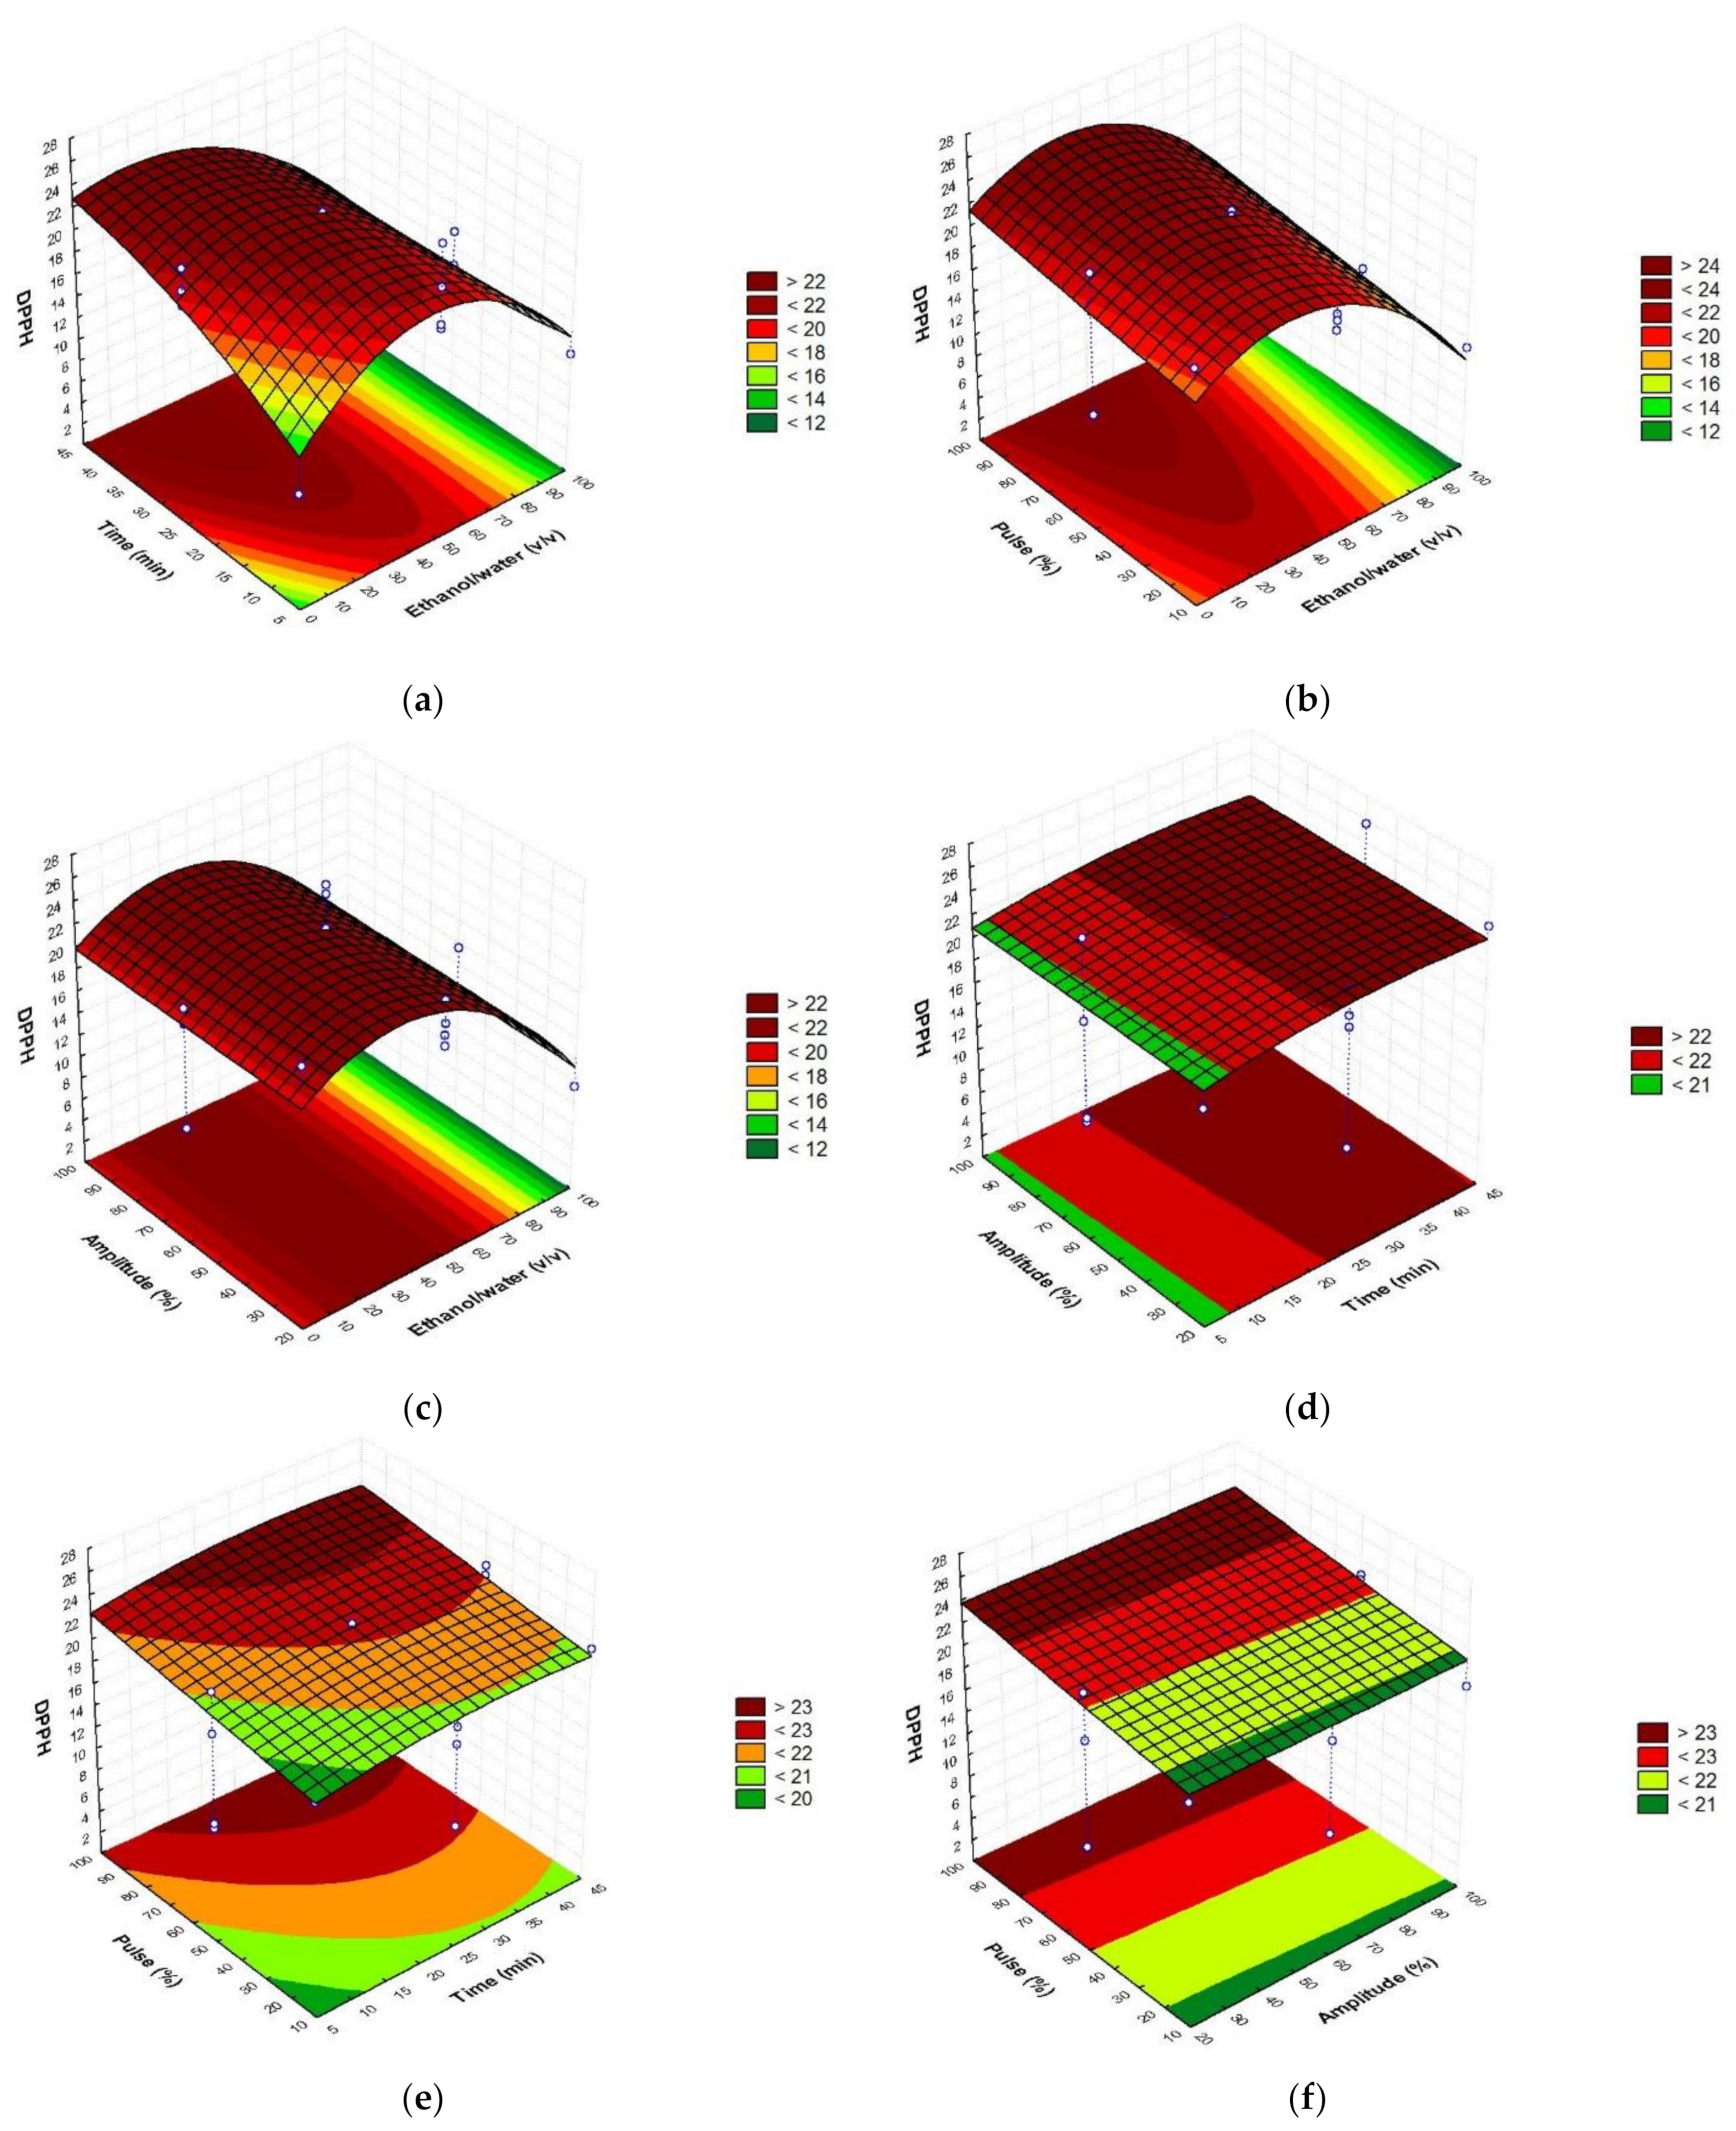
3.2. Fitting the Model
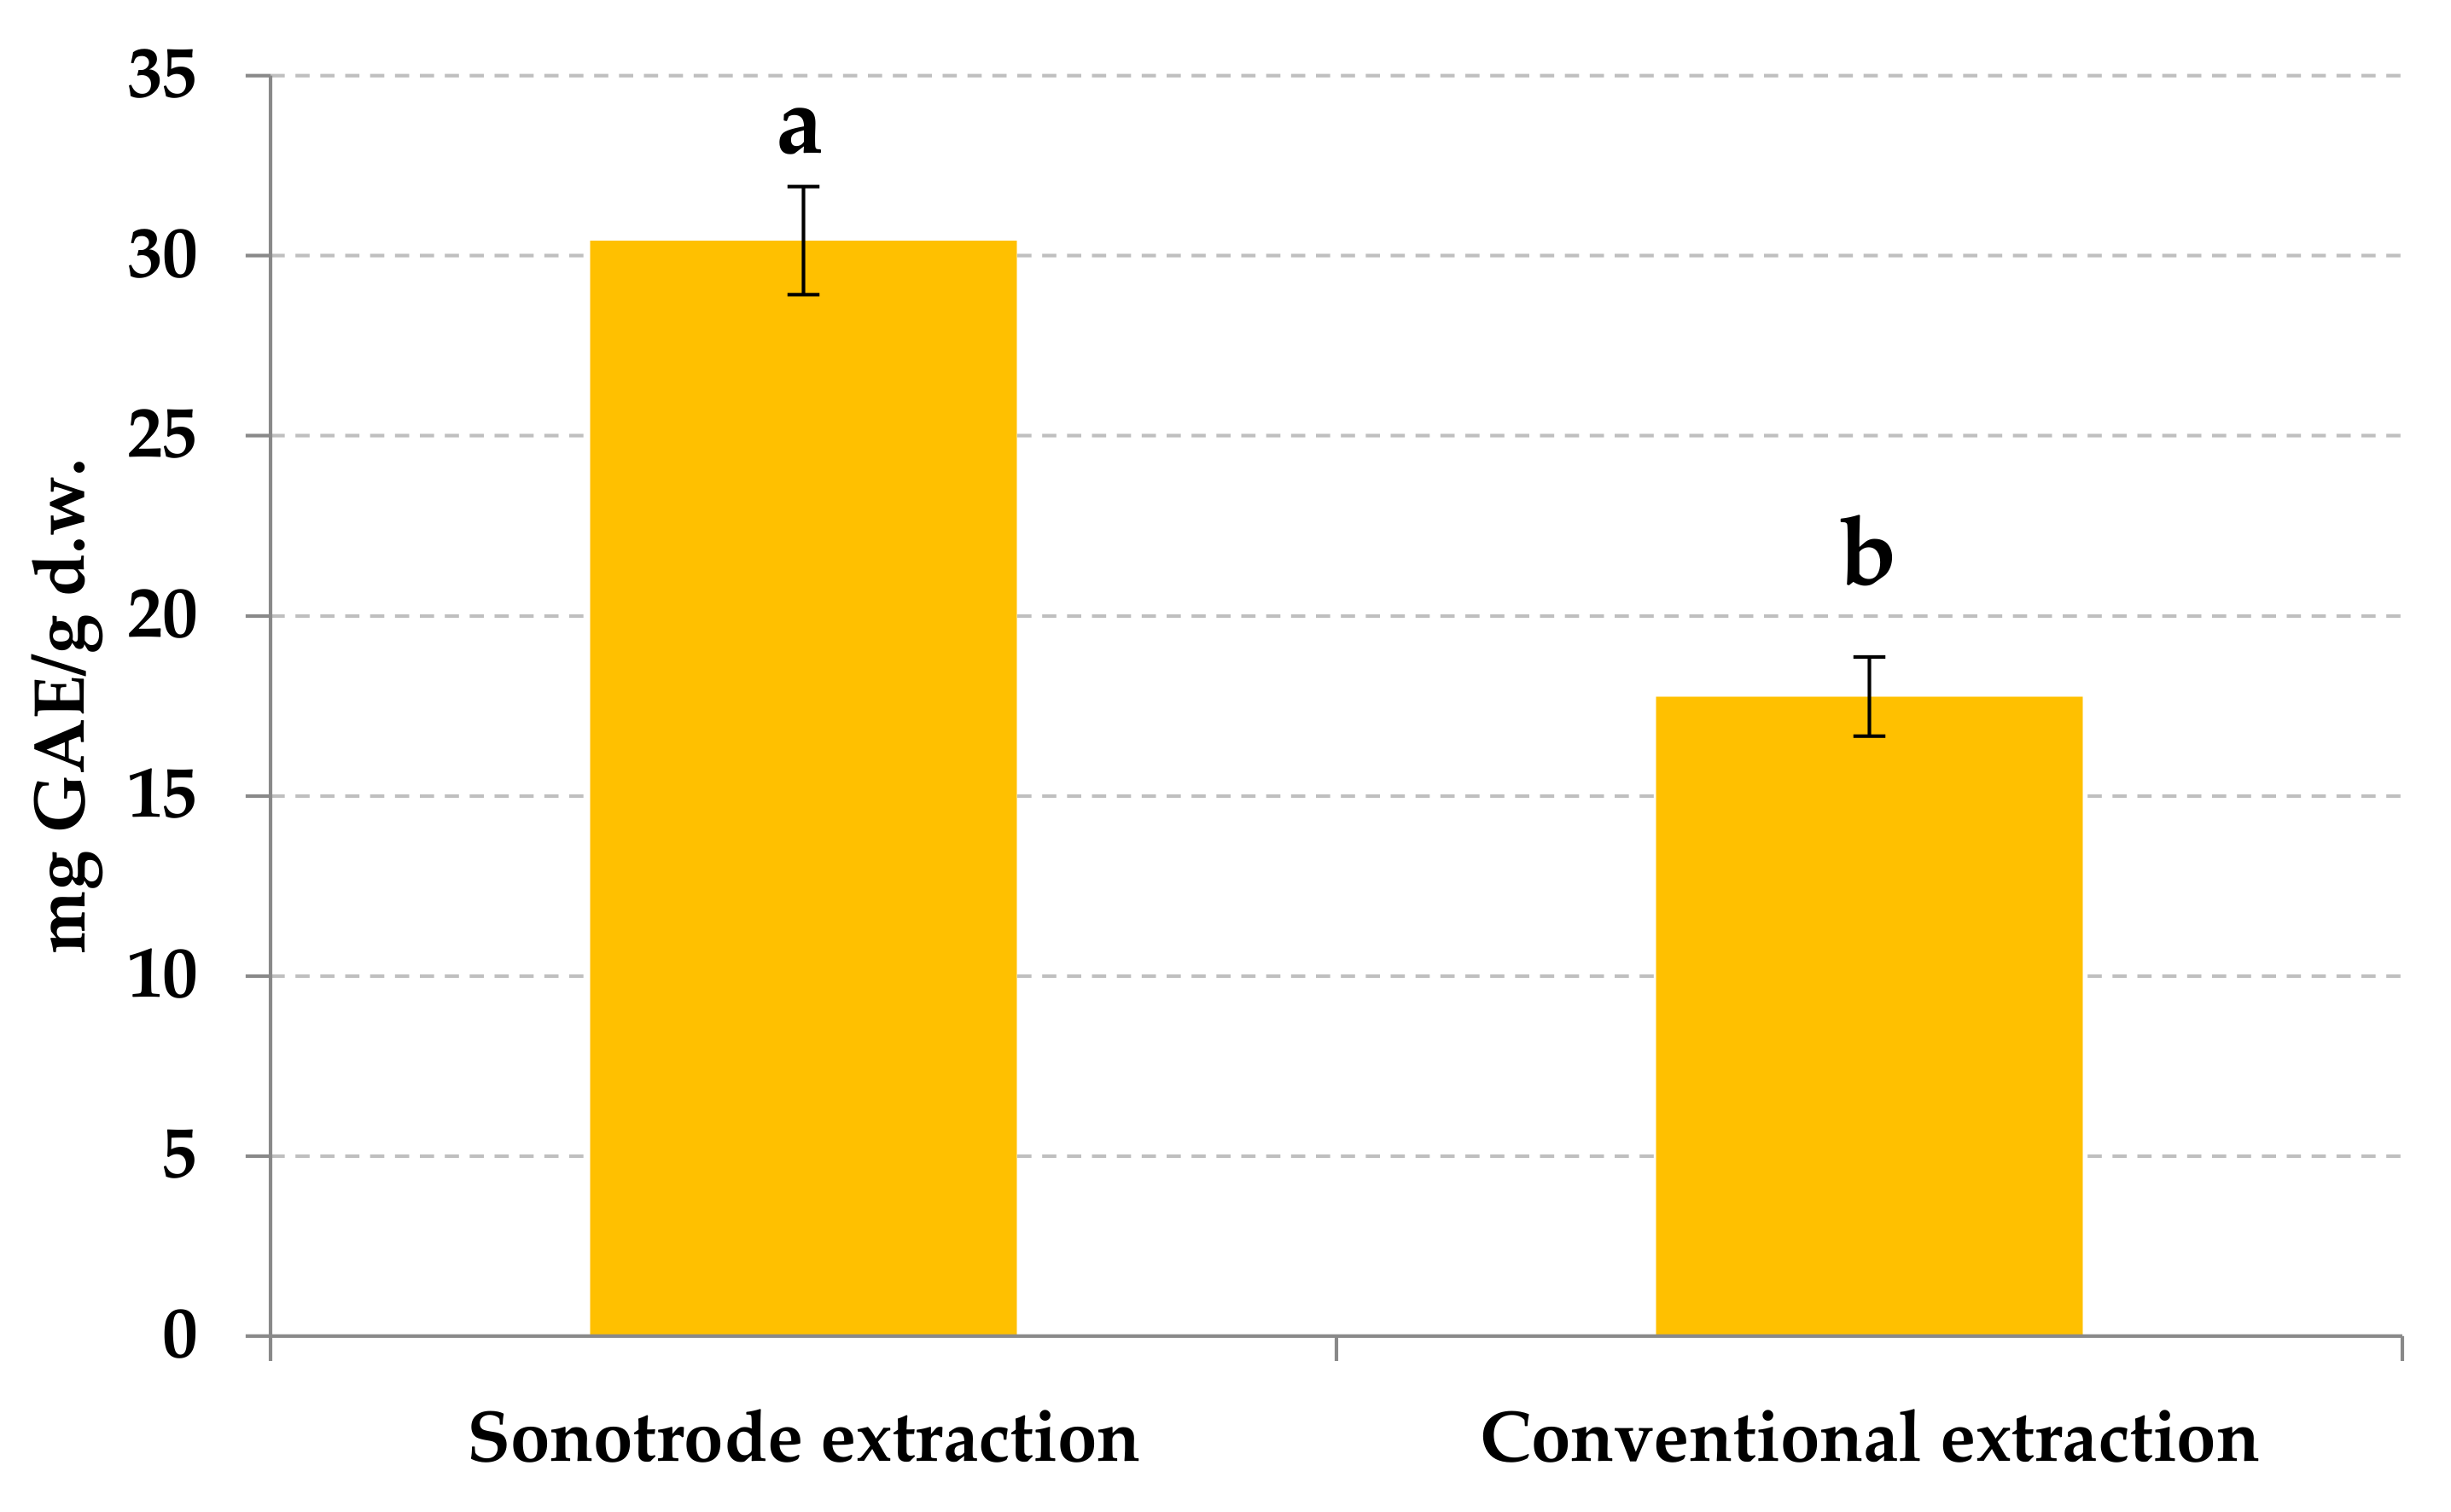
3.3. Confirmation of the Optimal Extraction Parameters by Sonotrode
3.4. Analytical Parameters of the Method
3.5. Identification of Phenolic Compounds by HPLC-ESI-TOF-MS
3.6. Quantification of Phenolic Compounds in Orange Peel Extracts
4. Conclusions
Author Contributions
Funding
Institutional Review Board Statement
Informed Consent Statement
Data Availability Statement
Acknowledgments
Conflicts of Interest
References
- Romero-Lopez, M.R.; Osorio-Diaz, P.; Bello-Perez, L.A.; Tovar, J.; Bernardino-Nicanor, A. Fiber concentrate from orange (Citrus sinensis L.) bagase: Characterization and application as bakery product ingredient. Int. J. Mol. Sci. 2011, 12, 2174–2186. [Google Scholar] [CrossRef] [PubMed] [Green Version]
- Razola-Díaz, M.d.C.; Guerra-Hernández, E.J.; García-Villanova, B.; Verardo, V. Recent developments in extraction and encapsulation techniques of orange essential oil. Food Chem. 2021, 354, 129575. [Google Scholar] [CrossRef] [PubMed]
- Barrales, F.M.; Silveira, P.; Barbosa, P.; Barbosa, P.D.P.M.; Ruviaro, A.R.; Paulino, B.N.; Pastore, G.M.; Macedo, G.A.; Martinez, J. Recovery of phenolic compounds from citrus by-products using pressurized liquids—An application to orange peel. Food Bioprod. Process. 2018, 112, 9–21. [Google Scholar] [CrossRef]
- Mamma, D.; Christakopoulos, P. Biotransformation of Citrus By-Products into Value Added Products. Waste Biomass Valorization 2014, 5, 529–549. [Google Scholar] [CrossRef]
- Okino-Delgado, C.H.; Fleuri, L.F. Obtaining lipases from byproducts of orange juice processing. Food Chem. 2014, 163, 103–107. [Google Scholar] [CrossRef] [Green Version]
- El Kantar, S.; Boussetta, N.; Rajha, H.N.; Maroun, R.G.; Louka, N.; Vorobiev, E. High voltage electrical discharges combined with enzymatic hydrolysis for extraction of polyphenols and fermentable sugars from orange peels. Food Res. Int. 2018, 107, 755–762. [Google Scholar] [CrossRef] [PubMed]
- De Castro, L.A.; Lizi, J.M.; das Chagas, E.G.L.; de Carvalho, R.A.; Vanin, F.M. From orange juice by-product in the food industry to a functional ingredient: Application in the circular economy. Foods 2020, 9, 593. [Google Scholar] [CrossRef]
- Sicari, V.; Pellicanò, T.M.; Laganà, V.; Poiana, M. Use of orange by-products (dry peel) as an alternative gelling agent for marmalade production: Evaluation of antioxidant activity and inhibition of HMF formation during different storage temperature. J. Food Process. Preserv. 2018, 42, e13429. [Google Scholar] [CrossRef]
- De Moraes Crizel, T.; Jablonski, A.; de Oliveira Rios, A.; Rech, R.; Flôres, S.H. Dietary fiber from orange byproducts as a potential fat replacer. LWT Food Sci. Technol. 2013, 53, 9–14. [Google Scholar] [CrossRef]
- Wang, S.; He, N.; Xing, H.; Sun, Y.; Ding, J.; Liu, L. Function of hesperidin alleviating inflammation and oxidative stress responses in COPD mice might be related to SIRT1/PGC-1α/NF-κB signaling axis. J. Recept. Signal Transduct. 2020, 40, 388–394. [Google Scholar] [CrossRef]
- Liu, L.; Shan, S.; Zhang, K.; Ning, Z.-Q.; Lu, X.-P.; Cheng, Y.-Y. Naringenin and hesperetin, two flavonoids derived from Citrus aurantium up-regulate transcription of adiponectin. Phyther. Res. 2008, 22, 1400–1403. [Google Scholar] [CrossRef]
- Choi, E.J.; Kim, G.H. Anti-/pro-apoptotic effects of hesperetin against 7,12-dimetylbenz(a) anthracene-induced alteration in animals. Oncol. Rep. 2011, 25, 545–550. [Google Scholar] [CrossRef] [PubMed]
- Guardia, T.; Rotelli, A.E.; Juarez, A.O.; Pelzer, L.E. Anti-inflammatory properties of plant flavonoids. Effects of rutin, quercetin and hesperidin on adjuvant arthritis in rat. Farmaco 2001, 56, 683–687. [Google Scholar] [CrossRef]
- Mahmoud, A.M.; Ashour, M.B.; Abdel-Moneim, A.; Ahmed, O.M. Hesperidin and naringin attenuate hyperglycemia-mediated oxidative stress and proinflammatory cytokine production in high fat fed/streptozotocin-induced type 2 diabetic rats. J. Diabetes Complicat. 2012, 26, 483–490. [Google Scholar] [CrossRef]
- Elavarasan, J.; Velusamy, P.; Ganesan, T.; Ramakrishnan, S.K.; Rajasekaran, D.; Periandavan, K. Hesperidin-mediated expression of Nrf2 and upregulation of antioxidant status in senescent rat heart. J. Pharm. Pharmacol. 2012, 64, 1472–1482. [Google Scholar] [CrossRef]
- Deng, L.Z.; Mujumdar, A.S.; Yang, W.X.; Zhang, Q.; Zheng, Z.A.; Wu, M.; Xiao, H.W. Hot air impingement drying kinetics and quality attributes of orange peel. J. Food Process. Preserv. 2020, 44, e14294. [Google Scholar] [CrossRef]
- Wang, L.; Weller, C.L. Recent advances in extraction of nutraceuticals from plants. Trends Food Sci. Technol. 2006, 17, 300–312. [Google Scholar] [CrossRef]
- Garau, M.C.; Simal, S.; Rosselló, C.; Femenia, A. Effect of air-drying temperature on physico-chemical properties of dietary fibre and antioxidant capacity of orange (Citrus aurantium v. Canoneta) by-products. Food Chem. 2007, 104, 1014–1024. [Google Scholar] [CrossRef]
- Abdurrahman Isa, A.; Samsuri, S.; Aini Amran, N. Integration of Maceration and Freeze Concentration for Recovery of Vitamin C from Orange Peel Waste. IOP Conf. Ser. Earth Environ. Sci. 2019, 268, 012101. [Google Scholar] [CrossRef]
- Singleton, V.L.; Orthofer, R.; Lamuela-Raventós, R.M. Analysis of Total Phenols and other oxidation substrates and antioxidants by means of Folin-Ciocalteu Reagent. In Oxidants and Antioxidants Part A, Methods in Enzymology; Academic Press: Boston, MA, USA, 1999; Volume 299, pp. 152–178. [Google Scholar]
- Verni, M.; Pontonio, E.; Krona, A.; Jacob, S.; Pinto, D.; Rinaldi, F.; Verardo, V.; Díaz-de-Cerio, E.; Coda, R.; Rizzello, C.G. Bioprocessing of Brewers’ Spent Grain Enhances Its Antioxidant Activity: Characterization of Phenolic Compounds and Bioactive Peptides. Front. Microbiol. 2020, 11, 1831. [Google Scholar] [CrossRef] [PubMed]
- Re, R.; Pellegrini, N.; Proteggente, A.; Pannala, A.; Yang, M.; Rice-Evans, C. Antioxidant activity applying an improved ABTS radical cation decolorization assay. Free Radic. Biol. Med. 1999, 26, 1231–1237. [Google Scholar] [CrossRef]
- Brand-Williams, W.; Cuvelier, M.E.; Berset, C. Use of a free redical method to evaluate antioxidant activity. LWT Food Sci. Technol. 1995, 28, 25–30. [Google Scholar] [CrossRef]
- Parejo, I.; Codina, C.; Petrakis, C.; Kefalas, P. Evaluation of scavenging activity assessed by Co(II)/EDTA-induced luminol chemiluminescence and DPPH·(2,2-diphenyl-1-picrylhydrazyl) free radical assay. J. Pharmacol. Toxicol. Methods 2000, 44, 507–512. [Google Scholar] [CrossRef]
- Victor, M.M.; David, J.M.; Cortez, M.V.M.; Leite, J.L.; da Silva, G.S.B. A High-Yield Process for Extraction of Hesperidin from Orange (Citrus sinensis L. osbeck) Peels Waste, and Its Transformation to Diosmetin, A Valuable and Bioactive Flavonoid. Waste Biomass Valorization 2021, 12, 313–320. [Google Scholar] [CrossRef]
- Lagha-Benamrouche, S.; Madani, K. Phenolic contents and antioxidant activity of orange varieties (Citrus sinensis L. and Citrus aurantium L.) cultivated in Algeria: Peels and leaves. Ind. Crops Prod. 2013, 50, 723–730. [Google Scholar] [CrossRef]
- Nayak, B.; Dahmoune, F.; Moussi, K.; Remini, H.; Dairi, S.; Aoun, O.; Khodir, M. Comparison of microwave, ultrasound and accelerated-assisted solvent extraction for recovery of polyphenols from Citrus sinensis peels. Food Chem. 2015, 187, 507–516. [Google Scholar] [CrossRef]
- Montero-Calderon, A.; Cortes, C.; Zulueta, A.; Frigola, A.; Esteve, M.J. Green solvents and Ultrasound-Assisted Extraction of bioactive orange (Citrus sinensis) peel compounds. Sci. Rep. 2019, 9, 16120. [Google Scholar] [CrossRef]
- Khan, M.K.; Abert-Vian, M.; Fabiano-Tixier, A.S.; Dangles, O.; Chemat, F. Ultrasound-assisted extraction of polyphenols (flavanone glycosides) from orange (Citrus sinensis L.) peel. Food Chem. 2010, 119, 851–858. [Google Scholar] [CrossRef]
- Shahram, H.; Dinani, S.T.; Amouheydari, M. Effects of pectinase concentration, ultrasonic time, and pH of an ultrasonic-assisted enzymatic process on extraction of phenolic compounds from orange processing waste. J. Food Meas. Charact. 2019, 13, 487–498. [Google Scholar] [CrossRef]
- Luengo, E.; Álvarez, I.; Raso, J. Improving the pressing extraction of polyphenols of orange peel by pulsed electric fields. Innov. Food Sci. Emerg. Technol. 2013, 17, 79–84. [Google Scholar] [CrossRef]
- El Kantar, S.; Rajha, H.N.; Maroun, R.G.; Louka, N. Intensification of polyphenols extraction from orange peels using infrared as a novel and energy saving pretreatment. J. Food Sci. 2020, 85, 414–420. [Google Scholar] [CrossRef] [PubMed]
- Hernández-Carranza, P.; Ávila-Sosa, R.; Guerrero-Beltrán, J.A.; Navarro-Cruz, A.R.; Corona-Jiménez, E.; Ochoa-Velasco, C.E. Optimization of Antioxidant Compounds Extraction from Fruit By-Products: Apple Pomace, Orange and Banana Peel. J. Food Process. Preserv. 2016, 40, 103–115. [Google Scholar] [CrossRef]
- Park, J.H.; Lee, M.; Park, E. Antioxidant activity of orange flesh and peel extracted with various solvents. Prev. Nutr. Food Sci. 2014, 19, 291–298. [Google Scholar] [CrossRef] [Green Version]
- Lachos-Perez, D.; Baseggio, A.M.; Mayanga-Torres, P.C.; Maróstica, M.R.; Rostagno, M.A.; Martínez, J.; Forster-Carneiro, T. Subcritical water extraction of flavanones from defatted orange peel. J. Supercrit. Fluids 2018, 138, 7–16. [Google Scholar] [CrossRef]
- Saleem, M.; Hyoung, J.K.; Jin, C.; Yong, S.L. Antioxidant caffeic acid derivatives from leaves of Parthenocissus tricuspidata. Arch. Pharm. Res. 2004, 27, 300–304. [Google Scholar] [CrossRef] [PubMed]
- Hahn, R.; Nahrstedt, A. Hydroxycinnamic acid derivatives, caffeoylmalic and new caffeoylaldonic acid esters, from Chelidonium majus. Planta Med. 1993, 59, 71–75. [Google Scholar] [CrossRef]
- Tang, J.; Dunshea, F.R.; Suleria, H.A.R. LC-ESI-QTOF/MS characterization of phenolic compounds from medicinal plants (Hops and Juniper Berries) and their antioxidant activity. Foods 2020, 9, 7. [Google Scholar] [CrossRef] [Green Version]
- Jabri Karoui, I.; Marzouk, B. Characterization of bioactive compounds in Tunisian bitter orange (Citrus aurantium L.) peel and juice and determination of their antioxidant activities. Biomed Res. Int. 2013, 2013, 345415. [Google Scholar] [CrossRef] [Green Version]
- Gorinstein, S.; Martín-Belloso, O.; Park, Y.S.; Haruenkit, R.; Lojek, A.; Íž, M.; Caspi, A.; Libman, I.; Trakhtenberg, S. Comparison of some biochemical characteristics of different citrus fruits. Food Chem. 2001, 74, 309–315. [Google Scholar] [CrossRef]
- Risch, B.; Herrmann, K.; Wray, V.; Grotjahn, L. 2′-(E)-O-p-coumaroylgalactaric acid and 2′-(E)-O-feruloylgalactaric acid in citrus. Phytochemistry 1987, 26, 509–510. [Google Scholar] [CrossRef]
- Lu, Q.; Lv, S.; Peng, Y.; Zhu, C.; Pan, S. Characterization of phenolics and antioxidant abilities of red navel orange “cara cara” harvested from five regions of china. Int. J. Food Prop. 2018, 21, 1107–1116. [Google Scholar] [CrossRef]
- Anagnostopoulou, M.A.; Kefalas, P.; Kokkalou, E.; Assimopoulou, A.N.; Papageorgiou, V.P. Analysis of antioxidant compounds in sweet orange peel by HPLC-diode array detection-electrospray ionization mass spectrometry. Biomed. Chromatogr. 2005, 19, 138–148. [Google Scholar] [CrossRef]
- Bocco, A.; Cuvelier, M.E.; Richard, H.; Berset, C. Antioxidant Activity and Phenolic Composition of Citrus Peel and Seed Extracts. J. Agric. Food Chem. 1998, 46, 2123–2129. [Google Scholar] [CrossRef]
- Masike, K.; Mhlongo, M.I.; Mudau, S.P.; Nobela, O.; Ncube, E.N.; Tugizimana, F.; George, M.J.; Madala, N.E. Highlighting mass spectrometric fragmentation differences and similarities between hydroxycinnamoyl-quinic acids and hydroxycinnamoyl-isocitric acids. Chem. Cent. J. 2017, 11, 29. [Google Scholar] [CrossRef] [PubMed]
- Kvasnička, F.; Voldřich, M.; Pyš, P.; Vinš, I. Deterimination of isocitric acid in citrus juice—A comparison of HPLC, enzyme set and capillary isotachophoresis methods. J. Food Compos. Anal. 2002, 15, 685–691. [Google Scholar] [CrossRef]
- Ehling, S.; Cole, S. Analysis of organic acids in fruit juices by liquid chromatography-mass spectrometry: An enhanced tool for authenticity testing. J. Agric. Food Chem. 2011, 59, 2229–2234. [Google Scholar] [CrossRef] [PubMed]
- Nazir, N.; Koul, S.; Qurishi, M.A.; Taneja, S.C.; Ahmad, S.F.; Bani, S.; Qazi, G.N. Immunomodulatory effect of bergenin and norbergenin against adjuvant-induced arthritis-A flow cytometric study. J. Ethnopharmacol. 2007, 112, 401–405. [Google Scholar] [CrossRef]
- Ma, Y.Q.; Ye, X.Q.; Fang, Z.X.; Chen, J.C.; Xu, G.H.; Liu, D.H. Phenolic compounds and antioxidant activity of extracts from ultrasonic treatment of satsuma mandarin (Citrus unshiu Marc.) peels. J. Agric. Food Chem. 2008, 56, 5682–5690. [Google Scholar] [CrossRef]
- Anagnostopoulou, M.A.; Kefalas, P.; Papageorgiou, V.P.; Assimopoulou, A.N.; Boskou, D. Radical scavenging activity of various extracts and fractions of sweet orange peel (Citrus sinensis). Food Chem. 2006, 94, 19–25. [Google Scholar] [CrossRef]
- Allaf, T.; Tomao, V.; Besombes, C.; Chemat, F. Thermal and mechanical intensification of essential oil extraction from orange peel via instant autovaporization. Chem. Eng. Process. Process Intensif. 2013, 72, 24–30. [Google Scholar] [CrossRef]
- Khan, M.K.; Zill-E-Huma; Dangles, O. A comprehensive review on flavanones, the major citrus polyphenols. J. Food Compos. Anal. 2014, 33, 85–104. [Google Scholar] [CrossRef]
- Vanamala, J.; Reddivari, L.; Yoo, K.S.; Pike, L.M.; Patil, B.S. Variation in the content of bioactive flavonoids in different brands of orange and grapefruit juices. J. Food Compos. Anal. 2006, 19, 157–166. [Google Scholar] [CrossRef]
- Chen, X.M.; Tait, A.R.; Kitts, D.D. Flavonoid composition of orange peel and its association with antioxidant and anti-inflammatory activities. Food Chem. 2017, 218, 15–21. [Google Scholar] [CrossRef] [PubMed]
- Iglesias-Carres, L.; Mas-Capdevila, A.; Bravo, F.I.; Aragonès, G.; Muguerza, B.; Arola-Arnal, A. Optimization of a polyphenol extraction method for sweet orange pulp (Citrus sinensis L.) to identify phenolic compounds consumed from sweet oranges. PLoS ONE 2019, 14, e0211267. [Google Scholar] [CrossRef]
- Omoba, O.S.; Obafaye, R.O.; Salawu, S.O.; Boligon, A.A.; Athayde, M.L. HPLC-DAD phenolic characterization and antioxidant activities of ripe and unripe sweet orange peels. Antioxidants 2015, 4, 498–512. [Google Scholar] [CrossRef] [Green Version]
- Berhow, M.A.; Vandercook, C.E. Biosynthesis of naringin and prunin in detached grapefruit. Phytochemistry 1989, 28, 1627–1630. [Google Scholar] [CrossRef] [Green Version]
- Castillo, J.; Benavente, O.; del Rio, J.A. Hesperetin 7-O-Glucoside and Prunin in Citrus Species (C. aurantium and C. paradisi). A Study of Their Quantitative Distribution in Immature Fruits and as Immediate Precursors of Neohesperidin and Naringin in C. aurantium. J. Agric. Food Chem. 1993, 41, 1920–1924. [Google Scholar] [CrossRef]
- Fayek, N.M.; Farag, M.A.; Abdel Monem, A.R.; Moussa, M.Y.; Abd-Elwahab, S.M.; El-Tanbouly, N.D. Comparative Metabolite Profiling of Four Citrus Peel Cultivars via Ultra-Performance Liquid Chromatography Coupled with Quadrupole-Time-of-Flight-Mass Spectrometry and Multivariate Data Analyses. J. Chromatogr. Sci. 2019, 57, 349–360. [Google Scholar] [CrossRef]
- Gattuso, G.; Barreca, D.; Gargiulli, C.; Leuzzi, U.; Caristi, C. Flavonoid composition of citrus juices. Molecules 2007, 12, 1641–1673. [Google Scholar] [CrossRef] [PubMed] [Green Version]
- Goh, J.X.H.; Tan, L.T.H.; Goh, J.K.; Chan, K.G.; Pusparajah, P.; Lee, L.H.; Goh, B.H. Nobiletin and derivatives: Functional compounds from citrus fruit peel for colon cancer chemoprevention. Cancers 2019, 11, 867. [Google Scholar] [CrossRef] [Green Version]
- Nakazawa, Y.; Aoki, M.; Ishiwa, S.; Morishita, N.; Endo, S.; Nagai, N.; Yamamoto, N.; Funakoshi-Tago, M.; Tamura, H. Oral intake of α-glucosyl-hesperidin ameliorates selenite-induced cataract formation. Mol. Med. Rep. 2020, 21, 1258–1266. [Google Scholar] [CrossRef] [PubMed] [Green Version]
- Sugasawa, N.; Katagi, A.; Kurobe, H.; Nakayama, T.; Nishio, C.; Takumi, H.; Higashiguchi, F.; Aihara, K.; Shimabukuro, M.; Sata, M.; et al. Inhibition of Atherosclerotic Plaque Development by Oral Administration of α-Glucosyl Hesperidin and Water-Dispersible Hesperetin in Apolipoprotein E Knockout Mice. J. Am. Coll. Nutr. 2019, 38, 15–22. [Google Scholar] [CrossRef] [PubMed]
- Lipson, S.M.; Ozen, F.S.; Louis, S.; Karthikeyan, L. Comparison of α-glucosyl hesperidin of citrus fruits and epigallocatechin gallate of green tea on the Loss of Rotavirus Infectivity in Cell Culture. Front. Microbiol. 2015, 6, 359. [Google Scholar] [CrossRef] [PubMed] [Green Version]
- Uchiyama, H.; Tozuka, Y.; Imono, M.; Takeuchi, H. Improvement of dissolution and absorption properties of poorly water-soluble drug by preparing spray-dried powders with α-glucosyl hesperidin. Int. J. Pharm. 2010, 392, 101–106. [Google Scholar] [CrossRef]
- Tozuka, Y.; Imono, M.; Uchiyama, H.; Takeuchi, H. A novel application of α-glucosyl hesperidin for nanoparticle formation of active pharmaceutical ingredients by dry grinding. Eur. J. Pharm. Biopharm. 2011, 79, 559–565. [Google Scholar] [CrossRef]
- Abad-García, B.; Garmón-Lobato, S.; Berrueta, L.A.; Gallo, B.; Vicente, F. On line characterization of 58 phenolic compounds in Citrus fruit juices from Spanish cultivars by high-performance liquid chromatography with photodiode-array detection coupled to electrospray ionization triple quadrupole mass spectrometry. Talanta 2012, 99, 213–224. [Google Scholar] [CrossRef]
- Brito, A.; Ramirez, J.E.; Areche, C.; Sepúlveda, B.; Simirgiotis, M.J. HPLC-UV-MS profiles of phenolic compounds and antioxidant activity of fruits from three citrus species consumed in Northern Chile. Molecules 2014, 19, 17400–17421. [Google Scholar] [CrossRef] [PubMed]
- Roriz, C.L.; Barros, L.; Carvalho, A.M.; Santos-Buelga, C.; Ferreira, I.C.F.R. Pterospartum tridentatum, Gomphrena globosa and Cymbopogon citratus: A phytochemical study focused on antioxidant compounds. Food Res. Int. 2014, 62, 684–693. [Google Scholar] [CrossRef] [Green Version]
- FooDB-Kaempferol 3-[2″-glucosyl-6″-Acetyl-Galactoside] 7-Glucoside. Available online: https://foodb.ca/compounds/FDB016214 (accessed on 15 January 2021).
- Calderón-Montaño, J.M.; Burgos-Morón, E.; Pérez-Guerrero, C.; López-Lázaro, M. A Review on the Dietary Flavonoid Kaempferol|BenthamScience. Mini Rev. Med. Chem. 2011, 11, 298–344. [Google Scholar] [CrossRef]
- Ferreres, F.; Sousa, C.; Vrchovská, V.; Valentão, P.; Pereira, J.A.; Seabra, R.M.; Andrade, P.B. Chemical composition and antioxidant activity of tronchuda cabbage internal leaves. Eur. Food Res. Technol. 2006, 222, 88–98. [Google Scholar] [CrossRef]
- Zanzer, Y.C.; Plaza, M.; Dougkas, A.; Turner, C.; Östman, E. Black pepper-based beverage induced appetite-suppressing effects without altering postprandial glycaemia, gut and thyroid hormones or gastrointestinal well-being: A randomized crossover study in healthy subjects. Food Funct. 2018, 9, 2774–2786. [Google Scholar] [CrossRef] [PubMed] [Green Version]
- Berhow, M.A.; Bennett, R.D.; Kanes, K.; Poling, S.M.; Vandercook, C.E. A malonic acid ester derivative of naringin in grapefruit. Phytochemistry 1991, 30, 4198–4200. [Google Scholar] [CrossRef]
- Kanes, K.; Tisserat, B.; Berhow, M.; Vandercook, C. Phenolic composition of various tissues of rutaceae species. Phytochemistry 1993, 32, 967–974. [Google Scholar] [CrossRef]
- Cheriet, T.; Ben-Bachir, B.; Thamri, O.; Seghiri, R.; Mancini, I. Isolation and biological properties of the natural flavonoids pectolinarin and pectolinarigenin—A review. Antibiotics 2020, 9, 417. [Google Scholar] [CrossRef] [PubMed]
- Yang, Y.; Zhao, X.J.; Pan, Y.; Zhou, Z. Identification of the chemical compositions of Ponkan peel by ultra performance liquid chromatography coupled with quadrupole time-of-flight mass spectrometry. Anal. Methods 2016, 8, 893–903. [Google Scholar] [CrossRef]
- Gualdani, R.; Cavalluzzi, M.M.; Lentini, G.; Habtemariam, S. The chemistry and pharmacology of citrus limonoids. Molecules 2016, 21, 1530. [Google Scholar] [CrossRef] [PubMed]
- Shi, Y.S.; Zhang, Y.; Li, H.T.; Wu, C.H.; El-Seedi, H.R.; Ye, W.K.; Wang, Z.W.; Li, C.B.; Zhang, X.F.; Kai, G.Y. Limonoids from Citrus: Chemistry, anti-tumor potential, and other bioactivities. J. Funct. Foods 2020, 75, 104213. [Google Scholar] [CrossRef]
- Umehara, K.; Hattori, I.; Miyase, T.; Ueno, A.; Hara, S.; Kageyama, C. Studies on the Constituents of Leaves of Citrus unshiu Marcov. Chem. Pharm. Bull. 1988, 36, 5004–5008. [Google Scholar] [CrossRef] [Green Version]
- Liew, S.S.; Ho, W.Y.; Yeap, S.K.; Bin Sharifudin, S.A. Phytochemical composition and in vitro antioxidant activities of Citrus sinensis peel extracts. PeerJ 2018, 2018, e5331. [Google Scholar] [CrossRef] [Green Version]


| Independent Factors | Dependent Factors | ||||||
|---|---|---|---|---|---|---|---|
| X1 | X2 | X3 | X4 | TPC (mg GAE/g d.w.) | ABTS (mg TE/g d.w.) | DPPH (mg TE/g d.w.) | |
| 1 | 0 (−1) | 5 (−1) | 60 (0) | 50 (0) | 20.46 ± 0.18 e–g | 26.67 ± 0.39 e,f | 10.55 ± 0.03 b |
| 2 | 100 (1) | 5 (−1) | 60 (0) | 50 (0) | 10.33 ± 0.10 b | 11.56 ± 0.26 a | 10.94 ± 0.21 c |
| 3 | 0 (−1) | 45 (1) | 60 (0) | 50 (0) | 21.64 ± 0.21 f–i | 24.92 ± 0.06 d,e | 19.79 ± 0.04 i |
| 4 | 100 (1) | 45 (1) | 60 (0) | 50 (0) | 19.55 ± 0.35 e | 18.28 ± 0.38 b | 11.07 ± 0.06 c |
| 5 | 50 (0) | 25 (0) | 20 (−1) | 10 (−1) | 25.33 ± 0.14 l | 25.21 ± 0.26 d,e | 20.02 ± 0.06 i |
| 6 | 50 (0) | 25 (0) | 100 (1) | 10 (−1) | 21.95 ± 0.16 g–j | 36.62 ± 0.50 n–p | 18.54 ± 0.05 f |
| 7 | 50 (0) | 25 (0) | 20 (−1) | 100 (1) | 25.12 ± 0.35 l | 39.13 ± 0.79 o–q | 21.05 ± 0.04 k,l |
| 8 | 50 (0) | 25 (0) | 100 (1) | 100 (1) | 29.75 ± 0.36 m | 30.14 ± 0.01 h, i | 20.95 ± 0.05 k |
| 9 | 50 (0) | 25 (0) | 60 (0) | 50 (0) | 23.59 ± 0.92 j,k | 34.97 ± 0.13 l, m | 22.43 ± 0.06 m,n |
| 10 | 0 (−1) | 25 (0) | 60 (0) | 10 (−1) | 20.08 ± 0.35 e,f | 36.27 ± 0.26 l–n | 21.21 ± 0.05 k,l |
| 11 | 100 (1) | 25 (0) | 60 (0) | 10 (−1) | 10.11 ± 0.37 b | 22.87 ± 0.51 c | 11.16 ± 0.04 c |
| 12 | 0 (−1) | 25 (0) | 60 (0) | 100 (1) | 21.95 ± 0.42 h–k | 33.07 ± 0.78 j,k | 19.93 ± 0.05 i |
| 13 | 100 (1) | 25 (0) | 60 (0) | 100 (1) | 16.27 ± 0.35 c,d | 23.60 ± 0.77 c,d | 15.44 ± 0.05 e |
| 14 | 50 (0) | 5 (−1) | 20 (−1) | 50 (0) | 21.30 ± 0.03 f–h | 37.18 ± 0.77 m–o | 19.03 ± 0.05 g |
| 15 | 50 (0) | 45 (1) | 20 (−1) | 50 (0) | 22.40 ± 0.14 h–k | 36.28 ± 0.64 m–p | 23.07 ± 0.05 p |
| 16 | 50 (0) | 5 (−1) | 100 (1) | 50 (0) | 10.31 ± 0.04 b | 29.71 ± 0.27 g, h | 22.69 ± 0.06 o |
| 17 | 50 (0) | 45 (1) | 100 (1) | 50 (0) | 23.03 ± 0.14 j,k | 40.92 ± 0.64 q | 22.23 ±0.05 m |
| 18 | 50 (0) | 25 (0) | 60 (0) | 50 (0) | 22.35 ± 0.07 h–k | 34.92 ± 0.59 k,l | 21.20 ± 0.08 l |
| 19 | 0 (−1) | 25 (0) | 20 (−1) | 50 (0) | 20.56 ± 0.35 e–g | 32.53 ± 0.37 j,k | 23.19 ± 0.06 p |
| 20 | 100 (1) | 25 (0) | 20 (−1) | 50 (0) | 8.66 ± 0.06 a | 26.33 ± 0.12 e,f | 9.54 ± 0.04 a |
| 21 | 0 (−1) | 25 (0) | 100 (1) | 50 (0) | 22.81 ± 0.26 j,k | 32.51 ± 0.03 j,k | 20.29 ± 0.05 j |
| 22 | 100 (1) | 25 (0) | 100 (1) | 50 (0) | 15.98 ± 0.21 c | 27.35 ± 0.96 f,g | 12.30 ± 0.04 d |
| 23 | 50 (0) | 5 (−1) | 60 (0) | 10 (−1) | 17.30 ± 0.42 d | 35.04 ± 0.19 l–n | 19.41 ± 0.04 h |
| 24 | 50 (0) | 45 (1) | 60 (0) | 10 (−1) | 20.42 ± 0.09 e–g | 38.15 ± 0.76 p,q | 21.28 ± 0.04 l |
| 25 | 50 (0) | 5 (−1) | 60 (0) | 100 (1) | 23.37 ± 0.13 k | 28.93 ± 0.15 g, h | 26.45 ± 0.04 r |
| 26 | 50 (0) | 45 (1) | 60 (0) | 100 (1) | 25.30 ± 0.08 l | 31.37 ± 0.37 i,j | 25.65 ± 0.04 q |
| 27 | 50 (0) | 25 (0) | 60 (0) | 50 (0) | 22.52 ± 0.36 i–k | 32.62 ± 0.27 j,k | 22.61 ± 0.01 n,o |
| Regression Coefficients | Response | |||||
|---|---|---|---|---|---|---|
| TPC | ABTS | DPPH | ||||
| Effect | p Value | Effect | p Value | Effect | p Value | |
| β0 | 20.9165 * | 0.0000 | 25.5081 * | 0.0000 | 16.4511 * | 0.0001 |
| Lineal | ||||||
| β1 | −7.39159 * | 0.0000 | −6.9354 * | 0.000 | −7.1540 * | 0.0036 |
| β2 | 7.14405 * | 0.0001 | 4.1242 * | 0.0189 | 3.9375 * | 0.0343 |
| β3 | 0.1177 | 0.8784 | −2.5229 | 0.6391 | 1.2579 | 0.7225 |
| β4 | 5.0592 * | 0.0002 | −6.3625 * | 0.0227 | 4.2319 * | 0.0215 |
| Crossed | ||||||
| β12 | 4.0196 * | 0.0211 | 4.2385 | 0.1091 | −4.5509 * | 0.0274 |
| β13 | 2.5322 | 0.0637 | 0.5152 | 0.7383 | 2.8321 | 0.0665 |
| β14 | 2.1488 | 0.0855 | 1.9652 | 0.2811 | 2.7874 | 0.0684 |
| β23 | 5.8083 * | 0.0023 | 6.0598 * | 0.0182 | −2.2457 | 0.4190 |
| β24 | −0.5977 | 0.4677 | −0.3305 | 0.8286 | −1.3348 | 0.2248 |
| β34 | 4.0099 * | 0.0214 | −10.1977 * | 0.0005 | 0.6917 | 0.4634 |
| Quadratic | ||||||
| β11 | 1.9745 * | 0.0001 | 12.6447 * | 0.0000 | 8.0299 * | 0.0020 |
| β22 | −1.0824 | 0.1228 | 7.1362 * | 0.0000 | 2.1692 * | 0.03400 |
| β33 | −1.6717 | 0.0569 | 0.7439 | 0.4660 | 1.1751 | 0.1326 |
| β44 | −2.2687 * | 0.0336 | 1.9455 | 0.1091 | 0.4520 | 0.3771 |
| R2 | 0.9564 | 0.9286 | 0.8694 | |||
| p Model | 0.0011 | 0.0043 | 0.0001 | |||
| p Lack of fit | 0.1522 | 0.2624 | 0.1117 | |||
| Parameter | Optimal Conditions | ||
|---|---|---|---|
| Ethanol/water (v/v) | 45 | ||
| Time (min) | 35 | ||
| Amplitude (%) | 90 | ||
| Pulse (%) | 100 | ||
| TPC | DPPH | ABTS | |
| Predicted value (mg/g d.w.) | 29.36 ± 3.5 | 24.44 ± 3.6 | 32.02 ± 7.0 |
| Obtained value (mg/g d.w.) | 30.42 ± 1.5 | 26.37 ± 1.6 | 35.62 ± 2.1 |
| Coefficient of variation | 0.025 | 0.053 | 0.075 |
| Technology Used | Conditions | TPC (mg GAE/g d.w.) | Reference |
|---|---|---|---|
| Solvent extraction | Water, 60 °C, 12 h | 6.89 | [33] |
| Methanol, 55 °C, 3 h | 28.00 | [25] | |
| Methanol/water 80:20, 20 °C, 22 h | 25.60 | [26] | |
| Methanol/sample 20:1 (v/w), 25 °C, 72 h | 18.50 | [34] | |
| Acetone/sample 20:1 (v/w), 25 °C, 72 h | 18.00 | [34] | |
| Acetone 50%/sample 50:1 (v/w), 60 °C, 2 h | 10.21 | [27] | |
| High voltage electrical discharges-assisted extraction | Water/sample 20:10 (v/w), 50 °C, 200 kJ/kg 0,5 Hz | 7.00 | [6] |
| Ultrasound-assisted extraction (ultrasonic bath) | Ethanol 40%/sample 80:1 (v/w), 40 °C, 30 min, 150 W | 2.33 | [29] |
| Ethanol 50%/sample 57:1 (v/w), 30 °C, 15 min | 5.50 | [3] | |
| Ethanol 50%/sample 10:1 (v/w), 30 min, 400 W | 1.05 | [28] | |
| Acetone 75.79%/sample 50:1 (v/w), 27 °C, 8.33 min, 65.94% amplitude | 10.35 | [27] | |
| Microwave-assisted extraction | Acetone 51%/sample 25:1 (v/w), 122 s, 500 W | 12.20 | [27] |
| Pressurized liquid extraction | Ethanol 50%/sample 47:1 (v/w), 10 MPa, 65 °C, 40 min | 10.30 | [3] |
| Ultrasound-assisted extraction (ultrasonic bath) combined with enzymatic process | Ethanol/sample 10:1 (v/w), 25 °C, 120 min, 500 W, with pectinase 0.50% w/w at pH 4 | 0.88 | [30] |
| Pressing extraction with pulsed electric fields as pre-treatment | 7 kV/cm PEF and 5 bars, 30 min | 0.35 | [31] |
| Solvent extraction with infrared as pre-treatment | Ethanol 50%/sample 8:1 (v/w), 50 °C, 1.5 h | 1.5 | [32] |
| Standards | Calibration Ranges (µg/mL) | Calibration Curves (µg/mL) | R2 | LOD (µg/mL) | LOQ (µg/mL) |
|---|---|---|---|---|---|
| Vanillic acid | 3.7–236.67 | y = 21.069x + 197.15 | 0.9979 | 0.47 | 1.57 |
| Chlorogenic acid | 3.85–246.67 | y = 58.665x − 289.54 | 0.9984 | 0.17 | 0.56 |
| Ferulic acid | 3.54–226.67 | y = 37.071x + 155.61 | 0.9983 | 0.27 | 0.89 |
| Quercetin | 3.54–226.67 | y = 154.26x + 1309.1 | 0.9988 | 0.06 | 0.21 |
| Rutin | 3.44–220 | y = 239.6x + 690.3 | 0.9954 | 0.04 | 0.14 |
| No. | Compound | Retention Time (Min) | Molecular Formula | m/z Experimental | m/z Calculated | Score | Error (ppm) |
|---|---|---|---|---|---|---|---|
| 1 | Caffeoylglycolic acid methyl ester isomer a | 3.608 | C12H12O6 | 251.055 | 251.0556 | 86.53 | −2.4 |
| 2 | Norbergenin | 3.806 | C13H14O9 | 313.0563 | 313.056 | 94.08 | 1 |
| 3 | Citric acid | 4.278 | C6H8O7 | 191.0198 | 191.0192 | 94.52 | 3.1 |
| 4 | Cynaroside A | 4.774 | C21H32O10 | 443.191 | 443.1917 | 99.27 | −1.6 |
| 5 | 2-(E)-O-Feruloyl-D-galactaric acid isomer a | 4.898 | C16H18O11 | 385.0769 | 385.0771 | 99.77 | −0.5 |
| 6 | 2-(E)-O-Feruloyl-D-galactaric acid isomer b | 5.113 | C16H18O11 | 385.0771 | 385.0771 | 95.25 | 0 |
| 7 | Caffeic acid 3-O-glucuronide | 5.308 | C15H16O10 | 355.0667 | 355.0665 | 99.92 | 0.6 |
| 8 | Citroside | 5.669 | C19H30O8 | 385.1856 | 385.1862 | 87.14 | −1.6 |
| 9 | Ferulic acid O-glucoside | 5.854 | C16H20O9 | 355.1024 | 355.1029 | 97.78 | −1.4 |
| 10 | 2-(E)-O-Feruloyl-d-galactaric acid isomer c | 6.007 | C16H18O11 | 385.0768 | 385.0771 | 96.52 | −0.8 |
| 11 | Feruloyl isocitric acid isomer a | 6.131 | C16H16O10 | 367.0662 | 367.0665 | 99.75 | −0.8 |
| 12 | Sinapic acid O-glucoside | 6.206 | C17H22O10 | 385.1133 | 385.1136 | 99.70 | −0.5 |
| 13 | Caffeoylglycolic acid methyl ester isomer b | 6.268 | C12H12O6 | 251.0549 | 251.0556 | 88.53 | −2.8 |
| 14 | Caffeoylmalic acid isomer a | 6.45 | C13H12O8 | 295.0446 | 295.0454 | 98.46 | −2.7 |
| 15 | Sinapinic acid-O-glucuronide | 6.545 | C17H20O11 | 399.0921 | 399.0927 | 89.58 | −1.5 |
| 16 | Feruloyl isocitric acid isomer b | 6.661 | C16H16O10 | 367.0675 | 367.0665 | 90.04 | 2.7 |
| 17 | Rutin isomer a | 6.785 | C27H30O16 | 609.1467 | 609.1456 | 94.51 | 1.8 |
| 18 | Dihydroisorhamnetin 7-rutinoside | 7.194 | C28H34O16 | 625.1765 | 625.1769 | 87.24 | −0.6 |
| 19 | Apigenin-di-C-hexoside (Vicenin-2) isomer a | 7.376 | C27H30O15 | 593.1506 | 593.1506 | 99.24 | 0 |
| 20 | Prunin | 7.596 | C21H22O10 | 433.1132 | 433.1135 | 100.0 | −0.7 |
| 21 | Isorhamnetin-3-O-rutinoside isomer a | 7.753 | C28H32O16 | 623.1607 | 623.1612 | 96.55 | −0.8 |
| 22 | Isorhamnetin-3-O-rutinoside isomer b | 7.914 | C28H32O16 | 623.1605 | 623.1612 | 95.79 | −1.1 |
| 23 | Caffeoylmalic acid isomer b | 8.241 | C13H12O8 | 295.0428 | 295.0454 | 88.92 | −8.8 |
| 24 | Luteolin-C-hexoside-C-pentoside isomer a | 8.432 | C26H28O15 | 579.134 | 579.135 | 86.57 | −1.7 |
| 25 | Alpha-Glucosyl Hesperidin | 8.481 | C34H44O20 | 771.2352 | 771.2348 | 92.05 | 0.5 |
| 26 | Luteolin-C-hexoside-C-pentoside isomer b | 8.572 | C26H28O15 | 579.1367 | 579.135 | 91.83 | 2.9 |
| 27 | Quercitrin | 8.676 | C21H20O11 | 447.0934 | 447.0927 | 99.92 | 1.6 |
| 28 | Eriocitrin | 8.8 | C27H32O15 | 595.1662 | 595.1663 | 88.90 | −0.2 |
| 29 | Limonin 17-β-d-glucopyranoside | 8.899 | C32H42O14 | 649.2497 | 649.2496 | 99.94 | 0.2 |
| 30 | Vitexin-O-pentoside isomer a | 9.135 | C26H28O14 | 563.1407 | 563.1401 | 99.96 | 1.1 |
| 31 | Apigenin-di-C-hexoside (Vicenin-2) isomer b | 9.213 | C27H30O15 | 593.1500 | 593.1506 | 96.70 | −1 |
| 32 | Quercetin-O-dihexoside | 9.234 | C27H30O17 | 625.1411 | 625.1405 | 98.61 | 1 |
| 33 | Vitexin-O-pentoside isomer b | 9.511 | C26H28O14 | 563.14 | 563.1401 | 100.0 | −0.2 |
| 34 | Naringin hydrate | 9.615 | C27H34O15 | 597.1816 | 597.1819 | 99.99 | −0.5 |
| 35 | Apigenin-di-C-hexoside (Vicenin-2) isomer c | 9.697 | C27H30O15 | 593.1506 | 593.1506 | 99.13 | 0 |
| 36 | Apigenin-di-C-hexoside (Vicenin-2) isomer d | 9.847 | C27H30O15 | 593.1505 | 593.1506 | 98.19 | −0.2 |
| 37 | Narirutin | 10.012 | C27H32O14 | 579.1696 | 579.1714 | 99.80 | 0.3 |
| 38 | Unknown flavonoid | 10.074 | C26H26O14 | 561.1246 | 561.1244 | 99.56 | 0.4 |
| 39 | 6-keto-7-β-deacetylnomilol 17-O-β-d-glucopyranoside | 10.219 | C32H44O15 | 667.2588 | 667.2602 | 88.13 | −2.1 |
| 40 | Rutin isomer b | 10.318 | C27H30O16 | 609.1458 | 609.1456 | 99.99 | 0.3 |
| 41 | Deacetylnomilinic acid 17-β-d-glucoside | 10.359 | C32H46O15 | 669.2781 | 669.2758 | 98.18 | 3.4 |
| 42 | Hesperidin | 10.45 | C28H34O15 | 609.1812 | 609.1819 | 99.98 | −1.1 |
| 43 | Kaempferol 3-O-[3″,6″-di-O-(E)-cinnamoyl]-β-d-glucopyranoside | 10.624 | C39H32O13 | 707.1788 | 707.1765 | 98.71 | 3.3 |
| 44 | Isoobacunoic acid 17-β-d-glucoside | 10.827 | C32H44O14 | 651.2661 | 651.2653 | 98.74 | 1.2 |
| 45 | Kaempferol 3-[2″-glucosyl-6″-acetyl-galactoside] 7-glucoside isomer a | 10.951 | C35H42O22 | 813.2104 | 813.2089 | 99.92 | 1.8 |
| 46 | Kaempferol 3-[2″-glucosyl-6″-acetyl-galactoside] 7-glucoside isomer b | 11.063 | C35H42O22 | 813.2089 | 813.2089 | 97.06 | 0.2 |
| 47 | Apigenin-di-C-hexoside (Vicenin-2) isomer e | 11.208 | C27H30O15 | 593.1504 | 593.1506 | 99.92 | −0.3 |
| 48 | Isorhamnetin-3-O-rutinoside isomer c | 11.336 | C28H32O16 | 623.1614 | 623.1612 | 99.20 | 0.3 |
| 49 | Kaempferol-dihexosyl acetate | 11.613 | C29H32O17 | 651.1577 | 651.1571 | 86.35 | 2.5 |
| 50 | nomilin 17-O-β-d-glucopyranoside | 11.973 | C34H46O15 | 693.2766 | 693.2758 | 99.99 | 1.2 |
| 51 | Neohesperidin | 12.184 | C28H34O15 | 609.1824 | 609.1819 | 99.90 | 0.8 |
| 52 | Didymin | 12.41 | C28H34O14 | 593.1885 | 593.187 | 91.36 | 2.5 |
| 53 | Nomilinic acid 17-β-d-glucoside | 12.602 | C34H48O16 | 711.2878 | 711.2864 | 97.47 | 2 |
| 54 | Apigenin 7-O-neohesperidoside | 12.693 | C27H30O14 | 577.1564 | 577.1557 | 99.80 | 1.2 |
| 55 | Obacunone 17-β-d-glucoside | 12.742 | C32H42O13 | 633.2574 | 633.2547 | 87.20 | 4.3 |
| 56 | Naringin 6″-malonate | 13.094 | C30H34O17 | 665.1697 | 665.1718 | 90.41 | −3.2 |
| 57 | Kaempferol 3-O-(6″-O-acetyl) glucoside-7-O-rhamnoside | 13.309 | C29H32O16 | 635.1617 | 635.1612 | 99.28 | 0.8 |
| 58 | Kaempferol 3-apiosyl-(1->4)-rhamnoside-7-rhamnoside | 13.338 | C32H38O18 | 709.1987 | 709.198 | 91.26 | 1 |
| 59 | Quercetin-3-O-rutinoside-7-O-Glucoside | 13.814 | C33H40O21 | 771.2137 | 771.1984 | 89.33 | 1.8 |
| 60 | Demethylnobiletin | 13.888 | C20H20O8 | 387.1079 | 387.108 | 92.26 | −0.3 |
| 61 | Methyl 2-[(2S,4R,5S,6R)-4-acetyloxy-6-(acetyloxymethyl)-5-[(2R,4R,5S,6R)-4,5-diacetyloxy-6-(acetyloxymethyl) oxan-2-yl]oxyoxan-2-yl]oxy-3,4,5-trihydroxy-6-oxobenzo[7]annulene-8-carboxylate | 14.132 | C35H40O20 | 779.2047 | 779.2035 | 99.98 | 1.5 |
| 62 | Naringenin | 14.178 | C15H12O5 | 271.0603 | 271.0606 | 95.40 | −1.1 |
| 63 | Kaempferol 3-O-sinapoyl-caffeoyl-sophoroside 7-O-glucoside isomer a | 14.339 | C53H56O28 | 1139.2892 | 1139.2885 | 95.98 | 1.1 |
| 64 | Kaempferol 3-O-sinapoyl-caffeoyl-sophoroside 7-O-glucoside isomer b | 14.476 | C53H56O28 | 1139.2933 | 1139.288 | 88.40 | 4.7 |
| 65 | Deacetylnomilin acid | 14.526 | C26H34O9 | 489.2131 | 489.2125 | 90.73 | 1.2 |
| 66 | Limonol | 14.559 | C26H32O8 | 471.2025 | 471.2019 | 96.48 | 1.3 |
| 67 | Kaempferol 3-O-feruloyl-caffeoyl-sophoroside 7-O-glucoside | 14.786 | C52H54O27 | 1109.2789 | 1109.2774 | 90.94 | 1.4 |
| 68 | Epilimonin | 15.043 | C26H30O8 | 469.1859 | 469.1862 | 99.98 | −0.6 |
| 69 | Limonin | 15.708 | C26H30O8 | 469.1849 | 469.1862 | 99.28 | −2.8 |
| 70 | Nomilinic acid | 15.8 | C28H36O10 | 531.2208 | 531.223 | 91.17 | −4.1 |
| 71 | Pectolinarigenin | 16.073 | C17H14O6 | 313.0704 | 313.0712 | 98.95 | −2.6 |
| 72 | Deoxylimonin | 16.102 | C26H30O7 | 453.1881 | 453.1913 | 85.92 | −3.1 |
| 73 | Isosakuranetin | 16.524 | C16H14O5 | 285.0754 | 285.0763 | 89.61 | −3.2 |
| 74 | 3′,4′-Didemethylnobiletin | 16.569 | C19H18O8 | 373.0923 | 373.0923 | 94.17 | 0 |
| Compounds | Fresh By-Product (µg/g d.w.) | Dry By-Product (µg/g d.w.) |
|---|---|---|
| Sum of phenolic compounds | 6344.0 ± 3.6 | 4737.6 ± 4.4 |
| Phenolic Acids | 3087.5 ± 0.2 | 2891.1 ± 2.4 |
| Norbergenin | 383.5 ± 0.5 | 340.4 ±0.7 |
| Caffeoylglycolic acid methyl ester isomer a | 201.8 ± 0.1 | 284.2 ± 0.7 |
| Caffeoylglycolic acid methyl ester isomer b | 133.36 ± 0.04 | 178.2 ± 0.1 |
| Caffeic acid 3-O-glucuronide | 218.9 ± 0.3 | 128.6 ± 0.7 |
| Caffeoylmalic Acid isomer a | 127.9 ± 0.6 | 99.5 ± 0.4 |
| Caffeoylmalic Acid isomer b | 109.5 ± 0.1 | 77.6 ± 0.1 |
| 2-(E)-O-Feruloyl-D-galactaric acid isomer a | 378.8 ± 0.5 | 463.0 ± 0.04 |
| 2-(E)-O-Feruloyl-D-galactaric acid isomer b | 575.6 ± 0.3 | 416.3 ± 0.4 |
| 2-(E)-O-Feruloyl-D-galactaric acid isomer c | 313.2 ± 0.2 | 564.0 ± 0.9 |
| Ferulic acid O-glucoside | 235.3 ± 0.7 | 48.73 ± 0.1 |
| Feruloyl Isocitric acid isomer a | 195.2 ± 0.7 | 170.66 ± 0.4 |
| Feruloyl isocitric acid isomer b | 16.9 ± 0.03 | 11.2 ± 0.2 |
| Sinapic acid O-glucoside | 183.5 ± 0.4 | 14.9 ± 0.1 |
| Sinapinic acid-O-glucuronide | 14.0 ± 0.5 | 93.7 ± 0.1 |
| Flavonoids | 3256.5 ± 3.4 | 1846.5 ± 2.0 |
| Cynaroside A | 13.1 ± 0.3 | 6.1 ± 0.1 |
| Rutin isomer a | 57.8 ± 0.3 | 73.6 ± 0.1 |
| Rutin isomer b | 22.0 ± 0.1 | 49.8 ± 0.05 |
| Prunin | 122.5 ± 0.4 | 35.4 ± 0.01 |
| Quercitrin | 1.2 ± 0.2 | <LOQ |
| Eriocitrin | 24.6 ± 0.1 | 17.5 ± 0.4 |
| Narirutin | 799.4 ± 0.5 | 319.6 ± 0.4 |
| Hesperidin | 894.8 ± 0.5 | 320.2 ± 0.5 |
| α-glucosyl Hesperidin | 23.8 ± 0.1 | 19.0 ± 0.1 |
| Neohesperidin | <LOQ | <LOQ |
| Didymin | 146.3 ± 0.2 | 72.8 ± 0.2 |
| Naringin 6″-malonate | <LOQ | <LOQ |
| Naringin hydrate | 35.1 ± 0.2 | 51.7 ± 0.2 |
| Dihydroisorhamnetin 7-rutinoside | 8.4 ± 0.2 | 10.1 ± 0.06 |
| Isorhamnetin-3-O-rutinoside isomer a | 135.4 ± 0.6 | 116.6 ± 0.3 |
| Isorhamnetin-3-O-rutinoside isomer b | 10.6 ± 0.1 | 8.0 ± 0.0005 |
| Isorhamnetin-3-O-rutinoside isomer c | 54.6 ± 0.1 | 48.9 ± 0.002 |
| Vitexin-O-pentoside isomer a | 72.2 ± 0.5 | 68.61 ± 0.27 |
| Vitexin-O-pentoside isomer b | 111.5 ± 0.01 | 94.6 ± 0.2 |
| Apigenin 7-O-neohesperidoside | 14.8 ± 0.1 | 9.2 ± 0.5 |
| Apigenin-di-C-hexoside (Vicenin-2) isomer a | 570.7 ± 0.9 | 318.3 ± 0.4 |
| Apigenin-di-C-hexoside (Vicenin-2) isomer b | <LOQ | <LOQ |
| Apigenin-di-C-hexoside (Vicenin-2) isomer c | 7.7 ± 0.2 | 13.7 ± 0.1 |
| Apigenin-di-C-hexoside (Vicenin-2) isomer d | 22.3 ± 0.1 | 16.3 ± 0.1 |
| Apigenin-di-C-hexoside (Vicenin-2) isomer e | <LOQ | <LOQ |
| Luteolin-C-hexoside-C-pentoside isomer a | 1.2 ± 0.1 | 0.2 ± 0.01 |
| Luteolin-C-hexoside-C-pentoside isomer b | 3.8 ± 0.1 | 2.3 ± 0.02 |
| Kaempferol 3-[2″-glucosyl-6″-acetyl-galactoside] 7-glucoside isomer a | 24.6 ± 0.3 | 16.0 ± 0.004 |
| Kaempferol 3-[2″-glucosyl-6″-acetyl-galactoside] 7-glucoside isomer b | 16.9 ± 0.7 | 12.3 ± 0.04 |
| Kaempferol-dihexosyl acetate | <LOQ | <LOQ |
| Kaempferol 3-O-(6″-O-acetyl) glucoside-7-O-rhamnoside | <LOQ | <LOQ |
| Kaempferol 3-apiosyl-(1->4)-rhamnoside-7-rhamnoside | <LOQ | <LOQ |
| kaempferol 3-O-[3″,6″-di-O-(E)-cinnamoyl]-β-d-glucopyranoside | 0.7 ± 0.06 | 0.3 ± 0.002 |
| Kaempferol 3-O-sinapoyl-caffeoyl-sophoroside 7-O-glucoside isomer a | <LOQ | <LOQ |
| Kaempferol 3-O-sinapoyl-caffeoyl-sophoroside 7-O-glucoside isomer b | <LOQ | <LOQ |
| Kaempferol 3-O-feruloyl-caffeoyl-sophoroside 7-O-glucoside isomer c | <LOQ | <LOQ |
| Quercetin-O-dihexoside | <LOQ | <LOQ |
| Quercetin-3-O-rutinoside-7-O-Glucoside | <LOQ | <LOQ |
| Demethylnobiletin | n.d. | <LOQ |
| 3′,4′-Didemethylnobiletin | <LOQ | <LOQ |
| Naringenin | 11.5 ± 0.02 | 9.4 ± 0.009 |
| Pectolinarigenin | <LOQ | <LOQ |
| Isosakuranetin | n.d. | <LOQ |
| Unknown flavonoid | 60.3 ± 0.1 | 125.8 ± 0.5 |
Publisher’s Note: MDPI stays neutral with regard to jurisdictional claims in published maps and institutional affiliations. |
© 2021 by the authors. Licensee MDPI, Basel, Switzerland. This article is an open access article distributed under the terms and conditions of the Creative Commons Attribution (CC BY) license (https://creativecommons.org/licenses/by/4.0/).
Share and Cite
Razola-Díaz, M.d.C.; Guerra-Hernández, E.J.; Rodríguez-Pérez, C.; Gómez-Caravaca, A.M.; García-Villanova, B.; Verardo, V. Optimization of Ultrasound-Assisted Extraction via Sonotrode of Phenolic Compounds from Orange By-Products. Foods 2021, 10, 1120. https://doi.org/10.3390/foods10051120
Razola-Díaz MdC, Guerra-Hernández EJ, Rodríguez-Pérez C, Gómez-Caravaca AM, García-Villanova B, Verardo V. Optimization of Ultrasound-Assisted Extraction via Sonotrode of Phenolic Compounds from Orange By-Products. Foods. 2021; 10(5):1120. https://doi.org/10.3390/foods10051120
Chicago/Turabian StyleRazola-Díaz, María del Carmen, Eduardo Jesús Guerra-Hernández, Celia Rodríguez-Pérez, Ana María Gómez-Caravaca, Belén García-Villanova, and Vito Verardo. 2021. "Optimization of Ultrasound-Assisted Extraction via Sonotrode of Phenolic Compounds from Orange By-Products" Foods 10, no. 5: 1120. https://doi.org/10.3390/foods10051120