Article

Preparation of an Immunoaffinity Column Based on Bispecific Monoclonal Antibody for Aflatoxin B1 and Ochratoxin A Detection Combined with ic-ELISA

Guangdong Provincial Key Laboratory of Food Quality and Safety, College of Food Science, South China Agricultural University, Guangzhou 510642, China
*
Author to whom correspondence should be addressed.
Foods 2022, 11(3), 335; https://doi.org/10.3390/foods11030335
Submission received: 15 December 2021 / Revised: 14 January 2022 / Accepted: 21 January 2022 / Published: 25 January 2022
(This article belongs to the Special Issue Application of Antibody and Immunoassay for Food Safety)

Abstract

:
A novel and efficient immunoaffinity column (IAC) based on bispecific monoclonal antibody (BsMAb) recognizing aflatoxin B1 (AFB1) and ochratoxin A (OTA) was prepared and applied in simultaneous extraction of AFB1 and OTA from food samples and detection of AFB1/OTA combined with ic-ELISA (indirect competitive ELISA). Two deficient cell lines, hypoxanthine guanine phosphoribosyl-transferase (HGPRT) deficient anti-AFB1 hybridoma cell line and thymidine kinase (TK) deficient anti-OTA hybridoma cell line, were fused to generate a hybrid-hybridoma producing BsMAb against AFB1 and OTA. The subtype of the BsMAb was IgG1 via mouse antibody isotyping kit test. The purity and molecular weight of BsMAb were confirmed by SDS-PAGE method. The cross-reaction rate with AFB2 was 37%, with AFG1 15%, with AFM1 48%, with AFM2 10%, and with OTB 36%. Negligible cross-reaction was observed with other tested compounds. The affinity constant (Ka) was determined by ELISA. The Ka (AFB1) and Ka (OTA) was 2.43 × 10⁸ L/mol and 1.57 × 10⁸ L/mol, respectively. Then the anti-AFB1/OTA BsMAb was coupled with CNBr-Sepharose, and an AFB1/OTA IAC was prepared. The coupling time and elution conditions of IAC were optimized. The coupling time was 1 h with 90% coupling rate, the eluent was methanol–water (60:40, v:v, pH 2.3) containing 1 mol/L NaCl, and the eluent volume was 4 mL. The column capacities of AFB1 and OTA were 165.0 ng and 171.3 ng, respectively. After seven times of repeated use, the preservation rates of column capacity for AFB1 and OTA were 69.3% and 68.0%, respectively. The ic-ELISA for AFB1 and OTA were applied combined with IAC. The IC50 (50% inhibiting concentration) of AFB1 was 0.027 ng/mL, the limit of detection (LOD) was 0.004 ng/mL (0.032 µg/kg), and the linear range was 0.006 ng/mL~0.119 ng/mL. The IC50 of OTA was 0.878 ng/mL, the LOD was 0.126 ng/mL (1.008 µg/kg), and the linear range was 0.259 ng/mL~6.178 ng/mL. Under optimum conditions, corn and wheat samples were pretreated with AFB1-OTA IAC. The recovery rates of AFB1 and OTA were 95.4%~105.0% with ic-ELISA, and the correlations between the detection results and LC-MS were above 0.9. The developed IAC combined with ic-ELISA is reliable and could be applied to the detection of AFB1 and OTA in grains.

1. Introduction

Mycotoxins are natural secondary metabolites produced by filamentous fungi under suitable conditions, among which aflatoxin B1 (AFB1) and ochratoxin A (OTA) are the most toxic and exist widely in grains [1,2,3,4]. In 2012, aflatoxins were listed in the group 1 classification (carcinogenic to humans) by the International Agency for Research on Cancer (IARC), and OTA was classified as group 2B (possibly carcinogenic to humans) by IARC in 1993 [5]. Some research has indicated that AFB1 and OTA frequently and simultaneously contaminated the same grain and the toxic synergistic effect caused aggravated harm [6,7,8].
Considering the health impact of AFB1 and OTA, the European Union (EU) has set the maximum level of AFB1 at 5.0 µg/kg in maize or rice, and 2.0 µg/kg in other cereals. As for OTA, the maximum level is 3.0~5.0 µg/kg in cereals [9]. In China, the maximum level for AFB1 is mandated at 5.0~20 µg/kg in different cereals, and for OTA this is 5.0 µg/kg in all cereals [10]. Detection technology for mycotoxins in food is needed to detect and monitor mycotoxins effectively. Due to the advantages of low cost, easy operation and speed, immunoassay has become the ideal choice in large-scale screening of mycotoxins.
The preparation of antibodies in an immunoassay for mycotoxin is critical [11], and all are reported as single-specific, including polyclonal antibody [12,13], monoclonal antibody (MAb) [14,15,16,17,18] and recombinant antibody [19,20,21,22]. Compared with a single-specific antibody which can only recognize a single analyte in a complex food matrix, a bispecific monoclonal antibody (BsMAb) with two intrinsic specific binding sites could simultaneously recognize and bind two distinct antigens [23,24,25]. It is predominant in immunoassays for food safety detection [25,26,27], which could reduce the cost of combined use of single-specific antibodies.
Several BsMAbs have been reported and applied to establish quantitative or qualitative immunoassays in the food safety field. Wang et al. [28] developed a BsMAb-based multi-analyte enzyme-linked immunosorbent assay (ELISA) for 5-morpholinomethyl-3-amino-2-oxazolidone (AMOZ), malachite green (MG), and leuco-malachite green (LMG) detection in aquatic products. Jin et al. [29] reported a visual colloidal gold immunochromatographic strip with BsMAb to detect carbofuran and triazophos.
In addition with regards to establishing an immunoassay method, BsMAb also has significant application value in other fields of immunoassay. Heterogeneous matrix effects in food affect the detection result and lead to the reduction of sensitivity and accuracy [30,31]. This is especially the case in trace quantity analysis of mycotoxins in grains. An immunoaffinity column (IAC) could separate and concentrate mycotoxins in grain and effectively improve the matrix effect based on a specific and reversible interaction between antigen and antibody [32,33,34]. This may be one of the most applicable and adaptable procedures for mycotoxin detection [35]. IACs have been reported as having extracted mycotoxins in various matrices [36], such as cereals [21,34,37,38], spices [39], potables [40,41], and nuts [42]. The IACs available at present are all based on a single-specific antibody, which can only conjugate to one target compound. Simultaneous contamination of multiple mycotoxins often exists in many foods. In order to extract these mycotoxins, more IACs are needed for sample pretreatment, which would be complicated, time-consuming, and costly. Two or more different antibodies were conjugated in the same IAC in some studies [43,44], which could also recognize and extract two or more mycotoxins simultaneously. Nevertheless, more than one antibody was still necessary, and the preparation or the assay procedures were complex. Moreover, the coupling ratio of different antibodies is uncertain and hard to measure, and mutual interference may be caused by competitive binding of different antibodies. In comparison with single-specific antibody-based IAC, a BsMAb based IAC would be more efficient, convenient, and economical when the sample is contaminated with two mycotoxins. Moreover, the coupling efficiency of BsMAb based IAC is easy to measure, and the interference caused by using two or more different antibodies could be effectively avoided because of the homogeneity of the antibody structure. At present, no BsMAb based IAC has been reported. In this study, in order to further investigate the preparation and properties of BsMAb, and explore its application prospects in IAC, a BsMAb against AFB1 and OTA was generated and characterized. Based on this BsMAb, an IAC was prepared and applied in simultaneous extraction of AFB1 and OTA from food samples. The extraction conditions were optimized. Then the IAC was applied combined with ic-ELISA (indirect competitive ELISA) for AFB1 and OTA detection in food samples.

2. Materials and Methods

2.1. Reagents and Material

Aflatoxin B1 (AFB1), ochratoxin A (OTA), aflatoxin B2 (AFB2), aflatoxin G1 (AFG1), aflatoxin G2 (AFG2), aflatoxin M1 (AFM1), aflatoxin M2 (AFM2), ochratoxin B (OTB), ochratoxin C (OTC), zearalenone (ZEN), deoxynivalenol (DON), T-2 toxin (T-2) and fumonisin B1 (FB1), N-methyl-N’-nitro-N-nitrosoguanidine (MNNG), Methyl Methane-sulfonate (MMS), 8-Azaguanine (8-AG), 5-bromo-2′-deoxyuridine (5-BrdU), Paraffin liquid, 50% PEG 4000, goat anti-mouse Immunoglobulin G horseradish peroxidase conjugate (HRP-IgG) were purchased from Sigma-Aldrich Chemical Co. (St. Louis, MO, USA). RPMI Medium 1640 basic (1×), HAT Media Supplement (50×), HT Media Supplement (50×), Pierce Rapid Isotyping Kits-Mouse were purchased from Thermo Fisher Scientific Co., Ltd. (Waltham, MA, USA). Fetal bovine serum was purchased from Guangzhou Saiguo Biotech Co., Ltd. (Guangzhou, China). All other chemicals and solvents were of analytical grade and were purchased from Shanghai Aladdin Bio-Chem Technology Co., Ltd. (Shanghai, China). Water was prepared using a Milli-Q water purification system.
CNBr-activated Sepharose 4B and polyethylene columns (8.9 mm × 63 mm) were purchased from Pharmacia Corporation (Wuhan, China). Female Balb/c mice (10 weeks old) were purchased from Guangdong Medical Laboratory Animal Centre (Foshan, China). Anti-AFB1 hybridoma cell line E4, anti-OTA hybridoma cell line B3, anti-AFB1 MAb (IgG1), anti-OTA MAb (IgG1), AFB1-OVA, OTA-OVA, blocking buffer, P solution and TMB chromogenic solution were produced by our laboratory.

2.2. Apparatus

ELISA plates were washed using a Multiskan MK2 microplate washer (Thermo Fisher Scientific Inc., Waltham, MA, USA). Absorbances of ELISA were measured on a Multiskan MK3 microplate reader (Thermo Fisher Scientific Inc., Waltham, MA, USA). Absorbances of antibody concentrations were measured on a NanoDrop 2000 c Ultraviolet spectrometer (Thermo Fisher Scientific Inc., Waltham, MA, USA).The LC-MS assay was conducted using an Agilent 6400 series LC system and an ECLIPS PLUS C18 (2.1 × 100 mm, 1.8 µm) (Agilent Technologies, Santa Clara, CA, USA) with a Triple Quadrupole Mass Spectrometer.

2.3. Mutagenesis of HGPRT and TK Deficient Hybridoma Cell Lines

The chemical mutagen scheme was performed as follows [28,45,46]: AFB1 hybridoma cell line E4 was cultured in HAT medium for 2 d before mutagenic treatment in a humidified 5% CO2 incubator at 37 °C. The cells were washed twice with PBS and cultured in HT medium for 2 d to restore the cells to normal morphology and were cultured in HAT medium for 24 h. After washing the cells with PBS twice, the cells were mutagenized in different concentrations of MNNG (5.0 μg/mL, 10.0 μg/mL, 20.0 μg/mL, and 40.0 μg/mL). The mutagenic treatment time was 2 h, 4 h, 6 h and 10 h. At the same time, the control group was cultured in 1‰ DMSO complete medium (RPMI-1640 culture media containing 20% fetal bovine serum) without MNNG. The cells were washed twice with PBS to finish the mutagenesis and cultured in complete medium. Finally, the cells were cultured for 3 d and the survival rate of the cells was determined by trypan blue staining, and the combination of MNNG concentration and mutagenic treatment time resulting in a survival rate of about 70% were selected as the optimal mutation parameters. OTA hybridoma cell line B3 was mutated with MMS (1.0 μg/mL, 5.0 μg/mL, 10.0 μg/mL, and 20.0 μg/mL) and for 2 h, 4 h, 6 h and 10 h by the same steps as above.

2.4. Screening of HGPRT and TK Deficient Hybridoma Cell Lines

After mutagenic treatment with MNNG, AFB1 hybridoma cells E4 were collected and incubated in a 6-well culture plate in selective semi-solid media containing 6-TG (50 μg/mL). After 10 d, the visible white clonal cell clusters were placed into a 96-well culture plate and cultured with 200 μL complete media containing 6-TG (50 μg/mL). The cell supernatants were analyzed by ELISA to screen positive clones which could recognize and bound to AFB1. Then the cells were tested by HAT media to confirm their HAT sensitivity. If the cell line could not grow in HAT media, it was HGPRT-deficient, and was named E4-HGPRT. Via the same steps, the TK-deficient OTA hybridoma cell line named B3-TK was screened with 5-BrdU (30 μg/mL).

2.5. Generation and Characterization of BsMAb

2.5.1. Generation of BsMAb

E4-HGPRT and B3-TK were fused under the effect of PEG 4000 [47]. The fused cells were cultured in 96-well culture plates with HAT media for 10 d. The cell supernatants were tested by ic-ELISA to confirm the presence of BsMAb which could recognize and bound to AFB1 and OTA simultaneously.
The selected tetra-doma cell lines were cloned by 4 rounds of limiting dilution assays, and then inoculated into female Balb/c mice that had been primed with 500 μL of sterile liquid paraffin. Ascites was collected from the Balb/c mice and purified with Protein G to obtain BsMAb. The concentration of BsMAb was measured by a NanoDrop 2000 c ultraviolet spectrometer. The subtype of BsMAb was determined by Pierce Rapid Isotyping Kits-Mouse. The purity and molecular weight of BsMAb were estimated by the SDS-PAGE method.

2.5.2. Antibody Specificity Determination

The cross-reactivity (CR) could be used as an index to evaluate the specificity of the anti-AFB1/OTA BsMAb. Inhibition curves were fitted through ic-ELISA data to determine the IC50 (50% inhibiting concentration) of each common mycotoxin contaminant (aflatoxin B1, aflatoxin B2, aflatoxin G1, aflatoxin G2, aflatoxin M1, aflatoxin M2, ochratoxin A, ochratoxin B, ochratoxin C, zearalenone, deoxynivalenol, T-2 toxin and fumonisin B1). The CR was calculated using the following equation:
CR = IC 50   of   AFB 1   or   OTA IC 50   of   common   mycotoxin   contaminant × 100 %

2.5.3. Antibody Affinity Determination

The affinity of BsMAb was validated as follows [48]: the coating antigen AFB1-OVA and OTA-OVA diluted to four gradient concentrations (5.0 μg/mL, 2.5 μg/mL, 1.25 μg/mL, 0.625 μg/mL) were coated in microplates at 4 °C for 14 h, respectively. The anti-AFB1/OTA BsMAb was diluted to eight gradient concentrations (9.6 × 10⁻³ mg/mL, 4.8 × 10⁻³ mg/mL, 2.4 × 10⁻³ mg/mL, 1.2 × 10⁻³ mg/mL, 6.0 × 10⁻⁴ mg/mL, 3.0 × 10⁻⁴ mg/mL, 1.5 × 10⁻⁴ mg/mL, 7.5 × 10⁻⁵ mg/mL) with PBS buffer, and then added to the micropores for specific binding. After reacting with HRP-IgG as secondary antibody, chromogenic solution, and termination solution successively, the A450nm was determined. The reaction curve was fitted by Origin 8.5 software. The concentration of BsMAb was used as abscissa and A450nm as ordinate. The average value of BsMAb concentration corresponding to the half-saturation index was taken as the affinity constant (Ka) of BsMAb.

2.6. Preparation of BsMAb Based IAC

According to the instruction, the procedures of IAC preparation was as follow: 0.5 g of CNBr-Sepharose 4B powder was swelled with 3 mL of HCl (1 mM) and washed with 20 mL of coupling buffer (0.1 M NaHCO3, pH 8.3) 5 times. Then, the Sepharose gel was mixed with 2 mL anti-AFB1/OTA BsMAb solution (9.61 mg in coupling buffer) and gently stirred at 25 °C. The concentration of unconjugated BsMAb in supernatant was determined by NanoDrop 2000 c ultraviolet spectrometer every 0.5 h to calculate the coupling efficiency. The optimal coupling time was determined when the coupling efficiency was over 90%.
The coupling efficiency was calculated as follows:
Coupling   Efficiency = Concentration   of   BsMAb   before   coupling Concentration   of   unconjugated   BsMAb Concentration   of   BsMAb   Before   Coupling
The agarose gel was redissolved in 50 mL blocking buffer (0.1 M Tris-HCl, pH 8.0) to block the free active sites at 25 °C for 2 h, and washed with 20 mL HAc-NaAc buffer (0.1 M, pH 4.0) and 20 mL Tris-HCl buffer (0.1 M Tris-HCl, pH 8.0) alternately for 4 cycles. Finally, 1 mL of immune gel prepared above was transferred to a polyethylene column and balanced with 20 mL loading buffer (0.1 M PBS, pH 7.4). The IAC prepared was stored with PBS containing 0.01% Merthiolate sodium (v/w) at 4 °C until use.

2.7. Optimization of Elution Conditions and Evaluation of the IAC Capacity

Mixed standard solution containing 50 ng AFB1 and 50 ng OTA was diluted in 15 mL loading buffer and drawn through the IAC. Then 20 mL of loading buffer was applied to wash the IAC. Finally, elution buffer was used to elute the analyte bound to the column. The collected eluent diluted twice with PBS was detected by ic-ELISA and recovery rates were evaluated.
Three elution conditions were optimized to determine the optimum conditions, including type of elution buffer, concentration of methanol in elution buffer, and volumes of elution buffer. Elution buffer A is 0.2 M glucine solution, pH 3.0. Elution buffer B is methanol-water, 90:10, v:v. Elution buffer C is methanol-water, 60:40, v:v, pH 2.3. Elution buffer D is methanol-water, 60:40, v:v, pH 2.3, containing 1 M NaCl. The concentration of methanol in elution buffer are 30%, 40%, 50%, and 60% (v/v). The volumes of elution buffer are 1 mL, 2 mL, 3 mL, 4 mL, 5 mL.
Under the optimal conditions, 15 mL of loading buffer containing excessive mixed standard of AFB1 (300 ng) and OTA (300 ng) was passed through the IAC. The eluent diluted with PBS was detected by ic-ELISA. The column was used repeatedly for several cycles, and the column capacity and preservation rates were calculated and compared. The column capacity/preservation rate was expressed as follows:
Column   Capacity = Concentration   of   AFB 1   or   OTA × Loading   Amount Immune   Gel   Volume
Preservation   Rate = Column   Capacity   for   Several   Cycles Column   Capacity   for   the   First   Treatment

2.8. ic-ELISA Combined with IAC

The collected eluent was detected by the ic-ELISA developed and optimized in our laboratory. The parameters of ic-ELISA are shown in Table 1 and the procedures are as follows. Coating antigen solution was coated in a 96-well polystyrene microtiter plate with 100 μL/well at 4 °C for 14 h, then washed with 300 μL/well wash solution (PBS containing 0.05% Tween-20) twice. 120 μL/well blocking buffer was used to block uncoated sites at 37 °C for 3 h, and then the plate was dried in a draught drying cabinet at 37 °C. Then, 50 μL MAb solution and 50 μL AFB1/OTA standard solution of gradient concentrations or the collected eluent diluted twice with PBS were added to each well and incubated, and the plate was washed 4 times. 100 μL/well HPR-IgG was added for incubation, and then washed 4 times. After washing, 100 μL/well of TMB chromogenic solution was added into each well and incubated for 10 min at 37 °C, and 50 μL/well of 2 M H2SO4 was added to terminate the chromogenic reaction. The absorbance at 450 nm (A450nm) was measured. The A450nm of the well without standard solution was as B0 and with standard solution was as B. The inhibition curve was fitted by Origin 8.5 software adopting B/B0 versus the concentration of AFB1 or OTA, and the IC50 was estimated (Figure 1). The limit of detection (LOD) was defined as the IC10 value. The linear range was taken as IC20 to IC80. The IC50 of AFB1 was 0.027 ng/mL, the LOD was 0.004 ng/mL (0.032 µg/kg), and the linear range was 0.006 ng/mL~0.119 ng/mL. The IC50 of OTA was 0.878 ng/mL, the LOD was 0.126 ng/mL (1.008 µg/kg), and the linear range was 0.259 ng/mL~6.178 ng/mL. The LODs of the ic-ELISA to AFB1 and OTA were obviously lower than the maximum levels. Therefore, this method was suitable for quantitative detection of AFB1 and OTA.

2.9. Analysis of Corn and Wheat Samples

The pretreatment method for AFB1 and OTA analysis was carried out as follows [43]. Corn and wheat samples were evenly crushed and passed through a 40-mesh sieve. 5.0 g of sample was put into a 50 mL polypropylene centrifuge tube, and 25 mL of methanol-water (70:30, v:v, containing 2.4% NaCl) was added, and shaken periodically for 5 min. After centrifuging at 4000 rpm for 10 min, the supernatant was collected through a 0.45 μm PTEE membrane filter to obtain the sample extract. Then 5 mL of the sample extract was diluted with 10 mL loading buffer and drawn through the AFB1/OTA-IAC. Nonspecifically adsorbed impurities were washed off using 20 mL loading buffer. Then, elution buffer optimized in 2.7 was used to elute, and diluted twice with PBS before detection by ic-ELISA. Concurrently, the samples were detected with LC-MS.
LC-MS conditions were modified from published methods [49] as follows: an Agilent LC system coupled with an Agilent 6400 series triple Quadrupole mass spectrometer was used for the confirmatory analysis. An Agilent ECLIPS PLUS C18 (2.1 × 100 mm, 1.8 µm) with solvent consisted of 0.1% formic acid (mobile phase A) and acetonitrile (mobile phase B, 0–2 min, 30%; 2–5 min, 90%; 5–10 min, 5%) at a flow rate of 0.30 mL/min. The temperature was 40 °C and the injection volume was 5 μL. The analysis was performed using positive-ion electrospray interface (ESI) with a multiple reaction monitoring (MRM) mode. The retention times of AFB1 and OTA were 3.339 min and 3.94 min, respectively.
Blank corn and wheat samples without AFB1 and OTA, having been confirmed by LC-MS, were used to spike recovery experiments. AFB1 and OTA of different concentrations (4 μg/kg, 10 μg/kg, 20 μg/kg, 50 μg/kg, 100 μg/kg) were spiked into the blank samples. Eight grain samples were randomly selected from a local market, including four corn samples and four wheat samples. After pretreatment, the sample eluents were detected by ic-ELISA, and the results were compared with those of LC-MS.

3. Results

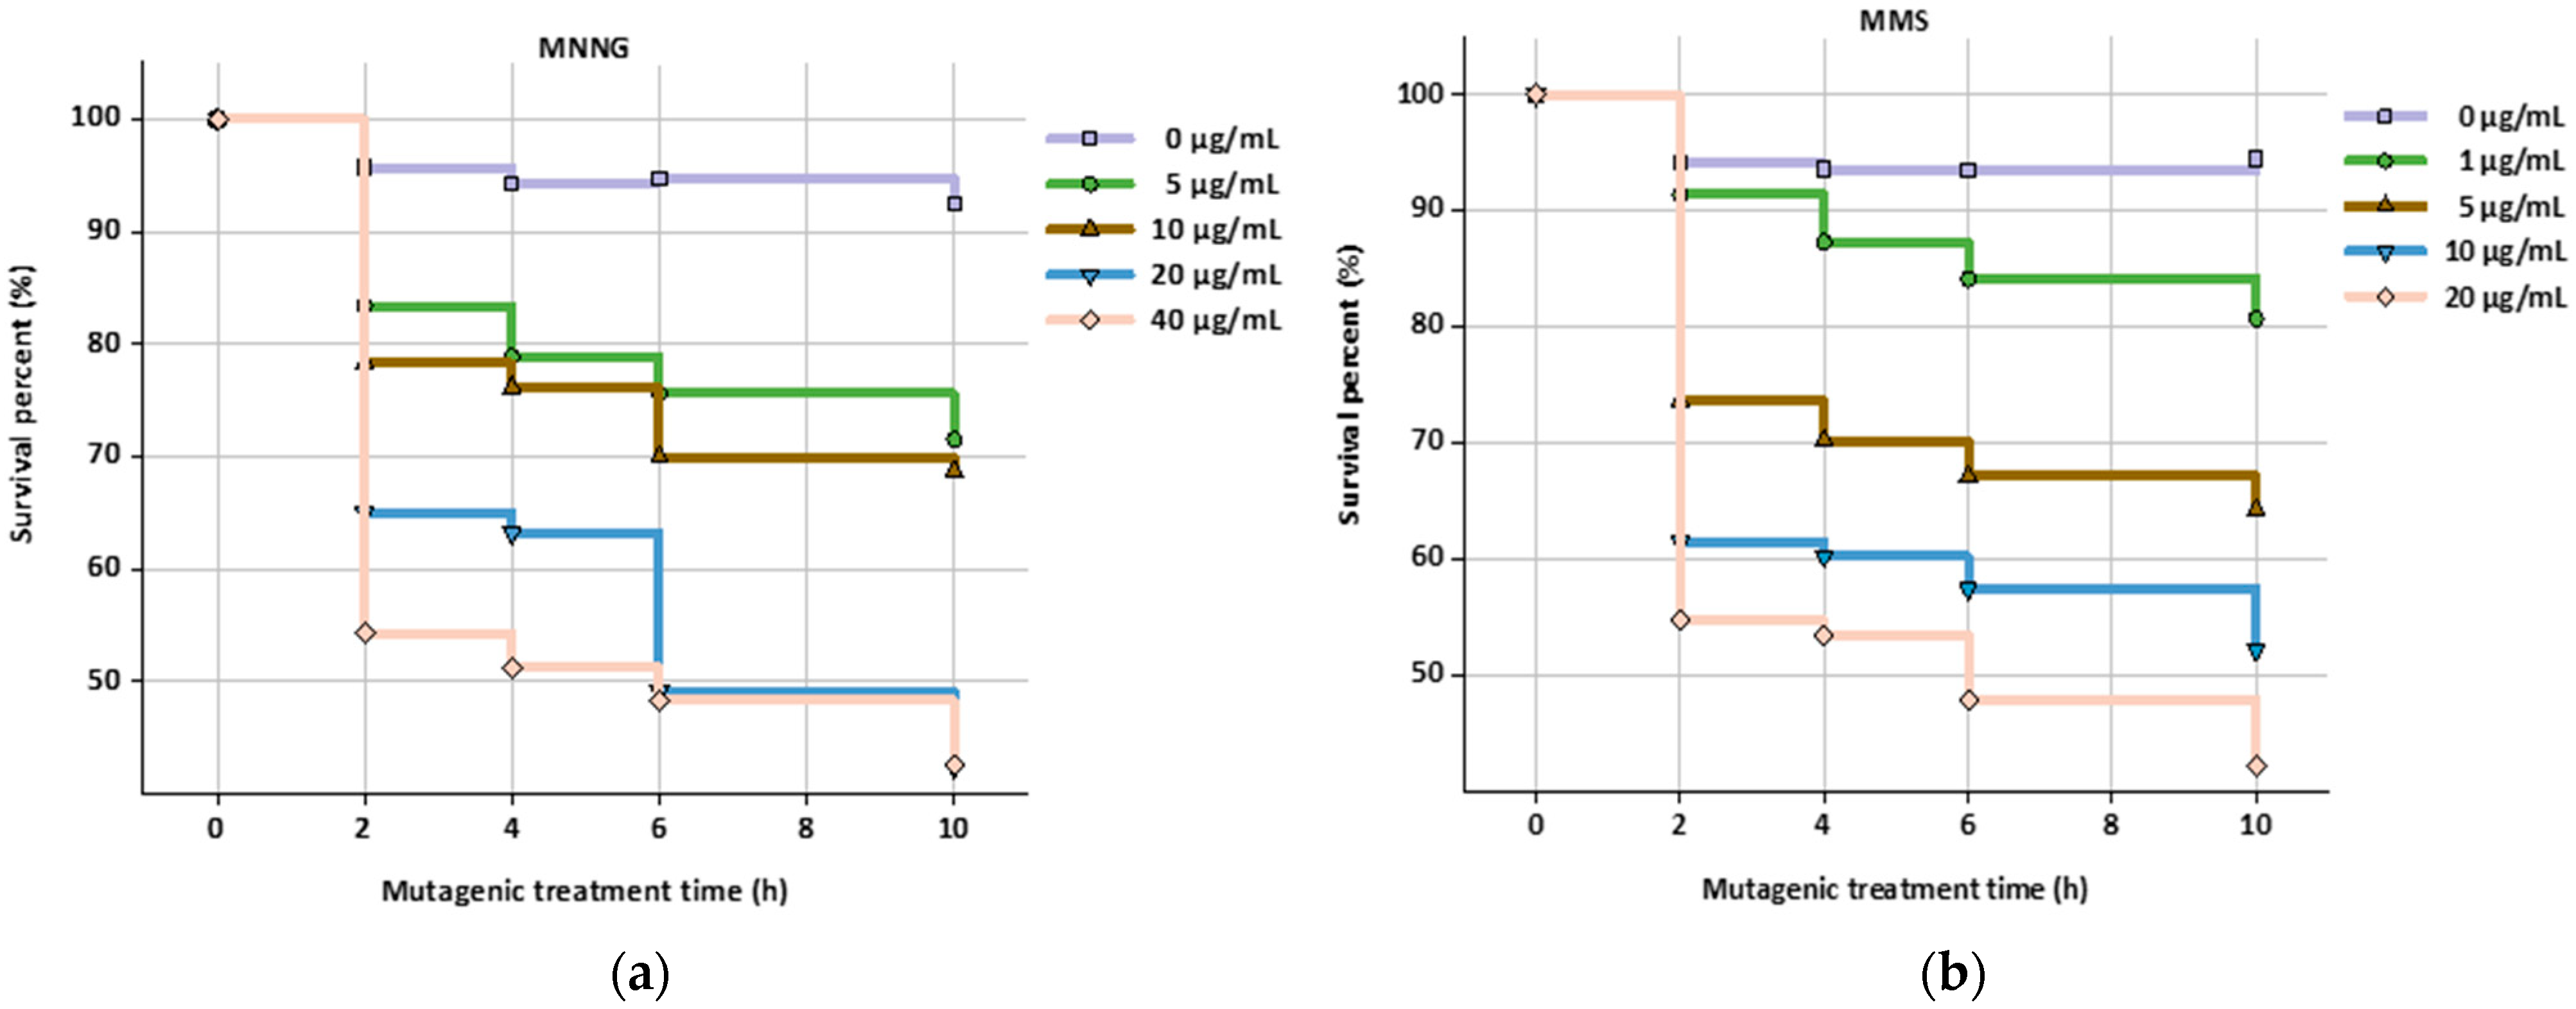
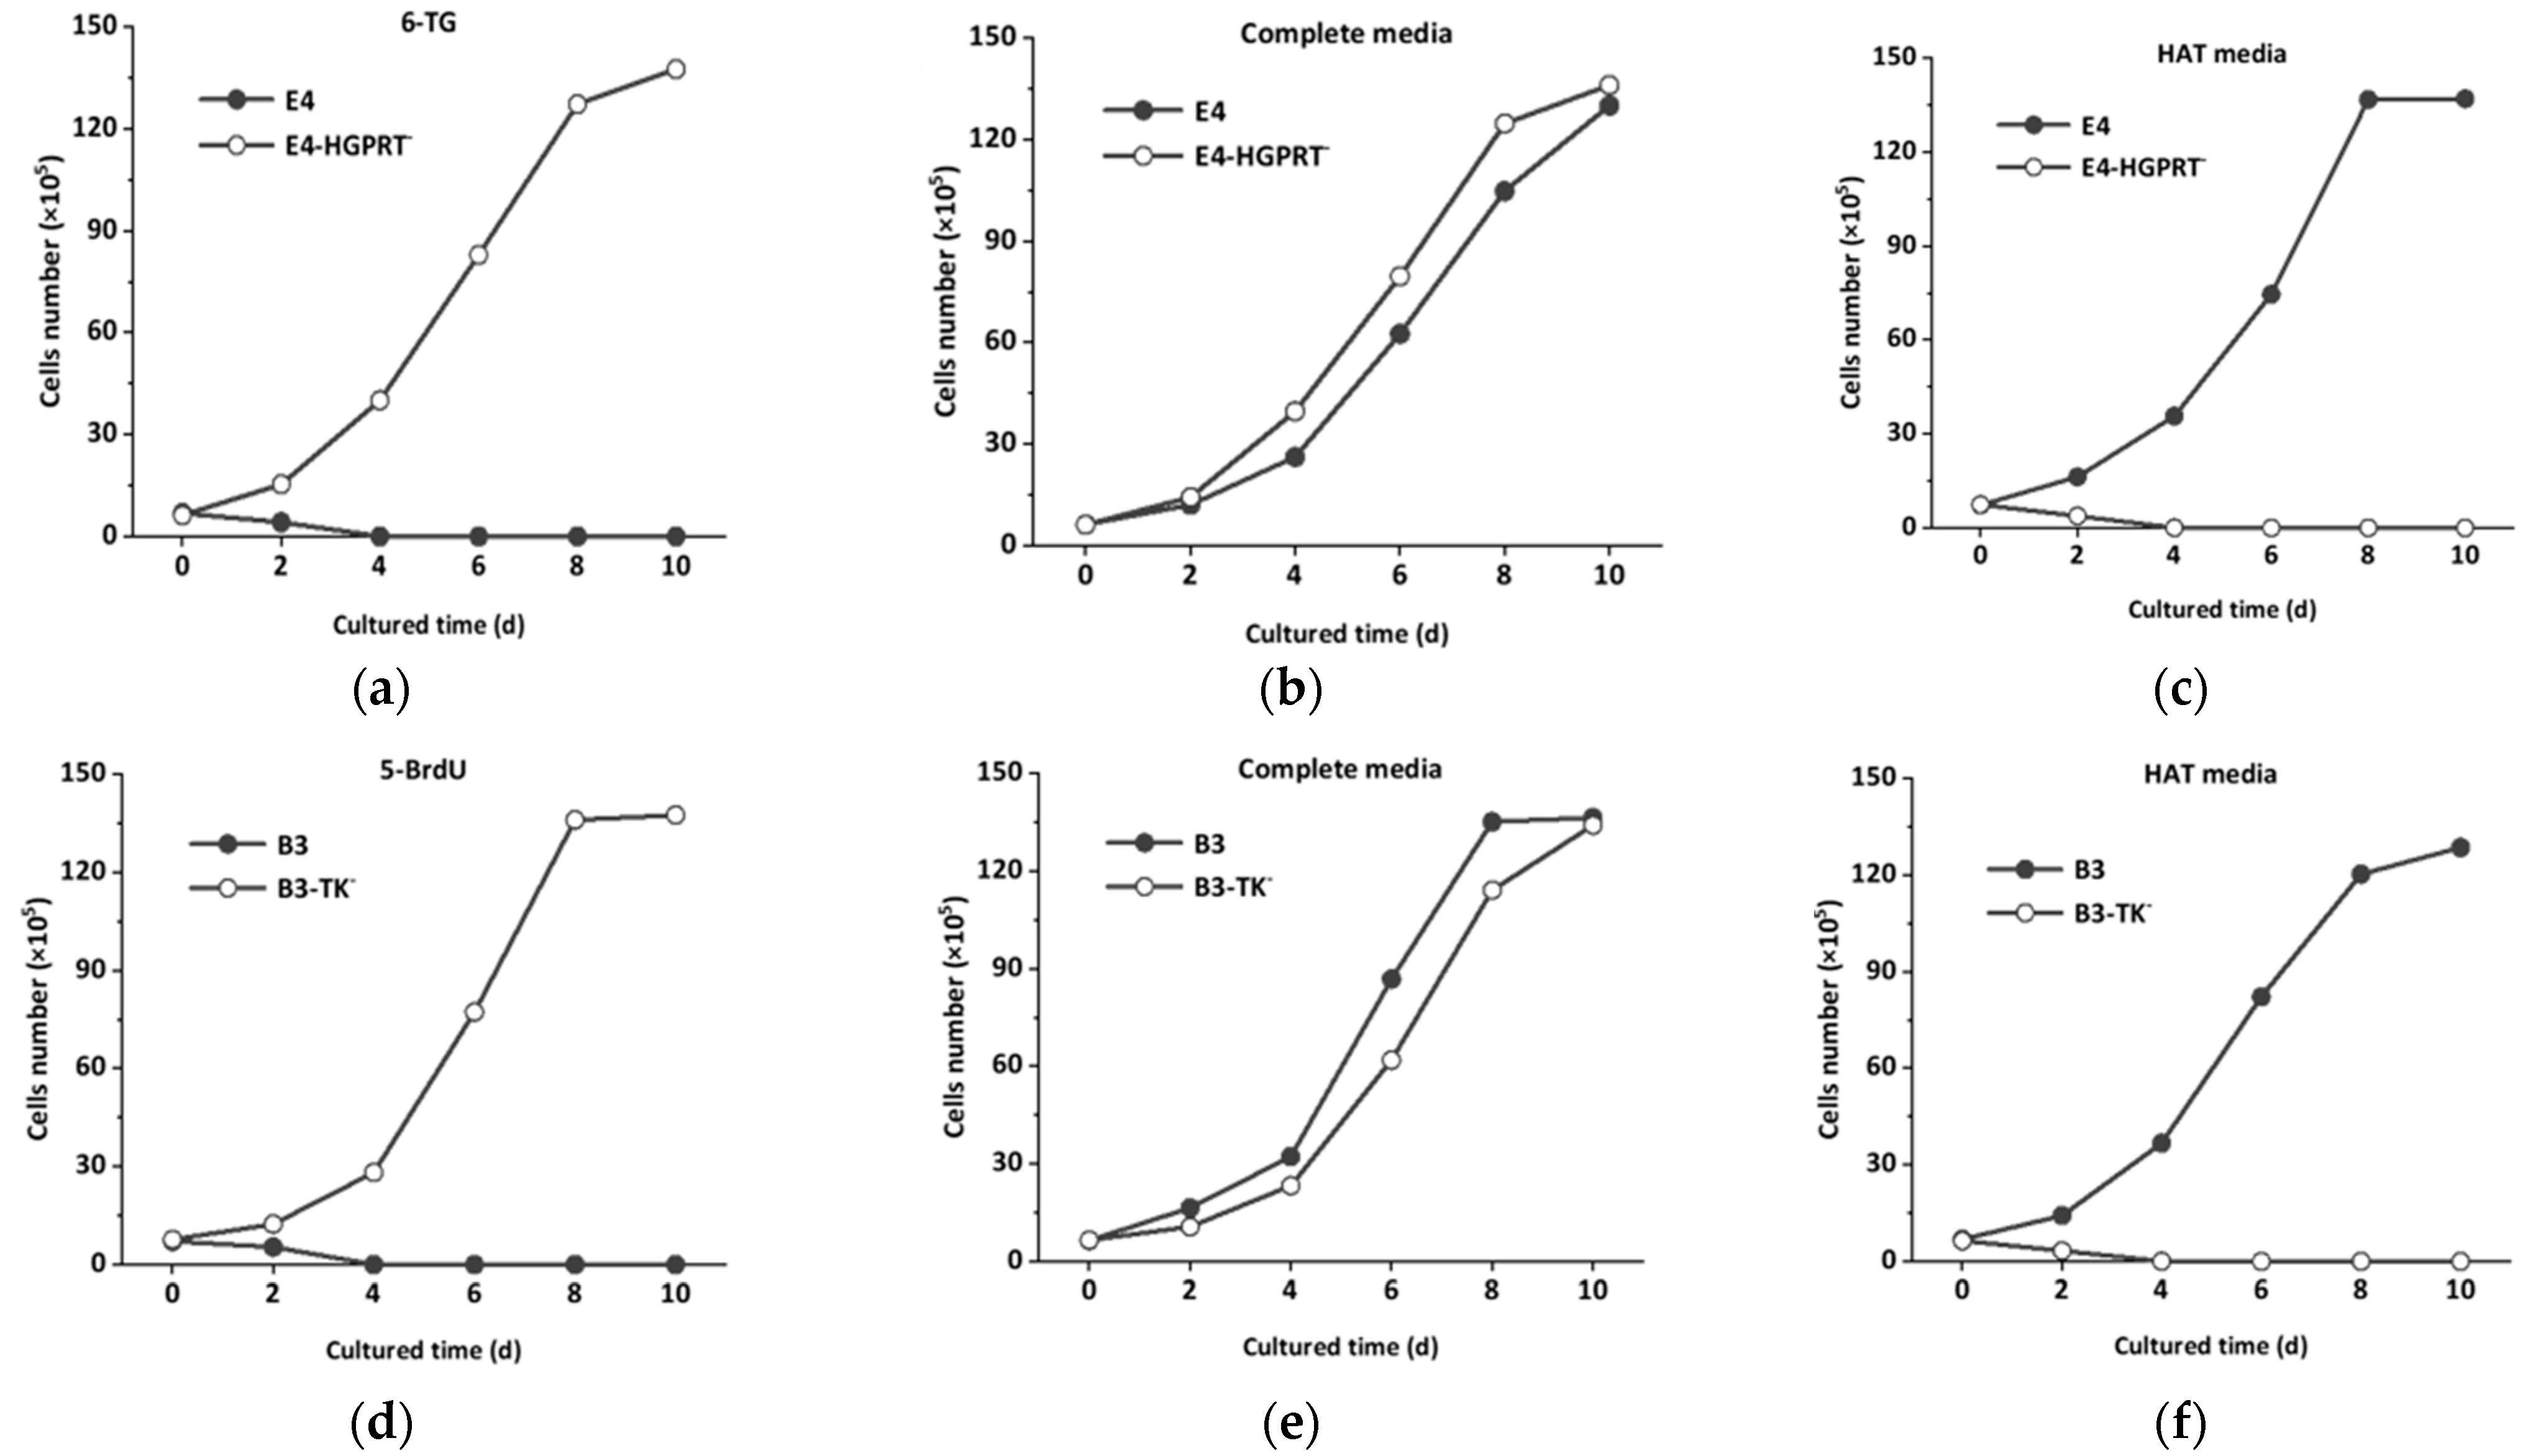
3.1. Mutagenesis and Screening of HGPRT and TK Deficient Hybridoma Cell Lines

The AFB1 hybridoma cell line E4 and OTA hybridoma cell line B3 were applied for construction of a HGPRT and TK deficient mutant, respectively. When the concentration of MNNG was 10 μg/mL and the treatment time was 6 h, the cell survival percentage was 69.9% (Figure 2a), which was determined as the optimal mutation condition of E4 cells. When the concentration of MMS was 5 μg/mL and the treatment time was 4 h, the cell survival percentage was 70.2% (Figure 2b), and the optimal mutation condition for B3 cells was determined. As mutagens, MNNG and MMS have strong mutagenic effect on cells. Over-high concentration and overlong treating time will reduce the activity of cells, or even result in apoptosis.
After MNNG mutation treatment, the E4 cells were inoculated in 6-TG medium for selective screening. The screened E4-HGPRT cell line gradually formed colonies with the ability to fission and grow. Finally, stable inherited deficient cells E4-HGPRT were obtained. Similarly, stable inherited deficient cells B3-TK were screened in 5-BrdU. Figure 3 depict the growth curves of E4-HGPRT and B3-TK in screening reagent (6-TG and 5-BrdU), complete media and HAT media after mutagenic treatment. The unmutated cells could not survive in screening reagent (Figure 3a,d). In complete medium culture, both normal cell line and mutant could grow normally (Figure 3b,e). The cell apoptosis in HAT medium was adopted as an indication of HGPRT or TK deficiency. The growth curve (Figure 3c,f) shows that E4-HGPRT and B3-TK were unable to divide in HAT media, which indicates that E4-HGPRT and B3-TK were sensitive to HAT media.

3.2. Generation and Characterization of BsMAb

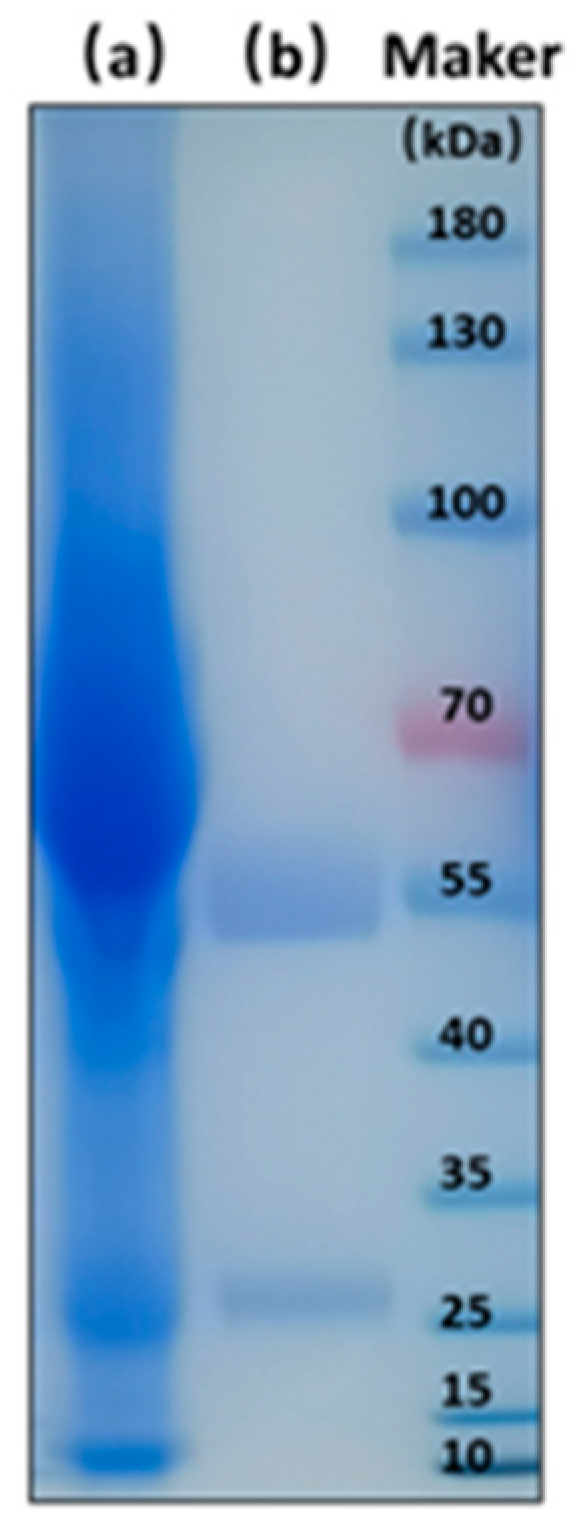
3.2.1. Generation of BsMAb

E4-HGPRT and B3-TK were fused by hybrid-hybridoma technology. A total of 83 tetradoma colonies were generated, and the cell supernatant was identified by ELISA. After 3–4 rounds of subcloning, a positive tetradoma T26 was chosen and was used for production of anti-AFB1/OTA BsMAb by induction in vivo. Clear bands of heavy chain (about 55 kDa) and light chain (about 25 kDa) from BsMAb were observed in the electropherogram (Figure 4). The concentration of BsMAb was 9.61 mg/mL measured by NanoDrop ultraviolet spectrophotometer.

3.2.2. Antibody Specificity Determination

The cross-reactivity of the BsMAb with other common mycotoxins was detected by ELISA. As shown in Table 2, five mycotoxins containing similar structures displayed evident cross-reactivities. The cross-reaction rate with AFB2 was 37%, with AFG1 15%, with AFM1 48%, with AFM2 10%, and with OTB 36%. Negligible cross-reaction was observed with other tested compounds.
It may be speculated from the cross-reactivities of aflatoxins that the specific recognition site of the BsMAb to aflatoxins was mainly coumarin plus cyclopentenone, followed by the difuran ring. The double bond on the furan ring was more conducive to the recognition of the antibody than the single bond (the cross-reaction rate of AFG1 was higher than that of AFG2, and the same trend exists between AFM1 and AFM2). Very often anti-AFB1 antibodies have high cross-reactivity for other aflatoxins, and a positive result for AFB1 is a sufficient motive for detailed analysis of aflatoxins in the sample by other techniques [43]. IAC was applied as pretreatment method in this study, and a certain amount of cross-reactivity of the antibody would be more acceptable than that used in specific quantitative analysis.

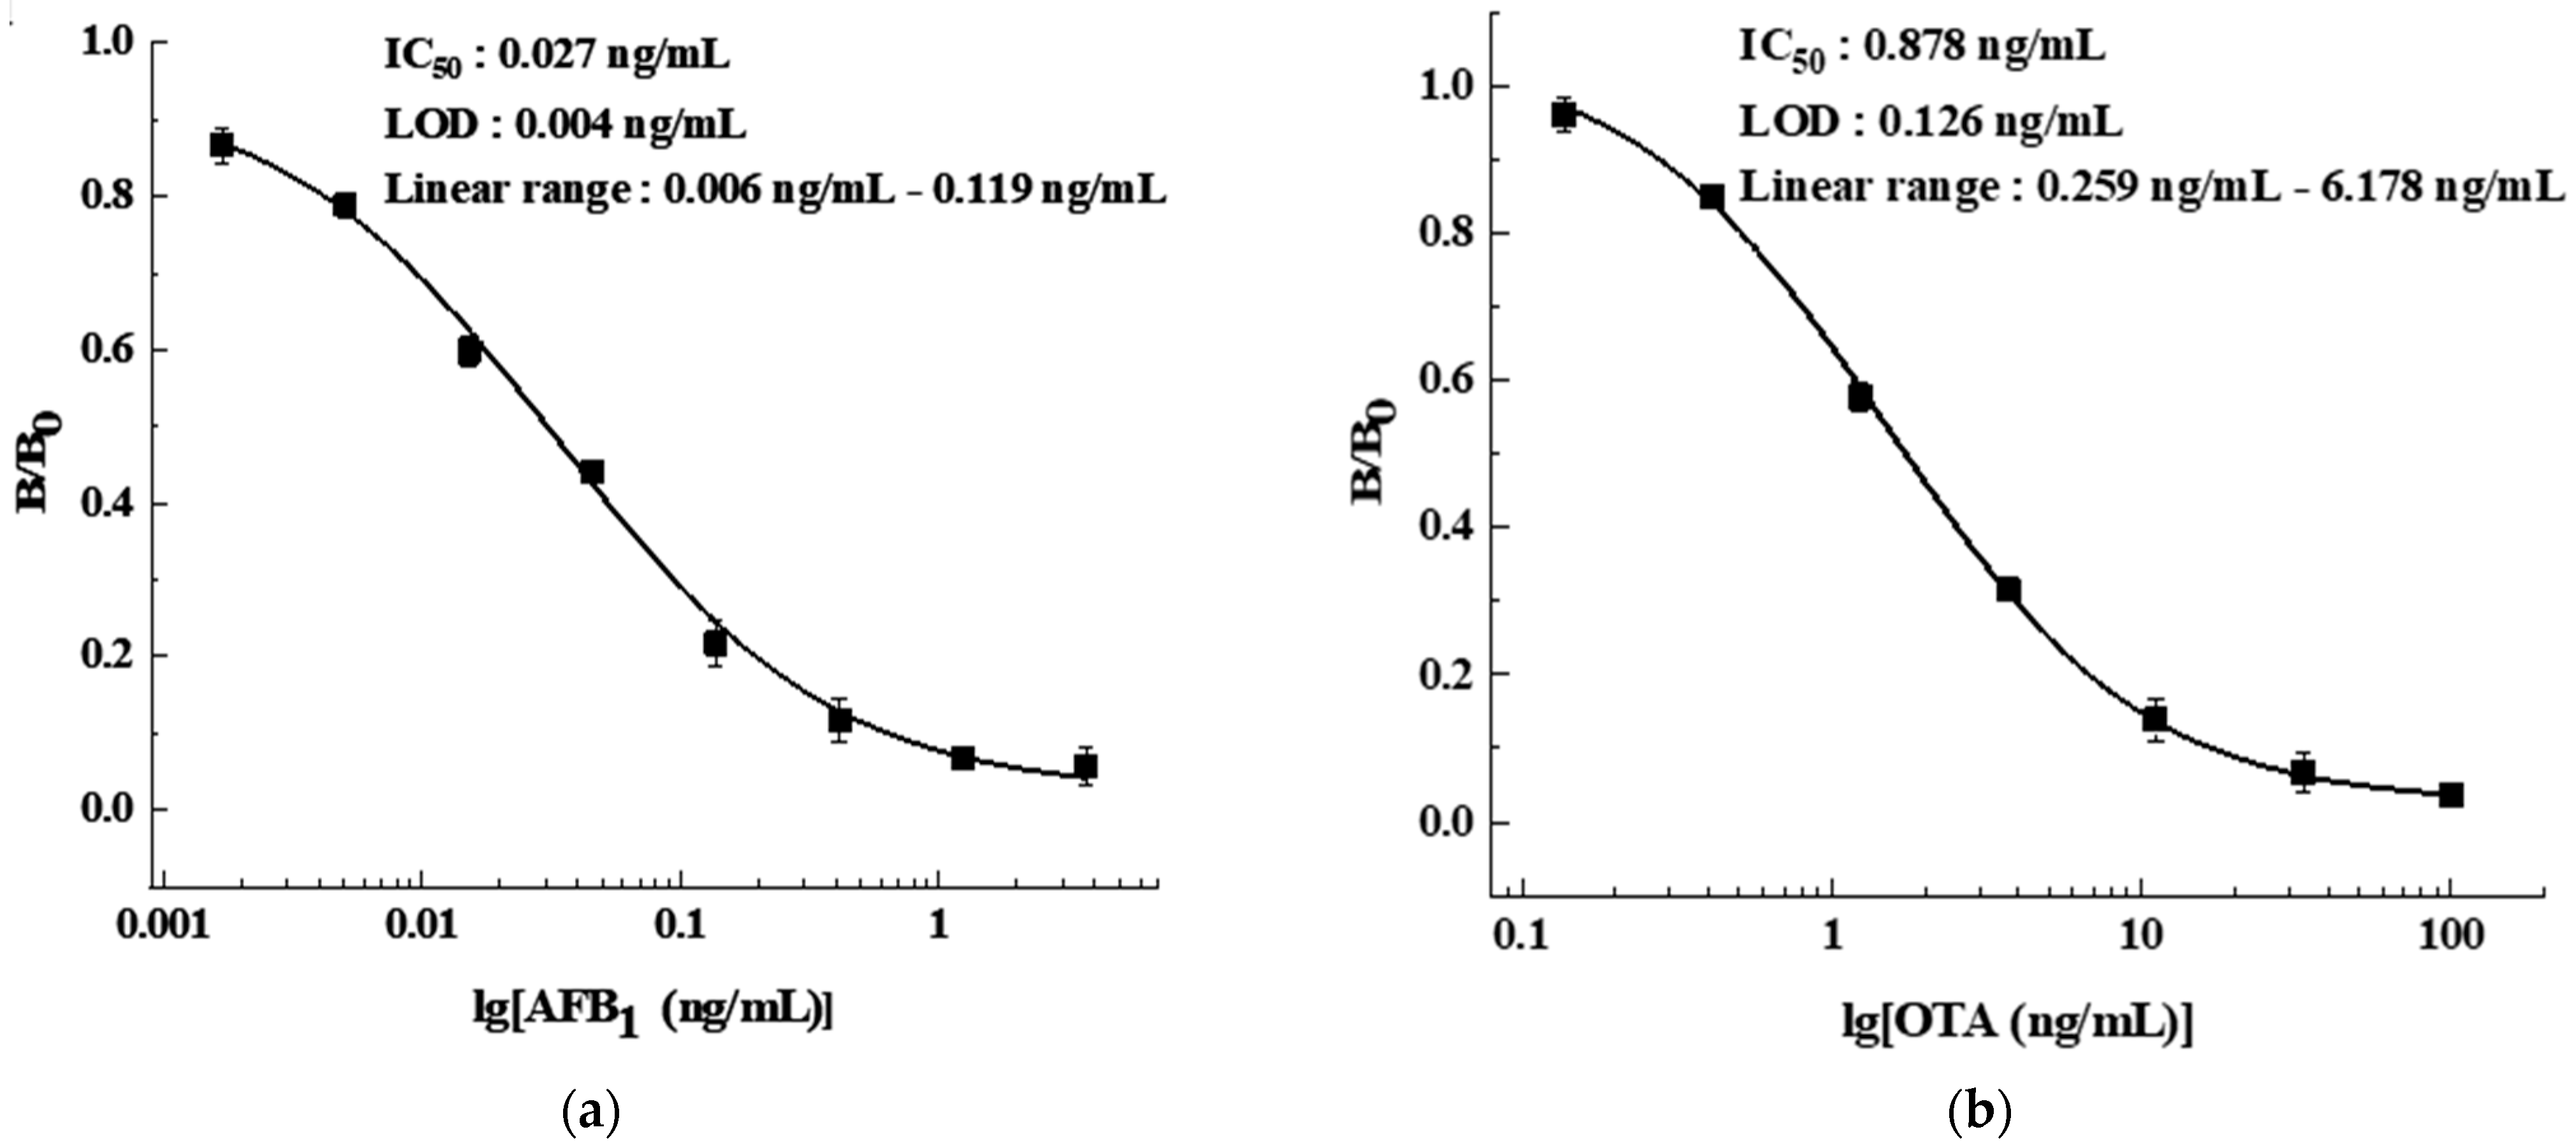
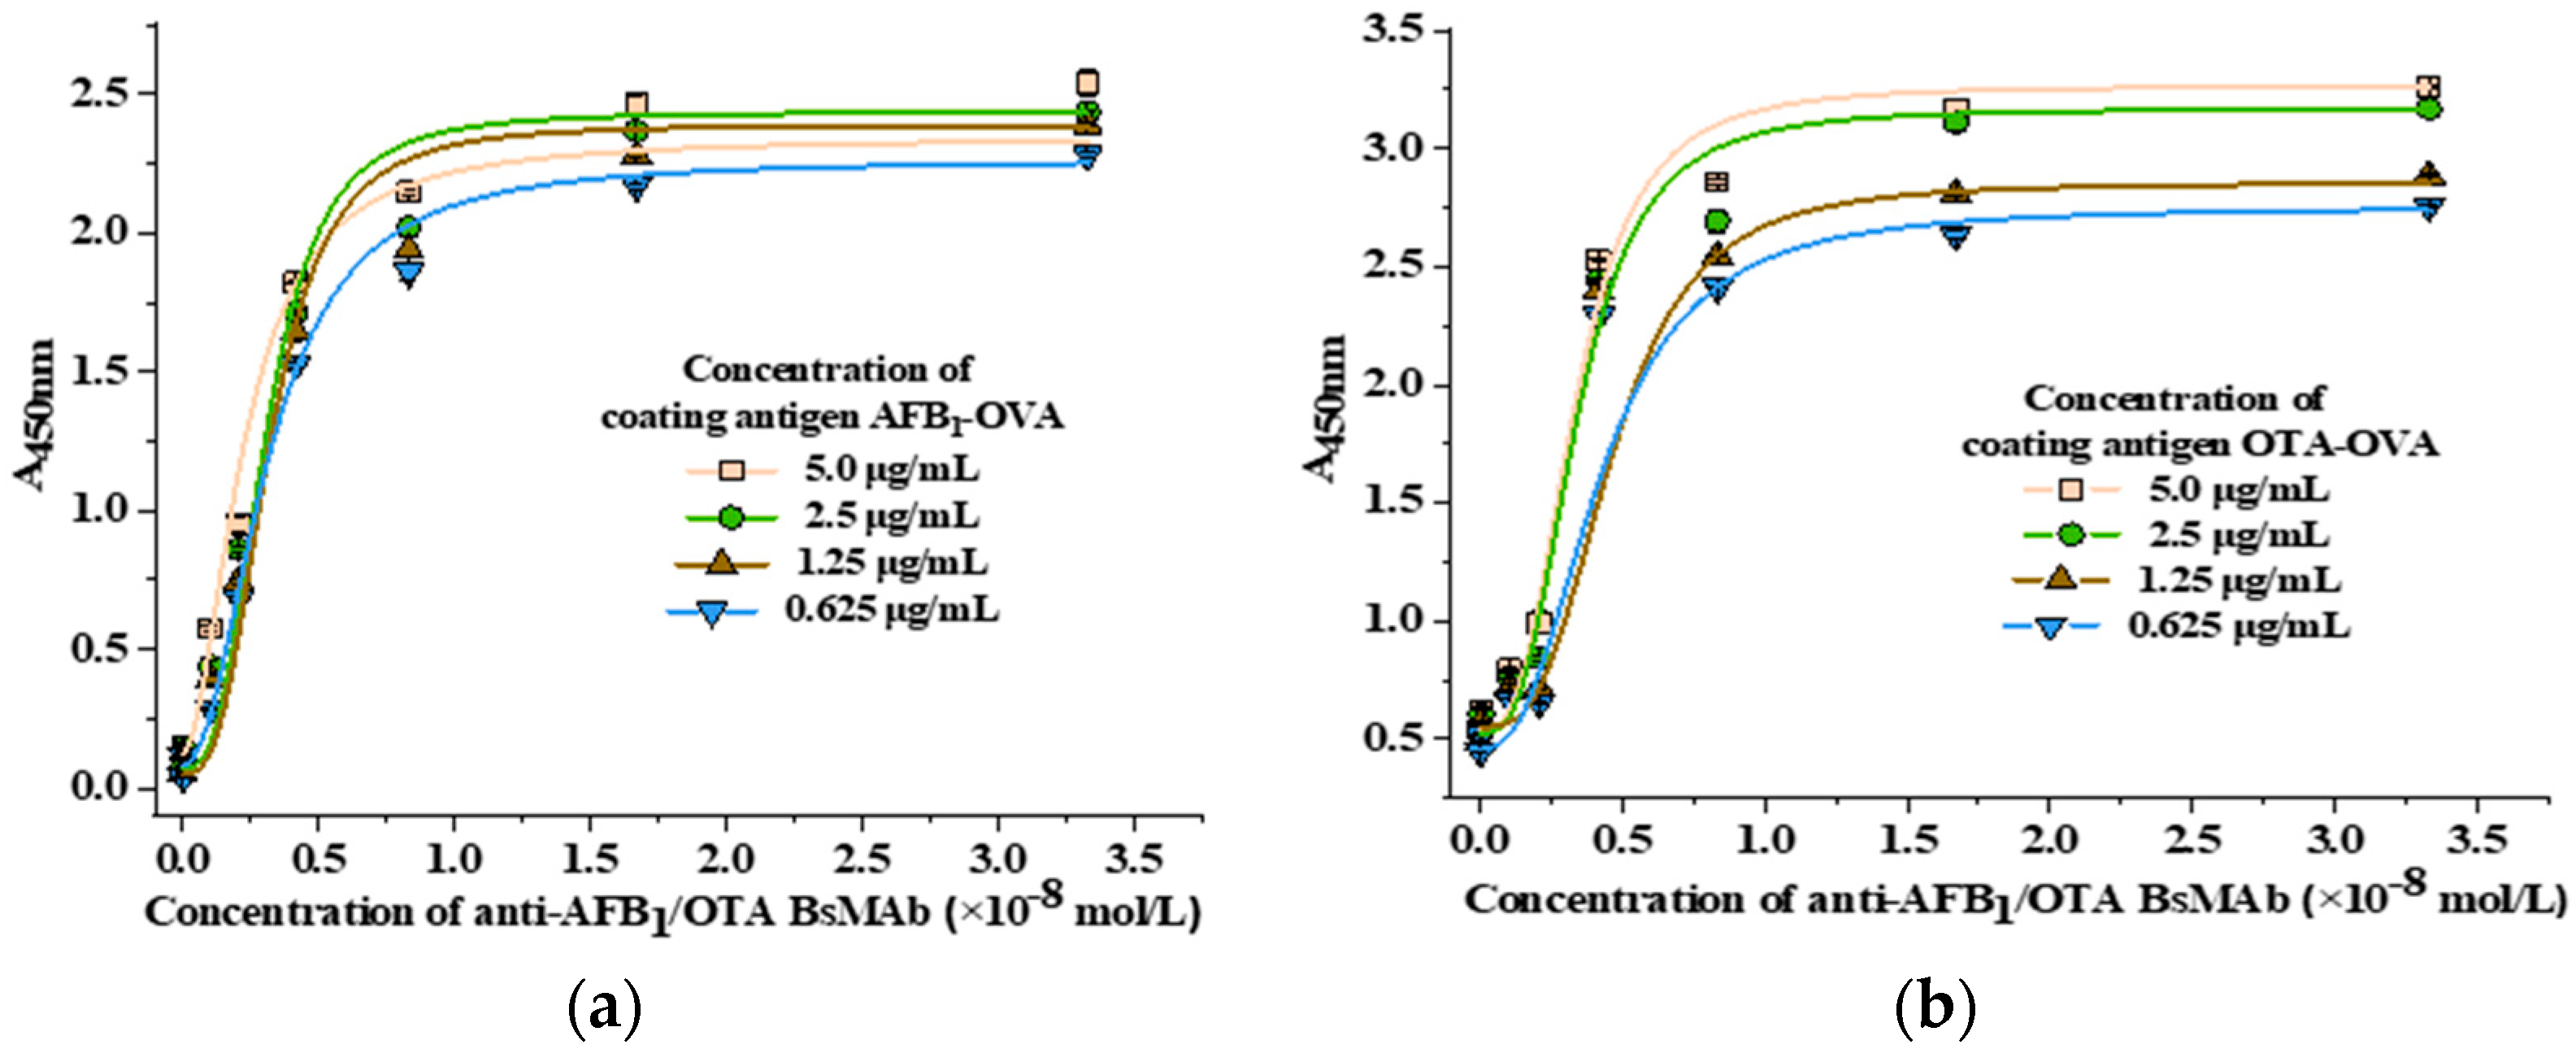
3.2.3. Antibody Affinity Determination

The affinity constant (Ka) at different coating concentrations was confirmed by ELISA and shown in Figure 5. The average Ka of the BsMAb to AFB1 and OTA were 2.43 × 10⁸ L/mol, and 1.57 × 10⁸ L/mol, respectively. Previous studies indicated that the affinity constant (Ka) of high affinity antibodies is between 107 L/mol–1012 L/mol [48], suggesting that the BsMAb prepared in this study is a high affinity antibody.

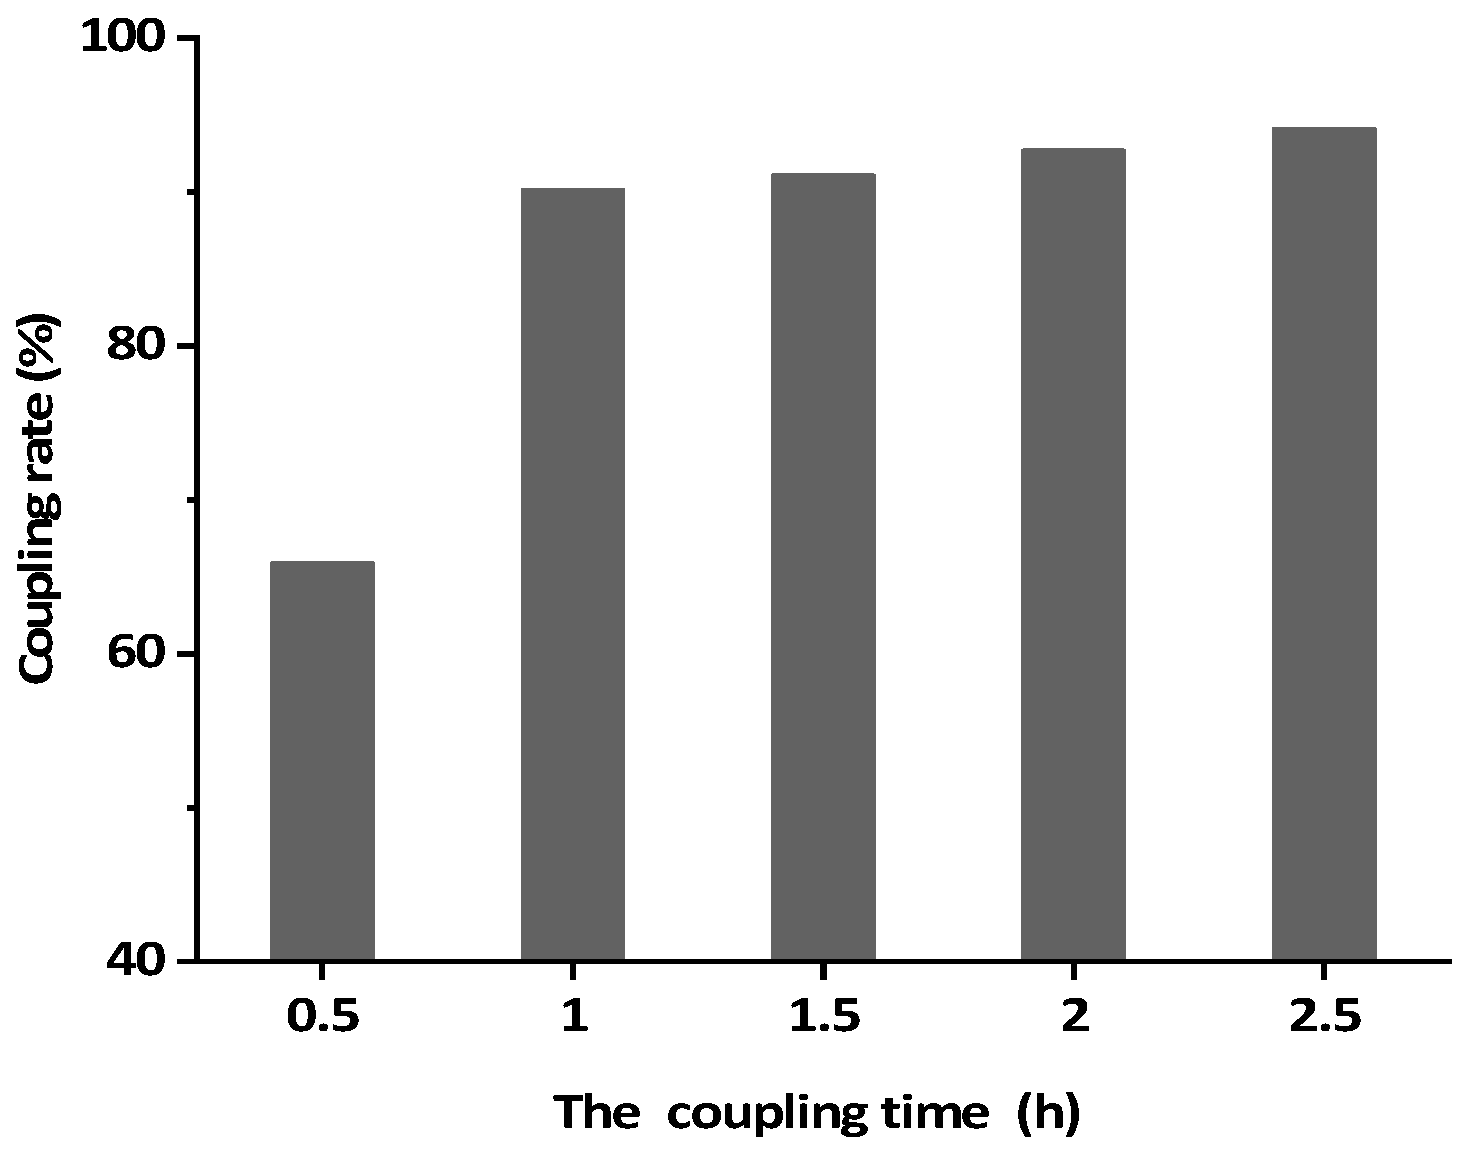
3.3. Preparation of BsMAb Based IAC

While anti-AFB1/OTA BsMAb was coupling with CNBr-Sepharose 4B, the concentration of antibody in the supernatant of the coupling solution was determined every 0.5 h, and the coupling efficiency was calculated to determine the optimal coupling time. Figure 6 shows that the coupling rate rapidly increased to 90.1% for 1 h and the increase in speed over 1 h became slower. Thus 1 h was selected as the optimal coupling time.

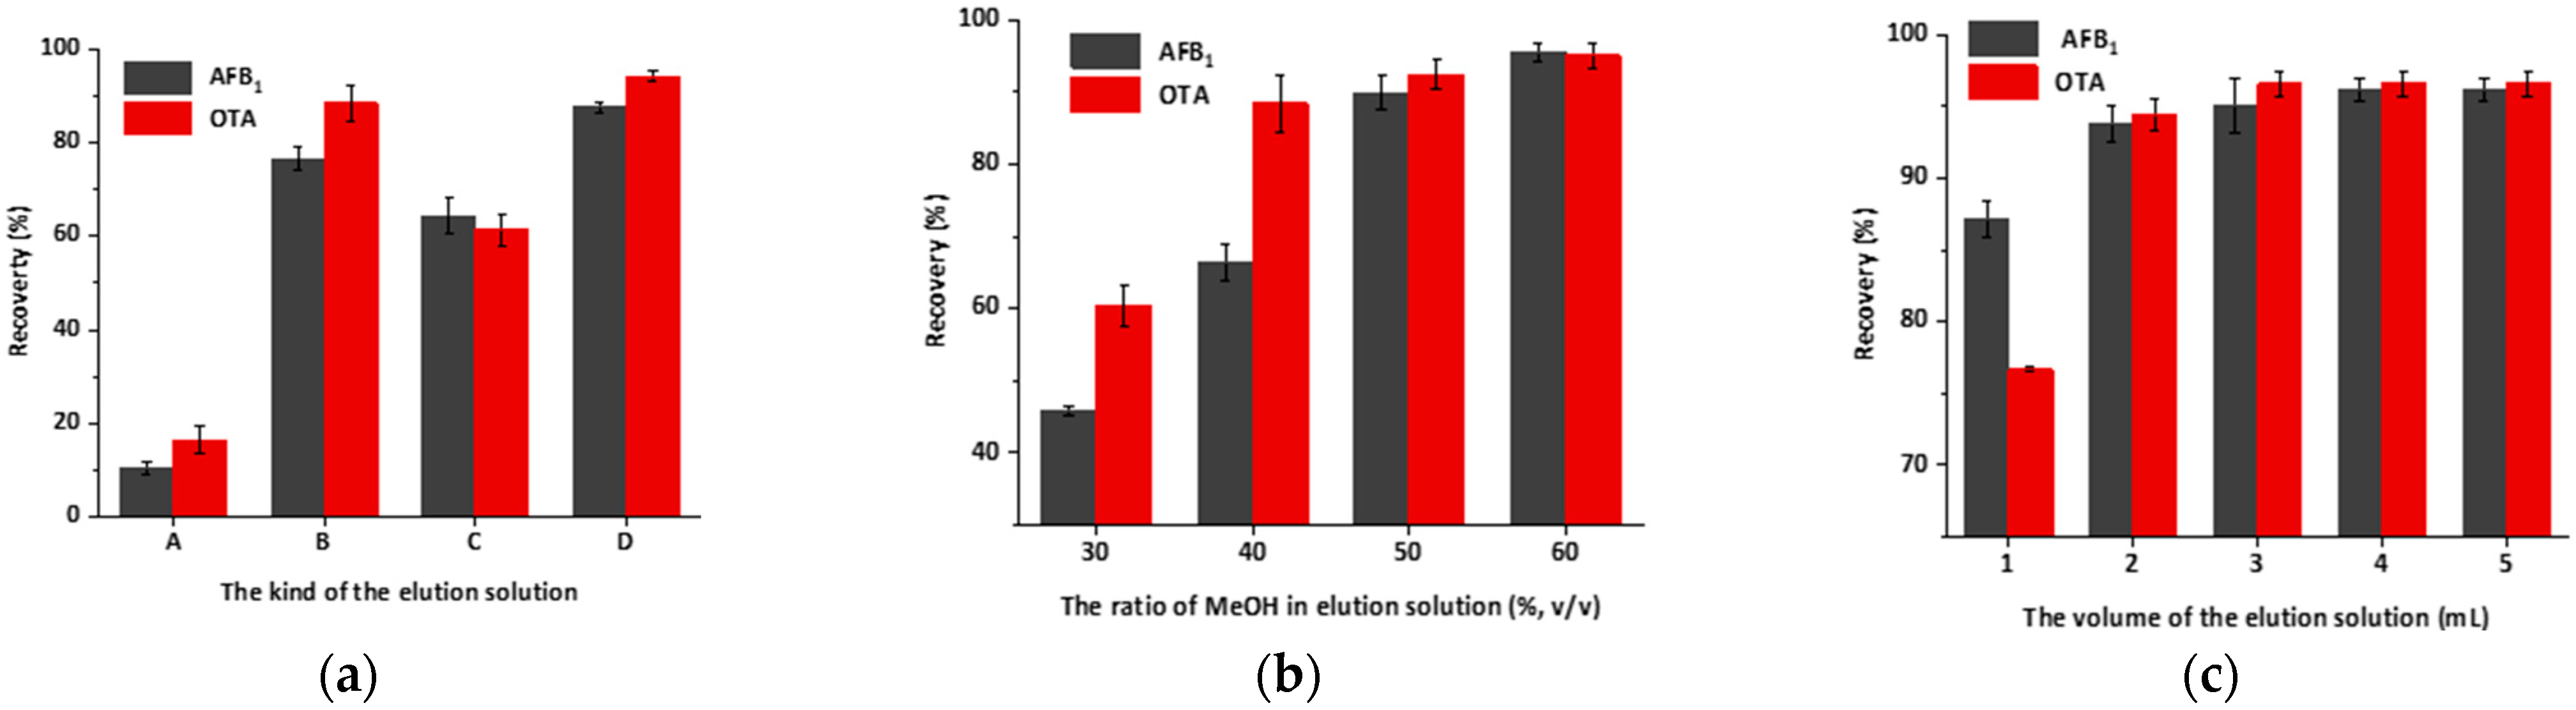
3.4. Optimization of Elution Conditions and Evaluating of the IAC Capacity

To achieve high extraction efficiency, three affecting conditions were optimized and were evaluated by the recovery of AFB1 and OTA.
Firstly, four kinds of elution buffer (A, B, C, D) were tested. The recoveries are shown in Figure 7a. Solution A achieved the lowest recovery, containing no methanol and ionic compound. When the column was eluted with solution D, the recovery of AFB1 and OTA was up to 90%. The concentration of methanol, pH and ion concentration could all influence the recovery. The methanol concentration has significant effect, and ion concentration and low pH also improved the elution recovery. It can be seen from Figure 7a that the recoveries of solution B and D are all around 80%. However, high methanol concentration may affect the activity of the antibody [43], so solution D containing NaCl and medium concentration of methanol is preferred.
Secondly, to further investigate the effect of methanol concentration, elution solutions containing different concentrations of methanol (30%, 40%, 50% and 60%, v/v, 1 M NaCl, pH 2.3) were evaluated. The recovery rose along with the increase of methanol concentration, and the highest recovery was obtained when the concentration of methanol was 60% (Figure 7b).
Thirdly, under the conditions optimized above, using solution containing 60% methanol, 1 M NaCl, pH 2.3 as elution solution, the effect of elution solution volumes (1, 2, 3, 4, 5 mL) on recoveries were also investigated. As shown in Figure 7c, recoveries increased from 87.2% to 96.2% for AFB1 and 76.7% to 96.6% for OTA as the volume increased from 1 mL to 4 mL. The highest recovery was acquired when the volume was above 4 mL, and further increase of the volume did not visibly improve the recovery, thus 4 mL was selected as the optimized volume.
Under the optimized elution conditions (4 mL of solution D with 60% methanol and 1 M NaCl used as elution buffer), the IAC was used repeatedly for seven cycles and the capacity was detected at every cycle. As shown in Table 3, the maximum binding capacities of the IAC for AFB1 and OTA were both over 165 ng. As the column is used repeatedly, the capacity decreases gradually. After seven cycles of use, the preservation rates of column capacity for AFB1 and OTA were 69.3% and 68.0%, respectively (Table 3), which is equivalent to 114.4 μg/kg and 116.3 μg/kg of AFB1 and OTA in samples, respectively, by conversion. According to some investigation results of mycotoxin contamination in agro--products and food samples [50,51,52,53], the capacity of the IAC could meet the needs of practical applications.

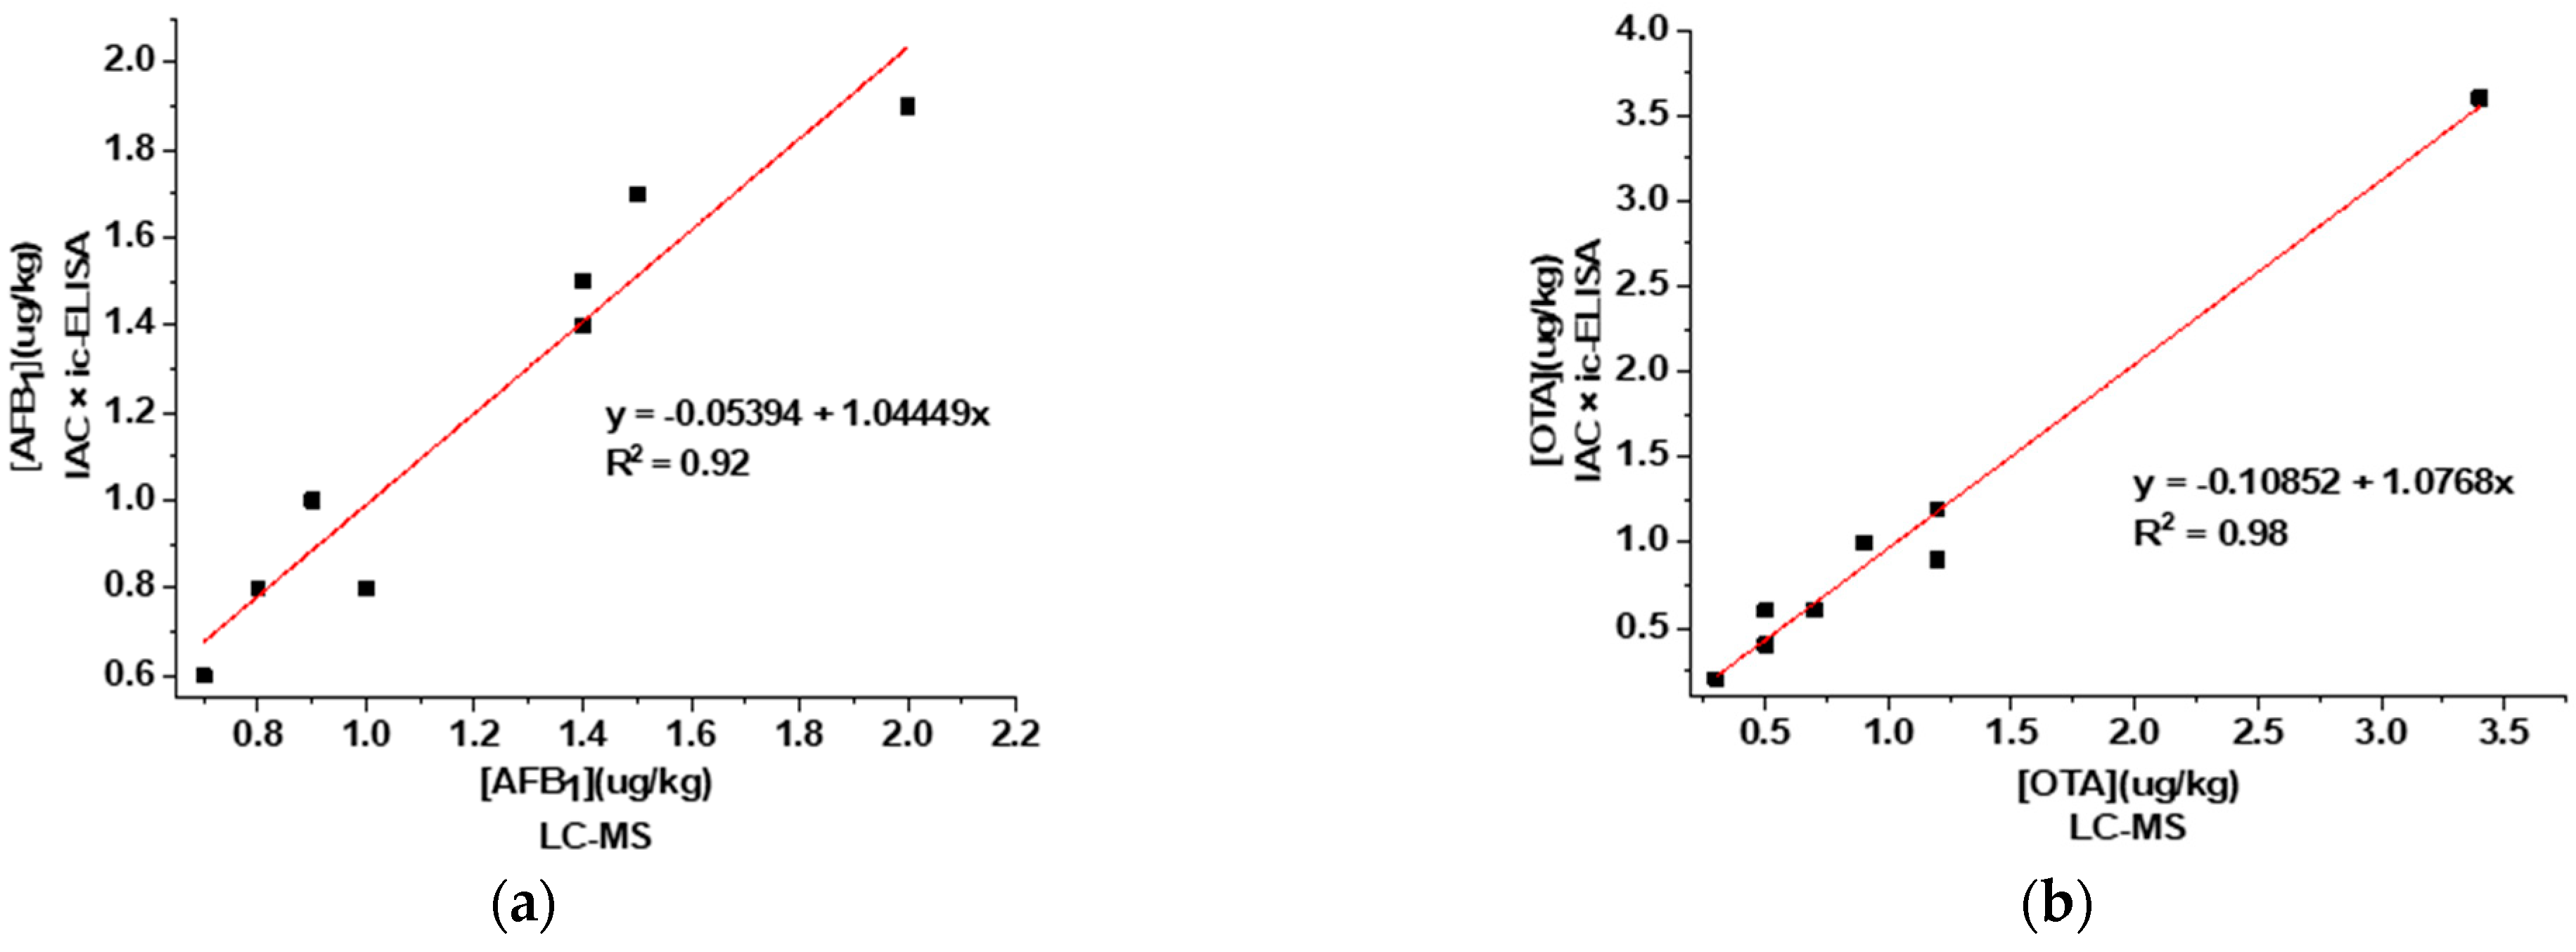
3.5. Analysis of Corn and Wheat Samples

AFB1 and OTA in spiked corn and wheat samples were detected by IAC combined with ELISA, and confirmed by LC-MS. The recoveries of IAC-ELISA ranged from 95.4% to 105.0%, and the coefficients of variation (CV) were less than 10% (Table 4). The results indicated that the assay performed well with appropriate recovery and accuracy. This may be ascribed to IAC pretreatment, which could relieve matrix interference effectively and ameliorate the recovery and accuracy of ELISA for AFB1 and OTA detection in food matrices. The results were confirmed by LC-MS to further prove the reliability of this assay.
Eight real samples of corn and wheat were simultaneously analyzed by the established IAC-ELISA and LC-MS. The results are shown in Figure 8. AFB1 and OTA both tested positive in the eight samples, but the levels were all below the maximum levels. The correlations between the detection results and LC-MS were both above 0.9. Thus it can be seen that the established IAC-ELISA could be applied to the detection of AFB1 and OTA simultaneously in real corn and wheat samples with high accuracy.

4. Conclusions

In this study, we develop a BsMAb based IAC which could bind AFB1 and OTA simultaneously, and the binding sites were 1:1 with the two mycotoxins. The coupling rate and the binding site ratio of AFB1 and OTA are easy to adjust and measure, and mutual interference could be avoided because of the homogeneity of the antibody structure. It is more efficient, convenient, and economical than the IACs based on single-specific antibodies. With satisfactory matrix effect elimination effect and recovery rate, it could be applied to detect AFB1 and OTA rapidly and effectively, combined with ic-ELISA. Besides, the application of this anti-AFB1/OTA BsMAb in IAC could provide reference for the application of other BsMAb in IAC in the future.
The BsMAb prepared in this study demonstrated different cross-reactivities to five biotoxins with similar structures. It is necessary to further improve the hapten structures and the screening strategy to prepare a more specific BsMAb if it were to be applied in the field with higher requirements for specificity. As a mature ELISA detection mode that could quantitatively determine two analytes simultaneously is unavailable at present, the ic-ELISA used in this study can just detect AFB1 and OTA respectively. If simultaneous detection of two toxins in ELISA can be achieved, this study will have more practical application value.

Author Contributions

Conceptualization, D.L.; Data curation, D.L., X.W. and R.S.; Formal analysis, Y.C. and L.L.; Supervision, Z.X.; Writing—original draft, D.L.; Writing—review & editing, H.W. and Z.X. All authors have read and agreed to the published version of the manuscript.

Funding

This study was supported financially by the National Key Research and Development Program of China (2018YFC1602903) and Guangdong Basic and Applied Basic Research Foundation (2019A1515012107).

Institutional Review Board Statement

All procedures involving animals were performed in accordance with the protective and administrant laws for laboratory animals of China and approved by the Institutional Authority for Laboratory Animal Care.

Informed Consent Statement

Not applicable.

Data Availability Statement

Data is contained within the article.

Conflicts of Interest

All authors declare no conflict of Interest.

References

  1. Duarte, S.C.; Lino, C.M.; Pena, A. Ochratoxin A in feed of food-producing animals: An undesirable mycotoxin with health and performance effects. Vet. Microbiol. 2011, 154, 1–13. [Google Scholar] [CrossRef] [PubMed]
  2. Egmond, H.; Dekker, W.H. Worldwide regulations for mycotoxins. Nat. Toxins 2010, 3, 332–336. [Google Scholar] [CrossRef] [PubMed]
  3. Fuchs, R.; Peraica, M. Ochratoxin A in human kidney diseases. Food Addit. Contam. 2005, 22, 53–57. [Google Scholar] [CrossRef] [PubMed] [Green Version]
  4. Santacroce, M.P.; Conversano, M.C.; Casalino, E.; Lai, O.; Zizzadoro, C.; Centoducati, G.; Crescenzo, G. Aflatoxins in aquatic species: Metabolism, toxicity and perspectives. Rev. Fish Biol. Fish. 2008, 18, 99–130. [Google Scholar] [CrossRef]
  5. WHO International Agency for Research on Cancer. IARC Monographs on the Identification of Carcinogenic Hazards to Humans. 2021. Available online: https://monographs.iarc.who.int/list-of-classifications (accessed on 14 December 2021).
  6. Kumar, A.; Jindal, N.; Shukla, C.L.; Pal, Y.; Ledoux, D.R.; Rottinghaus, G.E. Effect of ochratoxin A on Escherichia coli-challenged broiler chicks. Avian Dis. 2003, 47, 15–424. [Google Scholar] [CrossRef]
  7. Alassane-Kpembi, I.; Schatzmayr, G.; Taranu, I.; Marin, D.; Puel, O.; Oswald, I.P. Mycotoxins co-contamination: Methodological aspects and biological relevance of combined toxicity studies. Crit. Rev. Food Sci. Nutr. 2016, 57, 3489–3507. [Google Scholar] [CrossRef]
  8. Madrigal-Santillan, E.; Morales-Gonzalez, J.A.; Vargas-Mendoza, N.; Reyes-Ramírez, P.; Cruz-Jaime, S.; Sumaya-Martínez, T.; Pérez-Pastén, R.; Madrigal-Bujaidar, E. Antigenotoxic Studies of Different Substances to Reduce the DNA Damage Induced by Aflatoxin B-1 and Ochratoxin A. Toxins 2010, 2, 738–757. [Google Scholar] [CrossRef] [Green Version]
  9. European Commission. Commission Regulation (EC) No. 1881/2006 of 19 December 2006 setting maximum levels for certain contaminants in foodstuffs. Off. J. Eur. Union 2006, L364, 20–23. [Google Scholar]
  10. GB2761-2017; Chinese National Food Safety Standard, Maximum Residue Limits for Mycotoxins in Food. National Medical Products Administration: Beijing, China, 2017.
  11. Amino, N.; Hidaka, Y. Various types of immunoassay. Nihon Rinsho Jpn. J. Clin. Med. 1995, 53, 2107–2111. [Google Scholar]
  12. Lee, N.; Wang, S.; Allan, R.D.; Kennedy, I.R. A Rapid Aflatoxin B1 ELISA: Development and Validation with Reduced Matrix Effects for Peanuts, Corn, Pistachio, and Soybeans. J. Agric. Food. Chem. 2004, 52, 2746–2755. [Google Scholar] [CrossRef] [PubMed]
  13. Sun, X.; Zhao, X.; Tang, J.; Jun, Z.; Chu, F.S. Preparation of gold-labeled antibody probe and its use in immunochromatography assay for detection of aflatoxin B1. Int. J. Food Microbiol. 2005, 99, 185–194. [Google Scholar]
  14. Huang, X.; Huang, T.; Li, X.; Huang, Z. Flower-like gold nanoparticles-based immunochromatographic test strip for rapid simultaneous detection of fumonisin B1 and deoxynivalenol in Chinese traditional medicine. J. Pharm. Biomed. Anal. 2019, 177, 112895. [Google Scholar] [CrossRef] [PubMed]
  15. Machado, J.M.; Soares, R.R.; Chu, V.; Conde, J.P. Multiplexed capillary microfluidic immunoassay with smartphone data acquisition for parallel mycotoxin detection. Biosens. Bioelectron. 2018, 99, 40–46. [Google Scholar] [CrossRef] [PubMed]
  16. Gong, Y.; Zheng, Y.; Jin, B.; You, M.; Wang, J.; Li, X.; Lin, M.; Xu, F.; Li, F. A portable and universal upconversion nanoparticle-based lateral flow assay platform for point-of-care testing. Talanta 2019, 201, 126–133. [Google Scholar] [CrossRef] [PubMed]
  17. Qu, J.; Xie, H.; Zhang, S.; Luo, P.; Guo, P.; Chen, X.; Ke, Y.; Zhuang, J.; Zhou, F.; Jiang, W. Multiplex Flow Cytometric Immunoassays for High-Throughput Screening of Multiple Mycotoxin Residues in Milk. Food Anal. Methods 2019, 12, 877–886. [Google Scholar] [CrossRef]
  18. Qileng, A.; Liang, H.; Huang, S.; Liu, W.; Xu, Z.; Liu, Y. Dual-function of ZnS/Ag 2 S nanocages in ratiometric immunosensors for the discriminant analysis of ochratoxins: Photoelectrochemistry and electrochemistry. Sens. Actuators B Chem. 2020, 314, 128066. [Google Scholar] [CrossRef]
  19. Han, Z.; Tang, Z.; Jiang, K.; Huang, Q.; Meng, J.; Nie, D.; Zhao, Z. Dual-target electrochemical aptasensor based on co-reduced molybdenum disulfide and Au NPs (rMoS 2 -Au) for multiplex detection of mycotoxins. Biosens. Bioelectron. 2020, 150, 111894. [Google Scholar] [CrossRef]
  20. Shen, Y.; Pan, D.; Li, G.; Hu, H.; Xue, H.; Zhang, M.; Zhu, M.; Gong, X.; Zhang, Y.; Wan, Y. Direct Immunoassay for Facile and Sensitive Detection of Small Molecule Aflatoxin B1 based on Nanobody. Chemistry 2018, 24, 9869–9876. [Google Scholar]
  21. Liu, H.; Zhang, J.; Ding, K.; Chen, X.; Han, T. The development and characterization of an immunoaffinity column used for the simultaneous selective extraction of Fusarium toxins from grain products. Qual. Assur. Saf. Crops Foods 2019, 11, 325–331. [Google Scholar] [CrossRef]
  22. Wang, F.; Li, Z.; Yang, Y.; Wan, D.; Vasylieva, N.; Zhang, Y.; Cai, J.; Wang, H.; Shen, Y.; Xu, Z. Chemiluminescent Enzyme Immunoassay and Bioluminescent Enzyme Immunoassay for Tenuazonic Acid Mycotoxin by Exploitation of Nanobody and Nanobody-Nanoluciferase Fusion. Anal. Chem. 2020, 72, 11935–11942. [Google Scholar] [CrossRef]
  23. Moldenhauer, G. Bispecific Antibodies from Hybrid Hybridoma. In Bispecific Antibodies; Kontermann, R., Ed.; Academic Press: Cambridge, MA, USA; Springer: Berlin/Heidelberg, Germany, 2011; pp. 29–46. [Google Scholar]
  24. Sedykh, S.E.; Prinz, V.V.; Buneva, V.N.; Nevinsky, G.A. Bispecific antibodies: Design, therapy, perspectives. Drug Des. Dev. Ther. 2018, 12, 195. [Google Scholar] [CrossRef] [PubMed] [Green Version]
  25. Byrne, H.; Conroy, P.J.; Whisstock, J.C.; O’Kennedy, R.J. A tale of two specificities: Bispecific antibodies for therapeutic and diagnostic applications. Trends Biotechnol. 2013, 31, 621–632. [Google Scholar] [CrossRef] [PubMed]
  26. Ouyang, H.; Wang, L.; Yang, S.; Wang, W.; Wang, L.; Liu, F.; Fu, Z. Chemiluminescence reaction kinetics-resolved multianalyte immunoassay strategy using a bispecific monoclonal antibody as the unique recognition reagent. Anal. Chem. 2015, 87, 2952. [Google Scholar] [CrossRef] [PubMed]
  27. Takahashi, M.; Fuller, S.A. Production of murine hybrid-hybridomas secreting bispecific monoclonal antibodies for use in urease-based immunoassays. Clin. Chem. 1988, 34, 1693–1696. [Google Scholar] [CrossRef] [PubMed]
  28. Wang, F.; Wang, H.; Shen, Y.; Li, Y.; Dong, J.; Xu, Z.; Yang, J.; Sun, Y.; Xiao, Z. Bispecific Monoclonal Antibody-Based Multianalyte ELISA for Furaltadone Metabolite, Malachite Green, and Leucomalachite Green in Aquatic Products. J. Agric. Food. Chem. 2016, 64, 8054–8061. [Google Scholar] [CrossRef] [PubMed]
  29. Jin, R.; Guo, Y.; Wang, C.; Wu, J.; Zhu, G. Development of a Bispecific Monoclonal Antibody to Pesticide Carbofuran and Triazophos Using Hybrid Hybridomas. J. Food Sci. 2009, 74, T1–T6. [Google Scholar] [CrossRef]
  30. Trucksess, M.W.; Weaver, C.M.; Oles, C.J.; Oles, C.J.; Fry, F.S.; Noonan, G.O.; Betz, J.M.; Rader, J.I. Determination of aflatoxins B1, B2, G1, and G2 and ochratoxin A in ginseng and ginger by multitoxin immunoaffinity column cleanup and liquid chromatographic quantitation: Collaborative study. J. AOAC Int. 2008, 91, 511–523. [Google Scholar] [CrossRef] [Green Version]
  31. Suarez-Bonnet, E.; Carvajal, M.; Mendez-Ramirez, I.; Castillo-Urueta, P.; Cortés-Eslava, J.; Gómez-Arroyo, S.; Melero-Vara, J.M. Aflatoxin (B1, B2, G1, and G2) contamination in rice of Mexico and Spain, from local sources or imported. J. Food Sci. 2013, 78, T1822–T1829. [Google Scholar] [CrossRef] [Green Version]
  32. Chan, D.; Macdonald, S.J.; Boughtflower, V.; Brereton, P. Simultaneous determination of aflatoxins and ochratoxin A in food using a fully automated immunoaffinity column clean-up and liquid chromatography–fluorescence detection. J. Chromatogr. A 2004, 1059, 13–16. [Google Scholar] [CrossRef]
  33. Gong, Y.; Yang, T.; Xiaosong, M.O.; Mo, X.; Zhang, H.; Huang, W.; Lu, T.; Zhang, D.; Wang, H. Preparation of Immunoaffinity Column for AFB1 with Monoclonal Antibodies Immobilized on Protein A-Sepharose. Food Sci. 2015, 21, 193–198. [Google Scholar]
  34. Göbel, R.; Lusky, K. Simultaneous determination of aflatoxins ochratoxin A, and zearalenone in grains by new immunoaffinity column/liquid chromatography. J. AOAC Int. 2004, 87, 411–416. [Google Scholar] [CrossRef] [PubMed] [Green Version]
  35. Krska, R. Performance of modern sample preparation techniques in the analysis of Fusarium mycotoxins in cereals. J. Chromatogr. A 1998, 815, 49–57. [Google Scholar] [CrossRef]
  36. Li, P.; Zhang, Q.; He, T.; Zhang, Z.; Ding, X. Immunosorbent and Immunoaffinity Column for Aflatoxin M1 Nanobody and Preparation Method Thereof. U.S. Patent 2015/0276729 A1, 6 September 2016. [Google Scholar]
  37. Xie, J.; Sun, Y.; Zheng, Y.; Wang, C.; Sun, S.; Li, J.; Ding, S.; Xia, X.; Jiang, H. Preparation and application of immunoaffinity column coupled with dcELISA detection for aflatoxins in eight grain foods. Food Control 2017, 73, 445–451. [Google Scholar] [CrossRef]
  38. Ediage, E.N.; Van Poucke, C.; De Saeger, S. A multi-analyte LC–MS/MS method for the analysis of 23 mycotoxins in different sorghum varieties: The forgotten sample matrix. Food Chem. 2015, 177, 397–404. [Google Scholar] [CrossRef]
  39. Ardic, M.; Karakaya, Y.; Atasever, M.; Durmaz, H. Determination of aflatoxin B1 levels in deep-red ground pepper (isot) using immunoaffinity column combined with ELISA. Food Chem. Toxicol. 2008, 46, 1596–1599. [Google Scholar] [CrossRef]
  40. Arroyo-Manzanares, N.; Gámiz-Gracia, L.; García-Campaña, A.M. Determination of ochratoxin A in wines by capillary liquid chromatography with laser induced fluorescence detection using dispersive liquid–liquid microextraction. Food Chem. 2012, 135, 368–372. [Google Scholar] [CrossRef]
  41. Goryacheva, I.Y.; Karagusheva, M.A.; Van Peteghem, C.; Sibanda, L.; Saeger, S.D. Immunoaffinity pre-concentration combined with on-column visual detection as a tool for rapid aflatoxin M1 screening in milk. Food Control 2009, 20, 802–806. [Google Scholar] [CrossRef]
  42. Juan, C.; Zinedine, A.; Molto, J.C.; Idrissi, L.; Manes, J. Aflatoxins levels in dried fruits and nuts from Rabat-Salé area, Morocco. Food Control 2008, 19, 849–853. [Google Scholar] [CrossRef]
  43. Goryacheva, I.Y.; Saeger, S.D.; Delmulle, B.; Lobeau, M.; Eremin, S.A.; Barna-VetrÓ, I.; Van Peteghem, C. Simultaneous non-instrumental detection of aflatoxin B1 and ochratoxin A using a clean-up tandem immunoassay column. Anal. Chim. Acta 2007, 590, 118–124. [Google Scholar] [CrossRef]
  44. Yang, T.; Lv, Y.; Zhang, D.; Tang, Y.; Yuan, Y.; Zhang, H.; Wang, H. Preparation and Application of Immunoaffinity Column for Multi-mycotoxins. Chin. J. Anal. Chem. 2016, 44, 1243–1249. [Google Scholar]
  45. Hsie, A.W.; Brimer, P.A.; Mitchell, T.J.; Gosslee, D.G. The dose-response relationship for ethyl methanesulfonate-induced mutations at the hypoxanthine-guanine phosphoribosyl transferase locus in Chinese hamster ovary cells. Somat. Cell Mol. Genet. 1975, 1, 247–261. [Google Scholar] [CrossRef] [PubMed]
  46. Tergel; Tai, D.; Liu, G.; Daorna; Wang, R.; Guo, H.; Li, Y.; Li, Y. Establishment of Hypoxanthine Guanine Phosphoribosyl Transferase Mutant from Human Liver Cancer Cell Line HepG2. China Anim. Husb. Vet. Med. 2011, 38, 92–95. [Google Scholar]
  47. Kufer, P.; Lutterbüse, R.; Baeuerle, P.A. A Revival of Bispecific Antibodies. Trends Biotechnol. 2004, 22, 238–244. [Google Scholar] [CrossRef] [PubMed]
  48. Beatty, J.D.; Beatty, B.G.; Vlahos, W.G. Measurement of monoclonal antibody affinity by non-competitive enzyme immunoassay. J. Immunol. Methods 1987, 100, 173–179. [Google Scholar] [CrossRef]
  49. Delmulle, B.; Saeger, S.D.; Adams, A.; Kimpe, N.D.; Van Peteghem, C. Development of a liquid chromatography/tandem mass spectrometry method for the simultaneous determination of 16 mycotoxins on cellulose filters and in fungal cultures. Rapid Commun. Mass Spectrom. 2006, 20, 771–776. [Google Scholar] [CrossRef] [PubMed]
  50. Junsai, T.; Poapolathep, S.; Sutjarit, S.; Giorgi, M.; Zhang, Z.; Logrieco, A.F.; Li, P.; Poapolathep, A. Determination of Multiple Mycotoxins and Their Natural Occurrence in Edible Vegetable Oils Using Liquid Chromatography-Tandem Mass Spectrometry. Foods 2021, 10, 2795. [Google Scholar] [CrossRef] [PubMed]
  51. Akinyemi, M.O.; Braun, D.; Windisch, P.; Warth, B.; Ezekiel, C.N. Assessment of multiple mycotoxins in raw milk of three different animal species in Nigeria. Food Control 2022, 131, 108258. [Google Scholar] [CrossRef]
  52. Zhang, W.; Liu, Y.; Liang, B.; Zhang, Y.; Zhong, X.; Luo, X.; Huang, J.; Wang, Y.; Cheng, W.; Chen, K. Probabilistic risk assessment of dietary exposure to aflatoxin B1 in Guangzhou, China. Sci. Rep. 2020, 10, 7973. [Google Scholar] [CrossRef]
  53. Fan, K.; Ji, F.; Xu, J.; Qian, M.; Duan, J.; Nie, D.; Tang, Z.; Zhao, Z.; Shi, J.; Han, Z. Natural Occurrence and Characteristic Analysis of 40 Mycotoxins in Agro-Products from Yangtze Delta Region. Sci. Agric. Sin. 2021, 54, 2870–2884. [Google Scholar]
Figure 1. The inhibition curve of ic-ELISA: (a) AFB1; (b) OTA.
Foods 11 00335 g001
Figure 2. Effects of mutagen concentration and mutagenic treatment time on survival percentage (%) of the hybridoma cell line. (a) AFB1 hybridoma cell line E4; (b) OTA hybridoma cell line B3.
Foods 11 00335 g002
Figure 3. The growth curve of AFB1 hybridoma cell lines E4 and OTA hybridoma cell lines B3: (a) cell line E4 and E4-HGPRT in 6-TG; (b) cell line E4 and E4-HGPRT in the complete media; (c) cell line E4 and E4-HGPRT in HAT media; (d) cell line B3 and B3-TK in 5-BrdU; (e) cell line B3 and B3-TK in the complete media; (f) cell line B3 and B3-TK in HAT media.
Foods 11 00335 g003
Figure 4. The electropherogram of BsMAb: (a) ascites; (b) purified BsMAb.
Foods 11 00335 g004
Figure 5. The affinity constants (Ka) of anti-AFB1/OTA BsMAb: (a) AFB1; (b) OTA.
Foods 11 00335 g005
Figure 6. The coupling rate of different coupling times.
Foods 11 00335 g006
Figure 7. Optimization results of the IAC elution conditions: (a) the recovery of AFB1 and OTA with different kind of elution solution (n = 3); (b) the recovery of AFB1 and OTA with different ratios of methanol–water as elution solution (n = 3); (c) The recovery of AFB1 and OTA with different elution volume (n = 3).
Foods 11 00335 g007
Figure 8. Results of real sample detection by IAC-ELISA and LC-MS: (a) AFB1; (b) OTA.
Foods 11 00335 g008
Table 1. Parameters for ic-ELISA.
Target AnalyteAFB1OTA
Coating antigenAFB1-OVAOTA-OVA
Coating concentration (μg/mL)0.310.26
Coating buffer0.05 M carbonate buffer (pH 9.6)
Coating condition14 h, 4 °C
MAbAnti-AFB1 MAbAnti-OTA MAb
Standard analyteAFB1OTA
Competition condition30 min, 37 °C
HRP-IgG dilution1:5000
HRP-IgG incubation condition30 min, 37 °C
Table 2. IC50 and cross-reactivity (CR) of anti-AFB1/OTA BsMAb against related mycotoxins.
Mycotoxin AnalyteStructureIC50 (ng/mL)CR (%)
AFB1 Foods 11 00335 i0010.037100
AFB2 Foods 11 00335 i0020.10137
AFG1 Foods 11 00335 i0030.25215
AFG2 Foods 11 00335 i0043.5841
AFM1 Foods 11 00335 i0050.07748
AFM2 Foods 11 00335 i0060.37710
OTA Foods 11 00335 i0072.040100
OTB Foods 11 00335 i0085.62036
OTC Foods 11 00335 i009201.5351
ZEN Foods 11 00335 i010>1000<0.1
DON Foods 11 00335 i011>1000<0.1
FB1 Foods 11 00335 i012>1000<0.1
T-2 Foods 11 00335 i013>1000<0.1
Table 3. Column capacity and preservation rate of AFB1 and OTA in 7 cycles (n = 3).
CycleAFB1OTA
Column Capacity (ng)Preservation Rate (%)Column Capacity (ng)Preservation Rate (%)
1165.0100.0171.1100.0
2162.598.5169.599.1
3159.096.4166.497.3
4153.693.1156.291.3
5147.589.4145.885.2
6128.978.1133.377.9
7114.469.3116.368.0
Table 4. Results of spiked recovery experiments of corn and wheat samples with IAC-ELISA and LC-MS (n = 2).
SamplesAnalyteSpiked Concentration (μg/kg)IAC-ELISALC-MS
Measured (μg/kg)Recovery (%)CV (%)Measured (μg/kg)Recovery (%)CV (%)
Corn 0AFB10ND aNC bNCNDNCNC
OTA0NDNCNCNDNCNC
Corn 1AFB110095.695.65.097.397.33.3
OTA10098.698.64.597.997.93.5
Corn 2AFB15049.298.44.749.899.63.3
OTA5049.198.24.449.498.83.1
Corn 3AFB12019.296.04.319.296.03.5
OTA2019.698.04.419.296.03.2
Corn 4AFB1109.999.03.49.898.03.8
OTA1010.3103.04.29.898.03.6
Corn 5AFB144.1102.52.63.895.03.2
OTA44.2105.02.43.997.53.5
Wheat 0AFB10NDNCNCNDNCNC
OTA0NDNCNCNDNCNC
Wheat 1AFB110099.199.14.898.298.23.1
OTA10098.998.94.697.597.53.1
Wheat 2AFB15047.795.44.548.797.43.8
OTA5047.795.43.349.298.43.5
Wheat 3AFB12019.597.54.019.296.03.2
OTA2019.497.03.319.798.5 3.1
Wheat 4AFB1109.696.03.39.898.03.8
OTA109.999.03.29.999.03.5
Wheat 5AFB143.997.53.13.997.53.2
OTA43.997.52.84.0100.03.8
a ND, not detectable. b NC, not calculated.
Publisher’s Note: MDPI stays neutral with regard to jurisdictional claims in published maps and institutional affiliations.

