
Application of Fractals to Evaluate Fractures of Rock Due to Mining


1
School of Civil Engineering, Xuchang University, Xuchang 461000, China
2
School of Resources and Geosciences, China University of Mining and Technology, Xuzhou 221116, China
*
Author to whom correspondence should be addressed.
Fractal Fract. 2022, 6(2), 96; https://doi.org/10.3390/fractalfract6020096
Submission received: 20 December 2021
/
Revised: 24 January 2022
/
Accepted: 8 February 2022
/
Published: 10 February 2022
(This article belongs to the Section Engineering)
Abstract
:Fractures caused by mining are the main form of water inrush disaster. However, the temporal and spatial development characteristics of fractures of the rock mass due to mining are not clearly understood at present. In this paper, two geometric parameters, namely, fractal dimension and fracture entropy, are proposed to determine the spatial and temporal states of rock mass fractures caused by mining. The spatial and temporal structure characteristics of fractures in the rock mass due to mining are simulated with physical scale model testing based on digital image processing technology. A spatiotemporal model is created to examine the spatial and temporal patterns of hot and cold spots of the fractures based on a Geographic Information System (GIS). Results indicate that the fractal dimensions and entropy of the fractures network in the rock mass increase and decrease with the progression of mining, respectively, which can be examined in three stages. When the fractal dimension of the fractures in rock mass rapidly increases, the conductive fracture zone has a saddle shape. The fracture entropy of fracture has periodic characteristics in the advancing direction of the panel, which reflects the characteristics of periodic weighting. The fractal dimension and fracture entropy of fractures of the rock mass increase with time, and the rock mass system undergoes a process of increasing entropy. When the fractal dimension and fracture entropy of the fractures increase, the spatiotemporal state of fractures in rock mass caused by mining is initiated. When the fractal dimension and fracture entropy of the fractures decrease, the spatiotemporal state of fractures in rock mass is closed.
1. Introduction
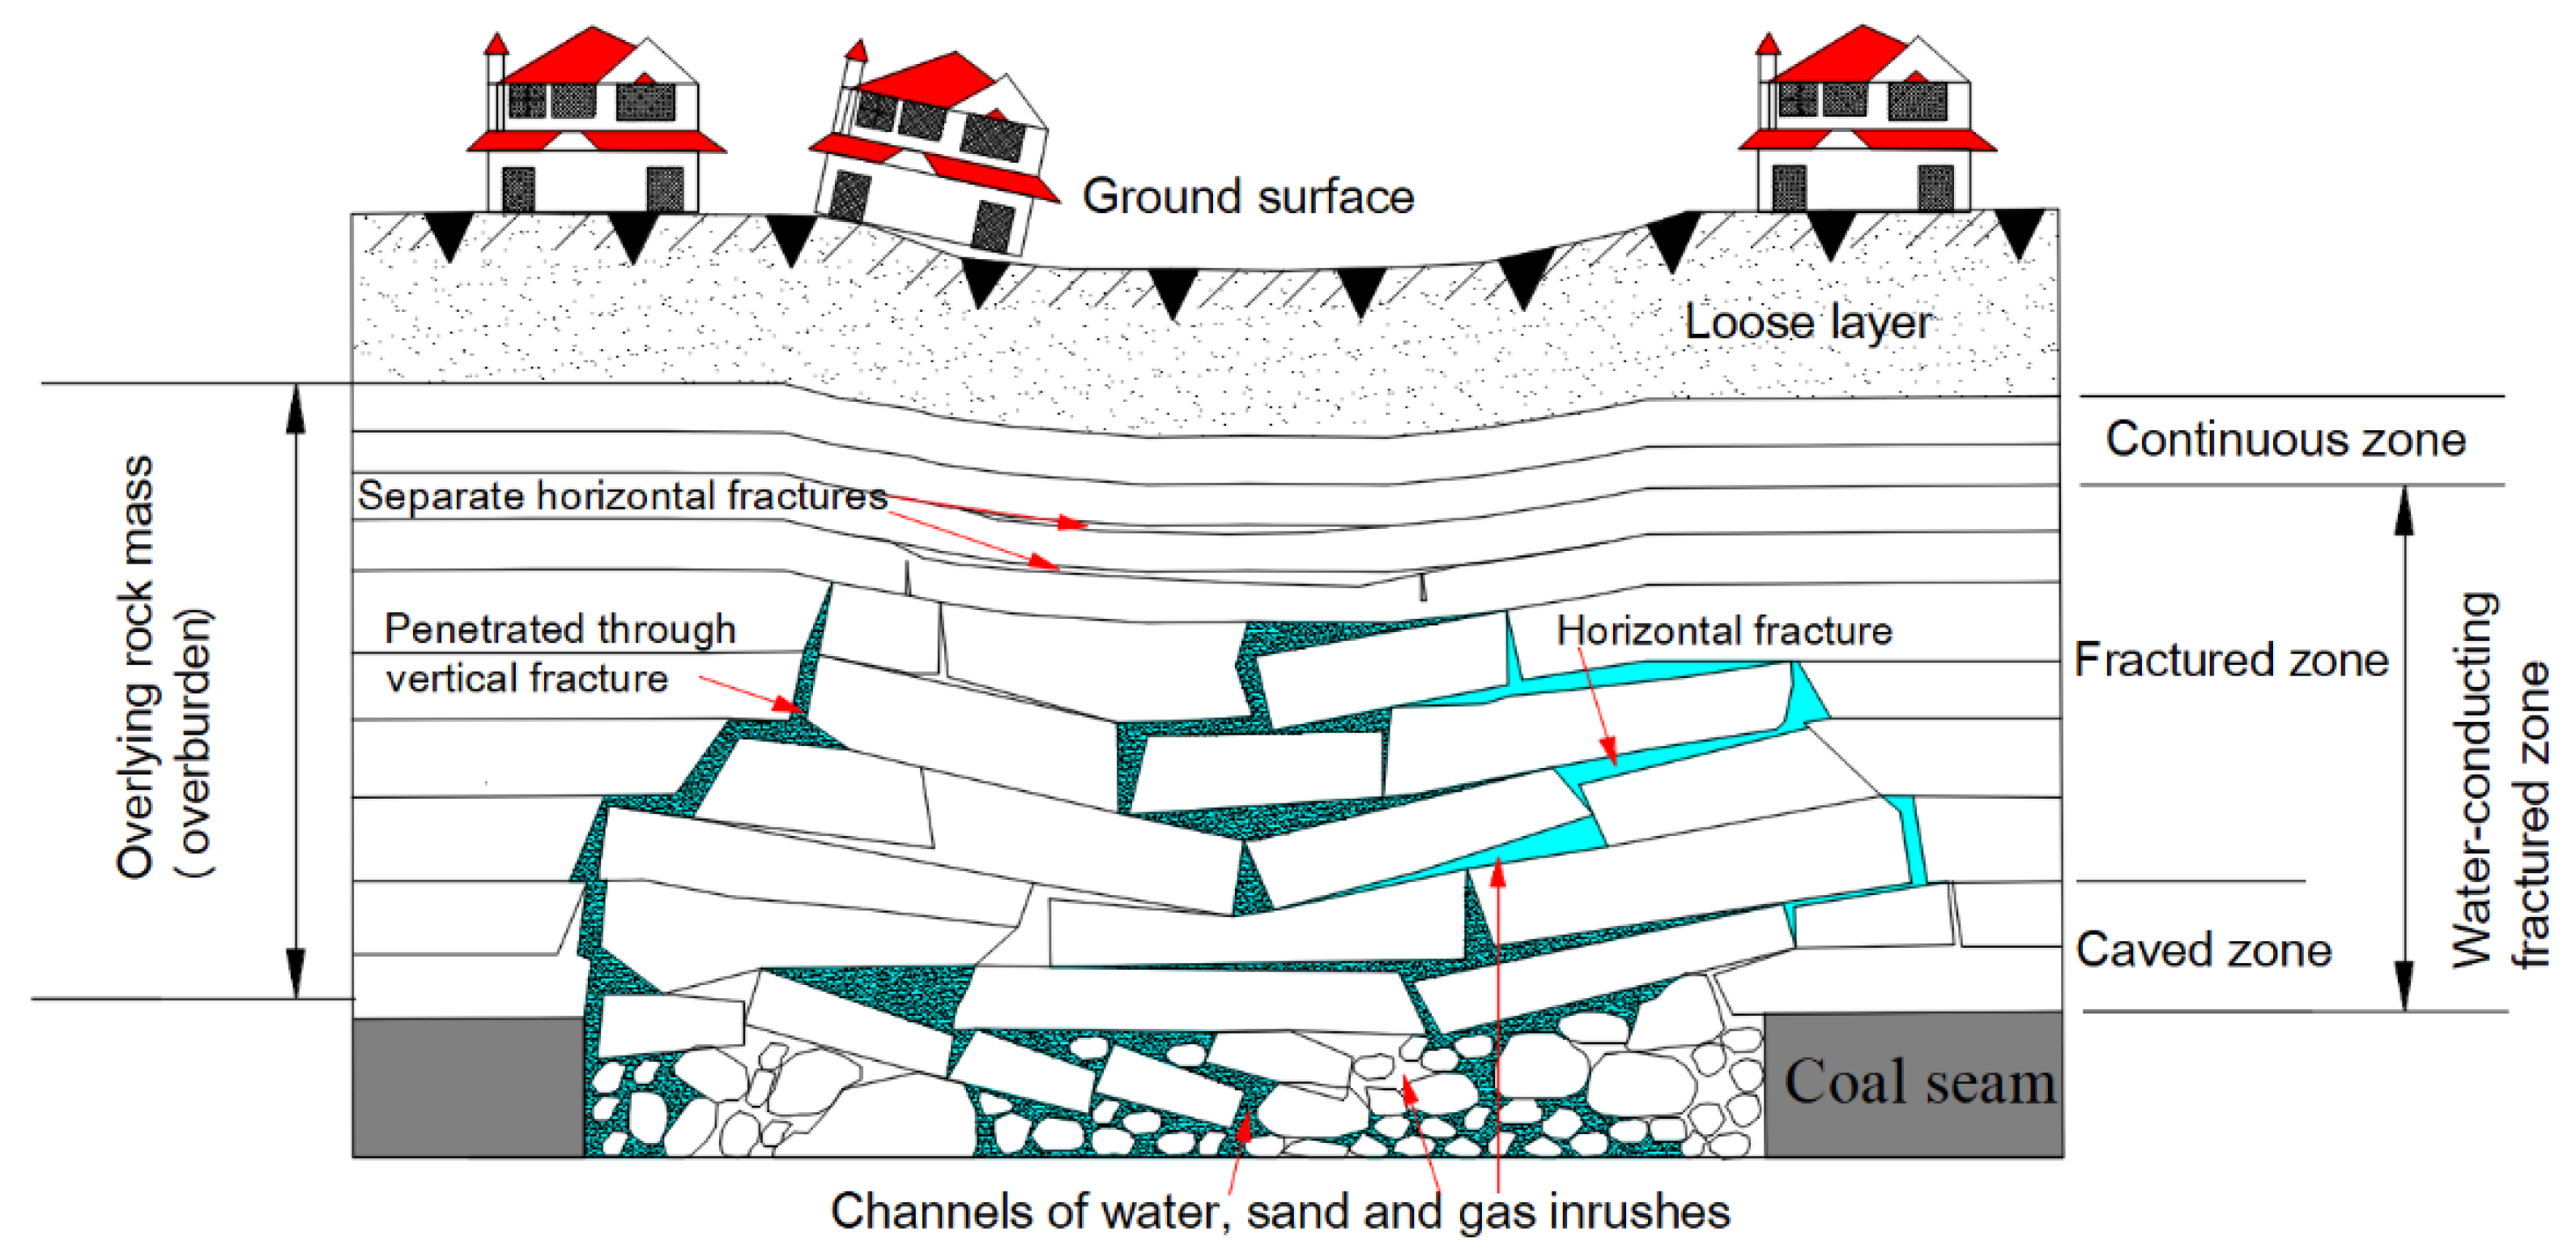
There are many micro and macro primary fractures in a rock mass, such as joints, bedding and faults. Coal seams have significant impacts on the rock mass especially when they are mined, because mining may cause fracturing of the rock mass, which can cause water and gas leakage [1,2]. Fractures will destroy the stability of the rock mass and even lead to water and sand inrushing, damage to groundwater resources, coal seam gas disasters, mining damage and surface environmental damage [3,4]. When coal seams are mined, bending, sinking and fracturing of the rock mass commonly take place as shown in Figure 1. Fluid migration and infiltration primarily occur through the rock mass fractures, especially in the conductive fracture zone, which includes the fractured and caved zones [5]. The permeability in the vertical direction is obviously greater than that in the bedding direction, and the aquifer as the porous medium is fractured [6,7,8]. The main purpose of research of fractures of the rock mass due to mining is to determine the location, development degree, state and change rule of fractures due to mining and establish a quantitative prediction method for determining the degree of development of such fractures. Therefore, the study of fractal changes of the rock fracture network is of great significance to ensure safe mining under aquifers and to realize cleaner production in mines.
In 1967, a fractal geometric theory was proposed by Mandelbrot [9,10,11], which can be used to define the fracture networks in rock mass. Another approach that can be used to define the development of fractures is the use of fractal theories, employing the self-similar properties of the rock mass [12], because fracture networks have scaling behaviors and therefore rock mass, which can be used to scale up the network to larger scales. In the same way, the fractures network formed by regenerated fractures also has fractal characteristics for new or primary cracks of the rock mass due to mining and other reasons.
The OM, SEM and XCT two-dimensional images of rocks were analyzed by Alfonso et al. [13] based on the box counting method. The fractal dimension was obtained using the power-law distribution of the three types of images. Zhang et al. analyzed the fractal characteristics of the scale and distribution of the fracture network caused by mining under different stress conditions, and found that the fractal dimension of fracture network size distribution varies with mining stress conditions, resulting in differences in coal seepage capacity [14]. High speed camera and digital speckle methods are more effective for image acquisition of coal and rock fractures in the mining process. The fractal method can effectively and quantitatively describe the evolution process of coal and rock fractures under dynamic load [15].
Due to the complexities and heterogeneity of fracture networks in a rock mass when mining is carried out, it is difficult to define fractures using conventional fractal geometry concepts. The fractures in the rock mass due to mining are crisscrossed and unevenly distributed, and the fracture development direction is disorderly and random [16,17]. Therefore, new parameters need to be considered to quantitatively describe the distribution characteristics of fracture development direction. Information entropy theory was proposed by Shannon in 1948 [18,19].
where S is the information entropy and pi is the probability of the occurrence of certain information, where the information entropy reflects the degree of disorder of the system information. The degree of disorder of the system decreases as the information entropy increases.
The uncertainty of information sources can be described by information entropy. Therefore, different entropy measures, including probabilistic, fuzzy and mixed entropies, can be used to quantitatively describe the randomness, fuzziness and compound uncertainty of uncertain information [20]. Ye et al. proposed a geological entropy method to estimate the relationship between permeability and connectivity of a two-dimensional fracture network [21]. Therefore, entropy can be used to describe the directional distribution characteristics of fracture development or the degree of disorder of the fracture system.
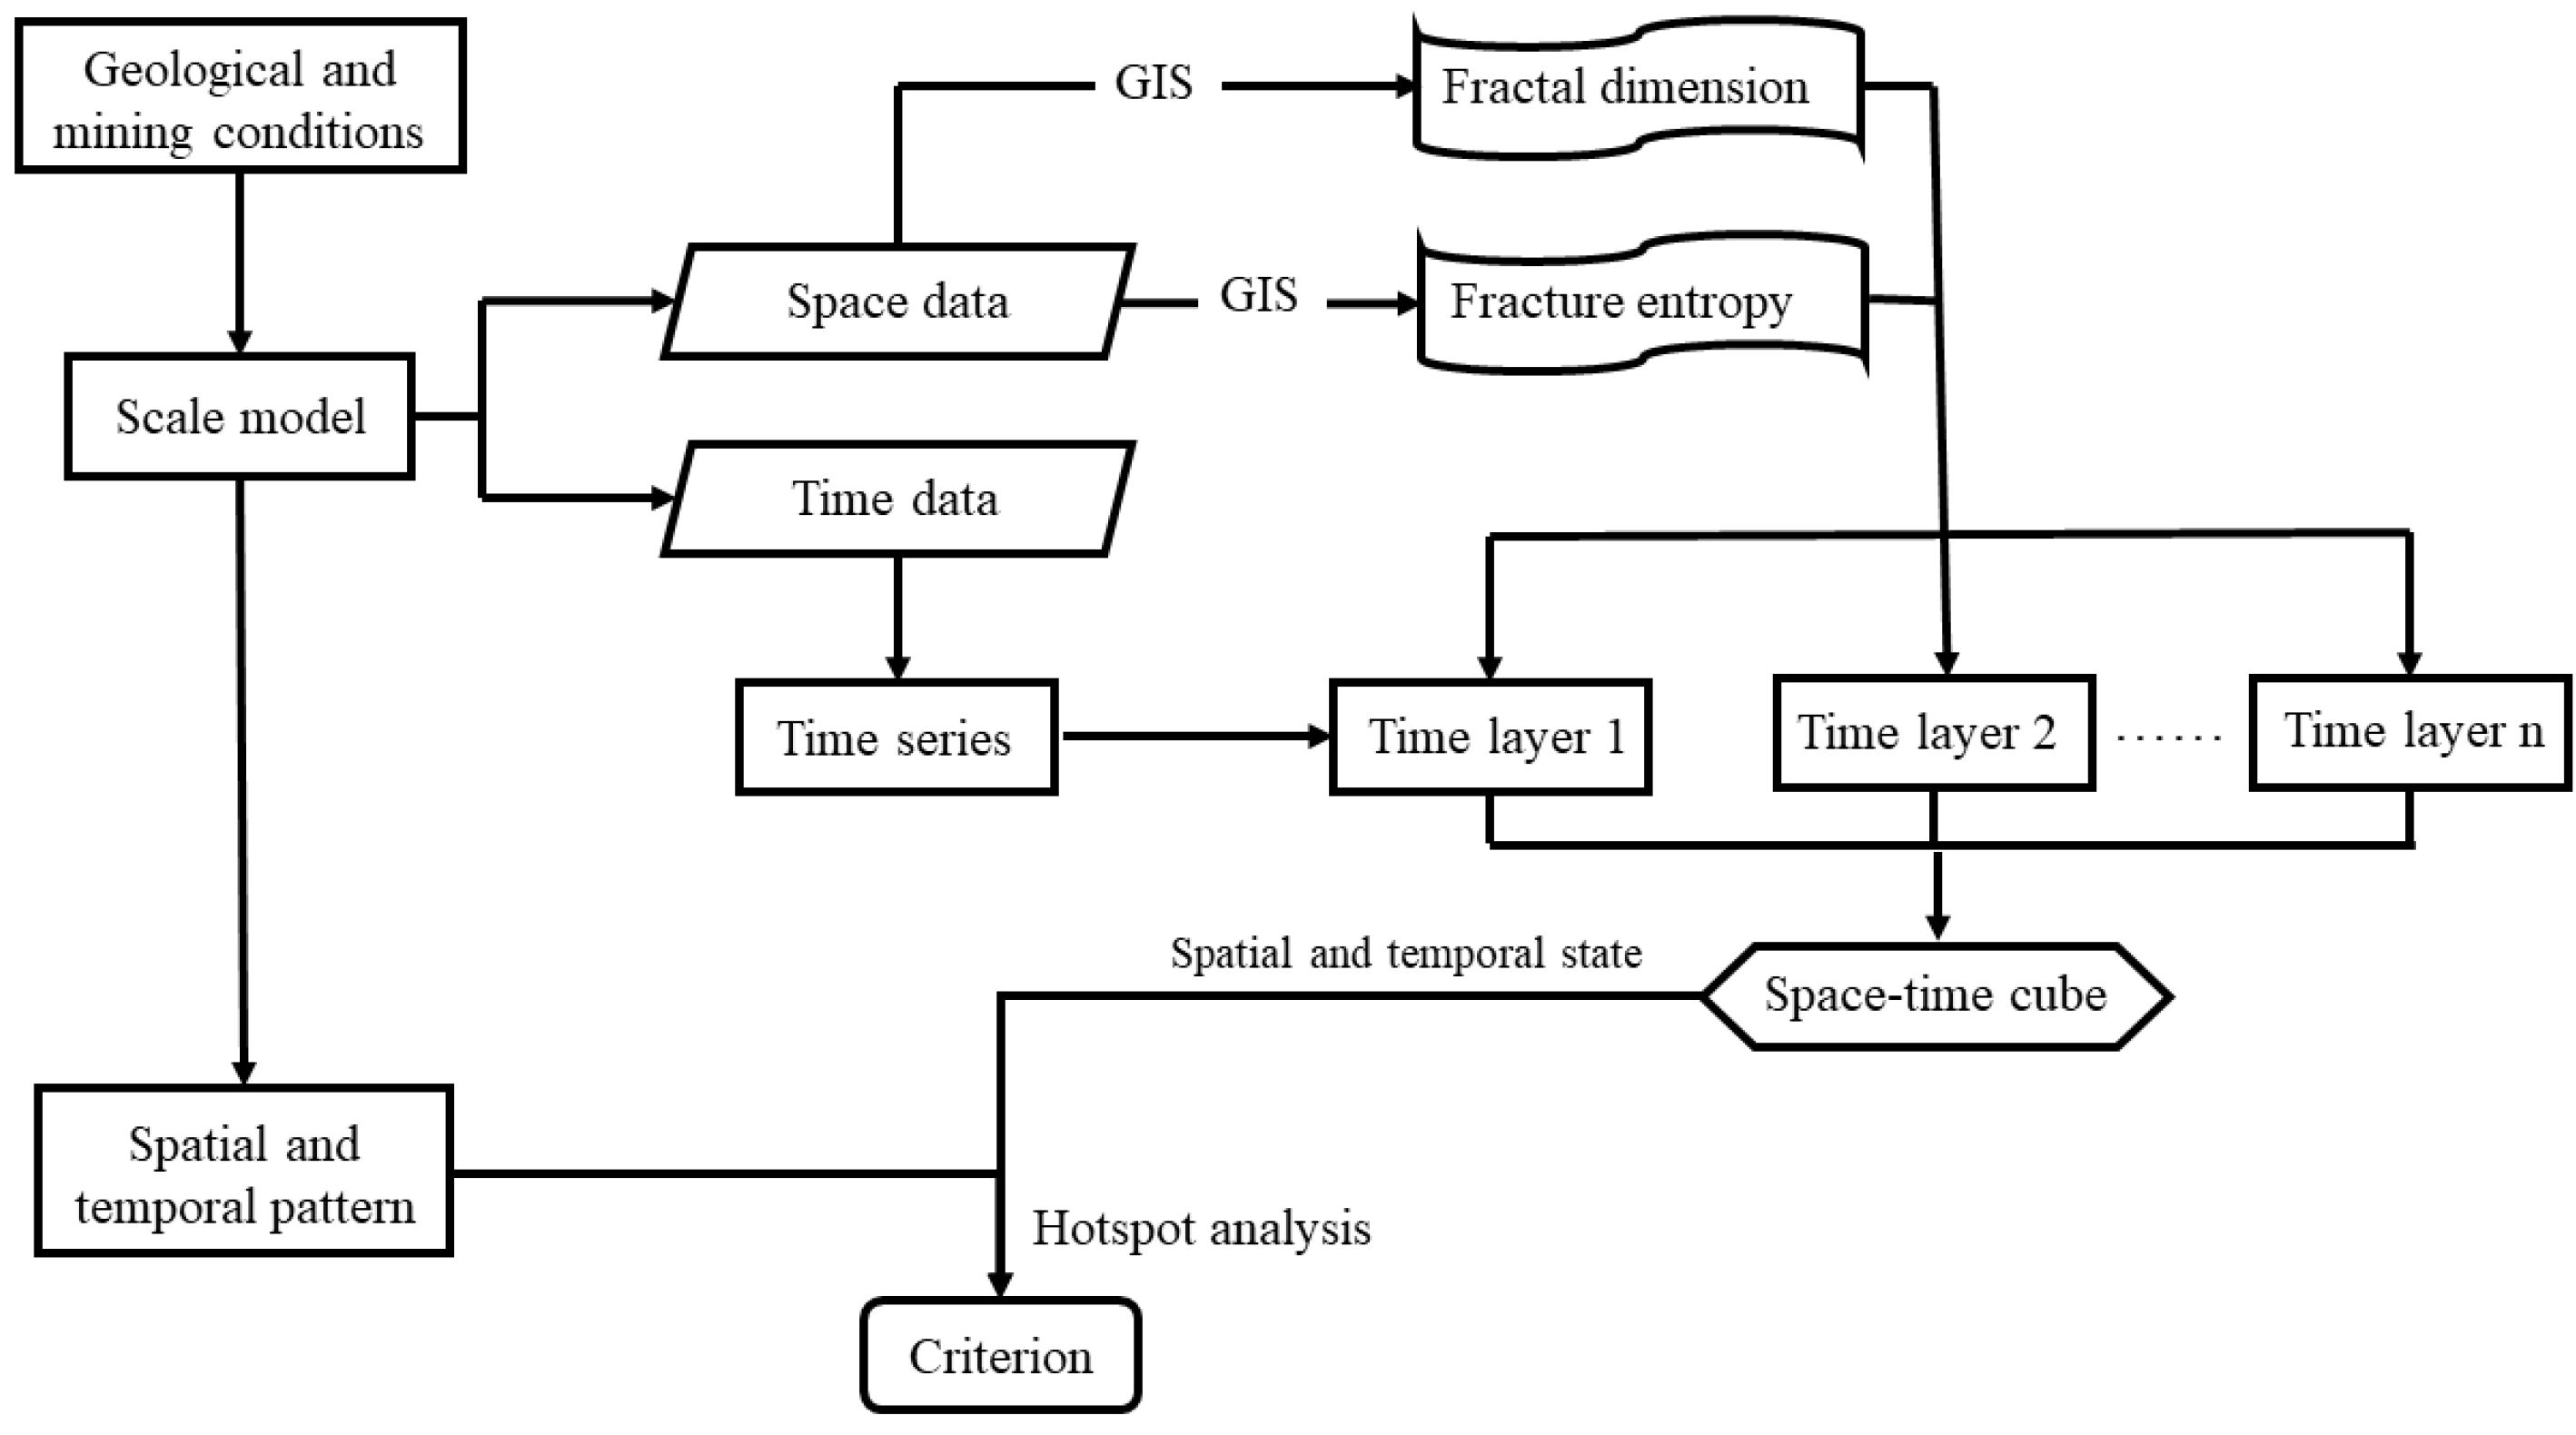
In this paper, the development and changes in rock mass fractures due to coal seam mining are examined. Two geometric parameters, namely fractal dimension and fracture entropy, are proposed to determine the spatial and temporal states of the rock mass fractures due to mining. The relationship between the length of the fractures and fractal dimension is established. A space–time cube is created to analyze the spatial and temporal characteristics of the rock mass fractures due to mining with the use of GIS by investigating the time and space dimensions.
2. Material and Methods
Hagerstrand [22] first proposed the concept of the space–time cube for spatiotemporal visualization analysis. The space–time cube is used to study behaviors by using two-dimensional coordinate axes for the position of the planes (x–y coordinates), which represent space in the real world, and a time axis for the changes in the position of a plane with time [23,24]. A 3D space–time cube is therefore formed from the x–y coordinate axes and the time axis. The spatiotemporal data used in this paper were temporal, spatial and attribute information. Then, a visualization model for space and time based on a space–time cube and GIS was developed to analyze the fractures due to rock mass failure caused by coal seam mining, as shown in Figure 2, with the following steps:
2.1. Scale Model Testing
Physical scale model testing is a widely used method in which the formation process and distribution of fractures in the rock mass can be reproduced. The evolution of fracturing of the rock mass in a deep mine due to the mining of a coal seam with a large dip was examined by Ye et al. [25], who used a physical scale model in a laboratory to investigate the stress on the rock mass and displacement of the rock mass. Scale model testing is a technique that is based on the theory of similitude, which is used to study complex problems based on similarities and analogies between objects or phenomena [26]. In scale model testing, similar conditions are determined first, which include geometric, mechanical, stress, deformation and failure similarities:
where Cl, Cσ, Cρ, Cε, Cμ, CE, Cc and Cφ are similarity constants, including the geometry size, stress, density, strain, Poisson’s ratio, modulus of elasticity, cohesion, and internal friction angle, respectively; and P and m denote the prototype and model, respectively. The similarity criteria and constants were determined based on the similarity principle. A prototype of the coal seam panel was based on a similarity model. Coal seam mining was simulated with the model, and spatiotemporal data were collected.
2.2. Establishing Fractal Dimension and Fracture Entropy
Mandelbrot [9] first proposed the fractal geometry theory, which has become a powerful tool for examining complex systems and characterizing random structures. The fractal theory and methods have been extensively applied in geotechnical engineering as a topographic technique for geographic analysis of various applications [27,28]. The complexities of the changes in fracture networks can be quantitatively explained using the fractal dimension, which is a ratio that compares the changes in a pattern with changes in scale. In recent years, the box counting method has been commonly used to find the fractal dimensions of an object. The fractal dimension is calculated as follows:
where N(s) is the number of units that are needed to cover a box with a length of s.
Information entropy, which is one of the most popular methods in making decisions based on GIS, measures the amount of uncertainty. The directional characteristics of the development of rock mass fractures in a mine are not known, so entropy of the fracturing is proposed to describe the directional distribution characteristics or the extent of the distribution of fracture development in the rock mass based on probabilistic entropy. Fracture entropy is defined as follows:
where pi is the density or area of the position, m is the total density or area, and n is the number of azimuth intervals.
2.3. Use of Space–Time Cubes
Space–time cubes are created in GIS to produce models that visualize and analyze 2D and 3D spatial and temporal data. A time series is used that integrates space and time in the model-led analysis. The location of the elements does not change with time, and attributes or measurements are collected with time. Time-stamped point features are structured into a data cube with Network Common Data Form (netCDF) datasets that have columns of space and time. All observations of the columns are calculated over the time of the defined position of a cube within each column.
The Mann–Kendall trend test is a statistical method for trend analysis to determine whether a trend is upward or downward for a variable over time or if there a trend in a time series [29]. If a time series Y is defined with n samples, then Hypothesis A is defined as follows: Every time series Y is independent of each other with random probability and the same distribution of samples. The alternative Hypothesis B is defined as follows: For any i, j ≤ n, i ≠ j, and the distribution of Yi and Yj is different.
The test statistics T are defined as follows:
The statistical approximation follows a normal distribution, and the average value is 0 when n ≥ 10. The variance is:
The standardized test statistics Z are:
The saliency level is defined as a, and then the confidence level is p = 1 − a, . In this study, there was a distinct trend of changes in the time series, and Hypothesis A was excluded. Therefore, the Z score could be used to determine the characteristics of the trend of the time series and is provided in Table 1.
3. Spatiotemporal Data Sampling
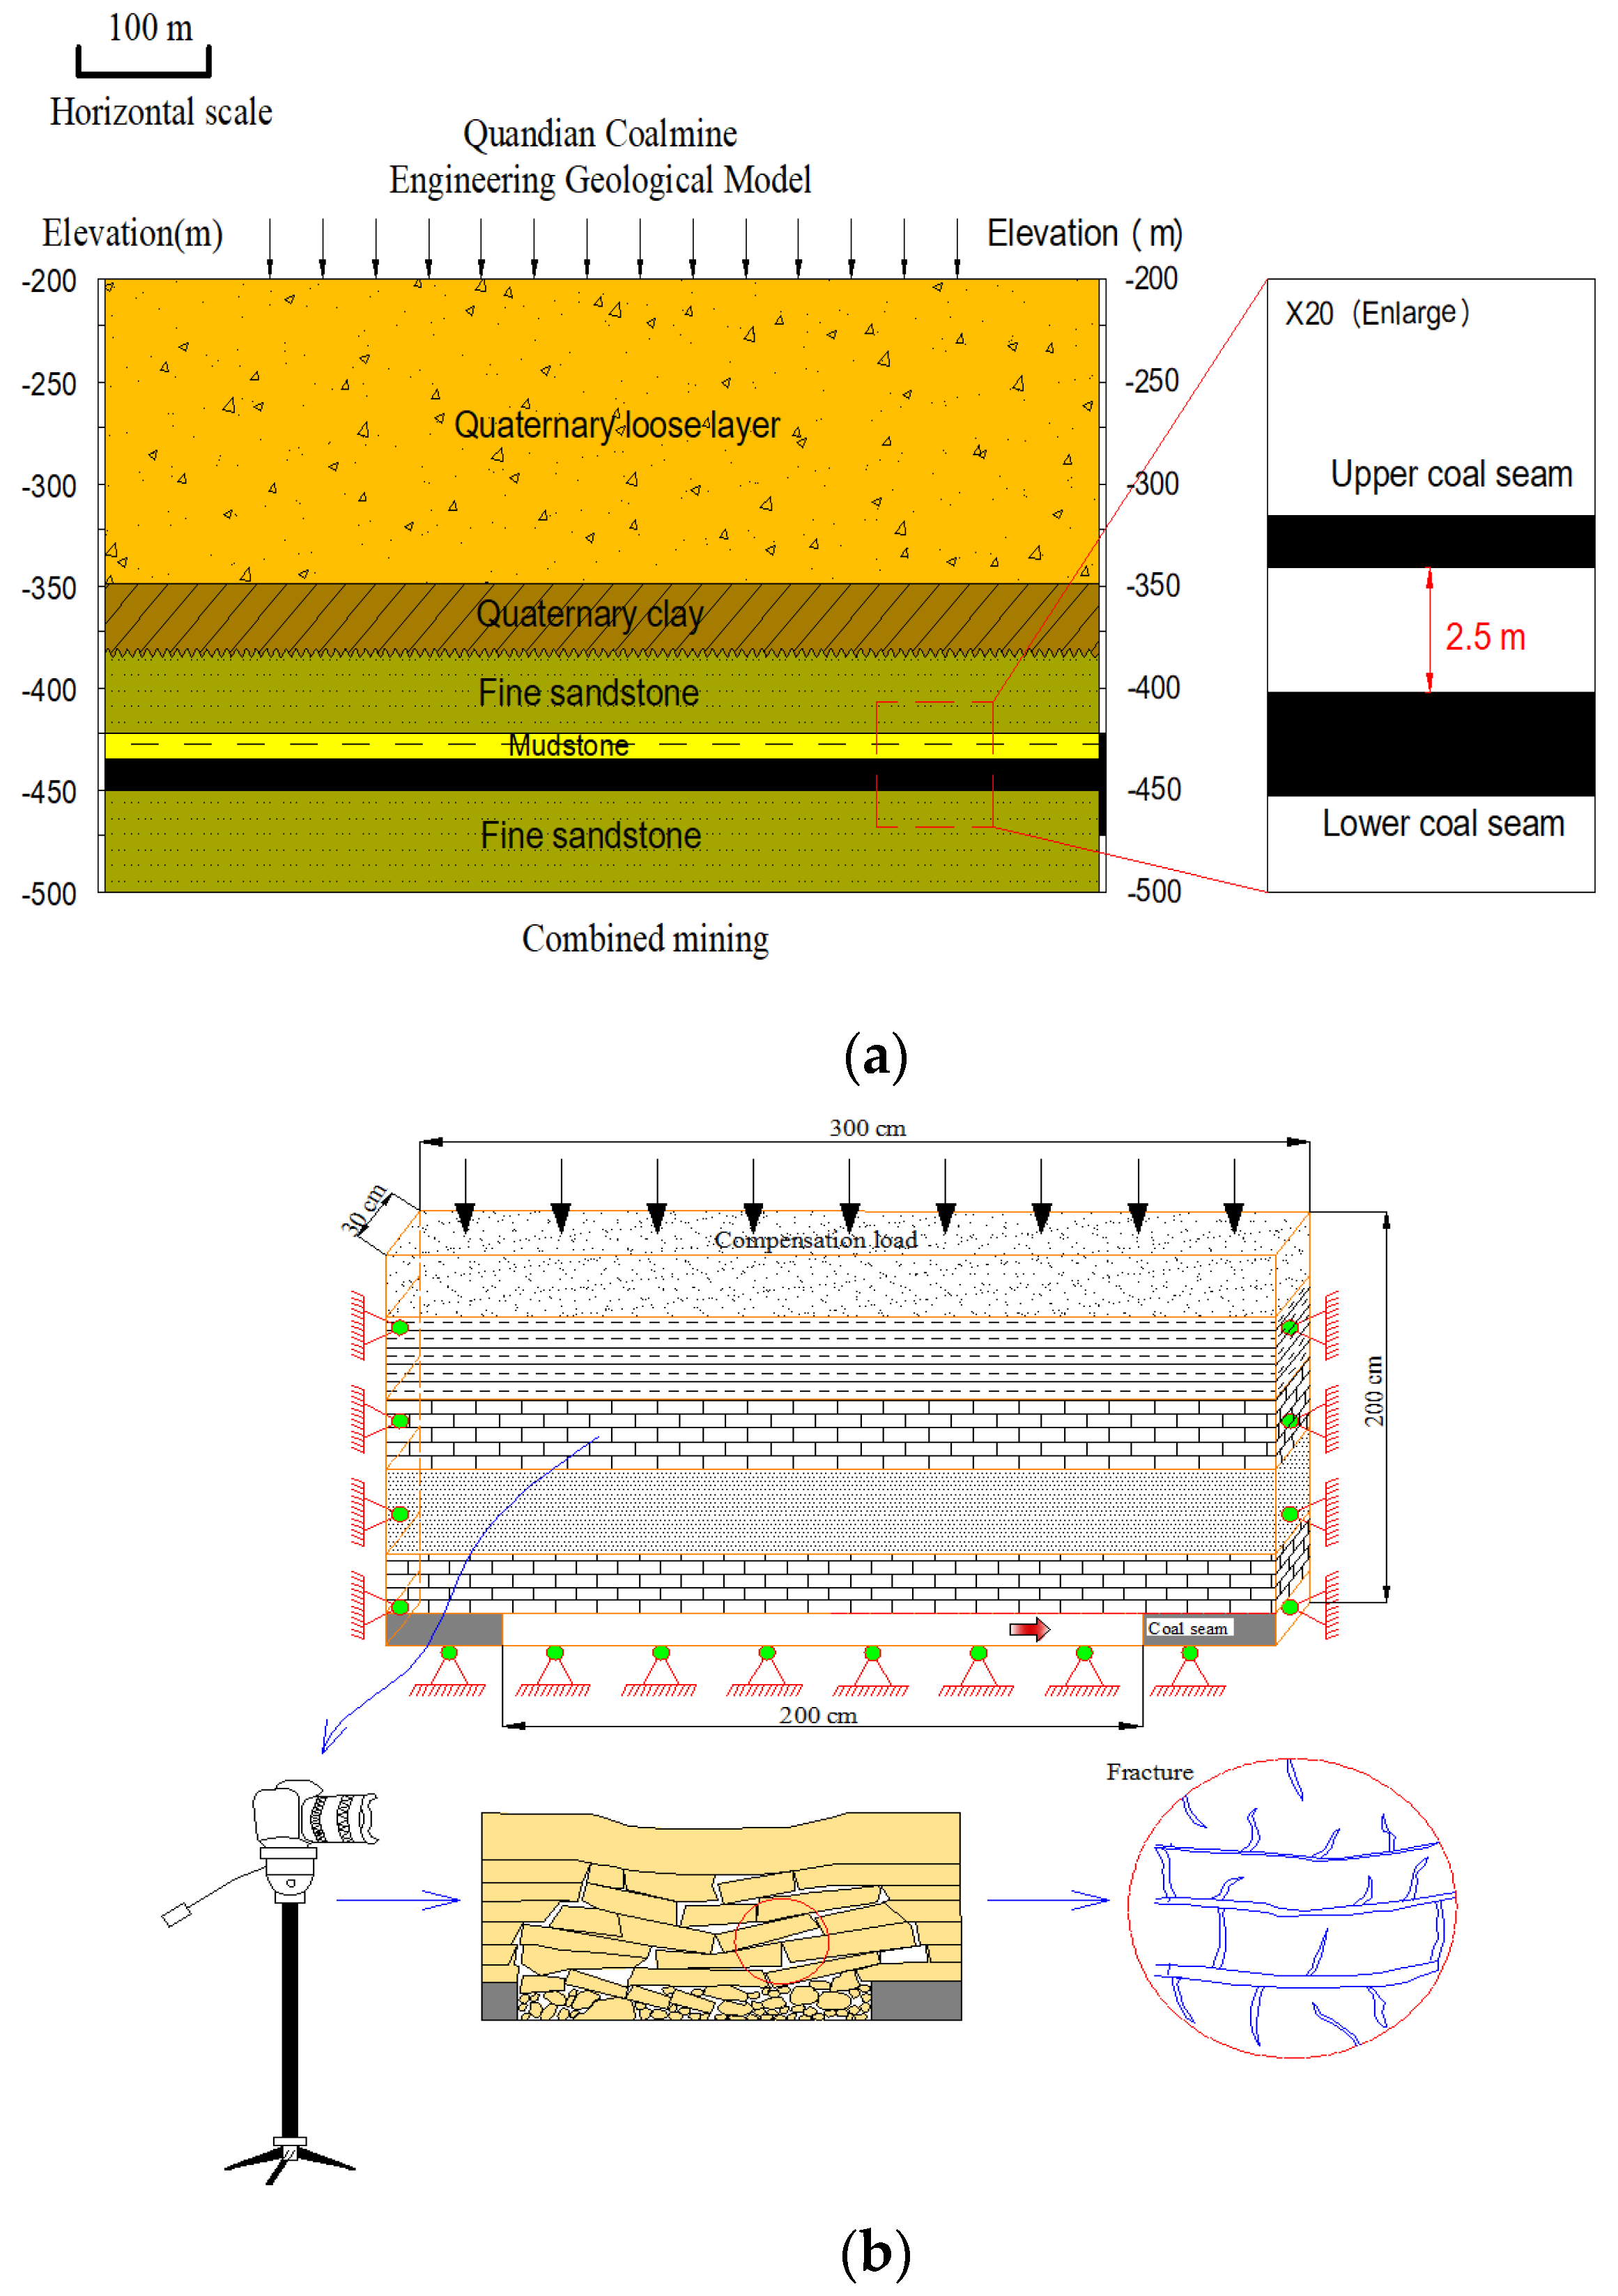
In this study, a physical model was established based on geological conditions, including the thickness of coal seams and the physical and mechanical properties of the rock mass of panels in the Quandian coal mine in China. However, the interburden between seams in the Quandian mine is less than 2.5 m, and combined mining is used in longwall caving mining, as shown in Figure 3a. First, the fracture characteristics of the rock mass due to combined mining were tested by us using a physical model, as shown in Figure 3b. The coal seams were found to be under Cenozoic sediments with an average thickness of 220 m. The average thickness of all the coal seams was determined to be 8 m. The rock mass, which is located above the coal seams, was found to have a thickness that ranges from 0 to 150 m.
The simulation of similar materials required the scale model to have geometric and kinematic similarities, similar boundary conditions, and similar physical proportions. The pressure on the Cenozoic sediments above the rock mass is from external loading. A similarity model was then created with different amounts of barite, sand, gypsum and water. The compressive strength of this similarity model had to be tested before scale model testing was carried out. The geometric dimensions of the models were 300 cm × 30 cm × 200 cm (length × width × height), with a geometric similarity of Cl = 200, as shown in Figure 3b.
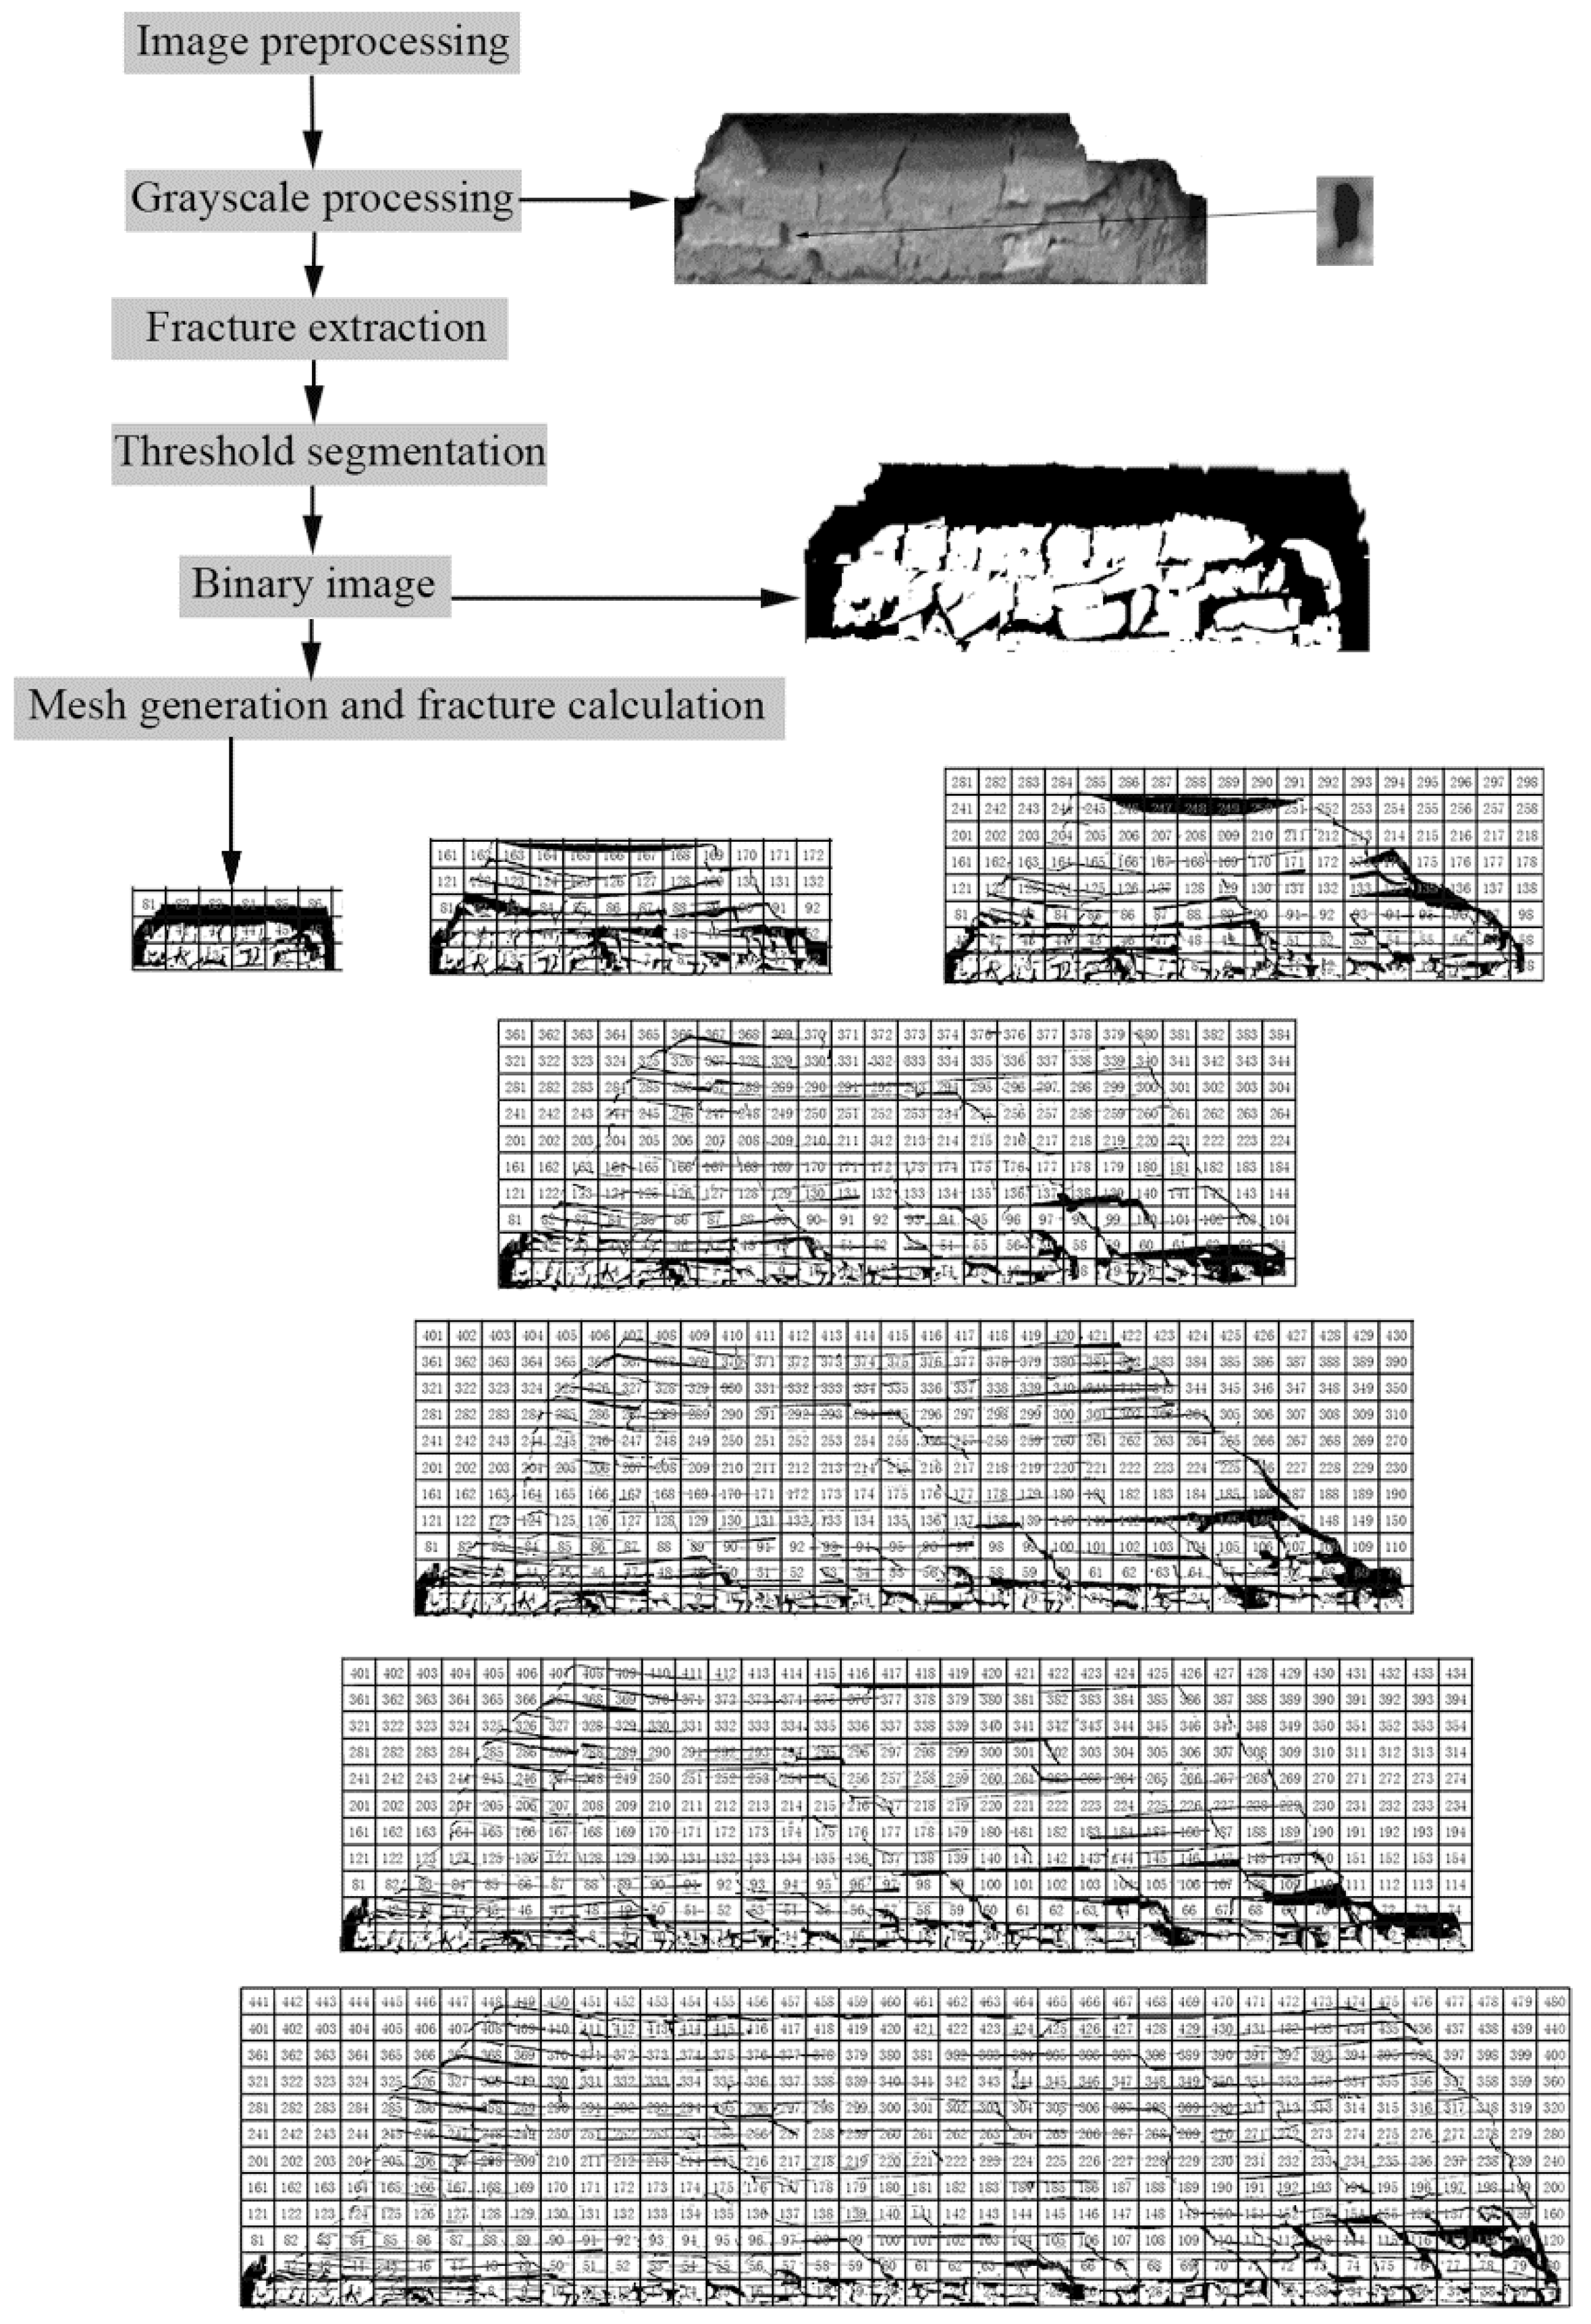
The coal seams in the mine were excavated by longwall caving. Then, images of the fractures were taken with a digital camera, and converted into binary images using a digital image processing program as shown in Figure 4. The RGB images were converted into greyscale images using the following formula:
where the Greyscale level is the greyscale value of the image to be processed; and red (R), green (G), and blue (B) are the corresponding color values of each layer in the matrix of the original image. Then, the greyscale images were converted into binary images using threshold segmentation, and the changes in the fracture networks due to mining were obtained. In order to better illustrate the development of the fracture state due to mining, an 8 × 10 m mesh was divided to study the fractal dimension and fracture entropy, in addition to the relationship between the fractal dimension and fracture state in each mesh, as shown in Figure 4.
4. Results
4.1. Fractal Characteristics of Fractures of the Rock Mass Due to Mining
The fracture network simultaneously expanded along the advancing and vertical directions of the rock mass as the mined distance increased. The fractal dimension of the fracture network was calculated using the box counting method, as shown in Table 2.
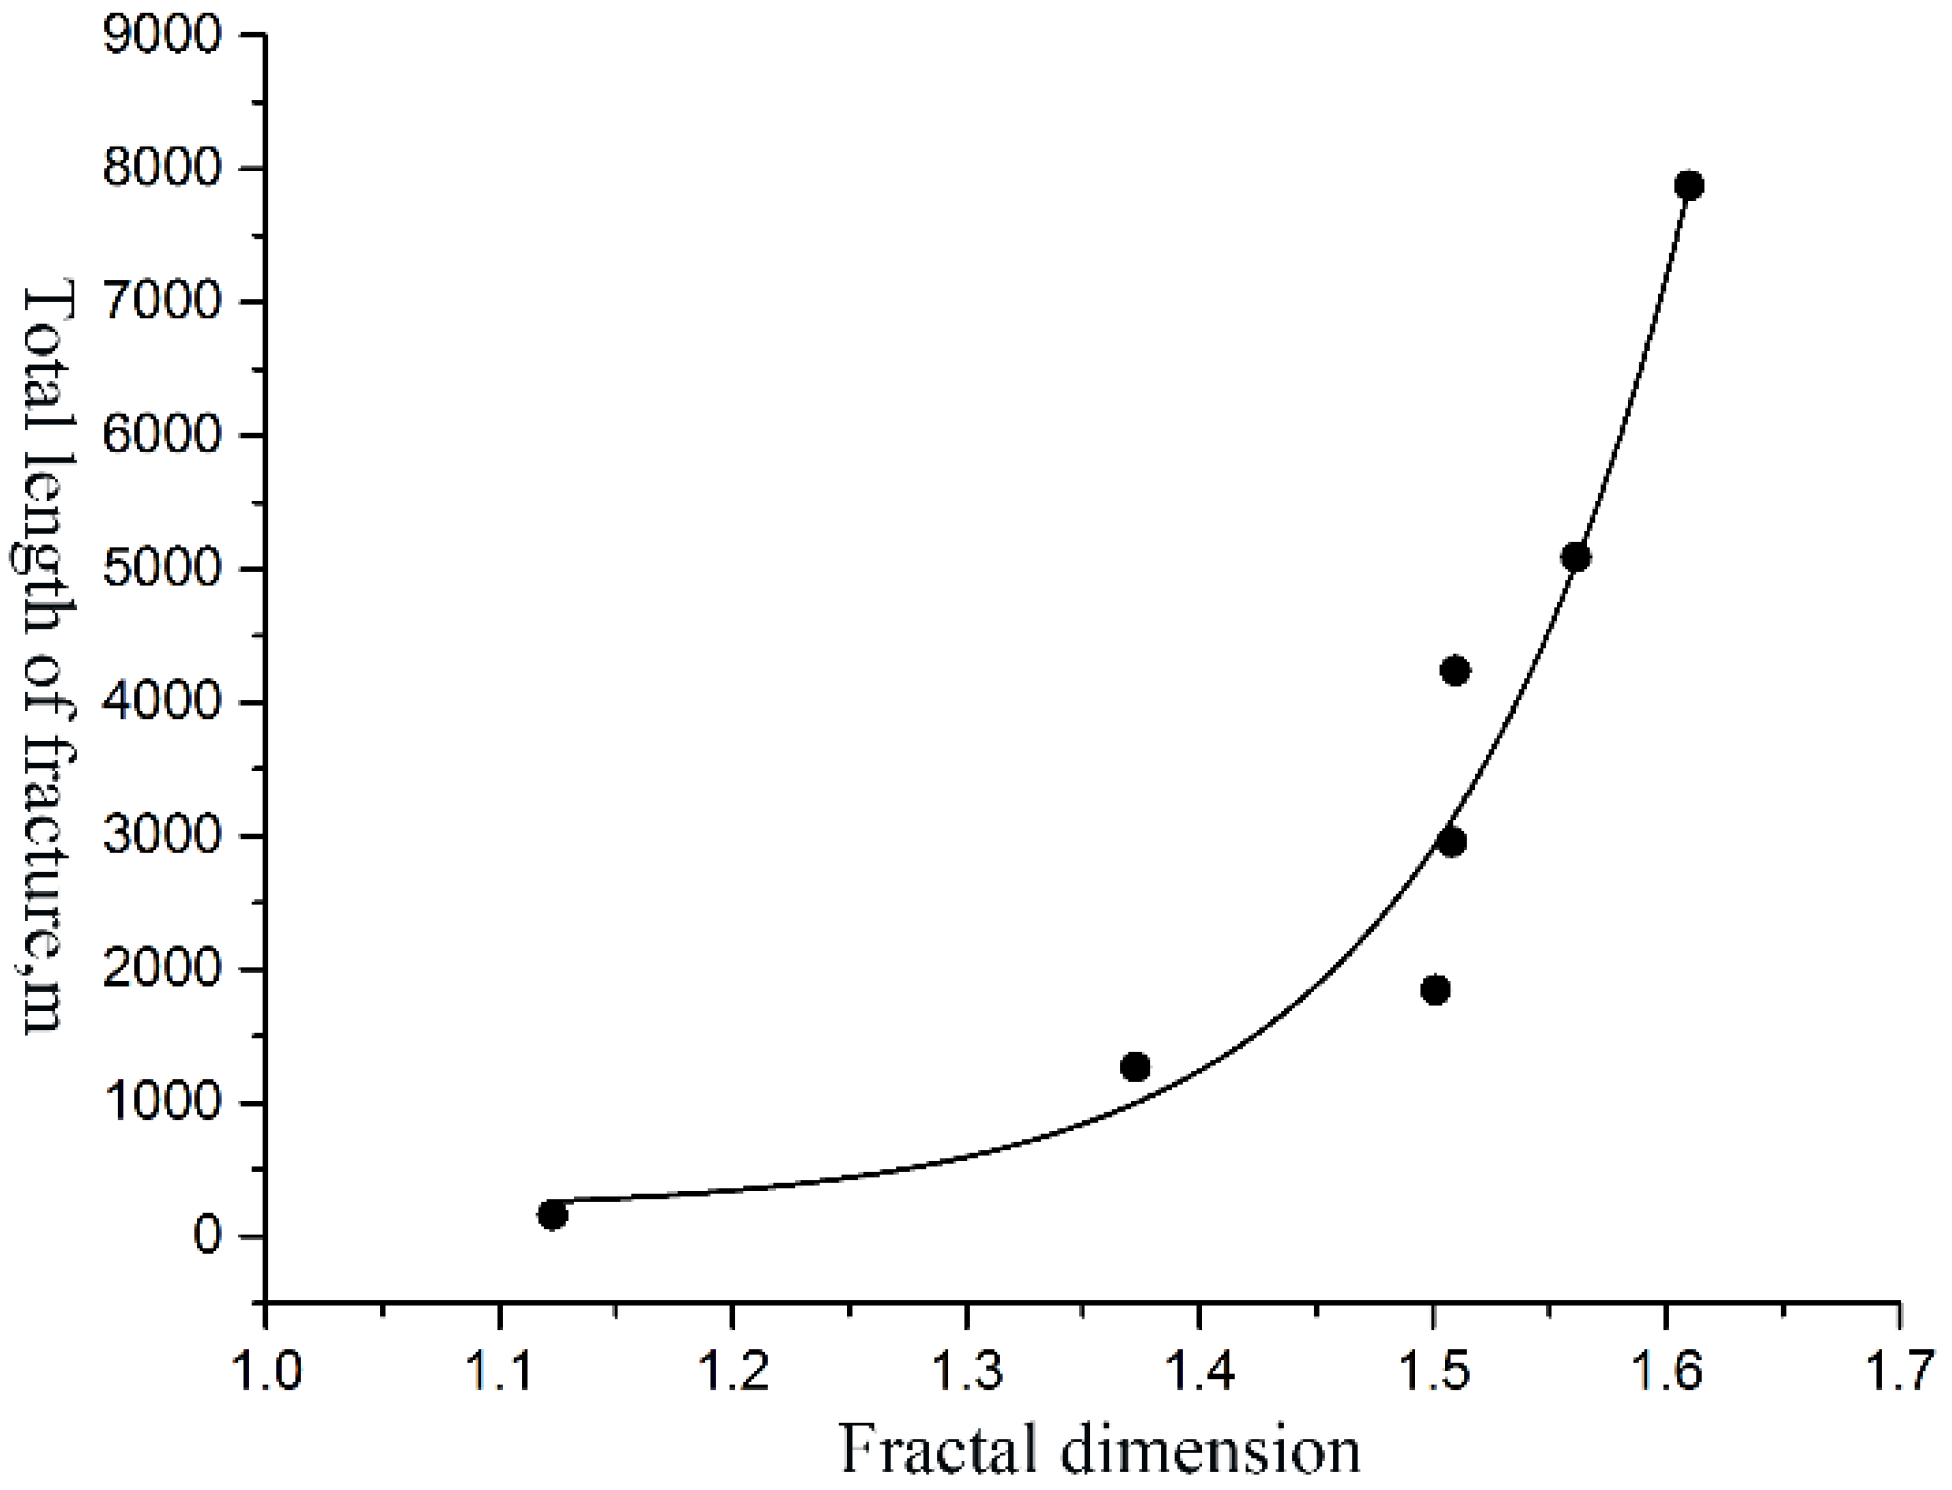
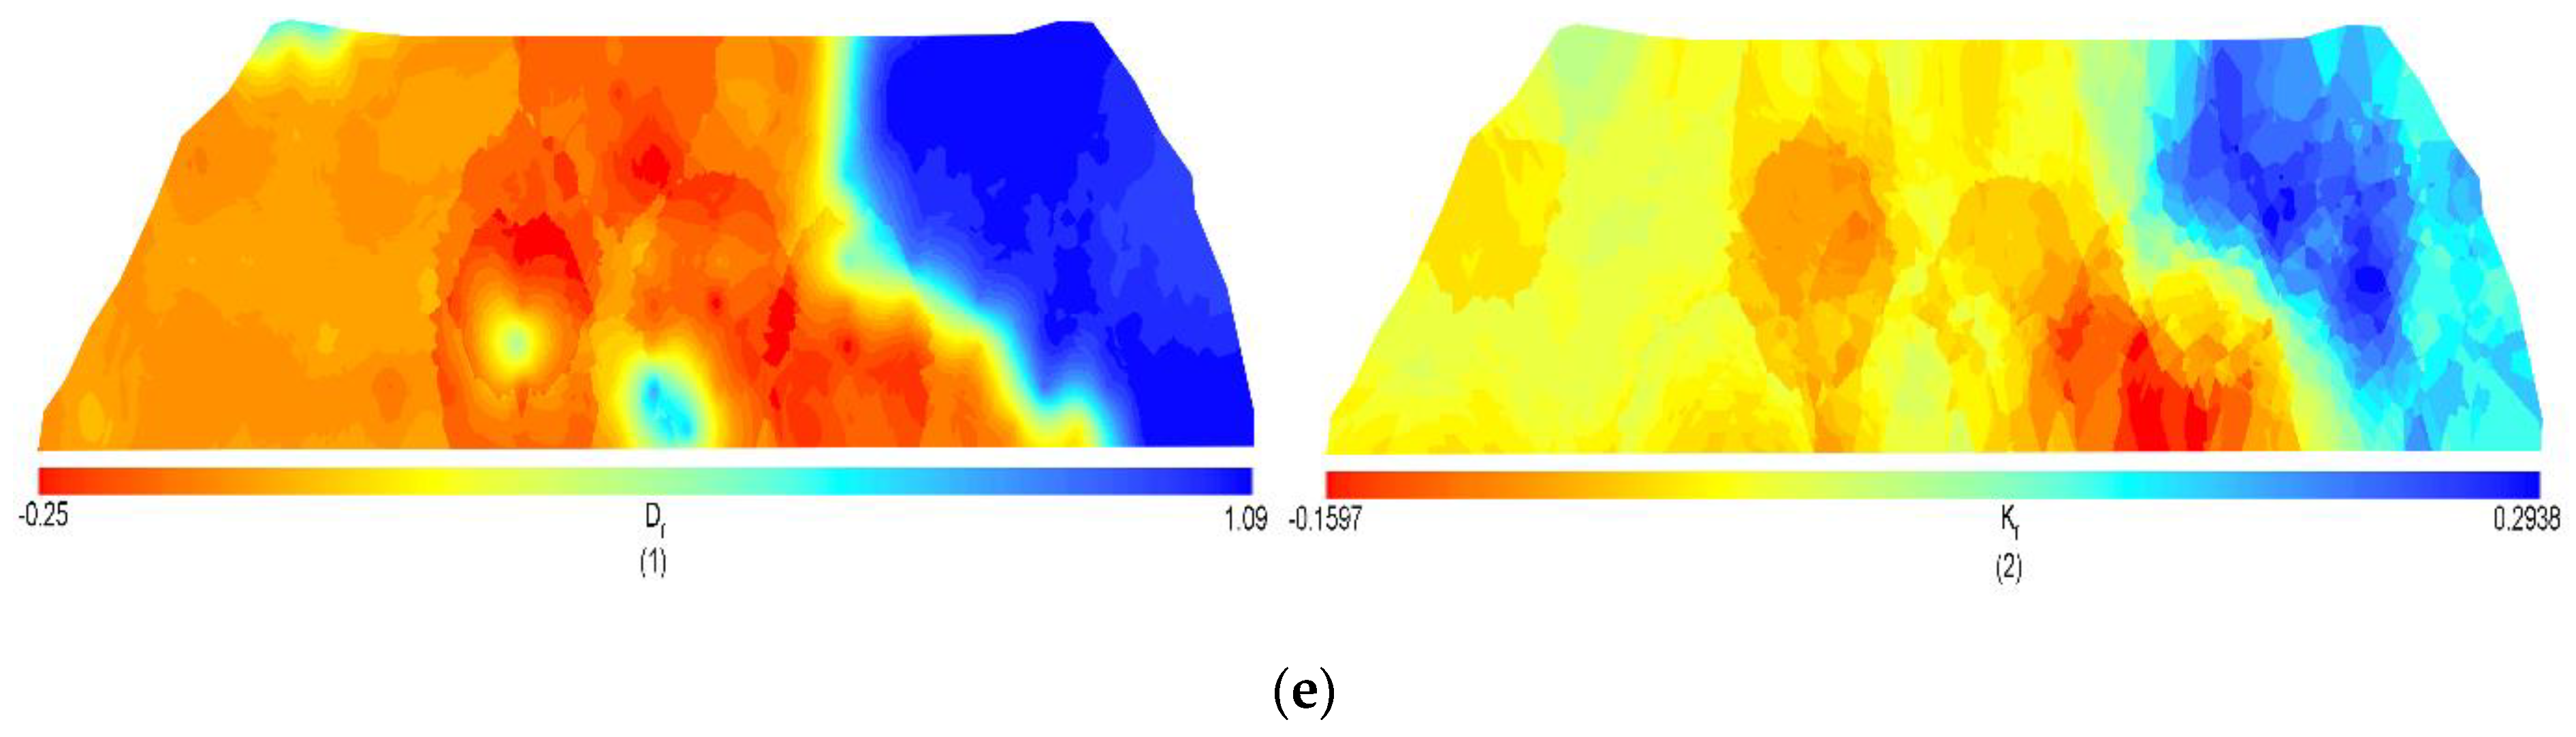
The total length of the fractures was measured using digital image processing, as shown in Figure 5. The relationship between the total length of the fracture and fractal dimension of the rock mass due to mining was determined using nonlinear equation fitting:
where L is the total length of the fracture, Df is the fractal dimension of the rock mass, and the correlation coefficient is 0.958.
The measured length of the fractures in the rock mass due to mining was 1/e. With an increase in the mined distance, the changes in the fracture network of the rock mass showed good self-similarity. Thus, the fractal dimension of the fracture network of the rock mass could be used as an index to characterize the space occupied by the fracture length, which could be applied to analyze and evaluate the fracture network by using a fractal dimension.
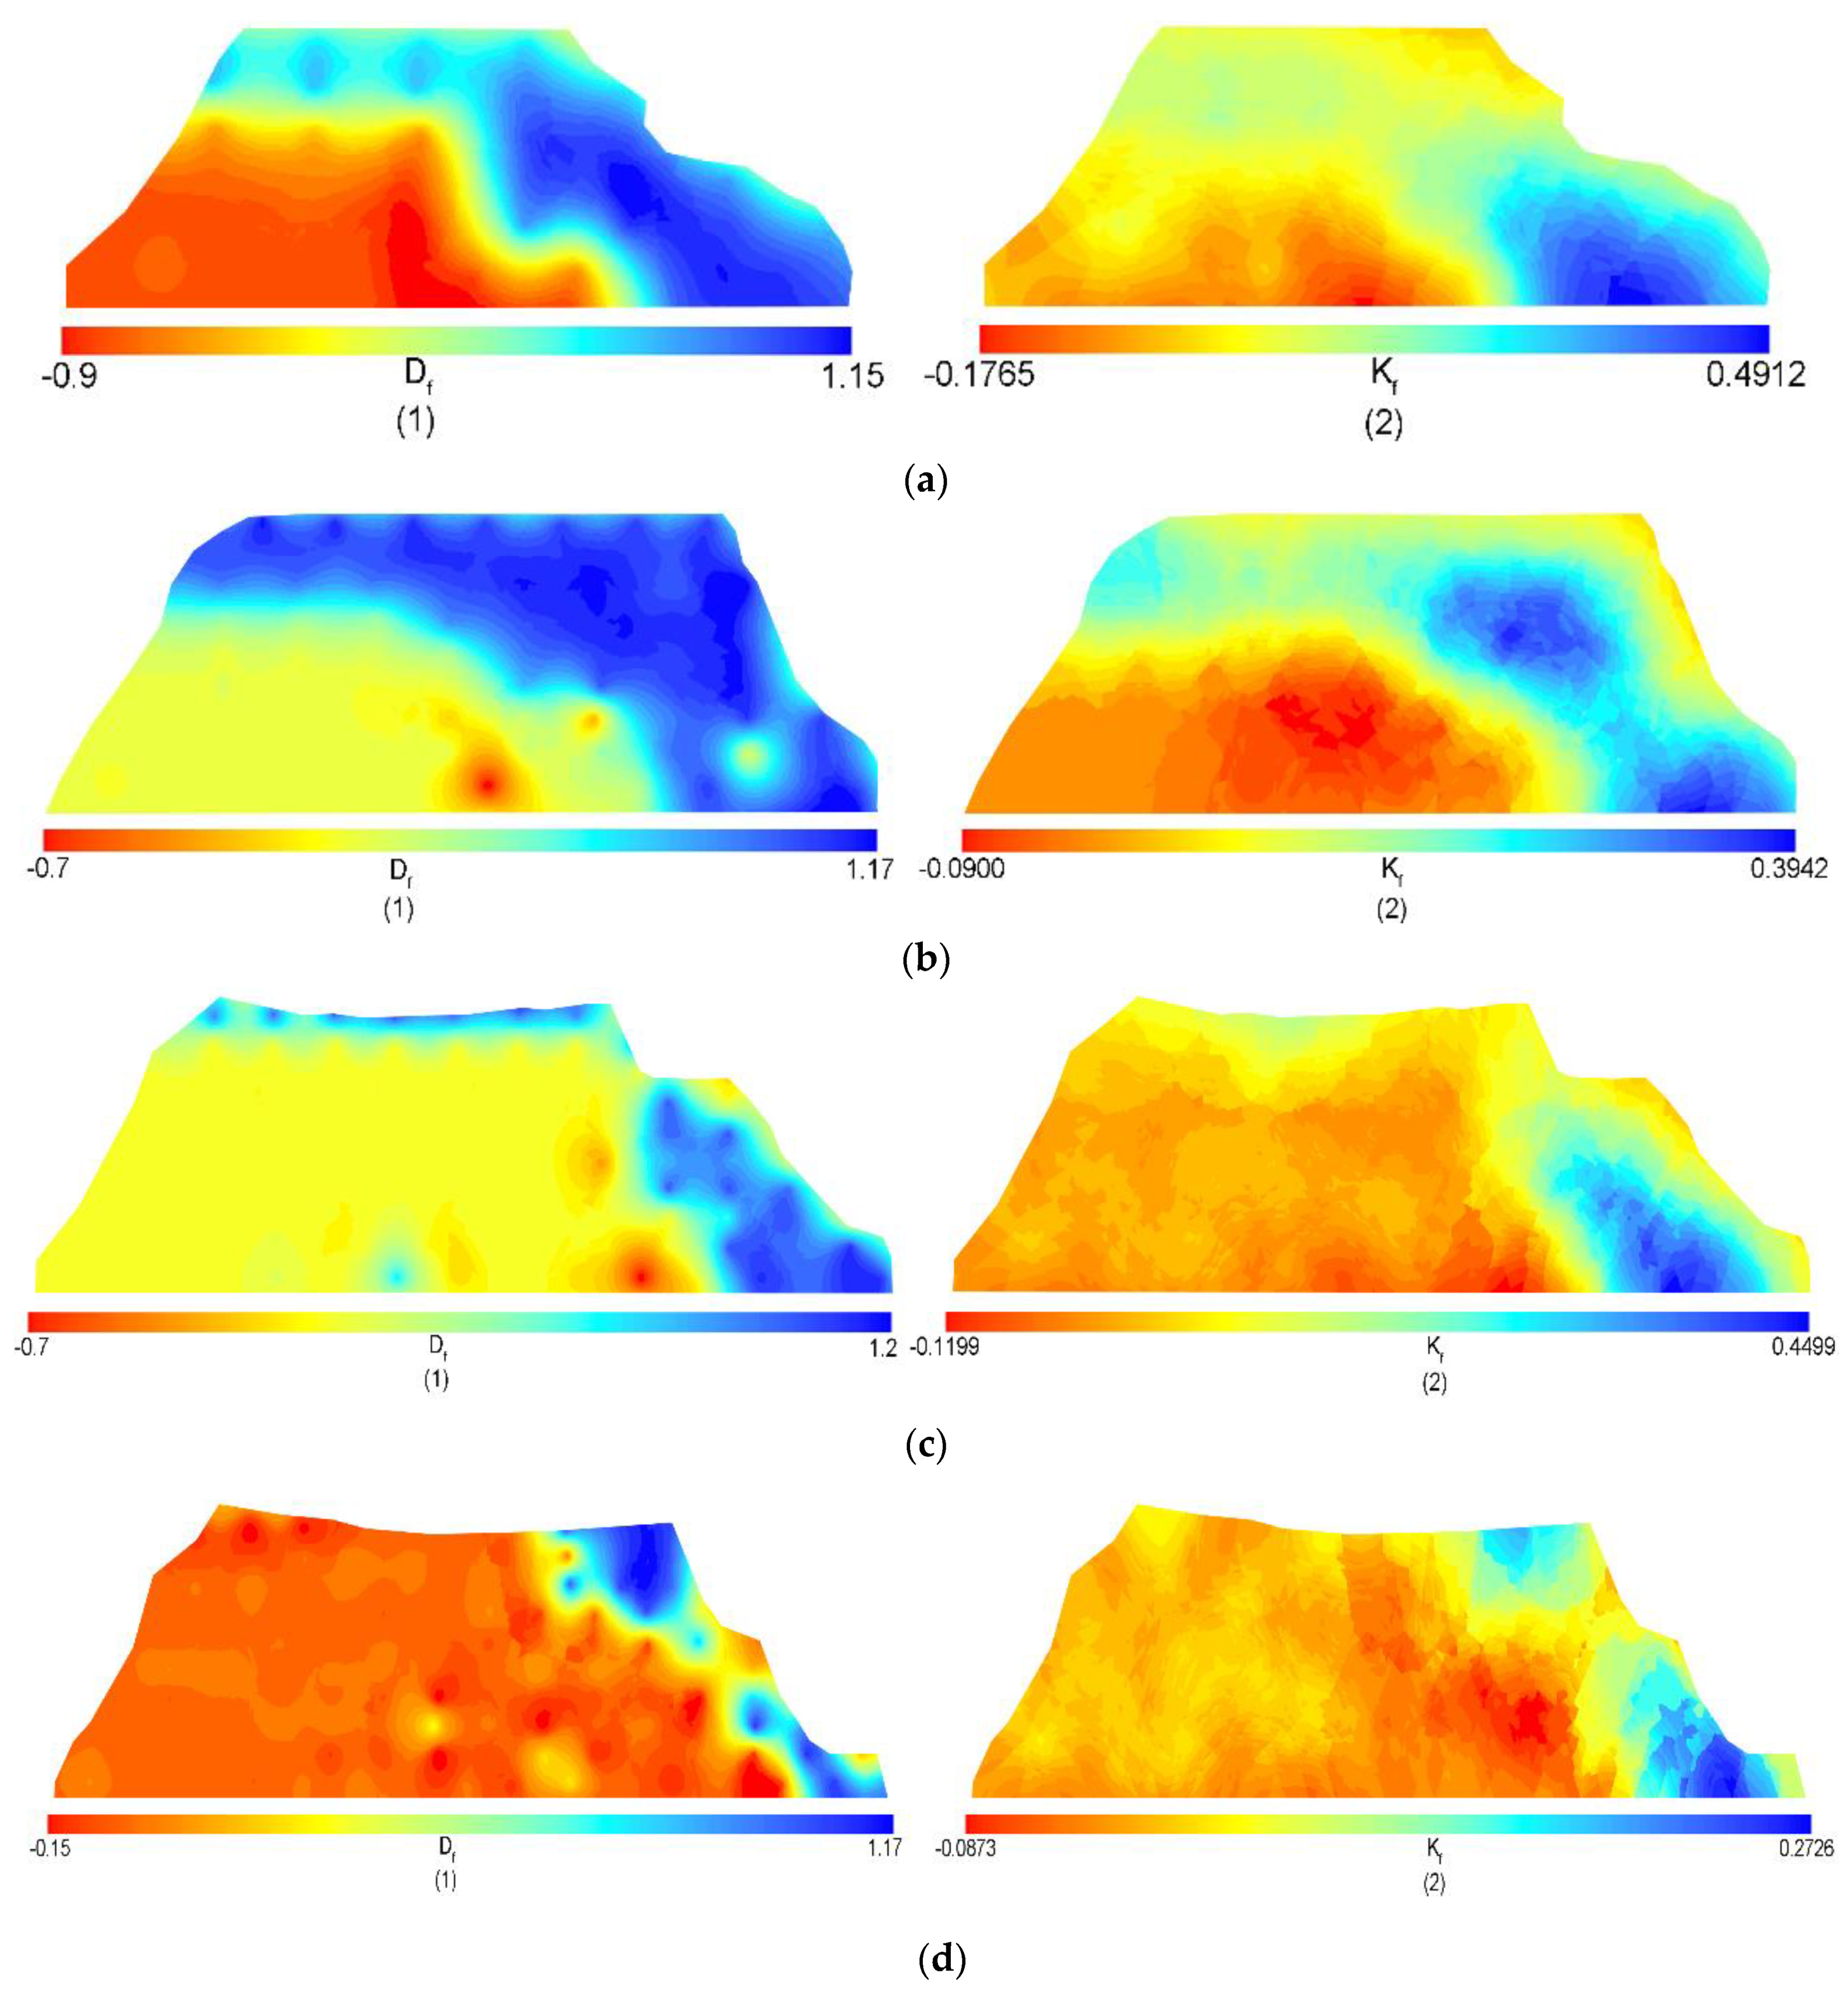
Figure 6a shows the variations in the fractal dimension of the rock mass fractures, in which the fractal dimension increased with fluctuations of the fractures. There are three stages in the development of rock mass fractures due to mining.
Stage I is when the fractal dimension of the rock mass fractures quickly increases. The caved and fractured zones form and expand to about 180 m before the mined panel.
Stage II is when the fractal dimension of the rock mass fracture slowly increases. The fractures begin to develop, then penetrate into the rock mass and finally close, and the rate of the fracture development is similar to that of fracture closure.
Stage III is when the fractal dimension of the rock mass fractures rapidly increases, and the conductive fracture zone is a saddle shape after a depth of 340 m.
Figure 6b,c show that the area with a high fractal dimension of rock mass fractures moved forward with the advancement of the goaf, while in the center of the goaf and towards the top of the goaf, the fractal dimension decreased due to the closure of the fractures in different areas, which is basically in agreement with the process of stress relief in the goaf. Finally, when the fractal dimension of the rock mass fractures rapidly increased, the conductive fracture zone was a saddle shape with a low trough in the middle and high peaks at the end.
4.2. The Entropy of Fractures of Rock Mass Due to Mining
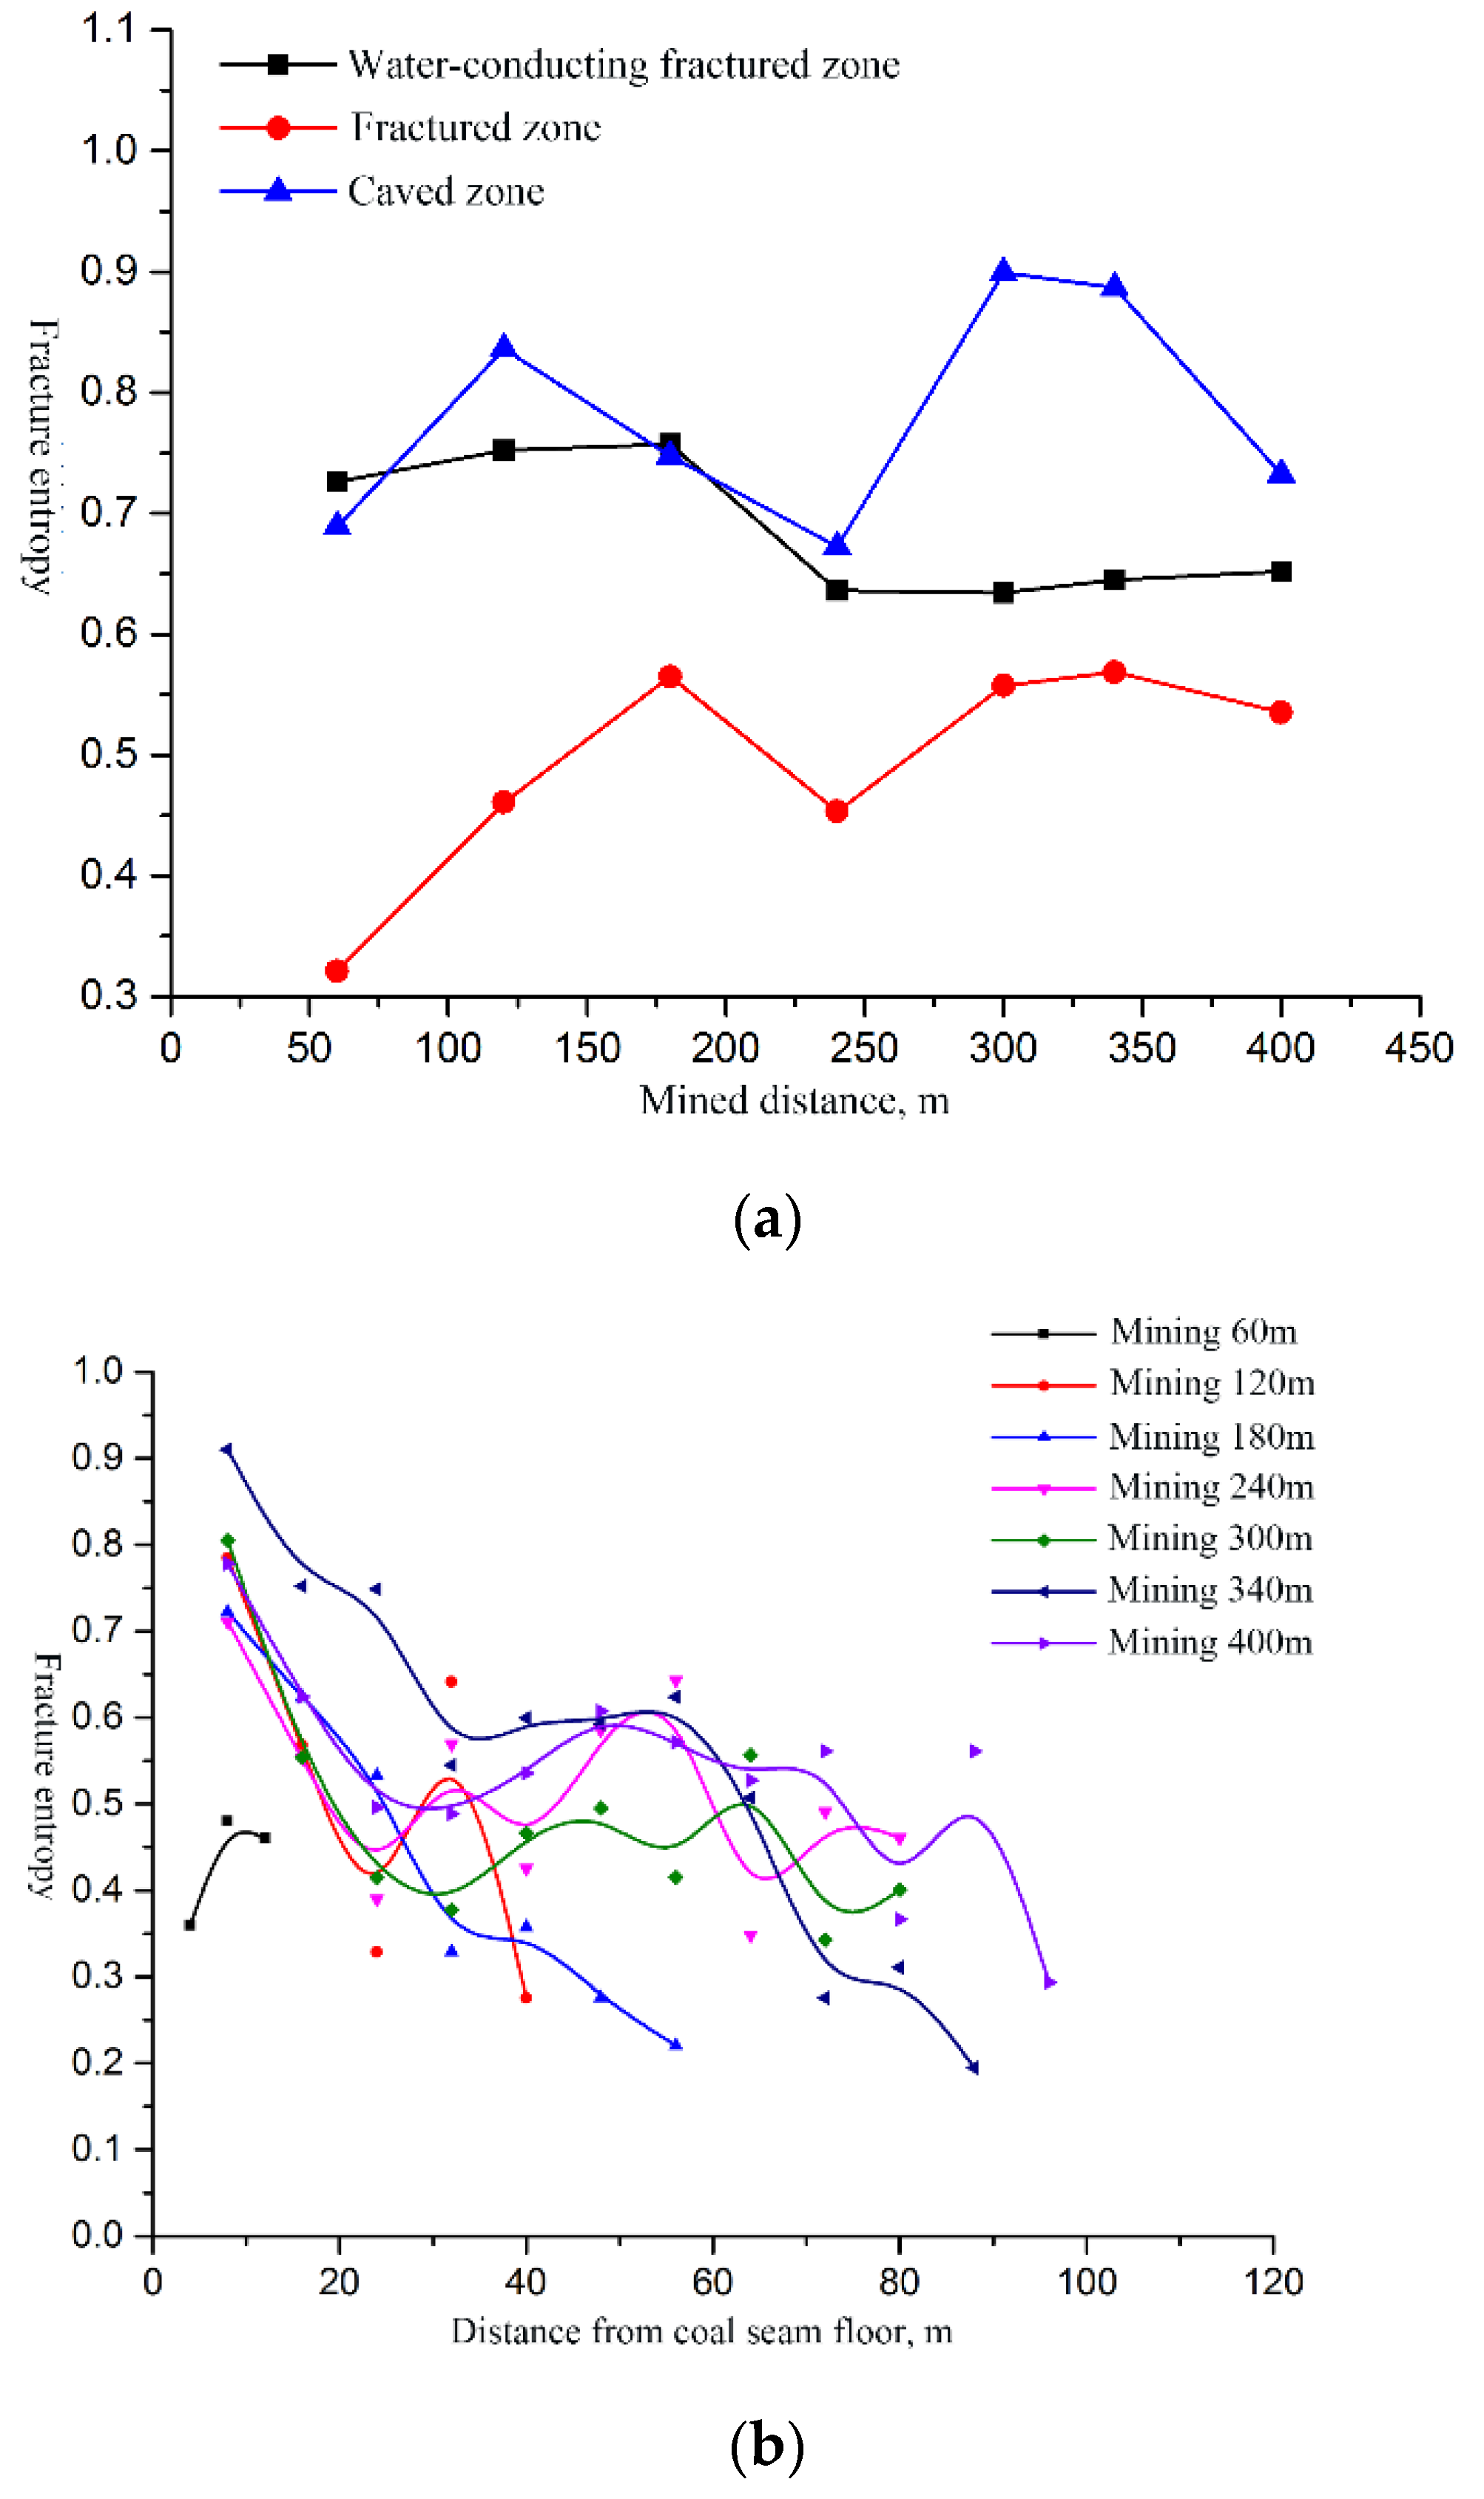
All of the fractures were in the same direction when the fracture entropy (Kf) was 0, and all of the fractures were evenly distributed in all directions when Kf was 1 or when fracture entropy ranged from 0 to 1, in accordance with Equation (4). The changes in the fracture entropy indicate the state of the rock mass fracture system due to mining, and an increase in the fracture entropy indicates the development of the fracture system from orderly to disorderly. There are three stages in the development of entropy of the rock mass fractures, as shown in Figure 7a.
Stage I: The fracture entropy of rock mass fractures increases with mining. In the early stages of mining, the collapse of the rock mass and the first and subsequent collapses of the main roof primarily cause fracturing of the rock mass, which contributes to the distribution of fractures in the rock mass and an increase in the degree of randomness of the fractures. The fractured zone is characterized by the development of longitudinal fractures, and the caved zone mainly contributes to an increase in the fracture entropy.
Stage II: The fracture entropy of the rock mass fractures is reduced with mining. The fracture entropy is reduced due to the compaction, penetration and closing of the fractures, which indicate that the fractures in the caved and fractured zones are compacted and tend to propagate in the same direction.
Stage III: The fracture entropy of the rock mass fractures is increased with mining. This is mainly due to the generation of new fractures and the opening of fractures, which lead to an increase in fracture entropy. However, due to the closure, penetration and compaction of the fractures in the goaf, the degree of randomness of the fractures in the missing information direction is reduced, which results in the slow increase in the entropy of the rock mass fractures in general.
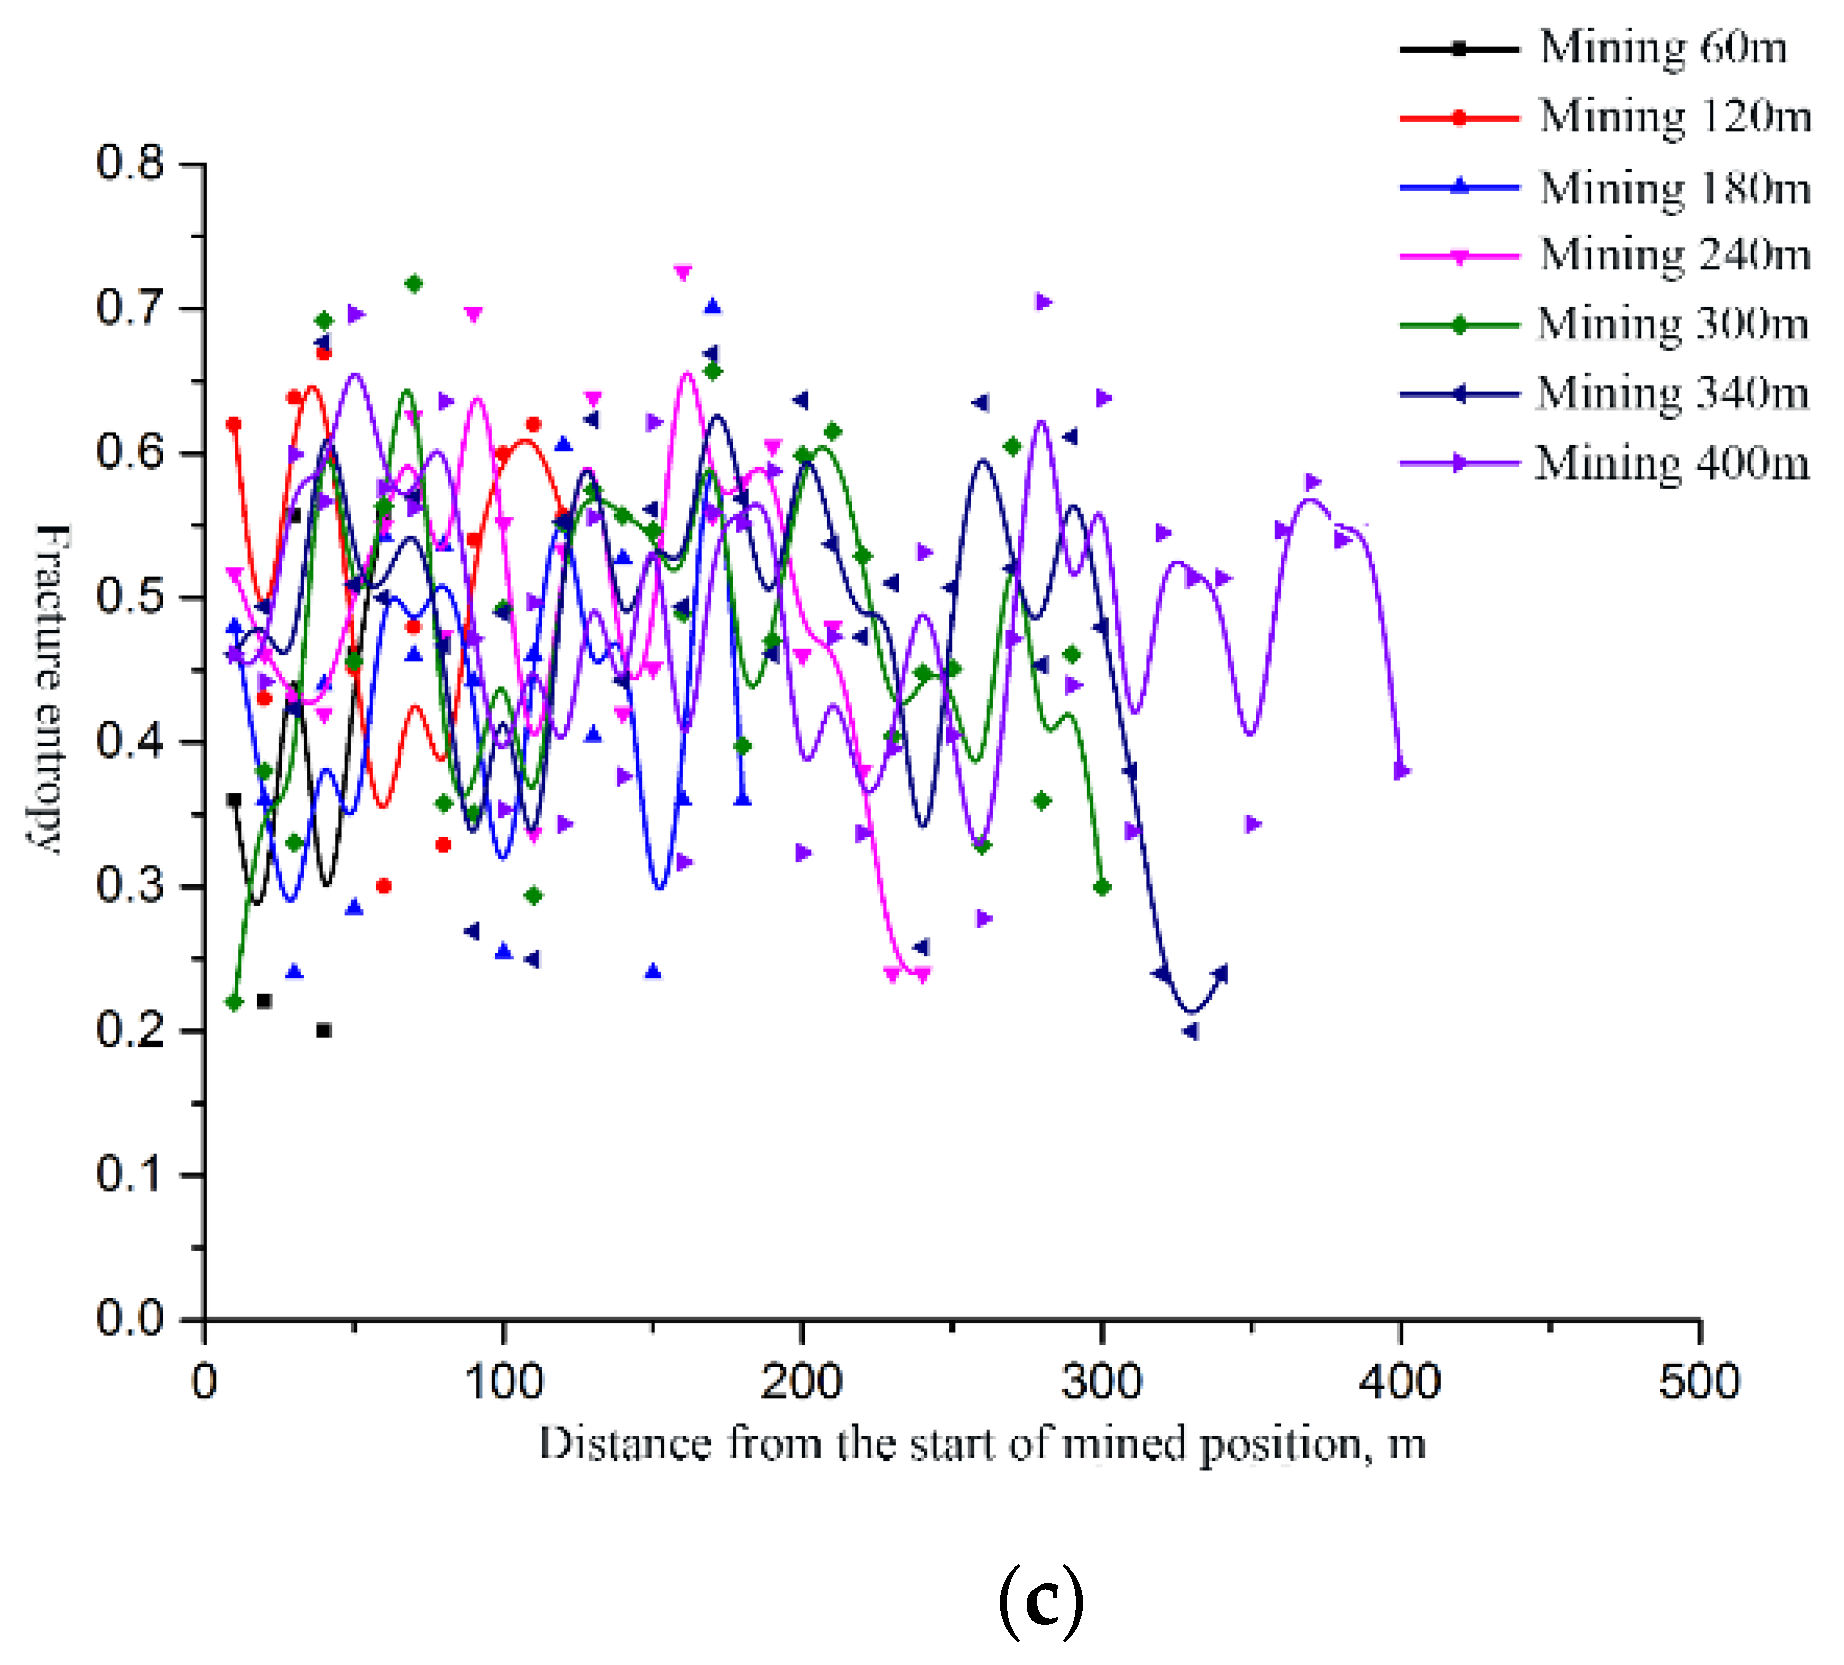
Figure 7b and Figure 8c show that the fracture entropy reflects the randomness characteristics of the fractures and the trend in the direction of the development of rock mass fractures due to mining. Fracture entropy has periodic characteristics in the advancing direction of the panel; that is, the entropy reflects the characteristics of periodic weighting. For each weighting break, the fracture entropy increases. The fracture entropy is gradually reduced with increases in distance from the coal seam floor, and the fracture entropy of the rock mass in the upper goaf is lower, and the degree of randomness is lower, which is less affected by mining.
The generation of new fractures or the penetration of fractures may increase the fractal dimension of the fractures to a certain degree and shows that the space occupied by the fracture length changes. In this way, the directional distribution of the fractures will change at the same time, and the fracture entropy may increase or not. The degree of reduction in the fractal dimension can be attributed to the closure and the coalescence of the fractures, which also account for the reduction in the fracture entropy of the fracture system. When the fractures are open, the space occupied by the fracture length remains unchanged, which indicates that the fractal dimension remains constant, but the fracture entropy increases, and the fractures show random behavior. Differentiation calculations were carried out with GIS on the incremental changes in the spatiotemporal parameters of the fractal dimension and entropy of fractures in the rock mass. Then, the characteristics of the incremental changes of discriminate spatiotemporal parameters were obtained, as shown in Figure 8. During the mining process, the region where the fractal dimension and fracture entropy of the fracture increased was mainly the region where new fractures were produced. In the areas where the fractured state remained constant, the fractal dimension and entropy remained unchanged. Therefore, the fracture entropy and fractal dimension could be combined to evaluate the state of the fractures. Accordingly, the criteria for determining the spatiotemporal state of the rock mass fractures were established and are listed in Table 3, where “+” denotes an increase, “−” denotes a decrease, and “±” denotes constant.
5. Discussion
The fractal dimension and fracture entropy of the mesh in Figure 4 were calculated, and two space–time cubes were created to describe the spatiotemporal changes in the rock mass fractures due to mining, as shown in Figure 9a, Figure 9b, respectively. In order to verify the universality of the criteria for determining the spatiotemporal state of rock mass fractures due to mining, the Mann–Kendall test was used to determine the trend in the spatiotemporal changes of the fractal dimension and fracture entropy of the rock mass fractures due to mining; z was determined to be 3.94. This indicates that the fractal dimension and fracture entropy of the rock mass strata increased with time, and the rock mass system underwent a process of increasing entropy.
Analyses of emerging spatiotemporal hot spot patterns identified data trends and found new, enhanced, reduced, and scattered hot and cold spots. Moreover, the Hot Spot Analysis tool can be used to examine the spatiotemporal changes in mining-induced fractures in the rock mass. Conceptually, a high fractal dimension and high entropy of aggregated fractures in space and time are represented by hot spots, whereas a low fractal dimension and low entropy of aggregated fractures are characterized by cold spots. The hot and cold spots and their characteristics with changes in the rock mass fractures can be detected by examining emerging spatiotemporal hot spot patterns, which can be used to evaluate the trends of the hot and cold spots over time. The Hot Spot Analysis tool is used to calculate the Getis–Ord Gi* statistics [30,31] for each dataset feature. The z-scores and p-values are obtained, which indicate the spatial cluster location of features with high and low values. Local Getis–Ord Gi* statistics can be used to show spatial differences and analyze the degree of clustering in space. Then, the hot and cold spot areas of the attribute distribution of a spatiotemporal object can be determined. Local Getis–Ord Gi* statistics are defined as follows:
where xj is the attribute value of element j, wi,j is the spatial weight between elements i and j, n is the sum of the elements, and
High values do not necessarily imply hot spots in a statistical sense. By analyzing the time series of the resultant Getis–Ord Gi* scores on each location or spatial grid, we can determine the hot and cold spot characteristics of these locations and then evaluate their trends. The results indicate that the newly added hot spots mainly aggregated on the upper and front parts of the panel along the advancing direction, which reflects the occurrence of new fractures, changes in the direction of fracturing, and rock mass deformation and failure. In terms of the fractal dimension of the fractures, oscillating hot spots were mainly distributed between the open cut and panel, which indicated the previous presence of cold spots. Therefore, mining caused the distribution of fractures behind the panel, on the upper panel, and in the gob. The mining process includes cycles of the initiation, opening, closing, compaction and penetration of the fractures, both in time and space. Regarding fracture entropy, it was mainly distributed in the continuous hot spot areas and showed a similar cycle, but with fewer oscillating hot spots. Therefore, the fractal dimension and entropy of fractures can be used to represent the spatiotemporal state and changes in the characteristics of mining-induced fractures in the rock mass.
6. Conclusions
A new method for spatiotemporal visualization is proposed in this study to assess the spatial and temporal characteristics of fractures, in time and space dimensions simultaneously, in a rock mass caused by mining. Scale model testing is used to simulate the changes in the rock mass fractures due to mining. A space–time cube is created to analyze the rock mass fractures. Two geometric characteristic parameters, namely fractal dimension and fracture entropy, are proposed to determine the spatial and temporal state of the rock mass fractures.
There are three stages in the development of a fractal dimension and fracture entropy of rock mass fractures. The fractal dimension of the rock mass fractures rapidly increases, and the conductive fracture zone has a saddle shape with a low trough in the middle and high peaks at the ends. The fracture entropy has periodic characteristics in the advancing direction of the panel, and the entropy reflects the characteristics of periodic weighting in the advancing direction of the panel. The spatiotemporal states of fractures experienced are initiated, penetrating, constant, opening, compacted and closed. The Mann–Kendall test is used to analyze the trend in the spatiotemporal changes of the fractal dimension and fracture entropy of the rock mass fractures based on a space–time cube. The fractal dimension and fracture entropy of the rock mass strata increase with time, and the rock mass system undergoes a process of increasing entropy. Fractal analysis of seepage in the fracture network due to mining will need to be carried out in future work.
Author Contributions
Data curation, Investigation, Methodology, writing—original draft preparation, B.Y.; Funding acquisition, Project administration, writing—review and editing, Y.L. All authors have read and agreed to the published version of the manuscript.
Funding
This research was funded by the National Key R&D Program of China (2017YFC0804101) and the Natural Science Foundation of Henan (222300420281).
Institutional Review Board Statement
Not applicable.
Informed Consent Statement
Not applicable.
Data Availability Statement
All data, models, or code generated or used during the study are available from the corresponding author by request.
Acknowledgments
The authors would like to thank all the anonymous referees for their constructive comments and suggestions.
Conflicts of Interest
The authors declare no conflict of interest.
References
- Kong, X.; Wang, E.; Li, S.; Lin, H.; Xiao, P.; Zhang, K. Fractals and chaos characteristics of acoustic emission energy about gas-bearing coal during loaded failure. Fractals 2019, 27, 1950072. [Google Scholar] [CrossRef]
- Huang, J.; Li, W.; Huang, D.; Wang, L.; Chen, E.; Wu, C.; Wang, B.; Deng, H.; Tang, S.; Shi, Y.; et al. Fractal analysis on pore structure and hydration of magnesium oxysulfate cements by first principle, thermodynamic and microstructure-based methods. Fractal Fract. 2021, 5, 164. [Google Scholar] [CrossRef]
- Yu, Y.; Ma, L. Application of roadway backfill mining in water-conservation coal mining: A case study in northern Shaanxi, China. Sustainability 2019, 11, 3719. [Google Scholar] [CrossRef] [Green Version]
- Sui, W.; Hang, Y.; Ma, L.; Wu, Z.; Zhou, Y.; Long, G.; Wei, L. Interactions of overburden failure zones due to multiple-seam mining using longwall caving. Bull. Eng. Geol. Environ. 2015, 74, 1019–1035. [Google Scholar] [CrossRef] [Green Version]
- Zhang, C.; Wang, F.; Bai, Q. Underground space utilization of coalmines in China: A review of underground water reservoir construction. Tunn. Undergr. Space Technol. 2021, 107, 103657. [Google Scholar] [CrossRef]
- Fan, L.; Liu, S. Fluid-dependent shear slip behaviors of coal fractures and their implications on fracture frictional strength reduction and permeability evolutions. Int. J. Coal Geol. 2019, 212, 103235. [Google Scholar] [CrossRef]
- Wei, M.; Liu, J.; Elsworth, D.; Liu, Y.; Zeng, J.; He, Z. Impact of equilibration time lag between matrix and fractures on the evolution of coal permeability. Fuel 2021, 290, 120029. [Google Scholar] [CrossRef]
- Zhang, D.; Sui, W.; Liu, J. Overburden failure associated with mining coal seams in close proximity in ascending and descending sequences under a large water body. Mine Water Environ. 2018, 37, 322–335. [Google Scholar] [CrossRef] [Green Version]
- Mandelbrot, B.B. Fractals: Form, Chance and Dimension; WH Freeman & Co.: San Francisco, CA, USA, 1979. [Google Scholar]
- Mandelbrot, B.B. The Fractal Geometry of Nature (Vol. 173); WH Freeman: New York, NY, USA, 1983. [Google Scholar]
- Mandelbrot, B.B. Self-Affine Fractal Sets Fractals in Physics; Pietronero, L., Tosatti, E., Eds.; Elsevier: Amsterdam, The Netherlands, 1986; pp. 3–29. [Google Scholar]
- Xu, P.; Li, S.; Lin, H.; Ding, Y.; Shuang, H.; Liu, S.; Tian, Y. Fractal Characterization of Pressure-Relief Gas Permeability Evolution in a Mining Fracture Network. Energies 2021, 14, 7031. [Google Scholar] [CrossRef]
- Alfonso, I.; Beltran, A.; Abatal, M.; Castro, I.; Fuentes, A.; Vázquez, L.; García, A. Fractal dimension determination of rock pores by multi-scale analysis of images obtained using OM, SEM and XCT. Fractals 2018, 26, 1850067. [Google Scholar] [CrossRef]
- Zhang, Z.; Xie, H.; Zhang, R.; Gao, M.; Ai, T.; Zha, E. Size and spatial fractal distributions of coal fracture networks under different mining-induced stress conditions. Int. J. Rock Mech. Min. Sci. 2020, 132, 104364. [Google Scholar] [CrossRef]
- Gao, M.Z.; Zhang, J.G.; Li, S.W.; Wang, M.; Wang, Y.W.; Cui, P.F. Calculating changes in fractal dimension of surface cracks to quantify how the dynamic loading rate affects rock failure in deep mining. J. Cent. South Univ. 2020, 27, 3013–3024. [Google Scholar] [CrossRef]
- He, W.; Hayatdavoudi, A.; Shi, H.; Sawant, K.; Huang, P. A preliminary fractal interpretation of effects of grain size and grain shape on rock strength. Rock Mech. Rock Eng. 2019, 52, 1745–1765. [Google Scholar] [CrossRef]
- Gao, Y.; Gao, F.; Yeung, M.C.R. A fractal and numerical simulation coupled study of fracture network during coal mining excavation. J. Appl. Math. 2014, 2014, 1–6. [Google Scholar] [CrossRef] [Green Version]
- Ikot, A.N.; Rampho, G.J.; Amadi, P.O.; Sithole, M.J.; Okorie, U.S.; Lekala, M.I. Shannon entropy and Fisher information-theoretic measures for Mobius square potential. Eur. Phys. J. Plus 2020, 135, 1–13. [Google Scholar] [CrossRef]
- Shannon, C.E. A mathematical theory of communication. Bell Syst. Tech. J. 1948, 27, 379–423. [Google Scholar] [CrossRef] [Green Version]
- Alibrandi, U.; Mosalam, K.M. Kernel density maximum entropy method with generalized moments for evaluating probability distributions, including tails, from a small sample of data. Int. J. Numer. Methods Eng. 2018, 113, 1904–1928. [Google Scholar] [CrossRef]
- Ye, Z.; Fan, X.; Zhang, J.; Sheng, J.; Chen, Y.; Fan, Q.; Qin, H. Evaluation of Connectivity Characteristics on the Permeability of Two-Dimensional Fracture Networks Using Geological Entropy. Water Resour. Res. 2021, 57, e2020WR029289. [Google Scholar] [CrossRef]
- Hagerstrand, T. Innovation Diffusion as a Spatial Process; The Johns Hopkins University Press: Baltimore, MD, USA, 1968. [Google Scholar]
- Kyriakidis, P.C.; Journel, A.G. Geostatistical space–time models: A review. Math. Geosci. 1999, 31, 651–684. [Google Scholar]
- Blangiardo, M.; Cameletti, M.; Baio, G.; Rue, H. Spatial and spatio-temporal models with R-INLA. Spat. Spatio-Temporal Epidemiol. 2013, 4, 33–49. [Google Scholar] [CrossRef] [Green Version]
- Ye, Q.; Wang, G.; Jia, Z.Z.; Zheng, C.S.; Wang, W.J. Similarity simulation of mining-crack-evolution characteristics of overburden strata in deep coal mining with large dip. J. Pet. Sci. Eng. 2018, 165, 477–487. [Google Scholar] [CrossRef] [Green Version]
- Loveridge, F.; McCartney, J.S.; Narsilio, G.A.; Sanchez, M. Energy geostructures: A review of analysis approaches, in situ testing and model scale experiments. Geomech. Energy Environ. 2020, 22, 100173. [Google Scholar] [CrossRef] [Green Version]
- Wang, L.; Zeng, X.; Yang, H.; Lv, X.; Guo, F.; Shi, Y.; Hanif, A. Investigation and application of fractal theory in cement-based materials: A review. Fractal Fract. 2021, 5, 247. [Google Scholar] [CrossRef]
- Wang, L.; Lu, X.; Liu, L.; Xiao, J.; Zhang, G.; Guo, F.; Li, L. Influence of MgO on the Hydration and Shrinkage Behavior of Low Heat Portland Cement-Based Materials via Pore Structural and Fractal Analysis. Fractal Fract. 2022, 6, 40. [Google Scholar] [CrossRef]
- Kendall, M.G. The Advanced Theory of Statistics, 2nd ed.; Charles Griffin & Co.: London, UK, 1946. [Google Scholar]
- Kumar, S.; Parida, B.R. Hydroponic farming hotspot analysis using the Getis–Ord Gi* statistic and high-resolution satellite data of Majuli Island, India. Remote Sens. Lett. 2021, 12, 408–418. [Google Scholar] [CrossRef]
- Griffith, D.A. Interpreting Moran Eigenvector Maps with the Getis-Ord Gi* Statistic. Prof. Geogr. 2021, 73, 447–463. [Google Scholar] [CrossRef]
Figure 1.
Fracture zones in a rock mass.

Figure 2.
Flow chart of spatial and temporal visualization analysis.

Figure 3.
Plane-stress physical model of rock mass fractures: (a) Engineering geological model; (b) scale model.
Figure 3.
Plane-stress physical model of rock mass fractures: (a) Engineering geological model; (b) scale model.

Figure 4.
Flow chart of extraction of fracture images and variations in the fracture network due to mining.
Figure 4.
Flow chart of extraction of fracture images and variations in the fracture network due to mining.

Figure 5.
Total length of fracture of rock mass versus fractal dimension.

Figure 6.
Spatio-temporal variation of fractal dimension of rock mass fractures: (a) due to mining; (b) in the vertical direction; and (c) in the mined direction.
Figure 6.
Spatio-temporal variation of fractal dimension of rock mass fractures: (a) due to mining; (b) in the vertical direction; and (c) in the mined direction.

Figure 7.
Spatio-temporal variation of fracture entropy of rock mass fractures: (a) due to mining; (b) in the vertical direction; and (c) in the mined direction.
Figure 7.
Spatio-temporal variation of fracture entropy of rock mass fractures: (a) due to mining; (b) in the vertical direction; and (c) in the mined direction.


Figure 8.
Incremental changes in spatiotemporal parameters of fractal dimension and fracture entropy of rock mass fractures: (a) 120–180 m; (b) 180–240 m; (c) 240–300 m; (d) 300–340 m; (e) 340–400 m; 1 fractal dimension, and 2 fracture entropy.
Figure 8.
Incremental changes in spatiotemporal parameters of fractal dimension and fracture entropy of rock mass fractures: (a) 120–180 m; (b) 180–240 m; (c) 240–300 m; (d) 300–340 m; (e) 340–400 m; 1 fractal dimension, and 2 fracture entropy.


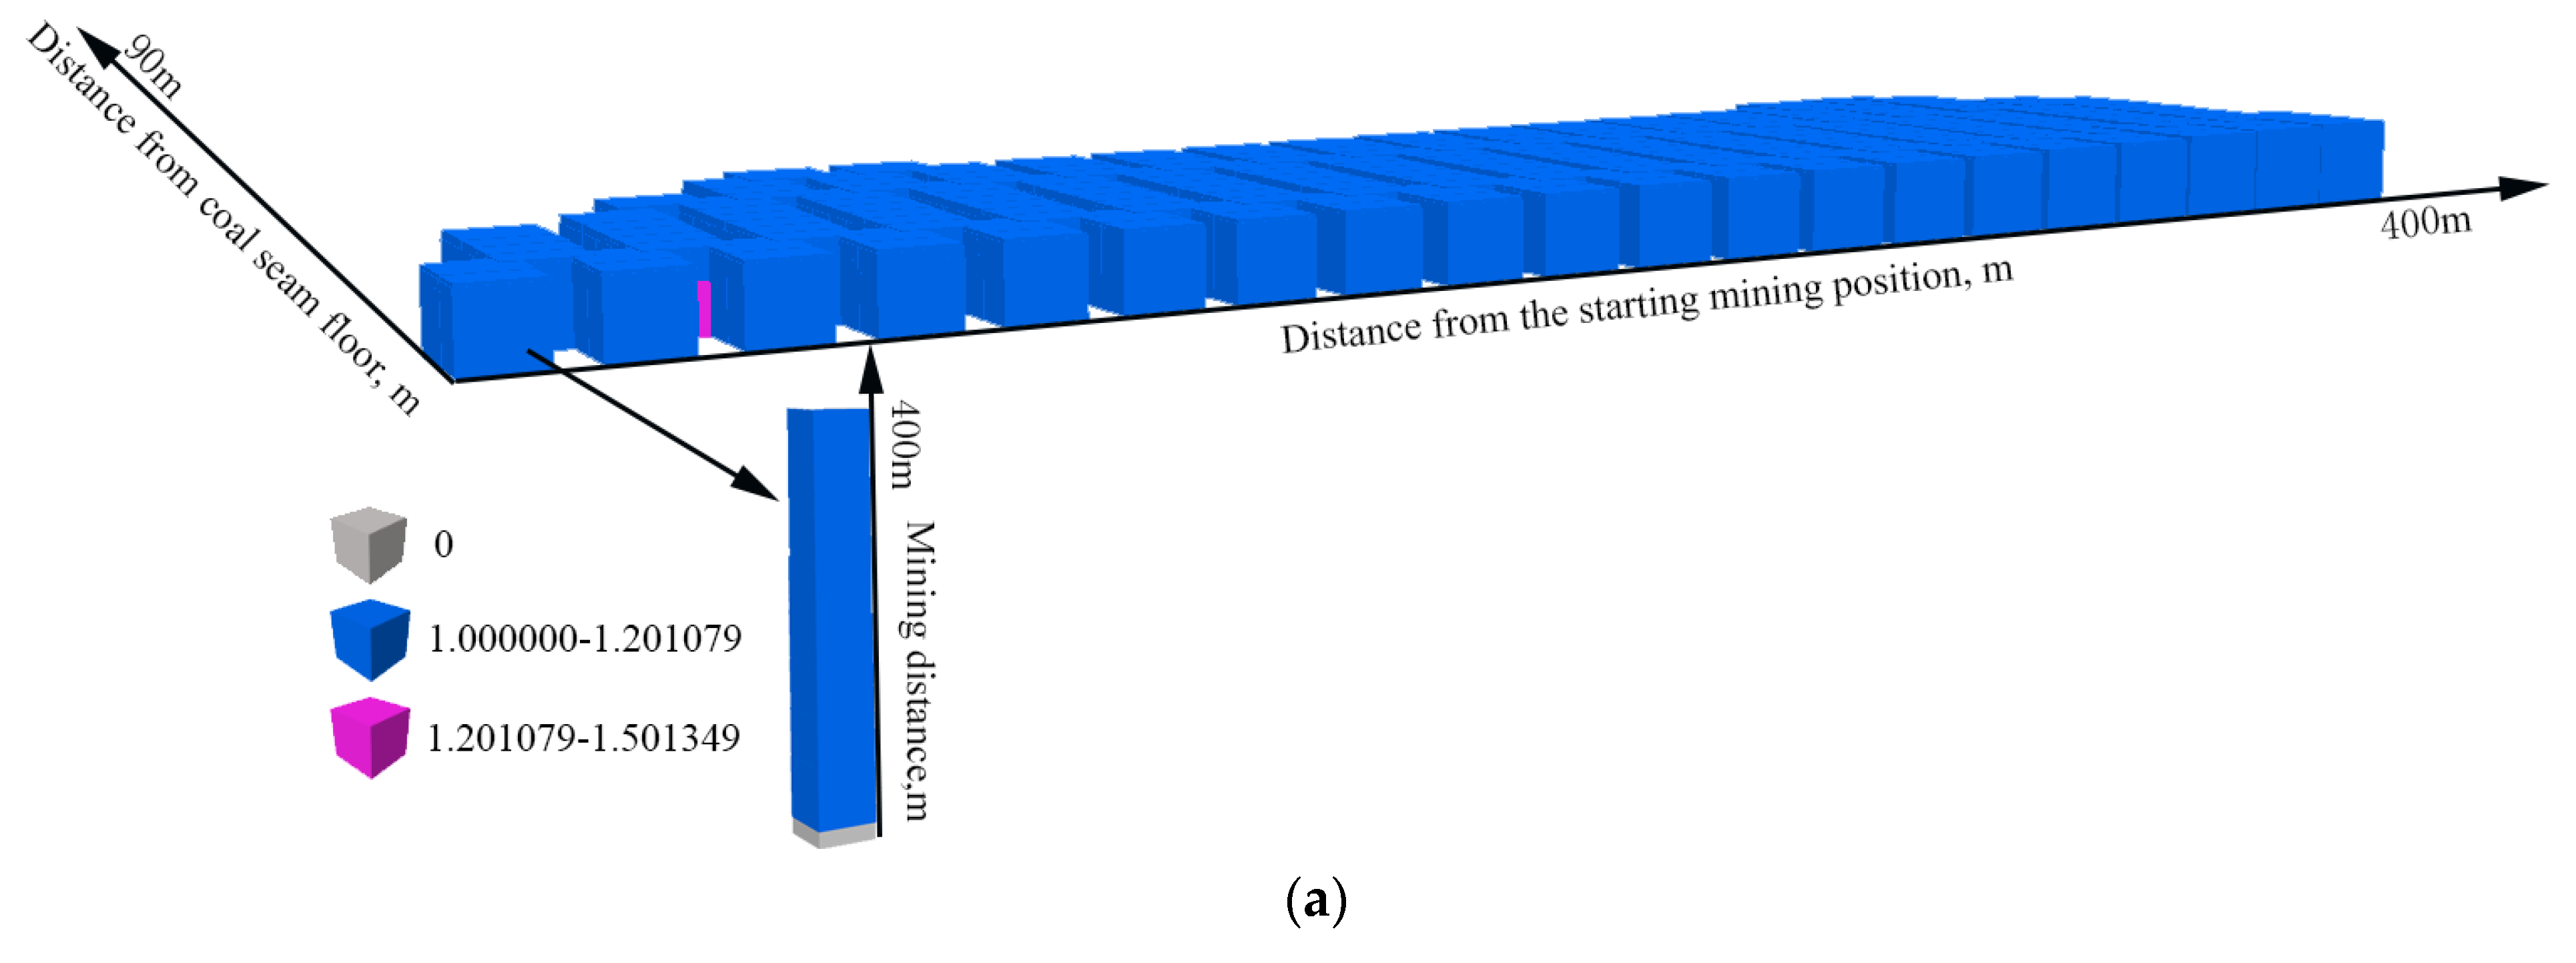
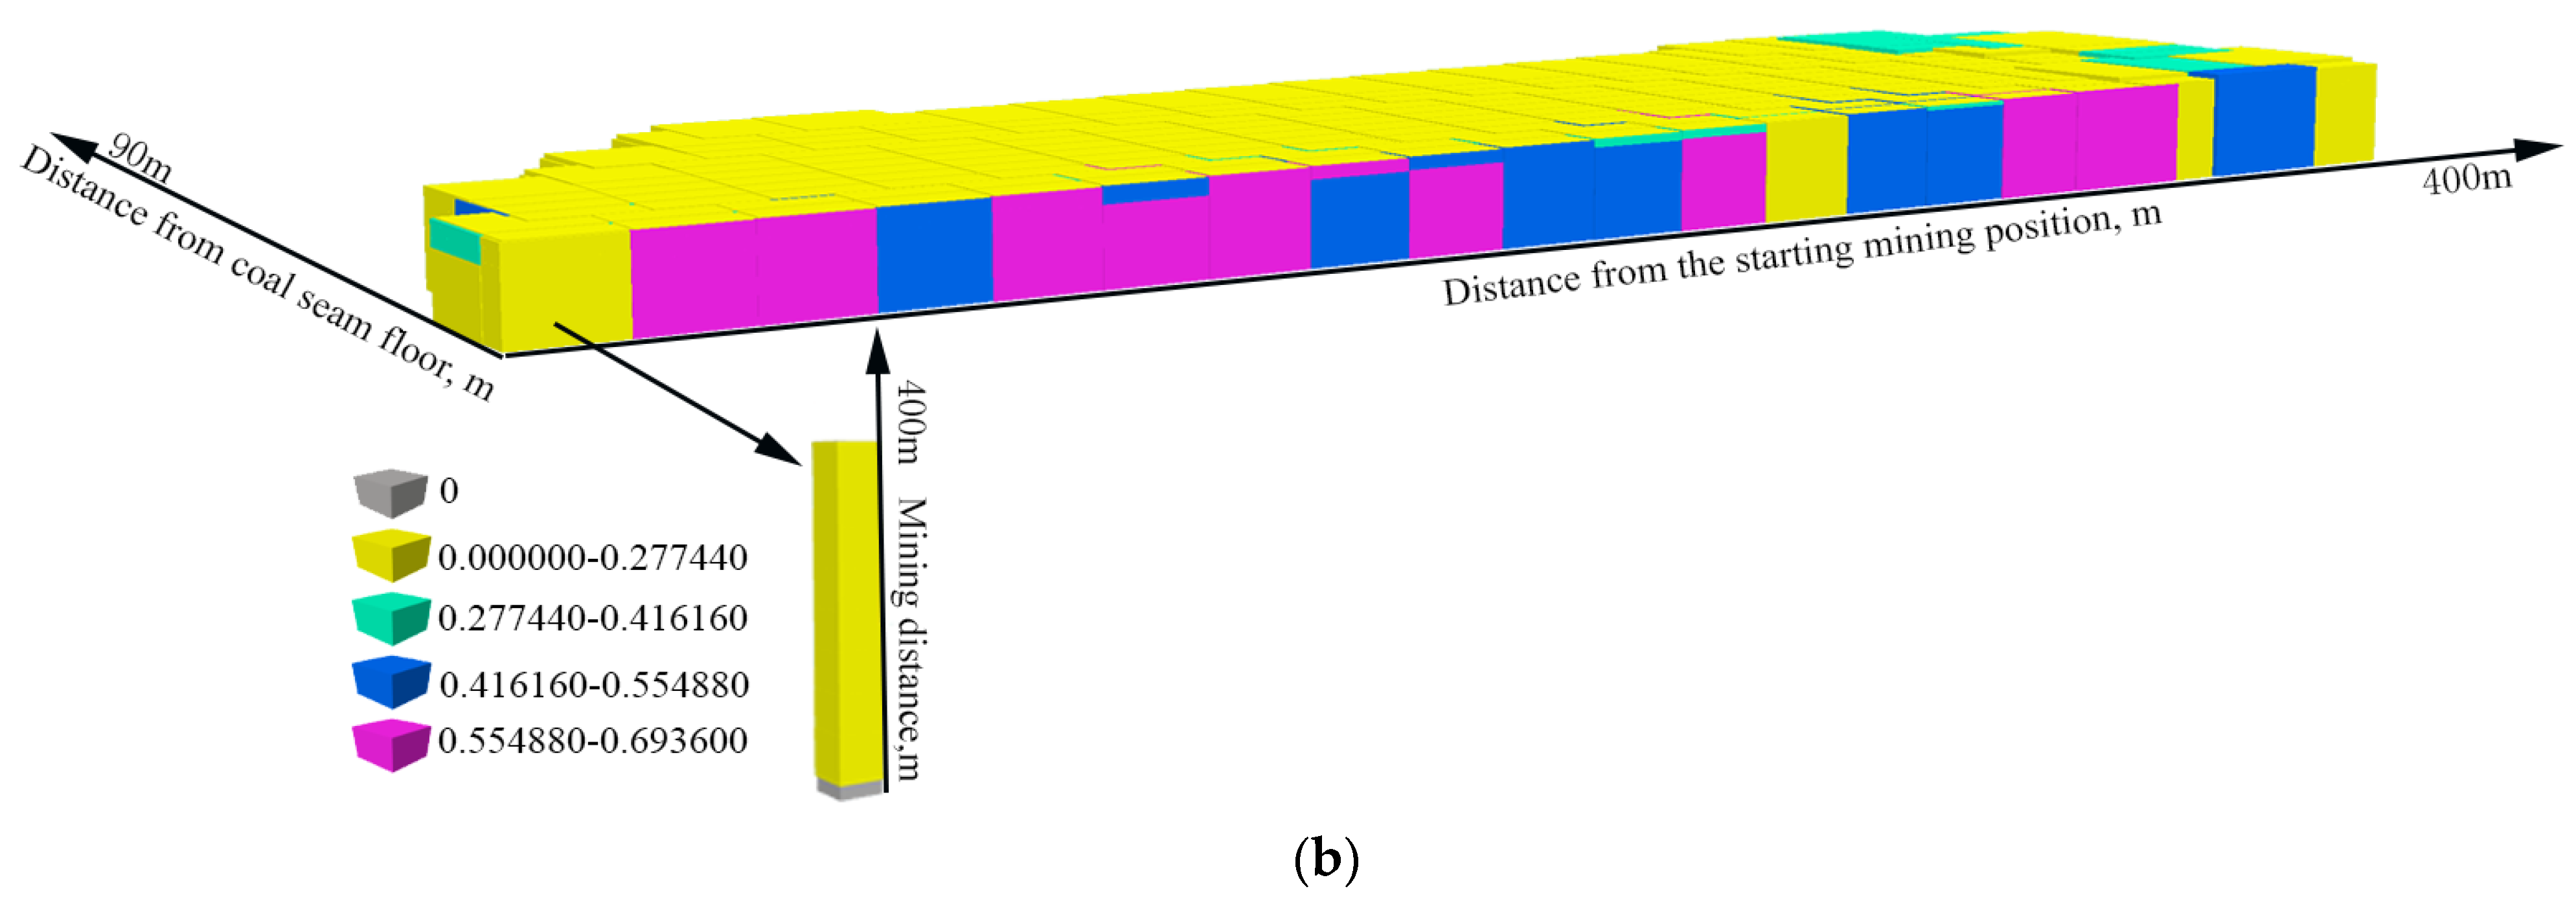
Figure 9.
Space–time cube of fracture entropy in mining-induced rock mass fractures: (a) fractal dimension; (b) fracture entropy.
Figure 9.
Space–time cube of fracture entropy in mining-induced rock mass fractures: (a) fractal dimension; (b) fracture entropy.


Table 1.
Characteristics of trend of time series.
| Trend Library | z | p | Trend |
|---|---|---|---|
| −3 | <−2.58 | 99% | Decline, confidence level 99% |
| −2 | −2.58 to −1.96 | 95% | Decline, confidence level 95% |
| −1 | −1.96 to −1.65 | 90% | Decline, confidence level 90% |
| 0 | −1.65 to 1.65 | - | Non-significant trend |
| 1 | 1.65 to 1.96 | 90% | Increase, confidence level 99% |
| 2 | 1.96 to 2.58 | 95% | Increase, confidence level 95% |
| 3 | >2.58 | 99% | Increase, confidence level 90% |
Table 2.
Calculation of fractal dimension of fractures with mined distance.
| Mined Distance (m) | Linear Regression Equation | Fractal Dimension | Correlation Coefficient |
|---|---|---|---|
| 60 | y = 1.123x + 3.235 | 1.123 | 0.999 |
| 120 | y = 1.373x + 4.397 | 1.373 | 0.998 |
| 180 | y = 1.501x + 4.467 | 1.501 | 0.999 |
| 240 | y = 1.508x + 4.117 | 1.508 | 0.999 |
| 300 | y = 1.510x + 4.485 | 1.510 | 0.999 |
| 340 | y = 1.561x + 4.506 | 1.561 | 0.999 |
| 400 | y = 1.610x + 4.594 | 1.610 | 0.999 |
Table 3.
Criteria for determining the spatiotemporal state of rock mass fractures due to mining.
| Number | Change in Df | Change in Kf | State of Fractures |
|---|---|---|---|
| 1 | Df+ | Kf+ | Initiated |
| 2 | Df− | Kf+ | Penetrating |
| 3 | Df− | Kf− | Closed |
| 4 | Df± | Kf± | Constant |
| 5 | Df± | Kf+ | Opening |
| 6 | Df± | Kf− | Compacted |
Notes: Df is fractal dimension, and Kf is fracture entropy.
Publisher’s Note: MDPI stays neutral with regard to jurisdictional claims in published maps and institutional affiliations. |
© 2022 by the authors. Licensee MDPI, Basel, Switzerland. This article is an open access article distributed under the terms and conditions of the Creative Commons Attribution (CC BY) license (https://creativecommons.org/licenses/by/4.0/).
Share and Cite
MDPI and ACS Style
Yang, B.; Liu, Y. Application of Fractals to Evaluate Fractures of Rock Due to Mining. Fractal Fract. 2022, 6, 96. https://doi.org/10.3390/fractalfract6020096
AMA Style
Yang B, Liu Y. Application of Fractals to Evaluate Fractures of Rock Due to Mining. Fractal and Fractional. 2022; 6(2):96. https://doi.org/10.3390/fractalfract6020096
Chicago/Turabian StyleYang, Binbin, and Yong Liu. 2022. "Application of Fractals to Evaluate Fractures of Rock Due to Mining" Fractal and Fractional 6, no. 2: 96. https://doi.org/10.3390/fractalfract6020096