
Surface Cracking and Fractal Characteristics of Cement Paste after Exposure to High Temperatures


1
Key Laboratory of Agricultural Soil and Water Engineering in Arid and Semiarid Areas of Ministry of Education, Northwest A&F University, Yangling 712100, China
2
College of Water Resources and Architectural Engineering, Northwest A&F University, Yangling 712100, China
3
State Key Laboratory of Green Building in Western China, Xi’an University of Architecture & Technology, Xi’an 710055, China
4
State Key Laboratory of Internet of Things for Smart City, Department of Civil and Environmental Engineering, University of Macau, Macau 999078, China
5
Jiangsu Province Special Equipment Safety Supervision Inspection Institute, Branch of Wuxi, Wuxi 214000, China
6
School of Civil Engineering, Dalian University of Technology, Dalian 116024, China
*
Author to whom correspondence should be addressed.
Fractal Fract. 2022, 6(9), 465; https://doi.org/10.3390/fractalfract6090465
Submission received: 20 July 2022
/
Revised: 21 August 2022
/
Accepted: 22 August 2022
/
Published: 25 August 2022
(This article belongs to the Special Issue Investigation and Application of Fractals in Civil Engineering Materials)
Abstract
:Destruction pattern analysis of building materials subjected to fire provide the basis for strengthening, restoring the bearing capacity, and optimizing the function of the building structure. The surface cracking and fractal characteristics of calcium carbonate whisker-reinforced cement pastes subjected to high temperatures were studied herein. The test results showed that at 400 °C, the surface crack area, length, and fractal dimension of cement pastes specimen increases from 0 to 35 mm2, 100 mm, and 1.0, respectively, due to the increase of vapor pressure. When the temperature is above 900 °C, the calcium carbonate whisker (CW) and other hydration products in the specimen begin to decompose, causing the surface crack area, length, and fractal dimension of the cement paste specimen to increase from 0 to 120 mm2, 310 mm, and 1.2, respectively. Compared with the length and width of cracks, the area, and fractal dimension of cracks are less affected by the size and shape of specimen. This paper uses image processing methods to analyze the cracking patterns and fractal characteristics of specimens after high-temperature treatment. The aim is to elucidate the quantitative relationship between concrete material, temperature, and cracking characteristics, providing theoretical basis for structural evaluation after exposure to high temperature.
1. Introduction
Fires are frequent disasters that seriously threaten people’s lives and property. After a fire, performance analysis and evaluation of the burned building’s structure are the basis for strengthening and restoring the bearing capacity and utilizing function of the building. It is undoubtedly important to evaluate the performance of common structural materials after exposure to high temperature. Concrete undergoes severe and complex physical and chemical changes under high temperature, which leads to performance deterioration and even complete loss of load-bearing capacity. The physical changes to concrete exposed to high temperatures include weight loss, color change, porosity increase, cracking, and bursting [1,2,3]. Physical characteristics such as mass loss, ultrasonic velocity, rebound, and compressive strength are usually measured to evaluate the degree of damage to the concrete after a fire [4,5]. However, the current research on the apparent cracks in concrete exposed to high temperature does not go beyond qualitative analysis.
With the widespread use of concrete in structural engineering, the issue of cracking has gradually become more relevant. Concrete cracking is one of the most notable risks to the durability and safety of structures [6]. Therefore, it is necessary to study the cracking characteristics of concrete. Tiberti et al. [7] provided an overview of the cracking behavior of steel fiber-reinforced concrete after bending. They investigated the effects of concrete matrix strength, fiber dosage, fiber aspect ratio, tensile strength, and fiber orientation on cracking properties, respectively. All of these parameters have a significant effect on the cracking characteristics of concrete. Yin et al. [8] investigated the post-cracking performance of recycled polypropylene fibers in concrete. Crack mouth opening displacement (CMOD) and round determinant panel test (RDPT) were used to evaluate the post-cracking behavior of fiber-reinforced concrete. Shen et al. [9] analyzed the effect of fiber length on the early cracking of high-performance concrete. The increase of fiber length could reduce the tensile creep and cracking resistance of high-strength concrete. Thus, various types of high-performance concrete were utilized and extensively studied [10]. Low-cracking, high-performance concrete has been the material of choice for engineering construction. Darwin et al. [11] conducted a long-term follow-up study on this topic. The results showed that high-strength concrete with high collapse is more prone to cracking than high-strength concrete with low collapse. In addition, for medium-strength concrete, concrete temperature control and early maintenance could reduce the negative effects of placing concrete under high-temperature conditions. Wang et al. [12] studied the amount of fly ash on the shrinkage, cracking, and fractal properties of panel concrete. The pore structure has a large effect on the concrete properties. Peng et al. [13] performed fractal analysis and hydration modeling of the pore structure of magnesium phosphate cement (MPC) slurry. They modeled the hydration reaction of MPC slurry and found that the fractal dimension was proportional to the porosity. However, most of these concrete cracking studies did not directly analyze surface cracks.
Analysis of the development of surface cracks yields valuable insight; therefore, the accurate detection of cracks is important. At present, concrete crack detection methods can be divided into fiber grating network detection [14,15], ultrasonic detection [16,17], acoustic emission detection [18,19] and image detection [20,21,22,23,24]. Fiber grating network detection, ultrasonic detection, and acoustic emission detection are all forms of contact measurement, which requires one to install several sensors in advance in order to determine the parameters of cracks. These three types of methods are not suitable for large-scale structural crack detection. The image detection method is a form of non-contact measurement, which is more convenient and cost-effective, and has accordingly received wide attention. Traditional image detection methods generally include two steps: pre-processing and detection. In the pre-processing stage, many kinds of filters are used to remove irrelevant features in the image; in the detection stage, support vector machines or other algorithms are used to identify cracks. This kind of method is greatly affected by the image’s quality, requires many intermediate steps, and cannot achieve end-to-end detection. Deep learning has achieved remarkable results in the field of image processing. Deep convolutional neural networks are used to automatically extract deep features of images, and complete image classification, object detection, semantic segmentation, and other tasks with high precision. Therefore, deep learning technology has gradually earned the attention of various industries, such as driverless cars [25,26,27], traffic management [28,29,30], construction safety [31,32], etc. In the field of civil engineering, there is also a large volume of image data. Many researchers combine deep learning with detection images to identify and locate damage. For example, Cha et al. [33] used a convolutional neural network and the sliding window technique to identify and locate cracks on the concrete surface. Li et al. [34] converted the vibration acceleration data of stay cables into images and used an image classification algorithm to detect abnormalities. Zhang et al. [35,36] used the deep convolutional neural network to monitor the bolt loosening damage, which includes both small and large degrees of bolt loosening damage. A shortcoming of deep learning is that it requires a large volume of data samples. Data quality also greatly affects the recognition capabilities of deep learning algorithms. In addition, the semantic segmentation algorithm requires artificially labeled cracks. Therefore, considering the crack characteristics of the specimens after high-temperature treatment, the labeling results can be directly used for analysis in this study.
Analysis of building material damage characteristics provides a basis for strengthening and restoring the bearing capacity and utilizing function of the building structure after a fire. The quantitative crack characteristics of fire-damaged cementitious composites have received little attention in research due to the difficulty of identifying cracks accurately with conventional measurement techniques. To bridge this gap, image annotation was used to extract the surface crack of cement paste from a high-temperature environment and analyze its developmental characteristics. The developmental process of surface cracks in cube and prism specimens after high-temperature testing was analyzed.
2. High-Temperature Testing
2.1. Specimen Preparation
Firstly, cement pastes with different contents (0%, 10%, 20%, 30%) of calcium carbonate whisker (CW) were prepared. The reason for using the 4 different contents of CW of 10%, 20%, 30% and 40% is that these four dosages of CW can effectively improve the compressive, flexural, and impact resistances of cement at room temperature [6]. The chemical compositions of composite Portland cement and CW are shown in Table 1. In order to reduce bubbling during the mixing process, tributyl phosphate was added into the mixture. In addition, a superplasticizer (SP) with a water reduction rate of 24.1% was used to ensure that the workability and fluidity of the freshly mixed cement paste were similar. The ratios of raw materials are shown in Table 2. In this experiment, two sizes of test specimens were made: a cube (70.7 × 70.7 × 70.7 mm3) and a prism (40 × 40 × 160 mm3), which were cured in a standard curing box for 24 h. After demolding, they were cured for 28 d in a 20 °C water tank.
In order to avoid bursting of the test specimen under high temperature, the test specimen was taken out of the water tank and put in the drying oven at 60 °C for 24 h. After that, the specimens were heated to 200 °C, 300 °C, 400 °C, 500 °C, 600 °C, 700 °C, 800 °C, 900 °C, 1000 °C, and 1100 °C, respectively, at a rate of 3 °C/min in an electric high-temperature furnace. After reaching the target temperature, the temperature was kept for 2 h. Then, the electric furnace was shut down until the temperature approached the ambient temperature, and the test specimens were taken out.
2.2. Data Preprocessing
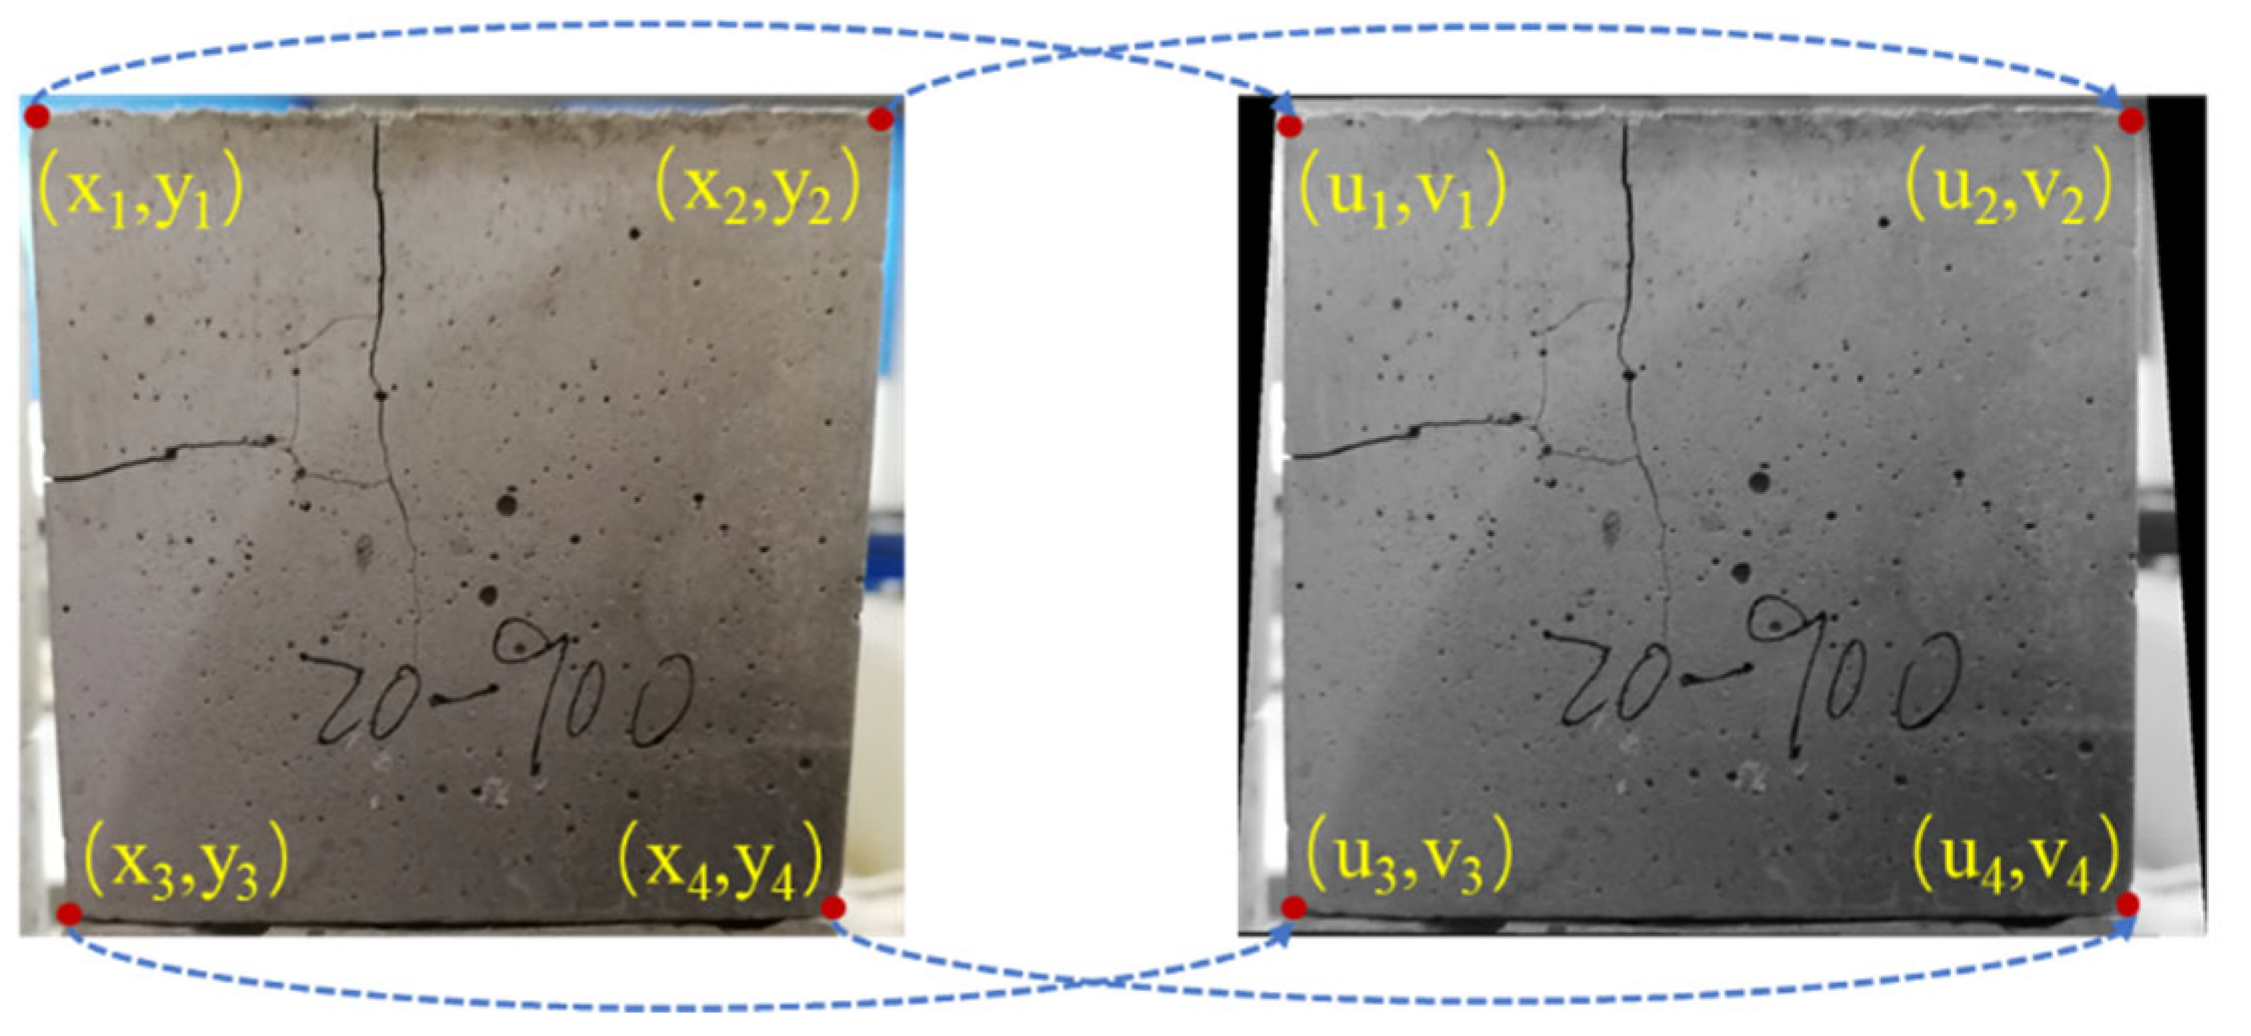
After high-temperature treatment, cracks appeared on the surface of concrete specimens. In this paper, a camera was used to collect images of concrete surface cracks. However, during the image collection process, it was not possible to ensure that the lens and the specimen remained completely vertical. In order to facilitate the quantitative identification of cracks, the perspective transformation was used to correct the concrete specimen in images, as shown in Figure 1.
This perspective transformation was used to complete the tilt correction of images. Perspective transformation can project the image to a new viewing plane, and its transformation formula is:
The core of the transmission transformation is a mapping matrix (3 × 3), where [a11, a12; a21 a22] is used for the linear transformation, [a13; a23] is used for the perspective transformation, and [a31, a32] is used for the translation transformation. (x, y) are the pixel coordinates of the original image, z is 1, and (u, v) are the pixel coordinates of the transformed image.
Assuming that the pixel coordinates of the four points in the original image and the transformed image are known, the eight unknown parameters in Formula 3 could be obtained. Therefore, four control points were selected from the original image, and the width (w) and height (h) of the new rectangle could be obtained through the coordinates of control points. According to the height and width of the new rectangle and the coordinates of the four points in the original image, the new pixel coordinates of the four points in the transformed image can be obtained.
According to four pairs of pixel coordinates and Formula (3), eight parameters in the perspective transformation matrix could be calculated, and then the tilt correction of the entire image could be completed. In order to unify the sizes of images in the data set, all corrected images were cropped to 900 × 900 pixels. Finally, LabelMe (version: 3.16.5) was used to label the cropped images.
3. Crack Parameter Extraction
After high-temperature treatment, cracks appeared on the surface of test specimens. The surfaces of these specimens were photographed using image acquisition equipment to construct a surface crack dataset. In this study, the cracks in the images were labeled using LabelMe. According to the labeling results, the pixel area of crack and test specimen could be calculated. The actual area of the specimen was known, and the pixel area of the crack was easily converted to the actual area of the crack. After the labeled cracks were skeletonized, the total length and average width of the cracks could be obtained. In order to express the shape of crack, the fractal dimension of the labeled crack image was calculated. Since the surface cracks of the test specimen are relatively broken after high-temperature treatment, it is not meaningful to count the number of cracks. Therefore, this paper analyzed the cracking characteristics of cement paste at high temperature from the crack area, total length, average width, and fractal dimension.
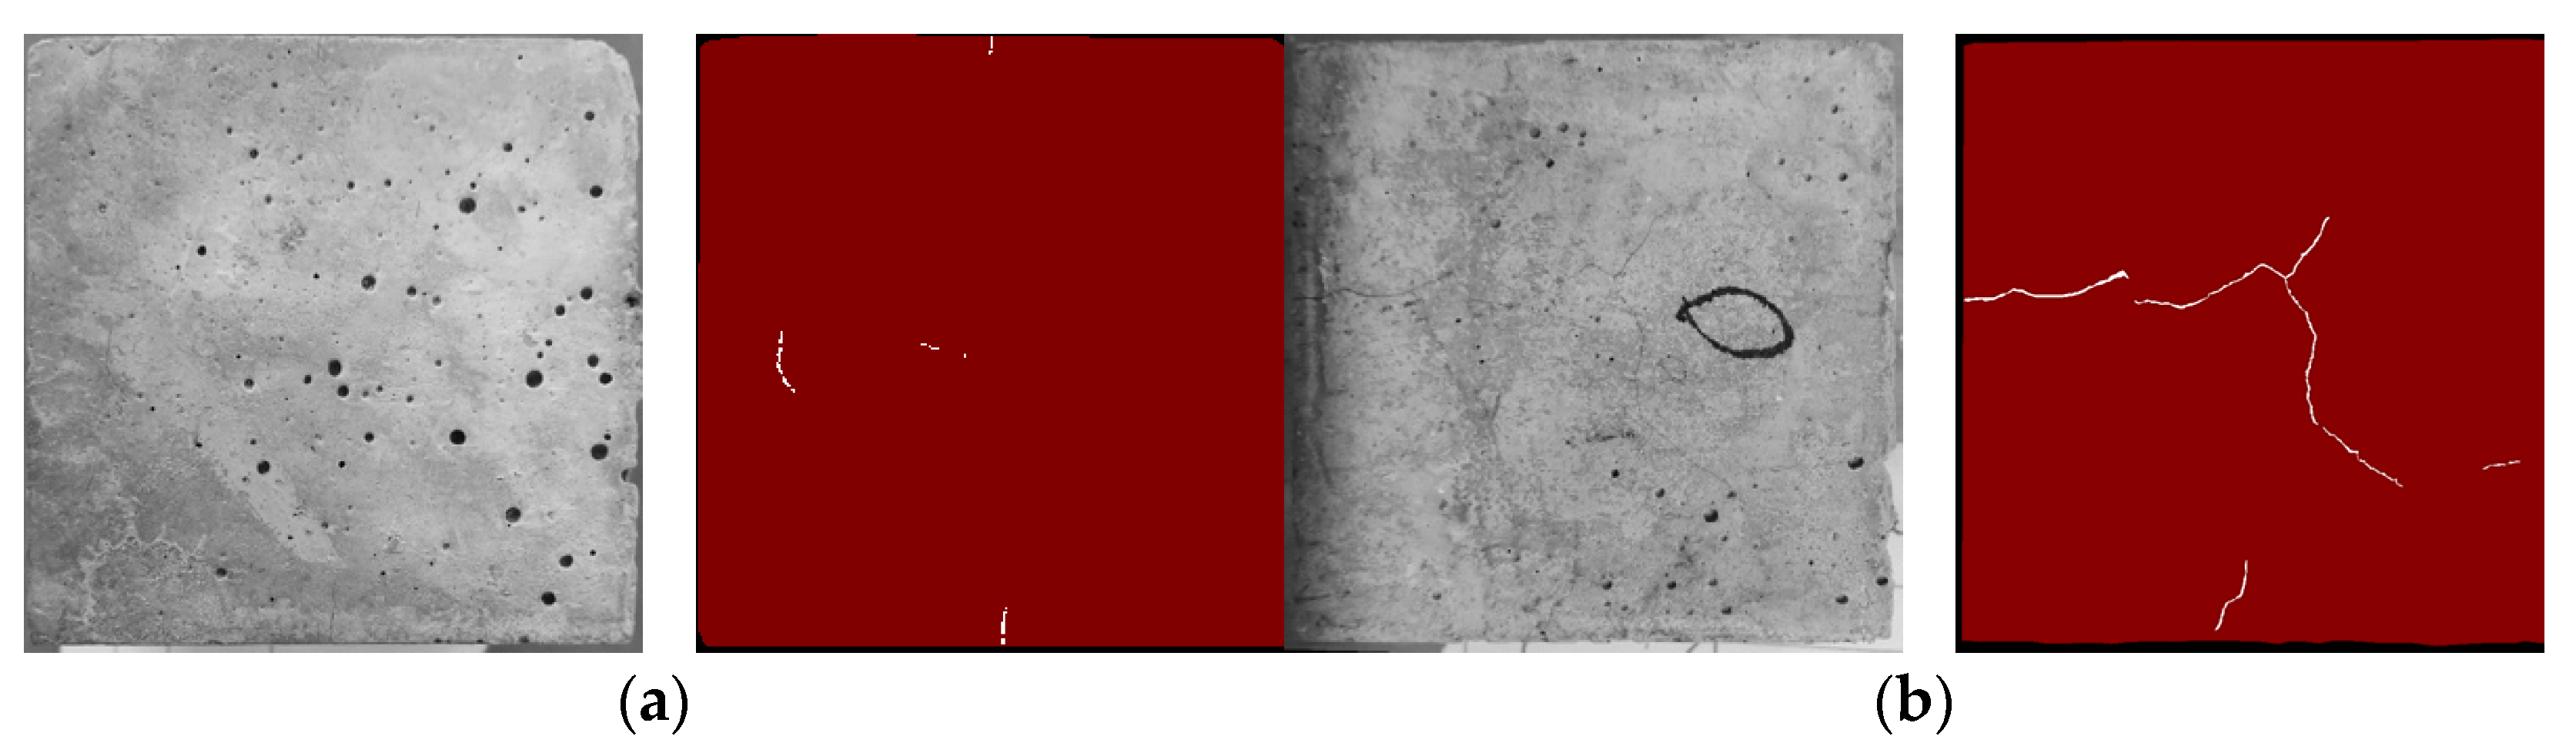
In this experiment, an open-source labeling software (LabelMe) was used to process cracks in images. This labeling software can obtain pixel-level labeling results of cracks in images by manual labeling, as shown in Figure 2. The annotation results can be used to construct a semantic segmentation dataset of cracks. It can be seen from the figure that many small cracks appeared on the surface of the test block after high-temperature treatment. After manual marking, the cracks on the surface of the specimen are clearly visible and the background elements are all masked. In general, semantic segmentation datasets can be used for training semantic segmentation algorithms in deep learning. The trained deep learning model can directly extract the cracks in the image at pixel level. However, only 164 images were collected for this crack dataset. The cracks on the surface of the specimens after high-temperature treatment are very small and thin, so the cracks may appear at any position of the specimens. It was not possible to highlight the crack locations with local cropping. Therefore, the extraction of these cracks is very difficult for deep learning. To test this method, these data are fed into the deep learning model to complete the model training. To prevent overfitting, these images are processed with various data augmentation methods. U-Net architecture was adopted, and the coding structure was Resnet-50. Some important hyperparameters are as follows: learning rate is 1e−4, batch size is 2, momentum is 0.9, and epoch is 100. However, this method is less effective in identifying surface cracks in the specimen after high-temperature treatment. This is mainly because the number of cracks in the dataset and the number of pixels occupied are very small, i.e., the difference between the number of positive and negative samples is very large. Therefore, in this study, the surface cracks of the specimen after high-temperature treatment could not be identified with high accuracy using deep learning. To generate a more accurate assessment of the cracking performance of the test blocks, the crack labeling results were used directly.
As can be seen in the figure, two types of targets were labeled. Among them, red represents the specimen and white represents the crack. The crack area could be quickly obtained by counting the number of white pixels. The labeling result could be changed from cracks to single-pixel lines after skeleton extraction. The pixel area occupied by the line is the crack length. The box-counting dimension method was used to calculate the fractal dimension of the cracks in each image [37]. The extracted cracks were placed on a uniformly divided grid, counting the minimum number of grids needed to cover the cracks. The side length of the grid is λ, and the whole image is divided into N grids. The fractal dimension (FD) of cracks can be defined as:
The sum of the number of red and white pixels gives the cross-sectional area of the specimen. The extraction results of these four types of parameters are shown in Table 3. The true area of the specimen cross-section is known. Therefore, these four types of parameters can be easily converted to real values. In addition, the average width of the crack is the crack area divided by the crack length.
4. Cracking Characteristics Analysis
In the production process of the cement paste specimens, calcium carbonate whiskers with contents of 0%, 10%, 20%, or 30% were added to the cube and prism specimens, respectively. These specimens were then treated at 20 °C, 200 °C, 300 °C, 400 °C, 500 °C, 600 °C, 700 °C, 800 °C, 900 °C, 1000 °C, and 1100 °C. Since the goal of this study was to accurately identify and analyze the shape and size of the cracks, in order to avoid the specimen bursting at high temperature, the heating rate of the electric furnace was set at 3 °C/min. When the temperature of the electric furnace reached the target temperature, it was maintained for 2 h and then cooled to room temperature. A camera was used to take pictures of these concrete specimens after high-temperature treatment.
The LabelMe software is used to label the surface cracks of a concrete specimen in an image. Using the annotation result, the pixel area of the specimen and the crack can be calculated. The actual area of the specimen is known, the pixel area of the crack is easily converted to the actual area of the crack. After the annotation cracks are skeletonized, the total length and average width of the cracks can be obtained. Fractal geometry is a mathematical theory used for describing irregular, disorderly phenomena and behaviors in nature. Its main concept is fractal dimensionality, which can quantitatively describe the complexity and space-filling capacity of geometric shapes. Concrete exhibits a series of fractal characteristics, both in its structure and working process. In order to illustrate the complexity of concrete crack morphology under high temperatures, the box-counting dimension method was used to calculate the fractal dimension of the crack morphology. Therefore, the actual area, total length, average width, and fractal dimension of cracks were determined for each image. Then, the cracking characteristics of cement paste with various CW contents and at various high temperatures were analyzed.
4.1. Cube Specimens
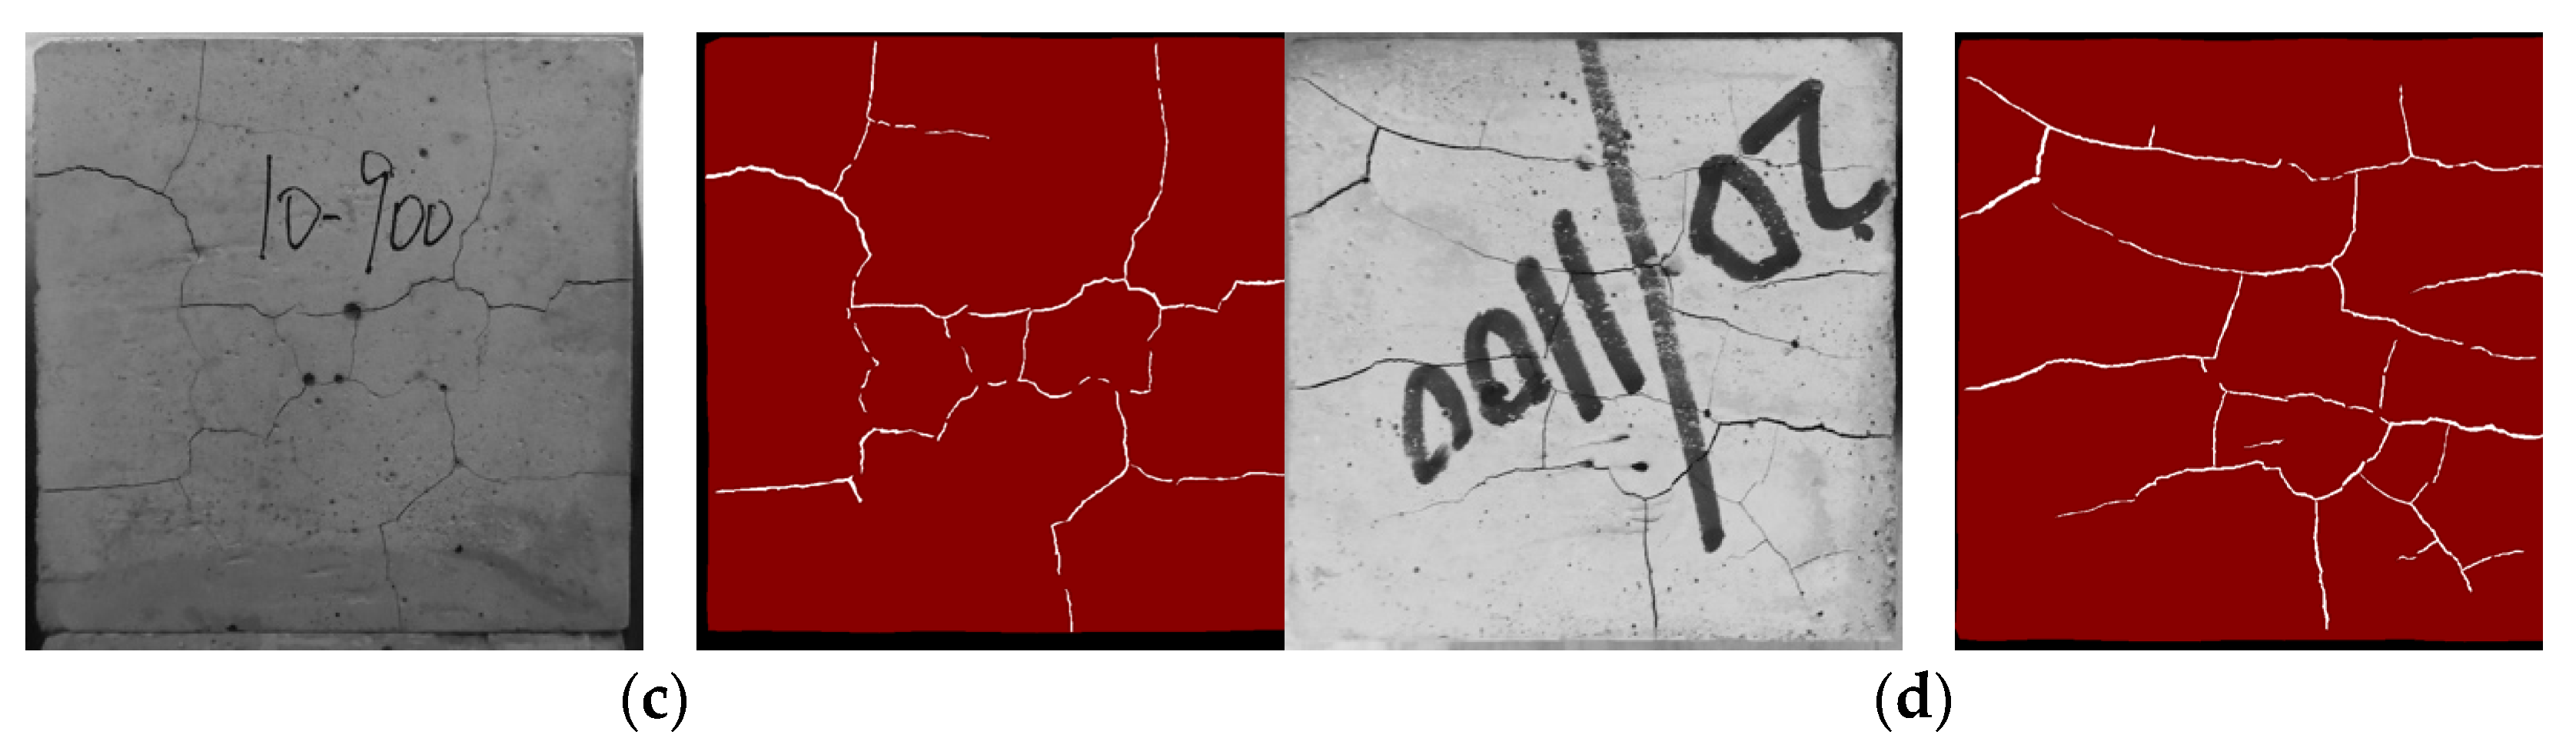
The annotation results of a few cube specimens are shown in Figure 3. On the left side are the original pictures, and on the right side are the annotation results. In the annotation results, the red part is the cement paste specimen, and the white part is the crack.
Using the annotation results, the pixel area of the specimen and the crack can be calculated. The actual area of the cube specimen is 4998.49 mm2. With the relationship between the actual area and the pixel area, the actual area of the crack can be easily obtained. Surface crack parameters (area, total length, average width, and fractal dimension) curve of the cube specimen are shown in Figure 4.
It can be seen from Figure 4a that the surface crack area of the specimen increases from 0 to about 10–30 mm2 at 400 °C. The reason for this phenomenon is that the vapor pressure in the cement paste reaches its peak value at 400–500 °C [38]. Under the high-temperature treatment system in this experiment, the electric furnace will maintain the peak temperature for 2 h after reaching the target temperature. Long-term high vapor pressure will cause the specimen to crack, which is essentially in accordance with the temperature at which high-strength concrete bursts described in the literature [39]. The crack areas of W20 and W30 are larger than those of W0 and W10. The primary reason is that the main component of CWs will be converted from aragonite to calcite, which is accompanied by about 1.2% quality damage. The carbon dioxide released during this phase change may also increase the air pressure in the specimen, which leads to an increase in the surface crack area of the specimen [40,41,42]. When the temperature reaches 900 °C or higher, the crack area of the specimen increases from 0 to about 30–120 mm2, mainly due to the decomposition of calcium carbonate and the other hydration products in the cement paste. At this time, the crack areas of W20 and W30 are significantly larger than those of W0 and W10, e.g., the crack area of W20 can reach more than 4 times that of W0. The main reason is that when the temperature is higher than 900 °C, CWs begin to decompose into calcium oxide and release carbon dioxide, which leads to the intensified cracking of the specimen [40,42].
The variation trend of the total crack length in the cube specimen is generally consistent with that of the crack area, as shown in Figure 4b. Specifically, the crack length increases from 0 to 30–100 mm at 400 °C and 20–310 mm above 900 °C. It can be seen from Figure 4c that when the temperature is below 900 °C, the average width of the cracks fluctuates around 0.24–0.3 mm. However, when the temperature reaches 900–1000 °C, the crack width of the specimen increases significantly, which is due to the decomposition of calcium carbonate and other hydration products [27,29]. An interesting phenomenon is that, compared with 1000 °C, the crack width of all specimens is reduced at 1100 °C. The reason is the CaO, produced by the decomposition of CaCO3 and hydration products, reacts with the silica in the cement–mineral admixture to form calcium silicate. Meanwhile, the Ca(OH)2 produced by the hydration of CaO during the cooling process also helps to fill the cracks in the specimen, thereby reducing the crack width [29]. As shown in Figure 4d, the fractal dimension of cracks increases significantly at the two temperature ranges of 400–500 °C and 900–1100 °C. Specifically, the fractal dimension of cracks increases from 0 to 0.6–1.0 at 400 °C and 0.6–1.2 above 900 °C. The fractal dimension of W0 is smaller than W20 and W30, indicating that the high content of CW also increases the complexity of high-temperature cracks.
4.2. Prism Specimens
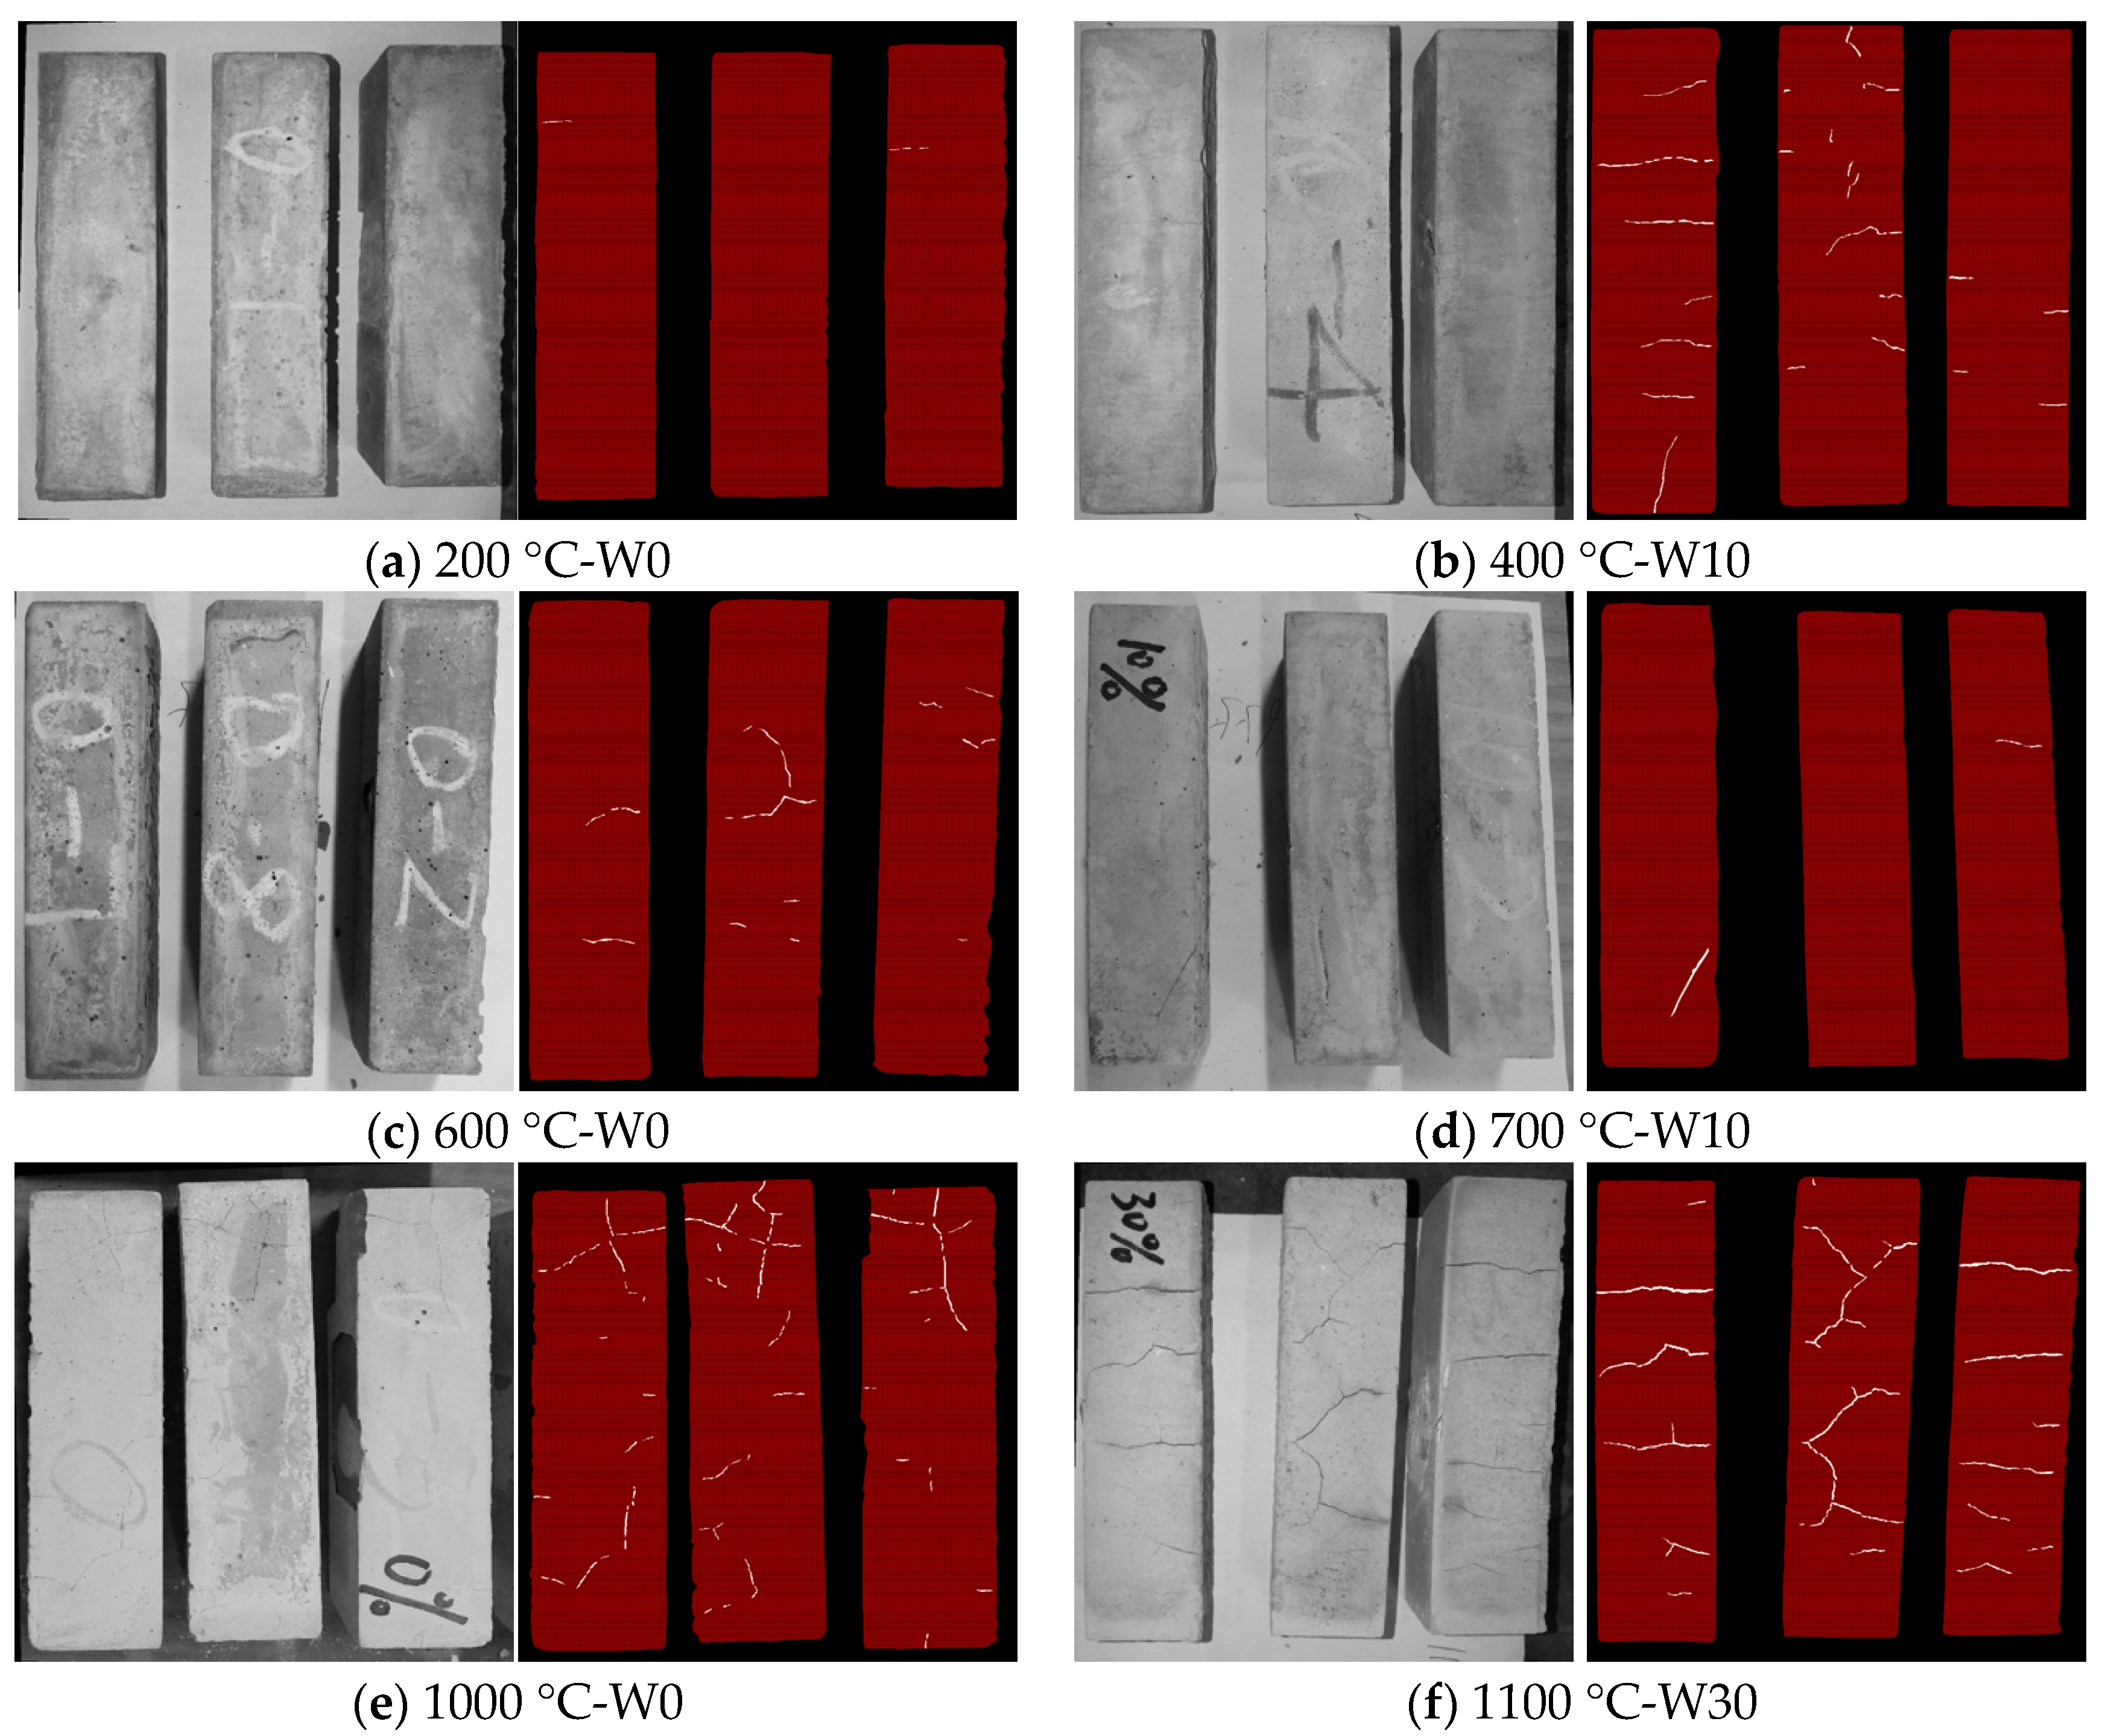
The annotation results of various prism specimens are shown in Figure 5. On the left side are the original pictures, and on the right side are the annotation results. In the annotation results, the red part is the cement paste specimen, and the white part is the crack.
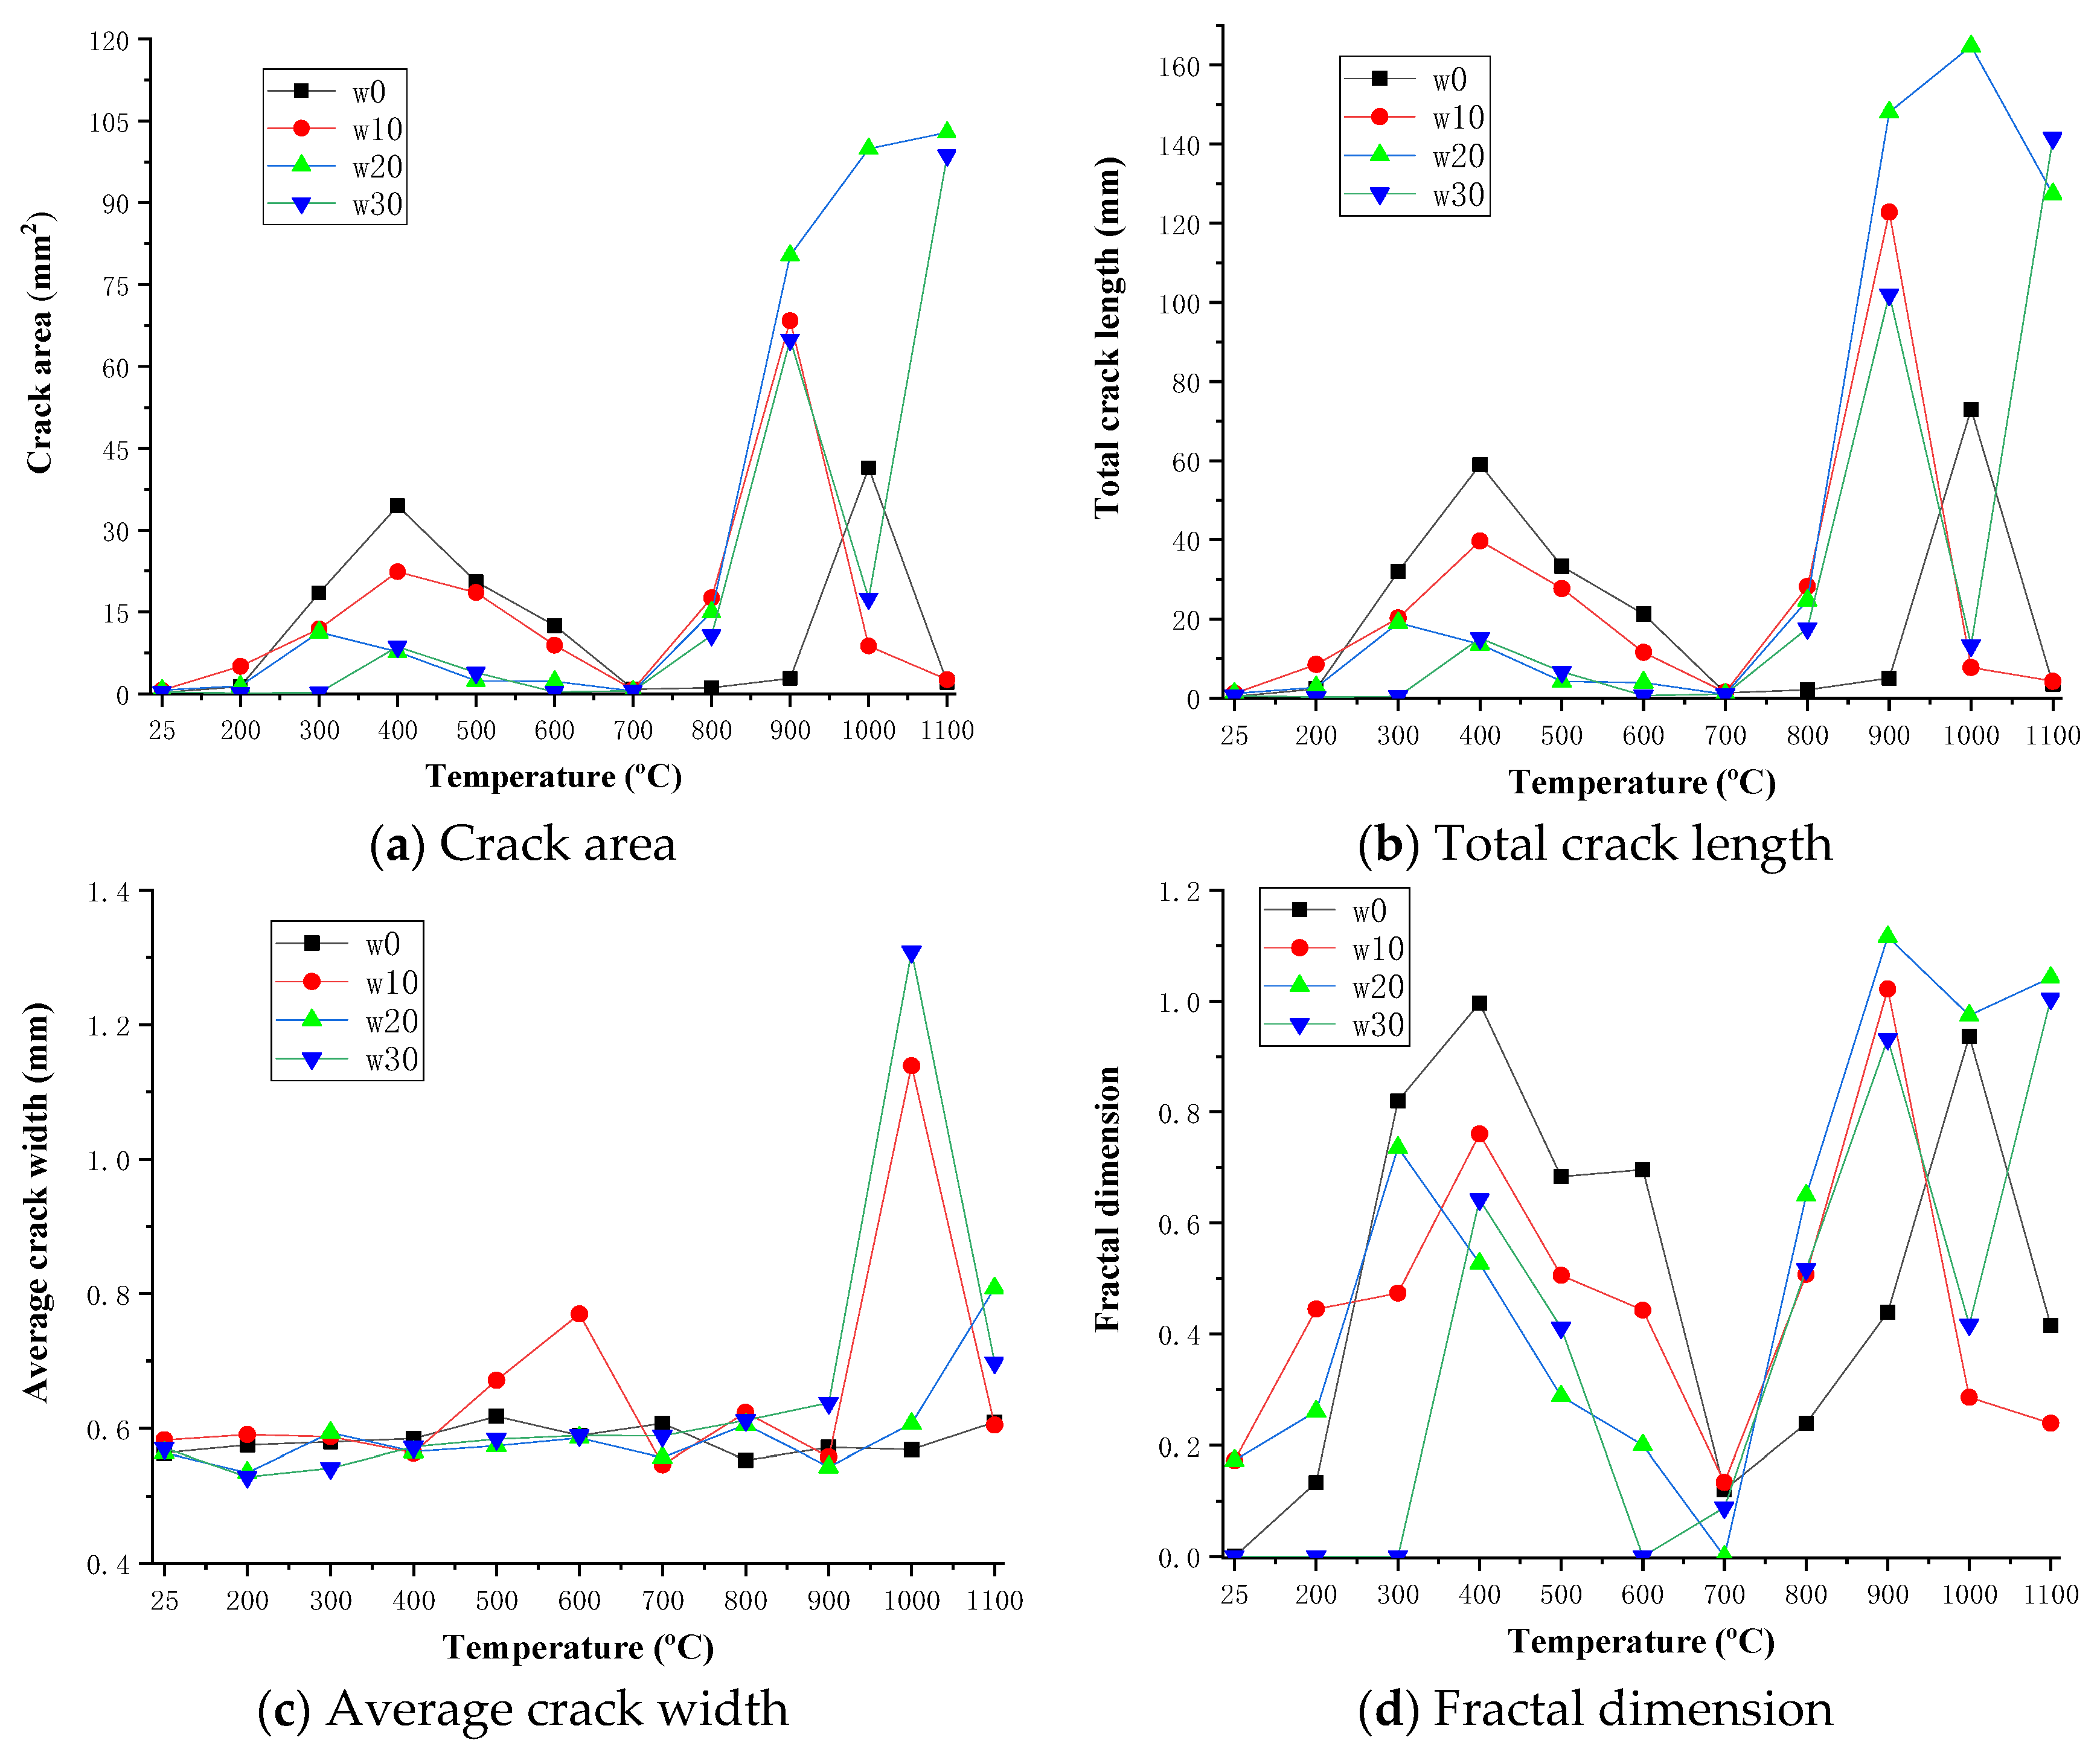
The actual area of the prism specimen is 6400 mm2. The calculation method of the crack parameters of the prism specimen is the same as for the cube specimen. Surface crack parameters (area, total length, average width, and fractal dimension) of prism specimens are shown in Figure 6. It can be seen from Figure 6a,b that the crack area and crack length of the prism specimen are generally close to the changing trend of the cube specimen. The crack area and length increase when the temperature is 400 °C, and the crack area and length increase more significantly when the temperature is above 900 °C. Specifically, the crack area reaches 35 mm2 at 400 °C and 100 mm2 above 900 °C. The crack length reaches 60 mm at 400 °C and 160 mm above 900 °C. However, the crack area and length of W0 and W10 are larger than that of W20 and W30 at about 400 °C, which is completely opposite to the result of the cube specimen. The short side length of the prism specimen is 40 mm, which is smaller than the side length (70.7 mm) of the cube specimen. At high temperatures, it takes less time for the smaller specimen to reach thermal equilibrium and the internal gas is easier to release. At this time, the conversion of calcium carbonate whiskers from aragonite to calcite has fewer side effects on the cement paste, and the CWs control the development of micro-cracks to a certain extent. Therefore, the CW can reduce the area and width of the apparent cracks of prism specimens.
It can be seen from Figure 6c that the crack width of the prism specimen is close to the changing trend of the cube specimen. The crack width changes little up to 900 °C but increases to 1.3mm when the temperature reaches 1000 °C. Similarly, it can be seen from Figure 6d that the fractal dimension of the prism specimen is close to the changing trend of the cube specimen. The fractal dimension of cracks increases notably in the two temperature ranges of 300–600 °C and 900–1100 °C. Specifically, the fractal dimension of cracks reaches 1.0 at 400 °C and 1.1 above 900 °C. However, the difference is that when the temperature is 300–600 °C, the fractal dimension of W0 is larger than that of W10, W20, and W30. In terms of absolute values, the total crack length of the cube specimen is visibly larger than that of the prism specimen, while the average crack width of the cube specimen is visibly smaller than that of the prism specimen. The crack area and fractal dimension of the cube specimen are close to that of the prism specimen.
It is necessary to consider the influence of the shape and size of each member, as the dimensions of concrete members vary greatly in actual engineering. According to the results of this paper, the crack area and fractal dimension are less affected by the shape and size of the cementitious composite member. Hence, they are more reliable for evaluating the degree of damage to concrete caused by fire.
5. Conclusions
Destruction pattern analysis of burned structures provides the basis for strengthening, restoring the bearing capacity, and optimizing the function of the building. Concrete will crack in a high temperature environment, and it is of great significance to quantitatively evaluate the degree of surface cracking. This study analyzed the cracking pattern of calcium carbonate whisker-reinforced cement pastes after high-temperature testing. The surface cracks of CW-modified cement paste treated at different temperatures are studied. The main conclusions are as follows: (a) these crack parameters can reflect the physical and chemical change process of the CW-reinforced cement paste at high temperature. At 400 °C, the surface crack area, length, and fractal dimension of cement pastes specimen reaches 35 mm2, 100 mm, and 1.0, respectively, due to the increase of vapor pressure. When the temperature is above 900 °C, the CW and other hydration products in the specimen will decompose, which cause the surface crack area, length, and fractal dimension of the cement paste specimen reach 120 mm2, 310 mm, and 1.2, respectively. (b) The cracking degree of the cement paste specimen after high temperature is determined by the size and shape of the specimen. Compared with the total length and average width of the crack, the crack area and fractal dimension are slightly less affected by the size and shape of the specimen. These two parameters can more reliably evaluate the cracking degree of concrete elements with different sizes after high temperature. (c) The crack parameter extraction method adopted in this paper can be used for cracking assessment of concrete materials and elements exposed to fire. However, the surface cracks of concrete cannot fully reflect the degree of damage to the concrete. In the future, deep learning could be combined with non-destructive testing technology such as ultrasonic wave propagation, which can reflect the internal state of concrete to evaluate the extent of fire damage more holistically.
Author Contributions
Conceptualization, methodology, investigation, formal analysis, writing—original draft, writing—review & editing, supervision, funding acquisition, L.L.; methodology, investigation, formal analysis, writing—original draft, writing—review & editing, supervision. Y.Z.; resources, Y.S.; resources. Z.X.; resources, funding acquisition, M.C. All authors have read and agreed to the published version of the manuscript.
Funding
The Natural Science Basic Research Program of Shaanxi (Program No. 2021JQ-174), National-level College Students Innovative and Entrepreneurial Training Program (202210712169), Natural Science Foundation of China (52109168), and Opening Fund of State Key Laboratory of Green Building in Western China (LSKF202214) are gratefully acknowledged.
Data Availability Statement
The data that support the findings of this study are available from the authors upon reasonable request.
Conflicts of Interest
The authors declared no potential conflict of interest with respect to the research, authorship, and/or publication of this article.
References
- Rahmouni, Z.E.A.; Tebbal, N. Mechanical Behavior of High-Performance Concrete under Thermal Effect. In Compressive Strength Concrete; IntechOpen: London, UK, 2020; p. 105. [Google Scholar]
- Tebbal, N.; Rahmouni, Z.; Maza, M. Combined effect of silica fume and additive on the behavior of high performance concretes subjected to high temperatures. Min. Sci. 2017, 24, 129–145. [Google Scholar]
- Khattab, M.; Hachemi, S.; Al Ajlouni, M.F. Evaluating the physical and mechanical properties of concrete prepared with recycled refractory brick aggregates after elevated temperatures’ exposure. Constr. Build. Mater. 2021, 311, 125351. [Google Scholar] [CrossRef]
- Aseem, A.; Baloch, W.L.; Khushnood, R.A.; Mushtaq, A. Structural health assessment of fire damaged building using non-destructive testing and micro-graphical forensic analysis: A case study. Case Stud. Constr. Mater. 2019, 11, e00258. [Google Scholar] [CrossRef]
- Qian, Y.; Yang, D.; Xia, Y.; Gao, H.; Ma, Z. Transport Properties and Resistance Improvement of Ultra-High Performance Concrete (UHPC) after Exposure to Elevated Temperatures. Buildings 2021, 11, 416. [Google Scholar] [CrossRef]
- Cao, M.; Wei, J. Microstructure and mechanical properties of CaCO3 whisker-reinforced cement. J. Wuhan Univ. Technol. Mater. Sci. Ed. 2011, 26, 1004–1009. [Google Scholar] [CrossRef]
- Tiberti, G.; Germano, F.; Mudadu, A.; Plizzari, G.A. An overview of the flexural post-cracking behavior of steel fiber reinforced concrete. Struct. Concr. 2018, 19, 695–718. [Google Scholar] [CrossRef]
- Yin, S.; Tuladhar, R.; Collister, T.; Combe, M.; Sivakugan, N.; Deng, Z. Post-cracking performance of recycled polypropylene fibre in concrete. Constr. Build. Mater. 2015, 101, 1069–1077. [Google Scholar] [CrossRef]
- Shen, D.; Jiang, J.; Shen, J.; Yao, P.; Jiang, G. Influence of curing temperature on autogenous shrinkage and cracking resistance of high-performance concrete at an early age. Constr. Build. Mater. 2016, 103, 67–76. [Google Scholar] [CrossRef]
- Yang, H.M.; Zhang, S.M.; Wang, L.; Chen, P.; Shao, D.K.; Tang, S.W.; Li, J.Z. High-ferrite Portland cement with slag: Hydration, microstructure, and resistance to sulfate attack at elevated temperature. Cem. Concr. Compos. 2022, 130, 104560. [Google Scholar] [CrossRef]
- Darwin, D.; Browning, J.; Lindquist, W.; McLeod, H.A.; Yuan, J.; Toledo, M.; Reynolds, D. Low-cracking, high-performance concrete bridge decks: Case studies over first 6 years. Transp. Res. Rec. 2010, 2202, 61–69. [Google Scholar] [CrossRef]
- Wang, L.; Yu, Z.; Liu, B.; Zhao, F.; Tang, S.; Jin, M. Effects of fly ash dosage on shrinkage, crack resistance and fractal characteristics of face slab concrete. Fractal Fract. 2022, 6, 335. [Google Scholar] [CrossRef]
- Peng, Y.; Tang, S.; Huang, J.; Tang, C.; Wang, L.; Liu, Y. Fractal analysis on pore structure and modeling of hydration of magnesium phosphate cement paste. Fractal Fract. 2022, 6, 337. [Google Scholar] [CrossRef]
- Wu, C.; Sun, K.; Xu, Y.; Zhang, S.; Huang, X.; Zeng, S. Concrete crack detection method based on optical fiber sensing network and microbending principle. Saf. Sci. 2019, 117, 299–304. [Google Scholar] [CrossRef]
- García Díaz, J.; Navarro Cano, N.; Rúa Álvarez, E. Determination of the Real Cracking Moment of Two Reinforced Concrete Beams through the Use of Embedded Fiber Optic Sensors. Sensors 2020, 20, 937. [Google Scholar] [CrossRef] [PubMed]
- Dumoulin, C.; Deraemaeker, A. Real-time fast ultrasonic monitoring of concrete cracking using embedded piezoelectric transducers. Smart Mater. Struct. 2017, 26, 104006. [Google Scholar] [CrossRef]
- Ham, S.; Song, H.; Oelze, M.L.; Popovics, J.S. A contactless ultrasonic surface wave approach to characterize distributed cracking damage in concrete. Ultrasonics 2017, 75, 46–57. [Google Scholar] [CrossRef] [PubMed]
- Xu, J.; Fu, Z.; Han, Q.; Lacidogna, G.; Carpinteri, A. Micro-cracking monitoring and fracture evaluation for crumb rubber concrete based on acoustic emission techniques. Struct. Health Monit. 2018, 17, 946–958. [Google Scholar] [CrossRef]
- Suzuki, T.; Shiotani, T.; Ohtsu, M. Evaluation of cracking damage in freeze-thawed concrete using acoustic emission and X-ray CT image. Constr. Build. Mater. 2017, 136, 619–626. [Google Scholar] [CrossRef]
- Ren, Y.; Huang, J.; Hong, Z.; Lu, W.; Yin, J.; Zou, L.; Shen, X. Image-based concrete crack detection in tunnels using deep fully convolutional networks. Constr. Build. Mater. 2020, 234, 117367. [Google Scholar] [CrossRef]
- Zhang, Y.; Yuen, K.V. Crack detection using fusion features-based broad learning system and image processing. Comput.-Aided Civ. Infrastruct. Eng. 2021, 36, 1568–1584. [Google Scholar] [CrossRef]
- Li, L.; Sun, H.X.; Zhang, Y.; Yu, B. Surface cracking and fractal characteristics of bending fractured polypropylene fiber-reinforced geopolymer mortar. Fractal Fract. 2021, 5, 142. [Google Scholar] [CrossRef]
- Dorafshan, S.; Thomas, R.J.; Maguire, M. Comparison of deep convolutional neural networks and edge detectors for image-based crack detection in concrete. Constr. Build. Mater. 2018, 186, 1031–1045. [Google Scholar] [CrossRef]
- Li, L.; Tao, J.C.; Zhang, Y.; Sun, H.X.; Yuen, K.V.; You, P.B. Crack fractal analysis of fractured polyethylene fiber reinforced alkali activated mortar under flexural load. Constr. Build. Mater. 2022, 345, 128428. [Google Scholar] [CrossRef]
- Maqueda, A.I.; Loquercio, A.; Gallego, G.; García, N.; Scaramuzza, D. Event-based vision meets deep learning on steering prediction for self-driving cars. In Proceedings of the IEEE Conference on Computer Vision and Pattern Recognition, Salt Lake City, UT, USA, 18–23 June 2018; pp. 5419–5427. [Google Scholar]
- Kim, J.; Lim, G.; Kim, Y.; Kim, B.; Bae, C. Deep learning algorithm using virtual environment data for self-driving car. In Proceedings of the 2019 International Conference on Artificial Intelligence in Information and Communication (ICAIIC), Okinawa, Japan, 11–13 February 2019; IEEE: New York, NY, USA, 2019; pp. 444–448. [Google Scholar]
- Fayjie, A.R.; Hossain, S.; Oualid, D.; Lee, D.J. Driverless car: Autonomous driving using deep reinforcement learning in urban environment. In Proceedings of the 2018 15th International Conference on Ubiquitous Robots (UR), Honolulu, HI, USA, 26–30 June 2018; IEEE: New York, NY, USA, 2018; pp. 896–901. [Google Scholar]
- Fadlullah, Z.M.; Tang, F.; Mao, B.; Kato, N.; Akashi, O.; Inoue, T.; Mizutani, K. State-of-the-art deep learning: Evolving machine intelligence toward tomorrow’s intelligent network traffic control systems. IEEE Commun. Surv. Tutor. 2017, 19, 2432–2455. [Google Scholar] [CrossRef]
- Kato, N.; Fadlullah, Z.M.; Mao, B.; Tang, F.; Akashi, O.; Inoue, T.; Mizutani, K. The deep learning vision for heterogeneous network traffic control: Proposal, challenges, and future perspective. IEEE Wirel. Commun. 2016, 24, 146–153. [Google Scholar] [CrossRef]
- Jindal, A.; Aujla, G.S.; Kumar, N.; Chaudhary, R.; Obaidat, M.S.; You, I. SeDaTiVe: SDN-enabled deep learning architecture for network traffic control in vehicular cyber-physical systems. IEEE Netw. 2018, 32, 66–73. [Google Scholar] [CrossRef]
- Zhang, Y.; Wang, T.; Yuen, K.V. Construction site information decentralized management using blockchain and smart contracts. Comput.-Aided Civ. Infrastruct. Eng. 2022, 37, 1450–1467. [Google Scholar] [CrossRef]
- Li, J.; Zhao, X.; Zhou, G.; Zhang, M. Standardized use inspection of workers’ personal protective equipment based on deep learning. Saf. Sci. 2022, 150, 105689. [Google Scholar] [CrossRef]
- Cha, Y.J.; Choi, W.; Büyüköztürk, O. Deep learning-based crack damage detection using convolutional neural networks. Comput.-Aided Civ. Infrastruct. Eng. 2017, 32, 361–378. [Google Scholar] [CrossRef]
- Bao, Y.; Tang, Z.; Li, H.; Zhang, Y. Computer vision and deep learning–based data anomaly detection method for structural health monitoring. Struct. Health Monit. 2019, 18, 401–421. [Google Scholar] [CrossRef]
- Zhang, Y.; Sun, X.; Loh, K.J.; Su, W.; Xue, Z.; Zhao, X. Autonomous bolt loosening detection using deep learning. Struct. Health Monit. 2020, 19, 105–122. [Google Scholar] [CrossRef]
- Zhao, X.; Zhang, Y.; Wang, N. Bolt loosening angle detection technology using deep learning. Struct. Control Health Monit. 2019, 26, e2292. [Google Scholar] [CrossRef]
- Panigrahy, C.; Seal, A.; Mahato, N.K.; Bhattacharjee, D. Differential box counting methods for estimating fractal dimension of gray-scale images: A survey. Chaos Solitons Fractals 2019, 126, 178–202. [Google Scholar] [CrossRef]
- Ding, Y.; Zhang, C.; Cao, M.; Zhang, Y.; Azevedo, C. Influence of different fibers on the change of pore pressure of self-consolidating concrete exposed to fire. Constr. Build. Mater. 2016, 113, 456–469. [Google Scholar] [CrossRef]
- Xiao, J.; Falkner, H. On residual strength of high-performance concrete with and without polypropylene fibres at elevated temperatures. Fire Saf. J. 2006, 41, 115–121. [Google Scholar] [CrossRef]
- Cao, M.; Li, L.; Yin, H.; Ming, X. Microstructure and Strength of Calcium Carbonate (CaCO3) Whisker Reinforced Cement Paste After Exposed to High Temperatures. Fire Technol. 2019, 55, 1983–2003. [Google Scholar] [CrossRef]
- Li, L.; Cao, M.; Yin, H. Comparative roles between aragonite and calcite calcium carbonate whiskers in the hydration and strength of cement paste. Cem. Concr. Compos. 2019, 104, 103350. [Google Scholar] [CrossRef]
- Li, L.; Cao, M.; Ming, X.; Yin, H.; Sun, Y.N. Microstructure of calcium carbonate whisker reinforced cement paste after elevated temperature exposure. Constr. Build. Mater. 2019, 227, 116609. [Google Scholar] [CrossRef]
Figure 1.
Tilt correction of specimen.

Figure 2.
Data annotation ((a–d) are the four samples in the image dataset; left is original image; right is annotation result).
Figure 2.
Data annotation ((a–d) are the four samples in the image dataset; left is original image; right is annotation result).


Figure 3.
Crack annotation results of the cube specimens with different treatment temperatures and raw material ratios; the treatment temperature and raw material ratio of (a–f) are 400 °C-W10, 400 °C-W20, 800 °C-W10, 900 °C-W20, 900 °C-W30, 1000 °C-W10, respectively; left is original image; right is annotation result.

Figure 4.
Surface crack parameters variation curves with temperature of the cube specimen ((a): crack area curve; (b): total crack length curve; (c): average crack width curve; (d): fractal dimension curve).
Figure 4.
Surface crack parameters variation curves with temperature of the cube specimen ((a): crack area curve; (b): total crack length curve; (c): average crack width curve; (d): fractal dimension curve).

Figure 5.
Crack annotation results of prism specimens with different treatment temperatures and raw material ratios; the treatment temperature and raw material ratio of (a–f) are 200 °C-W0, 400 °C-W10, 600 °C-W0, 700 °C-W10, 1000 °C-W0, 1100 °C-W30, respectively; left is original image; right is annotation result.

Figure 6.
Surface crack parameters variation curves with temperature of the prism specimen ((a): crack area curve; (b): total crack length curve; (c): average crack width curve; (d): fractal dimension curve).
Figure 6.
Surface crack parameters variation curves with temperature of the prism specimen ((a): crack area curve; (b): total crack length curve; (c): average crack width curve; (d): fractal dimension curve).


Table 1.
The Chemical Composition of Composite Portland Cement and CW.
| Component | CaO | SiO2 | Al2O3 | Fe2O3 | CO2 | MgO | SO3 | K2O | TiO2 |
|---|---|---|---|---|---|---|---|---|---|
| CW | 54.93 | 0.29 | 0.11 | 0.07 | 42.07 | 2.14 | 0.31 | 0 | 0 |
| Cement | 52.61 | 28.45 | 6.95 | 2.44 | 0 | 4.30 | 3.45 | 1.06 | 0.36 |
Table 2.
The Ratios of Raw Materials.
| Series | W/B | Cement (kg/m3) | CW (kg/m3) | Water (kg/m3) | SP (wt. %) |
|---|---|---|---|---|---|
| W0 | 0.30 | 1500 | 0 | 450 | 0.17 |
| W10 | 0.30 | 1350 | 150 | 450 | 0.67 |
| W20 | 0.30 | 1200 | 300 | 450 | 1.00 |
| W30 | 0.30 | 1050 | 450 | 450 | 1.20 |
Table 3.
Extraction Results of Parameters.
| Count | Specimen Area | Crack Area | Crack Length | Fractal Dimension |
|---|---|---|---|---|
| a | 87,325 | 75 | 53 | 0.5814 |
| b | 85,473 | 285 | 234 | 0.8595 |
| c | 83,825 | 1281 | 1007 | 1.2059 |
| d | 86,496 | 1789 | 1350 | 1.1908 |
Publisher’s Note: MDPI stays neutral with regard to jurisdictional claims in published maps and institutional affiliations. |
© 2022 by the authors. Licensee MDPI, Basel, Switzerland. This article is an open access article distributed under the terms and conditions of the Creative Commons Attribution (CC BY) license (https://creativecommons.org/licenses/by/4.0/).
Share and Cite
MDPI and ACS Style
Li, L.; Zhang, Y.; Shi, Y.; Xue, Z.; Cao, M. Surface Cracking and Fractal Characteristics of Cement Paste after Exposure to High Temperatures. Fractal Fract. 2022, 6, 465. https://doi.org/10.3390/fractalfract6090465
AMA Style
Li L, Zhang Y, Shi Y, Xue Z, Cao M. Surface Cracking and Fractal Characteristics of Cement Paste after Exposure to High Temperatures. Fractal and Fractional. 2022; 6(9):465. https://doi.org/10.3390/fractalfract6090465
Chicago/Turabian StyleLi, Li, Yang Zhang, Yuqiong Shi, Zhigang Xue, and Mingli Cao. 2022. "Surface Cracking and Fractal Characteristics of Cement Paste after Exposure to High Temperatures" Fractal and Fractional 6, no. 9: 465. https://doi.org/10.3390/fractalfract6090465